the Creative Commons Attribution 4.0 License.
the Creative Commons Attribution 4.0 License.
 | 01 Sep 2021
Greenhouse gases emissions from riparian wetlands: an example from the Inner Mongolia grassland region in China
Xinyu Liu
Xixi Lu
Ruihong Yu
Heyang Sun
Hao Xue
Zhen Qi
Zhengxu Cao
Zhuangzhuang Zhang
Tingxi Liu
Gradual riparian wetland drying is increasingly sensitive to global warming and contributes to climate change. Riparian wetlands play a significant role in regulating carbon and nitrogen cycles. In this study, we analyzed the emissions of carbon dioxide (CO2), methane (CH4), and nitrous oxide (N2O) from riparian wetlands in the Xilin River basin to understand the role of these ecosystems in greenhouse gas (GHG) emissions. Moreover, the impact of the catchment hydrology and soil property variations on GHG emissions over time and space was evaluated. Our results demonstrate that riparian wetlands emit larger amounts of CO2 (335–2790 in the wet season and 72–387 in the dry season) than CH4 and N2O to the atmosphere due to high plant and soil respiration. The results also reveal clear seasonal variations and spatial patterns along the transects in the longitudinal direction. N2O emissions showed a spatiotemporal pattern similar to that of CO2 emissions. Near-stream sites were the only sources of CH4 emissions, while the other sites served as sinks for these emissions. Soil moisture content and soil temperature were the essential factors controlling GHG emissions, and abundant aboveground biomass promoted the CO2, CH4, and N2O emissions. Moreover, compared to different types of grasslands, riparian wetlands were the potential hotspots of GHG emissions in the Inner Mongolian region. Degradation of downstream wetlands has reduced the soil carbon pool by approximately 60 %, decreased CO2 emissions by approximately 35 %, and converted the wetland from a CH4 and N2O source to a sink. Our study showed that anthropogenic activities have extensively changed the hydrological characteristics of the riparian wetlands and might accelerate carbon loss, which could further affect GHG emissions.
- Article
(11115 KB) - Full-text XML
- BibTeX
- EndNote


With the increasing rate of global warming, the change in the concentrations of greenhouse gases (GHGs) in the atmosphere is a source of concern in the scientific community (Cao et al., 2005). According to the World Meteorological Organization (WMO, 2018), the concentrations of carbon dioxide (CO2), methane (CH4), and nitrous oxide (N2O) in the atmosphere have increased by 146 %, 257 %, and 122 %, respectively, since 1750. Despite their lower atmospheric concentrations, CH4 and N2O absorb infrared radiation approximately 28 and 265 times more effectively at centennial timescales than CO2 (IPCC, 2013), respectively. On a global scale, CO2, CH4, and N2O together are responsible for 87 % of the GHG effect (Ferrón et al., 2007).
Wetlands are unique ecosystems that serve as transition zones between terrestrial and aquatic ecosystems. They play an important role in the global carbon cycle (Beger et al., 2010; Naiman and Decamps, 1997). Wetlands are sensitive to hydrological changes, particularly in the context of global climate change (Cheng and Huang, 2016). Moreover, wetland hydrology is affected by local anthropogenic activities, such as the construction of reservoirs, resulting in gradual drying. Although wetlands cover only 4 %–6 % of the terrestrial land surface, they contain approximately 12 %–24 % of global terrestrial soil organic carbon (SOC), thus acting as carbon sinks. Moreover, they release CO2, CH4, and N2O into the atmosphere and serve as carbon sources (Lv et al., 2013). During plant photosynthesis, the amount of carbon accumulated is generally higher than the amount of CO2 consumed (plant respiration, animal respiration, and microbial decomposition) in the wetland; thus, the net effect of the wetland is that of a carbon sink. Wetlands are increasingly recognized as an essential part of nature, given their simultaneous functions as carbon sources and sinks. Excessive rainfall causes an expansion in wetland area and a sharp increase in soil moisture content, thus enhancing respiration, methanogenesis, nitrification, and denitrification rates (Mitsch et al., 2009). On the other hand, reduced precipitation or severe droughts decrease water levels, causing the wetlands to dry up. The accumulated carbon is released back into the atmosphere through oxidation. Due to the increasing impact of climate change and human activity, drying of wetlands has been widely observed in recent years (Liu et al., 2006); more than half of global wetlands have disappeared since 1900 (Mitsch and Gosselink, 2007), and this tendency is expected to continue in the future. The loss of wetlands may directly shift the soil environment from anoxic to oxic conditions, while modifying the CO2 and CH4 source and sink functions of wetland ecological systems (Waddington and Roulet, 2000; Zona et al., 2009).
The Xilin River basin in China is characterized by a marked spatial gradient in soil moisture content. It is a unique natural laboratory that may be used to explore the close relationships between the spatiotemporal variations in hydrology and riparian biogeochemistry. Wetlands around the Xilin River play an irreplaceable role with regard to local climate control, water conservation, the carbon and nitrogen cycles, and husbandry (Gou et al., 2015; Kou, 2018). Moreover, the Xilin River region is subjected to seasonal alterations in precipitation and temperature regimes. Construction of the Xilin River reservoir has resulted in highly negative consequences, such as the drying of downstream wetlands, thereby affecting riparian hydrology and microbial activity in riparian soils. GHG emissions in riparian wetlands vary immensely. Therefore, understanding the interactions between the GHG emissions and hydrological changes in the Xilin River riparian wetlands has become increasingly important. Moreover, it is necessary to estimate the changes in GHG emissions as a result of wetland degradation at local and global scales.
In this work, GHG emissions from riparian wetlands and adjacent hillslope grasslands of the Xilin River basin were investigated. GHG emissions, soil temperature, and soil moisture content were measured in the dry and wet seasons. The main objectives of this study were to (1) investigate the temporal and spatial variations in CO2, CH4, and N2O emissions from the wetlands in the riparian zone and examine the main factors affecting the GHG emissions; (2) compare the GHG emissions from the riparian wetlands with those from different types of grasslands; and (3) evaluate the impact of wetland degradation in the study area on GHG emissions.
2.1 Study site
The Xilin River is situated in the southeastern part of the Inner Mongolia Autonomous Region in China (43∘26′–44∘39′ N, 115∘00′–117∘30′ E). It is a typical inland river of the Inner Mongolia grasslands. The river basin area is 10 542 km2, total length is 268.1 km, and average altitude is 988.5 m. According to the meteorological data provided by the Xilinhot Meteorological Station (Xi et al., 2017; Tong et al., 2004), the long-term annual mean air temperature is 1.7 ∘C, and the maximum and minimum monthly means are 20.8 ∘C in July and −19.8 ∘C in January, respectively. The average annual precipitation was 278.9 mm for the period of 1968–2015. Precipitation is distributed unevenly among the seasons, with 87.41 % of the total precipitation occurring between May and September.
Soil types in the Xilin River basin are predominantly chernozems (86.4 %), showing a significant zonal distribution as light chestnut soil, dark chestnut soil, and chernozems from the northwest to southeast. Soil types in this basin also present a vertical distribution with elevation. Soluble chernozems and carbonate chernozems are primarily observed at altitudes above 1350 m, with a relatively fertile and deep soil layer. Dark chestnut soil, boggy soil, and dark meadow with high humus content are distributed between the altitudes of 1150 and 1350 m. Meanwhile, light chestnut soil, saline meadow soil, and meadow solonchak with low soil humus, a thin soil layer, and coarse soil texture are distributed between the altitudes of 902 and 1150 m above sea level (Xi et al., 2017).
2.2 Field measurements and laboratory analyses
In this study, five representative transects were selected as the primary measurement sites in the entire Xilin River. Each transect cuts through the riparian wetlands near the river and the hillslope grasslands further away (Fig. 1).
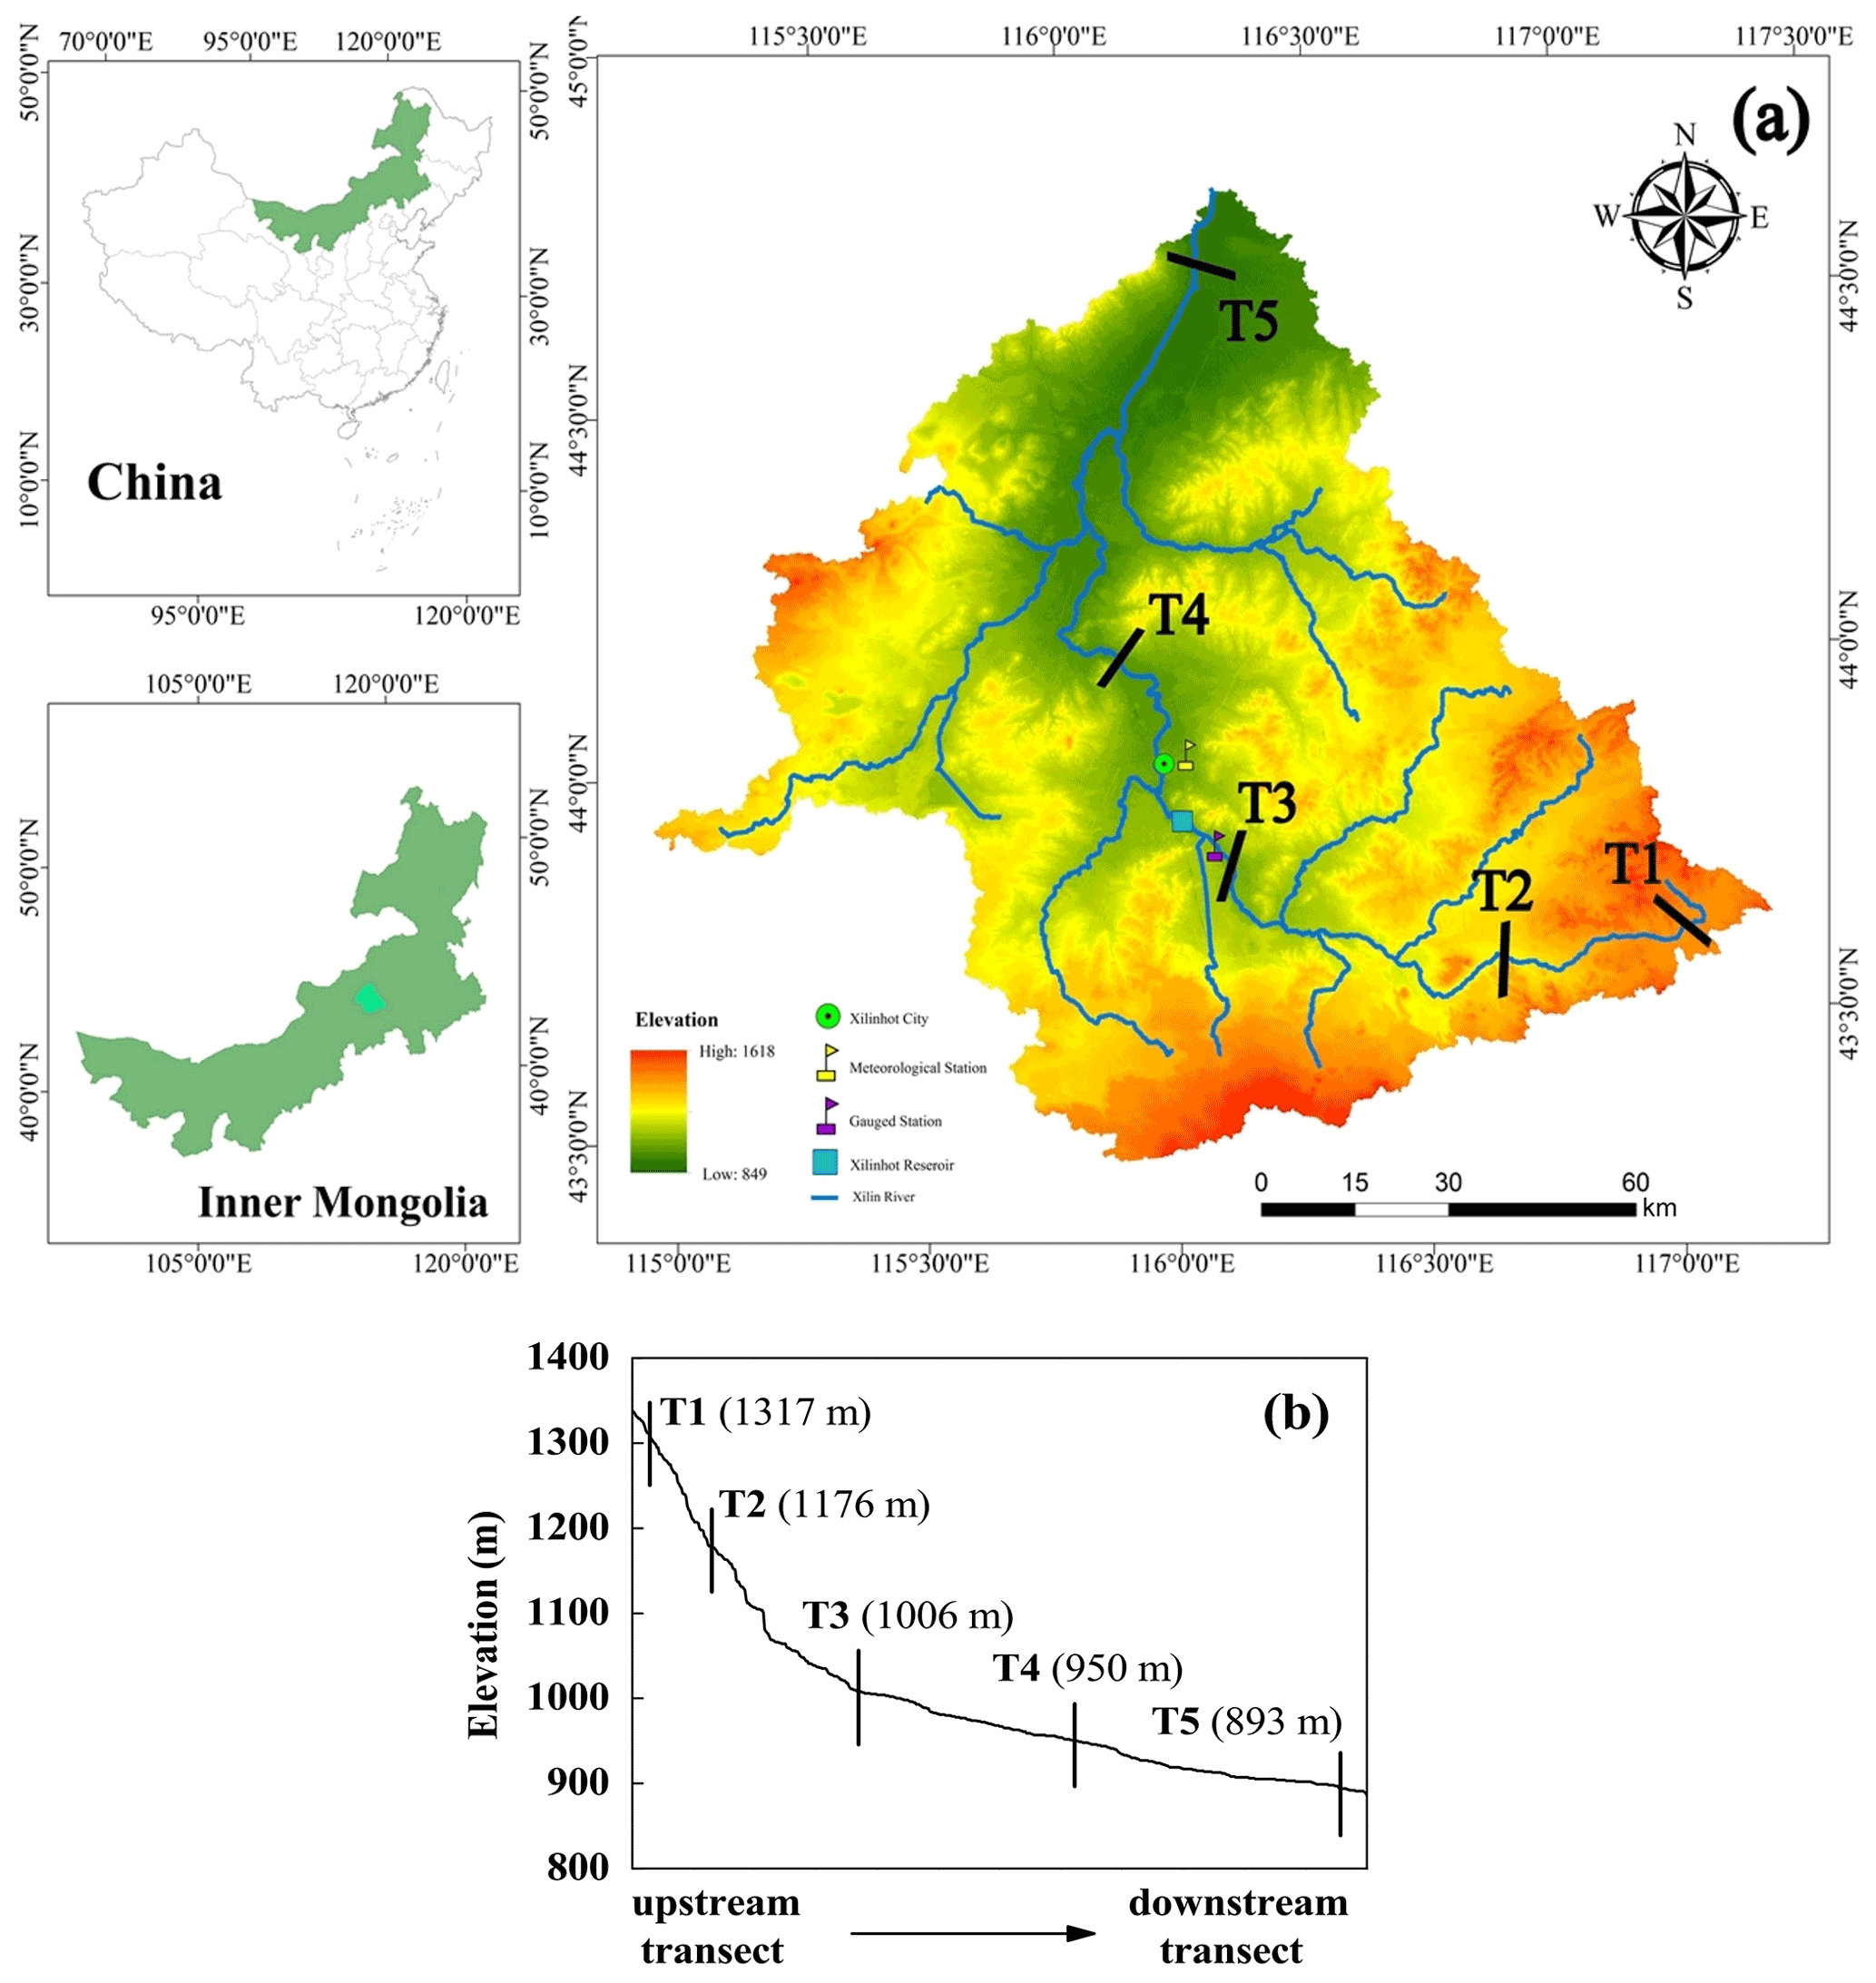
Figure 1(a) Location of the Xilin River basin and distribution of five riparian–hillslope transects (T1–T5). (b) Elevation details of each transect in the Xilin River basin.
The layout of the sampling points of each transect is shown in Fig. 2. Each sampling point, from T1–T5, was extended from either side of the river to the grassland on the slopes by using five to seven sampling points for each transect, resulting in 24 points in total. The sampling sites on the left and right banks were defined as L1–L3 and R1–R4 from the riparian wetlands to the hillslope grasslands. As transect T3 was located on a much wider flood plain, none of its sampling points were located on the hillslope grassland. The last transect (T5) was located downstream in the dry lake and contained seven sampling points. They were defined as S1–S7, where S1, S2, and S7 were located along the lakeshore (the lakeside zone), and S3–S6 were located in the dry lake bed (S3 and S4 in the mudbank, S5 in saline–alkali soil, and S6 in sand–gravel geology). Moreover, characterizations for the T1, T2, and T3 transects were located along the continuous river flow, and the T4 and T5 transects were located along the intermittent river flow.
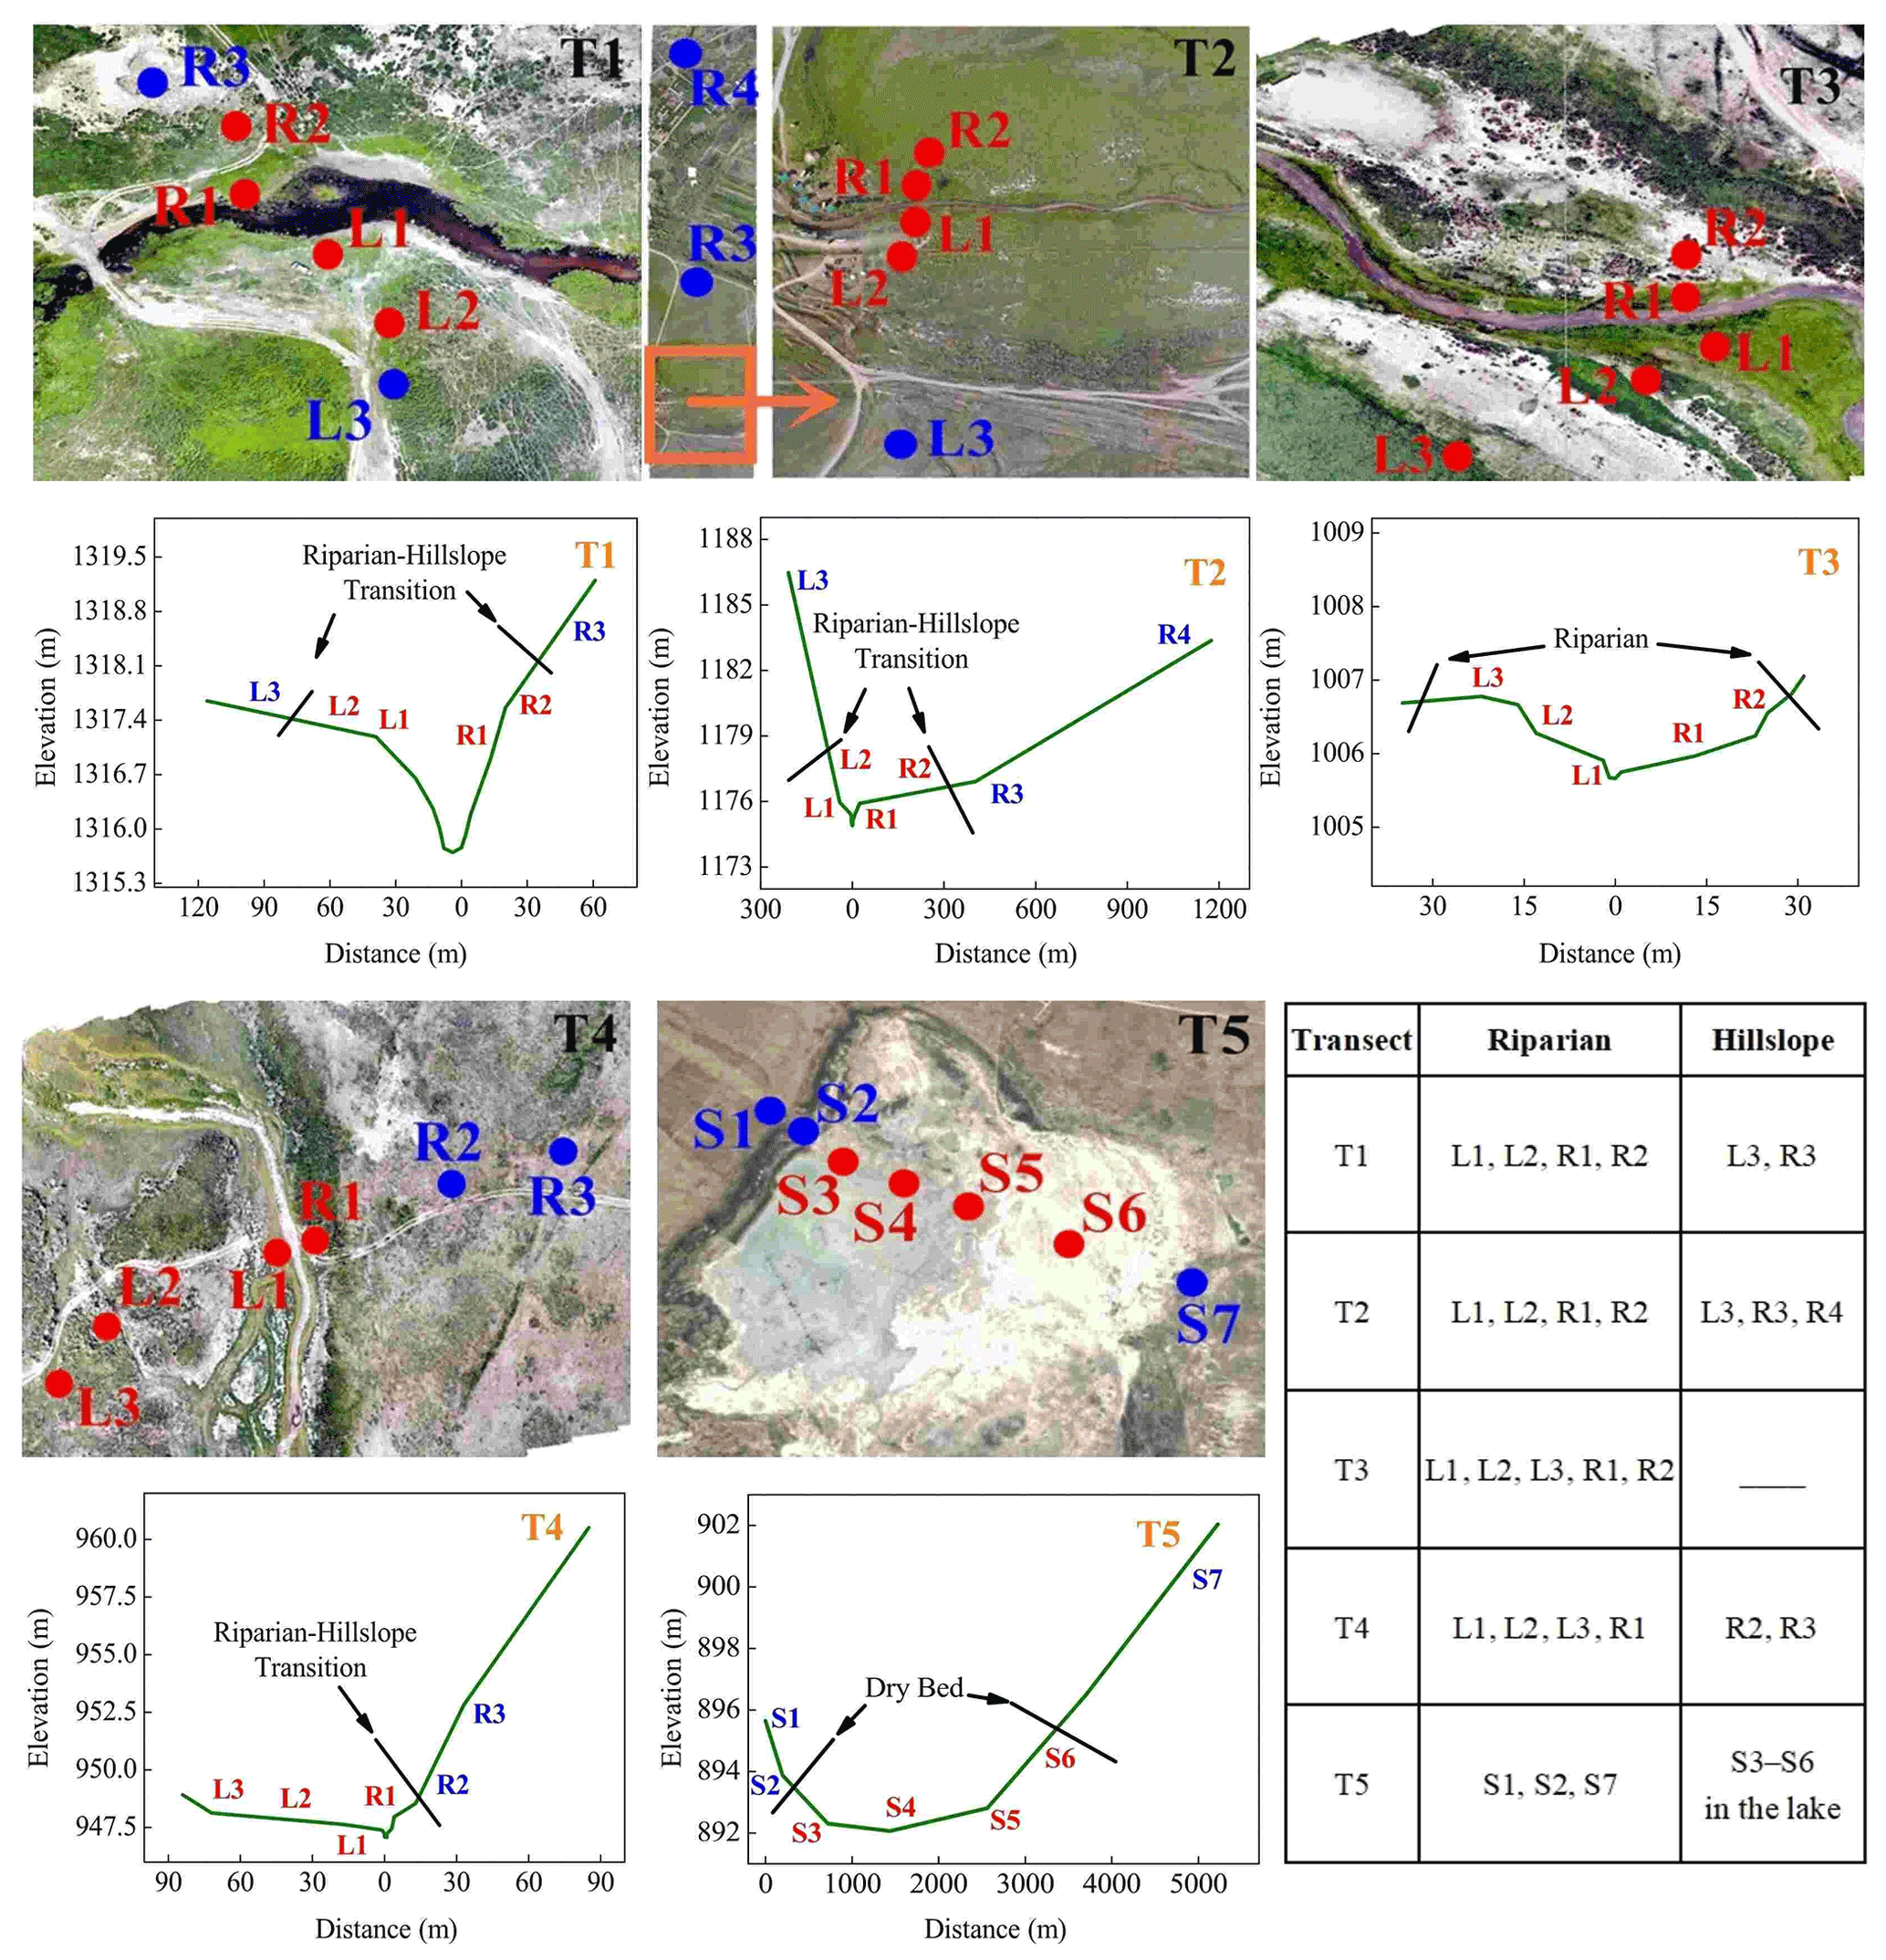
Figure 2Distributions of sampling points in transects T1–T5 (the images are the authors' own).
The CO2, CH4, and N2O emissions from each site were measured in August (wet season) and October (dry season) in 2018 using a static dark chamber and the gas chromatography method. The static chambers were made of a cube-shaped polyvinyl chloride (PVC) pipe (dimensions: ). A battery-driven fan was installed horizontally inside the top wall of the chamber to ensure proper air mixing during measurements. To minimize heating from solar radiation, white adiabatic aluminum foil was used to cover the entire aboveground portion of the chamber. During measurements, the chambers were driven into the soil to ensure airtightness and connected with a differential gas analyzer (Li-7000 CO2H2O analyzer, LI-COR, USA) to measure the changes in the soil CO2 concentration. The air in the chamber was sampled using a 60 mL syringe at 0, 7, 14, 21, and 28 min. The gas samples were stored in a reservoir bag and taken to the laboratory for CH4 and N2O measurements using gas chromatography (GC-2030, Japan). The measurements were scheduled for 09:00–11:00 or 15:00–17:00 UTC+8.
Soil temperature (ST) was measured at depths of 0–10 and 10–20 cm with a geothermometer (DTM-461, Hengshui, China). Plant samples were collected in a static chamber and oven-dried in the laboratory to obtain aboveground biomass (BIO). A 100 cm3 ring cutter was used to collect surface soil samples at each site, which were placed in aluminum boxes and immediately brought back to the laboratory to measure soil mass moisture content (SMC) and soil bulk density (ρb) using national standard methods (NATESC, 2006). Topsoil samples were collected, sealed in plastic bags, and brought back to the laboratory to measure soil pH, electrical conductivity (EC), total soil organic carbon (TOC) content, and soil C:N ratio.
Table 1Physical and chemical properties (mean ± SD) of soils at various sites within each transect.
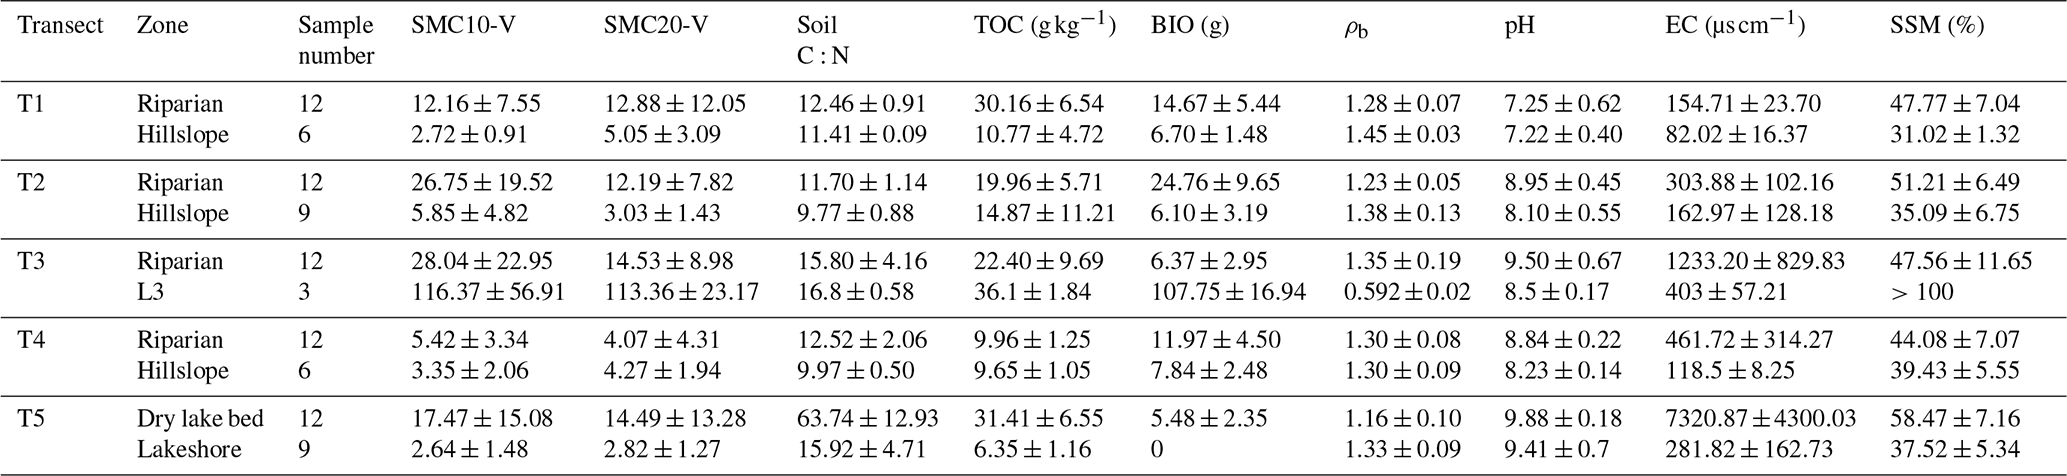
Note: SMC10-V – soil volumetric moisture content in 0–10 cm; SMC20-V – soil volumetric moisture content in 10–20 cm; soil C:N – soil carbon–nitrogen ratio; TOC – total soil organic carbon; BIO – aboveground biomass; ρb – soil bulk density; pH – soil pH; EC – soil electrical conductivity; SSM – saturated soil moisture.
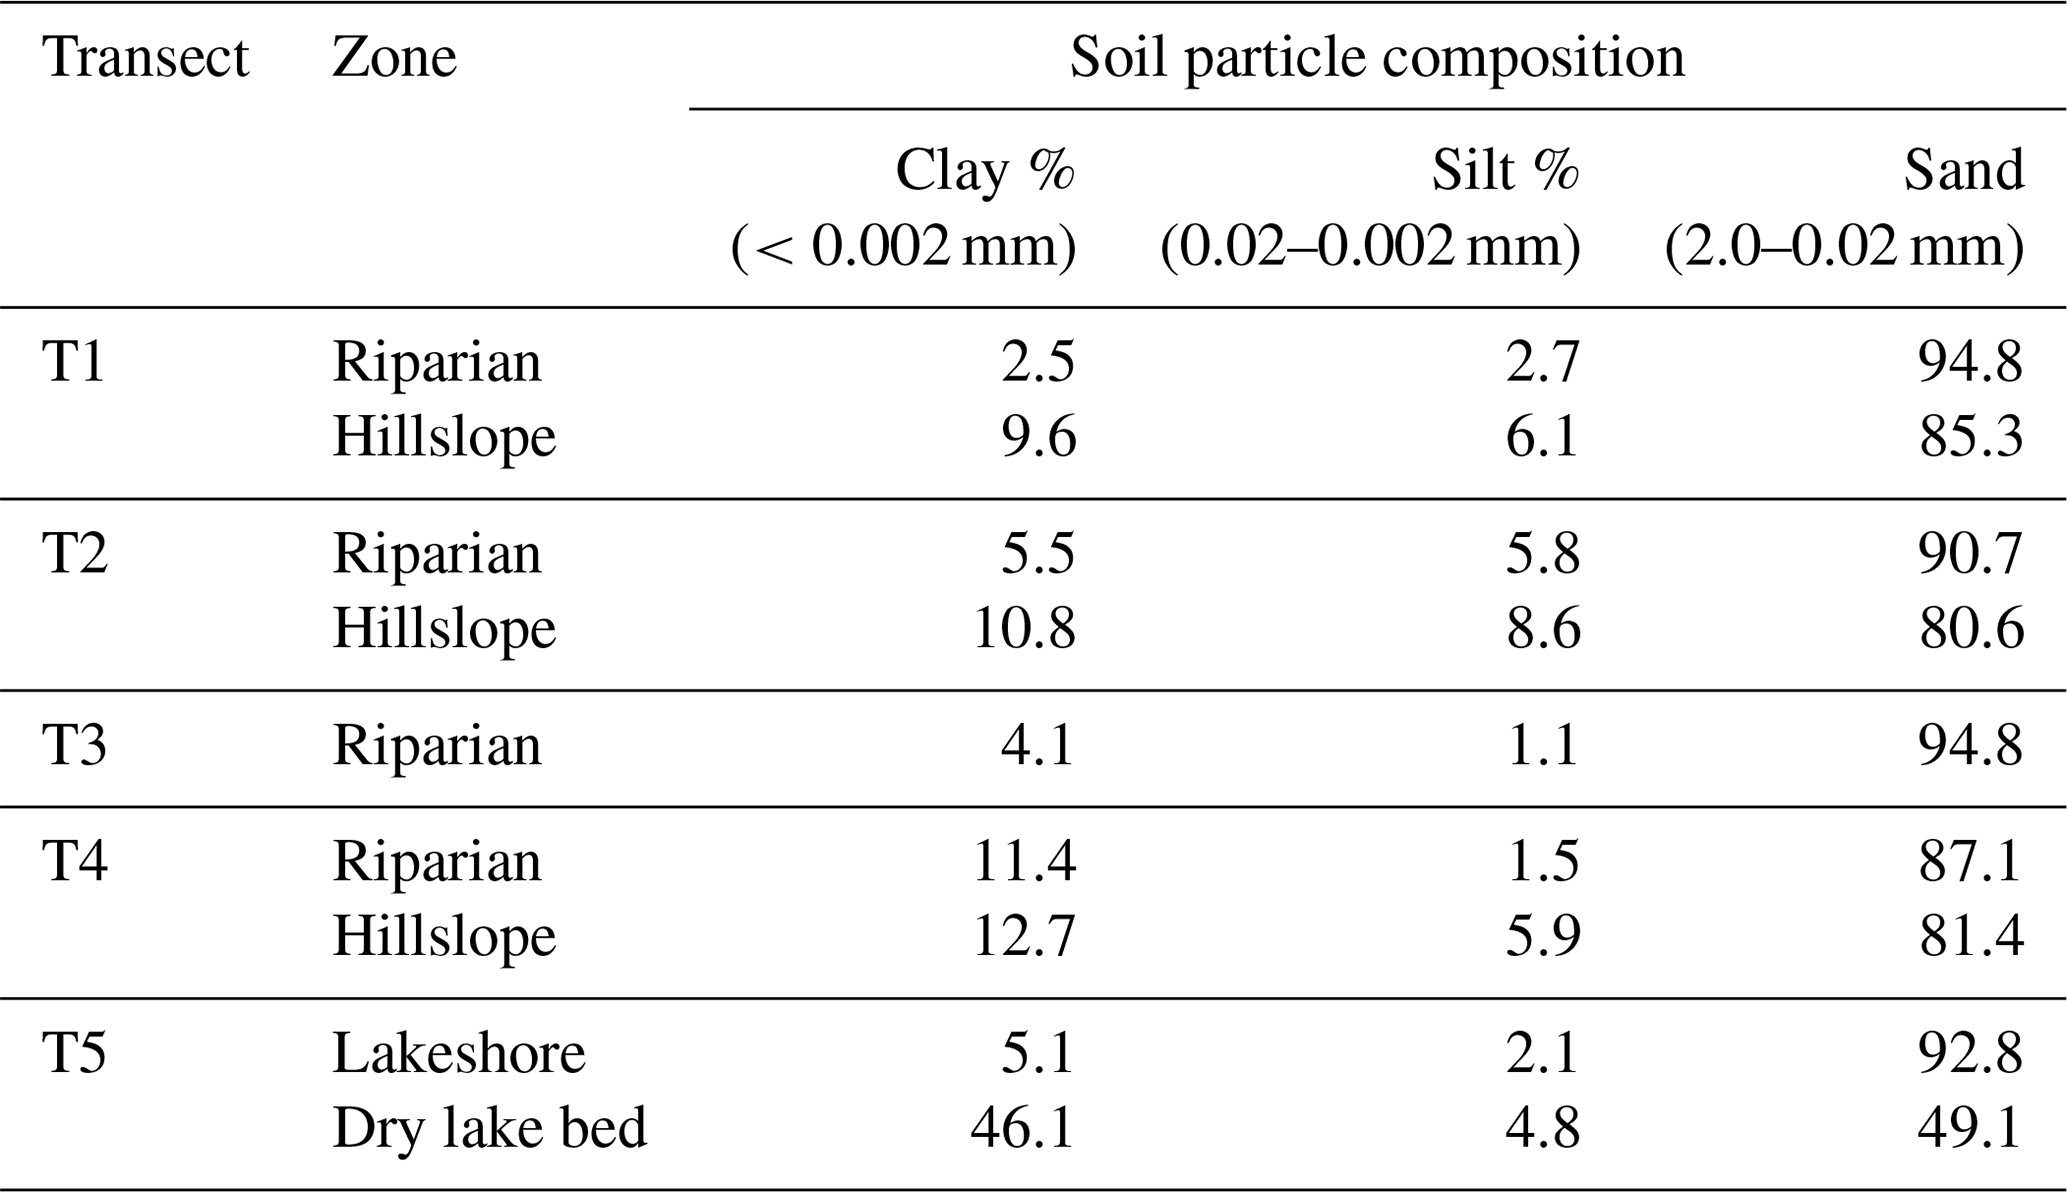
Table 2Soil particle composition of soils at various sites within each transect.
2.3 Calculation of GHG emissions
The CO2, CH4, and N2O emissions were calculated using Eq. (1) (Qin et al., 2016):
where F denotes the flux of CO2, CH4, and N2O emissions (); H is the height of the static chamber (0.18 m); M is the relative molecular weight (44 for CO2 and N2O, and 16 for CH4); V is the volume of gas in the standard state (22.4 L mol−1); is the rate of change of the gas concentration (10−6 h−1); and T is the temperature in the black chamber (∘C).
The annual cumulative emissions were calculated using Eq. (2) (Whiting and Chanton, 2001):
where M denotes the total cumulative emission amounts of CO2, CH4, or N2O (kg hm2); F is the emission flux of CO2, CH4, or N2O; i is the sampling frequency; and represents the interval between two adjacent measurement dates.
In this study, a 100-year timescale was selected to calculate the global warming potential (GWP) of soil CH4 and N2O emissions (Whiting and Chanton, 2001):
where 25 and 298 are the GWP multiples of CH4 and N2O relative to CO2 on a 100-year timescale, respectively.
2.4 Statistical analysis
All statistical analyses were performed using SPSS for Windows version 18.0 (SPSS Inc., Chicago, IL, USA). Statistical significance was set at P<0.05. Pearson correlation analysis was conducted to estimate the relationships between GHG fluxes and environmental variables. A Wilcoxon test was used to determine the differences in the GHG fluxes between the two seasons.
3.1 Spatiotemporal patterns of SMC for each transect
The temporal and spatial variations in SMC10 occurred in the following order: wet season > dry season and riparian wetlands > hillslope grasslands (Fig. 3a, c, and e). Similar variations were observed in SMC20 (Fig. 3b, d, and f). The average SMC10 and SMC20 in the continuous river transects in the riparian zones (SMC10 values were 37.44 % in the wet season and 19.40 % in the dry season, while SMC20 values were 25.96 % in the wet season and 17.39 % in the dry season) were higher than those in the hillslope grasslands (SMC10 values were 9.12 % in the wet season and 4.15 % in the dry season; SMC20 values were 6.51 % in the wet season and 5.96 % in the dry season). During the study period, both SMC10 and SMC20 changed as the distance from the river increased, and the highest value was observed at the near-stream sites (L1 and R1). SMC10 fluctuations were low in the intermittent transect compared with those in the upstream transects, with mean values being 11.79 % in the wet season and 3.72 % in the dry season in the riparian areas. The mean SMC10 in the hillslopes was 6.58 % in the wet season and 2.86 % in the dry season. SMC20 showed similar fluctuation; it was 7.22 % in the wet season and 2.98 % in the dry season in the riparian areas and 7.56 % in the wet season and 4.4 % in the dry season in the hillslopes. In transect T5, average SMC10 and SMC20 at the center of the lake (SMC10 values were 29.00 % in the wet season and 13.36 % in the dry season; SMC20 values were 29.30 % in the wet season and 9.69 % in the dry season) were higher than those along the lakeshore (SMC10 values were 4.90 % in the wet season and 3.13 % in the dry season; SMC20 values were 3.34 % in the wet season and 5.22 % in the dry season).
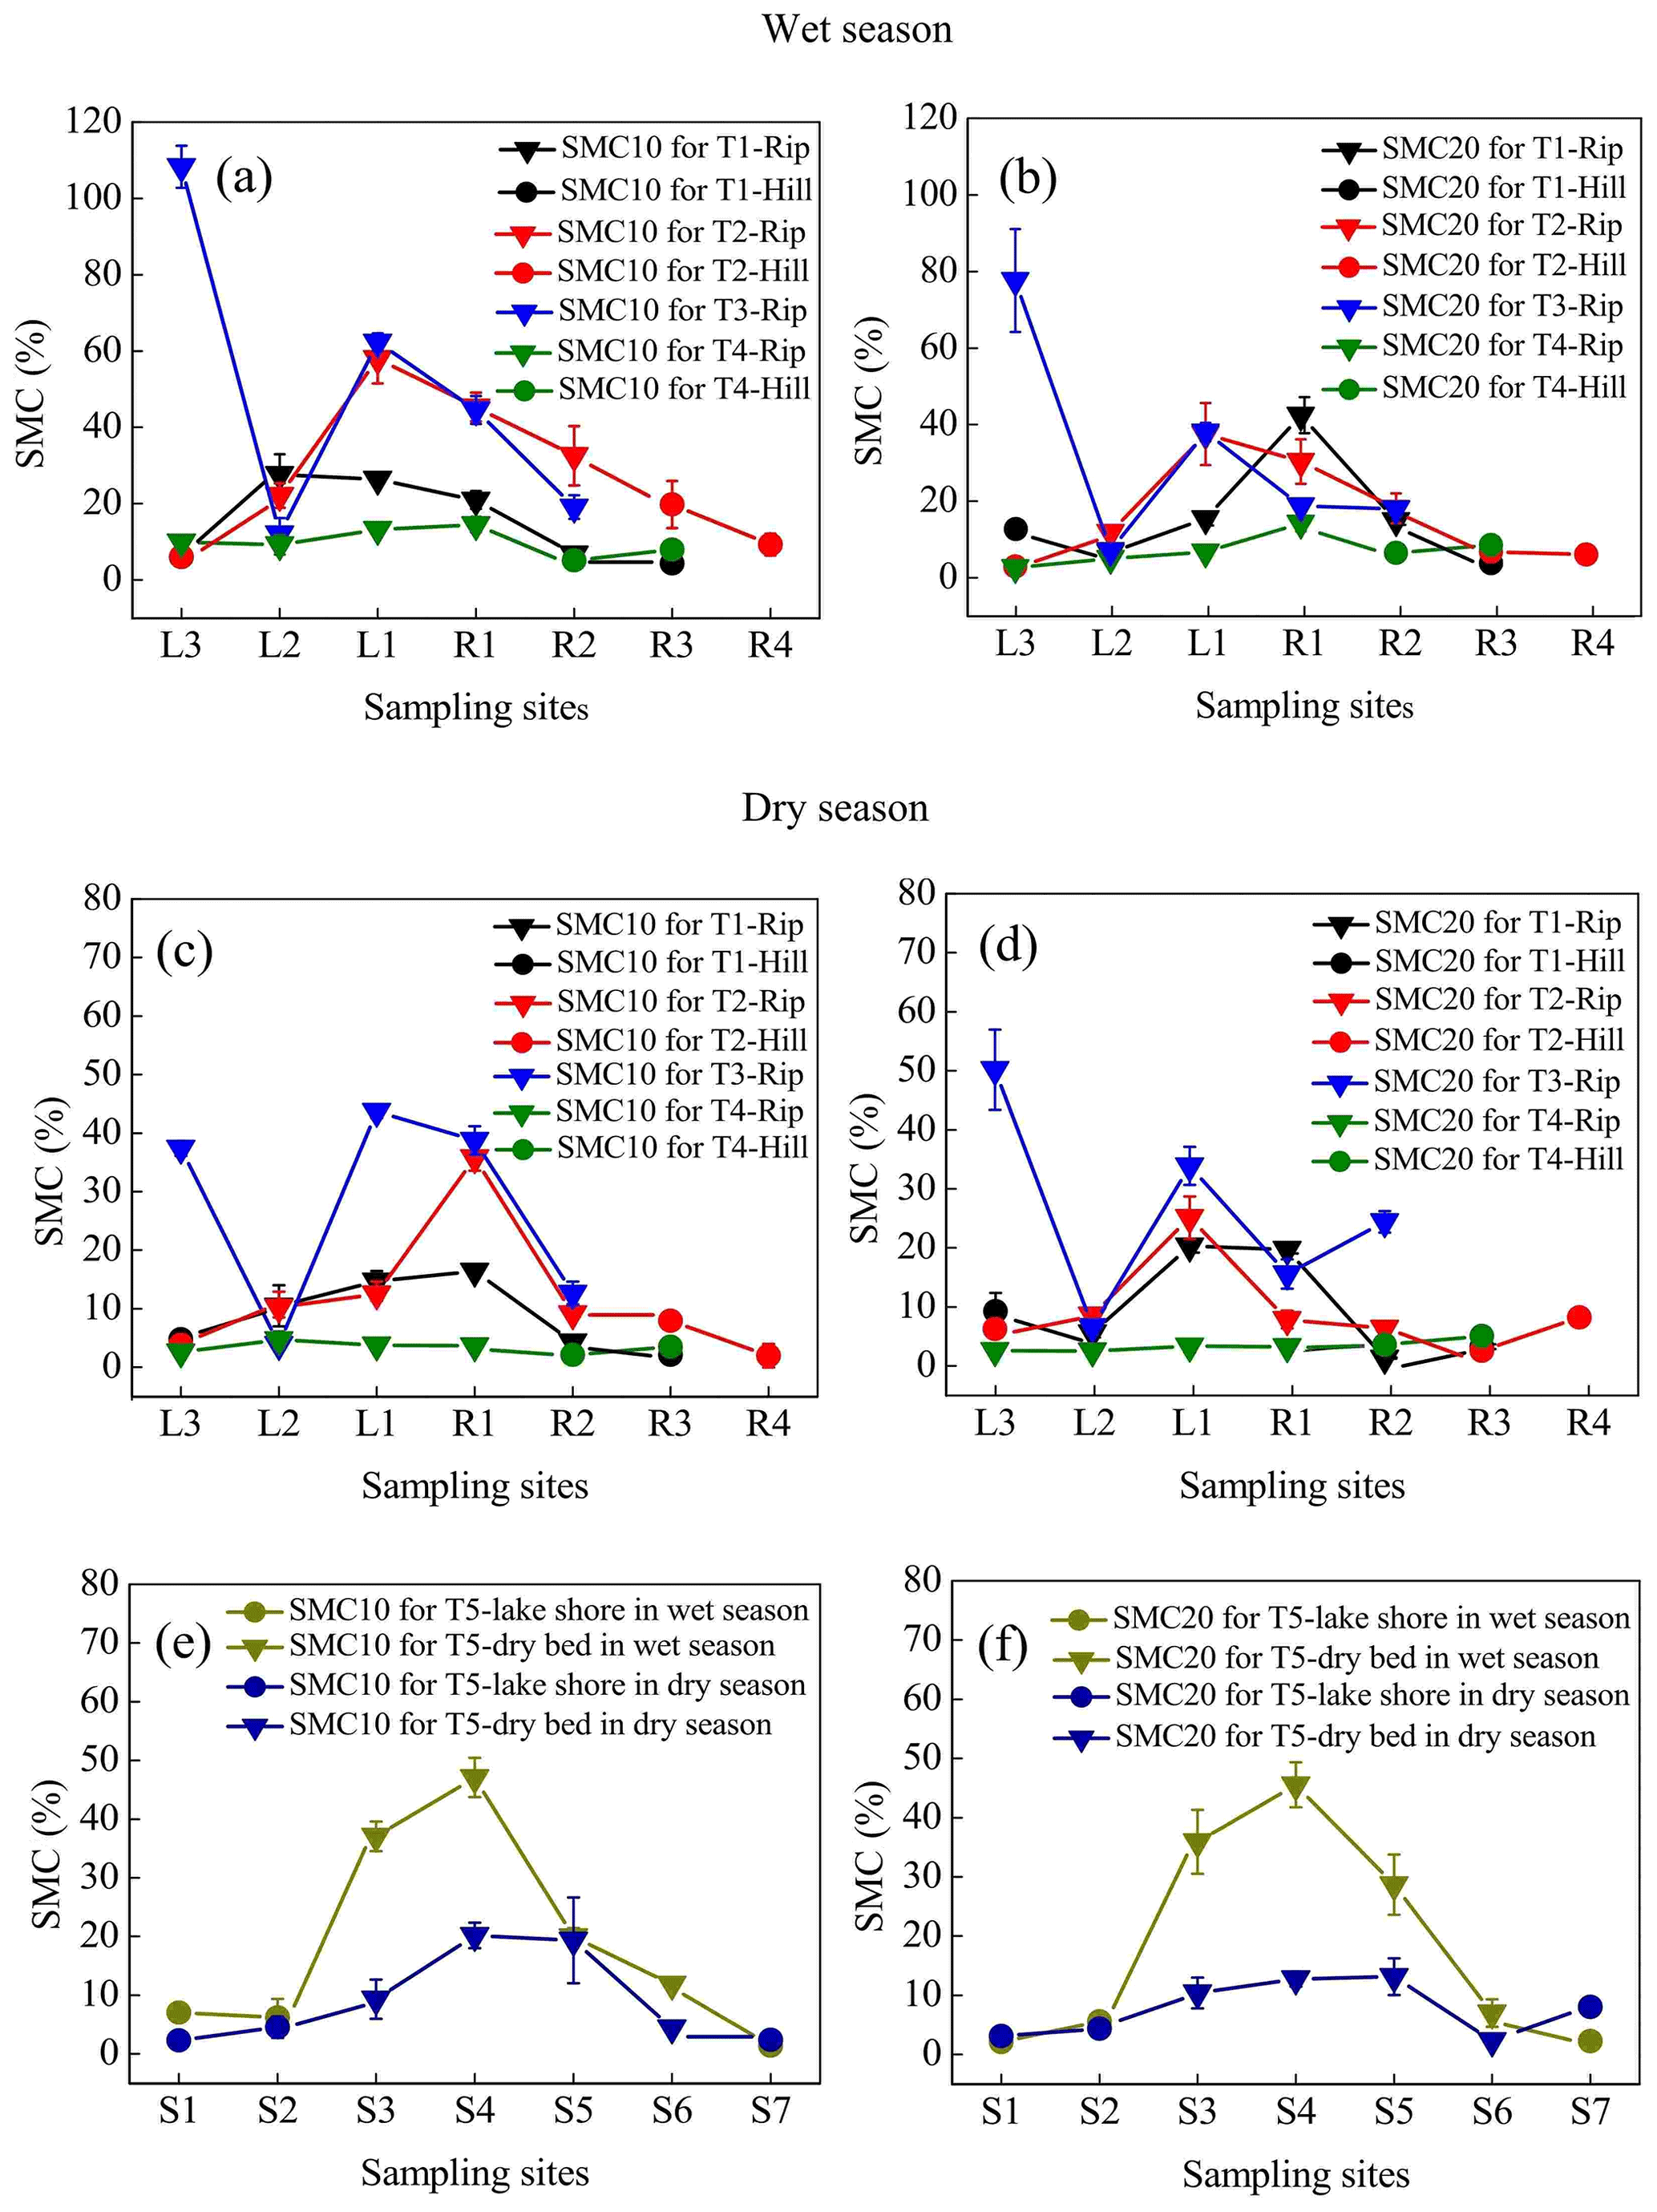
Figure 3Soil mass moisture contents (SMCs) at soil depths of 0–10 cm (SMC10) and 10–20 cm (SMC20) for transects T1–T5 in the wet and dry seasons. Error bars represent the SD about the mean.
3.2 Spatiotemporal patterns of ST in each transect
Spatiotemporal differences in ST during the entire observation period are displayed in Fig. 4. ST variations in the wet season (mean was 27.4 ∘C) were noticeably higher than those in the dry season (mean was 8.97 ∘C). Moreover, ST at riparian sites (mean, 26.0 ∘C in the wet season and 8.41 ∘C in the dry season) was slightly lower than that at the hillslope grasslands (mean, 30.9 ∘C in the wet season and 10.3 ∘C in the dry season) for the 0–10 cm soil depth, with the exception of transect T5. Similar results were observed for the 10–20 cm soil depth.
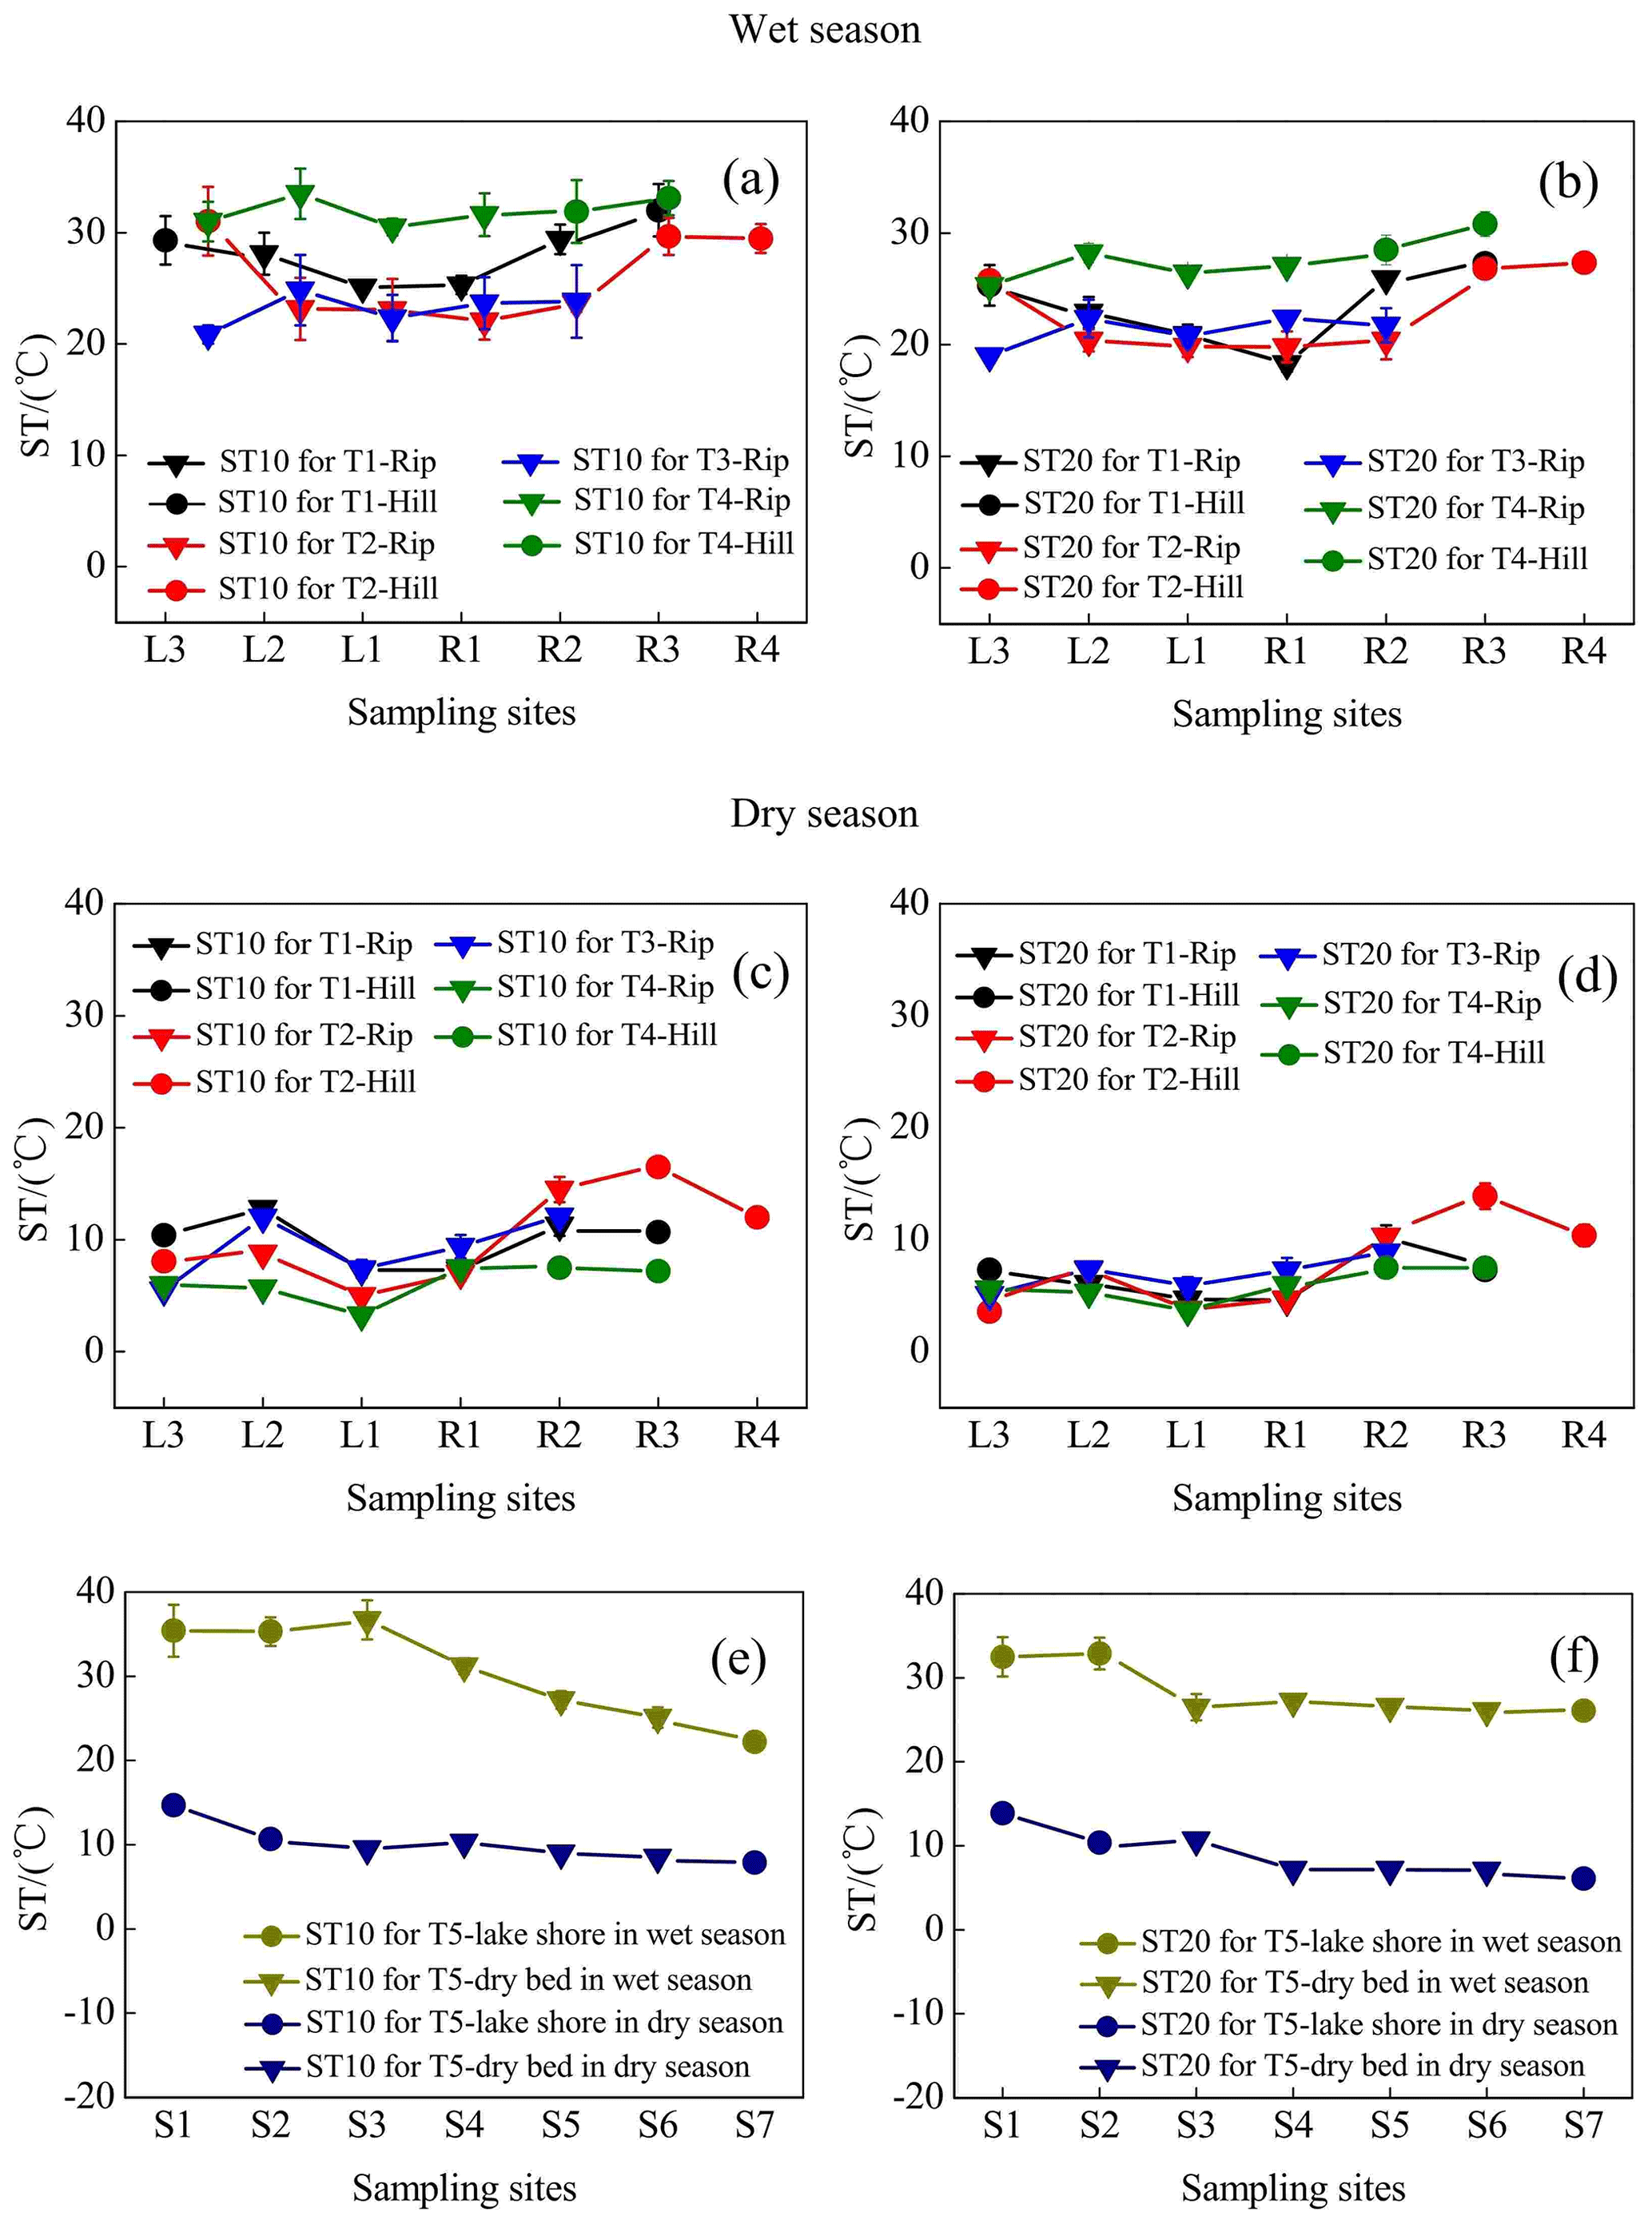
Figure 4Soil temperatures (STs) at soil depths of 0–10 cm (ST10) and 10–20 cm (ST20) for transects T1–T5 in the wet and dry seasons. Error bars represent the SD about the mean.
3.3 Spatiotemporal patterns of GHG emissions in each transect
Figure 5 shows the spatiotemporal variations in GHG emissions in the wet and dry seasons in each transect. CO2 emissions in each transect were higher in the wet season than in the dry season. The average emissions in the riparian wetland transects T1–T4 (1582.09±679.34 in the wet season and 163.24±84.98 in the dry season) were higher than the transects in the hillslope grasslands (1071.54±225.39 in the wet season and 77.68±25.32 in the dry season). High CO2 fluxes occurred in the riparian zones, while lower CO2 fluxes were observed in the hillslope grasslands in continuous river transects (T1, T2, and T3). Transect T4 exhibited lower CO2 emission in the riparian wetlands near the channel than at sites away from the channel. CO2 emissions in transect T5 in the wet and dry seasons decreased from the lakeshore to the lake center.

Figure 5Spatiotemporal patterns of CO2 (first column), CH4 (second column), and N2O (third column) emission (F) for each transect. Data are shown for the wet season (orange) and the dry season (blue). Error bars depict standard deviation.
CH4 emissions at the continuous river flow transects (T1, T2, and T3) varied between the wet and dry seasons, except for those at T4 (characterized by intermittent river flow) and T5 (the dry lake). In the wet season, the near-stream sites (L1 and R1) in T1, T2, and T3 were characterized as high-CH4 sources (average, 3.74±3.81 ), but the sites located away from the river gradually turned into CH4 sinks. Moreover, all the sites in transects T4 and T5 were sinks. CH4 emissions (mean value: 0.2±0.45 ) at the wetland sites were always lower in the dry season than those in the wet season. However, the sites on the hillslope grasslands served as CH4 sinks (mean value: ). In transect T5, CH4 emissions showed the opposite trend; a CH4 sink was observed in the wet season, but it was transformed into a CH4 source in the dry season.
Similar to the CO2 and CH4 emissions, N2O emissions showed a distinct spatiotemporal pattern in all the transects. N2O emissions in the wet season were higher than those in the dry season. These emissions were higher in the riparian wetlands than in the hillslope grasslands. Moreover, almost all sites with continuous river flow were N2O sources, while more than half of the sites with intermittent river flow were sinks.
Table 3 shows that CO2 fluxes were significantly correlated between the wet and dry seasons, while CH4 and N2O fluxes were not correlated between the two seasons.
Table 3Significant correlations between GHGs fluxes and two seasons (n=31).
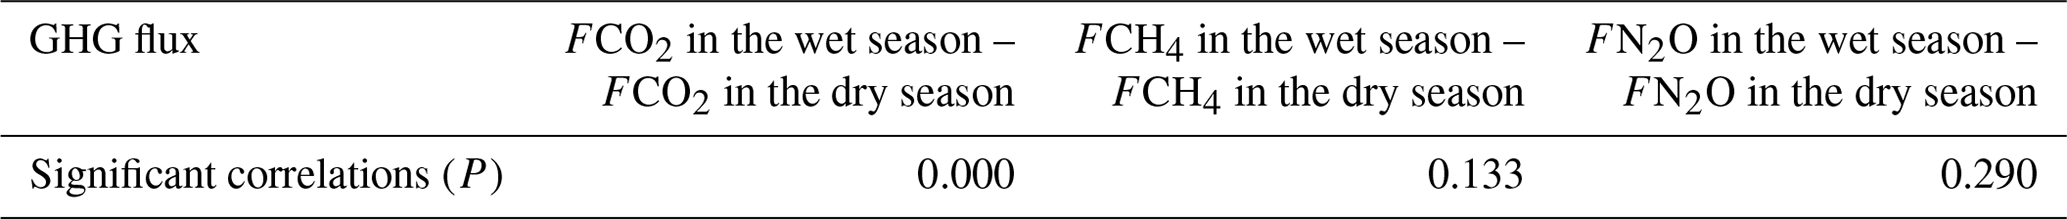
Note: P<0.05 denotes significant correlation and P>0.05 denotes no significant correlation.
3.4 Spatiotemporal patterns of GHG emission in upstream and downstream areas
Figure 6 shows the detailed spatial and seasonal patterns of GHG emission in the wet and dry seasons in the longitudinal direction from the upstream (T1, T2, and T3) to the downstream areas (T4 and T5). The CO2, CH4, and N2O emissions were calculated using the average values of the respective emissions in the wetlands and hillslope grasslands in each transect.

Figure 6Spatiotemporal patterns of CO2 (first line), CH4 (second line), and N2O (third line) emissions (F) in the upstream (T1, T2, and T3) and downstream areas (T4 and T5). Bars represent the mean values for each transect, and error bars show the standard errors.
CO2 emissions at the riparian wetlands (Fig. 6a) in the wet season decreased from 2444.69±228.58 in the upstream area to 665.08±347.57 downstream, and the corresponding values for the dry season were 238.12±48.20 and 94.14±7.67 , respectively. However, in the hillslope grasslands (Fig. 6b), CO2 emissions exhibited no significant seasonality between the upstream and downstream areas, with mean values being 1103.40±190.44 in the wet season and 79.18±24.52 in the dry season. In addition, the CO2 emissions in transect T5 were low for both months, with averages of 162.83±149.15 and 63.26±12.40 in the wet and dry seasons, respectively. The upstream riparian zones exhibited higher CO2 emissions (894.32±868.47 ) than their downstream counterparts (621.14±704.10 ). Mean CO2 emissions showed no significant differences in the grasslands, averaging 524.16±450.10 upstream and 508.06±534.77 downstream.
CH4 emissions showed a marked spatial pattern in the riparian zones from upstream to downstream (Fig. 6c). The transects with continuous river flow were CH4 sources in the wet and dry seasons, with average emissions of 1.42±3.41 and 0.27±0.49 , respectively; while those with intermittent river flow served as CH4 sinks, with the corresponding means of and , respectively. Moreover, the hillslope grassland sites in all transects were CH4 sinks (Fig. 6d).
N2O emissions in riparian wetlands (Fig. 7e) showed spatial patterns similar to those of CH4 emissions. In the wet season, the transects with continuous river flow served as N2O sources, with a mean emission of 0.031±0.031 ; meanwhile, transects with intermittent river flow acted as N2O sinks with an average emission of . In the dry season, N2O emissions occurred as weak sources in the longitudinal transects, exhibiting an average emission of 0.002±0.007 . However, the N2O emission in the hillslope grasslands did not show any spatial patterns (Fig. 7f).
4.1 Main factors influencing GHG emissions
4.1.1 Effects of SMC on GHG emissions
SMC constitutes one of the main factors affecting GHG emission in wetlands. In this study, transects T1–T4 were characterized by a marked spatial SMC gradient (i.e., a gradual decrease in SMC10 and SMC20 from the riparian wetlands to the hillslope grasslands and from the upstream to downstream regions; Fig. 3). The CO2, CH4, and N2O emissions showed a similar trend. Table 4 shows that SMC10 is positively correlated with CO2 emission (P<0.05) and that SMC10 and SMC20 are significantly positively correlated with CH4 emission (P<0.01) and with N2O emission (P<0.05 and P<0.01, respectively). These results indicate the influence of wetland SMC on GHG emission.
Typically, the optimal SMC associated with CO2 emission in the riparian wetlands ranges from 40 % to 60 % (Sjögersten et al., 2006), creating better soil aeration, and improving soil microorganism activity and respiration in plant roots, thereby promoting CO2 emission. Excessive SMC reduces soil gas transfer due to the formation of an anaerobic environment in the soil, and microbial activity is lowered, favoring the accumulation of organic matter (Hui, 2014). The SMC of the hillslope grasslands was found to be less than 10 %. Low soil moisture inhibits the growth of vegetation, with few vegetation residues and litters. Meanwhile, low soil moisture is not conducive to the survival of soil microorganisms, leading to lower CO2 emission from the hillslope grasslands than from the riparian zones (Moldrup et al., 2000; Hui, 2014). Similar results were obtained in our study. The change in CO2 emission in transect T5 was contrary to the changes in SMC10 and SMC20, likely because the optimal range of soil C:N is between 10–12 (Pierzynski et al., 1994), but the value in the dry lake bed of T5 is higher than 60. The high soil C:N resulted in nitrogen limitation in the process of decomposition of organic matter by microorganisms. Further, other sediment properties (like Soil pH >9.5) for this transect were not conducive to the survival of microorganisms (Table 1), and the increase in SMC did not increase the respiration activity of the microorganisms.
The highest CH4 emissions were observed at the near-stream sites (i.e., L1 and R1) in T1, T2, and T3, with average SMC of 30.29 %, while the SMC at the other sites, which were either weak sources or sinks, averaged at 14.57 %. These results indicate that a higher SMC is favorable for CH4 emissions. This may be because a higher SMC accompanies soil in a reduced state, which is beneficial for CH4 production and inhibits CH4 oxidation. A similar result was reported by Xu et al. (2008). They conducted experiments analyzing CH4 emissions from a variety of paddy soils in China and showed that CH4 production rates increased with the increase in SMC at the same incubation temperature. Meng et al. (2011) also reported that water depth was the main factor affecting CH4 emissions from wetlands. When the water level dropped below the soil surface, the decomposition of organic matter accelerated, and CH4 emission decreased. If the oxide layer is large, the soil is transformed into a CH4 sink (Meng et al., 2011).
The N2O fluxes showed a clear spatial pattern associated with the
changes in SMC. The moisture content of wetland soils directly affects the
aeration status of the soil. Besides, the aeration status affects the
partial pressure of oxygen, which has an important impact on
nitrifying and denitrifying bacterial activity and ultimately affects soil
N2O emissions (Zhang et al., 2005). Table 4 shows that N2O
emission is significantly positively correlated with SMC10 and SMC20 (P<0.01). Generally, when SMC is below the saturated water content,
the microorganisms are in an aerobic environment, and N2O mainly comes
from the nitrification reaction. N2O emission increases with increase
in SMC (Niu et al., 2017; Yu et al., 2006). In our study, the sampling sites
with higher SMC (riparian zones and some hillslope grassland zones in the
upstream transects) have higher N2O emissions. When SMC increases to
the saturated water content or is in a flooded state, the system is an
anaerobic environment, and the nitrous oxide reductase activity is higher
due to excessively high SMC, which is conducive to denitrification and
eventually produces N2 (Niu et al., 2017; Yu et al., 2006), such as
at site L1 in transect T3 in this study. Rückauf et al. (2004) showed that
denitrification was the main process under flooded soil conditions in
wetland soils and that the release of N2 exceeds that of N2O.
These findings are consistent with those of Liu et al. (2003), who showed
that SMC is an essential factor affecting N2O emission.
Nitrification: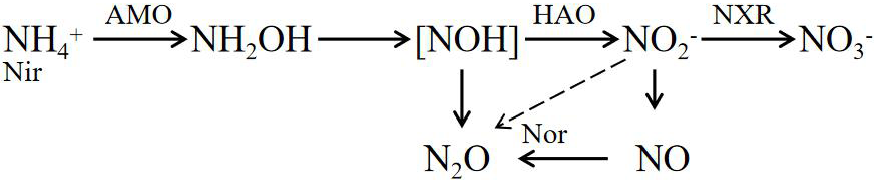
Denitrification:
The enzymes involved in the formula include ammonia monooxygenase (AMO), hydroxylamine oxidase (HAO), nitrite REDOX enzyme (HAO), nitrate reductase (Nar), nitrite reductase (Nir), nitric oxide reductase (Nor), and nitrous oxide reductase (Nos).
4.1.2 Effects of ST on GHG emissions
ST was another important factor affecting CO2 emission in this study; it was found to be significantly correlated with CO2 emission (P<0.01) (Table 4). The activity of soil microorganisms increases with rising soil temperature, leading to increased respiration and consequently higher CO2 emission (Heilman et al., 1999). Previous studies have reported that ST partially controls seasonal CO2 emission patterns (Inubushi et al., 2003). Concurrently, CO2 emissions in the wet season were significantly higher than those in the dry season in this study.
CH4 emissions showed a clear seasonal pattern, likely because high summer temperatures improve the activity of both CH4-producing and CH4-oxidizing bacteria (Ding et al., 2010). However, as Table 4 indicates, the correlation between CH4 emission and temperature was not significant in this study, likely because SMC was a more critical factor than temperature in our study region given its very dry climate. SMC showed a positive correlation with GHG emissions. In addition, SMC affected ST to a certain extent, while the interactions between SMC and ST had a mutual influence on CH4 emission. During the study period, the near-stream sites (L1 and R1) maintained a super-wet state on the ground surface for a long time, which was beneficial for the production of CH4. However, the wetlands maintained a state without water accumulation on the soil surface in August, which was conducive to the oxidative absorption of CH4. SMC thus masked the effect of ST on CH4 emissions.
Previous studies have indicated that temperature is an important factor affecting N2O emission (Sun et al., 2011) through primary mechanisms impacting the nitrifying and denitrifying bacteria in the soil. As Table 4 shows, the correlations between N2O emission and ST10 and ST20 were poor (P>0.05). This can be attributed to the wide suitable temperature range for nitrification–denitrification and weak sensitivity to temperature. Malhi and Mcgill (1982) found that the optimum temperature for nitrification was 20 ∘C and that it inhibits entirely at 30 ∘C. However, Brady (1999) believed that the suitable temperature range for nitrification is 25–35 ∘C and that nitrification inhibits below 5 ∘C or above 50 ∘C. This shows that the temperature requirements of nitrifying microorganisms in wetland soils are possibly different in different temperature belts. The suitable temperature range was the performance of the long-term adaptability of nitrifying microorganisms. Meanwhile, several studies have revealed that denitrification can be carried out in a wide temperature range (5–70 ∘C) and that it is positively related to temperature (Fan, 1995). However, the process is inhibited when the temperature is too high or too low. The average ST in the wet season was 27.4 ∘C, conducive to the growth of denitrifying microorganisms, while that in the dry season was 8.97 ∘C, and the microbial activity was generally low (Sun et al., 2011). Furthermore, ST fluctuations were low in both the wet and dry seasons. Therefore, the effect of ST on N2O emission may have been masked by other factors, such as moisture content.
4.1.3 Effects of BIO and soil organic matter content on GHG emissions
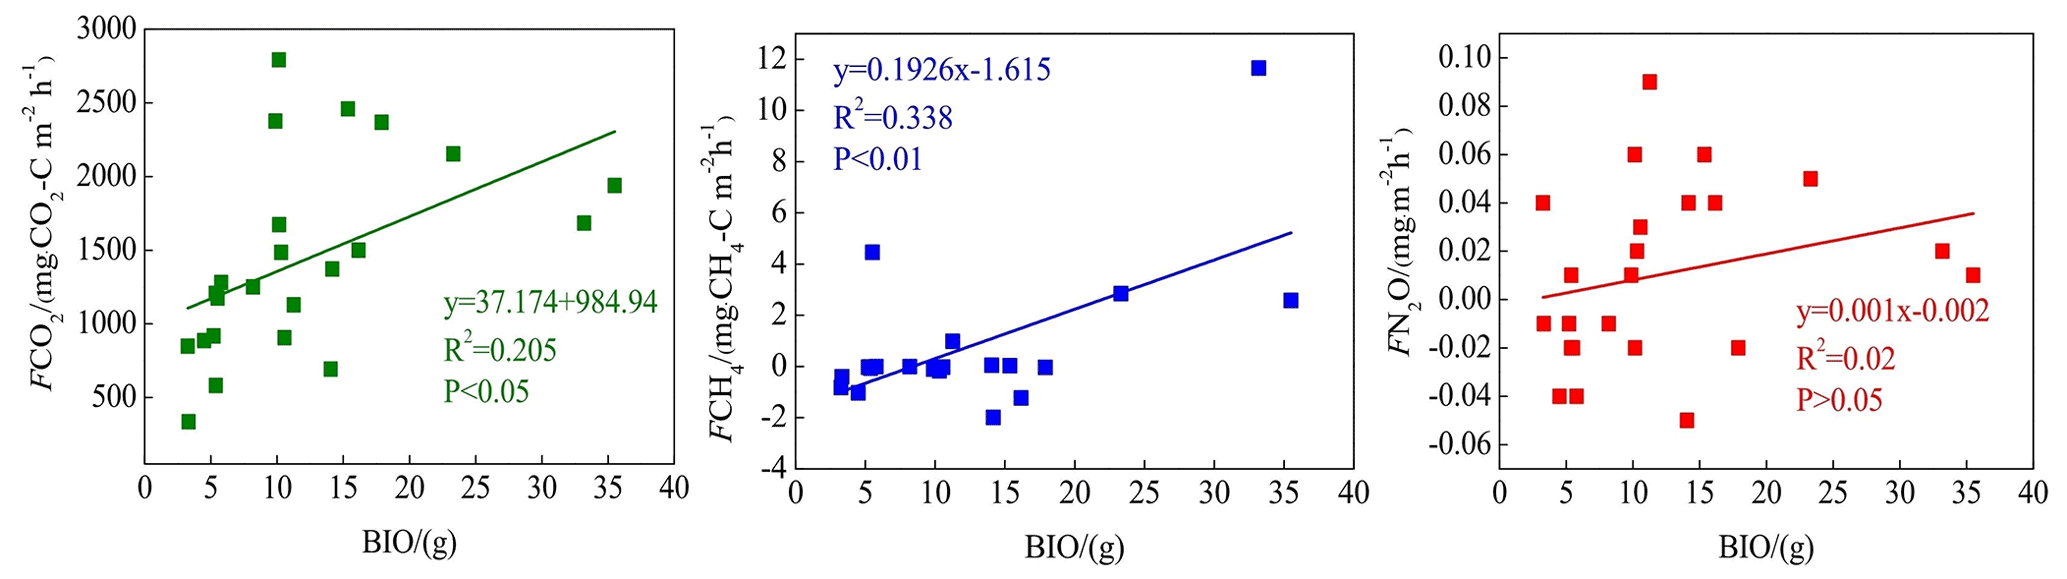
CO2 and CH4 emissions were higher in the riparian wetlands than in the grasslands, mainly because of the greater vegetation cover in the former. Typically, CO2 emissions in the riparian wetlands originate from plants and microorganisms, with plant respiration accounting for a large proportion in the growing season. Previous studies have shown that plant respiration accounts for 35 %–90 % of the total respiration in the wetland ecosystem (Johnson-Randall and Foote, 2005). The good soil physicochemical properties and high soil TOC content of the riparian wetlands improve both the activity of soil microorganisms and plant root respiration. As Table 4 shows, BIO is significantly correlated with CO2 (P<0.05) and CH4 (P<0.01) emissions. These results are indicated by the significant linear positive correlation between the respiration rate and plant biomass (Lu et al., 2007). Higher plant biomass storage can achieve more carbon accumulation during photosynthesis and higher exudate release by the roots. This, in turn, promotes the accumulation of soil organic matter. An increased amount of organic matter stimulates the growth and reproduction of soil microorganisms, ultimately promoting CO2 and CH4 emission. Moreover, plants act as gas channels for CH4 transmission, and a larger amount of biomass promotes CH4 emission, given the increased number of channels. In transect T3, the high CO2 emission observed at site L3 can be attributed to the relatively high levels of SMC, BIO, and soil nutrients, which stimulate microbial respiration rates.
BIO had a weak correlation with N2O emission (Table 4), which indicates that plants increase N2O production and emission, although this may not be the most critical factor. Previous studies have reported mechanisms wherein the plants are able to absorb the N2O produced in the soil through the root system before releasing it into the atmosphere. Additionally, the root exudates of plants can enhance the activity of nitrifying and denitrifying bacteria in the soil, ultimately promoting the production of N2O. Finally, oxygen stress caused by plant respiration can regulate the production and consumption of N2O in the soil, eventually affecting the conversion of nitrogen in the soil (Koops et al., 1996; Azam et al., 2005).
Site L3 in transect T3 was covered by tall reeds, and its BIO was much higher than that of any of the other sites; thus, the data for this site were excluded from the correlation analysis.
Soil C:N ratio refers to the ratio of the concentration of biodegradable carbonaceous organic matter to nitrogenous matter in the soil, and it forms a soil matrix with TOC. TOC decomposition provides energy for microbial activity, while the C:N ratio affects the decomposition of organic matter by soil microorganisms (Gholz et al., 2000). The correlation results (Fig. 8) indicate that TOC had a weak positive correlation with CO2 emission (P>0.05), but the soil C:N ratio had a significant negative correlation with CO2 emission (P<0.05), indicating that nitrogen has a limiting effect on soil respiration by affecting microbial metabolism. Liu (2019) have reported that N addition promotes CO2 emission from wetlands soil, and the effect of organic N input was significantly higher than that of inorganic N input. Organic carbon acts as a carbon source for the growth of plants and microorganisms, which boosts their respiration. Moreover, TOC has a significant correlation with N2O emissions (P<0.05). Most heterotrophic microorganisms use soil organic matter as carbon and electron donors (Morley and Baggs, 2010). Soil carbon sources have an important influence on microbial activity. Nitrifying or denitrifying microorganisms need organic matter to act as the carbon source during the assimilation of NH3 or . High content of organic matter in the soil can promote the concentration of heterotrophic nitrifying bacteria, consume dissolved oxygen in the medium, and cause the soil to become more anaerobic, thereby slowing down autotrophic growth nitrifying bacteria. This reduces the nitrification rate, ultimately promoting N2O release. Enwall et al. (2005) studied the effect of long-term fertilization on soil denitrification microbial action intensity. They found that the soil with long-term organic fertilizer application has a significant increase in organic matter content and consequently a significant increase in denitrification activity. Typically, low soil C:N ratios are favorable for the decomposition of microorganisms, the most suitable range being between 10 and 12 (Pierzynski et al., 2005). As Table 4 shows, N2O emission was significantly related to the soil C:N ratios (P<0.05), which means that denitrifying bacteria could use their endogenous carbon source for denitrification when the external carbon source was insufficient. Moreover, incomplete denitrification leads to the accumulation of NO2–N, which is conducive to N2O release. Meanwhile, due to the weak competitive ability of Nos to electrons, a low soil C:N ratio inhibits the synthesis of Nos, which is also a reason for N2O release. In this study, all sites in transects T1–T4 exhibited similar soil C:N ratios in the optimum range (Table 1), which is favorable for microbial decomposition. However, the soil C:N ratios in transect T5 were higher than those in the other transects, especially in the dry lake bed. Therefore, transect T5 showed severe mineralization and a low microbial decomposition rate.

Table 4Correlations between CO2, CH4, and N2O emissions and impact factors (n=62).
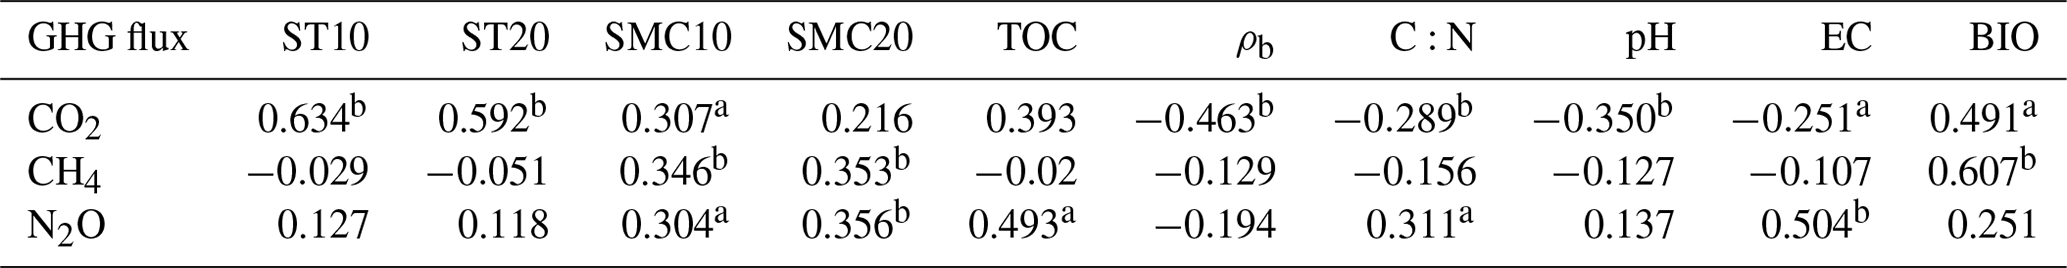
Note: 1. The analysis method used in the table is Pearson correlation analysis, and the numbers represent Pearson correlation coefficients. 2. a and b denote significant and highly significant correlations (P<0.05 and P<0.01), respectively. 3. ST – soil temperature, SMC – soil moisture content, ρb – soil bulk density, soil C:N – soil carbon–nitrogen ratio, pH – soil pH, EC – soil electrical conductivity, and BIO – aboveground biomass.
4.2 Riparian wetlands as hotspots of GHG emissions
The results of this study emphasized that the rate of CO2 emission in the riparian wetlands was higher than that in the hillslope grasslands, owing to a variety of factors. ST is an important factor affecting GHG emission. Mclain and Martens (2006) showed that seasonal fluctuations in ST and SMC in semi-arid regions have important effects on CO2, CH4, and N2O emissions in riparian soils. Poblador et al. (2017) studied the GHG emission in forest riparian zones and suggested that the difference in the CO2 and N2O emissions in these zones is caused by the spatial gradient of the regional SMC. In this study, the upstream riparian wetlands were characterized by higher TOC content, lower soil C:N ratio, and more abundant BIO than those in the hillslope grasslands (Table 1). These soil conditions benefited the soil microbial activity, ultimately enhancing respiration as well as CO2 emissions. However, the CO2 emission in the downstream areas was nearly identical to that in the grasslands, likely because the wetlands gradually evolved into grasslands after their degradation. N2O emission showed spatial patterns similar to that of CO2 emission, likely because the CO2 concentration was closely related to the nitrification and denitrification processes. High CO2 concentrations can promote the carbon and nitrogen cycles in soil (Azam et al., 2005), increasing belowground C allocation, which is associated with increased root biomass, root turnover, and root exudation. Elevated pCO2 in plants provides the energy for denitrification in the presence of high available N, and there is increased O2 consumption under elevated pCO2 (Baggs et al., 2003). Moreover, soil respiration increases during soil denitrification (Liu et al., 2010; Christensen et al., 1990). In this study, a weak correlation was observed between the CO2 and CH4 emissions in the riparian zones (r=0.228), but CO2 emission was significantly correlated with N2O emission (r=0.322, P<0.05). The soil became anaerobic in the riparian areas as the SMC increased, and this was conducive to the survival of CH4-producing bacteria and to denitrification reactions, eventually leading to an increase in CH4 and N2O emissions. Jacinthe et al. (2015) reported that inundated grassland-dominated riparian wetlands were CH4 sinks ( ), and Lu et al. (2015) also indicated that grasslands were CH4 sinks. In our study, a marked water gradient across the transects led to the transformation of the soil from anaerobic to aerobic soil, which changed the wetland to either a CH4 source or sink. Therefore, during the transition from the riparian wetlands to the hillslope grasslands, CH4 sources only appeared in the near-stream sites, while sinks appeared at other sites.
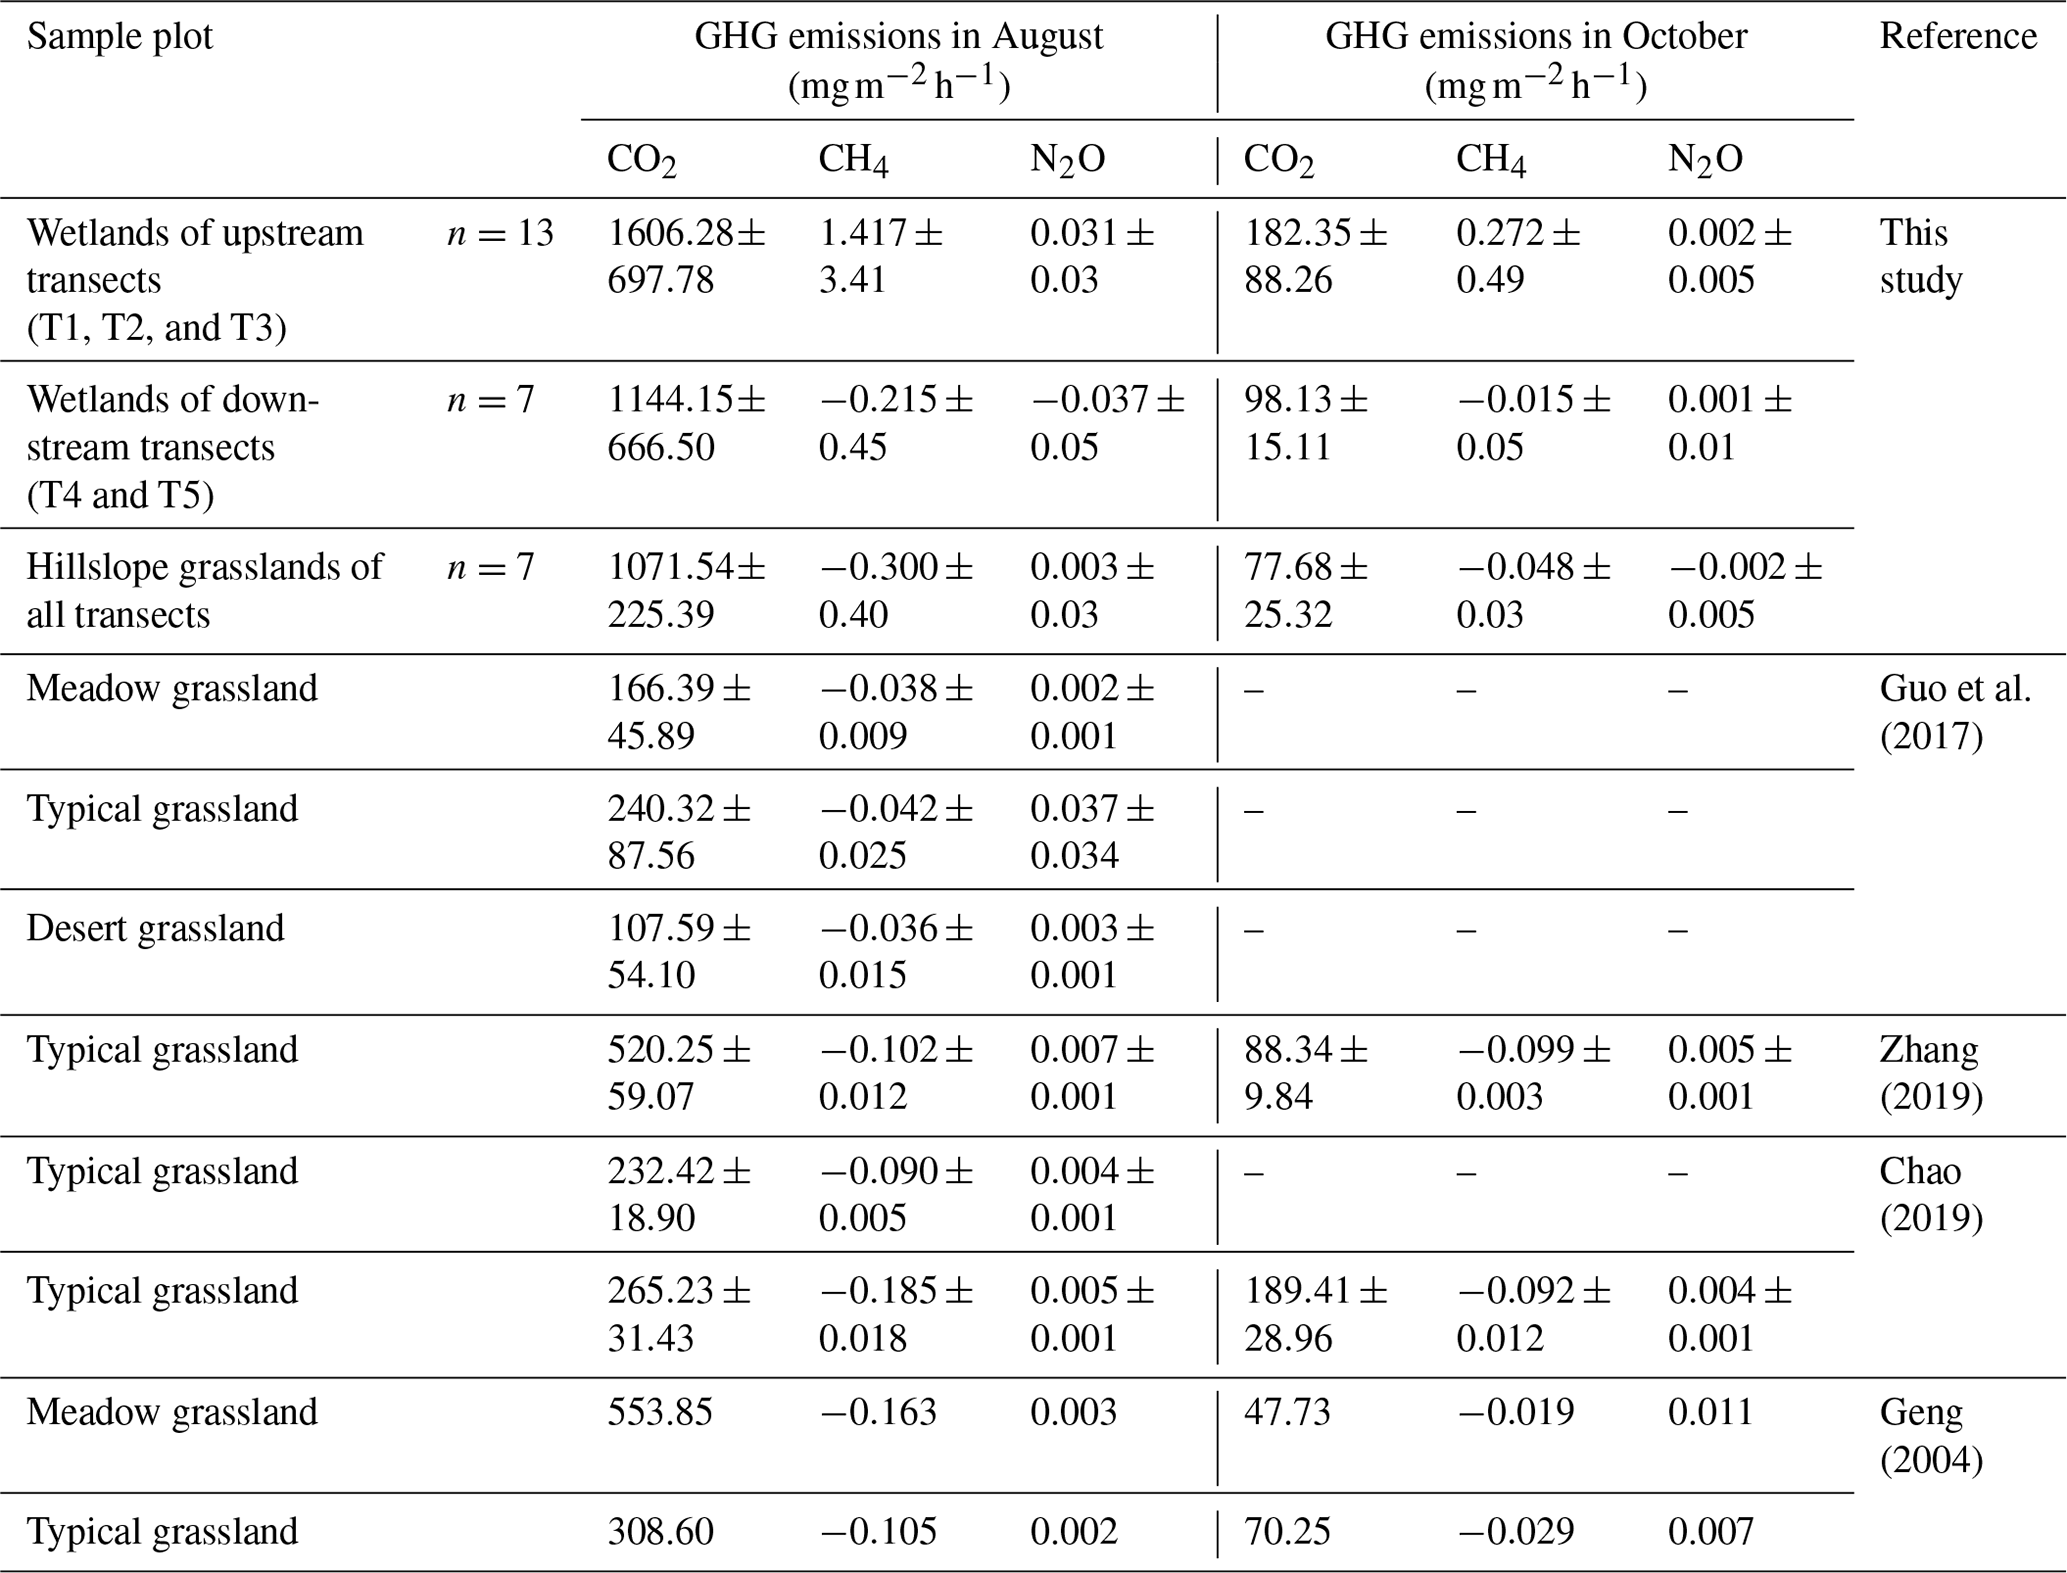
Further, we compared the GHG emissions in the riparian wetlands and the hillslope grasslands around the Xilin River basin with those in various types of grasslands (meadow grassland, typical grassland, and desert grassland) in the Xilingol League in Inner Mongolia (Table 5). CO2 emission in the wet season decreased in the following order: upstream riparian wetlands > downstream riparian wetlands > hillslope grasslands > meadow grassland > typical grassland > desert grassland. Moreover, the upper riparian wetlands acted as sources of CH4 emission, while the downstream transects and grasslands served as CH4 sinks. Similarly, except in the downstream transects, N2O emissions occurred as weak sources in different types of grasslands and upstream riparian wetlands. The GHG emissions showed similar spatial patterns in October. Although these estimates were made only in the growing season in August and the non-growing season in October, our results suggest that the riparian wetlands are the potential hotspots of GHG emission. Thus, it is important to study GHG emission to obtain a comprehensive picture of the role of the riparian wetlands in climate change.
Table 5GHG emission fluxes of riparian wetlands and grasslands.
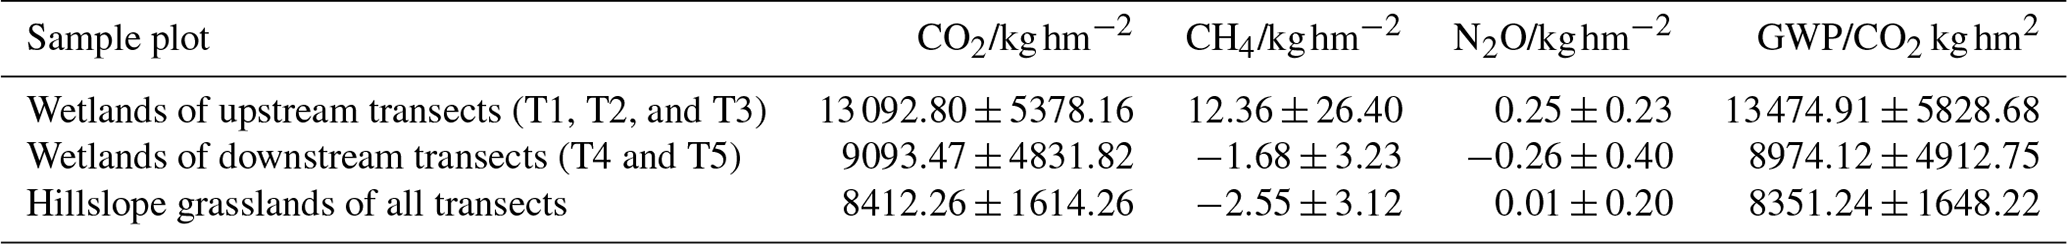
We roughly estimated the annual cumulative emission amounts of CO2, CH4, and N2O from the riparian wetlands and hillslope grasslands around the Xilin River basin and further calculated their global warming potential. As Table 6 indicates, annual cumulative emissions of CO2 and CH4 decreased in the following order: upstream riparian wetlands > downstream riparian wetlands > hillslope grasslands. N2O decreased in the following order: upstream riparian wetlands > hillslope grasslands > downstream riparian wetlands. In this study, we used the static dark-box method to measure CO2 emissions, which does not consider the absorption and fixation of CO2 by plant photosynthesis. Therefore, the total annual cumulative CO2 emissions are high. This result clearly showed the more significant impact of CO2 emission than that of CH4 and N2O emissions on global warming. The GWP depends on the cumulative emissions of the GHGs. The GWPs, shown in Table 6, were in the following order: upstream riparian wetlands (13 474.91 kg hm−2) > downstream riparian wetlands (8974.12 kg hm−2) > hillslope grasslands (8351.24 kg hm−2). Therefore, both the riparian wetlands and the grasslands are the “sources” of GHGs on a 100-year timescale. The source strength of the wetlands is higher than that of the grasslands, further indicating that the riparian wetlands are hotspots of GHG emission.
Table 6Cumulative annual emission flux and global warming potential of GHGs in riparian wetlands and grasslands.
4.3 Effects of riparian wetland degradation on GHG emissions
The hydrology and soil properties showed evident differences between transects because the downstream zone was dry all year due to the presence of the Xilinhot Dam (Fig. 1). The dam caused the degradation of the riparian wetlands, resulting in reduced GHG emission. The average CO2 emission amounted to 1663 in the upstream transects (T1, T2, and T3) at the riparian wetlands, while the downstream transects (T4 and T5) recorded an average emission of 1084 , 35 % lower than that in the upstream transects. The N2O emission from the riparian wetlands was lower in the downstream transects.
Wetland degradation first resulted in the continuous reduction of SMC, which led to the deepening of the wetland's aerobic layer thickness. Besides, SMC may affect ST and thus transport the CH4 emissions from a source to a sink by affecting methanogen activity (Yan et al., 2018). Second, the reduction of SMC impeded physiological activities of aboveground plants and inhabited related enzyme activities in the respiration process. Meanwhile, various enzyme reactions of underground microorganisms under water stress influence and reduced CO2 emissions (Zhang et al., 2017). Finally, after wetland degradation, long-term drought led to an extremely low SMC, which is not conducive to the growth of nitrifying and denitrifying bacteria and causes the transport of N2O emissions from source to sink (Zhu et al., 2013). As Table 1 shows, soil TOC content in the upstream transects (average: 25.1 g kg−1) was higher than that in the downstream transects (average: 8.41 g kg−1). The relatively low SMC and the aerobic environment were conducive to the mineralization and decomposition of the TOC. The degradation of plants in the wetlands led to the gradual reduction of BIO. Ultimately, the plant carbon source input of the degraded wetlands decreased, and the bare land temperature increased due to the reduced plant shelter. This accelerated the decomposition of TOC, leading to its decrease. This result indicates that wetland degradation caused the soil carbon pool's loss and weakened the wetland carbon source–sink function. These results are in agreement with those of Xia et al. (2017).
The degraded wetlands also caused soil desertification and salinization, leading to a decline in the physical protection afforded by organic carbon and a reduction in soil aggregates. Thus, the preservative effect provided by organic carbon declined. The TOC content and SMC in the dry lake bed in transect T5 were relatively high; however, the GHG emission was very low along this transect because soil pH values increased after the degradation of the lake soil, exceeding the optimum range required for microorganism activity. The soil C:N ratio was very high, resulting in severe mineralization and a low microbial decomposition rate, thus affecting the GHG emissions.
The riparian wetlands in the Xilin River basin constitute a dynamic ecosystem. The present spatial and temporal transfers in the studied biogeochemical processes were attributed to the changes in SMC, ST, and soil substrate availability. Our simultaneous analysis of CO2, CH4, and N2O emissions from the riparian wetlands and the hillslope grasslands in the Xilin River basin revealed that the majority of the GHG emissions occurred in the form of CO2. Moreover, our results clearly illustrate a marked seasonality and spatial pattern of GHG emissions along the transects and in the longitudinal direction (i.e., upstream and downstream). SMC and ST were two critical factors controlling the GHG emissions. Moreover, the abundant BIO promoted the CO2, CH4, and N2O emissions.
The riparian wetlands are potential hotspots of GHG emissions in the Inner Mongolian region. However, the degradation of these wetlands has transformed the area from a source to a sink for CH4 and N2O emissions and reduced CO2 emissions, which has severely affected the wetland carbon cycle processes. Our results show that though the riparian wetlands have high CO2 emissions, the wetlands are CO2 sinks due to the photosynthesis of plants. Overall, our study suggests that anthropogenic activities have significantly changed the hydrological characteristics of the studied area and that this can accelerate carbon loss from the riparian wetlands and further influence GHG emissions in the future.
All relevant data are included as graphics and tables in the paper. All raw data will be made available on request.
XinL, XixL, and RY designed the research framework and wrote the manuscript. XXL and RHY supervised the study. XinL, HX, ZQ, ZC, and ZZ carried out the field experiments and laboratory analyses. ZZ drew the GIS mapping in this paper. TL proofread a previous version of the manuscript. HS contributed much to the revised version of our manuscript.
The authors declare that they have no conflict of interest.
Publisher's note: Copernicus Publications remains neutral with regard to jurisdictional claims in published maps and institutional affiliations.
This study was funded by the National Key Research and Development Program of China (grant no. 2016YFC0500508), Major Science and Technology Projects of Inner Mongolia Autonomous Region (grant nos. 2020ZD0009 and ZDZX2018054), National Natural Science Foundation of China (grant no. 51869014), Key Scientific and Technological Project of Inner Mongolia (grant no. 2019GG019), and Open Project Program of the Ministry of Education Key Laboratory of Ecology and Resources Use of the Mongolian Plateau (grant no. KF2020006). We thank Wiley Editing Services (http://wileyeditingservices.com, last access: 24 June 2021) for its linguistic assistance during the preparation of a previous version of this paper.
This research has been supported by the National Key Research and Development Program of China (grant no. 2016YFC0500508), the National Natural Science Foundation of China (grant no. 51869014), the Science and Technology Major Project on Lakes of Inner Mongolia (grant nos. 2020ZD0009 and ZDZX2018054), Key Scientific and Technological Project of Inner Mongolia (grant no. 2019GG019), and Open Project Program of the Ministry of Education Key Laboratory of Ecology and Resources Use of the Mongolian Plateau (grant no. KF2020006).
This paper was edited by Anja Rammig and reviewed by two anonymous referees.
Azam, F., Gill, S., and Farooq, S.: Availability of CO2 as a factor affecting the rate of nitrification in soil, Soil Biol. Biochem., 37, 2141–2144, https://doi.org/10.1016/j.soilbio.2005.02.036, 2005.
Baggs, E. M., Richter, M., Cadisch, G., and Hartwig, U. A.: Denitrification in grass swards is increased under elevated atmospheric CO2, Soil Biol. Biochem., 35, 729–732, https://doi.org/10.1016/S0038-0717(03)00083-X, 2003.
Beger, M., Grantham, H. S., Pressey, R. L., Wilson, K. A., Peterson, E. L., Dorfman, D., Lourival, R., Brumbaugh, D. R., and Possingham, H. P.: Conservation planning for connectivity across marine, freshwater, and terrestrial realms, Biol. Conserv., 143, 565–575, https://doi.org/10.1016/j.biocon.2009.11.006, 2010.
Brady, N. C.: Nature and properties of soils, Prenflee-Hall, Inc., Wichita, USA, https://doi.org/10.2307/3894608, 1999.
Cao, M., Yu, G., Liu, J., and Li, K.: Multi-scale observation and cross-scale mechanistic modelling on terrestrial ecosystem carbon cycle, Sci. China Ser. D, 48, 17–32, 2005.
Chao, R.: Effects of Simulated Climate Change on Greenhouse Gas Fluxes in Typical Steppe Ecosystem, MS thesis, Inner Mongolia University, Hohhot, China, 2019.
Cheng, S. and Huang, J.: Enhanced soil moisture drying in transitional regions under a warming climate, J. Geophys. Res.-Atmos., 121, 2542–2555, https://doi.org/10.1002/2015JD024559, 2016.
Christensen, S., Simkins, S., and Tiedje, J. M.: Temporal Patterns of Soil Denitrification: Their Stability and Causes, Soil Sci. Soc. Am. J., 54, 1614, https://doi.org/10.2136/sssaj1990.03615995005400060017x, 1990.
Ding, W., Cai, Z., and Tsuruta, H.: Cultivation, nitrogen fertilization, and set-aside effects on methane uptake in a drained marsh soil in Northeast China, Glob. Change Biol., 10, 1801–1809, https://doi.org/10.1111/j.1365-2486.2004.00843.x, 2010.
Enwall, K., Philippot, L., and Hallin, S.: Activity and composition of the denitrifying bacterial community respond differently to long-term fertilization, Appl. Environ. Microb., 71, 8335–8343, https://doi.org/10.1128/AEM.71.12.8335-8343.2005, 2005.
Fan, X.: Research on nitrification potential and denitrification potential of soil in several farmland in China, Nanjing Institute of Soil Sciences, PhD thesis, Chinese Academy of Sciences, Nanjing, China, 1995.
Ferrón, S., Ortega, T., Gómez-Parra, A., and Forja, J. M.: Seasonal study of dissolved CH4, CO2 and N2O in a shallow tidal system of the bay of Cádiz (SW Spain), J. Marine Syst., 66, 244–257, https://doi.org/10.1016/j.jmarsys.2006.03.021, 2007.
Geng, H.: Study on Charactors of CO2, CH4, N2O Fluxes and the Relationship between Them and Environmental Factors in the Temperate Typical Grassland Ecosystem, MS thesis, Northwest Agriculture & Forestry University, Yangling, China, 2004.
Gholz, H. L., Wedin, D. A., Smitherman, S. M., Harmon, M. E., and Parton, W. J.: Long-term dynamics of pine and hardwood litter in contrasting environments: toward a global model of decomposition, Glob. Change Biol., 6, 751–765, https://doi.org/10.1046/j.1365-2486.2000.00349.x, 2000.
Gou, Q., Qu, J., Wang, G., Xiao, J., and Pang, Y.: Progress of wetland researches in arid and semi-ariregions in China, Arid Zone Research, 32, 213–220, 2015.
Guo, X., Zhou, D., and Li, Y.: Net Greenhouse Gas Emission and Its Influencing Factors in Inner Mongolia Grassland, Chinese Grassland Society, Guangzhou, China, 2017.
Heilman, J. L., Cobos, D. R., Heinsch, F. A., Campbell, C. S., and McInnes, K. J.: Tower-based conditional sampling for measuring ecosystem-scale carbon dioxide exchange in coastal wetlands, Estuaries, 22, 584–591, https://doi.org/10.2307/1353046, 1999.
Hui, R. N.: Study on the emission of CO2 and its impact factors in riparian wetland, MS thesis, Northeast Forestry University, 23 pp., 2014.
Inubushi, K., Furukawa, Y., Hadi, A., Purnomo, E., and Tsuruta, H.: Seasonal changes of CO2, CH4 and N2O fluxes in relation to land-use change in tropical peatlands located in coastal area of South Kalimantan, Chemosphere, 52, 603–608, https://doi.org/10.1016/s0045-6535(03)00242-x, 2003.
IPCC: Climate Change 2013: The Physical Science Basis. Contribution of Working, Working Group I of the IPCC, 43, 866–871, 2013.
Jacinthe, P. A., Vidon, P., Fisher, K., Liu, X., and Baker, M. E.: Soil Methane and Carbon Dioxide Fluxes from Cropland and Riparian Buffers in Different Hydrogeomorphic Settings, J. Environ. Qual., 44, 1080–1115, https://doi.org/10.2134/jeq2015.01.0014, 2015.
Johnson-Randall, L. A. and Foote, A. L.: Effects of managed impoundments and herbivory on wetland plant production and stand structure, Wetlands, 25, 38–50, https://doi.org/10.1672/0277-5212(2005)025[0038:EOMIAH]2.0.CO;2, 2005.
Koops, J. G., Oenema, O., and Beusichem, M. L.: Denitrification in the top and sub soil of grassland on peat soils, Plant Soil, 184, 1–10, https://doi.org/10.1007/bf00029269, 1996.
Kou, X.: Study on Soil Physicochemical Properties and Bacterial Community Characteristics of River Riparian Wetland in Inner Mongolia Grassland, MS thesis, Inner Mongolia University, Hohhot, China, 2018.
Liu, C.: Effects of Nitrogen Addition on the CO2 Emissions in the Reed (Phragmites australis) Wetland of the Yellow River Delta, China, MS thesis, Liaocheng University, Liaocheng, China, 2019.
Liu, C., Xie, G., and Huang, H.: Shrinking and drying up of Baiyangdian Lake wetland: a natural or human cause?, Chinese Geogr. Sci., 16, 314–319, 2006.
Liu, F., Liu, C., Wang, S., and Zhu, Z.: Correlations among CO2, CH4, and N2O concentrations in soil profiles in central Guizhou Karst area, Chinese Journal of Ecology, 29, 717–723, https://doi.org/10.1016/S1872-5813(11)60001-7, 2010.
Liu, J., Wang, J., Li, Z., Yu, J., Zhang, X., Wang, C., and Wang, Y.: N2O Concentration and Its Emission Characteristics in Sanjiang Plain Wetland, Chinese Journal of Environmental Science, 24, 33–39, 2003.
Lu, Y., Song, C., Wang, Y., and Zhao, Z.: Influence of plants on CO2 and CH4 emission in wetland ecosystem, Acta Botanica Boreali-Occidentalia Sinica, 27, 2306–2313, 2007.
Lu, Z., Du, R., Du, P., Li, Z., Liang, Z., Wang, Y., Qin, S., and Zhong, L.: Effect of mowing on N2O and CH4 fluxes emissions from the meadow-steppe grasslands of Inner Mongolia, Front. Earth Sci., 9, 473–486, https://doi.org/10.1007/s11707-014-0486-z, 2015.
Lv, M., Sheng, L., and Zhang, L.: A review on carbon fluxes for typical wetlands in different climates of China, Wetland Science, 11, 114–120, https://doi.org/10.13248/j.cnki.wetlandsci.2013.01.001, 2013.
Malhl, S. S. and Mcgill, W. B.: Nitrification in three Alberta soils: effects of temperature, moisure and substrates concentration, Soil Biol. Biochem., 14, 393–399, https://doi.org/10.1016/0038-0717(82)90011-6, 1982.
Mclain, J. E. T. and Martens, D. A.: Moisture controls on trace gas fluxes in semiarid riparian soils, Soil Sci. Soc. Am. J., 70, 367, https://doi.org/10.2136/sssaj2005.0105, 2006.
Meng, W., Wu, D., and Wang, Z.: Control factors and critical conditions between carbon sinking and sourcing of wetland ecosystem, Ecology and Environmental Sciences, 20, 1359–1366, https://doi.org/10.1016/S1671-2927(11)60313-1, 2011.
Mitsch, W. J. and Gosselink, J. G.: Wetlands (Fourth Edition), John Wiley & Sons Inc., Hoboken, NJ, 2007.
Mitsch, W. J., Gosselink, J. G., Zhang, L., and Anderson, C. J.: Wetland ecosystems, John Wiley & Sons, New Jersey, USA, 2009.
Moldrup, P., Olesen, T., Schjønning, P., Yamaguchi, T., and Rolston, D. E.: Predicting the gas diffusion coefficient in undisturbed soil from soil water characteristics, Soil Sci. Soc. Am. J., 64, 1588–1594, https://doi.org/10.2136/sssaj2000.64194x, 2000.
Morley, N. and Baggs, E. M.: Carbon and oxygen controls on N2O and N2 production during nitrate reduction, Soil Biol. Biochem., 42, 1864–1871, https://doi.org/10.1016/j.soilbio.2010.07.008, 2010.
Naiman, R. J. and Decamps, H.: The ecology of interfaces: Riparian zones, Annu. Rev. Ecol. Syst., 28, 621–658, https://doi.org/10.1146/annurev.ecolsys.28.1.621, 1997.
National Agricultural Technology Extension Service Center (NATESC): Technical specification for soil analysis, China Agriculture Press, Beijing, China, 256 pp., ISBN 978-71-0910-925-9, 2006.
Niu, C., Wang, S., Guo, Y., Liu, W., and Zhang, J.: Studies on variation characteristics of soil nitrogen forms, nitrous oxide emission and nitrogen storage of the Phragmites australis-dominated land/inland water ecotones in Baiyangdian wetland, Journal of Agricultural University of Hebei, 40, 72–79, 2017.
Pierzynski, G. M., Vance, G. F., and Sims, T. J.: Soils and Environmental Quality, 3rd Edn., CRC Press Inc., Boca Raton, 592 pp., https://doi.org/10.1201/b12786, 2005.
Poblador, S., Lupon, A., Sabaté, S., and Sabater, F.: Soil water content drives spatiotemporal patterns of CO2 and N2O emissions from a Mediterranean riparian forest soil, Biogeosciences, 14, 4195–4208, https://doi.org/10.5194/bg-14-4195-2017, 2017.
Qin, S., Tang, J., Pu, J., Xu, Y., Dong, P., Jiao, L., and Guo, J.: Fluxes and influencing factors of CO2 and CH4 in Hangzhou Xixi Wetland, China, Earth and Environment, 44, 513–519, 2016.
Rückauf, U., Augustin, J., Russow, R., and Merbach, W.: Nitrate removal from drained and reflooded fen soils affected by soil N transformation processes and plant uptake, Soil Biol. Biochem., 36, 77–90, https://doi.org/10.1016/j.soilbio.2003.08.021, 2004.
Sjögersten, S., Wal, R. V. D., and Woodin, S. J.: Small-scale hydrological variation determines landscape CO2 fluxes in the high Arctic, Biogeochemistry, 80, 205–216, https://doi.org/10.1007/s10533-006-9018-6, 2006.
Sun, Y., Wu, H., and Wang, Y.: The influence factors on N2O emissions from nirification and denitrification reaction, Ecology and Environmental Sciences, 20, 384–388, https://doi.org/10.1631/jzus.B1000275, 2011.
Tong, C., Wu, J., Yong, S., Yang, J., and Yong, W.: A landscape-scale assessment of steppe degradation in the Xilin River Basin, Inner Mongolia, China, J. Arid Environ., 59, 133–149, https://doi.org/10.1016/j.jaridenv.2004.01.004, 2004.
Waddington, J. M. and Roulet, N. T.: Carbon balance of a boreal patterned peatland, Glob. Change Biol., 6, 87–97, https://doi.org/10.1046/j.1365-2486.2000.00283.x, 2000.
Whiting, G. J. and Chanton, J. P.: Greenhouse earbon balance of wetlands: methane emission versus carbon sequestration, Tellus B, 53, 521–528, https://doi.org/10.3402/tellusb.v53i5.16628, 2001.
WMO: WMO Statement on the State of the Global Climate in 2017, World Meteorological Organization, 2018.
Xi, X., Zhu, Z., and Hao, X.: Spatial variability of soil organic carbon in Xilin River Basin, Research of Soil and Water Conservation, 24, 97–104, 2017.
Xia, P., Yu, L., Kou, Y., Deng, H., and Liu, J.: Distribution characteristics of soil organic carbon and its relationship with enzyme activity in the Caohai wetland of the Guizhou Plateau, Acta Scientiae Circumstantial, 37, 1479–1485, https://doi.org/10.13671/j.hjkxxb.2016.0129, 2017.
Xu, H., Cai, Z., and Yagi, K.: Methane Production Potentials of Rice Paddy Soils and Its Affecting Factors, Acta Pedologica Sinica, 45, 98–104, https://doi.org/10.1163/156939308783122788, 2008.
Yan, L., Zhang, X., Wang, J., Li, Y., Wu, H., and Kang, X.: Drainage effects on carbon flux and carbon storage in swamps, marshes, and peatlands, Chin. J. Appl. Environ. Biol., 24, 1023–1031, https://doi.org/10.19675/j.cnki.1006-687x.2017.11031, 2018.
Yu, P., Zhang, J., and Lin, C.: Progress of influence factors on N2O emission in farmland soil, Environment and sustainable development, 5, 20–22, 2006.
Zhang, D.: Effects of Different Grazing Intensities on Greenhouse Gases Flux in Typical Steppe of Inner Mongolia, MS thesis, Inner Mongolia University, Hohhot, China, 2019.
Zhang, Y., Hao, Y., Cui, L., Li, W., Zhang, X., Zhang, M., Li, L., Yang, S., and Kang, X.: Effects of extreme drought on CO2 fluxes of Zoige alpine peatland, Journal of University of Chinese Academy of Sciences, 34, 462–470, 2017.
Zhang, Z., Hua, L., Yin, X., Hua, L., and Gao, J.: Nitrous oxide emission from agricultural soil land some influence factors, Journal of Capital Normal University: Natural Science Edition, 26, 114–120, 2005.
Zhu, X., Song, C., Guo, Y., Shi, F., and Wang, L.: N2O emissions and its controlling factors from the peatlands in the Sanjiang Plain, China Environmental Sciences, 33, 2228–2234, 2013.
Zona, D., Oechel, W. C., Kochendorfer, J., Paw, U. K. T., Salyuk, A. N., Olivas, P. C., Oberbauer, S. F., and Lipson, D. A.: Methane fluxes during the initiation of a large-scale water table manipulation experiment in the Alaskan Arctic tundra, Global Biogeochem. Cy., 23, GB2013, https://doi.org/10.1029/2009gb003487, 2009.