the Creative Commons Attribution 4.0 License.
the Creative Commons Attribution 4.0 License.
 | 20 Sep 2021
Active and passive fluxes of carbon, nitrogen, and phosphorus in the northern South China Sea
Ching-Han Tung
Zong-Ying Lin
Yuh-ling Lee Chen
Shao-Hung Peng
Yen-Huei Lin
Li-Shan Tsai
This paper presents the measured active and passive fluxes of carbon (C), nitrogen (N), and phosphorus (P) and their response to seasonal and event-driven oceanographic changes in the northern South China Sea (NSCS). The total vertical flux of carbon (TFC) is defined as the sum of active and passive fluxes of biogenic carbon in the surface layer, which may be considered as the central part of marine carbon cycle. These active and passive fluxes of N and P were also considered to understand stoichiometric flux patterns and the roles of nutrients involved in the TFC. The magnitudes of total C, N, and P fluxes were, respectively, estimated to be 71.9–347 (mean ± SD, 163 ± 70) , 13.0–30.5 (21.2.± 4.9) , and 1.02–2.97 (1.94 ± 0.44) , which were higher than most previously reported vertical fluxes in open oceans, likely because a quarter of the fluxes was contributed from active fluxes that were unaccounted for in vertical fluxes previously. Moreover, the passive fluxes dominated the total vertical fluxes and were estimated to be 65.3–255 (125 ± 64.9) (77 ± 52 % of total C flux), 11.9–23.2 (17.6 ± 4.2) (83 ± 28 % of total N flux), and 0.89–1.98 (1.44 ± 0.33) (74 ± 24 % of total P flux). Vertical fluxes of dissolved organic C, N, and P were small (< 5 %) relative to passive fluxes. The contrasting patterns of active and passive fluxes found between summer and winter could mainly be attributed to surface warming and stratification in summer and cooling and wind-induced turbulence for pumping nutrients into the euphotic zone in winter. In addition to seasonal variations, the impact of anticyclonic eddies and internal-wave events on enhancing active and passive fluxes was apparent in the NSCS. Both active and passive fluxes were likely driven by nutrient availability within the euphotic zone, which was ultimately controlled by the changes in internal and external forcings. The nutrient availability also determined the inventory of chlorophyll a and new production, thereby allowing the estimates of active and passive fluxes for unmeasured events. To a first approximation, the South China Sea (SCS) may effectively transfer 0.208 ± 0.089 Gt C yr−1 into the ocean's interior, accounting for approximately 1.89 ± 0.81 % of the global C flux. The internal forcing and climatic conditions are likely critical factors in determining the seasonal and event-driven variability of total vertical fluxes in the NSCS.
- Article
(5771 KB) - Full-text XML
-
Supplement
(439 KB) - BibTeX
- EndNote


It is widely recognized that the global ocean may have absorbed anthropogenic CO2 as large as 50 % of total release to the atmosphere since the industrial revolution began in the middle of 18th century (Sabine et al., 2004). The uptake of atmospheric CO2 by oceans was carried out mainly through the physical pump and biological pump (BP), and both processes played key roles in removing carbon from the surface to deep layers of oceans (Ducklow et al., 2001; Boyd et al., 2019). The physical pump was regarded as the dissolution of atmospheric CO2 into the ocean and then transported into deep oceans through global circulation (Feely et al., 2001; Toggweiler et al., 2003). The previously reported BP consisted of active and passive fluxes of organic carbon synthesized in the euphotic zone and transported out of the surface through zooplankton migration mediation and gravitational particle settling, respectively, after escaping from respiration and grazing processes in the ocean surface (Falkowski, 1998; Ducklow et al., 2001; Sarmiento and Gruber, 2006; Passow and Carlson, 2012; Steinberg et al., 2000; Steinberg and Landry, 2017; Archibald et al., 2019). The vertical diffusion flux of dissolved organic carbon (DOC) produced in the surface has also been thought of as a part of passive flux (Ducklow et al., 2001; Steinberg and Landry, 2017). The BP was commonly regarded as an efficient process in downward transfer and storage of carbon dioxide and a critical one in determining the oceanic carbon cycle and budget (Ducklow et al., 2001; Sarmiento and Gruber, 2006; DeVries et al., 2012; Sander et al., 2014). Thus, Turner (2015) pointed out the BP as one of the most important carbon-involved processes in the world. Without the BP that exports ∼ 5 Gt C yr−1 to the mesopelagic zone, the atmospheric CO2 level would be much higher than it is today (Parekh et al., 2006; Cavan et al., 2019). Additionally, there was a wide consensus that the marginal sea plays an important role in modulating the global carbon cycling and fates (Walsh, 1991; Liu et al., 2002, 2010; Thomas et al., 2004; Chen and Borges, 2009; Dai et al., 2013). Thus, the investigation of active and passive fluxes in the large marginal sea appears to be important in increasing our understanding of the global context of oceanic carbon cycling and budgets.
Although the passive transport has long been assumed as the most important process in the transport of carbon from the surface to deep oceans, the active transport has been considered as an important part of total vertical flux of carbon (TFC) showing a substantial proportion (10 %–30 %) of sinking flux in a variety of oceanographic regimes after 1990s (Longhurst et al., 1989; Dam et al., 1995; Steinberg et al., 2000; Bianchi et al., 2013). This active transport is important in sustaining the metabolic requirement of the mesopelagic community through providing for the partial energy demand of the mesopelagic ecosystem (Robinson et al., 2010; Steinberg et al., 2008; Burd et al., 2010). Previous studies also showed an imbalance between the heterotrophic activity in mesopelagic waters and the estimates of carbon supplied by sinking particulate organic carbon (POC), suggesting the importance of diel vertical migration (DVM) of zooplankton and micronekton in supplying additional demands for microbial growth and respiration in the mesopelagic zone (Reinthaler et al., 2006; Boyd and Trull, 2007; Steinberg et al., 2008; Baltar et al., 2009; Boyd et al., 2019). Ducklow et al. (2001) and Passow and Carlson (2012) have drawn a whole picture of BP illustrating and deciphering the concept and processes of active, passive, and DOC fluxes in drawing down atmospheric CO2 and moving various carbon forms from the euphotic zone into the aphotic zone. Although less well documented, the contribution of DOC vertical flux to TFC may not be totally neglected particularly in oligotrophic or desert oceans. Previous studies have shown that DOC fluxes may contribute approximately 20 %–50 % of total Corg fluxes derived from new production in marginal seas and open oceans (Copin-Montégut and Avril, 1993; Hansell and Carlson, 1998, 2001; Avril, 2002; Hung et al., 2007; Steinberg and Landry, 2017).
Regarding the determination of passive carbon fluxes, sediment traps have been widely used so far to measure the vertical fluxes of POC in various regimes of the ocean (Honjo et al., 2008; Guidi et al., 2015), although they were subject to debates on precision issues (Gardner, 2000; Buesseler et al., 2007; Burd et al., 2010). Different approaches may include carbon and nutrient budget derivation in the euphotic zone, hydrodynamic-ecosystem model, and 234Th-POC simulation and modeling (Berelson, 2001; Ducklow et al., 2001; Buesseler et al., 2009), but they also have certain limitations and will not be discussed here. In terms of active transport, using net captures during daytime and nighttime for sampling DVM zooplankton and micronekton remained the most popular method in estimating active fluxes of carbon and related constituents (Longhurst et al., 1989; Dam et al., 1995; Steinberg et al., 2000, 2008; Hannides et al., 2009; Takahashi et al., 2009; Yebra et al., 2018). DVM represented the daily ascent of zooplankton and micronekton into the upper layer at dusk and decent into the mesopelagic zone approximately within 600 m at dawn (Dam et al., 1995; Bianchi et al., 2013). For the reliable estimates of DOC vertical fluxes following the surface accumulation and physical transport may not be a simple work. Hansell and Carlson (2001) and Baetge et al. (2020) have employed the seasonal difference of DOC inventory within surface layers to derive the DOC fluxes through the specified depth (e.g., 100 m). Copin-Montégut and Avril (1993) may be the first study employing the Fickian-like diffusion law to estimate the DOC vertical flux across a stratified prevailing system.
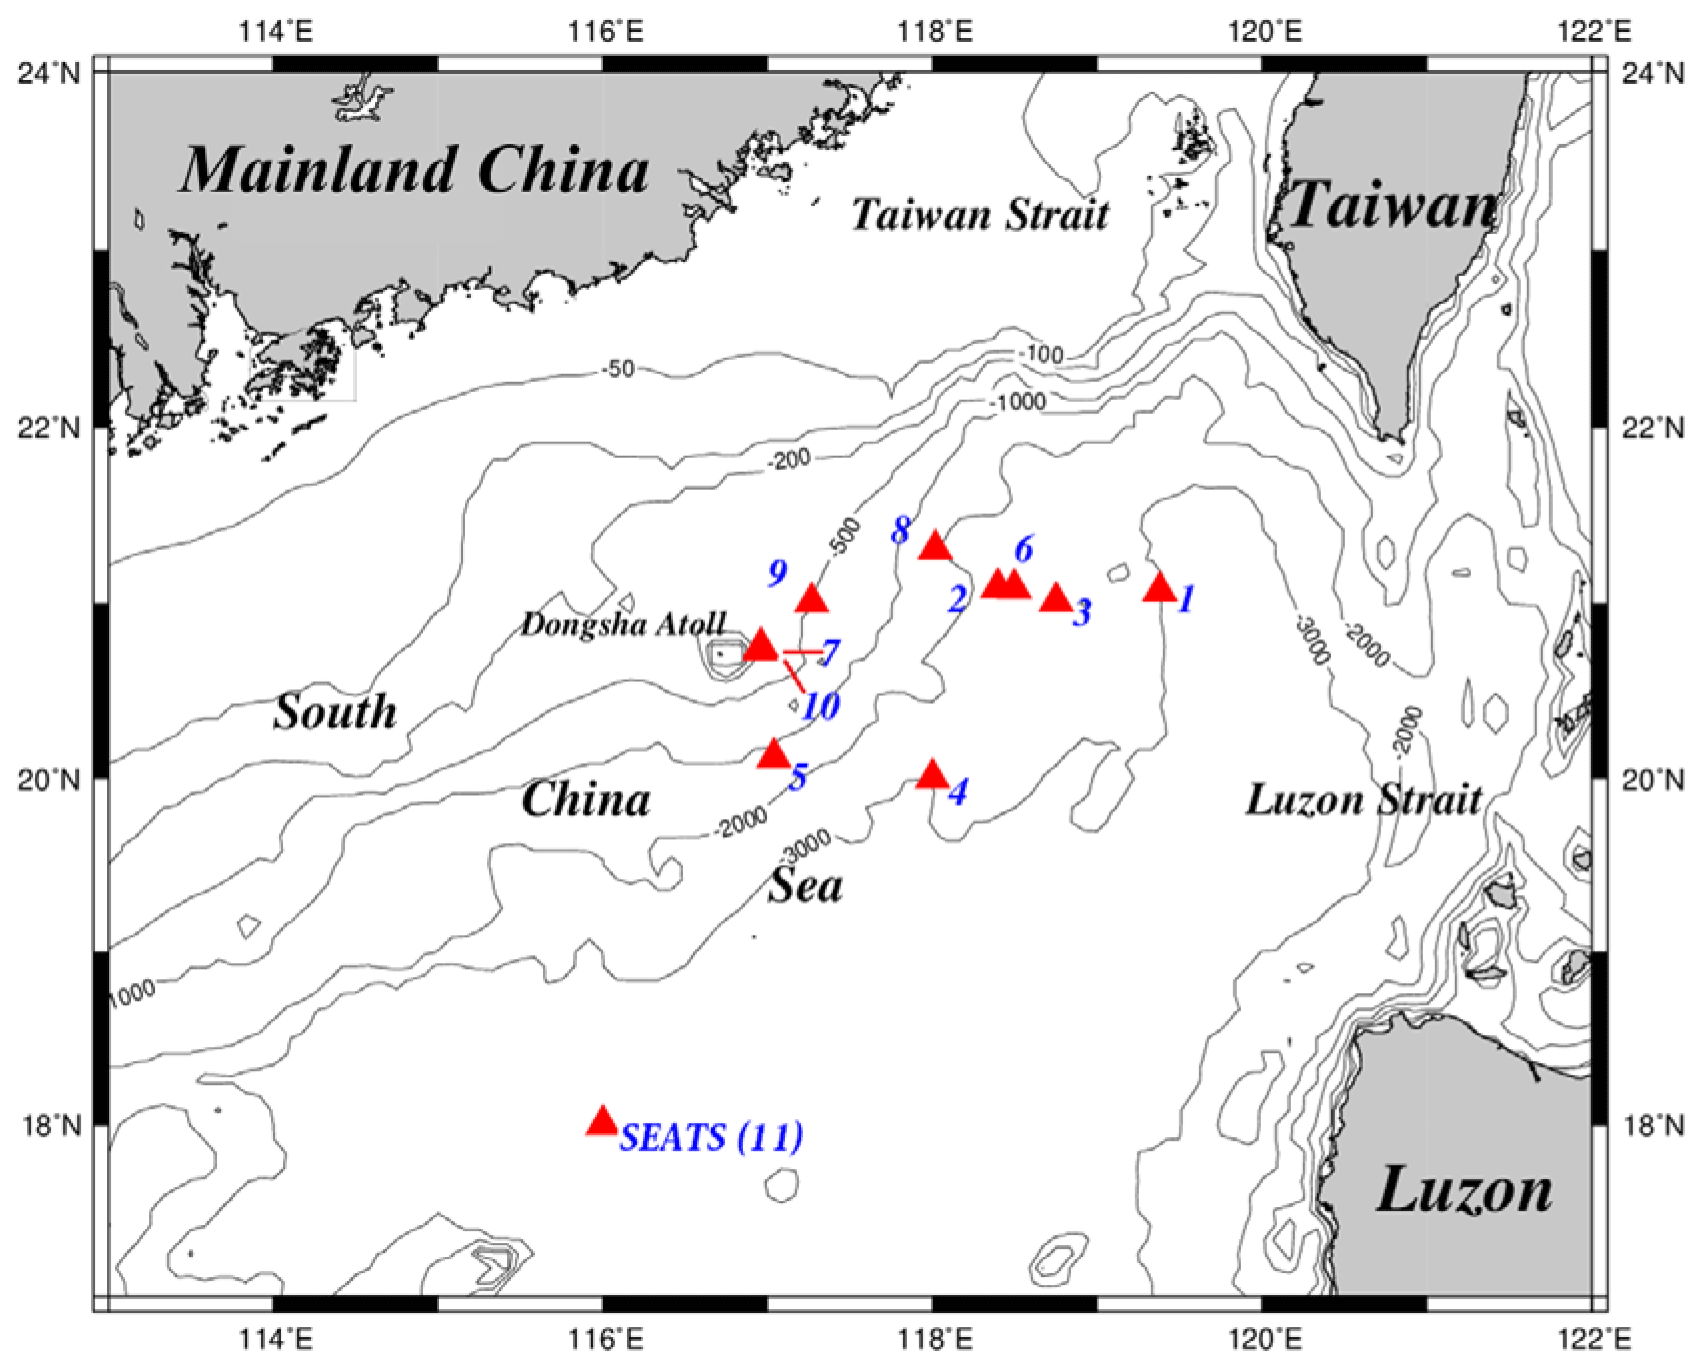
Figure 1Maps of the study area and sampling stations. The sampling stations were located mainly in deep-water regions, except for the shallow stations (stations 7 and 10) close to the Dongsha Atoll. All stations were renamed numerically to avoid confusion with the names originally used in different cruises. For seasonal and spatial comparison, the sampling stations were grouped into two domains, one located in the upper NSCS and one located in the central basin represented by the SEATS (11) station. SEATS denotes the Southeast Asian Time-series Study station in NSCS.
The South China Sea (SCS) is the largest marginal sea in the world and covers a variety of oceanographic domains including large estuaries, shelf, slope, and a deep central basin (see Fig. 1), ranging from < 100 to ∼ 5000 m in depth (Shaw and Chao, 1994). The northern SCS (NSCS) experiences a strong monsoon influence, and the surface circulation is generally clockwise during winter due to prevailing of northeasterly monsoon and anti-clockwise during summer resulting from prevailing southwesterly monsoon (Wyrtki, 1961, Shaw and Chao, 1994; Hu et al., 2000). As a result, the physical and biogeochemical conditions of NSCS were profoundly influenced by seasonal changes of climatic forcing and terrestrial inputs (Shaw and Chao, 1994; Dai et al., 2013). The NSCS is also a hot spot of internal waves generated in the Luzon Strait and transport westward from the Luzon Strait to the Dongsha Atoll continental shelf, causing significant impacts on the Dongsha Atoll-associated environments following internal-wave dissipation and shoaling events (Wang et al., 2007, Li and Farmer, 2011; Alford et al., 2015). Therefore, the vertical transfers of C, N, and P may vary temporally and spatially under the impacts of atmospheric and oceanic forcings in the NSCS. Although many reports have shown a balance or a tiny physical pump of carbon dioxide in most oligotrophic regions (Zhai et al., 2005, 2013; Dai et al., 2013), very few studies have measured C, N, and P transfers from the surface to the ocean's interior. Apparently, the study of active and passive fluxes is essential and urgent to realize the current conditions and processes of carbon fluxes in the NSCS. Thus, our ultimate goals focus primarily on understanding the current strengths of active and passive fluxes and their controlling mechanisms in the oligotrophic NSCS.
Table 1Sampling locations and time periods during various cruises in the northern South China Sea. Sampling stations were renamed numerically, and sampling periods were also noted with the associated seasons/events.

a In (inside eddy). b Out (outside eddy). a,b Vertical POC fluxes were derived from integrated new productions due to failure of trap recovery. c Vertical POC fluxes were derived from integrated new productions without trap deployment. d Active POC fluxes were derived from DIN and chlorophyll a inventories in the euphotic zone. e Station 7A (close to 8A) only had an integrated new-production value to derive vertical POC flux, and its POC flux was averaged to the flux of Station 8A to represent the vertical POC flux within the eddy (Station 3). f Passive flux data only; active flux was derived from DIN and chlorophyll a inventories. g Active flux data only; passive fluxes were derived from chlorophyll a inventories.
2.1 Study area and sampling locations
Figure 1 depicts the study area and sampling stations which are located on various domains in the NSCS. Except for stations located on the Dongsha Atoll-associated shelf and upper slope under the influence of internal-wave events, most sampling stations were located on lower slope and basin regions. To avoid confusion for different names on the same location in different expeditions, the sampling stations were renamed numerically (stations 1–11) to clearly distinguish them among locations and expeditions (Table 1). Station 11 is the Southeast Asian Time-series Study (SEATS) station in the NSCS.
2.2 Sampling procedures and analytical methods for seawater samples
Seawater samplings and electronic data retrieval were carried out on board R/V Ocean Researcher I (ORI-1039, ORI-1059, ORI-1074, and ORI-1082) and R/V Ocean Researcher III (ORIII-1073, ORIII-1184, and ORIII-1214) (Table 1). Seawater samples were collected using a cleaned Niskin bottle (20 L) mounted on a CTD/rosette from six light penetration depths (100 %, 46 %, 38 %, 13 %, 5 % and 0.6 %) in the euphotic zone and from various depths in the aphotic zone in each station to determine hydrological and biogeochemical parameters. Seawater temperature (T), salinity (S), depth, and fluorescence were recorded with CTD and attached probes. Surface and subsurface irradiances were measured with a PAR sensor (OSP2001, Biospherical Instrument, San Diego, USA). The scientific echo sounder (Simrad EK60) including 38 and 120 kHz was used for recording the signals of diel migrators located at different depths throughout expeditions. The euphotic zone was recorded as the depth at which light intensity was 0.6 % of surface irradiation (Chen, 2005). The mixed layer depth was estimated from a difference of potential density (< 0.125 kg m−3) between that of the ocean surface and the bottom of the mixed layer (Monterey and Levitus, 1997). The stratification index (SI) was defined as the averaged density difference (kg m−4) between the surface and a depth of 150 m (Chen et al., 2014).
The concentration of dissolved oxygen (DO) in retrieved seawater was determined immediately following a method of direct spectrophotometry of total iodine (Pai et al., 1993). The content of chlorophyll a (Chl a) was determined with a fluorometer (Turner Designs, model AU-10) according to the method of Welschmeyer (1994) after the filtered particulates were extracted with 90 % acetone. Depending on the concentration of particles, various volumes (1500–2500 mL) of duplicated seawater samples were filtered through pre-combusted (at 450 ∘C, 4 h) GF/F filters (diameter: 25 mm) to measure dissolved nutrients and dissolved organic carbon (DOC) in filtrate and particulate organic carbon (POC) in filtered particulates. Dissolved inorganic nitrogen ( + , hereafter DIN) and phosphate (, hereafter DIP) and silicate (H4SiO4, hereafter DSi) were determined colorimetrically (Grasshoff et al., 1983) with a UV–Vis spectrophotometer (Hitachi U-3310) equipped with a module of flow injection analysis for subsurface and deep water samples. DIN and DIP in oligotrophic surface samples were determined by the chemiluminescent method (Garside, 1982; Hung et al., 2007) and modified MAGIC method (Thomson-Bulldis and Karl, 1998; Hung et al., 2007), respectively. The averaged concentrations and inventories of Chl a, DIN and DIP in the euphotic zone were estimated from the mean value and trapezoidal integration of all determinants through the euphotic zone, respectively. DOC was measured using a method of high-temperature catalytic oxidation via the Shimadzu TOC-5000A analyzer following the established procedures (Hung et al., 2007, 2008). The quality of DOC data was regularly monitored using reference materials (41–44 µM C) provided by Dennis A. Hansell from the University of Miami. DON was determined from the difference between dissolved inorganic nitrogen (DIN = + ) and total dissolved nitrogen (TDN) that was measured with the chemiluminescence method using an instrument of Antek models 771/720 (Hung et al., 2007, 2008). Dissolved organic phosphorus (DOP) was determined from the difference between DIP and total dissolved phosphorus (TDP) that was measured with UV-persulfate oxidation and colorimetric method (Ridal and Moore, 1990). The precision of TDN and TDP analyses was better than ± 7 % and ± 5 %, respectively (Hung et al., 2007, 2008).
POC and particulate nitrogen (PN) in filtered particulates were determined with an elemental analyzer (Thermo Scientific Flash 2000) after removal of carbonate from particulates with 2 M HCl (Hung et al., 2007, 2008). The analytical precisions of POC and PN were generally < ± 0.3 µM C(N) (± 1σ), as evaluated from eight replica samples collected from the same depth. Each biogeochemical parameter was measured in triplicate ensuring the data quality of analyses in the laboratory (Hung et al., 2007, 2008).
2.3 Estimates of active fluxes of carbon, nitrogen and phosphorus
The active flux was determined by collecting diel migrators with a zooplankton net (NORPAC net, 200 µm mesh, d: 45 cm, L: 180 cm) coupled with a flow meter (Hydro-Bios, Germany) during three daytime (10:00–13:00) and nighttime (22:00–01:00) plankton tows. The difference of integrated biomass profiles in the upper 200 m layer between night and day was regarded as an estimate of the zooplankton and micronekton migrant biomass. The zooplankton net was towed obliquely under 1.5–2.5 knots through the upper layer of 200 m in each sampling time. After collection, the collecting time and water volume were recorded and the zooplankton and micronekton samples were cleaned with in situ seawater followed by Milli-Q water and stored in sealed plastic bags. The samples were frozen immediately with liquid nitrogen and stored at −20 ∘C until further treatment and analyses in the land-based laboratory. In the laboratory, the migrators were size fractionated according to the previously reported methods (Hannides et al., 2009; Al-Mutairi and Landry, 2001) by passing through 0.2, 0.5, 1.0, 2.0, and 5.0 mm sieves. Each size sample was equally split into two parts for experimental purposes. One part was used for immediate analyses of Chl a and phaeopigment contents, and the remainder was used for species identification (data not reported here) and numeration. The zooplankton and micronekton abundance (A, inds m−3) of each class was estimated from total individuals (inds) divided by the flowed water volume (V). The other part was filtered through pre-weighed Nuclepore PC filter (5 µm, 47 mm) to determine the dry-weight (DW) biomass (mg m−3) of various planktonic sizes after drying filtered samples in an oven at 60 ∘C for 3 d. The total migrant biomass was defined by the sum of various sized migrant biomasses derived from the difference of sized zooplankton–micronekton biomass between nighttime and daytime tows. The body contents of organic C, N, and P were determined by measuring a specific amount of homogenized dried biomass with same analytical procedures described in the next section for settling materials.
The total active flux reported here includes gut, excretory, respiratory, and mortality fluxes by zooplankton and micronekton (Hannides et al., 2009; Hernández-León et al., 2019). The gut carbon flux was converted from gut Chl a flux (carbon/Chl a = 30, Vidal, 1980), and the gut Chl a flux was estimated from gut contents (gut contents = Chl a + 1.5 × [phaeopigment]) and gut clearance rate constants (k, h−1) according to the methods of Dagg and Wyman (1983) and Dam and Peterson (1988). The Chl a and phaeopigment contents in zooplankton and micronekton were determined by following the acidification method of Strickland and Parsons (1972). The excretory fluxes of C, N, and P were defined as the fluxes of DOC, (DIN + DON), and (DIP + DOP), where DOC, DIN, DON, DIP, and DOP fluxes were estimated from migrant DW biomass using empirical allometric relationships reported by Al-Mutairi and Landry (2001). The excretory rates of ammonia (EDIN, ) and phosphate (EDIP, ) were estimated according to Eqs. (1) and (2):
The magnitude of organic excretion by migrators was estimated by assuming organic products represent a constant fraction of the total amount of waste by-products released by migrators at depths (Hannides et al., 2009). The fraction was 0.24 for organic C (Steinberg et al., 2000), 0.53 for organic N (Le Borgne and Roder, 1997), and 0.47 for organic P (Pomeroy et al., 1963). Thus, the excretory fluxes of dissolved organic C, N, and P () can be estimated by the following equations (Eqs. 3–5):
where RDIC is respiratory CO2 rate () converted from the oxygen consumption rate (RO) ( (Al-Mutairi and Landry, 2001)) assuming a respiratory quotient (RQ) of 0.80 (Hayward, 1980).
The respiratory flux was determined using the following equation (Eq. 6) developed by Takahashi et al. (2009):
where Fr is the respiratory flux (), Ld is the length of daytime (12 h), Ni is the abundance of migrators (), and RCi is the carbon respiration rate (), which is calculated from the empirical relationship (RCi = RO ⋅ RQ ; Takahashi et al., 2009). The mortality flux was estimated from the reported relationship Fm = Bi ⋅ Mdeep, where Bi is migrant flux through 200 m (), and Mdeep is the mortality rate of migrators (assuming Mdeep = 0.01) (Takahashi et al., 2009).
2.4 Experiments on passive fluxes of organic carbon, nitrogen, and phosphorus
As an exclusive part of passive flux, the vertical fluxes of settling POC, PN, and particulate organic phosphorus (POP) were determined by using floating sediment traps for particle collection followed by elemental analyses. The traps were deployed generally for three depths (50, 100, 150 m) in a planned station for approximately 1–3 d, depending on the oceanic condition and ship time availability, to collect sinking particles from upper layers. The sediment-trap array modified from Knauer et al. (1979) consists of two trap sets made from eight plexiglass tubes (aspect ratio of 9.53) attached to a polypropylene cross frame, similar to those described by Wei et al. (1994), for the depth of 50 and 100 m, and a commercial sediment trap (PARFLUX Mark8-13, McLane, USA) for a depth of 150 m. All sample tubes were filled with saline seawater to minimize the loss of collected sinking particles. However, no poisons were added to retard bacterial growth and decomposition. In the particular area of the Dongsha Atoll-associated shelf, the PARFLUX trap was attached to the thermistic-fluorescence string moored at the planned location. After collection, the particulate matter was removed from the PC filter (polycarbonate, 90 mm, pore size 0.4 µm) and washed with Milli-Q water to remove sea salts. After removing swimmers, the particulate matter was freeze-dried to determine settling fluxes of sinking particles and POC, PN, and POP. In an earlier experiment, vertical fluxes of POC at a depth of 120 m were measured through summer and winter by a deep-moored time-series trap (TECNICAP P.P.S. 3/3) deployed near the SEATS station (18∘19.661′ N, 115∘44.103′ E) following the deployed method described in Hung et al. (1999) and Chung and Hung (2000).
POC and PN were analyzed by placing collected particulate matter in a silver cup, and a few drops of 2 M HCl were added to remove carbonate. The acidified sample was dried in an oven and then determined with an elemental analyzer (Thermo Scientific Flash 2000). Another fraction of particulate matter without treating acid was used for total carbon (TC) analyses. Particulate inorganic carbon (PIC) was the difference between TC and POC. Organic matter content was estimated from POC content by a factor of 2 (%POM = %POC ⋅ 2; Gordon, 1970; Monaco et al., 1990). Particulate organic phosphorus (POP) was determined from the difference between total particulate phosphorus (PP) and particulate inorganic phosphorus (PIP). PIP was determined by the extraction of particulate matter with 1 M HCl ( = 50) for 24 h, and the extracted solution was determined by the DIP method described above (Aspila et al., 1976). The concentration of PP was determined by combusting particulate matter at 550 ∘C for 6 h followed by extraction and measurement as the same procedures for PIP (Aspila et al., 1976). Analytical uncertainty was < ± 6 % (n = 6) evaluated from repeated analyses for a coastal sediment. Vertical fluxes of particulate matter, POC, PN, and POP were determined by dividing the collected mass and elements at a specific depth with the trapping area and time period of deployed trap.
Despite playing a minor role in passive fluxes, the downward fluxes of DOC, DON, and DOP through a depth of 100 m were estimated from Fick's law of diffusion (Eq. 7):
where F(100) is the flux of DOC (N, P) through a depth of 100 m, Kz is the vertical turbulent coefficient, and is the gradient of measured parameter concentrations across the boundary. The concentration gradient () of DOC (N, P) was calculated from the difference of mean concentrations () divided by the mean depth interval () between two 100 m layers that were above and below the considered boundary (Hung et al., 2007). The Kz was derived from the dissipation rate (ε), the Richardson number (Rf), and the square of the Brunt–Väisälä frequency () at the pycnocline. Therefore, the Kz varies with the inverse of N2(p), as ε and Rf are taken as constant values of 10−8 m2 s−3 and 0.2, respectively (Copin-Montégut and Avril, 1993; Doval et al., 2001).
2.5 Measurements of primary productivity and new production
Primary productivity (PP) and nitrate-uptake new production (NP) were measured through deck incubation by adding NaH13CO3 and Na15NO3 into seawater, respectively, following the methods of Y.-L. Chen et al. (2008). Briefly, water samples were collected from the same six depths in the euphotic zone. The collected seawater was transferred immediately into two sets of three transparent polycarbonate bottles (2.3 L), one set for primary production measurement and the other for new-production measurement. Each set included two light bottles and one dark bottle. The bottles were covered with layers of neutral density screen to simulate irradiances at the sampling depths and incubated on deck under natural light in incubators circulated with flow-through surface seawater, starting at approximately 08:00–09:00 (local time) and lasting for 3 h. After incubation, the concentrations of particulate organic carbon, particulate nitrogen, and the isotopic ratios of 13C:12C and 15N:14N were measured by an automatic carbon-nitrogen elemental analyzer (ANCA) 20-20 mass spectrometer (Europa Scientific). For details of calculation of PP and NP, refer to Y.-L. Chen et al. (2008).
3.1 Hydrographic characteristics
The oceanographic conditions in the coast-excluded NSCS domains were likely dominated by monsoon-mediated surface circulation and Kuroshio intrusion (Chen et al., 2005; Dai et al., 2013; Hung et al., 2007, 2020; Liu et al., 2002; Zhai et al., 2005, 2013). In general, a strong northeast monsoon prevails between November and April, and a weak southwest monsoon prevails between June and September, leading to a basin-wide cyclonic circulation being dominant in winter and an anticyclonic circulation being dominant in summer (Shaw and Chao, 1994; Liu et al., 2002; Wong et al., 2007). Thus, stations 1 and 2 sampled in summer (July, 2013) exhibited similar distribution (0–300 m) of high surface temperature (T), low surface salinity (S), and low surface Chl a concentration with a subsurface maximum (Fig. 2). The mixed layer was shallow (20–27 m), and the T–S diagram reveals that their characteristics were similar to the typical pattern in South China Sea Water (SCSW; Fig. 3a). Stations 3 and 4 sampled in winter (December, 2013) exhibited low surface T, high surface S, and deeper mixed layer with surface-elevated Chl a concentration (Fig. 2). The seawater properties shifted toward the typical features of Kuroshio water (KW; Fig. 3a), influenced apparently by the intrusion of KW. Stations 3 and 4 were located inside and outside the anticyclonic eddy (Chen et al., 2015), respectively, with a pronounced deeper mixed layer (160 vs. 85 m) and higher Chl a at Station 3 than at Station 4. Stations 5 and 6 sampled in later spring (May, 2014) displayed similar patterns to those (T, S, and Chl a) in summer (stations 1 and 2; Fig. 2). The T–S features belong to certain extents between summer and winter (Fig. 3a).
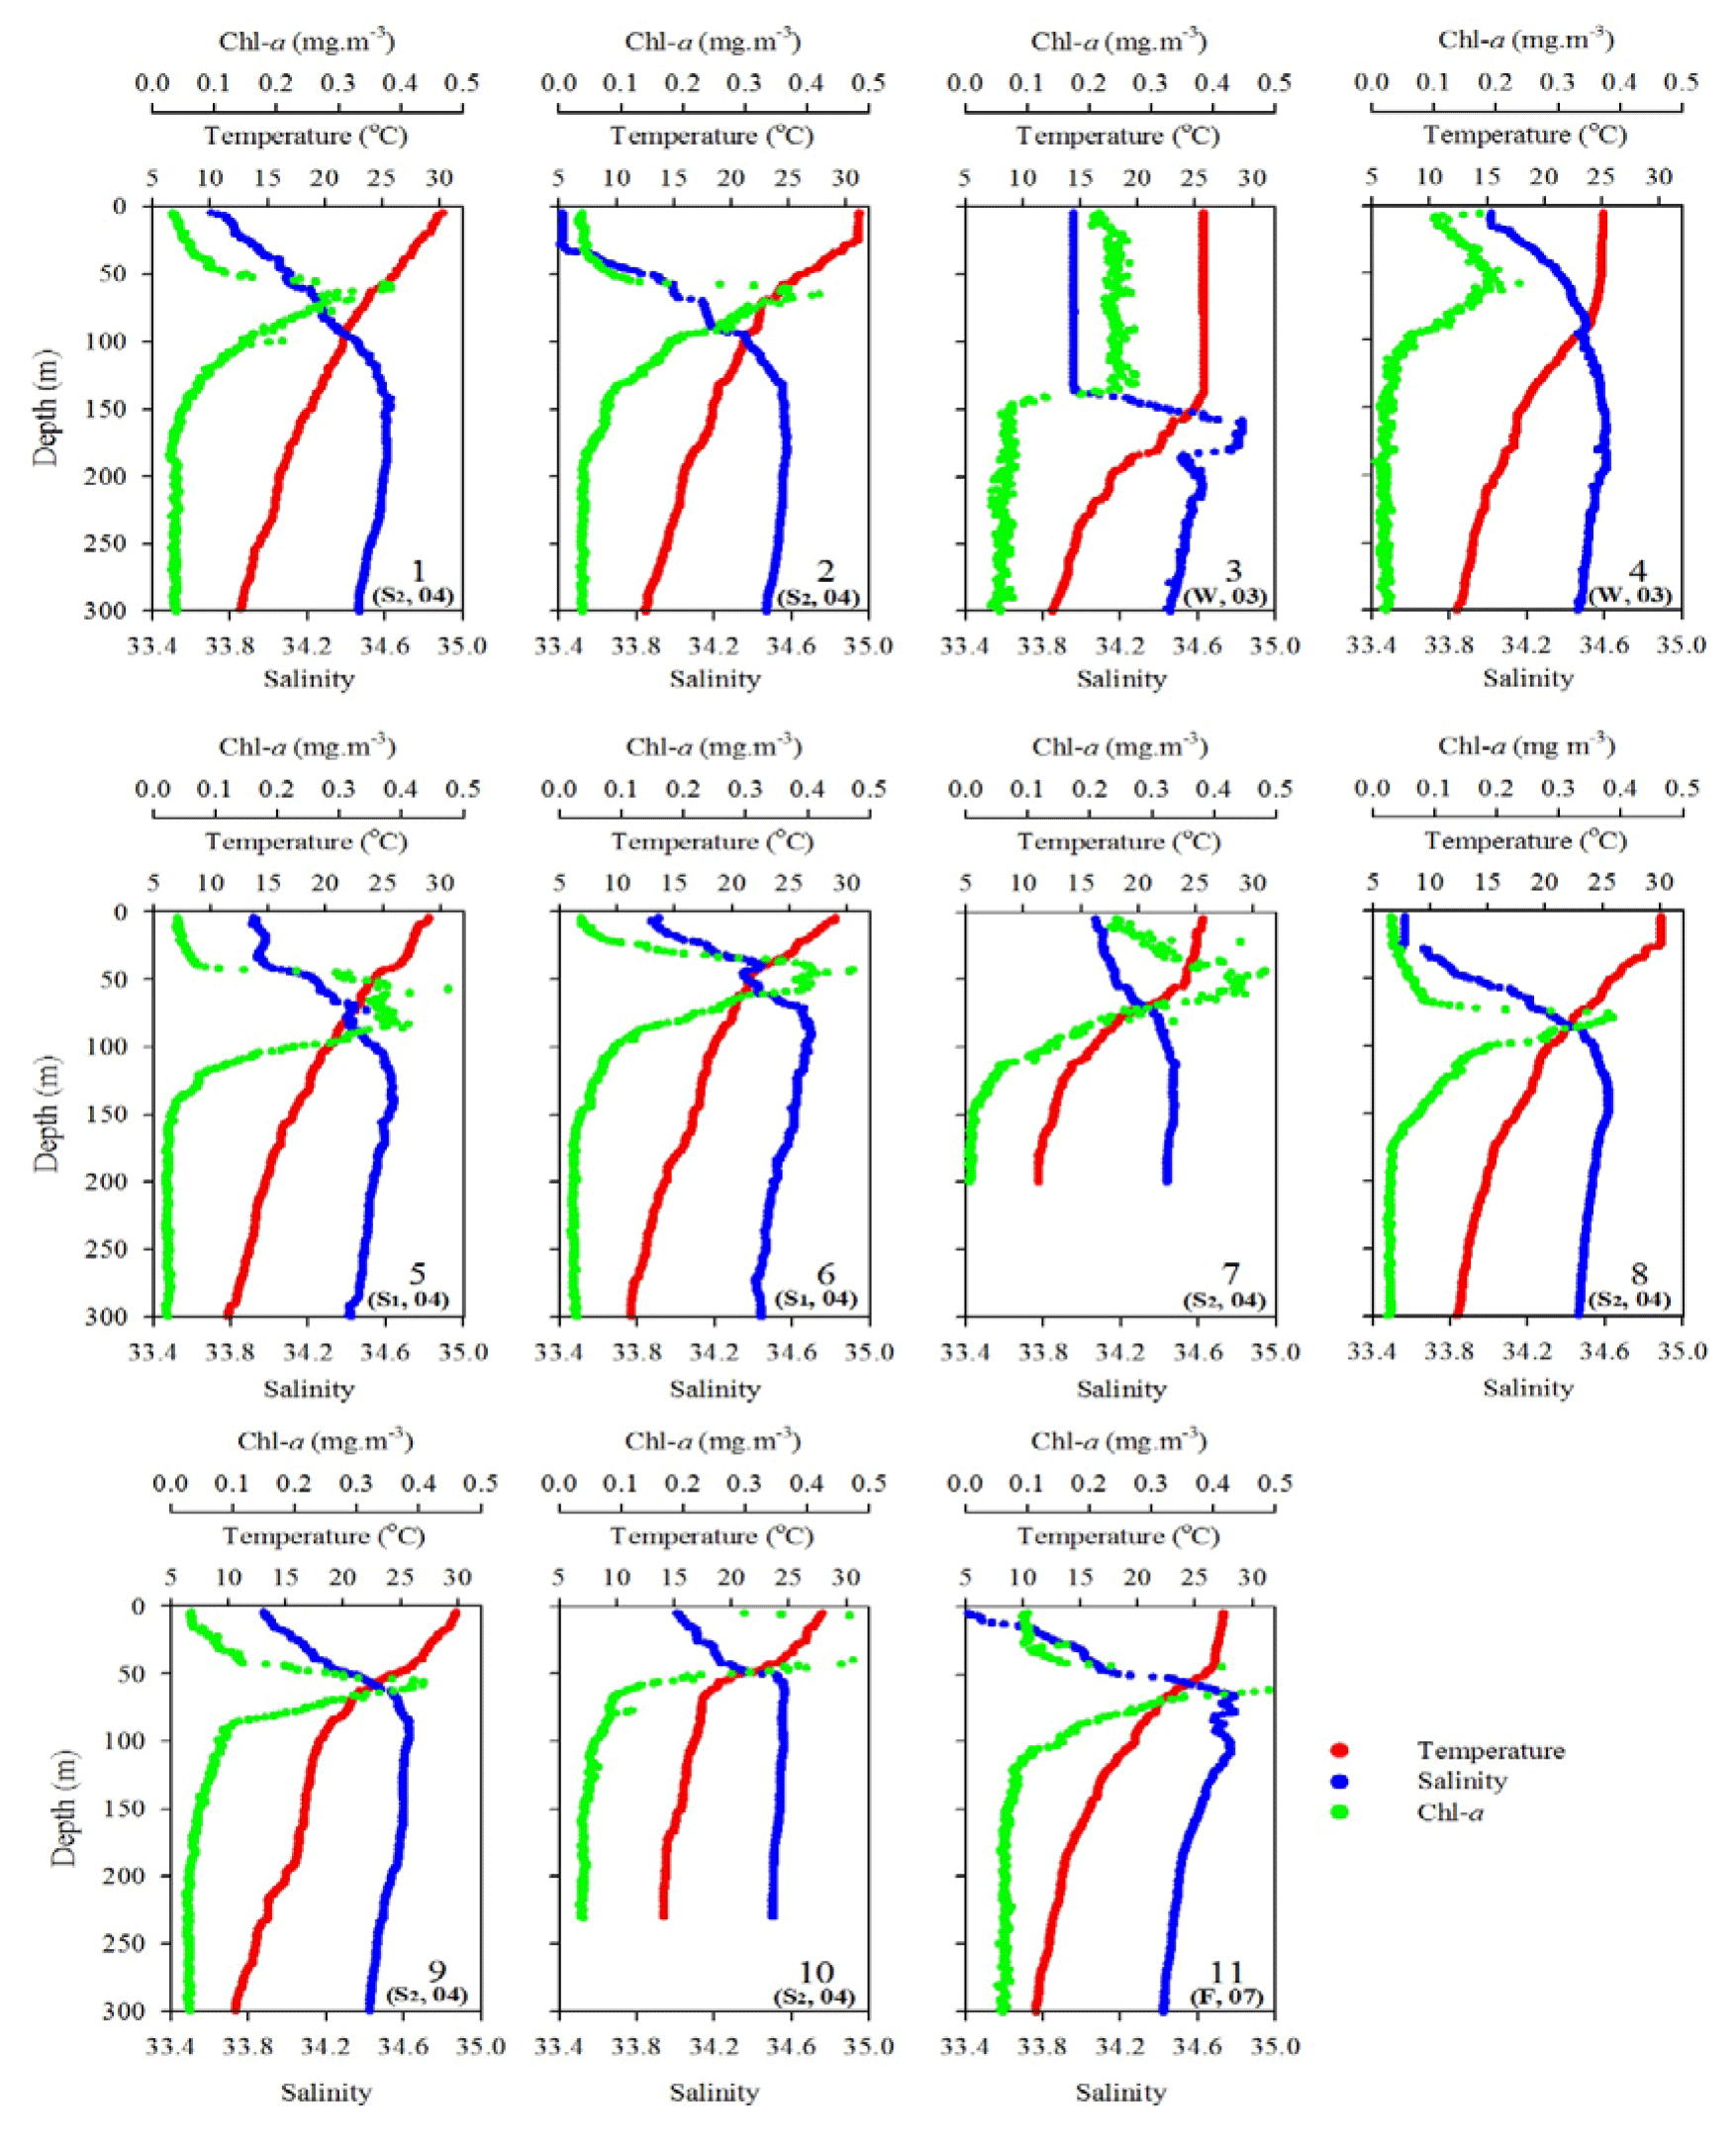
Figure 2Vertical profiles of temperature, salinity, and fluorescence (Chl a) in the upper layer (300 m) of the water column for all sampling stations during various expeditions. The data of sampling season (S1: spring; S2: summer; F: fall; W: winter) and year (e.g., 04 for 2004) are included for each sampling station.
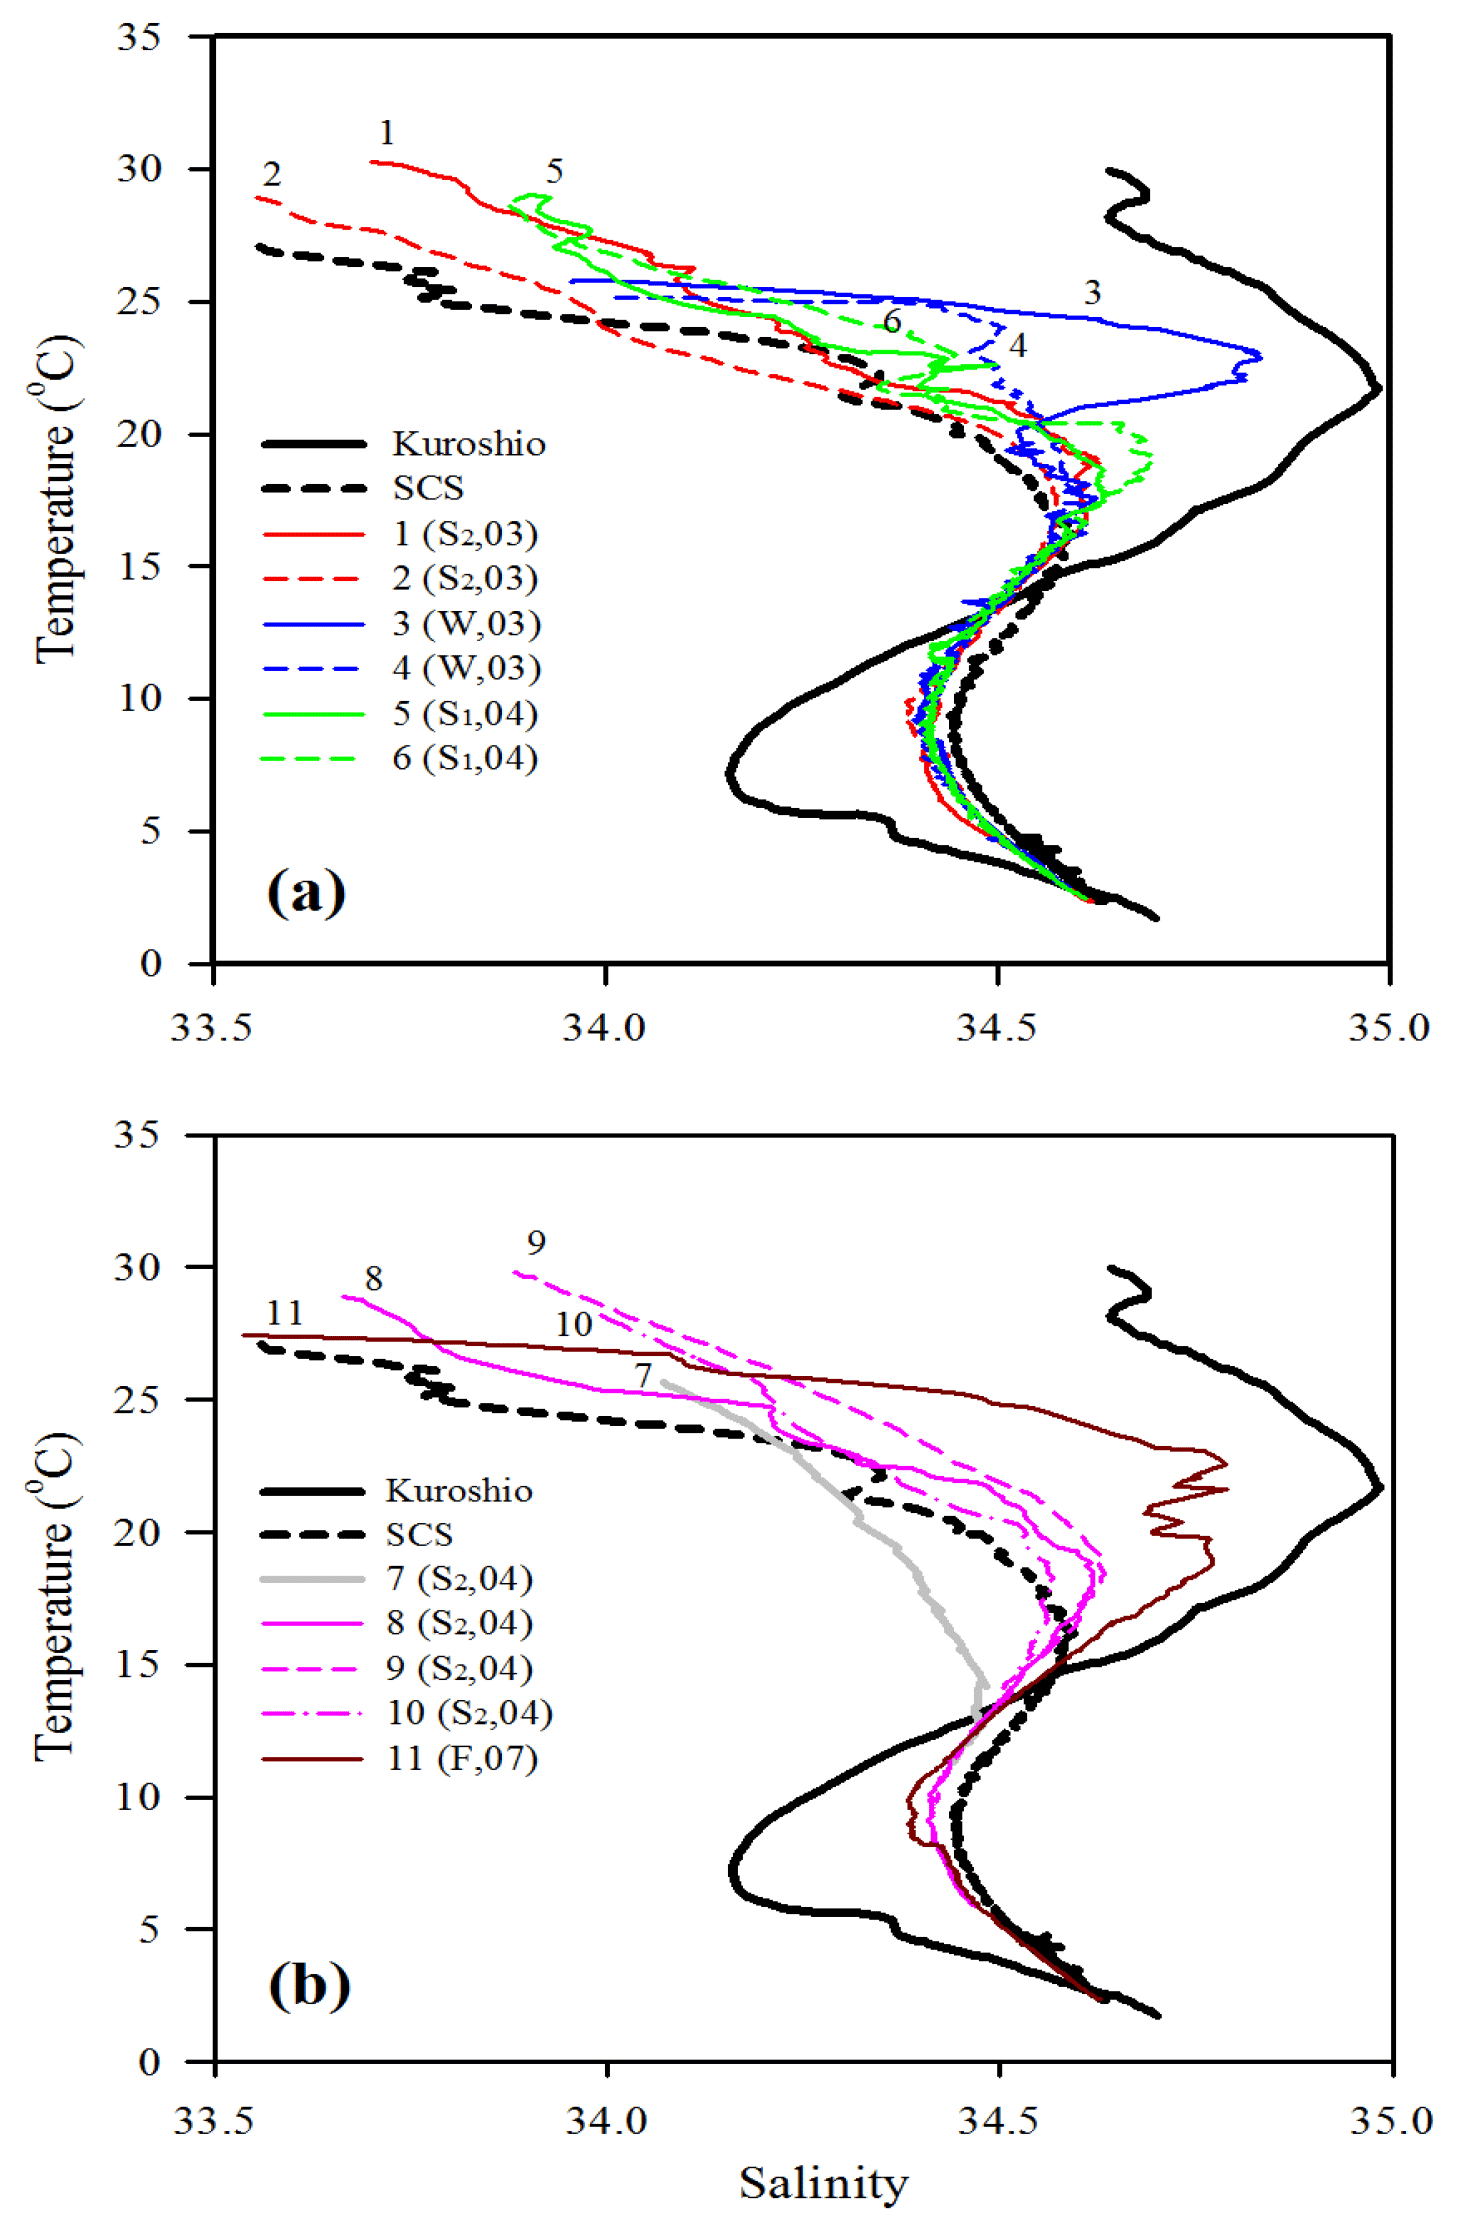
Figure 3T–S plots for comparing water-column characteristics among stations 1–6 (a) and stations 7–11 (b). Kuroshio and SCS indicate the typical T–S features of Kuroshio and South China Sea waters, respectively. The Kuroshio and SCS waters are typical waters collected from the West Philippine Sea and central SCS, respectively. Note that the data of sampling season (S1: spring; S2: summer; F: fall; W: winter) and year (e.g., 04 for 2004) are included for each sampling station.
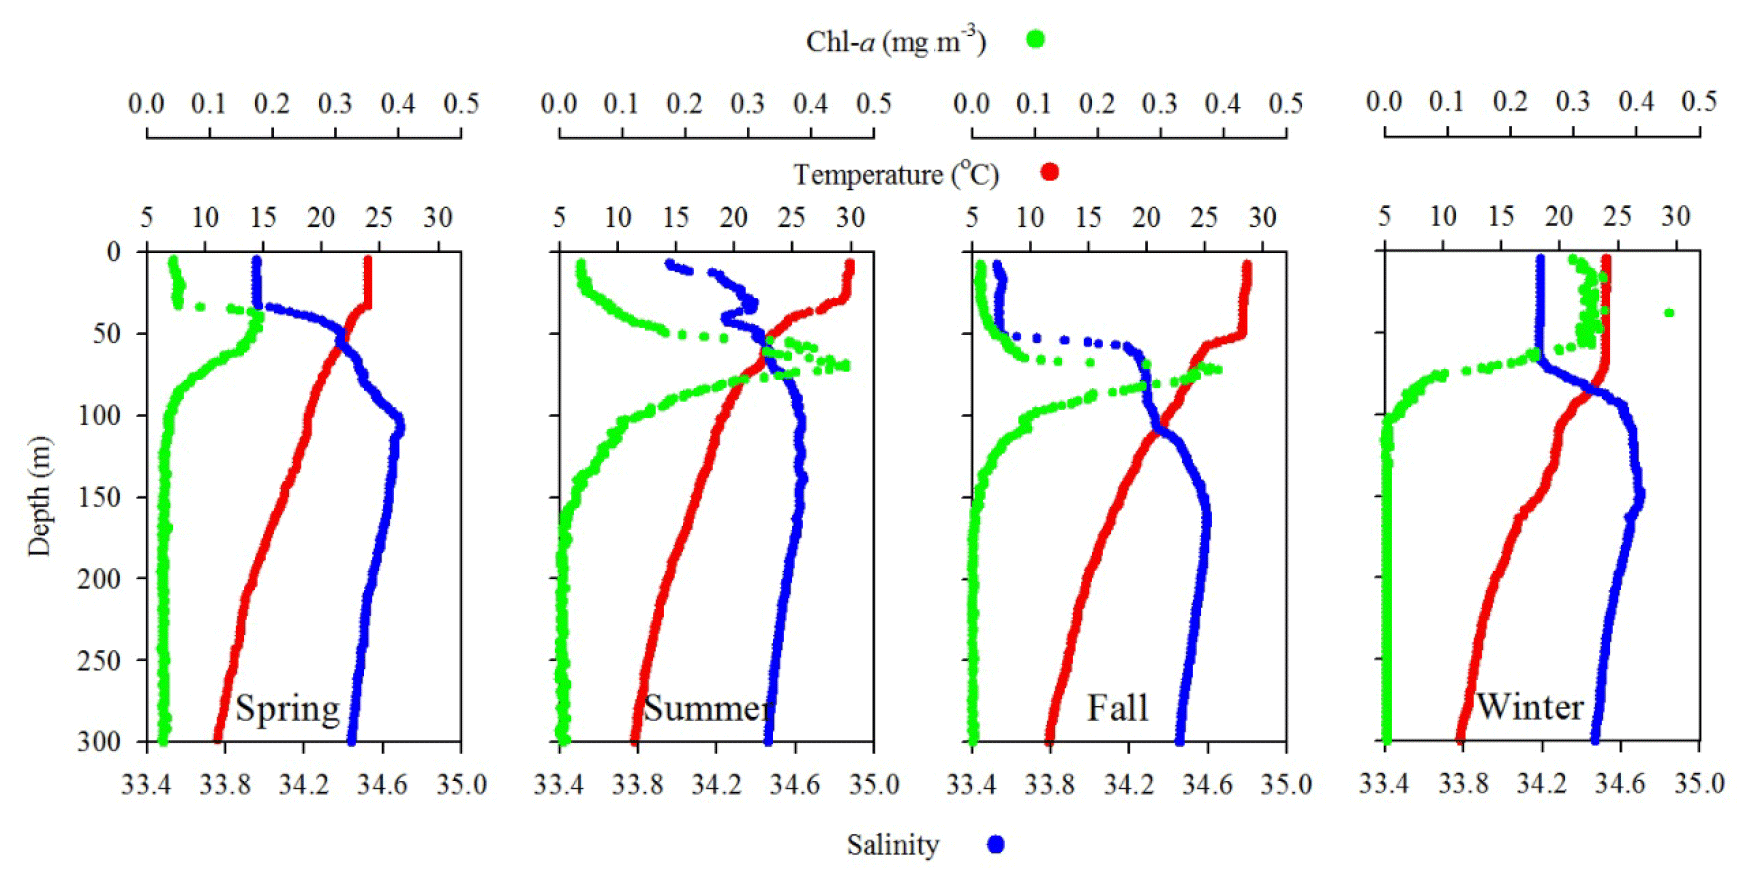
Figure 4Comparison of seasonal variations of temperature, salinity, and fluorescence (Chl a) profiles in the upper layer (300 m) of the water column at SEATS (11) station.
Station 7 sampled at the location close to the Dongsha Atoll in summer (June, 2014) was influenced by the internal-wave (IW) shoaling activity and exhibited low surface T and high surface S and Chl a, attributed apparently to the shoaling events (Fig. 2). The T–S diagram also clearly depicts the water sourced from subsurface SCSW (Fig. 3b). Stations 8 and 9 sampled in summer (July, 2014) exhibited the characteristics of SCSW in summer, and the distribution patterns of T, S, Chl a (Fig. 2), and T–S features (Fig. 3b) were similar to those in stations 1 and 2. Station 10 sampled in summer (July, 2014) was located at the same position as Station 7 and exhibited similar features but with slight differences in T, S, Chl a, and T–S properties (Figs. 2 and 3b), due to the different shoaling strength. Station 11 (SEATS) sampled in fall (November, 2017) also exhibited high surface T, low surface S, and moderate surface Chl a with an obvious subsurface maximum (Fig. 2). The T–S features shifted slightly toward the typical features of KW (Fig. 3b). The distribution patterns of T, S, and Chl a in different seasons are also presented in Fig. 4; significant differences in the three parameters were observed between summer and winter, with a deeper mixed layer, lower surface T, and higher surface Chl a in winter, and vice versa in summer. Spring and fall were apparently in transition states between winter and summer (Fig. 4).
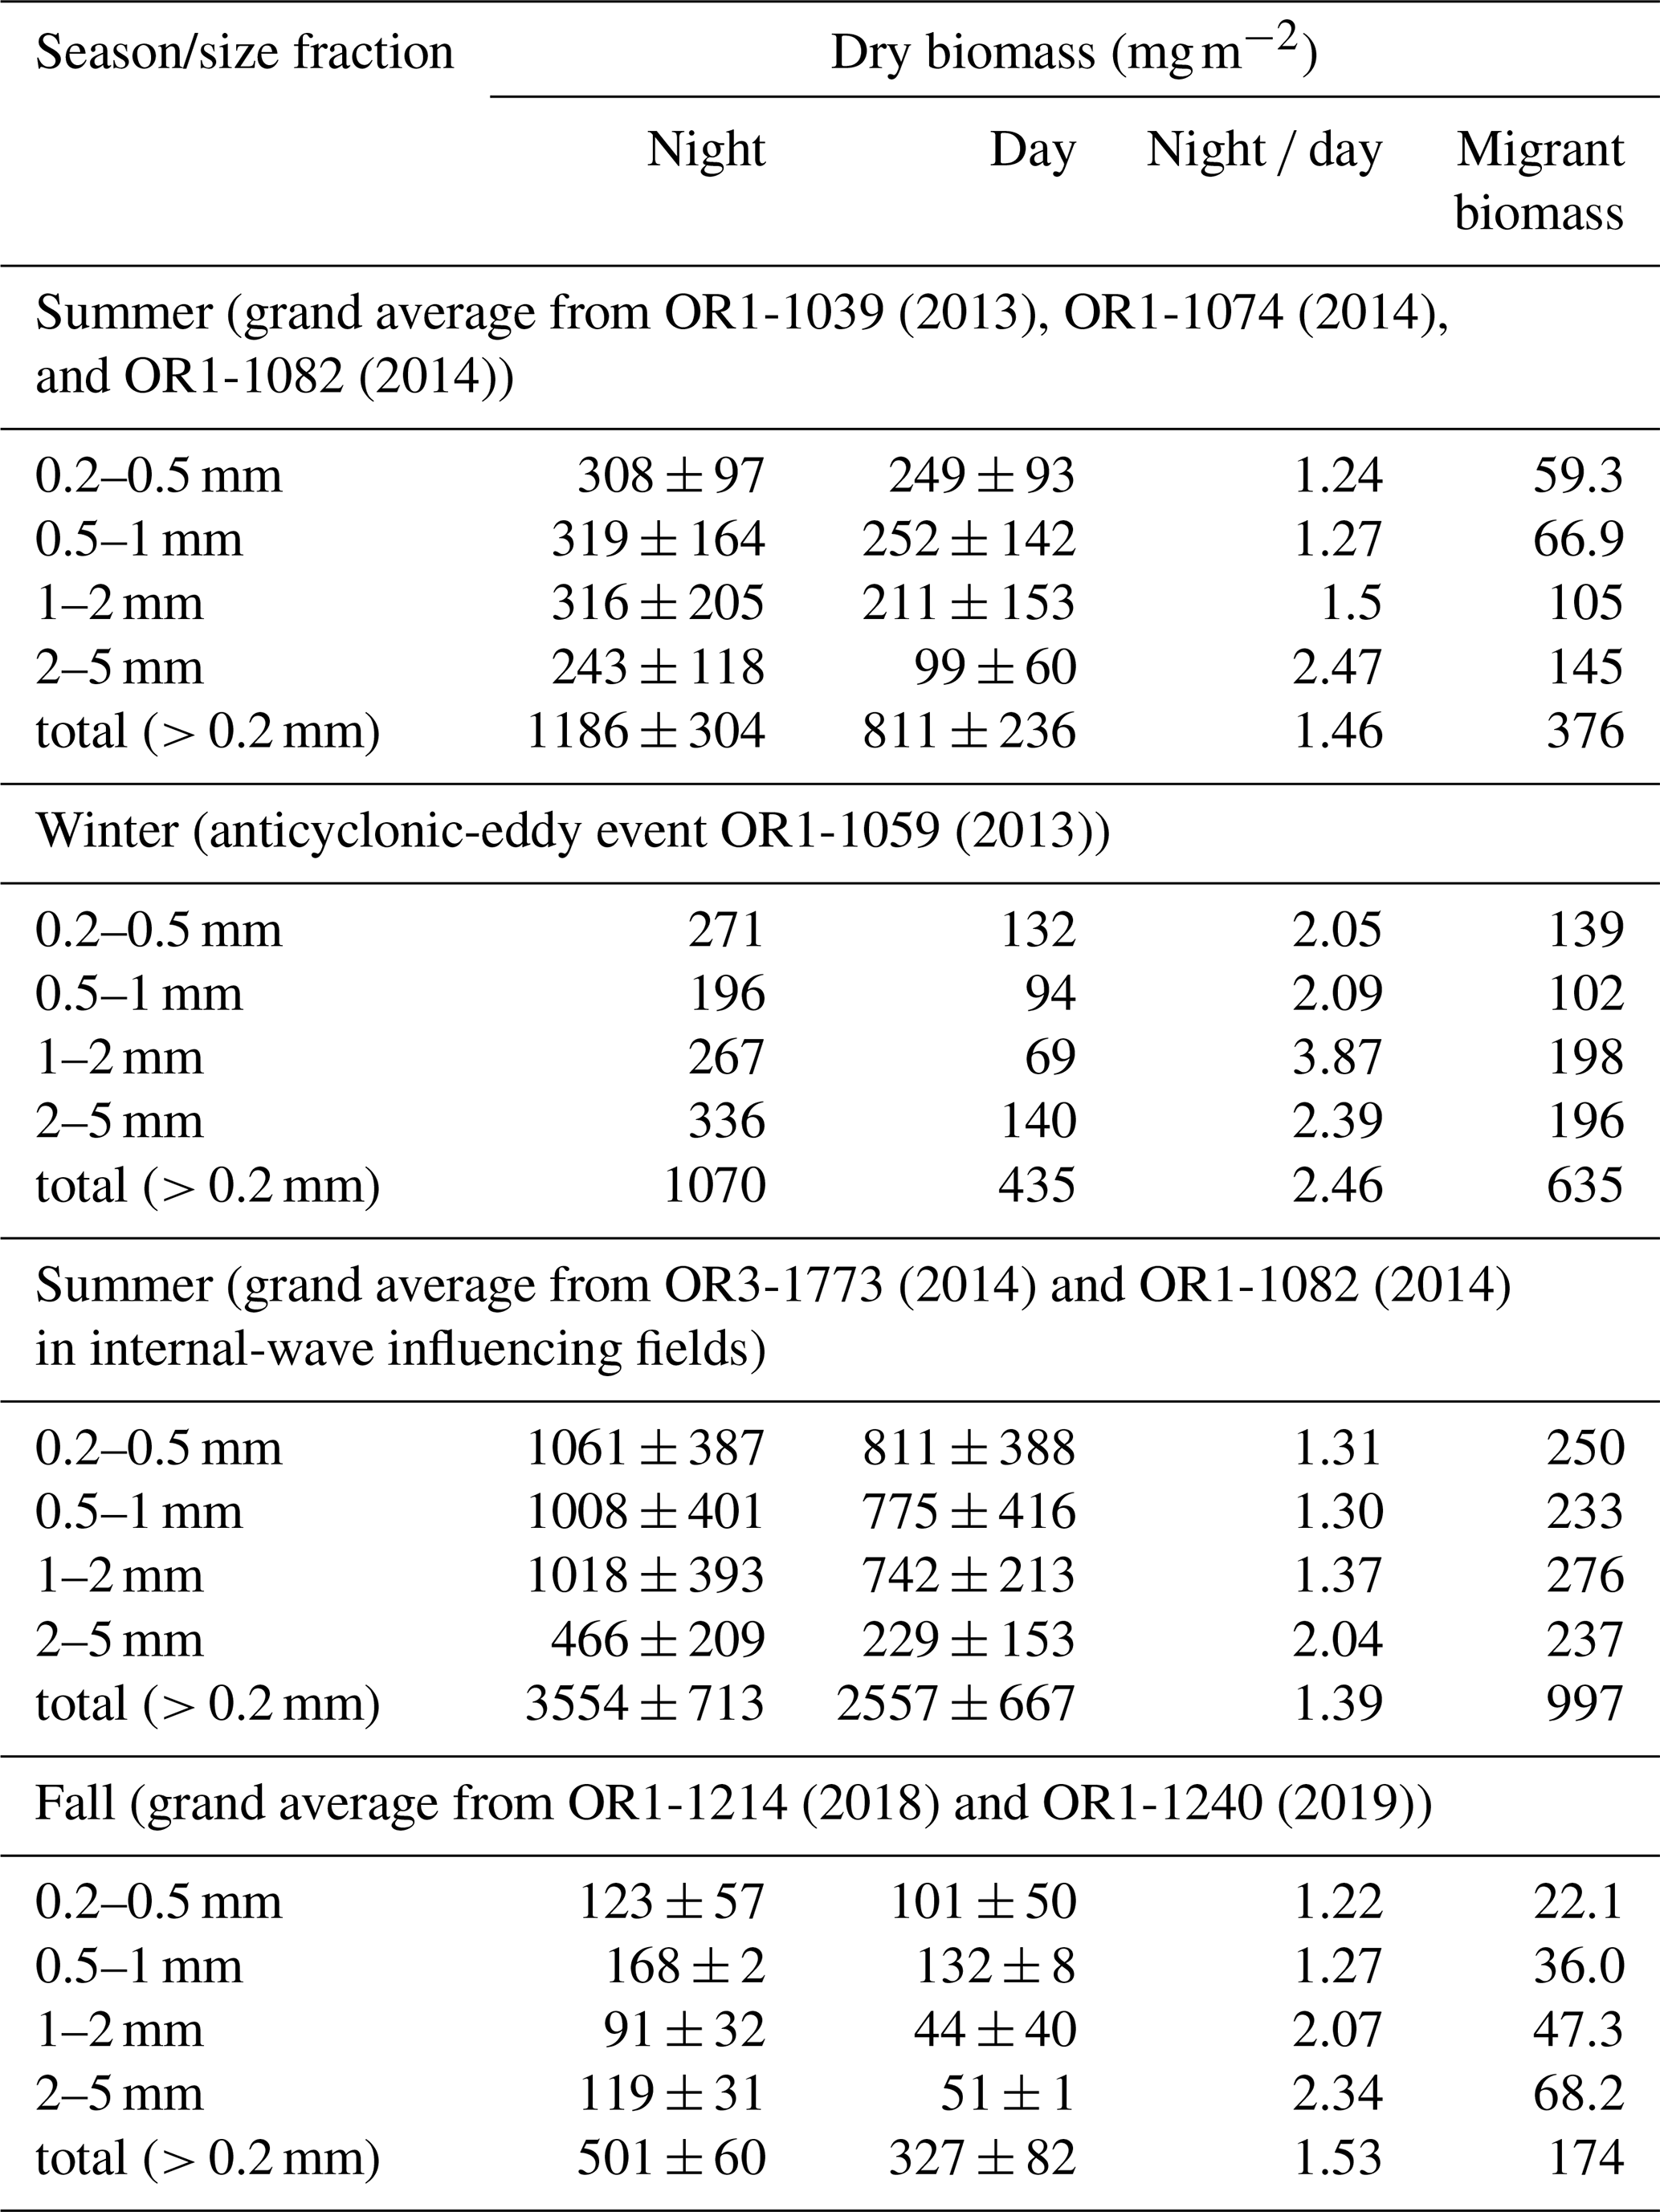
Table 2A list of mesozooplankton biomass and migrant biomass in various sizes collected from night and day tows, and night day biomass ratio during different seasons and events. The dry biomass (mg m−2) denotes an integrated biomass through the top layer of 200 m.
3.2 Active fluxes of organic carbon, nitrogen, and phosphorus
3.2.1 Evidence of DVM and biomass and abundance of zooplankton and micronekton
The vertical distribution and acoustic scattering layers of migrators recorded at frequencies of 38 kHz (depth > 1000 m) and 120 kHz (depth approx. ∼ 300 m), respectively, clearly had strong image layers around 400 m derived from 38 kHz data during the day and approximately 100 m derived from 120 kHz data during the night. This finding indicates that the vertical migrators were located largely at a depth of 400 m during the daytime and migrated to approximately 100 m during the nighttime. The major located layers of migrators during daytime and nighttime were comparable to those found for diel migrated fish in the northern slope of SCS (Wang et al., 2019). Sequential tows performed at eight time intervals (17:00, 21:00, 01:00, 03:00, 06:00, 09:00, 12:00, and 15:00) at the top 200 m revealed the largest mesozooplankton biomass (2021 mg m−2) and abundance (354 inds m−3) during the night (01:00) but the lowest biomass (1480 mg m−2) and abundance (270 inds m−3) during the day (12:00; Fig. S1 in the Supplement). Higher mesozooplankton biomass and abundance were observed in night tows than in day tows for all size classes; the occurrence of small mesozooplankton (0.2–2.0 mm) was generally higher than that of large mesozooplankton (2.0–5.0 mm), except for the highest occurrence of large (0.2–5.0 mm) mesozooplankton in winter (Table 2). However, the magnitude of migrant biomass (night minus day) was usually the largest for the 2.0–5.0 mm class, except during an internal-wave event in summer (Table 2). The total migrant biomass (sum of all sizes) was 474 mg m−2 in late spring, ranged from 235 to 418 (mean: 327) mg m−2 in summer, was 635 mg m−2 in winter with an anticyclonic event, and ranged from 158 to 189 (mean: 174) mg m−2 during fall at SEATS station (Table 2). An elevated biomass of 997 mg m−2 was observed in the internal-wave influencing fields in summer (Table 2). The night day ratio of migrant biomass was higher for large mesozooplankton (2.15–3.12 for size 2.0–5.0 mm) than for small mesozooplankton (1.21–2.09 for size 0.2–0.5–1.0 mm), coincident with the size distribution of migrant biomass (Table 2). This implied that larger migrators might play more crucial roles than smaller migrators in determining the vertical transport of materials and elements.
3.2.2 Elemental composition of mesozooplankton
The measurement of elemental contents of mesozooplankton is essential for determining active fluxes of C, N, and P. The planktonic contents of C, N, and P were 37.4 ± 4.34 %, 7.86 ± 1.29 %, and 0.76 ± 0.43 %, respectively, which did not significantly differ between daytime and nighttime tows in summer. In general, C and N contents were higher in smaller mesozooplankton (1.0–2.0 and 0.5–1.0 mm) than in larger mesozooplankton (2.0–5.0 mm), but the P content increased with an increase in mesozooplankton size. The C, N, and P contents were, respectively, 33.2 ± 10.3 %, 6.21 ± 2.10 %, and 1.06 ± 0.69 % in winter, with an occurrence of anticyclonic eddy; 39.4 ± 3.67 %, 7.88 ± 1.02 %, and 0.91 ± 0.36 % in internal-wave influencing fields in summer; and 40.4 ± 1.13 %, 8.92 ± 0.43 %, and 0.60 ± 0.08 % in fall at the SEATS station. The C and N contents were similar to those reported previously (35.6 %–40 %, Parsons et al., 1979; Dam and Peterson, 1993; Kobari et al., 2013; and 9 %, Peters and Downing, 1984, respectively). The molar ratios of C:N, C:P, and N:P varied seasonally, ranging from 5.29 to 5.80 (5.55 ± 0.16), 79.7 to 162 (131 ± 30), and 15.1 to 29.6 (23.6 ± 5.05), respectively, in summer. The elemental ratios of C:N, C:P, and N:P were 4.97–7.42 (6.33 ± 0.71), 45.3–211 (102 ± 50.6), and 9.12–35.3 (16.0 ± 8.2), respectively, in winter, and 5.31–6.23 (5.84 ± 0.27), 76.8–134 (111 ± 29.9), and 3.5–22.0 (18.9 ± 3.16), respectively, in summer in the internal-wave influencing fields. Moreover, they were 4.15–5.49 (5.2 ± 0.27), 139–215 (176 ± 31), and 25.2–40.6 (33.2 ± 6.29) in fall at the SEATS station. The elemental ratios of C:P and N:P exhibited greater variation than C:N, which likely resulted from the large variation in P content. The elemental composition, however, was comparable with that found in the ALOHA station (C88N18P1; Hannides et al., 2009), the Baltic Sea (C41N7P1–C144N24P1; Pertola et al., 2002), and Norwegian fjords (C63N8P1–C348N38P1; Gismervik, 1997). Our ratios were apparently higher than the Redfield ratio (C106N16P1) except for some cases in C:N ratios, likely because of the relatively low P content in mesozooplankton compared with phytoplankton.
3.2.3 Active fluxes of C, N, and P
Active fluxes of C, N, and P were estimated as the sum of respiratory, gut, excretory, and mortality fluxes for mesozooplankton of various size fractions, and the original data on component fluxes are presented in Table S1 in the Supplement. In terms of C flux, the respiratory flux was the most dominant, followed by gut flux, excretory DOC flux, and mortality flux. By contrast, the N and P fluxes were derived mainly from excretory and mortality fluxes, and the excretory fluxes were considerably higher than the mortality fluxes. In general, the respiratory, gut, and excretory C fluxes decreased with an increase in the size fractions with a few exceptions (Table S1). However, the excretory and mortality fluxes of N and P did not exhibit a consistent relationship with size fractions (Table S1). Overall, the active C flux was mainly accounted for by the respiration flux (49.4 %–75.8 %) and the least by the mortality flux (8.99 %–13.4 %); those results were comparable to those of the proportion of respiration flux contributing to active flux in the western equatorial Pacific (54.6 %; Hidaka et al., 2001), subtropical Pacific Ocean (61.8 %–63.0 %; Kobari et al., 2013), and Sargasso Sea (BATS Station, 75 %; Steinberg et al., 2000).
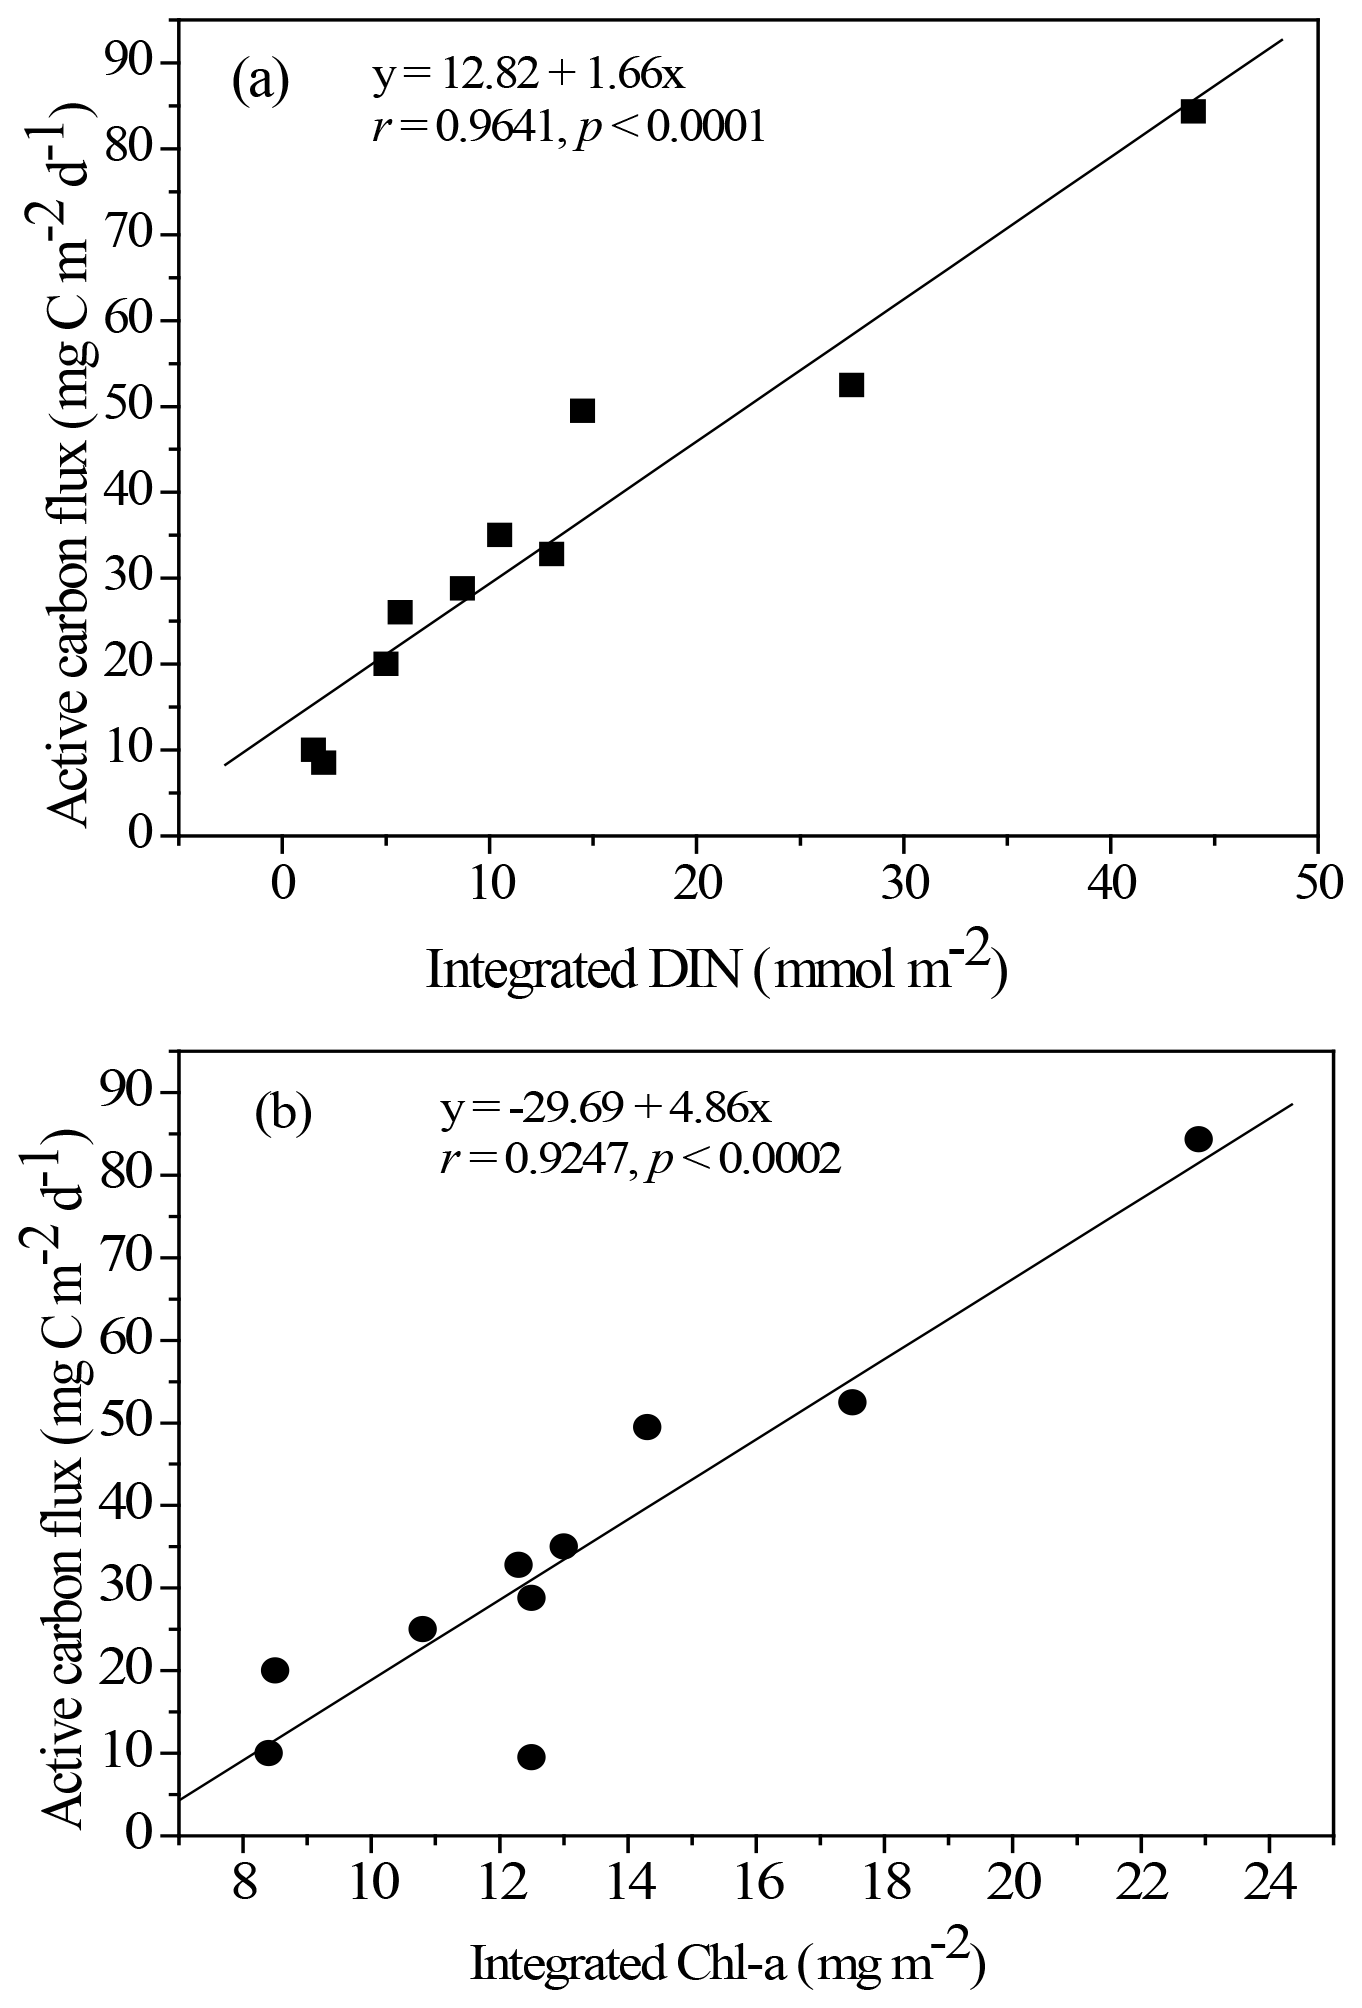
Figure 5Empirical relationship between active carbon fluxes and DIN inventories in the euphotic zone (a) and between active carbon fluxes and Chl a inventories in the euphotic zone (b). The statistic correlations were established from collected data in all expeditions.

Figure 6Comparisons between seasonal and spatial active carbon fluxes in the NSCS. The active fluxes were geographically grouped as the central basin represented by the SEATS station and the northern region for other sampling locations. The SEATS active fluxes were estimated using the empirical relationship between active fluxes and inventories of Chl a except for SEATS-F1 and F2 (fall season), which were derived from experimental data. The data of the northern region were all experimental data, except for the Winter/o (outside the eddy) datum derived from the empirical relationship between active fluxes and Chl a inventories. Winter/i (inside the eddy); Summer-IW (internal waves); SEATS-Su (summer); SEATS-W (winter); SEATS-F (fall).
Resolving spatial and seasonal variations in active fluxes in the NSCS is difficult because of unsuccessful sampling at certain stations and cruises. Nevertheless, for the first-order approximation, the active fluxes that could not be measured were estimated using the empirical relationship established from the experimental data of active fluxes and Chl a inventories (Fig. 5). Thus, the compiled active fluxes of C, N, and P were 7.69–93.4 , 1.06–7.26 , 0.13–0.99 , respectively (Fig. 6). The flux distribution was the highest in summer due to the impact of the internal-wave shoaling condition, followed by winter with an anticyclonic eddy, and finally by summer with a calm oceanic condition. The smallest values were found in the fall season under relatively calm condition (Fig. 3) in the central basin (SEATS, Station 11), which is far from land sources.
Table 3A list of measured and estimated fluxes of total mass, POC, PN, and POP in various sampling seasons and oceanic events in NSCS.
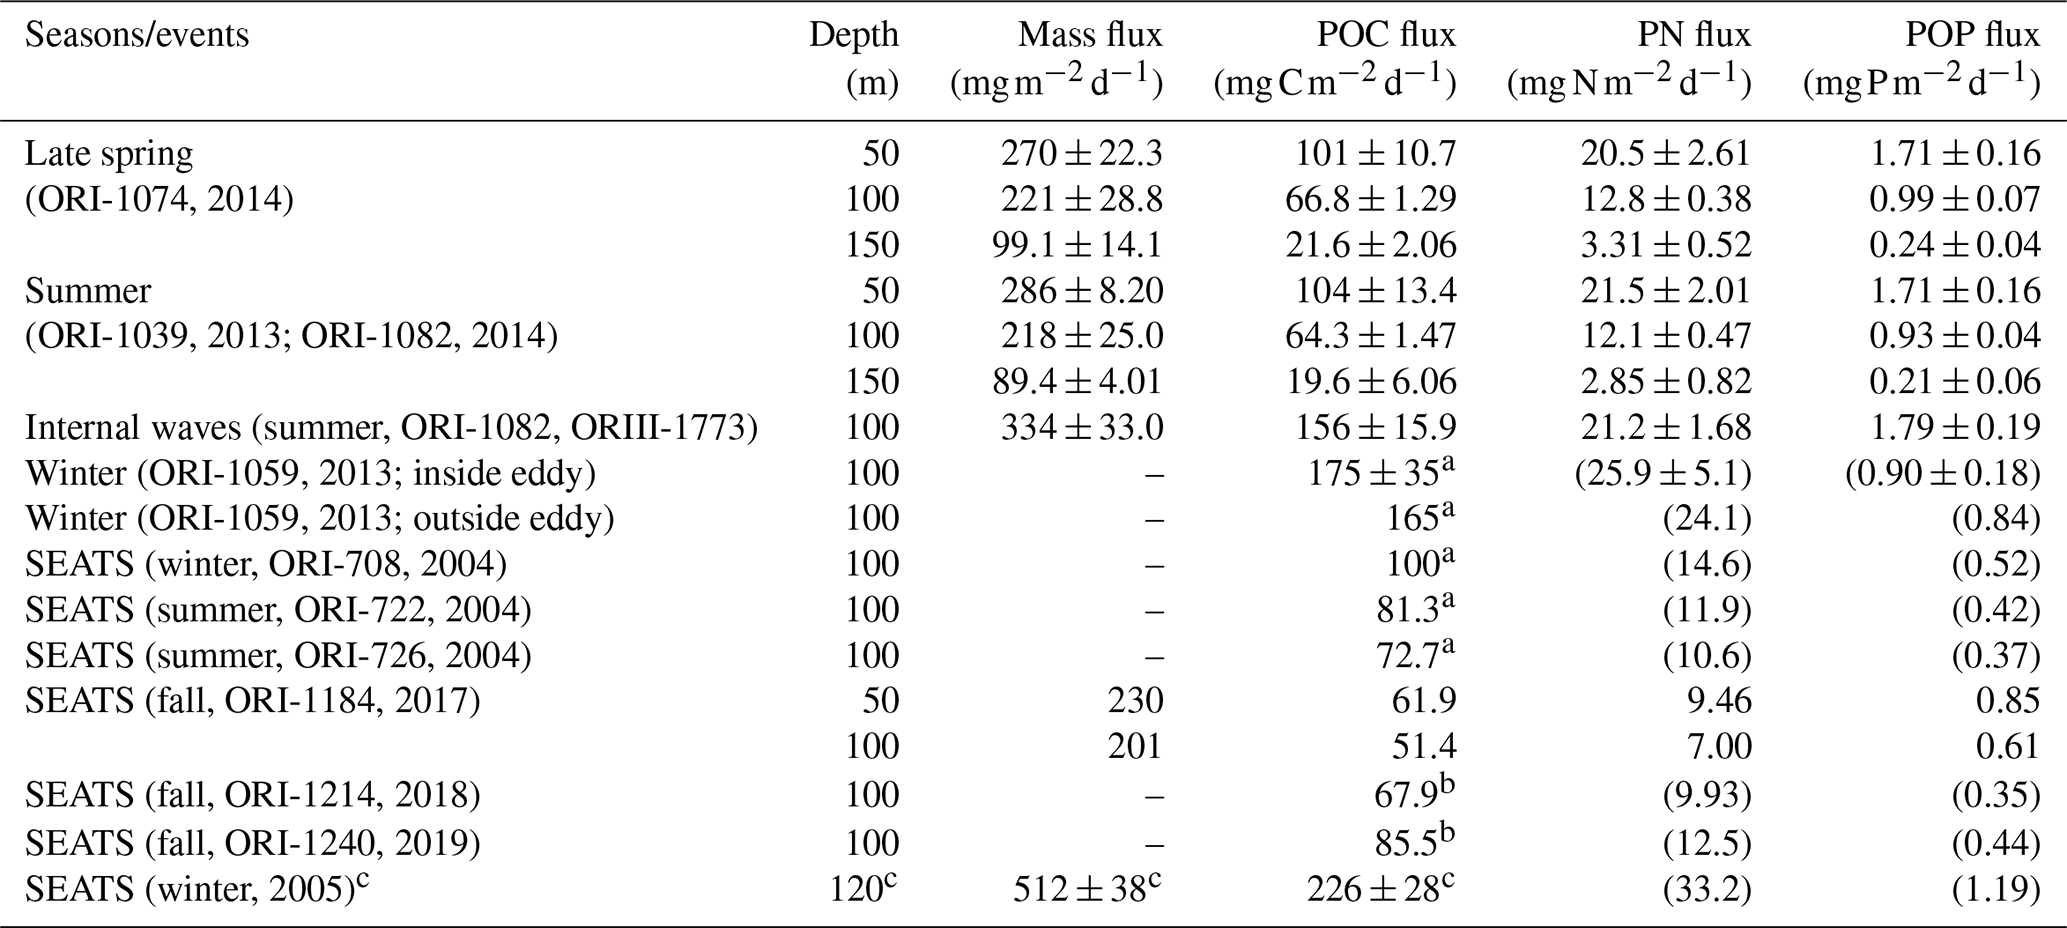
a POC fluxes were derived from integrated new production (see Fig. 9). b POC fluxes were derived from Chl a inventories in the euphotic zone (see Fig. 9a); PN and POP fluxes in parentheses were estimated from POC fluxes and C:N and C:P ratios. c Data collected from deep-moored traps deployed on the site close to the SEATS station.
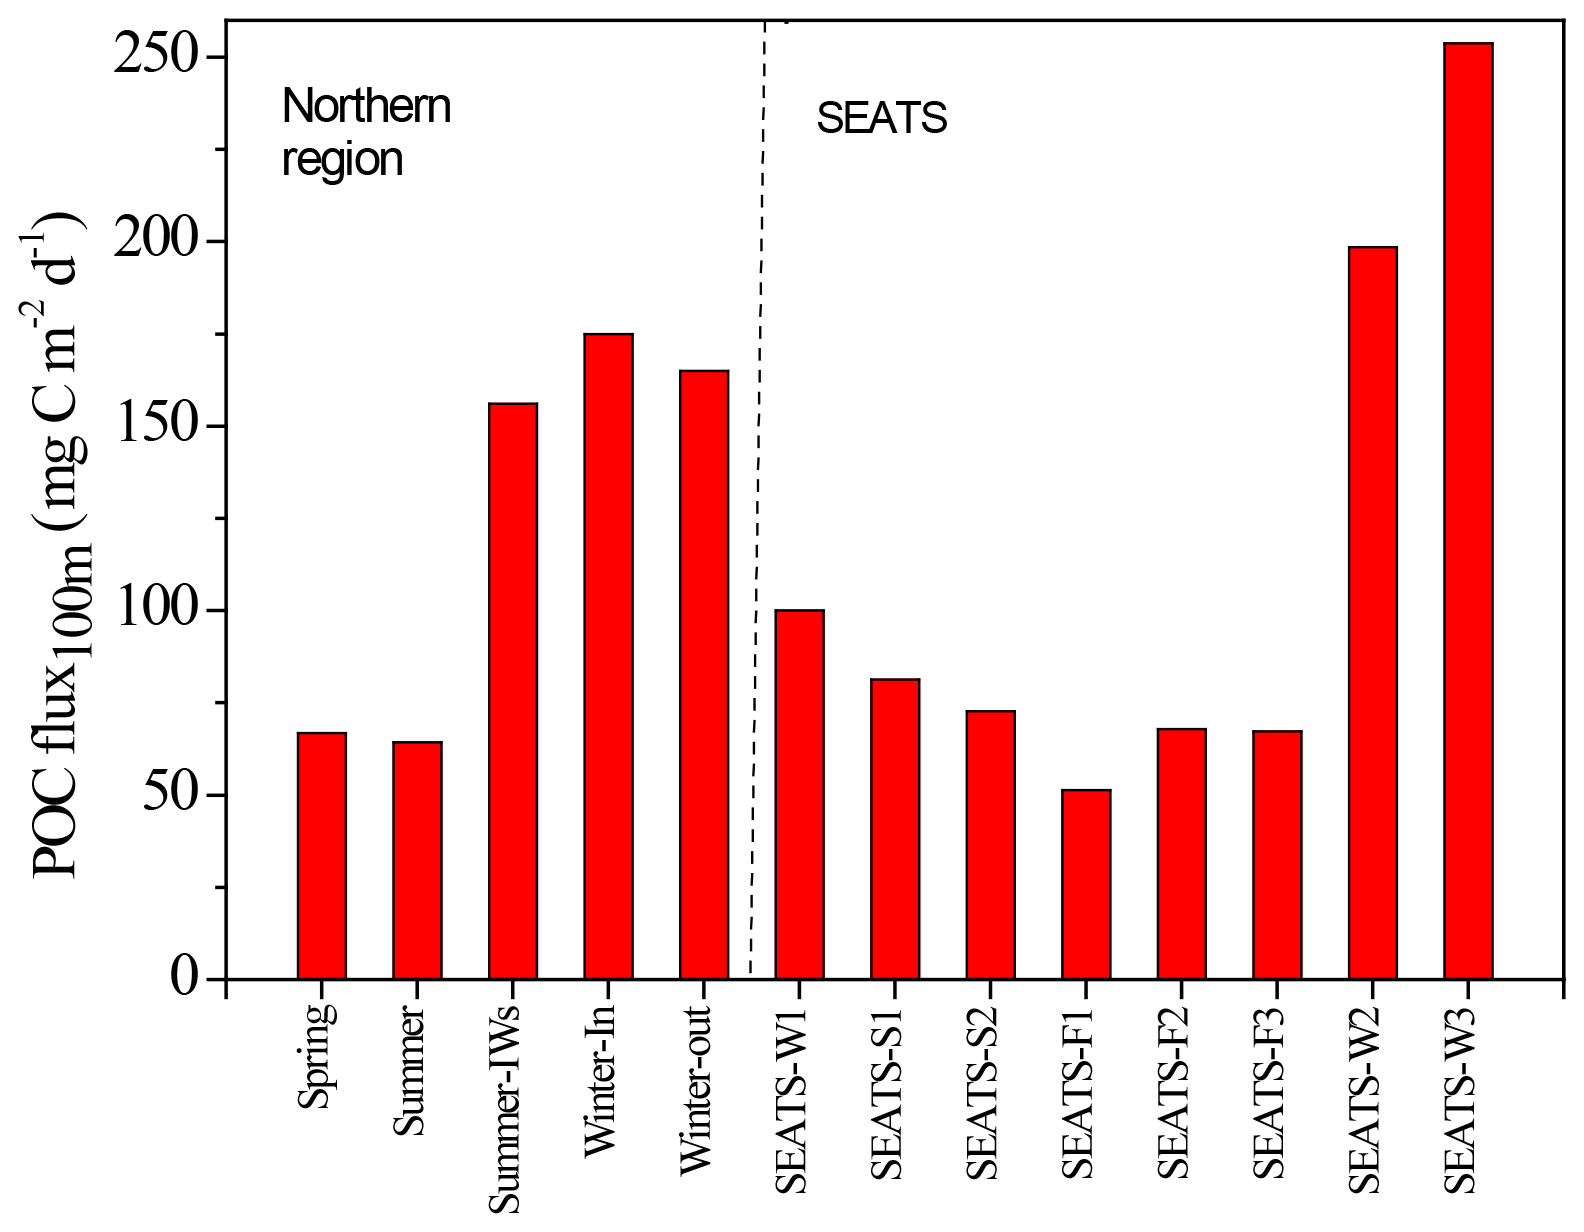
Figure 7Seasonal variations in vertical POC fluxes in the SEATS-excluded region (left side) and SEATS station (right side). Summer-IWs denotes the internal-wave event in summer; Winter-In denotes values inside the anticyclonic eddy in winter; Winter-out denotes values outside the anticyclonic eddy in winter. SEATS-W1, S1, S2, F1, F2, F3, W2, and W3 represent various samplings in winter (W), summer (S), and fall (F) seasons at the SEATS station. SEATS-W2 and W3 data were obtained from the bottom-moored traps at a depth of 120 m (see Fig. 11). Other SEATS data were derived from integrating data of the new production and Chl a (see Figs. 9 and 10) except for data of SEATS-F1, which were obtained from the deployed floating traps.
3.3 Passive fluxes of C, N, and P
3.3.1 Vertical fluxes of POC, PN, and POP
Vertical fluxes of POC, PN, and POP appeared to decrease with an increase in depth from 50 to 150 m, likely due to the increased decomposition of organic matter with increasing depth (Table 3). Because most euphotic zones were located at depths between 50 and 100 m, vertical fluxes through a depth 100 m were considered the measures of passive fluxes. To obtain a comprehensive understanding and for comparison, some fluxes through a depth of 100 m were obtained through prediction based on the euphotic-layer inventories of new production, DIN, and Chl a (see the Discussion section) for stations that exhibit trap recovery failure or those with no trap deployment in previous studies. Vertical POC fluxes through a depth of 100 m ranged from 64.3 ± 1.47 in typical summer to 165 in typical winter. The flux increased to 156 ± 15.9 in summer with the internal-wave shoaling condition and to 175 ± 3.5 in winter within the anticyclonic eddy (Table 3, Fig. 7). At the SEATS station located in the central basin, the POC fluxes ranged from 51.4 during fall to 100 during winter (Table 3). Additional data obtained from previous sequentially moored traps at the SEATS station at a depth of 120 m revealed extremely high fluxes (199–254 ) in winter (SEATS-W2, SEATS-W3; Fig. 7). Although data on PN and POP fluxes were limited, the data predicted after the addition of POC:PN and POC:POP ratios the seasonal and event-effected patterns followed apparently by the variability of POC fluxes (Table 3).
The molar ratios of POC:PN ranged from 5.65 ± 0.20 (at 50 m) to 8.00 ± 0.15 (at 100 m), with an average value of approximately 6.84 ± 0.60 (50–100 m). The C:N ratio increased slightly from 50 to 150 m, likely attributed to the rapid decay of PN over POC with increasing depth. The mean ratio was close to the Redfield ratio (6.6; Redfield, 1958), indicating a relatively low contribution of lithogenic POC sources. The molar ratios of POC:POP ranged from 152 ± 1.57 (at 50 m) to 243 ± 15.3 (at 150 m), with an overall value of approximately 194 ± 9.5. The increase in C:P ratios with increasing depth was more pronounced than that of C:N ratios, indicating that POP was more labile than PN in settling organic matter. The C:N and C:P ratios were applied to the estimation of the PN and POP fluxes not obtained from the measured POC fluxes presented in Table 3.
3.3.2 Vertical fluxes of DOC and DON
Although the data on DOC and DON fluxes through a depth of 100 m were limited, for first-order approximation, considering the contribution of DOC and DON fluxes to passive carbon and nitrogen fluxes was essential. In general, the vertical fluxes of DOC and DON likely increased from a depth of 50 to 150 m, ranging from 0.71 ± 0.68 at 50 m to 1.71 ± 0.01 at 150 m in spring and from 0.78 ± 0.52 at 50 m to 1.29 ± 0.15 at 150 m in summer (Table S2 in the Supplement). Vertical fluxes of DOC through a depth of 100 m were 1.13 ± 0.03 in spring and 1.10 ± 0.13 in summer. The DON fluxes ranged from 0.08 ± 0.06 at 50 m to 0.35 ± 0.02 at 150 m in spring and from 0.06 ± 0.06 at 50 m to 0.10 ± 0.08 at 150 m in summer (Table S2). Vertical fluxes of DON through a depth of 100 m were 0.22 ± 0.07 in spring and 0.09 ± 0.06 in summer. The DOC and DON fluxes through a depth of 100 m increased to 1.57 ± 1.07 and 0.36 ± 0.25 , respectively, during the summer influenced by internal-wave events. However, vertical flux data of DOC and DON in winter could not be obtained.

Figure 8Plots of statistic correlations between migrant biomass and active carbon fluxes (a), active nitrogen fluxes (b), and active phosphorus fluxes (c).
4.1 Regulation of active C, N, and P fluxes in the NSCS
Both migrant biomass and migratory fluxes of C, N, and P varied with seasons, locations, and oceanic events. Although determined independently, migrant biomass and active CNP fluxes coincidently varied with seasons and oceanic events. As a result, migrant biomass was closely correlated with migratory fluxes of C (r = 0.8343, p < 0.0001), N (r = 0.7800, p < 0.0001), and P (r = 0.8259, p < 0.0001; Fig. 8), indicating the crucial role of migrant biomass in determining the magnitudes of active C, N, and P fluxes. The increase in migrant biomass apparently increased the predation of phytoplankton during the night in the upper layers, which likely enhanced the metabolic and clearance rates of migrators during the daytime in mesopelagic zones because the two rates dominated the magnitudes of active fluxes (Table S1). Moreover, the larger migrators, particularly those of sizes 2–5 mm, appeared to be dominant in transporting C, N, and P into mesopelagic zones (Table 2), which is consistent with the results of Valencia et al. (2018), who reported 2–5 mm migrators as the major group in determining active fluxes at station ALOHA, North Pacific Subtropical Gyre. Steinberg and Landry (2017) compiled the data of migrant biomass and respiratory carbon fluxes collected from various locations in the North Atlantic and Pacific oceans and demonstrated an increase in respiratory carbon fluxes with an increase in migrant biomass (positive correlation). In addition, with an increase in respiratory carbon fluxes, the equivalent fraction of vertical POC fluxes measured by traps from epipelagic zones (100–200 m) also increased. Although the oceanic conditions may influence the community structure, size distribution, and migrant biomass leading to changes in active-flux magnitudes (Valencia et al., 2018), our data indicated that the 2–5 mm class exhibited the highest biomass ratios and migrant biomass in both summer and winter with contrasting oceanic conditions in the NSCS, implying the dominant role of 2–5 mm migrators in determining migratory fluxes in the subtropical–tropical ocean.
The NSCS experiences contrasting atmospheric and oceanic forcings between the winter and summer, including most of the time during spring and fall (Liu et al., 2002; Hung et al., 2020). In general, the upper-ocean stratification progressed from spring to summer (SI, 0.025–0.04 kg m−4) with an increase in temperature and weak southwesterly monsoon winds, after which the stratification began to erode from fall to winter (SI, < 0.01 kg m−4) due to surface-water cooling and the prevailing northeasterly monsoon winds. The subsurface nutrient pumping through the eutrophic base may intensify following the entry into the winter season. Thus, the discrete contents and inventories of nutrients and Chl a in the euphotic zone were considerably higher in winter than in summer in the NSCS, excluding the coastal and shelf zones reported in our previous studies (Hung et al., 2007, 2020; W. Chen et al., 2008; Chen et al., 2014) and in the current experiments. To obtain a complete data set of active fluxes for seasonal comparison, the flux data that could not be collected were derived from the data of Chl a and DIN inventories using appropriate correlations between active carbon fluxes and Chl a inventories (r = 0.9247, p < 0.002; Fig. 5a) and between active carbon fluxes and DIN inventories (r = 0.9641, p < 0.0001; Fig. 5b) constructed from the successfully collected data in the current study. These empirical relationships may also indicate that the active fluxes were driven by the availability of nutrients (DIN) in the euphotic zone, which in turn determined Chl a inventories because of a significant correlation between integrated DIN and integrated Chl a (r = 0.9479, p < 0.0001).
In the northern region, active fluxes were generally higher in winter than in spring and summer, likely due to the increase of nutrient pumping in winter. In addition, the active flux was slightly higher in the region within the anticyclonic eddy (Station 3) than in the region located outside the eddy (Station 4; Fig. 5), as a result of the eddy-enhanced nutrient pumping to the euphotic zone. Although the eddy was a regular anticyclonic eddy with depression of pycnocline, high nutrients and Chl a were detected in the center of eddy in the upper water column. Chen et al. (2015) demonstrated that this warm-core anticyclonic eddy (major axis: 420–430 km; minor axis: 240–260 km) occurring during winter was characterized by a deep mixed layer of up to 140–180 m and the concentration of nitrate and Chl a increased in the top water column (0–200 m), resulting in an increase in primary productivity and new production in seawater containing abundant Synechococcus, coccolithophores, and diatoms. They attributed the biological enhancements to the conditions that the eddy was at its decaying stage and re-incorporating intermittently with an intruding Kuroshio branch or the passage of internal waves to elevate nutrient concentrations. Thus, the nutrient pumping in the euphotic zone appears to be the major driver enhancing the active carbon fluxes in winter and in anticyclonic eddy-driven events. The extremely high active carbon flux that occurred in the internal-wave influencing field near the Dongsha Atoll was also attributed to the strong nutrient uplift caused by the elevation of waves despite the summer season conditions (Hung et al., 2021). At the SEATS station located in the central basin, the active carbon fluxes were not necessarily lower than those found in respective seasons in the northern region, although the lowest fluxes were noted during the fall season (Fig. 6). Similarly, the carbon fluxes were considerably higher in winter than in other seasons at the SEATS station, likely attributable to the abovementioned mechanism.
Data on active nitrogen and phosphorus fluxes in the NSCS are limited. To a first approximation, active nitrogen and phosphorus fluxes were derived from excretory and mortality fluxes; they respectively ranged from 1.06 and 0.13 during fall at SEATS station to 3.21 and 0.40 during spring, 1.77 and 0.33 during summer, 3.51 and 0.57 during the winter-eddy event, and 7.26 and 1.08 during the summer-IWs event. In general, the distribution of active nitrogen and phosphorus fluxes followed the seasonal patterns of active carbon fluxes. The C:N ratios of active fluxes ranged from 6.9 (fall) to 14.2 (winter; mean: 10.6), and the C:P ratio ranged from 55.7 (fall) to 87.7 (winter; mean: 72.9). The C:N and C:P ratios appeared to increase with an increase in active fluxes, likely caused by the increased contribution of respiration and gut fluxes to active fluxes, and the respiration and gut fluxes did not include nitrogen and phosphorus fluxes. Moreover, higher respiration and gut fluxes occurred in winter than in summer. The C:N and C:P ratios of active fluxes were, respectively, higher and lower than the C:N and C:P ratios of particulate vertical fluxes, the major component of passive fluxes.
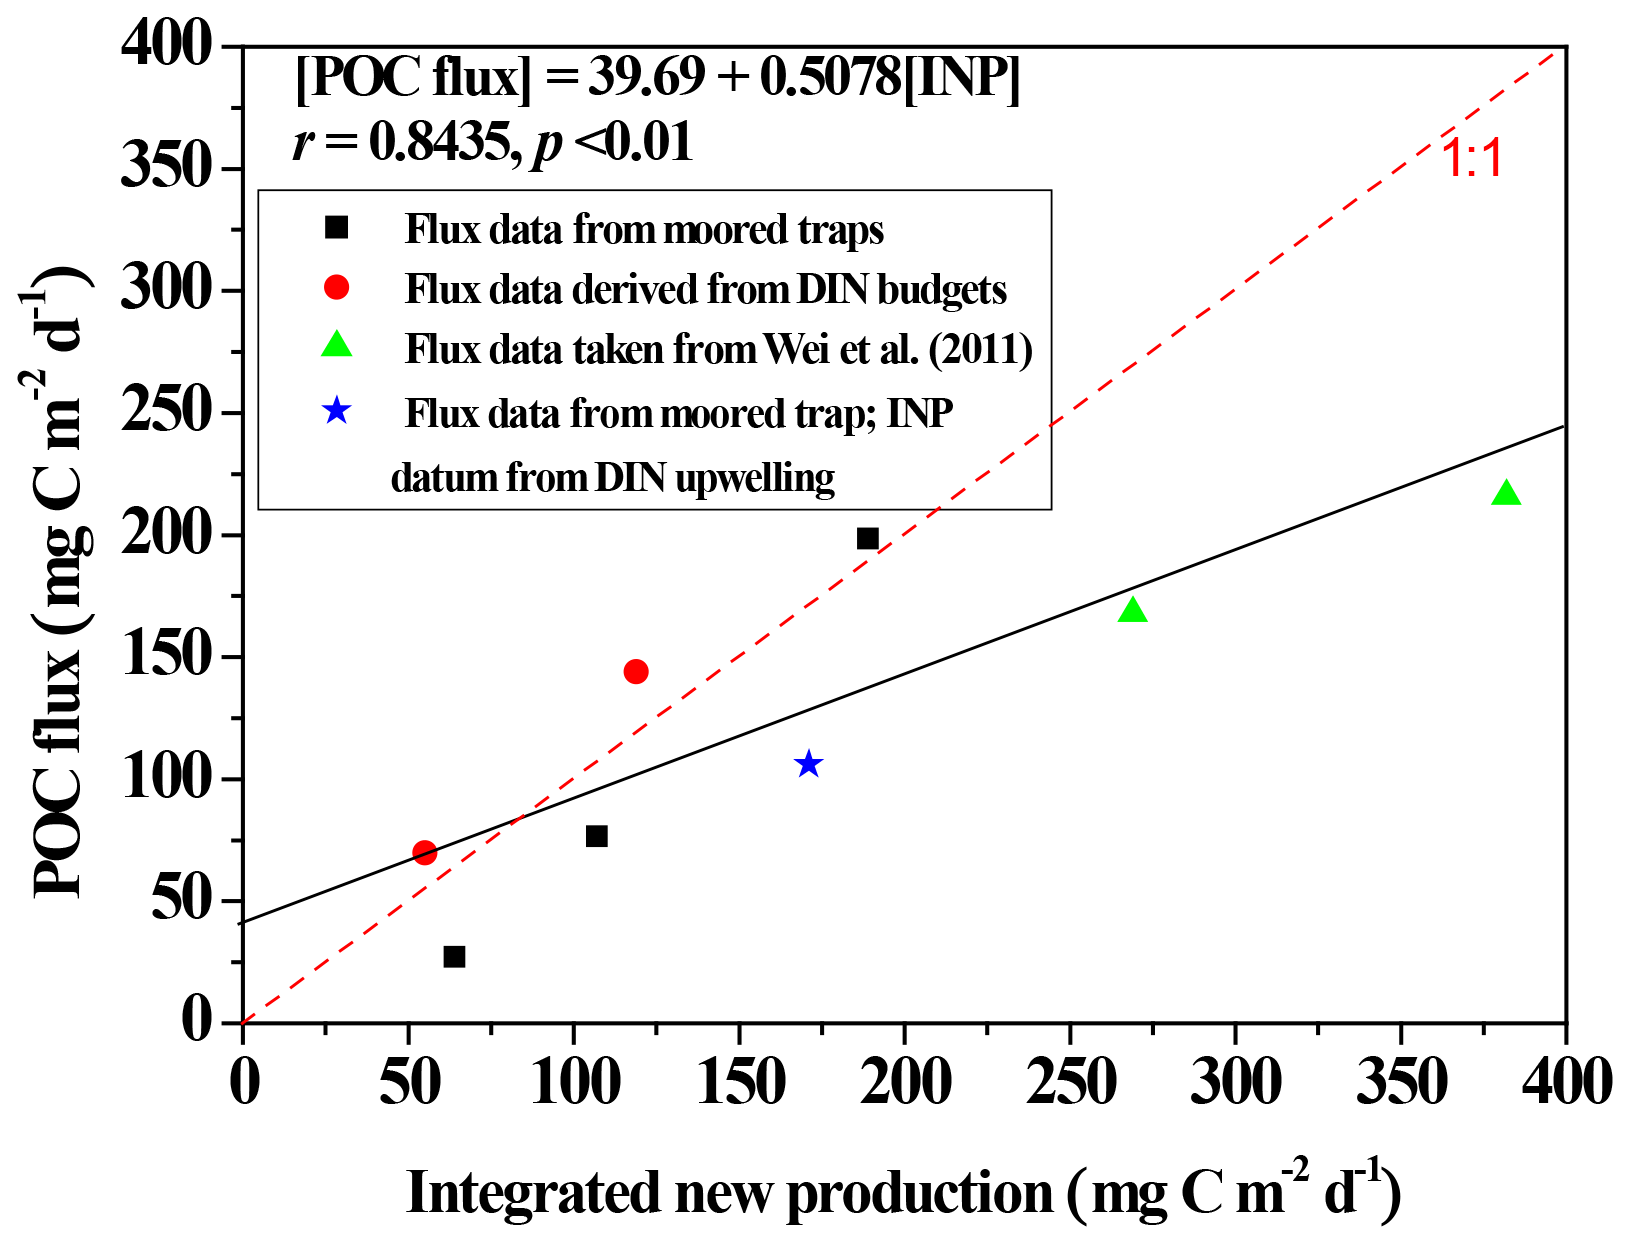
Figure 9Scatter plots depicting the relationship between integrated new production (INP) and POC fluxes through a depth of 100 m at the SEATS station, except for a datum (star symbol) derived from the station near the Dongsha Atoll (Hung et al., 2021). INP data were adapted from Y.-L. Chen et al. (2007, 2008, 2014) except for a datum derived from Hung et al. (2021). Data of POC fluxes through 100–120 m were derived from the moored trap (Tsai, 2007; Hung et al., 2021) and floating traps (Wei et al., 2011), except for two data items derived from DIN budgets (Hung et al., 2007). The solid black line denotes the linear regression (r = 0.8435, p < 0.01, n = 8) between INP and POC fluxes for all presented data.
4.2 Controlling mechanisms of passive fluxes of C, N, and P
Vertical POC fluxes varied with seasons and locations (Fig. 7), likely because of a pronounced difference in hydrographic and biogeochemical conditions between summer and winter. The upper water column has been widely reported to undergo stratification and experience restricted nutrient availability in summer; however, in winter surface stratification was eroded and nutrient availability increased, leading to enhanced primary productivity and new production (Figs. 2 and 4; Chen, 2005; Y.-L. Chen et al., 2008, 2014; Dai et al., 2013; Zhai et al., 2013; Hung et al., 2020). By combining the previous and current measurements, particularly our coauthor's (Yuh-ling Lee Chen) new production data, we found a striking relationship (r = 0.8502, p < 0.02) between integrated new productions and vertical POC fluxes through a depth of 100 m (Fig. 9). Vertical POC fluxes have also been efficiently predicted from primary production (R2 = 0.69–0.97) in various regimes of the ocean (Betzer et al., 1984; Pace et al., 1987). However, Karl et al. (1996) later found an inverse correlation between POC fluxes and primary production during the El Niño–Southern Oscillation (ENSO) period at ALOHA station. Under the oceanographic paradigm, new production is a significant contributor of primary productivity and the export production; therefore, a strong correlation between vertical POC fluxes and new productions is expected. By using this empirical relationship, the data of vertical POC fluxes that could not be collected in this study can be estimated on the basis of the new production data, and the more efficient data set of vertical fluxes can be used for spatial and seasonal comparisons.
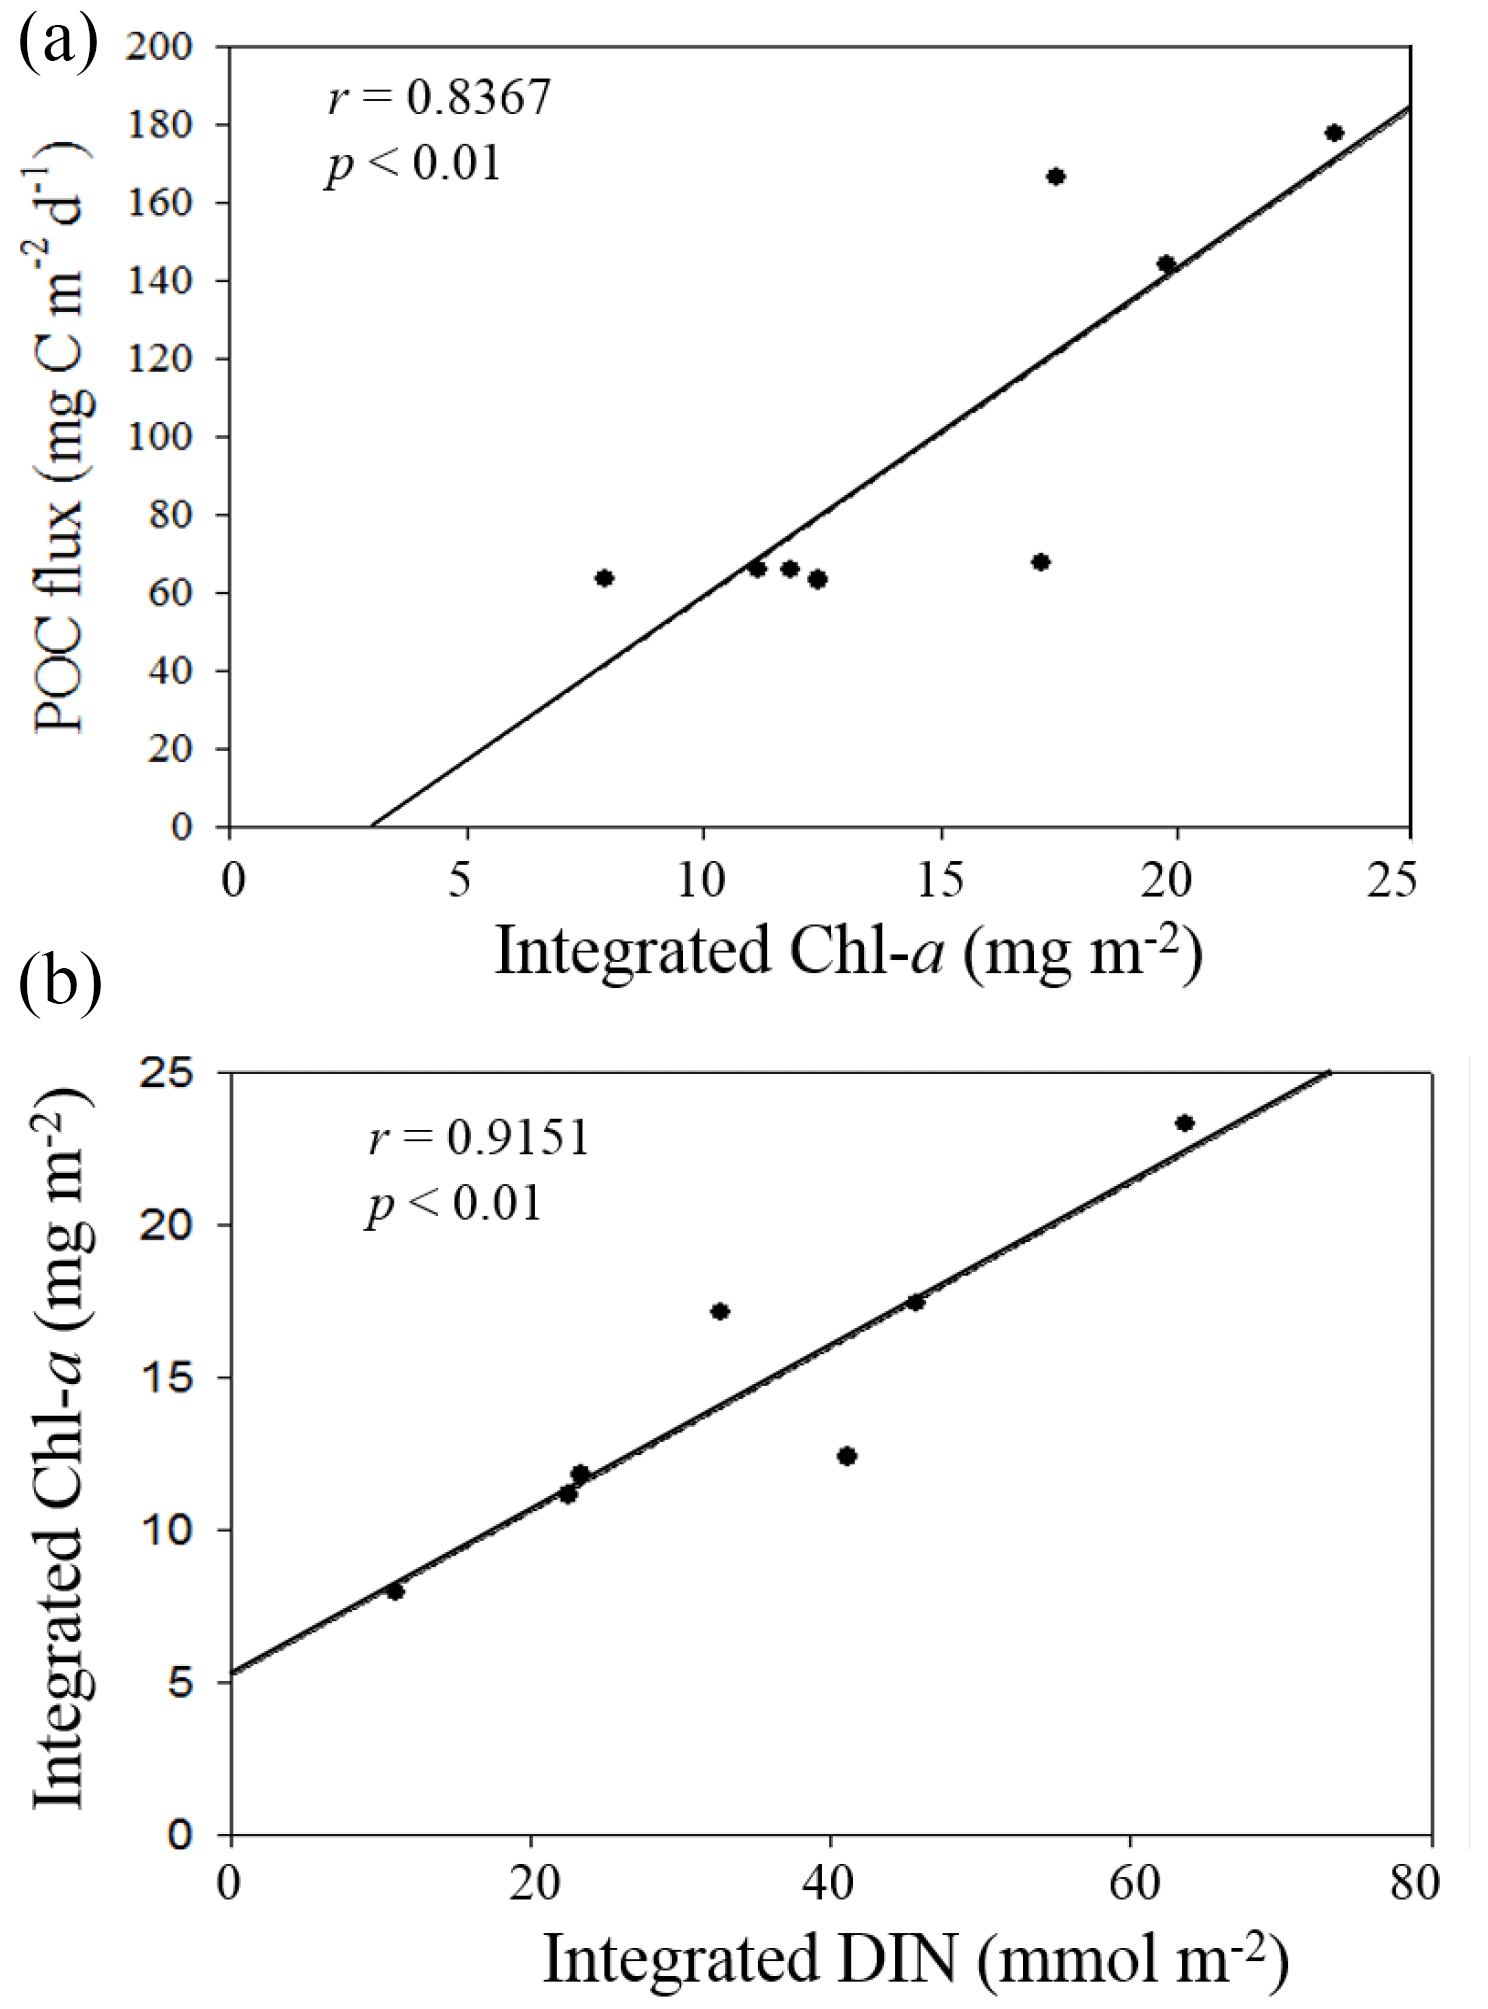
Figure 10Plots of positive correlations between integrated Chl a and vertical POC fluxes (a) and between DIN inventories and Chl a inventories in the euphotic zone (b).
Nutrient availability in the euphotic zone appeared to drive the variability of vertical POC fluxes in the NSCS. Based on previous results that the primary productivity and new production were determined by the availability of nutrients in the euphotic zone of the NSCS (Chen, 2005; Y.-L. Chen et al., 2008, 2014), the vertical POC fluxes through a depth of 100 m should be dependent of nutrient availability, particularly the availability of N + N in the euphotic zone because of the remarkable nitrogen limitation ([N + N] [DIP] ≪ 16) in the NSCS (Y.-L. Chen et al., 2008, 2014; Hung et al., 2020). The nutrient supply and availability were in turn determined mainly by climatic and oceanic forcings (e.g., the winter intensification of wind-driven turbulence and vertical convection). Therefore, vertical POC fluxes were largely determined by integrated Chl a (r = 0.8367, p < 0.01), which was determined by the availability of DIN (r = 0.9151, p < 0.01) derived from the data collected in this experiment (Fig. 10). As a result, vertical POC fluxes were likely to vary with the varying hydrographic and nutrient conditions.
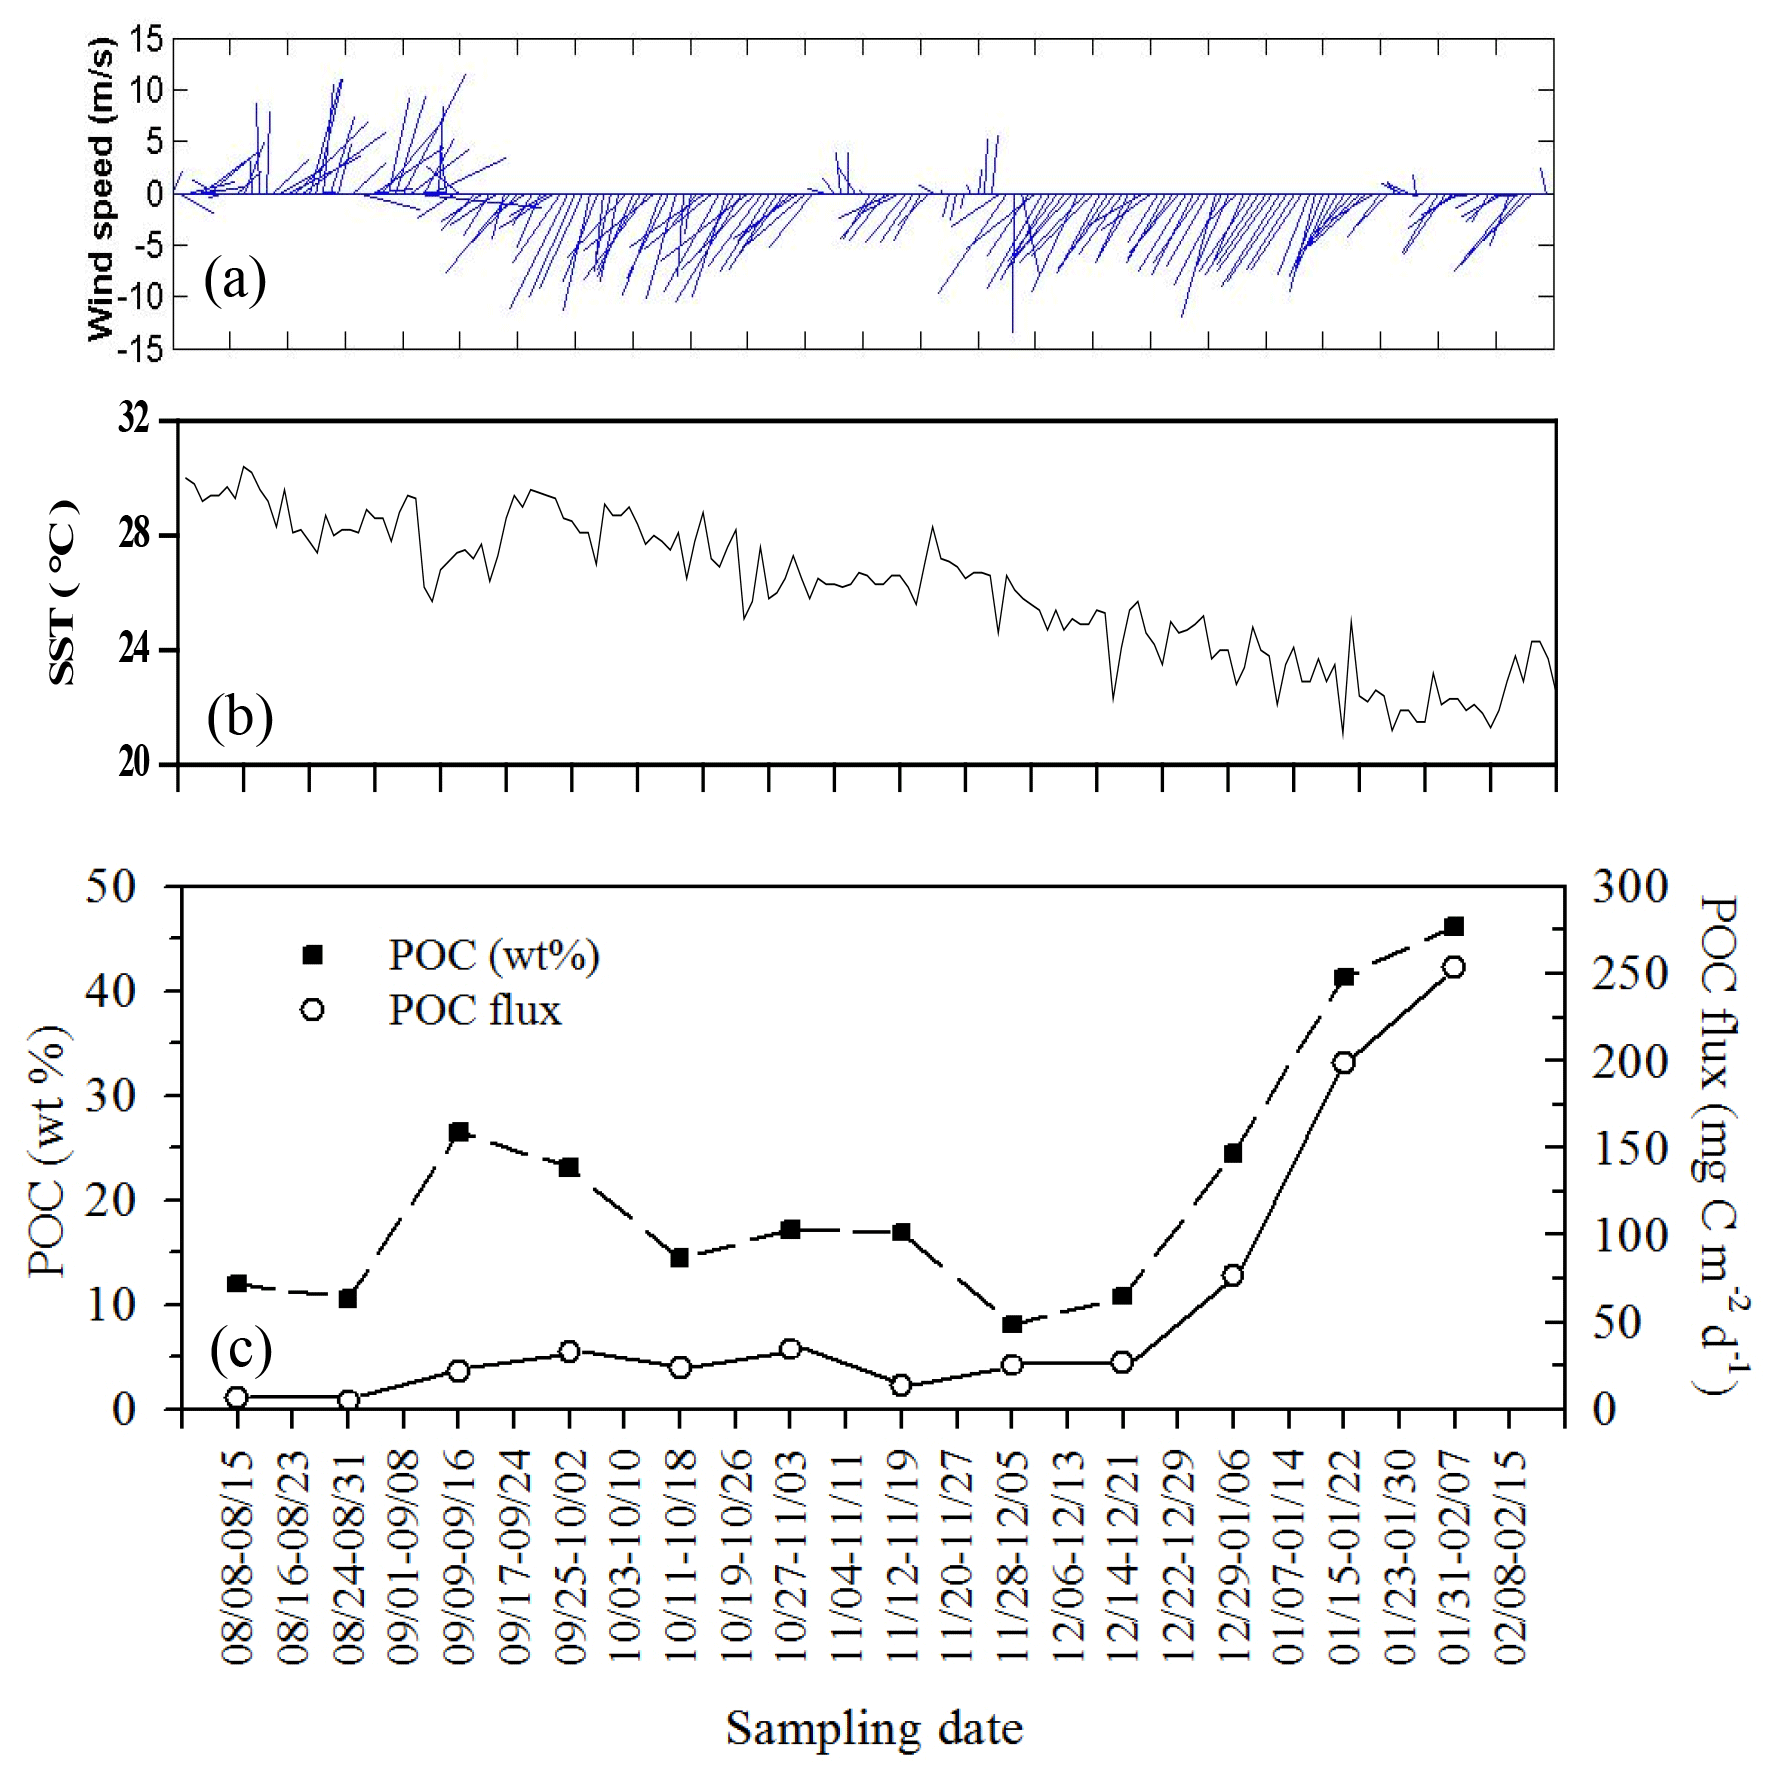
Figure 11Temporal variability of wind speed (a), surface temperature (b), and their corresponding vertical fluxes and weight (%) of POC (c) during the period the trap was moored (from summer to winter: 8 August 2004–15 February 2005) at a depth of 120 m on the site (18∘19.661′ N, 115∘44.103′ E) close to the SEATS station. All data were adapted from unpublished data in Tsai's thesis (Tsai, 2007).
By combing the experimental and estimated data, we found that the seasonal, geographic, and ocean events affect the vertical POC fluxes (Fig. 7). Vertical POC fluxes were higher in winter than in other seasons in both the northern region and central basin (SEATS). The flux was also slightly higher in the case influenced by an anticyclonic eddy than the one unaffected by an eddy in winter in the northern region, caused mainly by nutrient elevation similar to the mechanisms responsible for the increase in active fluxes. Zhou et al. (2020) reported the eddy evolution in determining the enhanced states of POC and opal fluxes in the western SCS and attributed the difference in flux enhancement to the eddy's stage and sampling location within the eddy. They suggested that eddies may contribute < 4 % of the net POC flux in the entire SCS basin. This value may be a conservative estimate because nearly half of eddies that occurred in the SCS were anticyclonic eddies that were previously regarded as processes in decreasing POC fluxes (Xiu et al., 2010; He et al., 2019). However, our data and the previous report (Shih et al., 2015) suggest that anticyclonic eddies can enhance POC vertical fluxes in the NSCS and western North Pacific Ocean. An exception to this pattern in POC fluxes occurred in summer; the POC fluxes were expected to be low but were highly elevated due to the impact of the shoaling of internal waves. Although POC fluxes were largely estimated using empirical relationships between POC fluxes and integrated new production and Chl a, the overall data indicated that the highest POC fluxes were noted in winter, followed by summer and fall. Notably, for vertical POC fluxes through a depth of 120 m collected sequentially by moored traps covering summer and winter periods, extremely low POC fluxes were observed in summer and fall but extremely high POC fluxes were observed in winter (Fig. 11c). The exceptionally high POC fluxes in winter may be caused by the more effective trapping in catching pulsed winter blooming through the sequential and continuous collection by traps with larger trapping area (TECNICAP P.P.S. 3/3) than that through the short-term (1–3 d) collection with floating traps with smaller trapping areas in each event. The highest POC fluxes correspond to the highest POC contents (wt. %) in settling mass (Fig. 11c), indicating major biological origins of the total settling materials (%POM = %POC ⋅ 2) in winter. The highest POC fluxes were also attributable to the prevailing northeast monsoon wind (Fig. 11a) and lowest surface temperature (Fig. 11b), which enhanced surface mixing and nutrient pumping.
Vertical PN and POP fluxes were relatively incomplete compared with POC fluxes that elucidated the seasonal and geographic variations because of the lack of predicted data for evaluation. However, PN and POP fluxes at a depth of 100 m followed generally with POC-flux patterns, showing the highest values (21.2 ± 1.68 ; 1.79 ± 0.19 ) in the summer internal-wave event and lowest values (12.1 ± 0.47 ; 0.93 ± 0.04 ) in the typical summer season. The POC:PN ratios ranged from 5.65 ± 0.20 at a depth of 50 m to 8.56 ± 0.20 at a depth of 150 m, which is not quite different from the Redfield ratio (6.6). The POC:POP ratios ranged from 152 ± 1.57 at a depth of 50 m to 243 ± 15.3 at a depth of 150 m, which is higher than the Redfield ratio (106) and may reflect the dominant distribution of small-size phytoplankton (Y.-L. Chen et al., 2008, 2014). The C:N and C:P ratios generally increased from a depth of 50 m to a depth of 150 m, implying the preferential decay of POP and PN over POC.
Vertical fluxes of DOC and DON through a depth of 100 m were relatively low compared with POC and PON fluxes because of the small vertical gradient of concentrations in surface waters. Vertical DOP fluxes were negligible because of the insignificant concentration gradient. Despite the lack of winter data, DOC and DON fluxes were expected to increase from summer to winter because of the summer surface accumulation caused by stratification and the increase in downward fluxes in winter due to the erosion of stratification.
Table 4Summary and comparison of estimated active, passive (flux at a depth of 100 m), and total vertical fluxes of carbon, nitrogen, and phosphorus in NSCS and other oceans.
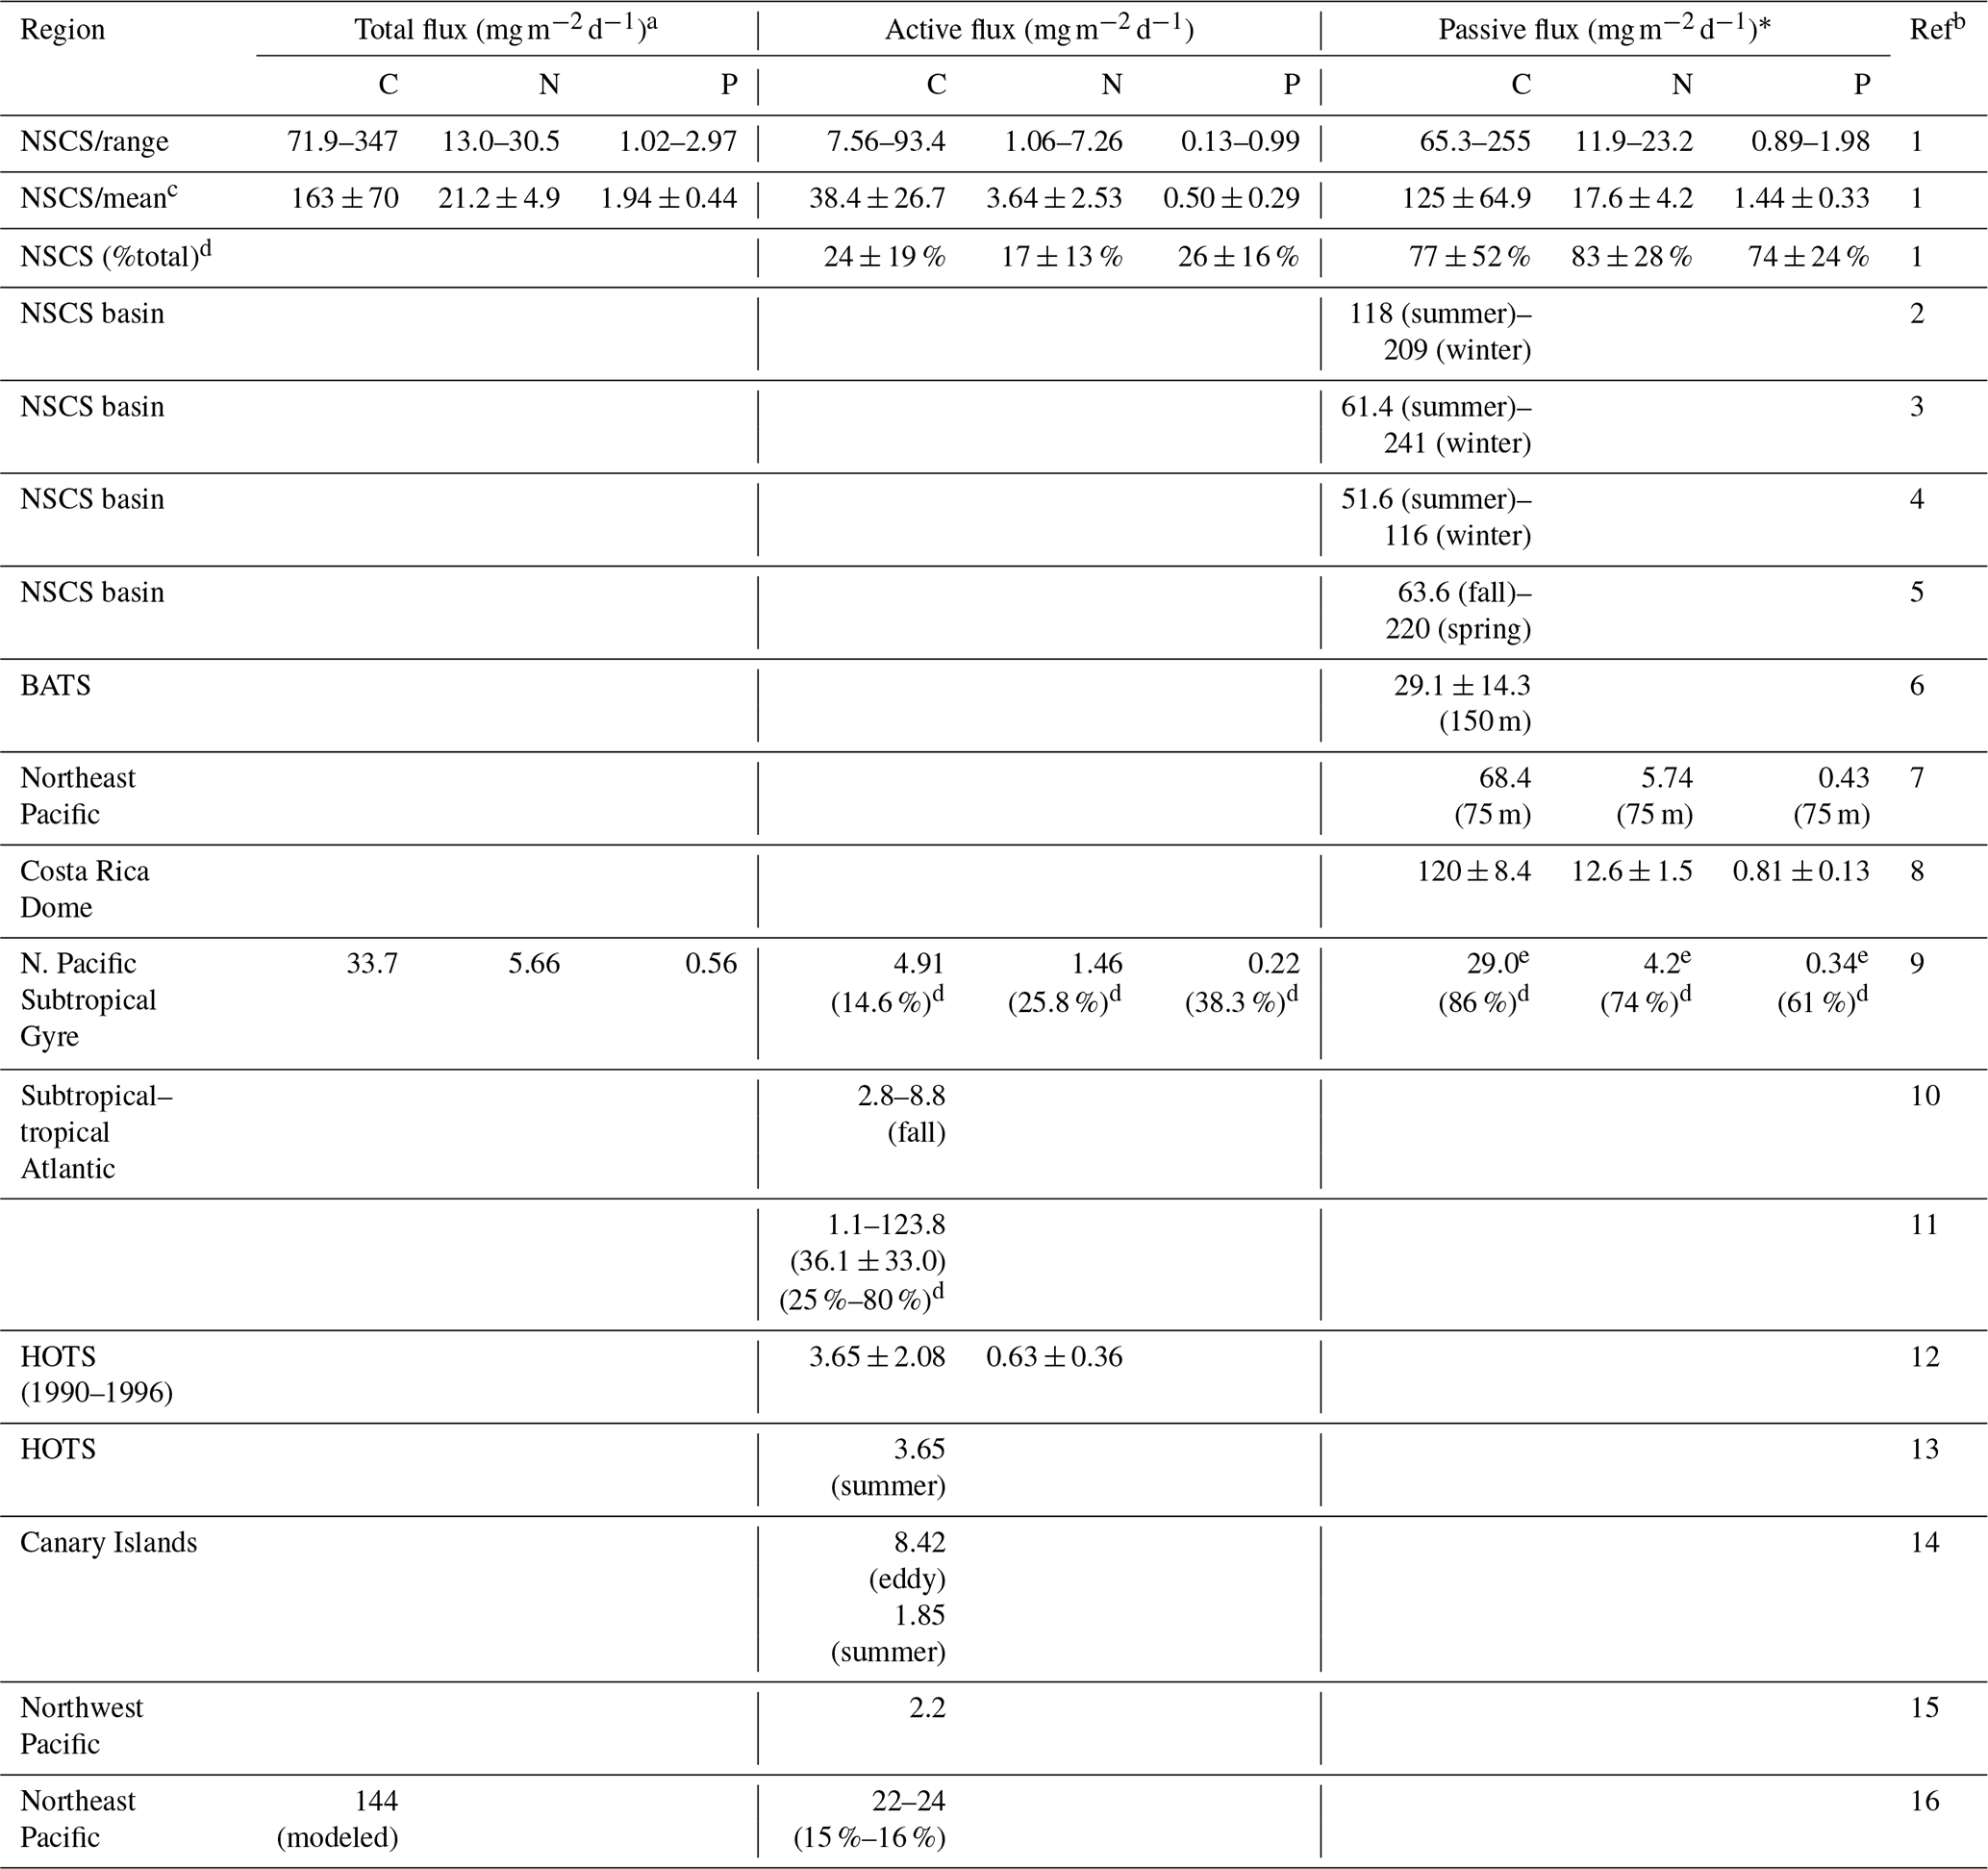
a Total flux = (active flux) + (passive flux). * Passive flux = (POC flux) + (DOC flux). b Ref (reference): 1 (this study); 2 (Ho et al., 2010); 3 (Wei et al., 2011); 4 (Cai et al., 2015); 5 (W. Chen et al., 2008); 6 (Helmke et al., 2010); 7 (Knauer et al., 1979); 8 (Stukel et al., 2016); 9 (Hannides et al., 2009); 10 (Longhurst et al.,1990); 11 (Hernández-León et al., 2019); 12 (Al-Mutairi and Landry, 2001); 13 (Steinberg et al., 2008); 14 (Yebra et al., 2005); 15 (Kobari et al., 2013); 16 (Davison et al., 2013). c Mean: mean ± standard deviation. d %: the percentage (fraction) of total flux. e 29.0: the value reported at 150 m.
4.3 Ocean-wide comparisons of active fluxes, passive fluxes, and total vertical fluxes
Overall, the active fluxes of C, N, and P were 7.56–93.4 (mean ± SD, 38.4 ± 26.7) , 1.06–7.26 (3.64 ± 2.53) , and 0.13–0.99 (0.50 ± 0.29) in the NSCS (Table 4). Although most previous reports lacked data on active N and P fluxes, our magnitudes of active fluxes of C, N, and P were considerably higher than those reported in the North Pacific Subtropical Gyre (Hannides et al., 2009; Table 4), HOTS station (Al-Mutairi and Landry, 2001; Steinberg et al., 2008; Table 4), Canary Islands (Yebra et al., 2005; Table 4), subtropical–tropical Atlantic (Longhurst, 1990; Table 4), Northeast Pacific (Davison et al. 2013; Table 4), and Northwest Pacific (Kobari et al., 2013; Table 4). The relatively low reported values may be attributed to two reasons, the different ocean regimes and conditions and the other active fluxes derived only from respiratory flux. The most comparable active carbon flux was reported by Hernández-León et al. (2019) with the total active flux (36.1 ± 33.0 ; Table 4) derived from the respiratory, gut, excretory, and mortality fluxes in the subtropical–tropical Atlantic. These data are very close to our estimated active C fluxes, which is likely because of the same estimation method used.
It is worth noting that the estimates of active flux and associated uncertainty were derived mainly from oligotrophic regions even though two shallow stations off the Dongsha Atoll were included in this study. The uncertainty of flux was mainly associated with the spatial and seasonal (including extreme events) variability in the NSCS. As active fluxes and passive fluxes may increase toward mesotrophic and eutrophic domains (Steinberg and Landry, 2017; Yebra et al., 2018; Hernández-León et al., 2019), these estimates (mean ± SD) may be regarded as the lower-bound fluxes under the state that the oligotrophic domain dominates the entire region of SCS. There was an interesting report suggesting that the lateral migration of fish played an important role on determining DVM transport across the slope of NSCS (Wang et al., 2019). The impact of this issue on active fluxes is unknown in the oligotrophic ocean, but this scenario warrants further study.
Because of the small contributions of DOC and DON fluxes to passive fluxes, our passive fluxes can be compared directly with previous vertical fluxes of POC. The range and mean values of our data are comparable with those recorded in the same oceanic regime (most from the SEATS station) during various periods (W. Chen, et al., 2008; Ho et al., 2010; Wei et al., 2011; Cai et al., 2015; Table 4), although the passive fluxes of N and P have not been recorded. Our data are strikingly close to the fluxes of C, N, and P reported from the Costa Rica Dome upwelling system (Stukel et al., 2016; Table 4). However, our data are apparently higher than those reported from the Northeast Pacific (Knauer et al., 1979; Table 4), BATS station (Helmke et al., 2010; Table 4), and North Pacific Subtropical Gyre (Hannides et al., 2009; Table 4). This may imply that the NSCS was more effective than the open Atlantic and Pacific oceans in mediating POC transfer from the surface to the interior of the ocean.
The total export of carbon from the surface into the interior of the ocean in the South China Sea (3.5 × 10⁶km2) may be extrapolated from the total C fluxes measured in the NSCS. To a first approximation, the total export was preliminarily projected to be 0.208 ± 0.089 Gt C yr−1 [(163 ± 70 ) ⋅ (3.5 × 10⁶ km2) ⋅ (365 d yr−1)], which is approximately 1.89 ± 0.81 % of the global annual flux (11 Gt C yr−1) reported by Sanders et al. (2014). Although this value is about twice as large as the ratio of ocean area (SCS/global ocean = 0.97 %), the ratio of carbon transfer (1.89 ± 0.81 %) is expected to change if more data in total C flux are available for the SCS. Nevertheless, the annual C flux was higher than the value reported from the North Atlantic (0.55–1.94 Gt C yr−1; Sanders et al., 2014) if the area of the SCS was normalized to that of the North Atlantic (43.45 × 10⁶ km2); thus, the SCS, as the largest marginal sea, may play a more efficient role than open oceans in the transfer of atmospheric CO2 into deep layers.
4.4 Relative contributions of active fluxes and passive fluxes to total vertical fluxes
Contributions of active fluxes of C, N, and P to total vertical fluxes of C, N, and P accounted for 24 ± 19 %, 17 ± 13 %, and 26 ± 16 %, respectively (Table 4). Despite the limited data available for other oceans, in our study, the magnitude of the contribution of active C flux was higher, but those of contributions of active N and P fluxes were lower than the corresponding findings by Hannides et al. (2009) in the North Pacific Subtropical Gyre (Table 4). However, the magnitude of the contribution of active C flux in our study was apparently lower than the range reported by Hernández-León et al. (2019; 36.1 ± 33.0 %, Table 4) in the subtropical–tropical Atlantic. Hernández-León et al. (2020) also predicted a global supply of 0.44 Pg C yr−1 transported by zooplankton into the bathypelagic ocean, comparable to the range of passive carbon export. They argued that the active flux may account for about 25 % of total flux in oligotrophic zones but can reach about 80 % of total flux in meso- and eutrophic zones (Hernández-León et al., 2020). The lowest range (15 %–16 %) was reported by Davison et al. (2013; Table 4) in the Northeast Pacific, although their total vertical C flux was estimated from modeled net primary production. Our passive fluxes of C, N, and P contributed dominantly to total vertical fluxes of C, N, and P accounting for 77 ± 52 %, 83 ± 28 %, and 74 ± 24 %, respectively (Table 4). Overall, the range of difference in the proportions of total vertical fluxes was reasonable, which may imply that our findings are reliable. The C:N and C:P ratios in the total vertical flux were 7.69 and 84.0, respectively, indicating higher C and P enrichment compared with the Redfield ratio. This may be attributed to the more pronounced enrichment in C and P in active fluxes (C:N = 10.4; C:P = 75.8) because the ratios are closer to the Redfield ratio in passive fluxes (C:N = 7.1; C:P = 86.8) than in active fluxes. DVM-mediated transport may play a crucial role in the transfer of P from the surface to the mesopelagic zone.
To understand the strength of carbon removal from the surface to the interior of the ocean, the study of active and passive fluxes is essential. Elucidating the total vertical fluxes of C, N, and P in the SCS is a high research priority not only because of the limited existing data in the SCS but also for increasing the knowledge of the total-flux responses to changing tropical oceans. Overall, the collected and estimated data indicated that the passive fluxes of C, N, and P were seasonally variable and particularly higher in winter than in other seasons in the NSCS. The strengths of passive fluxes were estimated as 65.3–255 (125 ± 64.9) , 11.9–23.2 (17.6 ± 4.2) , and 0.89–1.98 (1.44 ± 0.33) , of which the fluxes of DOC, DON, and DOP accounted for generally less than 5 %. Active fluxes varied largely in coincidence with the seasonal variations of passive fluxes, ranging from 7.56 to 93.4 (38.4 ± 26.7) , from 1.06 to 7.26 (3.64 ± 2.53) , and from 0.13 to 0.99 (0.50 ± 0.29) in the NSCS. They usually account for less than one-third of the total vertical fluxes. Both active and passive fluxes exhibited contrasting patterns between summer and winter, resulting mainly from surface warming and stratification in summer and cooling and wind-induced turbulence in pumping nutrients into the euphotic zone in winter. The increase in nutrient availability appeared to increase the primary and secondary production in tropical winter when the temperature remained sufficiently high for biological activity. In addition, the impact of anticyclonic eddy and internal-wave events on enhancing active and passive fluxes was pronounced in the NSCS. Overall, the active and passive fluxes were driven by nutrient availability within the euphotic layer, which was ultimately controlled by the change in internal and external forcings. To a first approximation, the SCS may effectively transfer 0.208 ± 0.089 Gt C yr−1 into the ocean's interior, accounting for approximately 1.89 ± 0.81 % of the global C flux.
The data published in this contribution are largely included in this article and its Supplement. Additional data can be obtained through email request to the corresponding author.
The supplement related to this article is available online at: https://doi.org/10.5194/bg-18-5141-2021-supplement.
In this work, JJH planned and conducted the experiments and wrote the article; CHT, ZYL, SHP, LST, and YHL performed experiments including collection and analyses of hydrographic and biological pump data; YLLC performed new-production experiments and supervision.
The authors declare that they have no conflict of interest.
Publisher's note: Copernicus Publications remains neutral with regard to jurisdictional claims in published maps and institutional affiliations.
The authors would like to thank Mei-Heui Huang, Hiao-Dan Huang, and Yi-Ting Yeh for their assistance in sampling and analyses.
This research has been supported by the Ministry of Science and Technology, Taiwan (grant nos. MOST 107-2621-M-110-022, MOST 108-2621-M-110-015, and MOST 109-2621-M-110-008), and the Aim for the Top University Plan of the National Sun Yat-sen University and Ministry of Education, Taiwan, ROC (grant no. 06C030203).
This paper was edited by Yuan Shen and reviewed by three anonymous referees.
Alford, M. H., Peacock, T. M., Mackinnon, J. A., et al.: The formation and fate internal waves in the South China Sea, Nature, 521, 65–69, 2015.
Al-Mutairi, H. and Landry, M. R.: Active export of carbon and nitrogen at Station ALOHA by diel migrant zooplankton, Deep-Sea Res. Pt. II, 48, 2083–2103, 2001.
Archibald, K. M., Siegel, D. A., and Doney, S. C.: Modeling the impact of zooplankton diel vertical migration on the carbon export flux of the biological pump, Global Biogeochem. Cy., 33, 181–199, https://doi.org/10.1029/2018GB005983, 2019.
Aspila, K. I., Agemian, H., and Chau, A. S. Y.: A semiautomated method for determination of inorganic,organic and total phosphate in sediments, Analyst, 101, 187–197, 1976.
Avril, B.: DOC dynamics in the northwestern Mediterranean Sea (DYFAMED site), Deep-Sea Res. Pt. II, 49, 2163–2182, 2002.
Baetge, N., Graff, J. R., Behrenfeld, M. J., and Carlson, C.: Net community production, dissolved organic carbon accumulation, and vertical export in the Western North Atlantic, Front. Mar. Sci., 7, 227, https://doi.org/10.3389/fmars.2020.00227, 2020.
Baltar, F., Arístegui, J., Gasol, J. M., Sintes, E., and Herndl, G. J.: Evidence of prokaryotic metabolism on suspended particulate organic matter in the dark waters of the subtropical North Atlantic, Limnol. Oceanogr., 54, 182–193, 2009.
Berelson, W. M.: The flux of particulate organic carbon into the ocean interior: a comparison of four U.S. JGOFS regional studies, Oceanography, 14, 59–67, 2001.
Betzer, P. R., Showers, W. J., Laws, E. A., Winn, C. D., Ditullio, G. R., and Kroopnick, P. M.: Primary productivity and particle fluxes on a transect of the equator at 153∘ W in the Pacific Ocean, Deep-Sea Res. Pt. A, 31, 1–11, 1984.
Bianchi, D., Stock, C., Galbraith, E. D., and Sarmiento, J. L.: Diel vertical migration: Ecological controls and impacts on the biological pump in a one-dimensional ocean model, Global Biogeochem. Cy., 27, 478–491, https://doi.org/10.1002/gbc.20031, 2013.
Boyd, P. W. and Trull, T. W.: Understanding the export of biogenic particles in oceanic waters: Is there consensus?, Prog. Oceanogr., 72 276–312, 2007.
Boyd, P. W., Claustre, H., Levy, M., Siegel, D. A., and Weber, T.: Multi-faceted particle pumps drive carbon sequestration in the ocean, Nature, 568, 327–335, https://doi.org/10.1038/s41586-019-1098-2, 2019.
Buesseler, K. O., Lamborg, C. H., Boyd, P. W., lam, P. J., Trull, T. W., Bidigare, R. R., Bishop, J. K. B., Casciotti, K. L., Dehairs, F., Elskens, M., Honda, M., Karl, D. M., Siegel, D. A., silver, M. W., Steinberg, D. K., Valdes, J., Van Mooy, B., and Wilson, S.: Revisiting carbon flux through the ocean's twilight zone, Science, 316, 567–570, 2007.
Buesseler, K. O., Pike, S., Maiti, K., Lamborg, C. H., Siegel, D. A., and Trull, T. W.: Thorium-234 as a tracer of spatial, temporal and vertical variability in particle flux in the North Pacific, Deep-Sea Res. Pt. I, 56, 1143–1167, 2009.
Burd, A. B., Hansell, D. A., Steinberg, D. K., Anderson, T. R., and Aristegui, J.: Assessing the apparent imbalance between geochemical and biochemical indicators of meso- and bathypelagic biological activity: What the @$#! is wrong with present calculations of carbon budgets?, Deep-Sea Res. Pt. II, 57, 1557–1571, 2010.
Cai, P., Zhao, D., Wang, L., Huang, B., and Dai, M.: Role of particle stock and phytoplankton community structure in regulating particulate organic carbon export in a large marginal sea, J. Geophys. Res.-Oceans, 120, 2063–2095, 2015.
Cavan, E. L., Laurenceau-Cornec, E. C., Bressac, M., and Boyd, P. W.: Exploring the ecology of the mesopelagic biological pump, Prog. Oceanogr., 176, 102125, https://doi.org/10.1016/j.pocean.2019.102125, 2019.
Chen, C.-T. A. and Borges, A. V.: Reconciling opposing views on carbon cycling in the coastal ocean: Continental shelves as sinks and near-shore ecosystems as sources of atmospheric CO2, Deep-Sea Res. Pt. II, 56, 578–590, 2009.
Chen, W., Cai, P., Dai, M., and Wei, J.: disequilibrium and particulate organic carbon export in the northern South China Sea, J. Oceanogr., 64, 417–428, 2008.
Chen, Y.-L., Chen, H.-Y., Tuo, S.-H., and Ohki, K.: Seasonal dynamics of new production from Trichodesium N2 fixation and nitrate uptake in the upstream Kuroshio and South China Sea basin, Limnol. Oceanogr., 53, 1705–1721, 2008.
Chen, Y.-L., Chen, H.-.Y., Lin, Y.-.H., Yong, T.-C., Taniuchi, Y., and Tuo, S.: The relative contributions of unicellular and filamentous diazotrophs to N2 fixation in the South China Sea and the upstream Kuroshio, Deep-Sea Res. Pt. I, 85, 56–71, 2014.
Chen, Y.-L, Chen, H.-Y., Jan, S., Lin, Y.-H., Kuo, T.-H., and Hung, J.-J.: Biologically active warm-core anticyclonic eddies in the marginal seas of the western Pacific Ocean, Deep-Sea Res. Pt. I, 106, 68–84, 2015.
Chen, Y.-L. L.: Spatial and seasonal variations of nitrate-based new production and primary production in the South China Sea, Deep-Sea Res. Pt. I, 52, 319–340, 2005.
Chen, Y.-L. L., Chen, H.-Y., Lin, I-I, Lee, M.-A., and Chang, J.: Effects of cold eddy on phytoplankton production and assemblages in Luzon Strait boarding the South China Sea, J. Oceanogr., 63, 671–683, 2007.
Chung, Y. C. and Hung, G. W.: Particulate fluxes and transports on the slope between the southern East China Sea and the South Okinawa Trough, Cont. Shelf Res., 20, 571–597, 2000.
Copin-Montégut, G. and Avril, B.: Vertical distributions and temporal variation of dissolved organic carbon in the North Western Mediterranean Sea, Deep-Sea Res. Pt. I, 40, 1963–1972, 1993.
Dagg, M. J. and Wyman, K. D.: Natural ingestion rates of the copepods Neocalanus plumchrus and N. cristatus calculated from gut contents, Mar. Ecol. Prog. Ser., 13, 37–46, 1983.
Dai, M. H., Cao, Z. M., Guo, X. H., Zhai, W. D., Liu, Z. Y., Yin, Z. Q., Xu, Y. Y., Gan, J. P., Hu, J. Y., and Du, C. J.: Why are some marginal seas sources of atmospheric CO2?, Geophy. Res. Lett., 40, 2154–2158, https://doi.org/10.1002/grl.50390, 2013.
Dam, H. G. and Peterson, W. T.: The effect of temperature on the clearance rates constant of planktonic copepods, J. Exp. Mar. Biol. Ecol., 123, 1–14, 1988.
Dam, H. G. and Peterson, W. T.: Seasonal contrasts in the die1 vertical distribution, feeding behavior, and grazing impact of the copepod Temora Zongicornis in Long Island Sound, J. Mar. Res., 51, 561–594, 1993.
Dam, H. G., Roman, M. R., and Youngbluth, M. J.: Downward export of respiratory by diel-migrant mesozooplankton at the JGOFS Bermuda time-series station, Deep-Sea Res. Pt. I, 42, 1187–1197, 1995.
Davison, P. C., Checkley, D. M., Koslow, J. A., and Barlow, J.: Carbon export mediated by mesopelagic fishes in the northeast Pacific Ocean, Prog. Oceanogr., 116, 14–30, 2013.
DeVaries, T., Primeau, F., and Deutsch, C.: The sequestration efficiency of biological pump, Geophy. Res. Lett., 39, L13601, https://doi.org/10.1029/2012GL051963, 2012.
Doval, M. D., Álverez-Salgado, X. A., and Pérez, F. F.: Organic matter distributions in the Eastern North Atlantic–Azores Front region, J. Marine Syst., 30, 33–49, 2001.
Ducklow, H. W., Steinberg, D. K., and Buesseler, K. O.: Upper Ocean Carbon Export and the biological pump, Oceanography, 14, 50–58, 2001.
Falkowski, P. G., Barber, R. T., and Smetacek, V.: Biogeochemical controls and feedbacks on ocean primary production, Science, 281, 200–206, 1998.
Feely, R. A., Sarbine, C. L., Takahashi, T. and Wanninkhof, R.: Uptake and storage of carbon dioxide in the ocean: the global CO2 survey, Oceanography, 14, 18–32, 2001.
Gardner, W. D.: Sediment trap technology and surface sampling in surfacewaters, in: The Changing Ocean Carbon Cycle, a Midterm Synthesis of the Joint Global Ocean Flux Study, edited by: Hanson, R. B., Ducklow, H. W., and Field, J. G., Cambridge University Press, Cambridge, UK, 2000.
Garside, C.: A chemiluminescent technique for the determination of nanomolar concentrations of nitrate and nitrite in seawater, Mar. Chem., 11, 159–167, 1982.
Gismervik, I.: Stoichiometry of some marine planktonic crustaceans, J. Plankton Res., 19, 279–285, 1997.
Gordon, D. C.: Some studies of the distribution and composition of particulate organic carbon in the North Atlantic Ocean, Deep-Sea Res., 17, 233–243, 1970.
Grasshoff, K., Ehrhardt, M., and Kremling, K.: Methods of Seawater Analysis, Verlag Chimie, Weinheim, 143–187, 1983.
Guidi, L., Legendre, L., Reygondeau, G., Uitz, J., Stemmann, L., and Henson, S. A.: A new look at ocean carbon remineralization for estimating deep-water sequestration, Global Biogeochem. Cy., 29, 1044–1059, https://doi.org/10.1002/2014gb005063, 2015.
Hannides, C. C. S., Landry, M. R., Benitez-Nelson, C. R., Styles, R. M., Montoya, J. P., and Karl, D. M.: Export stoichiometry and migrant-mediated flux of phosphorus in the North Pacific Subtropical Gyre, Deep-Sea Res. Pt. I, 56, 73–88, 2009.
Hansell, D. A. and Carlson, C. A.: Deep Ocean gradients in dissolved organic carbon concentrations, Nature, 395, 263–266, 1988.
Hansell, D. A. and Carlson, C. A.: Biogeochemistry of total organic carbon and nitrogen in the Sagasso Sea: control by convective overturn, Deep-Sea Res. Pt. II, 48, 1649–1667, 2001.
Hayward, T. L.: Spatial and temporal feeding patterns of copepods from the North Pacific Central Gyre, Mar. Biol., 58, 295–309, 1980.
He, Q., Zhan, H., Xu, J., and Cai, S.: Eddy-induced chlorophyll anomalies in the western South China Sea, J. Geophys. Res.-Oceans, 9487–9506, https://doi.org/10.1029/2019JC015371, 2019.
Helmke, P., Neuer, S., Lomas, M. W., Conte, M., and Freudenthal, T.: Cross-basin difference in particulate organic carbon export and flux attenuation in the subtropical North Atlantic gyre, Deep-Sea Res. Pt. I, 57, 213–223, 2010.
Hernández-León, S., Olivar, M. P., Fernández de Puelles, M. L., Bode, A., Castellón, A., López-Pérez, C., Tuset, V. M., and González-Gordillo, J. I.: Zooplankton and micronekton active flux across the tropical and subtropical Atlantic Ocean, Front. Mar. Sci., 6, 535, https://doi.org/10.3389/fmars.2019.00535, 2019.
Hernández-León, S., Koppelmann, R., Fraile-Nuez, E., Bode, A., Mompeán, C., Irigoien, X., Olivar, M. P., Echevarría, F., Fernández de Puelles, M. L., González-Gordillo, J. I., Cózar, A., Acuña, J. L., Agustí, and Duarte, C. M.: Large deep-sea zooplankton biomass mirrors primary production in the global ocean, Nat. Commun., 11, 6048, https://doi.org/10.1038/s41467-020-19875-7, 2020.
Hidaka, K., Kawaguchi, K., Murakami, M., and Takahashi, M.: Downward transport of organic carbon by diel migratory micronekton in the western equatorial Pacific: its quantitative and qualitative importance, Deep-Sea Res. Pt. I, 48, 1923–1939, 2001.
Ho, T.-Y., Chou, W.-C., Wei, C.-L., Lin, F.-J., Wong, G. T. F., and Lin, H.-L.: Trace metal cycling in the surface water of the South China Sea: Vertical fluxes, composition, and sources, Limnol. Oceanogr., 55, 1807–1820, 2010.
Honjo, S., Manganini, S. J., Krishfield, R. A., and Francois, R.: Particulate organic carbon fluxes to the ocean interior and factors controlling the biological pump: a synthesis of global sediment trap programs since 1983, Prog. Oceanogr., 76, 217–285, https://doi.org/10.1016/j.pocean.2007.11.003, 2008.
Hu, J., Kawamura, H., Hong, H., and Qi, Y.: A review on the currents in the South China Sea: Seasonal circulation, South China Sea warm current and Kuroshio intrusion, J. Oceanogr., 56, 607–624, 2000.
Hung, J. J., Lin, C. S., Hung, G. W., and Chung, Y. C.: Lateral transport of lithogenic particles from the continental margin of the southern East China Sea, Estuar. Coast. Shelf S., 49, 483–499, 1999.
Hung, J.-J., Wang, S.-M., and Chen, Y.-L.: Biogeochemical controls on distributions and fluxes of dissolved and particulate organic carbon in the Northern South China Sea, Deep-Sea Res. Pt. II, 54, 1486–1503, 2007.
Hung, J.-J., Hung, C.-S., and Su, H.-M.: Biogeochemical responses to the removal of maricultural structures from the eutrophic Lagoon (Tapong Bay) in Taiwan, Mar. Environ. Res., 65, 1–17, 2008.
Hung, J.-J., Wang, Y.-J., Tseng, C.-M., and Chen, Y.-L.: Controlling mechanisms and cross linkages of ecosystem metabolism and atmospheric CO2 flux in the northern South China Sea, Deep-Sea Res. Pt. I, 157, 103205, https://doi.org/10.1016/j.dsr.2019.103205, 2020.
Hung, J.-J., Wang, Y.-H., Fu, K.-H., Tsai, S.-H., Lee, C.-Y., Lu, W.-Z., Shen, Y.-J., Lin, Y.-H., and Lee, I.-H.: Biogeochemical responses to internal-wave impacts in the continental margin off Dongsha atoll in the northern South China Sea, Prog. Oceanogr., submitted, 2021.
Karl, D. M., Christian, J. R., Dore, D. E., Hebel, D. V., Letlier, R. M., Tupas, L. M., and Winn, C. D.: Seasonal and interannual variability in primary production and particle flux at Station ALOHA, Deep-Sea Res. Pt. II, 43, 539–568, 1996.
Knauer, G. A., Martin, J. H., and Bruland, K. W.: Fluxes of particulate carbon, nitrogen, and phosphorus in the upper water column of the northeast Pacific, Deep Sea Res. Pt. I, 26, 97–108, 1979.
Kobari, T., Kitamura, M., Minowa, M., Isami, H., Akamatsu, H., Kawakami, H., Matsumoto, K., Wakita, M., and Honda, M. C.: Impacts of the wintertime mesozooplankton community to downward carbon flux in the subarctic and subtropical Pacific Oceans, Deep-Sea Res. Pt. I, 81, 78–88, 2013.
Le Borgne, R. and Rodier, M.: Net zooplankton and the biological pump: a comparison between the oligotrophic and mesotrophic equatorial Pacific, Deep-Sea Res. Pt. II, 44, 2003–2023, 1997.
Li, Q. and Farmer, D. M.: The generation and evolution of nonlinear internal waves in the deep basin of South China Sea, J. Phys. Oceanogr., 41, 1345–1363, 2011.
Liu, K. K., Chao, S. Y., Shaw, P. T., Gong, G. C. and Chen, C. C.: Monsoon-forced chlorophyll distribution and primary production in the South China Sea: observations and a numerical study, Deep-Sea Res. Pt. I, 49, 1387–1412, 2002.
Liu, K. K., Atkinson, L., Quinones, R. A., and Talaue-Mcmanus, L.: Biogeochemistry of Continental Margins in a Global Contex, in: Carbon and Nutrient Fluxes in Continental Margins, edited by: Liu, K.-K., Atkinson, L., Quinones, R. A., and Talaue-McManus, L., Springer-Verlag, Berlin, 3–24, 2010.
Longhurst, A. R., Bedo, A. W., Harrison, W. G., Head, E. J. H., Horne, E. P., Irwin, B., and Moralest, C.: NFLUX: a test of vertical nitrogen flux by diel migrant biota, Deep-Sea Res., 36, 705–1719, 1989.
Longhurst, A. R., Bedo, A. W., Harrison, W. G., Head, E. J. H., and Sameoto, D. D.: Vertical flux of respiratory carbon by oceanic diel migrant biota, Deep-Sea Res., 37, 685–694, 1990.
Monaco, A., Biscaye, P. E., Soyer, J., Pocklington, R., and Heussner, S.: Particle fluxes and ecosystem response on a continental margin: the 1985-1988 Mediterranean ECOMARGE experiment, Cont. Shelf Res., 10, 809–839, 1990.
Monterey, G. and Levitus, S.: Seasonal variability of mixed layer depth for the worldocean, NOAA atlas NRSDIS 14, U.S. Gov. Printing Office, Washington, D.C., 1997.
Pace, M. L., Knauert, G. A., Karl, D. M., and Martin, J. H.: Primary production, new production and vertical flux in the eastern Pacific Ocean, Nature, 325, 803–804, 1987.
Pai, S. C. Gong, G. C., and Liu, K. K.: Determination of dissolved oxygen in seawater by direct spectrophotometry of total iodine, Mar. Chem., 41, 343–351, 1993.
Parekh, P., Dukiewicz, S., Follows, M. J., and Ito, T.: Atmospheric carbon dioxide in a less dusty world, Geophy. Res. Lett., 33, L03610, https://doi.org/10.1029/2005GL025098, 2006.
Parsons, T. R., Takahashi, M., and Hargrave, B.: Biological oceanographic processes, 2nd Edn., Pergamon Press, Oxford, 332 pp., 1979.
Passow, U. and Carlson, C. A.: The biological pump in a high CO2 world, Mar. Ecol.-Prog. Ser., 470, 249–271, 2012.
Pertola, S., Koski, M., and Viitasalo, M.: Stoichiometry of mesozooplankton in N- and P-limited areas of the Baltic Sea, Mar. Biol., 140, 425–434, 2002.
Peters, R. S. and Downing, J. A.: Empirical analysis of zooplankton filtering and feeding rates, Limnol. Oceanogr., 29, 763–784, 1984.
Pomeroy, L. R., Mathews, H. M., and Min, H. S.: Excretion of phosphate and soluble organic phosphorus compounds by zooplankton, Limnol. Oceanogr., 8, 50–55, 1963.
Redfield, A. C.: The biological control of chemical factors in the environment, Am. Sci., 46, 205–221, 1958.
Reinthaler, T., van Aken, H., Veth, C., Aristegui, J., Robinson, C., Williams, P. J., le, B., Lebaron, P., and Herndl, G. J.: Prokaryotic respiration and production in the meso- and bathypelagic realm of the eastern and western North Atlantic basin, Limnol. Oceanogr., 51, 1262–1273, 2006.
Ridal, J. J. and Moore, R. M.: A re-examination of the measurement of dissolved organic phosphorus in seawater, Mar. Chem., 1990, 29, 19–31, 1990.
Robinson, C., Steinberg, D. K., Koppelmann, R., Robison, B., Anderson, T. R., Arístegui J., Carlson, C. A., Frost, J. R., Ghiglione, J.-F., Hernández-León, S., Jackson, G., Queguiner, B., Ragueneau, O., Rassoulzadegan, F., Tamburini, C., Tanaka, T., Wishner, K. F., and Zhang, J.: Mesopelagic zone ecology and biogeochemistry – a synthesis, Deep-Sea Res. Pt. II, 57, 1504–1518, 2010.
Sabine, C. L., Feely, R. A., Gruber, N., Key, R. M., Lee K., Bullister, J. L., Wanninkhof, R., Wong, C. S., Wallace, D. W. R., Tilbrook, B., Millero, F. J., Peng, T. H., Kozyr, A., Ono, T., and Rios, A. F.: The oceanic sink for anthropogenic CO2, Science, 305, 367–371, 2004.
Sanders, R., Henson, S. A., Koski, M., De la Rocha, C. L., Painter, S. C., Poulton, A. J., Riley, J., Salihoglu, B., Visser, A., Yool, A., Bellerby, R., and Martin, A. P.: The biological carbon pump in the north Atlantic, Prog. Oceanogr., 129, 200–218, 2014.
Sarmiento, J. L. and Gruber, N.: Ocean Biogeochemical Dynamics, Princeton University Press, Princeton and Oxford, 2006.
Shaw, P. T. and Chao, S. Y.: Surface circulation in the South China Sea, Deep-Sea Res. Pt. I, 41, 1663–1683, 1994.
Shih, Y.-Y., Hung, C.-C., Gong, G.-C., Chung, W.-C., Wang, Y.-H., Lee, I-W., Chen, K.-S., and Ho, C.-Y.: Enhanced particulate organic carbon export at eddy edges in the oligotrophic Western North Pacific Ocean, Plos One, 10, e0131538, https://doi.org/10.1371/journal.pone.0131538, 2015.
Steinberg, D. K. and Landry, M. R.: Zooplankton and ocean carbon cycle, Annu. Rev. Mar. Sci., 9, 413–444, 2017.
Steinberg, D. K., Caelson, C. A., Bates, N. R., Goldthwait, S. A., Madin, L. P., and Michaels, A. F.: Zooplankton vertical migration and the active transport of dissolved organic and inorganic carbon in the Sargasso Sea, Deep-Sea Res. Pt. I, 47, 137–158, 2000.
Steinberg, D. K., Benjamin A. S., Mooy, K., Buesseler, K. O., Boyd, P. W., Kobari, T., and Karl, D. M.: Bacterial vs. zooplankton control of sinking particle flux in the ocean's twilight zone, Limnol. Oceanogr., 53, 1327–1338, 2008.
Strickland, J. D. H. and Parsons, T. R.: A practical handbook of seawater analysis, Bulletin Fisheries Research Board of Canada, Ottawa, 311 pp., 1972.
Stukel, M. R., Benitez-Nelson, C. R., Decima, M., Taulor, A. G., Buchwald, C., and Landry, M. R.: The biological pump in the Costa Rica Dome: an open-ocean upwelling system with high new production and low export, J. Plankton Res., 38, 348–365, 2016.
Takahashi, K., Kuwata, A., Sugisaki, H., Uchikawa, K., and Saito, H.: Downward carbon transport by diel vertical migration of the copepods Metridiapacifica and Metridiaokhotensis in the Oyashio region of the western subarctic Pacific Ocean, Deep-Sea Res. Pt. I, 56, 1777–1791, 2009.
Thomas, H., Bozec, Y., Elkalay, K., and De Baar, H.: Enhanced open ocean storage of CO2 from shelf sea pumping, Science, 304, 1005–1008, 2004.
Toggweiler, J. R., Gnanadesikan, A., Carson, S., Murnane, R., and Sarmiento, J. L.: Representation of the carbon cycle in box models and GCMs: 1. Solubility pump, Global Biogeochem. Cy., 17, 1026, https://doi.org/10.1029/2001GB001401, 2003.
Tomson-Bulldis, A. and Karl, D.: Application of a novel method for phosphorus determinations in the oligotrophic North Pacific Ocean, Limnol. Oceanogr., 43, 1565–1577, 1998.
Tsai, L.-S.: Geochemistry of settling materials in the northern South China Sea, MS thesis, National Sun Yat-sen University, Kaohsiung, Taiwan, 93 pp., 2007.
Turner, J. T.: Zooplankton fecal pellets, marine snow, phytodetritus and the ocean's biological pump, Prog. Oceanogr., 130, 205–248, 2015.
Valencia, B., Decima, M., and Landry, M. R.: Environmental effects on mesozooplankton size structure and export flux at station ALOHA North Pacific subtropical gyre, Global Biogeochem. Cy., 32, 289–305, https://doi.org/10.1002/2017GB005785, 2018.
Vidal, J.: Physioecology of zooplankton. 1. Effects of phytoplankton concentration, temperature, and body size on the growth rate of Calanus pacificus and Pseudocalanus sp., Mar. Biol., 32, 99–110, 1980.
Walsh, J. J.: Importance of continental margins in the marine biogeochemical cycling of carbon and nitrogen, Nature, 350, 53–55, 1991.
Wang, X., Zhang, J., Zhao, X., Chen, Z., Ying, Y., Li, Z., Xu, D., Liu, Z., and Zhou, M.: Vertical distribution and diel migration of mesopelagic fishes on the northern slope of the South China Sea, Deep-Sea Res. Pt. II, 167, 128–141, 2019.
Wang, Y. H., Dai, C. F., and Chen, Y. Y.: Physical and ecological processes of internal waves on an isolated reef ecosystem in the South China Sea, Geophys. Res. Lett., 30, 2121, https://doi.org/10.1029/2003GL018532, 2007.
Wei, C.-L., Jen, K.-L., and Chu, K.: Sediment trap experiments in the water column off southwestern Taiwan, J. Oceanogr., 50, 403–414, 1994.
Wei, C.-L., Lin, S.-Y., Sheu, D. D.-D., Chou, W.-C., Yi, M.-C., Santschi, P. H., and Wen, L.-S.: Particle-reactive radionuclides (234Th, 210Pb, 210Po) as tracers for the estimation of export production in the South China Sea, Biogeosciences, 8, 3793–3808, https://doi.org/10.5194/bg-8-3793-2011, 2011.
Welschmeyer, N. A.: Fluormetric analysis of chlorophyll a on the presence of chlorophyll b and pheopigments, Limnol. Oceanogr., 39, 1985–1992, 1994.
Wong, G. T. F., Ku, T.-L., Mulholland, M., Tseng, C.-M., and Wang, D.-P.: The SouthEast Asian Time-series Study (SEATS) and the biogeochemistry of the South China Sea–An overview, Deep-Sea Res. Pt. II, 54, 1434–1447, 2007.
Wyrtki, K.: Physical oceanography of the Southeast Asianwaters, Scientific results of marine investigations of the South China Sea and the Gulf of Thailand, Scripps Institute of Oceanography, La Jolla, California, NAGA report, vol. 2, 195 pp., 1961.
Xiu, P., Chai, F., Shi, L., Xue, H., and Chao, Y.: A census of eddy activities in the South China Sea during 1993–2007, J. Geophys. Res., 115, C03012, https://doi.org/10.1029/2009JC005657, 2010.
Yebra, L., Almeida, C., and Hernández-León, S.: Vertical distribution of zooplankton and active flux across an anticyclonic eddy in the Canary Island waters, Deep Sea Res. Pt. I, 52, 69–83, 2005.
Yebra, L., Herrera, L., Mercado, J. M., Cortes, D., Gomez-Jakobsen, F., Alonso, A.,Sanchez, A., Salles, S., and Valcarcel-Perez, N.: Zooplankton production and carbon export in the western Alboran Sea gyre (SW Mediterranean), Prog. Oceanogr., 167, 64–77, 2018.
Zhai, W. D., Dai, M. H., Cai, W. J., Wang, Y. C., and Hong, H. S.: The partial pressure of carbon dioxide and air–sea fluxes in the northern South China Sea in spring, summer and autumn, Mar. Chem., 96, 87–97, 2005.
Zhai, W.-D., Dai, M.-H., Chen, B.-S., Guo, X.-H., Li, Q., Shang, S.-L., Zhang, C.-Y., Cai, W.-J., and Wang, D.-X.: Seasonal variations of sea–air CO2 fluxes in the largest tropical marginal sea (South China Sea) based on multiple-year underway measurements, Biogeosciences, 10, 7775–7791, https://doi.org/10.5194/bg-10-7775-2013, 2013.
Zhou, K., Dai, M., Xiu, P., Wang, L., Hu, J., and Benitez-Nelson: Transient enhancement and decoupling of carbon and opal export in cyclonic eddies, J. Geophys. Res.-Oceans, 125, e2020JC016372, https://doi.org/10.1029/2020JC016372, 2020.