the Creative Commons Attribution 4.0 License.
the Creative Commons Attribution 4.0 License.
 | 23 Sep 2021
Sedimentation rate and organic matter dynamics shape microbiomes across a continental margin
Sabyasachi Bhattacharya
Tarunendu Mapder
Svetlana Fernandes
Chayan Roy
Jagannath Sarkar
Moidu Jameela Rameez
Subhrangshu Mandal
Abhijit Sar
Amit Kumar Chakraborty
Nibendu Mondal
Sumit Chatterjee
Bomba Dam
Aditya Peketi
Ranadhir Chakraborty
Aninda Mazumdar
Marine sedimentation rate and bottom-water O2 concentration control organic carbon remineralization and sequestration across continental margins, but whether and how they shape microbiome architecture (the ultimate effector of all biogeochemical phenomena) across shelf and slope sediments is still unclear. Here we reveal distinct microbiome structures and functions, amidst comparable pore fluid chemistries, along 300 cm sediment horizons underlying the seasonal (shallow coastal; water depth: 31 m) and perennial (deep sea; water depths: 530 and 580 m) oxygen minimum zones (OMZs) of the Arabian Sea, situated across the western Indian margin. The sedimentary geomicrobiology was elucidated by analyzing metagenomes, metatranscriptomes, enrichment cultures, and depositional rates measured via radiocarbon and lead excess dating; the findings were then evaluated in light of the other geochemical data available for the cores. Along the perennial-OMZ sediment cores, microbial communities were dominated by Gammaproteobacteria and Alphaproteobacteria, but in the seasonal-OMZ core communities were dominated by Euryarchaeota and Firmicutes. As a perennial-OMZ signature, a cryptic methane production–consumption cycle was found to operate near the sediment surface, within the sulfate reduction zone; overall diversity, as well as the relative abundances of anaerobes requiring simple fatty acids (methanogens, anaerobic methane oxidizers, sulfate reducers, and acetogens), peaked in the topmost sediment layer and then declined via synchronized fluctuations until the sulfate–methane transition zone was reached. The microbiome profile was completely reversed in the seasonal-OMZ sediment horizon. In the perennial-OMZ sediments, deposited organic carbon was higher in concentration and rich in marine components that degrade readily to simple fatty acids; simultaneously, lower sedimentation rate afforded higher O2 exposure time for organic matter degradation despite perennial hypoxia in the bottom water. The resultant abundance of reduced carbon substrates eventually sustained multiple inter-competing microbial processes in the upper sediment layers. The entire geomicrobial scenario was opposite in the sediments of the seasonal OMZ. These findings create a microbiological baseline for understanding carbon–sulfur cycling in distinct depositional settings and water column oxygenation regimes across the continental margins.
- Article
(6771 KB) - Full-text XML
-
Supplement
(2253 KB) - BibTeX
- EndNote


Most of the chemical transformations taking place in marine sediments are functions of in situ microbial communities that are co-established in the sediment system along with the organic matter which is delivered to the seafloor from the water column (D'Hondt et al., 2019). Depositional dynamics and post-depositional fate of organic carbon in a marine territory depends on a host of ecosystem parameters (LaRowe et al., 2020), of which the in situ rate of sedimentation and dissolved O2 (DO) concentration of the water column are considered to be of prime importance (Canfield, 1994; Burdige, 2007; Middelburg and Levin, 2009; Ruvalcaba Baroni et al., 2020). Flux and composition of the organic matter and microflora deposited also influence the carbon remineralization and sequestration dynamics of a sediment system (Kristensen et al., 1995; Parkes et al., 2000; Burdige, 2007; LaRowe et al., 2020), while water column oxygenation level impacts the preservation of labile (biochemically reactive) organic matter, as well as the composition of the microbial community in the seafloor (Jessen et al., 2017). From this perspective, however, little is known about how microbiome profile, the ultimate driver of all biogeochemical processes, changes in the age–depth context of a diagenetically maturing sediment package (Kallmeyer et al., 2012; Orsi et al., 2017). We also do not have any direct and comprehensive idea about how differential bottom-water DO concentration, sedimentation rate, and flux and nature of the deposited organic matter, as often encountered along water-depth transects across continental margins (Middelburg, 2019a, b), shape the microbiome profile of marine sediments. In this scenario, the distinct depositional environments of perennial and seasonal oxygen minimum zones (pOMZs and sOMZs) located in the deep and shallow coastal waters across western continental margins, respectively (Naqvi et al., 2000, 2006; Ulloa et al., 2012), afford ideal settings for geomicrobiological explorations aimed at answering these fundamental questions of marine ecology and biogeochemistry.
In the partially landlocked territories of the global ocean, pOMZs typically occur as mid-oceanic bands between 200 and 1200 m below the sea level (m b.s.l.) (Lam and Kuypers, 2011). The Arabian Sea pOMZ (AS_pOMZ) is the thickest (vertical span: ∼1.2 km), and one of the largest ( km2 in terms of total area covered), perpetually oxygen-depleted water masses (<20 µM dissolved O2 round the year) within the global ocean (Ulloa et al., 2012; Acharya and Panigrahi, 2016). It is an outcome of high productivity and biological oxygen demand in the euphotic zone, which is compounded by poor ventilation of the water due to land-locking from three sides; high productivity, in turn, is sustained by monsoon current-driven upwelling of water masses rich in nitrate, followed by convective mixing during winter (Madhupratap et al., 1996).
sOMZs build up in thermally stratified, shallow coastal waters when eutrophication enhances organic matter deposition in tandem with microbial growth and depletion of O2 from the water column (Levin et al., 2009; Middelburg and Levin, 2009); in case hypoxia persists for years and organic matter continues to accumulate, the OMZ expands and the water becomes euxinic (Turner et al., 2008). The Arabian Sea sOMZ (AS_sOMZ), which develops transiently over the western Indian shelf due to seasonally changing costal circulation and hydrography, features eutrophication-induced hypoxia during the summer and autumn months. During the southwest monsoon, the ocean current upwells low-oxygenated water over India's west coast, but the same cannot reach the surface near the shore as a warm freshwater layer is formed over ∼10–40 m water depths owing to intense coastal rainfall and river drainage (Gupta et al., 2016). High levels of chemoorganoheterotrophic activities add to the intense O2 depletion, often within 10 m b.s.l. water depth. In this way, by the month of August, the bottom water becomes suboxic, while in September–October, complete denitrification and sulfate reduction is observed in the water column; however with the reversal of surface currents in November–December, oxic condition is reestablished (Naqvi et al., 2000, 2006).
As the two OMZs across the western Indian continental margin feature differential water column oxygenation regimes, drainage and depositional environments, and marine versus terrestrial organic matter inputs (Fernandes et al., 2018, 2020), here we use their sediment systems as models for investigating microbial community dynamics in distinct diagenetic settings and delineating the physicochemical drivers of microbiome structure and functions across continental shelf and slope sediment horizons. The microbiomes and ecologies were revealed via a “metagenomics – slurry culture – metatranscriptomics” approach, focusing on the population dynamics of sulfate-reducing bacteria and archaea, methanogenic archaea, anaerobically methane-oxidizing archaea (ANME), acetogenic bacteria, and anaerobically sulfur-oxidizing bacterial (ANSOB) chemolithotrophs. Sedimentation rates of the explored territories were measured via radiocarbon and lead excess dating. These findings were then considered in the context of the geochemical information available for the sediment cores (Fernandes et al., 2018, 2020). Comparison of all microbiological and geochemical data showed that pore-fluid chemistry, which is expected to have profound influence on sedimentary microbiota, is largely comparable for the two physiographically and spatiotemporally distinct oxygenation regimes. Instead, the widely contrasting microbiology of the two sediment systems was shaped by their distinct deposition and degradation dynamics in relation to organic matter.
2.1 Study area and sampling
In the course of the research cruise SSK42 (RV Sindhu Sankalp 42), the following sediment cores, which form the basis of the current study, were retrieved by the gravity coring technique from the upper regions of the western Indian continental margin. The cores designated as SSK42/5 and SSK42/6 were collected from sites located at 580 m b.s.l. (GPS coordinates: 16∘49.88' N and 71∘58.55' E) and 530 m b.s.l. (GPS coordinates: 16∘50.03' N and 71∘59.50' E) water depths, within the eastern AS_pOMZ territory, while the core named SSK42/9 was collected from the AS_sOMZ territory, at a water depth of 31 m b.s.l. (GPS coordinates: 16∘13.56' N and 73∘19.16' E) (Fig. 1a).

Figure 1Geographical and geological context of the AS_pOMZ and AS_sOMZ sites explored. (a) Schematic diagram showing the position of SSK42/5, SSK42/6, and SSK42/9 (indicated by green color), relative to the other SSK42 cores (indicated by yellow color) reported elsewhere (Fernandes et al., 2018, 2020). Water depth is plotted to scale along the vertical axis of the diagram, while distances between the cores represented along the horizontal axis are not in scale. Within the oxygenated water mass (light turquoise shade) the mid-oceanic pOMZ is indicated by blue. Sediment horizons underlying the pOMZ are indicated by gray while those impinged by oxygenated water masses are indicated by brown. (b–d) Age versus depth models and sedimentation rates along (b) SSK42/5 (based on 14C dates), (c) SSK42/6 (based on 14C dates), and (d) SSK42/9 (based on 210Pbxs data). Data for SSK42/9 were re-plotted from Fernandes et al. (2020) while those for SSK42/5 and SSK42/6 are from this study.
The ∼300 cm long and 12 cm wide cores were sampled on board SSK42, at an average resolution of 15–30 cm, as described previously (Bhattacharya et al., 2020; Mandal et al., 2020). For every sediment depth explored for microbiology, multiple sample replicates designated individually for a pair of metagenomes, one metatranscriptome, and different culture-based analyses were collected. Sample replicates were consistently stored at −20 and 4 ∘C until further use, accordingly designated for culture-independent and culture-dependent studies, respectively. In tandem with sampling for microbiology, individual sediment depths of the three cores were also sampled, treated, and stored for geochemical analyses, as described previously (Fernandes et al., 2018, 2020; Mandal et al., 2020).
2.2 Geological age of the samples and sedimentation rate of the sites
For the two pOMZ cores SSK42/5 and SSK42/6, radiocarbon (14C) dates of the sediment samples were estimated in this study according to Stuiver and Polach (1977) and Fairbanks et al. (2005), as described elsewhere (Bhattacharya et al., 2019). For the sOMZ sediment core SSK42/9, 210Pb activity in the sediment samples has already been measured by Fernandes et al. (2020) using the standard procedure described by Krishnaswami and Lal (1978); overall sedimentation rate has been calculated for the core based on lead excess (210Pbxs) data, with the extrapolated ages along the core-top to core-bottom trajectory determined from the overall invariant sedimentation rate (Fernandes et al., 2020).
2.3 Metagenome sequencing, assembly, and annotation
DNA for metagenomic analysis was extracted on board SSK42 from the designated sample replicates as described previously (Bhattacharya et al., 2020; Mandal et al., 2020). The duplicate metagenomes isolated in this way for each microbial community explored along the three sediment cores were sequenced separately using Ion PGM or Ion Proton (Thermo Fisher Scientific, Waltham, USA), as described elsewhere (Bhattacharya et al., 2020; Mandal et al., 2020). Each sequence file obtained in this way (Tables S1–S3 in the Supplement) was submitted to Sequence Read Archive (SRA) of National Center for Biotechnology Information (NCBI, Bethesda, USA), with distinct run accession numbers, under the BioProject PRJNA309469.
For each sedimentary community explored, its quality-filtered (Phred score ≥ 20) metagenomic sequence dataset pair was co-assembled by using the softwares Megahit v1.2.x (Li et al., 2015) and MetaQUAST (Mikheenko et al., 2016) as described earlier (Bhattacharya et al., 2020; Mandal et al., 2020). Genes, or open reading frames, coding for peptides at least 30 amino acids in length, were identified within contigs having a minimum 100 bp length, using MetaGeneMark (Zhu et al., 2010). All the individual gene catalogs obtained in this way were annotated for the putative functions of their constituent genes by searching the eggNOG v5.0 database (Huerta-Cepas et al., 2019; last access: 14 April 2020) using eggNOG-mapper and HMMER (Huerta-Cepas et al., 2017).
Parallel to the assembly-based annotation of the metagenomes, the two independent datasets of metagenomic sequence generated for every sedimentary community were individually annotated based on taxonomic affiliation of their constituent reads. For the taxonomic classification of reads, the datasets were searched separately against the NCBI non-redundant (nr) protein sequence database (last access: 14 April 2020) as well as the four distinct databases of single-copy conserved marker proteins, which were specially curated from CheckM version 0.7.060 (Parks et al., 2015; last access: 22 December 2020), for all sulfate-reducing, methanogenic, acetogenic, or sulfur-oxidizing genera with standing in prokaryotic nomenclature (Euzéby, 1997; Parte et al., 2020). For the mapping (identification) of ANME-related reads, the datasets were searched against a putative protein sequence database (Table S4 in the Supplement) curated manually from the NCBI GenBank using the ANME genome sequence accession numbers given in the Genome Taxonomy Database (GTDB) (Parks et al., 2018; last access: 20 March 2021). Furthermore, this curated database contained several fosmid-clone-based sequences of ANME available in the GenBank (Table S4) – potential ORFs present within these DNA sequences were translated to putative amino acid sequences using Prodigal v2.6.3 (Hyatt et al., 2010) and then incorporated in the database.
All the above read-matching experiments were carried out using the BlastX utility available within the BLAST+ package (Camacho et al., 2009), with cut-offs set at minimum 60 % identity and 15 amino acid alignment alongside an e value (these values are sufficiently stringent to ensure reliable genus-level classification of gene sequences having diverse metabolic function and conservation levels; Mandal et al., 2020). For every metagenomic read (query sequence) matching one or more reference sequence(s) of the database, the best hit was taken. Prior to a matching experiment, all reads present within a metagenomic dataset were trimmed using PRINSEQ (Schmieder and Edwards, 2011) in such a way as to never contain more than five consecutive bases having Phred scores below 15.
With reference to a metagenome from a given sediment community, percentage allocations of reads to individual taxa/uncultivated entities were considered to be the direct measures of the relative abundances of the taxa/uncultivated entities within that community (Tringe et al., 2005; Gill et al., 2006; Jones et al., 2008; Ghosh et al., 2015; Mandal et al., 2020; Roy et al., 2020). Since duplicate metagenomes were sequenced for each community, at the end of a read classification experiment for a given sediment community, two separate values were obtained for the relative abundance (prevalence) for every taxon/uncultivated entity searched and found to be present in the community. Arithmetic means of the two independent relative abundance values were calculated (this gave the mean relative abundance of the taxon/uncultivated entity within the community in question) and used for comparisons between distinct communities along and across the sediment cores.
For a given sediment community, prevalence of a particular metabolic type was measured by summing up the mean relative abundances of all such microbial taxa/uncultivated entities whose every reported strain or member is known to exhibit the phenotype(s) of that metabolism. Accordingly, prevalence of sulfate reducers was determined by summing up the mean relative abundances of the taxa listed in Supplementary Note 1. Prevalence of methanogenic archaea in a community was determined by summing up the mean relative abundances of all genera belonging to the classes Methanobacteria, Methanococci, Methanomicrobia, and Methanopyri (Hedderich and Whitman, 2006, 2013). Prevalence of ANME in a community was determined by summing up the mean relative abundances of the uncultivated entities listed in Table S4. Prevalence of acetogenic bacteria in a community was determined by summing up the mean relative abundances of the genera Acetitomaculum, Acetoanaerobium, Acetobacterium, Acetohalobium, Acetonema, Moorella, Natroniella, Oxobacter, Ruminococcus, Sporomusa, and Syntrophococcus (Drake et al., 2006, 2013). Prevalence of anaerobically sulfur-oxidizing bacteria in a community was determined by summing up the mean relative abundances of the taxa listed in Supplementary Note 2. Distributions (fluctuations) of the mean relative abundances of individual metabolic types along a sediment core were fitted to potential (approximate) mathematical functions using the software OriginPro 9 as described previously (Fernandes et al., 2018). For this purpose χ2 values were considered as minimization criteria. χ2 minimization was achieved by following the Levenberg–Marquardt algorithm (Marquardt, 1963; Moré, 1978). For optimal fitting of the ad hoc functions to the distribution of the data, the functions were independently iterated up to 4000 times with uniformly sampled parameters considering a tolerance level at 10−9. The goodness of all function fittings was reflected in the corresponding minimized χ2 values.
2.4 Quantitative estimation of diversity from taxonomically annotated metagenomic datasets
The level of microbial diversity present in a given sedimentary community was quantified, as described previously (Ghosh et al., 2015; Roy et al., 2020), by calculating the Simpson dominance index, Shannon–Wiener diversity index, and Shannon–Wiener evenness index (Magurran, 2004) from the mean relative abundances of phyla, determined on the basis of the taxonomic annotation of metagenomic data. The phylum-level relative abundance values used in these calculations were the same as those illustrated in Fig. 2. Notably, the data for Proteobacteria were split into those for the constituent classes of this phylum. Furthermore, only those groups which had ≥0.01 % mean relative abundance in at least one sediment community across the three cores were considered in these analyses.
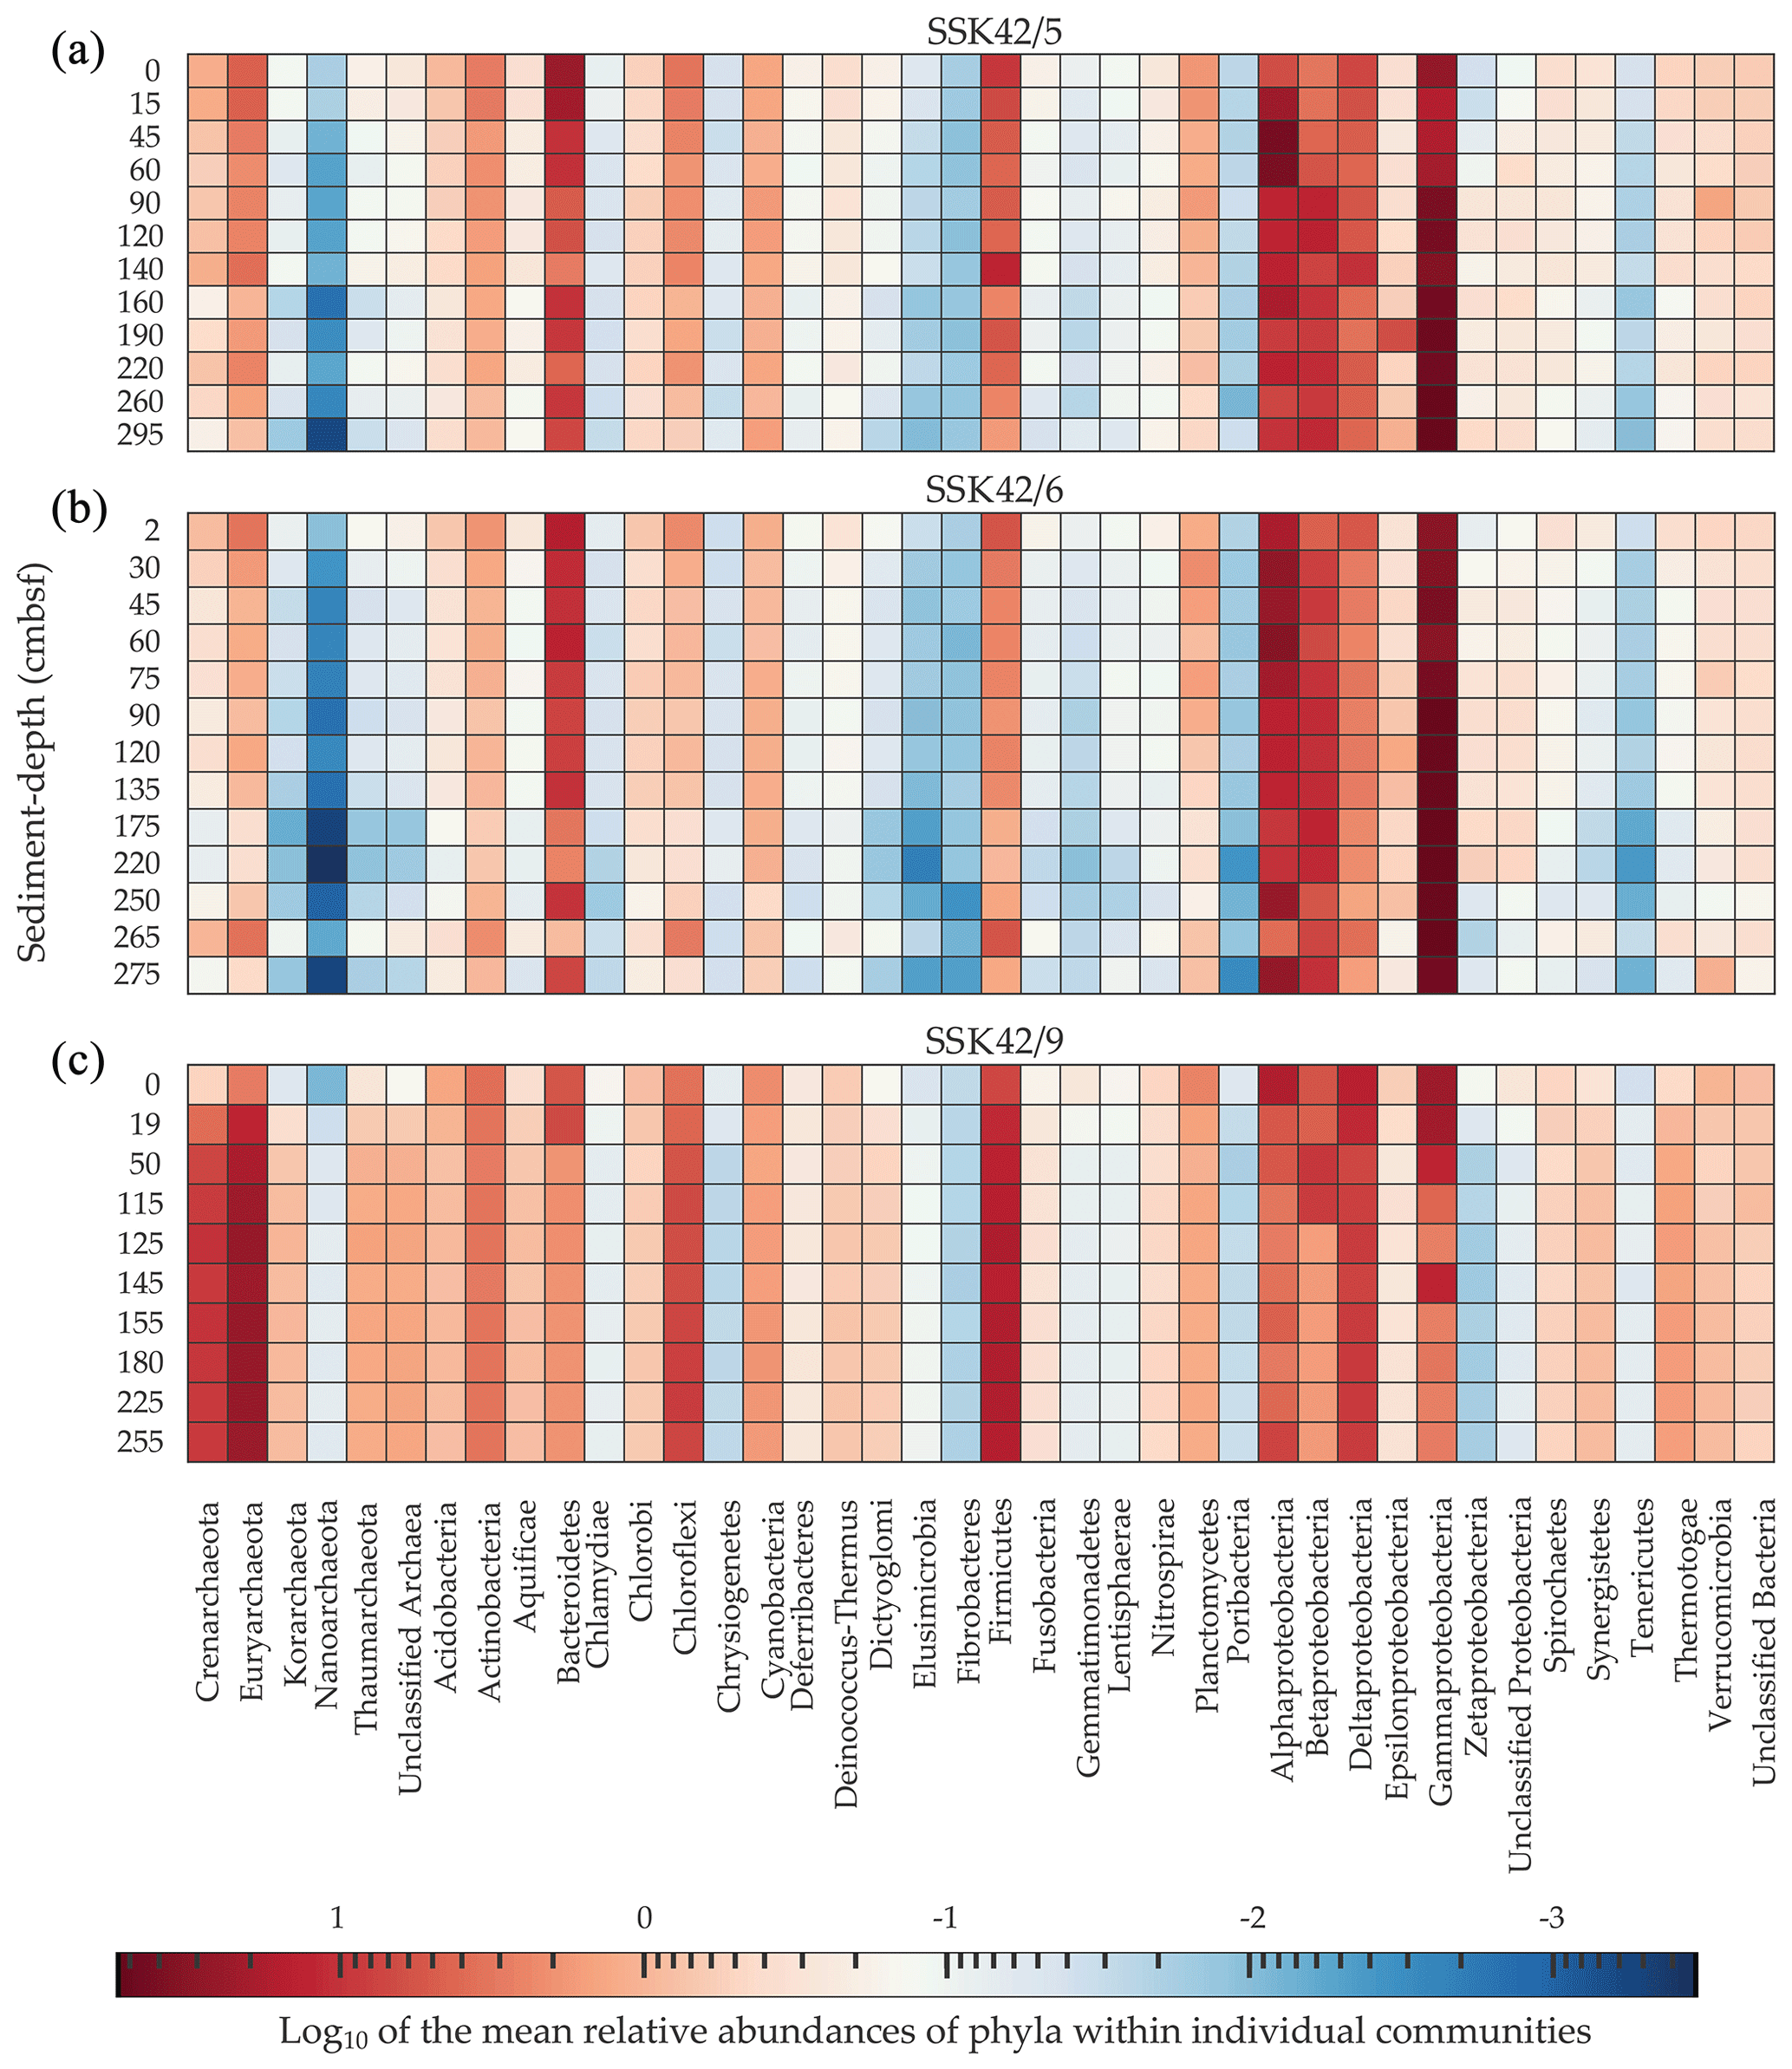
Figure 2Heat map where the relative abundances of microbial phyla within individual sediment communities (estimated as the percentages of metagenomic reads affiliated with the phyla upon searching the datasets against the NCBI nr protein database) are compared along, as well as across, (a) SSK42/5, (b) SSK42/6, and (c) SSK42/9. For each phylum present in a community, Log10 of its mean relative abundance has been plotted in the z axis of the heat map. Only the phylum Proteobacteria has been split into its constituent classes; following this, only such groups which had ≥0.01 % relative abundance in at least one community across the three cores were considered for the analysis.
2.5 Metatranscriptome sequencing and analysis
Metatranscriptomes were extracted from the designated sample replicates fixed with RNAlater (Ambion Inc., USA) on board SSK42, using RNA PowerSoil Total RNA Isolation Kit (MoBio, Carlsbad, USA), while 2×150 nucleotide, paired-end sequencing of the metatranscriptomes was done on a HiSeq4000 platform (Illumina Inc., San Diego, USA), as described elsewhere (Bhattacharya et al., 2020; Mandal et al., 2020).
Although before sequencing potential rRNAs were removed from the native metatranscriptomes using Ribo-Zero Gold (Illumina Inc.), all paired-end metatranscriptomic reads generated for each sedimentary community, before their use in downstream analyses, were mapped onto the rRNA gene sequence database SILVA (Quast et al., 2013) using the software Bowtie2 v.2.3.4.3 (Langmead and Salzberg, 2012) to stamp out whatever rRNA sequences were potentially still there in the dataset. After the elimination of all rRNA-related reads from the native sequence datasets, the two metatranscriptomes in hand retained 23 711 392 and 29 852 795 read pairs (the raw datasets initially had 23 940 274 and 30 010 937 read pairs, respectively).
Subsequent to the in silico clean up of the metatranscriptomic sequence datasets, they were assembled into contigs using the software utility rnaspades.py, available within the SPAdes package 3.13.0 (Nurk et al., 2013), in default mode. Putative genes, or open reading frames, long enough to code for at last 30 amino acids at a stretch, were identified and reported in >100 bp long contigs by the use of the software Prodigal v2.6.3 (Hyatt et al., 2010). Gene catalogs obtained from individual metatranscriptomes were annotated functionally with the help of the software eggNOG-mapper (Huerta-Cepas et al., 2017), via searches against the eggNOG v5.0 database (Huerta-Cepas et al., 2019; last access: 20 April 2020) using the algorithm HMMER.
Furthermore, each rRNA-read-free metatranscriptomic sequence dataset was individually mapped (using Bowtie2 v.2.3.4.3) onto the genomic sequence databases curated separately for all sulfate reducers (Table S5 in the Supplement), methanogens (Table S6 in the Supplement), ANME (Table S4), acetogens (Table S7 in the Supplement), and ANSOB (Table S8 in the Supplement). In these operations, Bowtie2 was run in sensitive local read alignment mode, allowing (i) 0 mismatches in seed alignments, (ii) 20 nucleotide seed substrings to align during multiseed alignments, (iii) 15 consecutive seed extension attempts to “fail” before Bowtie2 moves on using the alignments found until then, and also allowing (iv) Bowtie2 to “re-seed” reads with repetitive seeds for a maximum of two occasions. Seed interval function f was put as , where x denoted the read length (Langmead and Salzberg, 2012).
2.6 Enrichment of methanogens and estimation of methane in slurry incubations
In order to determine the viability of in situ methanogen populations, sediment samples from individual depths of the SSK42 cores were added (5 % ) to a medium specific for the growth of marine methanogens (Hedderich and Whitman, 2006) and incubated anaerobically. Each liter of this medium (pH 7) contained 0.14 g CaCl2⋅2H2O, 0.34 g KCl, 0.5 g NH4Cl, 2.75 g MgCl2⋅6H2O, 3.45 g MgSO4⋅7H2O, 0.14 g K2HPO4⋅3H2O, 0.01 g Fe(NH4)2(SO4)2⋅6H2O, 0.001 g resazurin, 21.97 g NaCl, 2 g yeast extract, 0.5 g Na2S, 0.5 g sodium thioglycolate, 10 mL trace element solution, and 2 g NaHCO3, 4 g HCOONa, 6.8 g CH3COONa, and 0.04 % () CH3OH as methanogenic substrates. Notably, this medium contains ∼10 mM sulfate () in the form of magnesium and ferric ammonium salts in addition to the methanogenic substrates formate, acetate, and methanol. Furthermore, the 25–28 mM pore-water sulfates native to the samples were also present in the slurry cultures. All but two components of the medium were dissolved in water, deoxygenated by purging a mixture gas containing (), and then autoclaved, in screw-capped bottles. Only methanol and sodium sulfide were added by means of filter sterilization after opening the medium-containing bottles inside an H35 Hypoxystation (Don Whitley Scientific, West Yorkshire, UK) that was stipulated at 15 ∘C temperature, 75 % humidity, and 0 % partial pressure of O2 created by continuous flow of (). Inside the anaerobic workstation, the medium was dispensed into individual culture flasks: 1 g sediment sample was added to 20 mL medium dispensed in 100 mL narrow-mouth and fixed-joint Erlenmeyer flask; all such flasks were then capped by sleeve stopper septa and incubated at 15 ∘C for 21 d.
Sediment slurry cultures that did not produce methane in the first round of enrichment were subjected to up to three consecutive sub-cultures by transferring 1 mL clear suspension to fresh 20 mL medium (followed by a 21 d incubation) in each round of sub-culturing. Concentrations of methane in the headspaces of all the incubation flasks were determined according to Mathew et al. (2015) by injecting 20 µL of the headspace gas into a GC2010 gas chromatograph (Shimadzu Corporation, Kyoto, Japan) equipped with a thermal conductivity detector (injector temperature: 200 ∘C; detector temperature: 250 ∘C). An HP-PLOT Molesieve column (Agilent Technologies, Santa Clara, USA) having 30 m length, 0.32 mm diameter, and 12 µm film was used together with helium as the carrier gas to separate the components of a headspace gas sample. Temperature of the column was set at 40 ∘C with a 5 min holding time; it was subsequently increased to 250 ∘C at a rate of 20 ∘C per 10 min of holding time. Peak areas for different gases in the chromatographs were calibrated for measuring unknown concentrations by using a synthetic mixture of nitrogen, hydrogen, carbon dioxide, and methane in the ratio by volume.
3.1 Geographical and geological context of the sediment horizons explored
For the sediment samples investigated along the AS_pOMZ core SSK42/5, radiocarbon(14C)-based geological age ranged between approximately 1000 and 12 000 years (before present). For the samples of the other AS_pOMZ core SSK42/6, it spanned between 4000 and 10 600 years (Fig. 1b and c). Sedimentation rate in this territory ranged between 11 and 132 cm kyr−1, and there appeared to be no sign of slumping (age reversal) within the sediment packages. Notably, sedimentation rate in both the cores increased at depths corresponding to ∼6800 years and was relatively higher in the more recent upper layers. On the other hand, based on Pb excess (210Pbxs) data (Fernandes et al., 2020), overall sedimentation rate calculated for the AS_sOMZ core SSK42/9 was 0.21 cm yr−1; core-top to core-bottom ages for this sediment horizon, extrapolated based on a grossly invariant sedimentation rate, spanned between 116.2 and 1487 years (Fig. 1d).
3.2 Distinct microbiome compositions characterize AS_pOMZ and AS_sOMZ sediments
On the basis of the data obtained from the taxonomic classification of metagenomic reads, differentially diversified microbial communities encompassing 40 bacterial and archaeal phyla (individual classes were considered for the phylum Proteobacteria) were detected across the AS_pOMZ sediment cores SSK42/5 and SSK42/6 and the AS_sOMZ sediment core SSK42/9 (Fig. 2). Out of the 40 phyla present at different levels of their relative sequence abundance across the three cores, 17 (Acidobacteria, Actinobacteria, Alphaproteobacteria, Bacteroidetes, Betaproteobacteria, Chloroflexi, Crenarchaeota, Cyanobacteria, Deltaproteobacteria, Euryarchaeota, Firmicutes, Gammaproteobacteria, Planctomycetes, Thaumarchaeota, Thermotogae, Verrucomicrobia, and Zetaproteobacteria) were found to have ≥ 0.1 % mean relative abundance in at least one of the explored sedimentary communities of each core. Although these phyla were major constituents of the microbiome in the pOMZ as well as sOMZ sediment horizons, their distribution pattern varied widely in the two distinct sedimentary systems. For instance, Gammaproteobacteria exhibited remarkably high relative abundance within the sedimentary communities of SSK42/5 and SSK42/6 but not SSK42/9 (Fig. 2). Alphaproteobacteria was also considerably abundant in the communities of the two pOMZ cores, with sharp increases recorded in the 15–60 cm b.s.f. and 45–60 cm b.s.f. zones of SSK42/5 and SSK42/6, respectively. In contrast, all the communities explored along SSK42/9 were dominated by Euryarchaeota and Firmicutes.
For all 17 major bacterial and archaeal phyla that were detected across the pOMZ and sOMZ sediment horizons, relative abundance fluctuated several times down the sediment depths in all three cores (Fig. 2). In SSK42/5 and SSK42/6, relative abundances of most of these phyla declined from the sediment surfaces to the core bottoms, while few remained unchanged, and still fewer increased (for instance, Gammaproteobacteria and Zetaproteobacteria increased with sediment depth in both SSK42/5 and SSK42/6, even though the latter decreased sharply below 250 cm b.s.f. in SSK42/6). Corroborative to these trends, most of the phyla in the pOMZ cores had numerically high and statistically significant (P≤ 0.05) negative Spearman correlation coefficients (ρ) with sediment depth (Table S9 in the Supplement). By contrast, in SSK42/9, relative abundances of many of the 17 major phyla increased steadily with sediment depth; of these, Chloroflexi, Crenarchaeota, Euryarchaeota, Firmicutes, and Thermotogae had numerically high and statistically significant positive ρ values with sediment depth (Table S9). Furthermore, Thaumarchaeota and Korarchaeota, Unclassified Archaea, Aquificae, Deinococcus-Thermus, Dictyoglomi, Elusimicrobia, Fusobacteria, and Synergistetes that were abundant only in SSK42/9 increased with sediment depth (Fig. 2).
Phylum-level microbial diversity of individual sedimentary communities, indexed based on their taxonomically annotated metagenomic data (calculations given in Tables S10–S12 in the Supplement), varied considerably along all three cores (Fig. 3). In the pOMZ cores SSK42/5 and SSK42/6, both Shannon–Wiener diversity index (H) and Shannon–Wiener evenness index (EH) decreased by ∼27 % from the topmost layers to the core bottoms; corroboratively, both the indices showed numerically high (≥ 0.8) and statistically significant (P≤ 0.05) negative ρ values with sediment depth (Table S13 in the Supplement). By contrast, in the same trajectory along the sOMZ core SSK42/9, there was a net increase in H and EH. Notably, however, the overall ranges within which the index values varied in SSK42/9 were quite narrow. Spearman correlations of all three indices with sediment depth were also low for this core (Table S13). In all three cores, fluctuation of Simpson dominance (D) index with sediment depth was inverse to that of H or EH (Fig. 3).
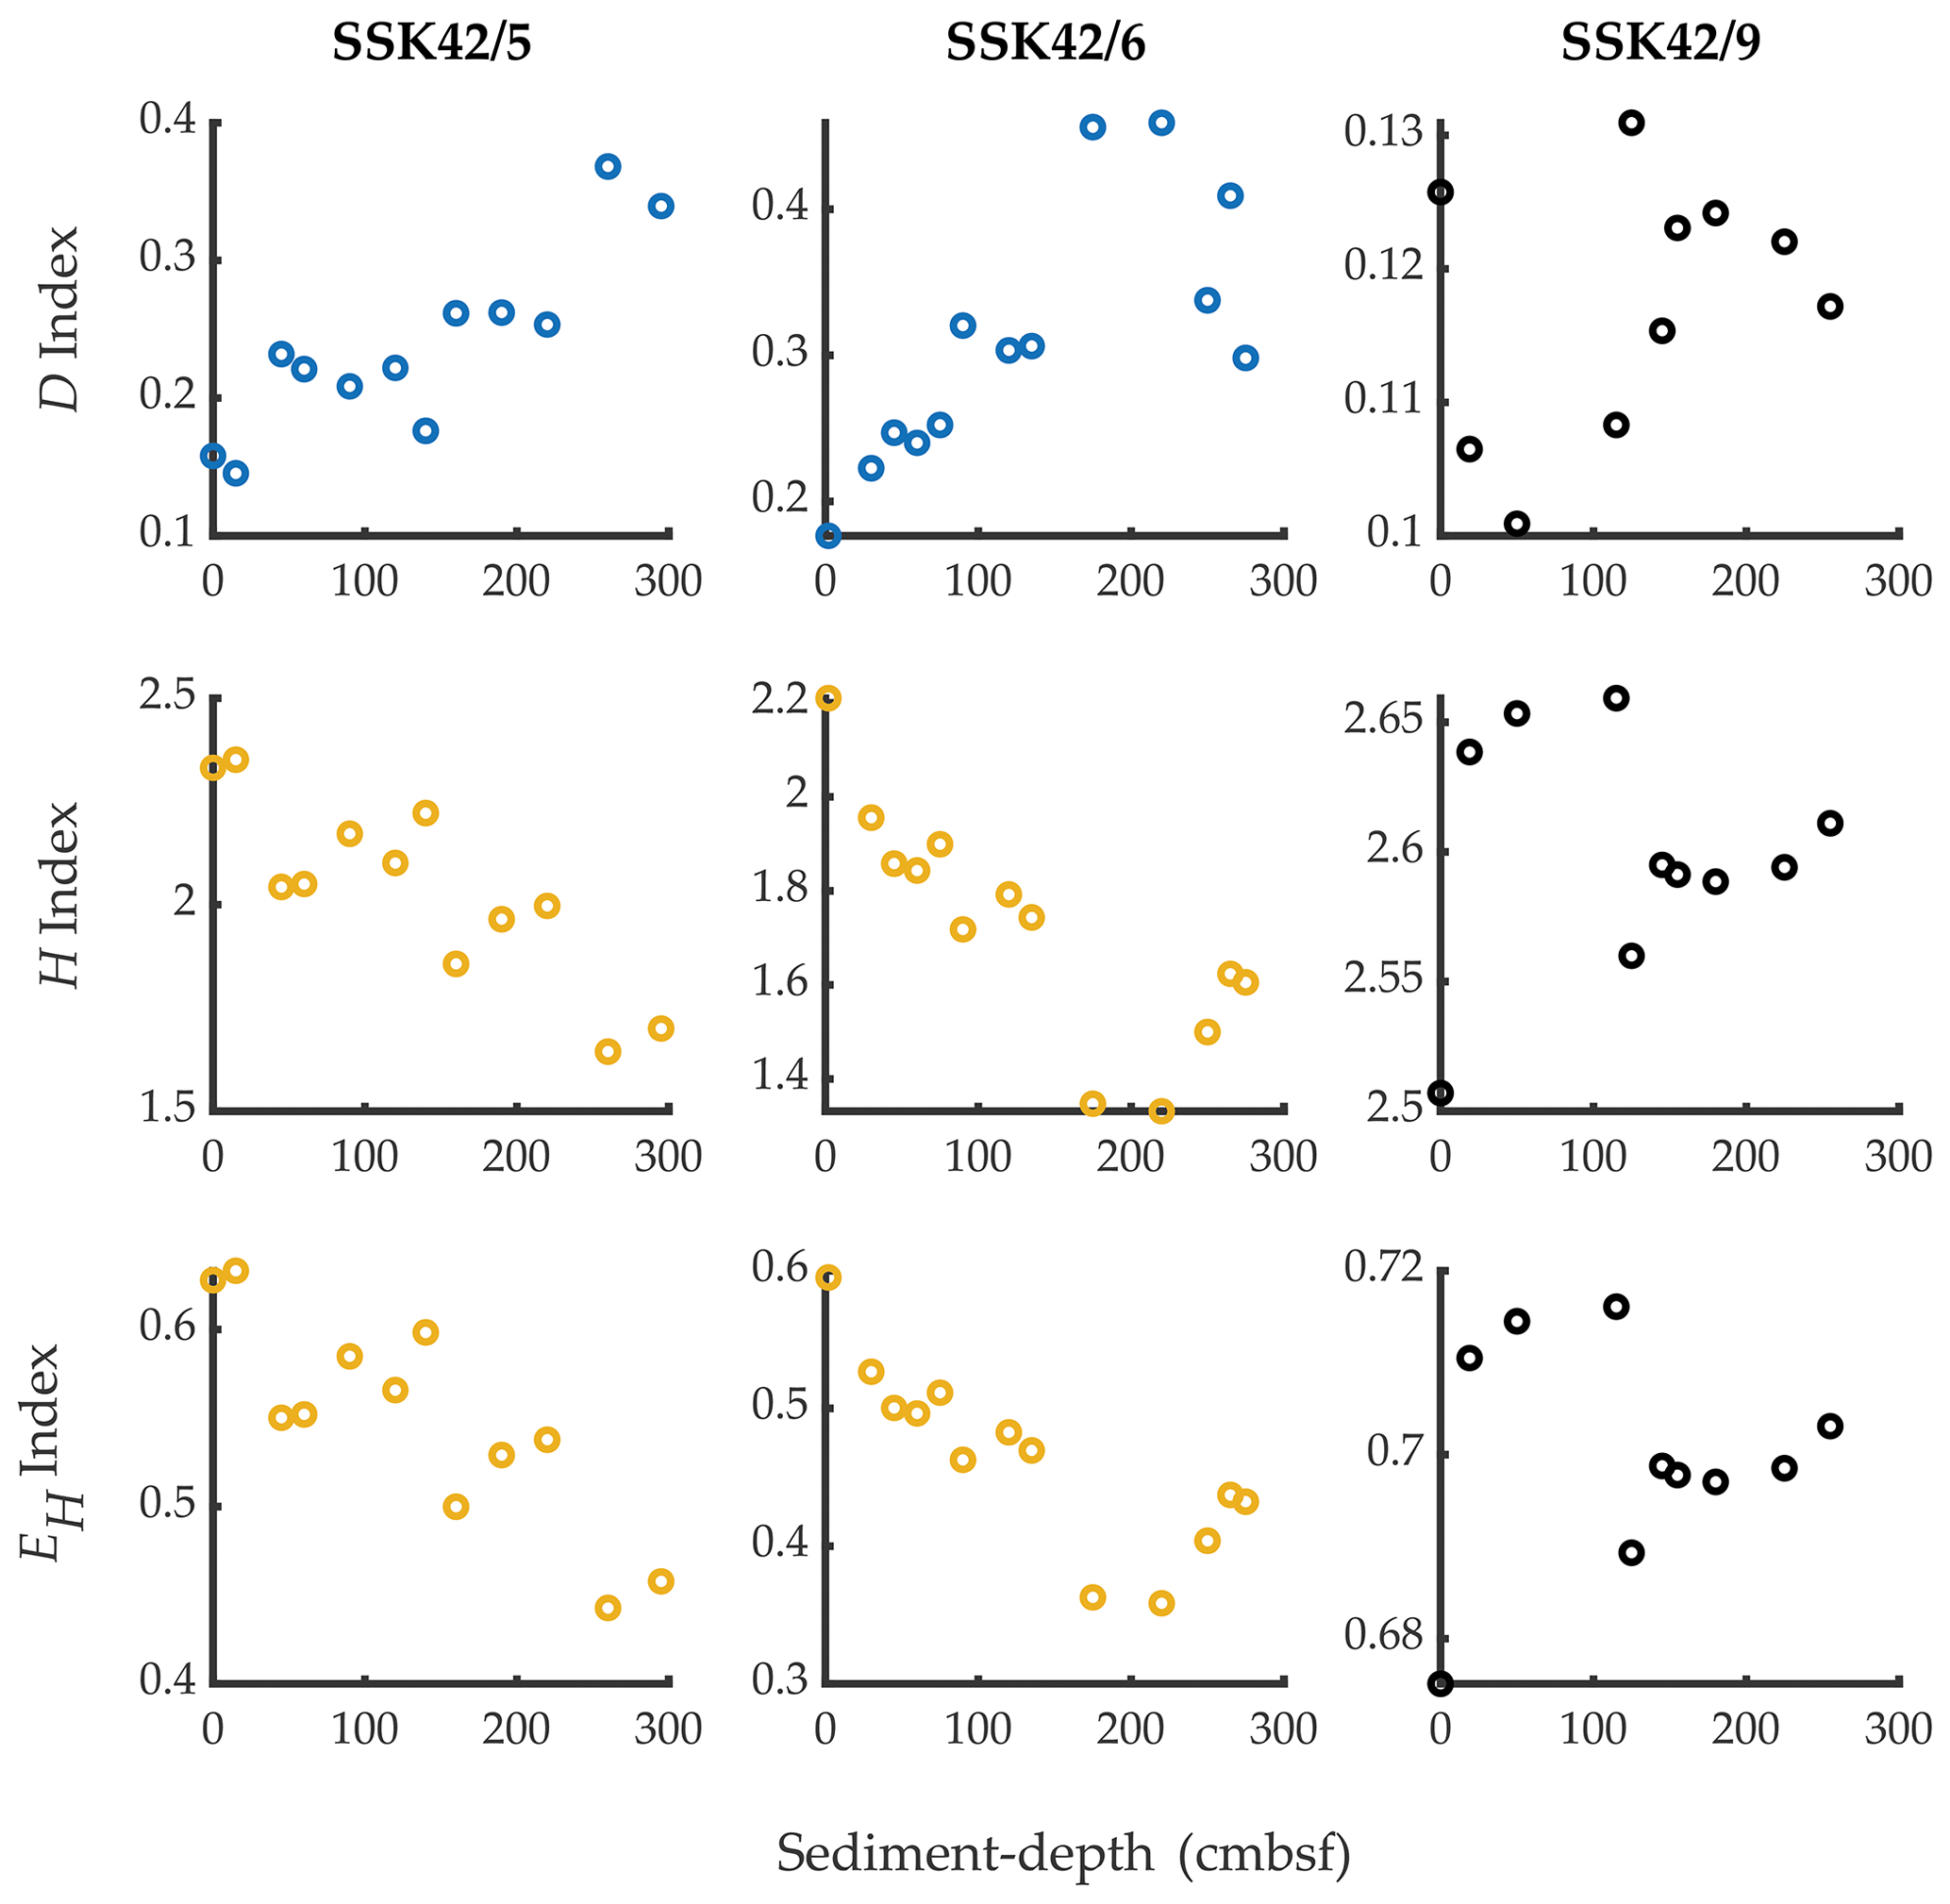
Figure 3Simpson dominance (D), Shannon diversity (H), and Shannon equitability (EH) indices of the individual sediment communities of SSK42/5, SSK42/6, and SSK42/9, determined on the basis of relative abundances of phyla, which in turn were estimated as the percentages of metagenomic reads affiliated to the phyla upon searching the datasets against the NCBI nr protein database. Plots corresponding with Spearman's correlation coefficients with P<0.05, between the diversity index concerned and sediment depth, have dark blue symbols; plots corresponding with negative ρ values numerically ≥0.8 with P<0.05, between the diversity index concerned and sediment depth, have chrome yellow symbols; plots corresponding with positive or negative ρ values numerically ≤0.8 have black symbols, irrespective of whether P is <0.05 (all ρ values are given in Table S13).
3.3 Genes for anaerobic metabolisms related to C–S cycling are abundant across the pOMZ and sOMZ cores
When the assembled metagenomes of each sediment sample investigated along the two AS_pOMZ cores SSK42/5 and SSK42/6 were annotated individually, 24 contig collections (out of the total 25 generated) were found to encompass diverse homologs of the sulfate reduction genes which code for sulfate adenylyltransferase (cysN, cysD, sat, and met3), adenylylsulfate reductase (aprA and aprB), and dissimilatory sulfite reductase (dsrA and dsrB) (Table S14 in the Supplement). Only for 250 cm b.s.f. of SSK42/6 was no homolog detectable for the different sulfate reduction genes, plausibly owing to relatively low metagenomic data throughput for this sample (Table S2). On the other hand, all 25 metagenome assemblies obtained from these two cores contained diverse homologs for a large number of the genes involved in acetoclastic methanogenesis; 23 of them encompassed homologs of genes involved in hydrogenotrophic methanogenesis, methylotrophic methanogenesis, and biosynthesis of co-enzyme M (Table S15 in the Supplement) that is required for methyl group transfer during methanogenesis (Thauer, 1998). All 25 assemblies also contained diverse homologs of the acetogenesis-related genes cooS, acsA (encoding anaerobic carbon-monoxide dehydrogenase); acsB (encoding acetyl-CoA synthase); cdhE, acsC and cdhD, acsD (encoding acetyl-CoA decarbonylase/synthase); acsE (encoding 5-methyltetrahydrofolate corrinoid/iron sulfur protein methyltransferase); fdhA and fdhB (encoding formate dehydrogenase (NADP+)); fhs (encoding formate-tetrahydrofolate ligase); folD (encoding methylenetetrahydrofolate dehydrogenase (NADP+)/methenyltetrahydrofolate cyclohydrolase); and (encoding metF methylenetetrahydrofolate reductase (NADPH)) (Table S16 in the Supplement). Furthermore, all 25 metagenome assemblies obtained from the two cores were found to contain diverse homologs of the anaerobic sulfide oxidation genes which code for sulfide–quinone oxidoreductase (sqr) and sulfide dehydrogenase (fccA and fccB) (Table S17 in the Supplement).
When the assembled metagenomes of each sediment sample explored in the AS_sOMZ core SSK42/9 were annotated individually, all 10 contig collections generated were found to encompass diverse homologs for large numbers of genes for sulfate reduction (Table S18 in the Supplement), hydrogenotrophic methanogenesis, acetoclastic methanogenesis as well as methylotrophic methanogenesis (Table S19 in the Supplement), and acetogenesis (Table S20 in the Supplement). A total of 9 out of the 10 metagenome assemblies contained genes required for co-enzyme M biosynthesis (Table S19) and anaerobic sulfur oxidation (Table S21 in the Supplement). For the 115 cm b.s.f. sediment sample of SSK42/9, no homolog of co-enzyme M biosynthesis and anaerobic sulfur oxidation genes was detectable; this could be due to the low metagenomic data throughput obtained for this sample (Table S3).
3.4 Sulfate reducers, methanogens, ANME, and acetogens predominate in the top layers of pOMZ sediments and decline via synchronous fluctuations along the cores
Relative abundances of sulfate reducers, methanogens, ANME, and acetogens were found to vary in sync with each other throughout the AS_pOMZ cores SSK42/5 (Fig. 4a) and SSK42/6 (Fig. 4b), but not the AS_sOMZ core SSK42/9 (Fig. 4c). Comparable core-wise trends were also observed for the total number of functional gene homologs identified for dissimilatory sulfate reduction, methanogenesis (including hydrogenotrophic, methylotrophic, and acetoclastic pathways, plus co-enzyme M biosynthesis), and acetogenesis (i.e., reductive acetyl-CoA pathway or Wood–Ljungdahl pathway), within the metagenome assemblies obtained for the individual sediment samples of SSK42/5, SSK42/6, and SSK42/9 (Table S22 in the Supplement).

Figure 4Relative abundances of sulfate reducers, methanogens, anaerobic methanotrophs, acetogens, and anaerobic sulfur oxidizers along (a and d) SSK42/5, (b and e) SSK42/6, and (c and f) SSK42/9. Variations in the relative abundances of sulfate reducers, methanogens, anaerobic methanotrophs, and acetogens are shown in (a–c), whereas the variations in the relative abundance of anaerobic sulfur oxidizers are shown (in comparison with sulfur reducers) in (d–f). Relative abundance values plotted for sulfate reducers, methanogens, acetogens, and sulfur oxidizers are the percentages of metagenomic reads that matched genomic sequences from the genera considered to represent these metabolic types (similar core-wise trends of relative abundance were observed when the percentages of metagenomic reads matching CheckM-derived marker gene sequences from the genera considered to represent sulfate reducers, methanogens, acetogens, or sulfur oxidizers were plotted against sediment depth). Relative abundance values for the five metabolic types are plotted as five differently colored symbols. The theoretical lines in the same color code as the symbols represent the mathematical functions fitted to the distributions of the different metabolic types: solid and dashed lines represent zones of mathematically defined and undefined distributions, respectively. Supplementary Note 3 gives the mathematical definitions of the fluctuation trends recorded for the relative abundances of the individual metabolic types along the different sediment cores (the zones of discontinuous increase or decrease, not defined by any mathematical function, could be reflective of drastic changes in the prevailing biogeochemical regimes).
Along SSK42/5 and SSK42/6, relative abundances of sulfate reducers, methanogens, ANME, and acetogens eventually decline from the sediment surfaces to the core bottoms, albeit via multiple phases of fall and rise. Concurrently, in these two cores, Spearman correlations between sediment depth and the prevalence of the individual metabolic types are all negative and mostly high numerically and significant statistically (Table S23 in the Supplement). In SSK42/5 and SSK42/6, prevalence of all four metabolic types individually is within 0–8 cm b.s.f. at their respective core-wise maxima; from there they decrease until the first 60–80 cm b.s.f. In SSK42/5, the upper zone of decline is followed by a zone of increase in the relative abundances of all four metabolic types; then there are reductions in their relative abundances and finally bell-shaped distributions (Fig. 4a). Along SSK42/6, the first zone of decline is followed by three consecutive zones of increase and decrease in the relative abundances of all four metabolic types; however, within this territory, only one zone of decline conformed to a mathematical function (Fig. 4b).
In contrast to the above trends, over the first 120 cm b.s.f. of SSK42/9, the trend of fluctuation in the relative abundance of sulfate reducers is different from that of methanogens, ANME, and acetogens (Fig. 4c). While the relative abundances of methanogens, ANME, and acetogens exhibit sharp increases along this sediment depth, prevalence of sulfate reducers has two fluctuation features: an initial zone of slight decline overlapped by a subsequent zone of small increase that brings the relative abundance of sulfate reducers almost to the core-top level. Below 120 cm b.s.f. of SSK42/9, relative abundances of all four metabolic types plateau. Corroborative to the trends of fluctuation in their relative abundance values, Spearman correlations between the prevalence of the individual metabolic types along SSK42/9 and sediment depth are all positive and mostly high numerically and significant statistically (Table S23).
The fluctuation trends recorded for the relative abundances of the individual metabolic types along the different sediment cores have been defined mathematically (fitted to approximate functions) in Supplementary Note 3. Consistent with these data, Spearman correlation coefficients (ρ) for the pair-wise associations between (i) sulfate reducers and methanogens, (ii) methanogens and ANME, (iii) ANME and sulfate reducers, (iv) acetogens and sulfate reducers, and (v) acetogens and methanogens were all found to be higher in SSK42/5 and/or SSK42/6, compared to SSK42/9; only the ρ value for the acetogens–ANME pair was highest in SSK42/9 (Table S24 in the Supplement).
Throughout SSK42/5 and SSK42/6, ANME and/or sulfate reducers are the most abundant metabolic types, followed by methanogens and acetogens (Fig. 4a and b). In contrast, for the most part of SSK42/9 (except 0 and 19 cm b.s.f.) methanogens predominate, followed by sulfate reducers, ANME, and acetogens (Fig. 4c). Although relative abundance of acetogens is lower than the other three metabolic types along all three cores, overall prevalence of acetogens is much higher in SSK42/9 than in SSK42/5 or SSK42/6. Even the lowest relative abundance of acetogens in SSK42/9 (0.35 % at 0 cm b.s.f.) is greater than or almost equal to the highest relative abundances of acetogens in SSK42/5 (0.37 % at 0 cm b.s.f.) and SSK42/6 (0.28 % at 0 cm b.s.f.), respectively.
3.5 Population dynamics of anaerobic sulfur-oxidizing bacteria
Considerable prevalence of ANSOB was detected in all three cores. In the two pOMZ cores SSK42/5 (Fig. 4d) and SSK42/6 (Fig. 4e), their mean relative abundance in the different sedimentary communities ranges between 0.4 %–4.6 % and 0.3 %–2.5 % of the metagenomic reads annotated; minimum prevalence is encountered within 0–2 cm b.s.f., while prevalence increases exponentially until 140 and 220 cm b.s.f. in SSK42/5 and SSK42/6, respectively. In SSK42/5, the upper zone of sharp increase is followed by a zone of decrease in ANSOB prevalence and then a bell-shaped distribution; in SSK42/6, however, the upper zone of sharp increase is followed by a single zone of sharp decline. On the other hand, overall prevalence and population distribution (involving a single phase of sharp decline) of ANSOB along the sOMZ core SSK42/9 (Fig. 4f) are distinct from SSK42/5 or SSK42/6 (Fig. 4d and e). ANSOB constitutes only 0.4 %–0.8 % of the communities explored along SSK42/9, except at 0 cm b.s.f. where its prevalence is 1.8 %. Notably, core-wise trends of variation comparable to those depicted for ANSOB prevalence in Fig. 4d–f were also observed for the total number of functional gene homologs identified for anaerobic sulfur oxidation, within the metagenome assemblies obtained for the individual sediment samples of SSK42/5, SSK42/6, and SSK42/9 (Table S22).
Along some segments of SSK42/5 and SSK42/6, but not SSK42/9, trends of fluctuation in the prevalence of ANSOB are reverse to those of sulfate reducers. However, these dependencies between ANSOB and sulfate reducers were not reflected in their Spearman correlations determined for the individual sediment cores taken in their entirety (Table S25 in the Supplement). This said, in SSK42/5 and SSK42/6 (but not in SSK42/9), ρ value between ANSOB prevalence and sediment depth was found to be positive and numerically high; the probability value (P) corresponding to the ρ value was <0.05 for SSK42/5 and slightly above this cut-off for SSK42/6 (Table S25). Furthermore, in SSK42/6, fluctuations in the prevalence of ANSOB (Fig. 4e) showed significantly positive correlation (Table S25) with pore-water sulfide (ΣHS−) concentration (Fig. 5b), whereas prevalence of sulfate reducers (Fig. 4e) showed significantly negative correlation (Table S25) with pore-water sulfide concentration (Fig. 5b).
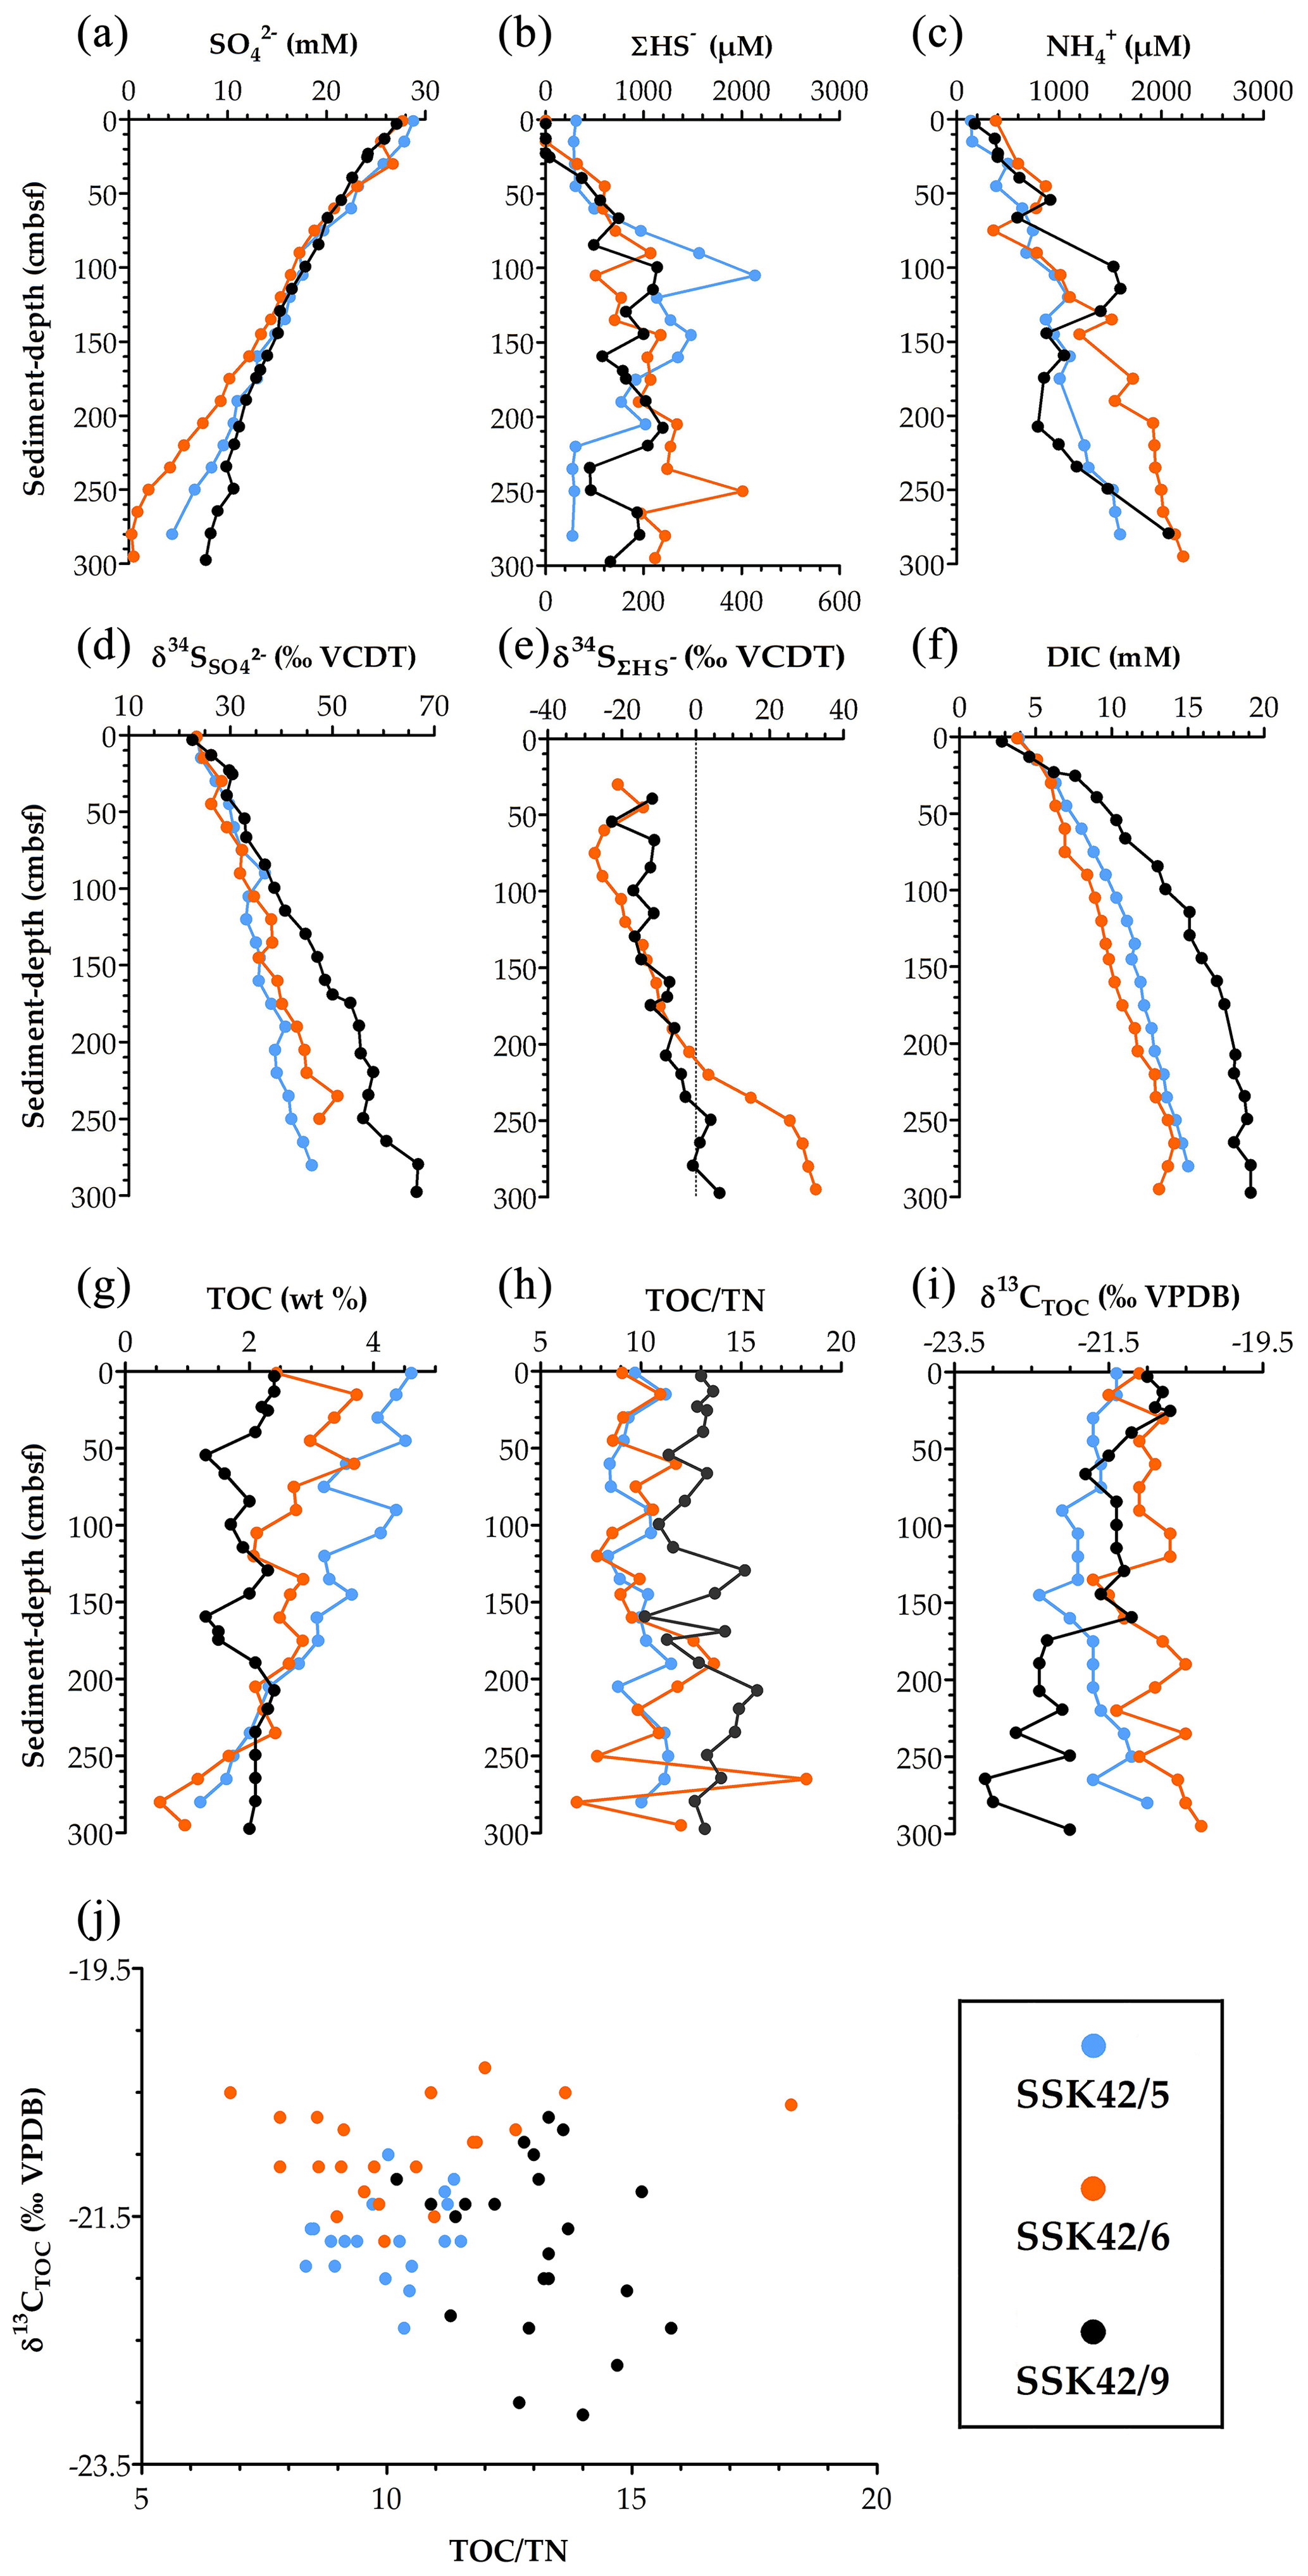
Figure 5Key parameters of pore-water and solid-phase chemistry along the AS_pOMZ cores SSK42/5 and SSK42/6 and the AS_sOMZ core SSK42/9, compared using data taken from Fernandes et al. (2018) and Fernandes et al. (2020), respectively. (a) Concentration of sulfate (), (b) concentration of sulfide (ΣHS−), (c) concentration of ammonium (), (d) sulfur isotope ratio of sulfate (), (e) sulfur isotope ratio of dissolved sulfide (), (f) concentration of dissolved inorganic carbon (DIC), (g) TOC content (in wt %), (h) (TOCTN)molar ratio, (i) carbon isotope ratio of TOC (), and (j) values plotted against (TOCTN)molar ratio for each sediment sample explored along the three cores. For all the parameters, except , data have been plotted for all three cores; only for are data unavailable for the pOMZ core SSK42/5.
3.6 Methanogens of the upper layers of AS_pOMZ, but not AS_sOMZ, cores are active in situ
The most remarkable ecological feature shared by SSK42/5 (Fig. 4a) and SSK42/6 (Fig. 4b), but not SSK42/9 (Fig. 4c), was that methanogens within the two pOMZ cores have their maximum relative abundance at the topmost sediment layers where, idiosyncratically, there is no free methane (Fernandes et al., 2018), and the abundances of sulfate and sulfate reducers are also at their core-wise maxima (Fig. 4a and b). In view of their peculiar population ecology in the pOMZ sediments, potential viability of the methanogens present in the two topmost samples of the three sediment cores were tested via slurry culture in marine-methanogen-specific medium. Subsequently, in situ metabolic functionality of the methanogen populations was checked by metatranscriptome analysis of the sediment samples.
After 21 d incubation in methanogen-specific medium at 15 ∘C, samples from 0 and 15 cm b.s.f. of SSK42/5 produced 2.66 and 4.97 , respectively, 2 and 15 cm b.s.f. of SSK42/6 produced 2.81 and 7.69 , respectively (Fig. 6a and b), and 0 and 19 cm b.s.f. of SSK42/9 produced no methane at all. When similar tests were carried out with the rest of the samples of the three cores, only those corresponding to 250, 265, 270, and 275 cm b.s.f. of SSK42/6 produced 5.41, 5.82, 4.37, and 3.95 , respectively (Fig. 6a and b). Subsequently, to test whether very small numbers of viable methanogen cells were there in the sediment samples which did not produce any methane in this first round of slurry culture, the latter were tested for methane production after consecutive rounds of sub-culturing (enrichment) in marine-methanogen-specific medium (in each sub-culture, 1 mL clear suspension of the parent culture was transferred to fresh 20 mL medium and incubated for 21 d). Here, only the following samples produced small amounts of methane, which were detectable after three consecutive sub-cultures of their initial slurry: 45 cm b.s.f. of SSK42/5 that produced 0.47 of the third sub-culture and 30 and 235 cm b.s.f. of SSK42/6 that produced 0.21 and 0.29 of the third sub-culture, respectively (Fig. 6a and b). Sub-culturing followed by methane estimation was not continued further for the rest of the samples.
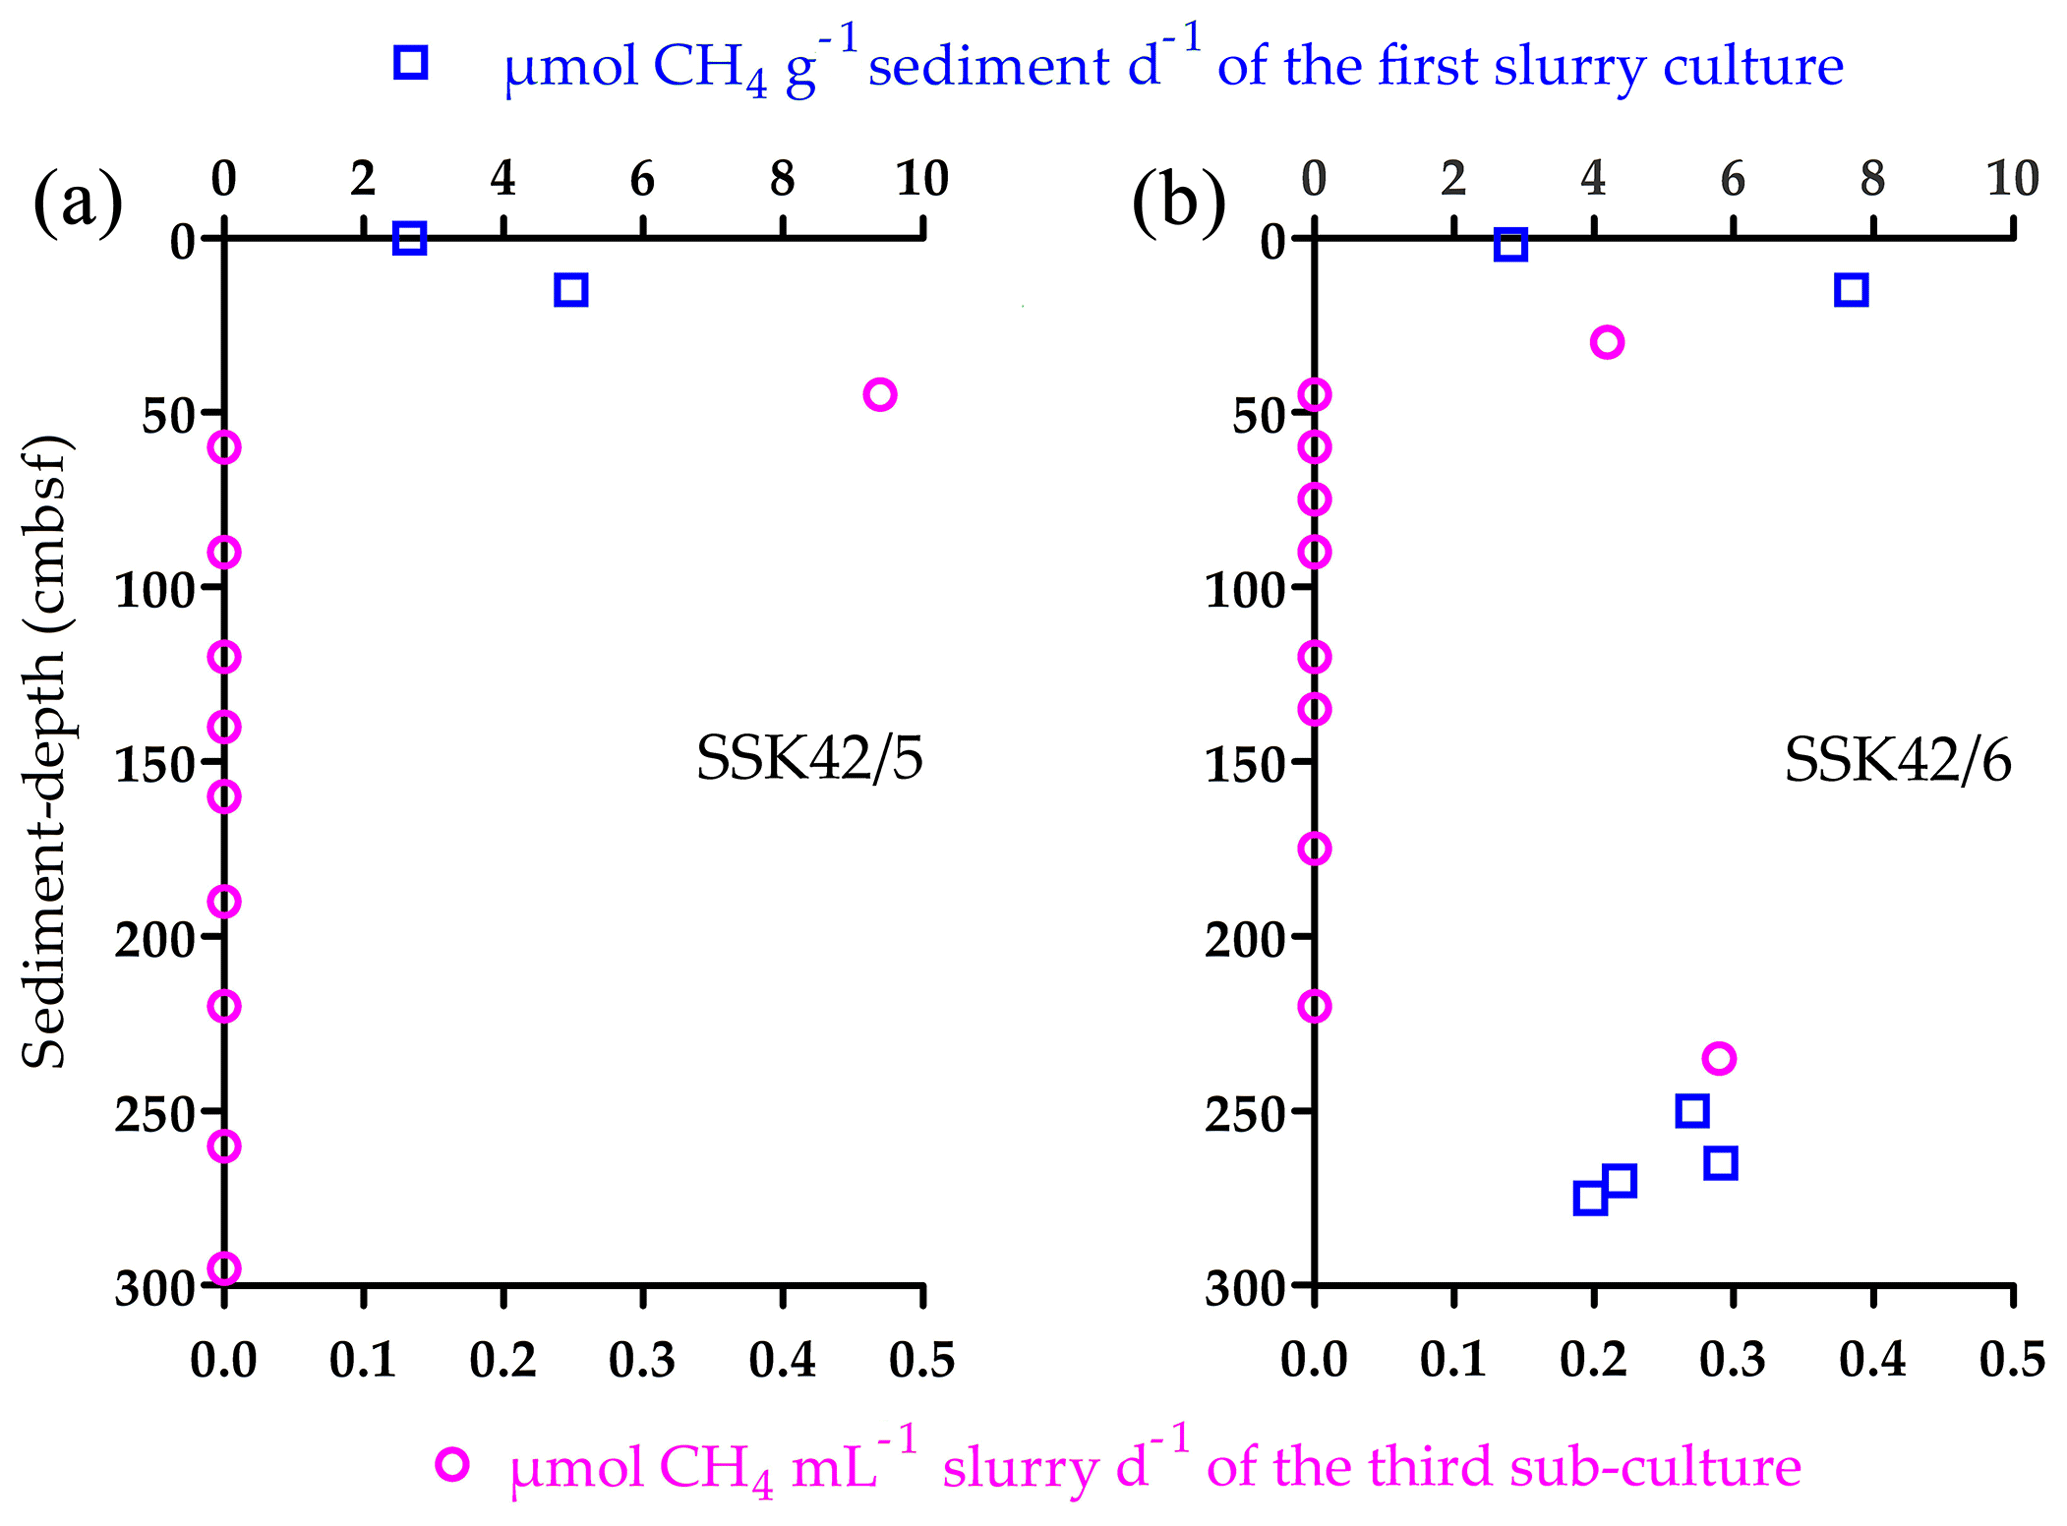
Figure 6Methane production in the slurry cultures or sub-cultures of the different sediment samples from (a) SSK42/5 and (b) SSK42/6 in marine-methanogen-specific medium.
To corroborate the in situ functionality of the upper-sediment-layer methanogens of the AS_pOMZ cores, metatranscriptomes isolated and sequenced from the 0 cm b.s.f. sample of SSK42/5 and 2 cm b.s.f. sample of SSK42/6 were analyzed for footprints of active methanogens (since the results of the slurry culture experiments showed that the upper-sediment-layer methanogens of SSK42/9 were non-viable, metatranscriptomes were not analyzed for the corresponding samples). Overall, the two metatranscriptomic datasets were mapped separately against the comprehensive genomic sequence databases curated individually for not only the methanogens (Table S6) but also the ANME (Table S4), sulfate reducers (Table S5), acetogens (Table S7), and ANSOB (Table S8). For the 0 cm b.s.f. sample of SSK42/5, 0.42 % and 0.39 % read pairs matched concordantly with sequences present in the genome databases of methanogens and ANME, respectively; 21.73 %, 15.36 %, and 8.0 % matched concordantly with sequences present in the genome databases of sulfate reducers, ANSOB, and acetogens, respectively (Fig. 7a). For the 2 cm b.s.f. sample of SSK42/6, 0.28 % and 0.23 % read pairs matched concordantly with sequences present in the genome databases of methanogens and ANME, respectively; 18.45 %, 13.62 %, and 6.09 % matched concordantly with sequences present in the databases of sulfate reducers, ANSOB, and acetogens, respectively (Fig. 7b).
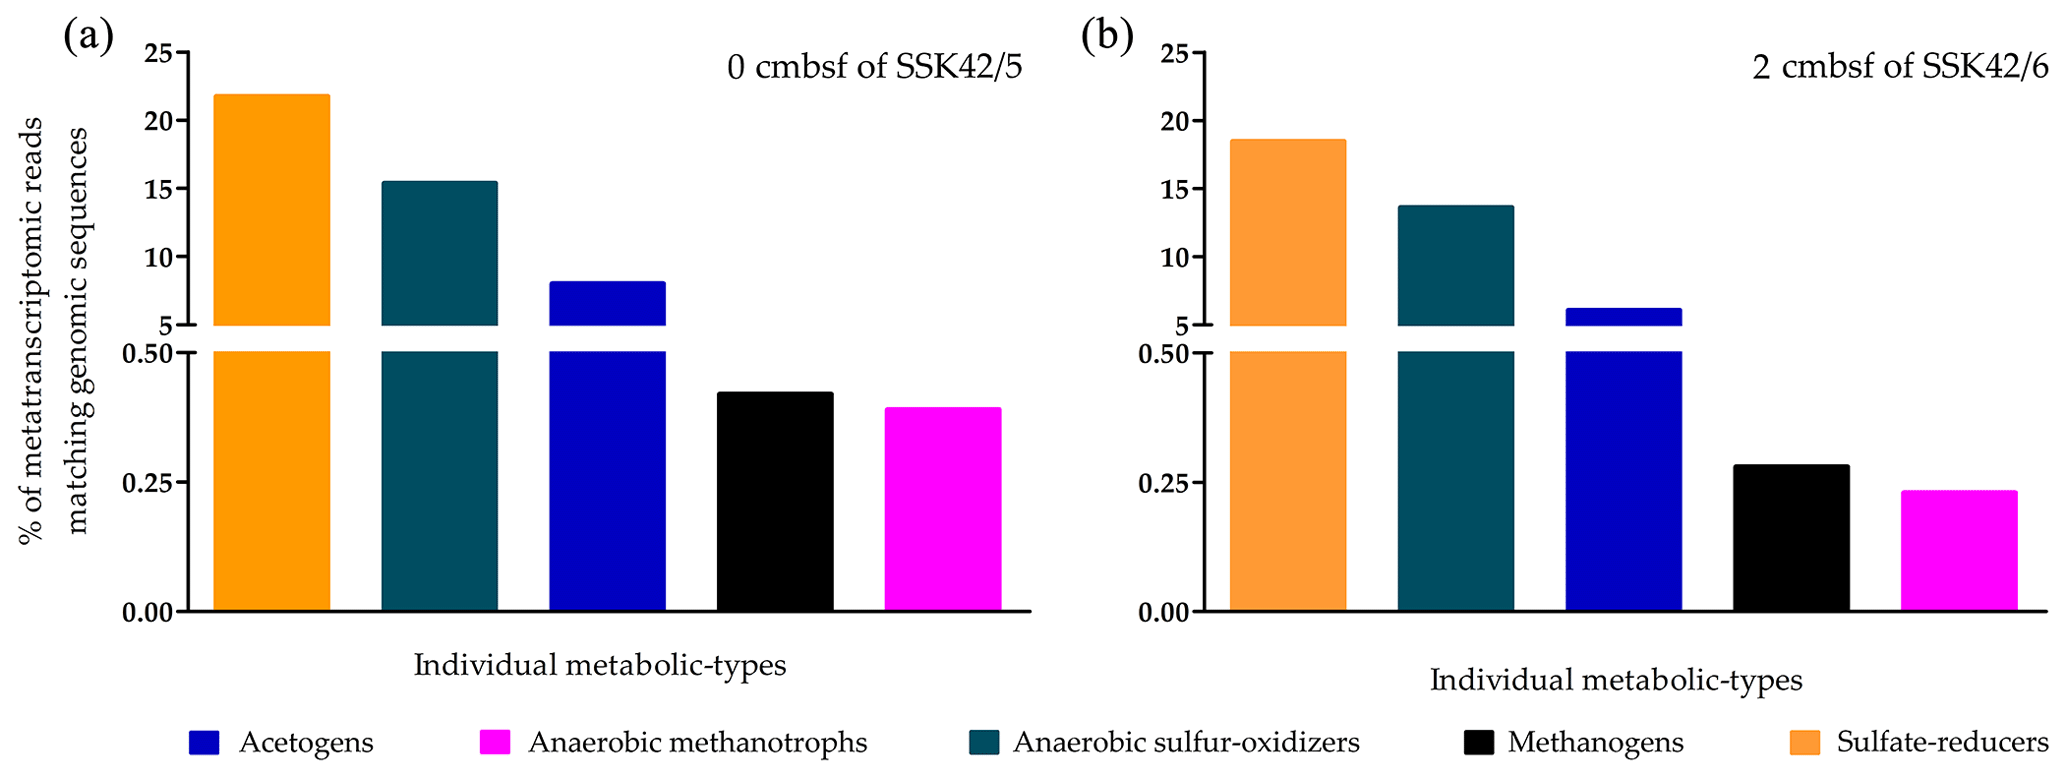
Figure 7Percentages of metatranscriptomic read from (a) 0 cm b.s.f. of SSK42/5 and (b) 2 cm b.s.f. of SSK42/6 that matched genomic sequences of methanogens, ANME, sulfate reducers, acetogens, or ANSOB.
Furthermore, when the two rRNA-read-free metatranscriptomic sequence datasets were individually assembled into contigs and annotated for putative functional genes, the resultant gene catalogs were found to encompass diverse homologs of (i) the sulfate-reduction-related genes cysN (encoding sulfate adenylyltransferase subunit 1), cysD (encoding sulfate adenylyltransferase subunit 2), and aprA (encoding adenylylsulfate reductase, subunit A) (Table S26 in the Supplement); (ii) the methanogenesis-related genes ackA (encoding acetate kinase), pta (encoding phosphate acetyltransferase), and ACSS/acs (encoding acetyl-CoA synthetase) (Table S27 in the Supplement); (iii) the acetogenesis-related genes fdhA (encoding formate dehydrogenase (NADP+) alpha subunit), fhs (encoding formate–tetrahydrofolate ligase), folD (encoding methylenetetrahydrofolate dehydrogenase (NADP+)/methenyltetrahydrofolate cyclohydrolase), and metF, MTHFR (encoding methylenetetrahydrofolate reductase (NADPH)) (Table S28 in the Supplement); and (iv) the anaerobic sulfide oxidation-related genes sqr (encoding sulfide–quinone oxidoreductase), fccB (encoding sulfide dehydrogenase (flavocytochrome c) flavoprotein chain), and fccA (encoding cytochrome subunit of sulfide dehydrogenase) (Table S29 in the Supplement).
3.7 Microbial community dynamics within the shallow SMTZ of SSK42/6
Out of the three sediment cores studied, only SSK42/6 has detectable buildup of biogenic methane (at 250 cm b.s.f. and below) and thereby a shallower sulfate–methane transition zone (SMTZ), which apparently is a biogeochemical signature of the sediments underlying the heart of the AS_pOMZ's perpendicular span (Fernandes et al., 2018). Metagenome analysis for the SMTZ samples of SSK42/6 showed that the increase in methane concentration from 24.5 mM at 250 cm b.s.f. to 42.5 mM at 265 cm b.s.f. (Fernandes et al., 2018) coincides with sharp increases in the relative abundance of methanogens, as well as sulfate reducers, ANME, and acetogens (notably, at 265 cm b.s.f. of SSK42/6, ∼1 mM sulfate is still present in the pore water; see Fig. 5a). Subsequently, relative abundances of all four metabolic types decline sharply at 275 cm b.s.f., where methane (Fernandes et al., 2018) and sulfate (Fig. 5a) concentrations reach approximately 859 mM and 0.3 mM, respectively. These trends indicate that at 275 cm b.s.f., acute depletion of sulfate from the pore water potentially limits the anaerobic oxidation of methane (AOM) via sulfate reduction, thereby causing high accumulation of methane in the sediment. Methane buildup, in turn, constrains the in situ microbiota as a whole, including the methanogens themselves. Absence of CO2, which could have been regenerated from methane if AOM had been there, plausibly limits ecosystem productivity further. In this context it is noteworthy that the methane accumulated at the 275 cm b.s.f. of SSK42/6 amidst low relative abundance of methanogens could have originated in, and diffused upward from, deeper sediment layers where in situ methane concentrations are expectedly low amidst increasing relative abundance of methanogens.
4.1 Peculiar population ecology of anaerobic microorganisms as a signature of pOMZ sediments
4.1.1 Overview of the microbiome architecture
The present exploration of sedimentary microbiota across the western Indian continental margin revealed diverged microbiome architectures in the seasonal (shallow coastal) and perennial (deep sea) OMZs. In the pOMZ and sOMZ sediment horizons, microbial diversity decreased and increased along the cores, respectively (Fig. 3); in the former, communities were dominated by Gammaproteobacteria and Alphaproteobacteria, while in the latter, communities were dominated by Euryarchaeota and Firmicutes (Fig. 2). As a signature of the pOMZ sediments, methanogens, anaerobic methane oxidizers, sulfate reducers, and acetogens had their maximum relative abundances in the upper layers, while prevalence declined with increasing sediment depth via multiple phases of synchronized fall and rise (Fig. 4a and b) until the SMTZ was reached, as in sediment depths ≥ 250 cm b.s.f. of SSK42/6 which contained biogenic methane (Fernandes et al., 2018). Conversely, in the sOMZ sediment horizon explored, prevalence of sulfate reducers was at its highest, and methanogens, anaerobic methane oxidizers, and acetogens were lowest in the top layer. Within 50 cm b.s.f., methanogens, anaerobic methane oxidizers, and acetogens increased sharply while sulfate reducers decreased slightly; prevalence of all four metabolic types steadied thereafter (Fig. 4c). Slurry culture and metatranscriptome analysis showed that the methanogens of the upper 0–45 cm b.s.f. of the pOMZ, but not sOMZ, cores were functional in situ. Down the sediment depths, methanogen populations were active again in the shallow SMTZ of SSK42/6.
4.1.2 Analogous microbiome architectures in other marine sediment systems
For sulfate reducers, overall decline of their relative abundance in the sediment surface to core-bottom trajectory, as encountered in the pOMZ cores (Fig. 4d and e), is consistent with the depth trends of sulfate concentration in the sediment system (Fig. 5a). However, their coexistence and covariance with methanogens, ANME, and acetogens are idiosyncratic to common ecological axioms since all these metabolic types employ the acetyl-CoA pathway for either acetate (biomass) synthesis or acetate degradation, so their natural populations are expected to compete with each other for the common resource hydrogen (Drake et al., 2006, 2013). This said, tandem methanogenesis and sulfate reduction has also been reported from sediment–water interfaces and upper sediment layers well above the SMTZs, of geographically diverse, organic-matter-rich marine sediments, including those underlying other pOMZ systems (Ferdelman et al., 1997; Treude et al., 2005; Mitterer, 2010; Jørgensen and Parkes, 2010; Maltby et al., 2016, 2018; Chronopoulou et al., 2017). Furthermore, biogeochemical features such as shallow depth of SMTZs, and sulfide buildup and cryptic methane cycling within the sulfate reduction zone and near the sediment surface (see below), indicate that the microbiome architecture of SSK42/5 and SSK42/6 could be similar to that of the cold methane seep sediments of the northern Arabian Sea, off the Makran coast of Pakistan (Fischer et al., 2012; Himmler et al., 2015).
4.1.3 Cryptic methane cycling in the upper sediment layers of AS_pOMZ
Whereas free methane was there in many of the global methanogenesis sites located within sulfate reduction zones (Maltby et al., 2016, 2018; Chronopoulou et al., 2017), the presence of live methanogens across the upper sediment layers of SSK42/5 and SSK42/6 is peculiar because there is no detectable methane in situ (Fernandes et al., 2018). Metagenomic and metatranscriptomic data, however, indicated that tandem prevalence of ANME, at relative abundance levels greater than or equal to those of the methanogens (Fig. 4a and b), could be a major reason behind the absence of free methane in the upper sediment layers of AS_pOMZ. Furthermore, aerobically methane-oxidizing bacteria that are not only present throughout SSK42/5 and SSK42/6 (Bhattacharya et al., 2020) but also potentially active in the upper sediment layers of the two cores (Table S30 in the Supplement) could also add to the depletion of the in situ methane.
4.1.4 Mechanistic basis of methanogen–sulfate reducer coexistence
The effective scarcity of hydrogen in SSK42/5 and SSK42/6, and especially in the upper sediment layers of these cores, may not be as acute as the community architecture suggests it to be. For instance, most of the sulfate-reducing genera predominant in these cores have the ability to respire by reducing sulfur species other than sulfate (e.g., dimethyl sulfoxide, elemental sulfur, sulfite, and/or thiosulfate; see Tables S31 and S32 in the Supplement and references therein), which have less-positive reduction potential than sulfate (Muyzer and Stams, 2008). A total of 50 %–60 % of the methanogens identified in any community of SSK42/5 and SSK42/6 belonged to the family Methanosarcinaceae, all members of which can all utilize methylated substrates (such as methanol and methylamines) without the requirement for free hydrogen (see Tables S33 and S34 in the Supplement and references therein). Moreover, many of the methanogenic genera prevalent across SSK42/5 and SSK42/6 have hydrogenotrophic and/or acetoclastic methanogenesis reported for all their members; this indicates that there is sufficient supply of hydrogen in this sediment system for multiple hydrogen-requiring processes to function unabated. Coexistence of acetogens with sulfate reducers, methanogens, and ANME further corroborated the in situ abundance of hydrogen because acetogenic CO2 reduction operates in anoxic environments only when there is a temporal or spatial relaxation in the competition for hydrogen (Sugimoto and Wada, 1993; Shannon and White, 1996; Hoehler et al., 1999). In this context it is noteworthy that taxonomically diverse fermentative and exoelectrogenic bacteria, which are potent sources of hydrogen in a biogeochemical system (besides simple carbon sources such as lactate, acetate, CO2, etc.), are ubiquitous in the AS_pOMZ sediments (Fernandes et al., 2018).
4.1.5 Potential biogeochemical role of ANSOB
Relative abundance of anaerobic sulfur oxidizers was much higher across the AS_pOMZ cores (Fig. 4d and e) compared to the AS_sOMZ core (Fig. 4f). This indicated that the ecology dominated by sulfate reducers, methanogens, ANME, and acetogens of the pOMZ sediment system was also complemented by sulfur oxidizers. Furthermore, the pOMZ (but not sOMZ) cores exhibited significant positive correlation between ANSOB prevalence and sediment depth and also ANSOB prevalence and pore-water sulfide concentration; significant negative correlation was observed between prevalence of sulfate reducers and sulfide concentration (Table S25). These dependencies could be reflective of ANSOB recycling some amounts of in situ sulfide to sulfate, in the same way they do in the deeper (165–540 cm b.s.f.) layers of pOMZ sediments off the Peruvian coast (Holmkvist et al., 2011). Such potential sulfide oxidation processes, however, are unlikely to leave an isotopic footprint in the sulfide or sulfate present in situ, because sulfur-chemolithotrophic pathways generally render very small overall fractionations in the stable isotope ratios of the substrates/products (Alam et al., 2013, 2021).
4.2 Sedimentation rate and organic matter dynamics as the main drivers of microbiome architecture
The microbiome and ecology of AS_pOMZ and AS_sOMZ sediment horizons are distinctive despite the pore-fluid chemistry of SSK42/5 and SSK42/6 (Fernandes et al., 2018) being essentially similar to that of SSK42/9 (Fernandes et al., 2020). For instance, along the three cores, sulfate concentration (Fig. 5a), sulfur isotope ratio () of sulfate (Fig. 5d), dissolved sulfide (ΣHS−) concentration (Fig. 5b), sulfur isotope ratio () of dissolved sulfide (Fig. 5e), and concentrations of ammonium () and dissolved inorganic carbon (Fig. 5c and f) exhibit largely comparable trends. Remarkably, however, relative abundance, deposition dynamics, composition, and post-depositional fate of organic matter (Fernandes et al., 2018, 2020) distinguished the two systems significantly. Bottom-water DO level is known not to impact organic matter degradation and preservation in marine territories (for example, costal locations having shallow water depths) where sedimentation rate is greater than ∼0.04 cm yr−1 (Canfield, 1994). Most organic carbon in such settings gets buried and preserved, while only small amounts decompose slowly after burial via anaerobic pathways, as pre-burial O2 exposure time is effectively very low irrespective of what amount of O2 is present in the bottom water (Hartnett et al., 1998); concurrently, across the global ocean, regardless of the bottom-water DO concentration, organic carbon burial efficiency varies directly and inversely with sedimentation rate and O2 exposure time, respectively (Canfield, 1994; Hartnett et al., 1998; Burdige, 2007; Aller, 2014).
In SSK42/5 and SSK42/6, total organic carbon (TOC) content ranges between 1.2 and 4.6 wt % and 0.6 and 3.7 wt %, respectively, but in SSK42/9 the range of TOC content is much smaller (1.3–2.4 wt %) (Fig. 5g). TOC contents of the top layers of SSK42/5 and SSK42/6 (water depths: 580 and 530 m b.s.l., respectively) are approximately double that of SSK42/9 (water depth: 31 m b.s.l.). This is inconsistent with the general water-depth-dependent trend of organic carbon deposition encountered across continental margins. Generally (outside the OMZs), at higher water depths, the organic detritus gets more time for degradation during transit from the euphotic zone of primary production to the sea floor, so across the continental margins, organic matter delivery rate decreases with increasing water depth (Middelburg, 2019a, b). Furthermore, organic carbon flux across the seabed is generally higher in shallower coastal areas, especially within the euphotic zones (up to ∼300 m b.s.l.), because productivity is higher in these water columns, on top of which microphytobenthos, sponges, and bioturbating animals augment sediment surface productivity and deposition of fresh organic matter that is unreacted upon, so labile or amenable to biodegradation (Middelburg, 2019a, b). In this context, a greater amount of organic carbon influx on the pOMZ sediments is potentially attributable to the lack of macrofaunal activity and low levels of aerobic microbial catabolism during the passage of the organic matter through the perennially hypoxic water columns (Cavan et al., 2017; Jessen et al., 2017).
Comparison of the TOC depth trends of the two sediment systems indicate that, with increasing diagenetic maturity, the organic carbon delivered to the seabed is degraded more rapidly in the pOMZ territory than in the sOMZ. For instance, considering the first 1500 years (up to ∼75 cm b.s.f.) of SSK42/5, ∼30 % of the deposited TOC is depleted, compared to ∼16 % depletion achieved over the same geological time along the entire length of SSK42/9. While the steady depletion of TOC along SSK42/5 and SSK42/6 (Fig. 5g) reflects the labile character of the organic matter deposited in the pOMZ sediments, the more or less unvarying TOC content along SSK42/9 (Fig. 5g) suggests that the organic matter delivered to the sOMZ seafloor is enriched in components refractory to post-depositional degradation. For the sOMZ system, it seems likely that the labile components of the organic matter are already degraded in the water column and sediment–water interface by virtue of exposure to high DO levels and therefore copious macrofaunal and aerobic microbial activities for most of the year (Fernandes et al., 2020). Concurrent to this supposition, the molar ratio of TOC and total nitrogen (TN) in the sediment samples, in conjunction with the data (Fig. 5h–j), indicated that the organic matter present in the pOMZ and sOMZ sediments is predominated by marine and terrestrial components (as per Tyson, 1995), which in turn are more labile and refractory to remineralization, respectively (Kristensen et al., 1995; Burdige, 2007).
The above geochemical considerations elucidated that the organic matter deposited in AS_pOMZ sediments is not only higher in quantity but also richer in marine biomass than its sOMZ counterpart. As marine organic matter is effectively hydrolyzed into soluble simple fatty acids irrespective of what amount of dissolved O2 is present in the chemical milieu (Burdige, 1991; Kristensen et al., 1995; Aller et al., 1996; Aller and Blair, 2004; Burdige, 2007), its copious delivery on to the pOMZ seafloor, and plausible ready de-polymerization in situ, can be instrumental in sustaining high relative abundances of multiple metabolic types requiring simple fatty acids (such as methanogens, sulfate reducers, and acetogens) in the top sediment layers of SSK42/5 and SSK42/6 (Fig. 4a and b), where overall microbial diversity is also at its peak (Fig. 3). Furthermore, the low sedimentation rate (0.011–0.132 cm yr−1) of this AS_pOMZ territory (Fig. 1b and c) may result in an effectively high O2 exposure time (Burdige, 2007) for the degradation of the deposited organic matter, including whatever refractory component may be there, even as DO remains perennially low (∼2 µM at the time of current sampling) in the bottom water (Fernandes et al., 2018). High O2 exposure time, in turn, may usher other biogeochemical mechanisms and conditions that augment organic carbon breakdown (Burdige, 2007), and in doing so enhance the availability of simple fatty acids for methanogens, sulfate reducers, and acetogens in the upper sediment layers of SSK42/5 and SSK42/6 (Fig. 4a and b). Expectedly, with increasing diagenetic maturity and aging of sediments in the deeper layers of the pOMZ cores, the residual organic matter becomes increasingly refractory to degradation, and reduced metabolites also become scarce. This may be the reason behind the overall decrease in methanogens, sulfate reducers, and acetogens along SSK42/5 (Fig. 4a) and SSK42/6 (Fig. 4b), as well as the loss of viability of methanogens in the deeper layers of these cores (Fig. 6) (notably, methanogens are likely to lose out to sulfate reducers with increasing competition for reduced metabolites; Hedderich and Whitman, 2006, 2013).
In contrast to the pOMZ scenario, the refractory nature of the organic matter deposited in the sOMZ sediments, and consequent shortage of reduced metabolites in the topmost sediment layer, seems to be the reason why relative abundance of all anaerobic metabolic types requiring simple fatty acids except sulfate reducers is lowest at the top layer of SSK42/9 (Fig. 4c). Notably, within this core, overall microbial diversity is also lowest in the topmost layer (Fig. 3). Albeit high bottom-water DO (178 µM at the time of the current sampling) prevails in this shallow coastal territory for approximately two-thirds of a year (Naqvi et al., 2006; Fernandes et al., 2020), high sedimentation rate (0.21 cm yr−1) of the region (Fig. 1d) potentially leads to an effectively low O2 exposure time (Canfield, 1994; Hartnett et al., 1998) for the terrestrial-component-rich organic matter, most of which would apparently degrade only in the presence of O2 (Kristensen et al., 1995; Burdige, 2007). In this way, the supply of simple fatty acids for methanogens, sulfate reducers, and acetogens gets critically limited in the upper sediment layers of SSK42/9. However, sharp increase in the relative abundances of methanogens, ANME, and acetogens (alongside a small decline of sulfate reducers) within a few centimeters below sea floor of the SSK42/9, followed by steadying of the prevalence of all the four metabolic types (Fig. 4c), signals that the catabolic constraint eases immediately below the top layer, and small amounts of the deposited organic matter depolymerize slowly (plausibly via anaerobic pathways) with increasing diagenetic maturity of the sediment (Hartnett et al., 1998).
The present exploration revealed wide divergence of sedimentary microbiomes in the distinct depositional environments of a seasonal (shallow coastal) and a perennial (deep sea) oxygen minimum zone, across a continental margin. Microbiome divergence of the sOMZ and pOMZ sediment systems was not reflected in their comparable pore-fluid chemistries; instead, distinct organic matter dynamics in relation to its composition, deposition, and post-depositional fate seemed to shape the ecosystems amidst only a circuitous influence of water column DO concentrations. More tandem investigations of microbiome and geochemistry are needed across global shelf–slope sediment systems to obtain comprehensive knowledge on the geomicrobial dynamics of the Earth’s continental margins.
All nucleotide sequence data have been deposited in the Short Read Archive (SRA) of the National Center for Biotechnology Information (NCBI), MD, USA, under the BioProject accession number PRJNA309469: (i) the metagenome shotgun sequence datasets have the run accession numbers SRR3646127 through SRR3646132, SRR3646144, SRR3646145, SRR3646147, SRR3646148, SRR3646150 through SRR3646153, SRR3646155 through SRR3646158, and SRR3646160 through SRR3646165, SRR3570036, SRR3570038, SRR3577067, SRR3577068, SRR3577070, SRR3577071, SRR3577073, SRR3577076, SRR3577078, SRR3577079, SRR3577081, SRR3577082, SRR3577086, SRR3577087, SRR3577090, SRR3577311, SRR3577337, SRR3577338, SRR3577341, SRR3577343 through SRR3577345, SRR3577347, SRR3577349, SRR3577350, and SRR3577351; and (ii) the metatranscriptome sequence datasets have the run accession numbers SRR7990741 and SRR7983762.
The supplementary materials related to this article are available in the form of an MS Word file named Supplementary Information and one MS Excel file named Supplementary Dataset. The supplement related to this article is available online at: https://doi.org/10.5194/bg-18-5203-2021-supplement.
WG conceived the study, designed the experiments, interpreted the results, and wrote the paper. SB anchored the whole microbiological work, performed the experiments, and analyzed and curated all processed and unprocessed data. AM led the mission SSK42 and all geochemistry studies therein. AM, RC, and BD made intellectual contributions to the paper. TM, CR, JS, MJR, SM, AS, AKC, NM, and SC performed microbiological experiments and/or data analysis. SF and AP performed geochemical experiments. All authors read and vetted the manuscript.
The authors declare no competing interest.
Publisher's note: Copernicus Publications remains neutral with regard to jurisdictional claims in published maps and institutional affiliations.
We thank the CSIR-National Institute of Oceanography (NIO) for facilitating the geochemical studies and the research cruise SSK42 for acquisition of sediment cores. All the support received from the CSIR-NIO Ship Cell members and the crew members of SSK42 is gratefully acknowledged. Sabyasachi Bhattacharya received a fellowship from Bose Institute. Svetlana Fernandes and Jagannath Sarkar received fellowships from the Council of Scientific and Industrial Research, Government of India (GoI). Chayan Roy and Moidu Jameela Rameez got fellowships from the University Grants Commission, GoI. Subhrangshu Mandal got a fellowship from the Department of Science and Technology, GoI. Nibendu Mondal got fellowships from the Science and Engineering Research Board, GoI (under the grant EMR/2016/002703) and Bose Institute. Sumit Chatterjee received a fellowship from the Department of Biotechnology, GoI.
This research has been supported by the Earth System Sciences Organization, Ministry of Earth Sciences (grant no. MoES/36/00IS/Extra/19/2013) and Bose Institute (Intramural Faculty Grants). The research cruise SSK42 was also funded by the Ministry of Earth Sciences, GoI, via GAP2303.
This paper was edited by Tina Treude and reviewed by two anonymous referees.
Acharya, S. S. and Panigrahi, M. K.: Eastward shift and maintenance of Arabian Sea oxygen minimum zone: understanding the paradox, Deep-Sea Res. Pt. I, 115, 240–252, https://doi.org/10.1016/j.dsr.2016.07.004, 2016.
Alam, M., Pyne, P., Mazumdar, A., Peketi, A., and Ghosh, W.: Kinetic enrichment of 34S during proteobacterial thiosulfate oxidation and the conserved role of SoxB in S–S bond breaking, Appl. Environ. Microb., 79, 4455–4464, https://doi.org/10.1128/AEM.00956-13, 2013.
Alam, M., Fernandes, S., Mandal, S., Rameez, M. J., Bhattacharya, S., Peketi, A., Mazumdar, A., and Ghosh, W.: 34S enrichment as a signature of thiosulfate oxidation in the “Proteobacteria”, FEMS Microbiol. Lett., 368, fnab073, https://doi.org/10.1093/femsle/fnab073, 2021.
Aller, R. C.: Sedimentary diagenesis, depositional environments, and benthic fluxes treatise on geochemistry, in: Treatise on Geochemistry, vol. 8, edited by: Holland, H. and Turekian, K. K., Elsevier, Oxford, UK, 293–334, https://doi.org/10.1016/B978-0-08-095975-7.00611-2, 2014.
Aller, R. C. and Blair, N. E.: Early diagenetic remineralization of sedimentary organic C in the Gulf of Papua deltaic complex (Papua New Guinea): net loss of terrestrial C and diagenetic fractionation of C isotopes, Geochim. Cosmochim. Ac., 68, 1815–1825, https://doi.org/10.1016/j.gca.2003.10.028, 2004.
Aller, R. C., Blair, N. E., Xia, Q., and Rude, P. D.: Remineralization rates, recycling, and storage of carbon in Amazon shelf sediments, Cont. Shelf Res., 16, 753–786, https://doi.org/10.1016/0278-4343(95)00046-1, 1996.
Bhattacharya, S., Roy, C., Mandal, S., Rameez, M. J., Sarkar, J., Fernandes, S., Mapder, T., Alam, M., Roy, R., Mondal, N., Pyne, P., Halder, P. K., Peketi, A., Chakraborty, R., Mazumdar, A., and Ghosh, W.: Metabolically-active obligate aerobes in anoxic (sulfidic) marine sediments, bioRxiv, 728287, https://doi.org/10.1101/728287, 2019.
Bhattacharya, S., Roy, C., Mandal, S., Sarkar, J., Rameez, M. J., Mondal, N. Mapder, T., Chatterjee, S., Pyne, P., Alam, M., Halder, P. K., Roy, R., Fernandes, S., Peketi, A., Chakraborty, R., Mazumdar, A., and Ghosh, W.: Aerobic microbial communities in the sediments of a marine oxygen minimum zone, FEMS Microbiol. Lett., 367, fnaa157, https://doi.org/10.1093/femsle/fnaa157, 2020.
Burdige, D. J.: The kinetics of organic matter mineralization in anoxic marine sediments. J. Mar. Res. 49, 727–761, https://doi.org/10.1357/002224091784995710, 1991.
Burdige, D. J.: Preservation of organic matter in marine sediments: controls, mechanisms, and an imbalance in sediment organic carbon budgets?, Chem. Rev., 107, 467–485, https://doi.org/10.1021/cr050347q, 2007.
Camacho, C., Coulouris, G., Avagyan, V., Ma, N., Papadopoulos, J., Bealer, K., and Madden, T. L.: BLAST+: architecture and applications, BMC Bioinformatics, 10, 421, https://doi.org/10.1186/1471-2105-10-421, 2009.
Canfield, D. E.: Factors influencing organic carbon preservation in marine sediments, Chem. Geol., 114, 315–329, https://doi.org/10.1016/0009-2541(94)90061-2, 1994.
Cavan, E. L., Trimmer, M., Shelley, F., and Sanders, R.: Remineralization of particulate organic carbon in an ocean oxygen minimum zone, Nat. Commun., 8, 14847, https://doi.org/10.1038/ncomms14847, 2017.
Chronopoulou, P. M., Shelley, F., Pritchard, W. J., Maanoja, S. T., and Trimmer, M.: Origin and fate of methane in the Eastern Tropical North Pacific oxygen minimum zone, ISME J., 11, 1386–1399, https://doi.org/10.1038/ismej.2017.6, 2017.
D'Hondt, S., Pockalny, R., Fulfer, V. M., and Spivack, A. J.: Subseafloor life and its biogeochemical impacts, Nat. Commun., 10, 3519, https://doi.org/10.1038/s41467-019-11450-z, 2019.
Drake, H. L., Küsel, K., and Matthies, C.: Acetogenic Prokaryotes, in: The Prokaryotes, volume Ecophysiology and Biochemistry, edited by: Dworkin, M., Falkow, S., Rosenberg, E., Schleifer, K.-H., and Stackebrandt, E., Springer, New York, USA, 354–420, https://doi.org/10.1007/0-387-30742-7_13, 2006.
Drake, H. L., Küsel, K., and Matthies, C.: Acetogenic Prokaryotes, in: The Prokaryotes, volume Prokaryotic Physiology and Biochemistry, edited by: Rosenberg, E., DeLong, E. F., Lory, S., Stackebrandt, E., and Thompson, F., Springer, Berlin, Germany, 3–60, https://doi.org/10.1007/978-3-642-30141-4_61, 2013.
Euzéby, J. P.: List of Bacterial Names with Standing in Nomenclature: a folder available on the Internet, Int. J. Syst. Evol. Micr., 47, 590–592, https://doi.org/10.1099/00207713-47-2-590, 1997.
Fairbanks, R. G., Mortlock, R. A., Chiu, T. C., Cao, L., Kaplan, A., Guilderson, T. P., Fairbanks, T. W., Bloom, A. L., Grootes, P. M., and Nadeau, M. J.: Radiocarbon calibration curve spanning 0 to 50,000 years BP based on paired 230Th/234U/238U and 14C dates on pristine corals, Quaternary Sci. Rev., 24, 1781–1796, https://doi.org/10.1016/j.quascirev.2005.04.007, 2005.
Ferdelman, T. G., Lee, C., Pantoja, S., Harder, J., Bebout, B. M., and Fossing, H.: Sulfate reduction and methanogenesis in a Thioploca-dominated sediment off the coast of Chile, Geochim. Cosmochim. Ac., 61, 3065–3079, https://doi.org/10.1016/S0016-7037(97)00158-0, 1997.
Fernandes, S., Mazumdar, A., Bhattacharya, S., Peketi, A., Mapder, T., Roy, R., Carvalho, M. A., Roy, C., Mahalakshmi, P., Silva, R., Rao, P. S., Banik, S., and Ghosh, W.: Enhanced carbon-sulfur cycling in the sediments of Arabian Sea oxygen minimum zone center, Sci. Rep., 8, 8665, https://doi.org/10.1038/s41598-018-27002-2, 2018.
Fernandes, S., Mazumdar, A., Peketi, A., Anand, S. S., Rengarajan, R., Jose, A., Manaskanya, A., Carvalho, M. A., and Shetty, D.: Sulfidization processes in seasonally hypoxic shelf sediments: A study off the West coast of India, Mar. Petrol. Geol., 104353, https://doi.org/10.1016/j.marpetgeo.2020.104353, 2020.
Fischer, D., Sahling, H., Nöthen, K., Bohrmann, G., Zabel, M., and Kasten, S.: Interaction between hydrocarbon seepage, chemosynthetic communities, and bottom water redox at cold seeps of the Makran accretionary prism: insights from habitat-specific pore water sampling and modeling, Biogeosciences, 9, 2013–2031, https://doi.org/10.5194/bg-9-2013-2012, 2012.
Ghosh, W., Roy, C., Roy, R., Nilawe, P., Mukherjee, A., Haldar, P. K., Chauhan, N. K., Bhattacharya, S., Agarwal, A., George, A., and Pyne, P.: Resilience and receptivity worked in tandem to sustain a geothermal mat community amidst erratic environmental conditions, Sci. Rep., 5, 12179, https://doi.org/10.1038/srep12179, 2015.
Gill, S. R., Pop, M., DeBoy, R. T., Eckburg, P. B., Turnbaugh, P. J., Samuel, B. S., Gordon, J. I., Relman, D. A., Fraser-Liggett, C. M., and Nelson, K. E.: Metagenomic analysis of the human distal gut microbiome, Science, 312, 1355–1359, https://doi.org/10.1126/science.1124234, 2006.
Gupta, G. V. M., Sudheesh, V., Sudharma, K. V., Saravanane, N., Dhanya, V., Dhanya, K. R., Lakshmi, G., Sudhakar, M., and Naqvi, S. W. A.: Evolution to decay of upwelling and associated biogeochemistry over the southeastern Arabian Sea shelf, J. Geophys. Res., 121, 159–175, https://doi.org/10.1002/2015JG003163, 2016.
Hartnett, H. E., Keil, R. G., Hedges, J. I., and Devol, A. H.: Influence of oxygen exposure time on organic carbon preservation in continental margin sediments, Nature, 391, 572–575, https://doi.org/10.1038/35351, 1998.
Hedderich, R. and Whitman, W. B.: Physiology and biochemistry of the methane-producing archaea, in: The Prokaryotes, volume Ecophysiology and Biochemistry, edited by: Dworkin, M., Falkow, S., Rosenberg, E., Schleifer, K.-H., and Stackebrandt, E., Springer, New York, USA, 1050–1079, https://doi.org/10.1007/0-387-30742-7_34, 2006.
Hedderich, R. and Whitman, W. B.: Physiology and biochemistry of the methane-producing archaea, in: The Prokaryotes, volume Prokaryotic Physiology and Biochemistry, edited by: Rosenberg, E., DeLong, E. F., Lory, S., Stackebrandt, E., and Thompson, F., Springer, Berlin, Germany, 635–662, https://doi.org/10.1007/978-3-642-30141-4_81, 2013.
Himmler, T., Birgel, D., Bayon, G., Pape, T., Ge, L., Bohrmann, G., and Peckmann, J.: Formation of seep carbonates along the Makran convergent margin, northern Arabian Sea and a molecular and isotopic approach to constrain the carbon isotopic composition of parent methane, Chem. Geol., 415, 102–117, https://doi.org/10.1016/j.chemgeo.2015.09.016, 2015.
Hoehler, T. M., Albert, D. B., Alperin, M. J., and Martens, C. S.: Acetogenesis from CO2 in an anoxic marine sediment, Limnol. Oceanogr., 44, 662–667, https://doi.org/10.4319/lo.1999.44.3.0662, 1999.
Holmkvist, L., Ferdelman, T. G., and Jørgensen, B. B.: A cryptic sulfur cycle driven by iron in the methane zone of marine sediment (Aarhus Bay, Denmark), Geochim. Cosmochim. Ac., 75, 3581–3599, https://doi.org/10.1016/j.gca.2011.03.033, 2011.
Huerta-Cepas, J., Forslund, K., Coelho, L. P., Szklarczyk, D., Jensen, L. J., Von Mering, C., and Bork, P.: Fast genome-wide functional annotation through orthology assignment by eggNOG-mapper. Mol. Biol. Evol., 34, 2115–2122, https://doi.org/10.1093/molbev/msx148, 2017.
Huerta-Cepas, J., Szklarczyk, D., Heller, D., Hernández-Plaza, A., Forslund, S. K., Cook, H., Mende, D. R., Letunic, I., Rattei, T., Jensen, L. J., and von Mering, C.: eggNOG 5.0: a hierarchical, functionally and phylogenetically annotated orthology resource based on 5090 organisms and 2502 viruses, Nucleic Acids Res., 47, D309–D314, https://doi.org/10.1093/nar/gky1085, 2019.
Hyatt, D., Chen, G. L., Locascio, P. F., Land, M. L., Larimer, F. W., and Hauser, L. J.: Prodigal: prokaryotic gene recognition and translation initiation site identification, BMC Bioinformatics, 11, 119, https://doi.org/10.1186/1471-2105-11-119, 2010.
Jessen, G. L., Lichtschlag, A., Ramette, A., Pantoja, S., Rossel, P. E., Schubert, C. J., Struck, U., and Boetius, A.: Hypoxia causes preservation of labile organic matter and changes seafloor microbial community composition (Black Sea), Sci. Adv., 3, e1601897, https://doi.org/10.1126/sciadv.1601897, 2017.
Jones, B. V., Begley, M., Hill, C., Gahan, C. G., and Marchesi, J. R.: Functional and comparative metagenomic analysis of bile salt hydrolase activity in the human gut microbiome, P. Natl. Acad. Sci. USA, 105, 13580–13585, https://doi.org/10.1073/pnas.0804437105, 2008.
Jørgensen, B. B. and Parkes, R. J.: Role of sulfate reduction and methane production by organic carbon degradation in eutrophic fjord sediments (Limfjorden, Denmark), Limnol. Oceanogr., 55, 1338–1352, https://doi.org/10.4319/lo.2010.55.3.1338, 2010.
Kallmeyer, J., Pockalny, R., Adhikari, R., Smith, D. C., and D'Hondt, S.: Global distribution of microbial abundance and biomass in subseafloor sediment, P. Natl. Acad. Sci. USA, 109, 16213–16216, https://doi.org/10.1073/pnas.1203849109, 2012.
Krishnaswami, S. and Lal, D.: Radionuclide limnochronology, in: Lakes – Chemistry, Geology, Physics, edited by: Lerman, A., Springer-Verlag, New York, USA, 153–177, https://doi.org/10.1007/978-1-4757-1152-3_6, 1978.
Kristensen, E., Ahmed, S. I., and Devol, A. H.: Aerobic and anaerobic decomposition of organic matter in marine sediment: which is fastest?, Limnol. Oceanogr., 40, 1430–1437, https://doi.org/10.4319/lo.1995.40.8.1430, 1995.
Lam, P. and Kuypers, M. M. M.: Microbial nitrogen cycling processes in oxygen minimum zones, Annu. Rev. Mar. Sci., 3, 317–345, https://doi.org/10.1146/annurev-marine-120709-142814, 2011.
Langmead, B. and Salzberg, S. L.: Fast gapped-read alignment with Bowtie2, Nat. Methods, 9, 357–359, https://doi.org/10.1038/nmeth.1923, 2012.
LaRowe, D. E., Arndt, S., Bradley, J. A., Estes, E. R., Hoarfrost, A., Lang, S. Q., Lloyd, K. G., Mahmoudi, N., Orsi, W. D., Walter, S. S., and Steen, A. D.: The fate of organic carbon in marine sediments – New insights from recent data and analysis, Earth-Sci. Rev., 204, 103146, https://doi.org/10.1016/j.earscirev.2020.103146, 2020.
Levin, L. A., Ekau, W., Gooday, A. J., Jorissen, F., Middelburg, J. J., Naqvi, S. W. A., Neira, C., Rabalais, N. N., and Zhang, J.: Effects of natural and human-induced hypoxia on coastal benthos, Biogeosciences, 6, 2063–2098, https://doi.org/10.5194/bg-6-2063-2009, 2009.
Li, D., Liu, C. M., Luo, R., Sadakane, K., and Lam, T. W.: MEGAHIT: an ultra-fast single-node solution for large and complex metagenomics assembly via succinct de Bruijn graph, Bioinformatics, 31, 1674–1676, https://doi.org/10.1093/bioinformatics/btv033, 2015.
Madhupratap, M., Kumar, S. P., Bhattathiri, P. M. A., Kumar, M. D., Raghukumar, S., Nair, K. K. C., and Ramaiah, N.: Mechanism of the biological response to winter cooling in the northeastern Arabian Sea, Nature, 384, 549–552, https://doi.org/10.1038/384549a0, 1996.
Magurran, A. E.: Measuring Biological Diversity, Blackwell Science Ltd., Oxford, 2004.
Maltby, J., Sommer, S., Dale, A. W., and Treude, T.: Microbial methanogenesis in the sulfate-reducing zone of surface sediments traversing the Peruvian margin, Biogeosciences, 13, 283–299, https://doi.org/10.5194/bg-13-283-2016, 2016.
Maltby, J., Steinle, L., Löscher, C. R., Bange, H. W., Fischer, M. A., Schmidt, M., and Treude, T.: Microbial methanogenesis in the sulfate-reducing zone of sediments in the Eckernförde Bay, SW Baltic Sea, Biogeosciences, 15, 137–157, https://doi.org/10.5194/bg-15-137-2018, 2018.
Mandal, S., Bhattacharya, S., Roy, C., Rameez, M. J., Sarkar, J., Mapder, T., Fernandes, S., Peketi, A., Mazumdar, A., and Ghosh, W.: Cryptic roles of tetrathionate in the sulfur cycle of marine sediments: microbial drivers and indicators, Biogeosciences, 17, 4611–4631, https://doi.org/10.5194/bg-17-4611-2020, 2020.
Marquardt, D. W.: An Algorithm for Least–Squares Estimation of Nonlinear Parameters, J. Soc. Ind. Appl. Math., 11, 431–441, https://doi.org/10.1137/0111030, 1963.
Mathew, A. K., Bhui, I., Banerjee, S. N., Goswami, R., Chakraborty, A. K., Shome, A., Balachandran, S., and Chaudhury, S.: Biogas production from locally available aquatic weeds of Santiniketan through anaerobic digestion, Clean Techn. Environ. Policy, 17, 1681–1688, https://doi.org/10.1007/s10098-014-0877-6, 2015.
Moré, J. J.: The Levenberg-Marquardt algorithm: Implementation and theory, in: Numerical Analysis, edited by: Watson, G. A., Springer, Berlin, Germany, 105–116, https://doi.org/10.1007/BFb0067700, 1978.
Middelburg, J. J.: The Return from organic to inorganic carbon, in: Marine Carbon Biogeochemistry: A Primer for Earth System Scientists, Springer, Cham, Switzerland, 37–56, https://doi.org/10.1007/978-3-030-10822-9_3, 2019a.
Middelburg, J. J.: Carbon processing at the seafloor, in: Marine Carbon Biogeochemistry: A Primer for Earth System Scientists, Springer, Cham, Switzerland, 57–75, https://doi.org/10.1007/978-3-030-10822-9_4, 2019b.
Middelburg, J. J. and Levin, L. A.: Coastal hypoxia and sediment biogeochemistry, Biogeosciences, 6, 1273–1293, https://doi.org/10.5194/bg-6-1273-2009, 2009.
Mikheenko, A., Saveliev, V., and Gurevich, A.: MetaQUAST: evaluation of metagenome assemblies, Bioinformatics, 32, 1088–1090, https://doi.org/10.1093/bioinformatics/btv697, 2016.
Mitterer, R. M.: Methanogenesis and sulfate reduction in marine sediments: A new model, Earth Planet. Sc. Lett., 295, 358–366, https://doi.org/10.1016/j.epsl.2010.04.009, 2010.
Muyzer, G. and Stams, A. J. M.: The ecology and biotechnology of sulphate-reducing bacteria, Nat. Rev. Microbiol., 6, 441–454, https://doi.org/10.1038/nrmicro1892, 2008.
Naqvi, S. W. A., Jayakumar, D. A., Narvekar, P. V., Naik, H., Sarma, V. V. S. S., D'souza, W., Joseph, S., and George, M. D.: Increased marine production of N2O due to intensifying anoxia on the Indian continental shelf, Nature, 408, 346–349, https://doi.org/10.1038/35042551, 2000.
Naqvi, S. W. A., Naik, H., Jayakumar, D. A., Shailaja, M. S., and Narvekar, P. V.: Seasonal oxygen deficiency over the western continental shelf of India, in: Past and Present Water Column Anoxia, Nato Science Series: IV: Earth and Environmental Sciences, vol. 64, edited by: Neretin, L., Springer, Dordrecht, The Netherlands, 195–224, https://doi.org/10.1007/1-4020-4297-3_08, 2006.
Nurk, S., Bankevich, A., Antipov, D., Gurevich, A. A., Korobeynikov, A., Lapidus, A., Prjibelski, A. D., Pyshkin, A., Sirotkin, A., Sirotkin, Y., and Stepanauskas, R.: Assembling single-cell genomes and mini-metagenomes from chimeric MDA products, J. Comput. Biol., 20, 714–737, https://doi.org/10.1089/cmb.2013.0084, 2013.
Orsi, W. D., Coolen, M. J., Wuchter, C., He, L., More, K. D., Irigoien, X., Chust, G., Johnson, C., Hemingway, J. D., Lee, M., and Galy, V.: Climate oscillations reflected within the microbiome of Arabian Sea sediments, Sci. Rep., 7, 6040, https://doi.org/10.1038/s41598-017-05590-9, 2017.
Parks, D. H., Imelfort, M., Skennerton, C. T., Hugenholtz, P., and Tyson, G. W.: CheckM: assessing the quality of microbial genomes recovered from isolates, single cells, and metagenomes, Genome Res., 25, 1043–1055, https://doi.org/10.1101/gr.186072.114, 2015.
Parks, D. H., Chuvochina, M., Waite, D. W., Rinke, C., Skarshewski, A., Chaumeil, P. A., and Hugenholtz, P.: A standardized bacterial taxonomy based on genome phylogeny substantially revises the tree of life, Nat. Biotechnol., 36, 996–1004, https://doi.org/10.1038/nbt.4229, 2018.
Parkes, R. J., Cragg, B. A., and Wellsbury, P.: Recent studies on bacterial populations and processes in subseafloor sediments: A review, Hydrogeol. J., 8, 11–28, https://doi.org/10.1007/PL00010971, 2000.
Parte, A. C., Sardà Carbasse J., Meier-Kolthoff, J. P., Reimer, L. C., and Göker, M.: List of Prokaryotic names with Standing in Nomenclature (LPSN) moves to the DSMZ, Int. J. Syst. Evol. Micr., 70, 5607–5612, https://doi.org/10.1099/ijsem.0.004332, 2020.
Quast, C., Pruesse, E., Yilmaz, P., Gerken, J., Schweer, T., Yarza, P., Peplies, J., and Glöckner, F. O.: The SILVA ribosomal RNA gene database project: improved data processing and web-based tools, Nucleic Acids Res., 41, D590–D596, https://doi.org/10.1093/nar/gks1219, 2013.
Roy, C., Rameez, M. J., Haldar, P. K., Peketi, A., Mondal, N., Bakshi, U., Mapder, T., Pyne, P., Fernandes, S., Bhattacharya, S., Roy, R., Mandal, S., O'Neill, W. K., Mazumdar, A., Mukhopadhyay, S. K., Mukherjee, A., Chakraborty, R., Hallsworth, J. E., and Ghosh, W.: Microbiome and ecology of a hot spring-microbialite system on the Trans-Himalayan Plateau, Sci. Rep., 10, 5917, https://doi.org/10.1038/s41598-020-62797-z, 2020.
Ruvalcaba Baroni, I., Palastanga, V., and Slomp, C. P.: Enhanced organic carbon burial in sediments of oxygen minimum zones upon ocean deoxygenation, Front. Mar. Sci., 6, 839, https://doi.org/10.3389/fmars.2019.00839, 2020.
Schmieder, R. and Edwards, R.: Quality control and preprocessing of metagenomic datasets, Bioinformatics, 27, 863–864, https://doi.org/10.1093/bioinformatics/btr026, 2011.
Shannon, R. D. and White, J. R.: The effects of spatial and temporal variations in acetate and sulfate on methane cycling in two Michigan peatlands, Limnol. Oceanogr., 41, 435–443, https://doi.org/10.4319/lo.1996.41.3.0435, 1996.
Stuiver, M. and H. A. Polach.: Discussion Reporting of 14C data, Radiocarbon, 19, 355–363, https://doi.org/10.1017/S0033822200003672, 1977.
Sugimoto, A. and Wada, E.: Carbon isotopic composition of bacterial methane in a soil incubation experiment: Contributions of acetate and CO2H2, Geochim. Cosmochim. Ac., 57, 4015–4027, https://doi.org/10.1016/0016-7037(93)90350-6, 1993.
Thauer, R. K.: Biochemistry of Methanogenesis: a Tribute to Marjory Stephenson, Microbiology, 144, 2377–2406, https://doi.org/10.1099/00221287-144-9-2377, 1998.
Tringe, S. G., Von Mering, C., Kobayashi, A., Salamov, A. A., Chen, K., Chang, H. W., Podar, M., Short, J. M., Mathur, E. J., Detter, J. C., and Bork, P.: Comparative metagenomics of microbial communities, Science, 308, 554–557, https://doi.org/10.1126/science.1107851, 2005.
Treude, T., Krüger, M., Boetius. A., and Jørgensen, B. B.: Environmental control on anaerobic oxidation of methane in the gassy sediments of Eckernförde Bay (German Baltic), Limnol. Oceanogr., 50, 1771–1786, https://doi.org/10.4319/lo.2005.50.6.1771, 2005.
Turner, R. E., Rabalais, N. N., and Justic, D.: Gulf of Mexico hypoxia: Alternate states and a legacy, Environ. Sci. Technol., 42, 2323–2327, https://doi.org/10.1021/es071617k, 2008.
Tyson, R. V.: Sedimentary Organic Matter: Organic Facies and Palynofacies, Springer, Dordrecht, The Netherlands, 383–394, https://doi.org/10.1007/978-94-011-0739-6, 1995.
Ulloa, O., Canfield, D. E., DeLong, E. F., Letelier, R. M., and Stewart, F. J.: Microbial oceanography of anoxic oxygen minimum zones, P. Natl. Acad. Sci. USA, 109, 15996–16003, https://doi.org/10.1073/pnas.1205009109, 2012.
Zhu, W., Lomsadze, A., and Borodovsky, M.: Ab initio gene identification in metagenomic sequences, Nucleic Acids Res., 38, e132, https://doi.org/10.1093/nar/gkq275, 2010.