the Creative Commons Attribution 4.0 License.
the Creative Commons Attribution 4.0 License.
 | 28 Sep 2021
Long-term spatiotemporal variations in and expansion of low-oxygen conditions in the Pearl River estuary: a study synthesizing observations during 1976–2017
Jiatang Hu
Zhongren Zhang
Jia Huang
The Pearl River estuary (PRE) frequently experiences low-oxygen conditions in summer, with large-extent low-oxygen events and a long-term deoxygenation trend being reported recently. In this study, we provide a synthesis of the spatiotemporal patterns and incidence of different low-oxygen levels in the PRE based on the in situ observations collected from 1976 to 2017 and aim to elucidate the underlying mechanisms of low-oxygen conditions and their changes over the past 4 decades. The long-term observations show that the dissolved oxygen (DO) content in the PRE has had significant temporal variability and spatial heterogeneity. Low-oxygen conditions (DO < 4 mg L−1) have occurred mostly in the bottom waters of 5–30 m during summer and early autumn, with locations and severity varying substantially between years. Coastal waters from the southwest of Lantau Island to the northeast of the Wanshan Archipelago were identified as a hotspot area prone to subsurface low-oxygen conditions due to the combined effects of comparatively deep topography, a certain residence time and stability of the water column, and enhanced oxygen depletion related to high phytoplankton biomass. In addition, the low-oxygen waters, either directly imported from the upstream reaches or generated locally and further transported with the estuarine circulation, also had considerable impacts on the oxygen levels in the estuary. As for early autumn, marked low-oxygen conditions were present in both the surface and the bottom waters. A large area affected by low oxygen (∼ 4450 km2) was found in September 2006, where the low-oxygen conditions were comparable to the most severe ones observed in summer. The area was formed by the inflows of low-oxygen waters from the upstream reaches and enhanced oxygen depletion driven by an intricate coupling of physical and biogeochemical processes. Our analysis also reveals there has been an apparent expansion of the summertime low-oxygen conditions at the bottom of the PRE since the years around 2000, coincident with major environment changes in the Pearl River region. Overall, the PRE seems to be undergoing a transition from a system characterized by episodic, small-scale hypoxic events (DO < 2 mg L−1) to a system with seasonal, estuary-wide hypoxic conditions in summer. Although exacerbated eutrophication associated with anthropogenic nutrient inputs has generally been considered the primary cause for the deterioration of low-oxygen conditions in the PRE, the sharp decline in sediment load may play an important role as well via increasing water transparency and thereby supporting higher and broader phytoplankton biomass in the estuary.
- Article
(11386 KB) - Full-text XML
-
Supplement
(340 KB) - BibTeX
- EndNote


Oxygen is fundamental to biogeochemical processes and life in aquatic environments. Its decline can impose significant impacts on aquatic ecosystems. When the dissolved oxygen (DO) level drops below 2 mg L−1, hypoxic conditions emerge and could have a series of undesirable biological and ecological consequences, such as causing extensive mortality of fish and dramatic changes in the biological community structures and sediment biogeochemical cycles, promoting the release of greenhouse gases and aggravating ocean acidification (Zhang et al., 2010; Cai et al., 2011; Middelburg and Levin, 2009; Diaz and Rosenberg, 2008). In recent decades, hypoxia (DO < 2 mg L−1) has frequently occurred in estuaries and coastal waters, largely ascribed to the influence of human activities in combination with global changes (Breitburg et al., 2018; Rabalais et al., 2010). Large-scale hypoxic zones have been observed in a variety of coastal systems, including the Baltic Sea, the northern Gulf of Mexico, Chesapeake Bay, Long Island Sound, and the Yangtze estuary, with substantial increases in the spatial extent, intensity, and duration of hypoxia in recent years (Fennel and Testa, 2019, and references therein).
A great number of studies have been carried out to investigate the short- and long-term changes in, underlying processes of, and controlling factors of coastal hypoxia. It has been clearly shown that the generation and development of hypoxia in densely populated and urbanized estuaries and other coastal systems are closely linked to intensifying eutrophication induced by anthropogenic nutrient inputs (Rabalais et al., 2010; Fennel and Testa, 2019). For example, the northern Gulf of Mexico experiences persistent, large-scale hypoxia in the bottom water every summer (with an area of 15 000 km2 on average) largely due to the high primary production stimulated by excessive nutrient loads from rivers together with strong density stratification (Bianchi et al., 2010; Rabalais et al., 2002). In addition, physical conditions such as winds and upwelling also play a significant role in regulating the intensity and duration of hypoxia (Yu et al., 2015; Feng et al., 2014). Compared with the northern Gulf of Mexico, the summertime hypoxic zone off the Yangtze estuary has both common (i.e., the intense stratification and eutrophication-driven primary production are the key mechanisms controlling hypoxia) and unique features. Its formation and evolution are influenced by a more complex interaction of various water masses, including Yangtze diluted water, Taiwan warm currents, Kuroshio subsurface water, and upwelled water (Zhang et al., 2018; Wei et al., 2017). Overall, the dynamics of hypoxia in estuaries and coastal waters are controlled by a combination of physical, biological, and chemical processes (e.g., photosynthesis, nitrification, water-column microbial respiration, sediment oxygen uptake), but the predominant ones vary by system. Also, the susceptibility to developing hypoxic conditions is significantly different between coastal systems, depending on their respective pressures from local pollution loads and capacities to resist such pressures under regional physical and biogeochemical regimes.
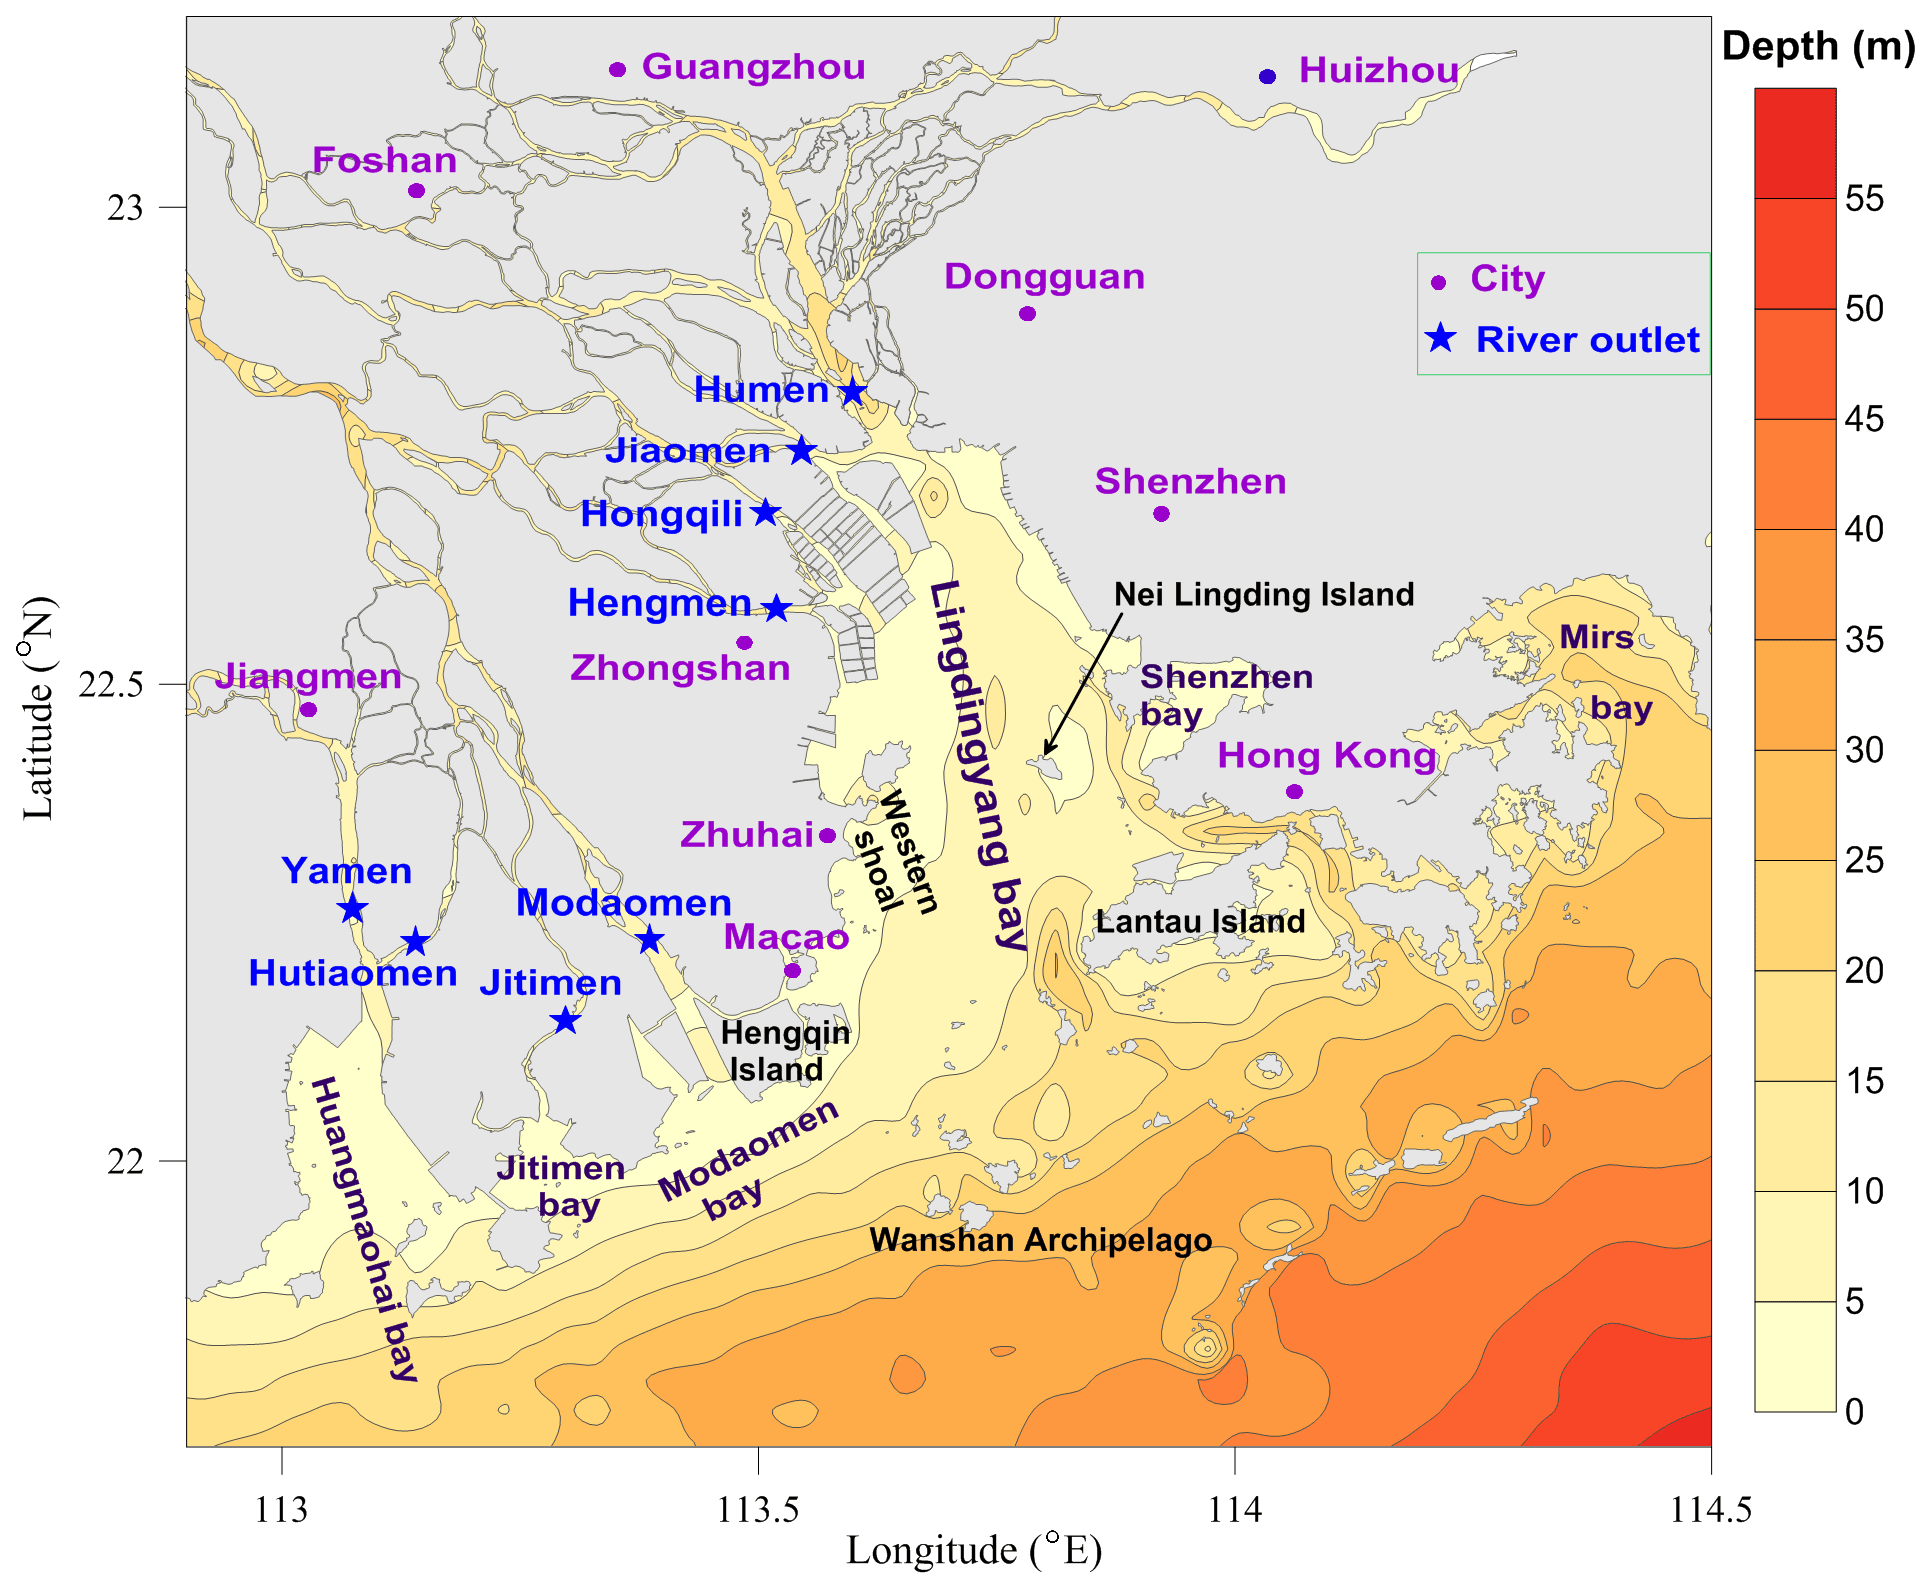
Figure 1Map of the Pearl River estuary (PRE) and adjacent coastal waters. Note that the purple dots denote cities in the Guangdong–Hong Kong–Macao Greater Bay Area and the blue stars indicate the locations of eight outlets of the Pearl River freshwater discharged into the PRE; Humen, Jiaomen, Hongqili, and Hengmen are typically called the four eastern river outlets, while the others are called the four western river outlets.
Located in the south of China, the Pearl River estuary (PRE, Fig. 1) is the central area of the Guangdong–Hong Kong–Macao Greater Bay Area, surrounded by several megacities (including Guangzhou, Shenzhen, and Hong Kong). With a rapidly growing population and socioeconomic development, the PRE receives large inputs of nutrients and diverse contaminants, which has led to a wide range of severe problems in the estuary, such as eutrophication, red tides, hypoxia, and a decline in fishery resources (Dai et al., 2008; Harrison et al., 2008; X. Li et al., 2020). There has been great concern about hypoxia in the PRE since the 1980s. Based on historical observations, Lin et al. (2001) reported for the first time the incidence of bottom-water hypoxia in the PRE. In follow-up field surveys, hypoxic events were also observed in the western shoal of the Lingdingyang Bay, the outer Modaomen and Huangmaohai bays, and the waters adjacent to Lantau Island and the Wanshan Archipelago (Su et al., 2017; Cui et al., 2019; Shi et al., 2019; Yin et al., 2004; Lu et al., 2018; Qian et al., 2018; Li et al., 2018; Ye et al., 2013). Extensive research has been conducted to explore the distribution and influential factors of hypoxia in the PRE by means of field observations and numerical simulations. Results showed that hypoxia mainly appeared in the bottom waters during summer, and freshwater-induced stratification and sediment oxygen consumption are the dominant factors leading to its generation (Zhang and Li, 2010; Wang et al., 2017; Yin et al., 2004); however, due to the combined effects of relatively shallow depth, high water turbidity, strong physical processes, and the short duration of vertical stratification (eroded by periodic tidal forcing and strong wind events; Luo et al., 2009; Lu et al., 2018), hypoxia was generally confined to a very small scale and occurred in an episodic and intermittent manner (X. Li et al., 2020; Rabouille et al., 2008). Nevertheless, notable low-oxygen (DO < 4 mg L−1) events, with their spatial extent much larger than that of previous ones, have been reported in recent works (Shi et al., 2019; Lu et al., 2018; Su et al., 2017; Li et al., 2018). Su et al. (2017) reported that the areal extent of bottom DO < 2 mg L−1 in July 2014 exceeded 290 km2, and Li et al. (2018) reported that the extent of bottom DO < 4 mg L−1 in June 2015 was estimated at ∼ 1500 km2. There seems to be a growth of the areas affected by low-oxygen conditions in the PRE. Collectively, the problem of hypoxia has received great attention, but there is still a lack of in-depth investigation into the temporal and spatial variability in DO in the PRE, and the scope, frequency, and intensity of hypoxia as well as its long-term changes are poorly understood. Besides, most of the previous studies have focused on the summertime hypoxia, and it is unclear whether hypoxia also exists in other periods. This is an important issue that has long been ignored. In fact, as we will point it out in this study, there was a large area of hypoxia that occurred in early autumn as well, which appears to have had different features and driving mechanisms from those typically observed in summer.
Here we synthesize the observational data at sites collected during 1976–2017 to explore the temporal and spatial characteristics of DO and the long-term status of low-oxygen conditions (including their locations, areal extent, and frequencies of occurrence) in the PRE. We also aim to clarify the key factors controlling low-oxygen conditions and their expansion over recent years.
Table 1A summary of the observational data in the PRE used for analysis.

Data sources: (1) 42 cruises conducted by the South China Sea Environmental Monitoring Center during 1976–2006; (2) a summer cruise conducted by the Pearl River Estuary Pollution Project; (3) 4 seasonal cruises conducted by the State Oceanic Administration of China during 2006–2007; (4) 4 seasonal cruises conducted the Marine and Fishery Environmental Monitoring Center of Guangdong Province during 2013–2014; (5) data adopted from the literatures (Su et al., 2017; Lu et al., 2018; Shi et al., 2019).
* Note that in Dataset 1 chl a data were only available for September 2006.
2.1 Data sources, sample collections, and measurements
The data used for analysis comprise multiyear cruise observations in the PRE and its adjacent coastal waters compiled from five datasets (see Table 1 for details). The first dataset (Dataset 1) includes vertical profiles of salinity, temperature, DO, nutrients (ammonia, nitrate, and phosphate), and suspended sediment concentrations (SSCs) collected by the South China Sea Environmental Monitoring Center during 1976–2006 (with 42 cruises in total); data on chlorophyll a (chl a) were available in September 2006. Part of the data were also used for analysis by X. Li et al. (2020), in which the methods of sampling and chemical analysis were described in their Sect. 2.1. Further details on the sample collection, measurement, and data quality control are provided in the Supplement.
The second dataset (Dataset 2) contains historical measurements of water quality parameters collected from a summer cruise carried out by the Pearl River Estuary Pollution Project in July 1999 (Chen et al., 2004). The vertical profiles for temperature, salinity, turbidity, DO, and chl a were measured using a YSI 6600 multi-parameter automatic water quality sensor. The instrument was calibrated twice with standard samples. The chl a data obtained were compared with those obtained from 169 water samples measured by a Turner Designs 10-005R fluorometer, and the DO content was calibrated against the saturation level prior to each profile measurement (Yin et al., 2004). As for nutrients, samples were collected by Go-Flo water samplers from the surface, middle, and bottom and were measured on board with traditional standard methods following the same specification as for Dataset 1. The physical and biochemical parameters of Dataset 2 have been used in multiple observational studies (e.g., Yin et al., 2004; Yang et al., 2011) and modeling studies (e.g., Hu and Li, 2009; Luo et al., 2009).
The third dataset (Dataset 3) includes the observed salinity, temperature, and DO profiles collected by the State Oceanic Administration of China from cruises in four different seasons during 2006–2007, while the fourth dataset (Dataset 4) contains the water quality data (listed in Table 1) collected by the Marine and Fishery Environmental Monitoring Center of Guangdong Province from four seasonal cruises during 2013–2014. These two datasets both followed the same specifications as for Dataset 1 in terms of sampling procedures and chemical analysis. It is important to note that although the specifications issued by the National Standards of China have changed over time, the methodology and fundamental principles for analyzing salinity, DO, nutrients, and chl a involved in this study have not changed, ensuring the accuracy and comparability of the data. The last dataset (Dataset 5) is comprised of recent observations on bottom-water DO obtained from literature sources, including data in July 2014 (Su et al., 2017), July 2015 (Lu et al., 2018), and July 2017 (Shi et al., 2019). All these DO data were measured on board using the classic Winkler titration method (Parson et al., 1984). For further details see descriptions in the corresponding literatures.
In addition, the DO saturation state (DOS) and apparent oxygen utilization (AOU) were used to assess the severity of oxygen deficits in the PRE. The DOS metric (in units of %) was calculated as the ratio of the in situ DO concentration to its saturation level (DOsat) at a given salinity and temperature, while the AOU was defined as the difference between DOsat and DO, with negative AOU values indicating supersaturation status:
The DO saturation concentration (i.e., DOsat) was computed via the following equation (Garcia and Gordon, 1992):
where A0, A1, A2, A3, A4, and A5 are constants with values of 5.80818, 3.20684, 4.11890, 4.93845, 1.01567, and 1.41575, respectively; B0, B1, B2, and B3 are constants with values of −7.01211 × 10⁻³, −7.2595 × 10⁻³, −7.93334 × 10⁻³, and −5.5449 × 10⁻³, respectively; C0 is a constant equal to −1.32412 × 10⁻⁷; S is salinity; and Ts is a scaled temperature calculated as
where T is temperature (∘C).
2.2 Data analysis
The spatiotemporal distributions of DO and its related variables in the PRE were visualized using MATLAB and Excel software. Besides, the areal extent of DO < 2, DO < 3, and DO < 4 mg L−1 (referred to as hypoxia, oxygen deficiency, low oxygen, respectively) was also estimated using MATLAB as follows. Firstly, we divided the sea area of the PRE into a number of grid cells with a spatial resolution of 0.01∘ and then used the scattered-data interpolation method (namely, the “scatteredInterpolant” function) to interpolate the observed DO data onto the grid cells. Secondly, we calculated the total areas for all the grid cells being hypoxic (with DO < 2 mg L−1) to estimate the hypoxic areas. The same procedures were applied to compute the areal extent for oxygen deficiency and low oxygen by using a DO threshold of 3 and 4 mg L−1, respectively.
To investigate the key factors controlling the occurrence and development of low-oxygen conditions in the PRE, Pearson correlation analysis between DO and other water quality variables was also performed using MATLAB. The Pearson correlation coefficient (r) of two variables (x and y) is defined as
where N is the total number of observations for the variables; the overbar denotes the mean of each variable.
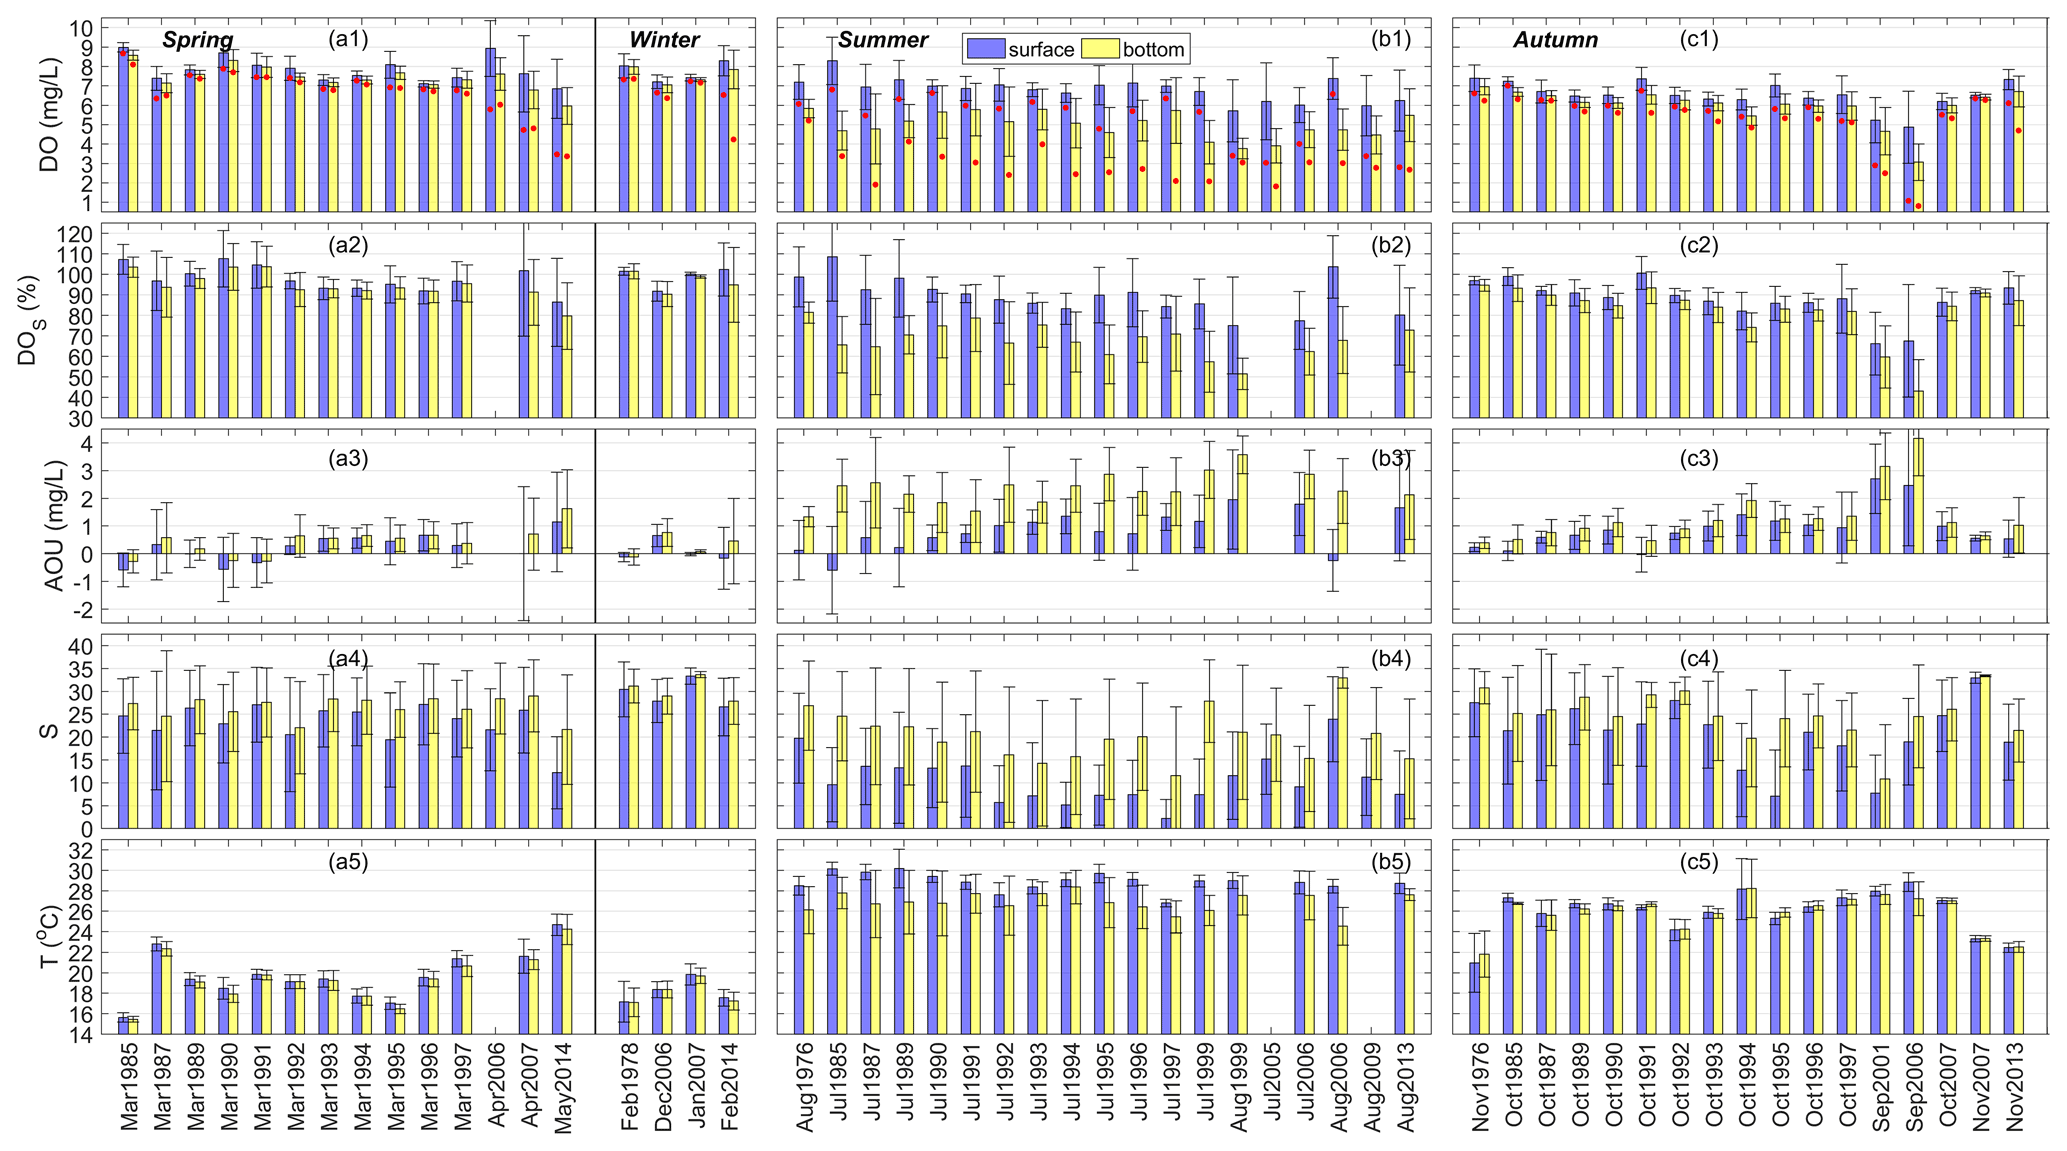
Figure 2Spatial means and standard deviations of DO concentrations, DO saturation (DOS), apparent oxygen utilization (AOU), salinity (S), and temperature (T) in the surface and bottom waters of the PRE in (a) spring (March–May) and winter (December–February), (b) summer (June–August), and (c) autumn (September–November) during 1976–2014. Note that the red dots in the first row of the figure represent the lowest DO values measured in each time period.
3.1 Seasonal variations in DO-related variables in the PRE
Figure 2 shows the spatial means and standard deviations of DO concentrations, DOS, AOU, salinity, and temperature at the surface and bottom of the PRE during different seasons (note that the lowest DO values observed in each time period are also shown in the figure). It can be clearly seen that all these variables had significant seasonal variations. In spring and winter, the average DO concentration was maintained at about 6–9 mg L−1 (Fig. 2a1). The DO level at the bottom was slightly lower than that at the surface. No low-oxygen water with DO < 4 mg L−1 was found except in May 2014. In spring, the surface salinity primarily varied between 20 and 27, and the bottom salinity was slightly higher (Fig. 2a4). In winter, salinity was high, with a very small difference between the surface and bottom, indicating that the water column was well mixed; the average water temperature (17–21 ∘C) was lower than that in spring overall (Fig. 2a5). DOS values in these two seasons were similar, mostly at near-saturation (90 %–107 %, Fig. 2a2), while the AOU primarily varied between 0.76 and −0.59 mg L−1 correspondingly (Fig. 2a3).
In summer, the DO content was lower than that in spring and winter, especially in the bottom water (with averages of 3.8–5.8 mg L−1, Fig. 2b1). Low oxygen (DO < 4 mg L−1) was observed in all 19 summer months except August 1976, and oxygen deficiency (DO < 3 mg L−1) was observed in 14 out of 19 summer months including the July of 1987, 1991–1992, and 1994–1997; July–August 1999; July 2005; July–August 2006; August 2009; and August 2013. Hypoxia (DO < 2 mg L−1) occurred in July 1987 and July 2005. Actually, the DO levels in July 1997 and July 1999 were very close to hypoxic conditions as well, with minimum concentrations of 2.1 mg L−1. Water temperature in summer was comparatively high, with 27.0–30.5 ∘C at the surface and mostly 24.5–28.5 ∘C at the bottom (Fig. 2b5). Besides, the differences in temperature and salinity between the surface and bottom were evident, especially for salinity (Fig. 2b4), showing the presence of pronounced vertical stratification across the water column. Most of the surface DOS was maintained at 80 %–104 % (Fig. 2b2), but the bottom DOS was significantly lower (51 %–79 %). The AOU showed a similar pattern, with values at the bottom (1.33–3.57 mg L−1) higher than those at the surface (−0.59 to 1.95 mg L−1; Fig. 2b3).
In autumn, water temperature decreased compared with in summer but was higher than the temperatures in spring and winter, as shown in Fig. 2c5. As for salinity, it was close to that in spring. Low-oxygen water was absent in middle to late autumn (October and November), when the average DO, DOS, and AOU were generally maintained at 6.0–7.5 mg L−1, 74 %–101 %, and −0.034 to 1.92 mg L−1 (Fig. 2c1–c3), respectively, with small vertical differences. However, in early autumn (September) fairly low DO values appeared in both the surface and the bottom waters (as low as 1.1 mg L−1 at the surface and 0.8 mg L−1 at the bottom in September 2006). The bottom DOS dropped below 35 % in September 2006 (Fig. 2c2) while the AOU reached as high as 4.16 mg L−1 (Fig. 2c3). This reveals the existence of potential hypoxic events in periods other than summer.
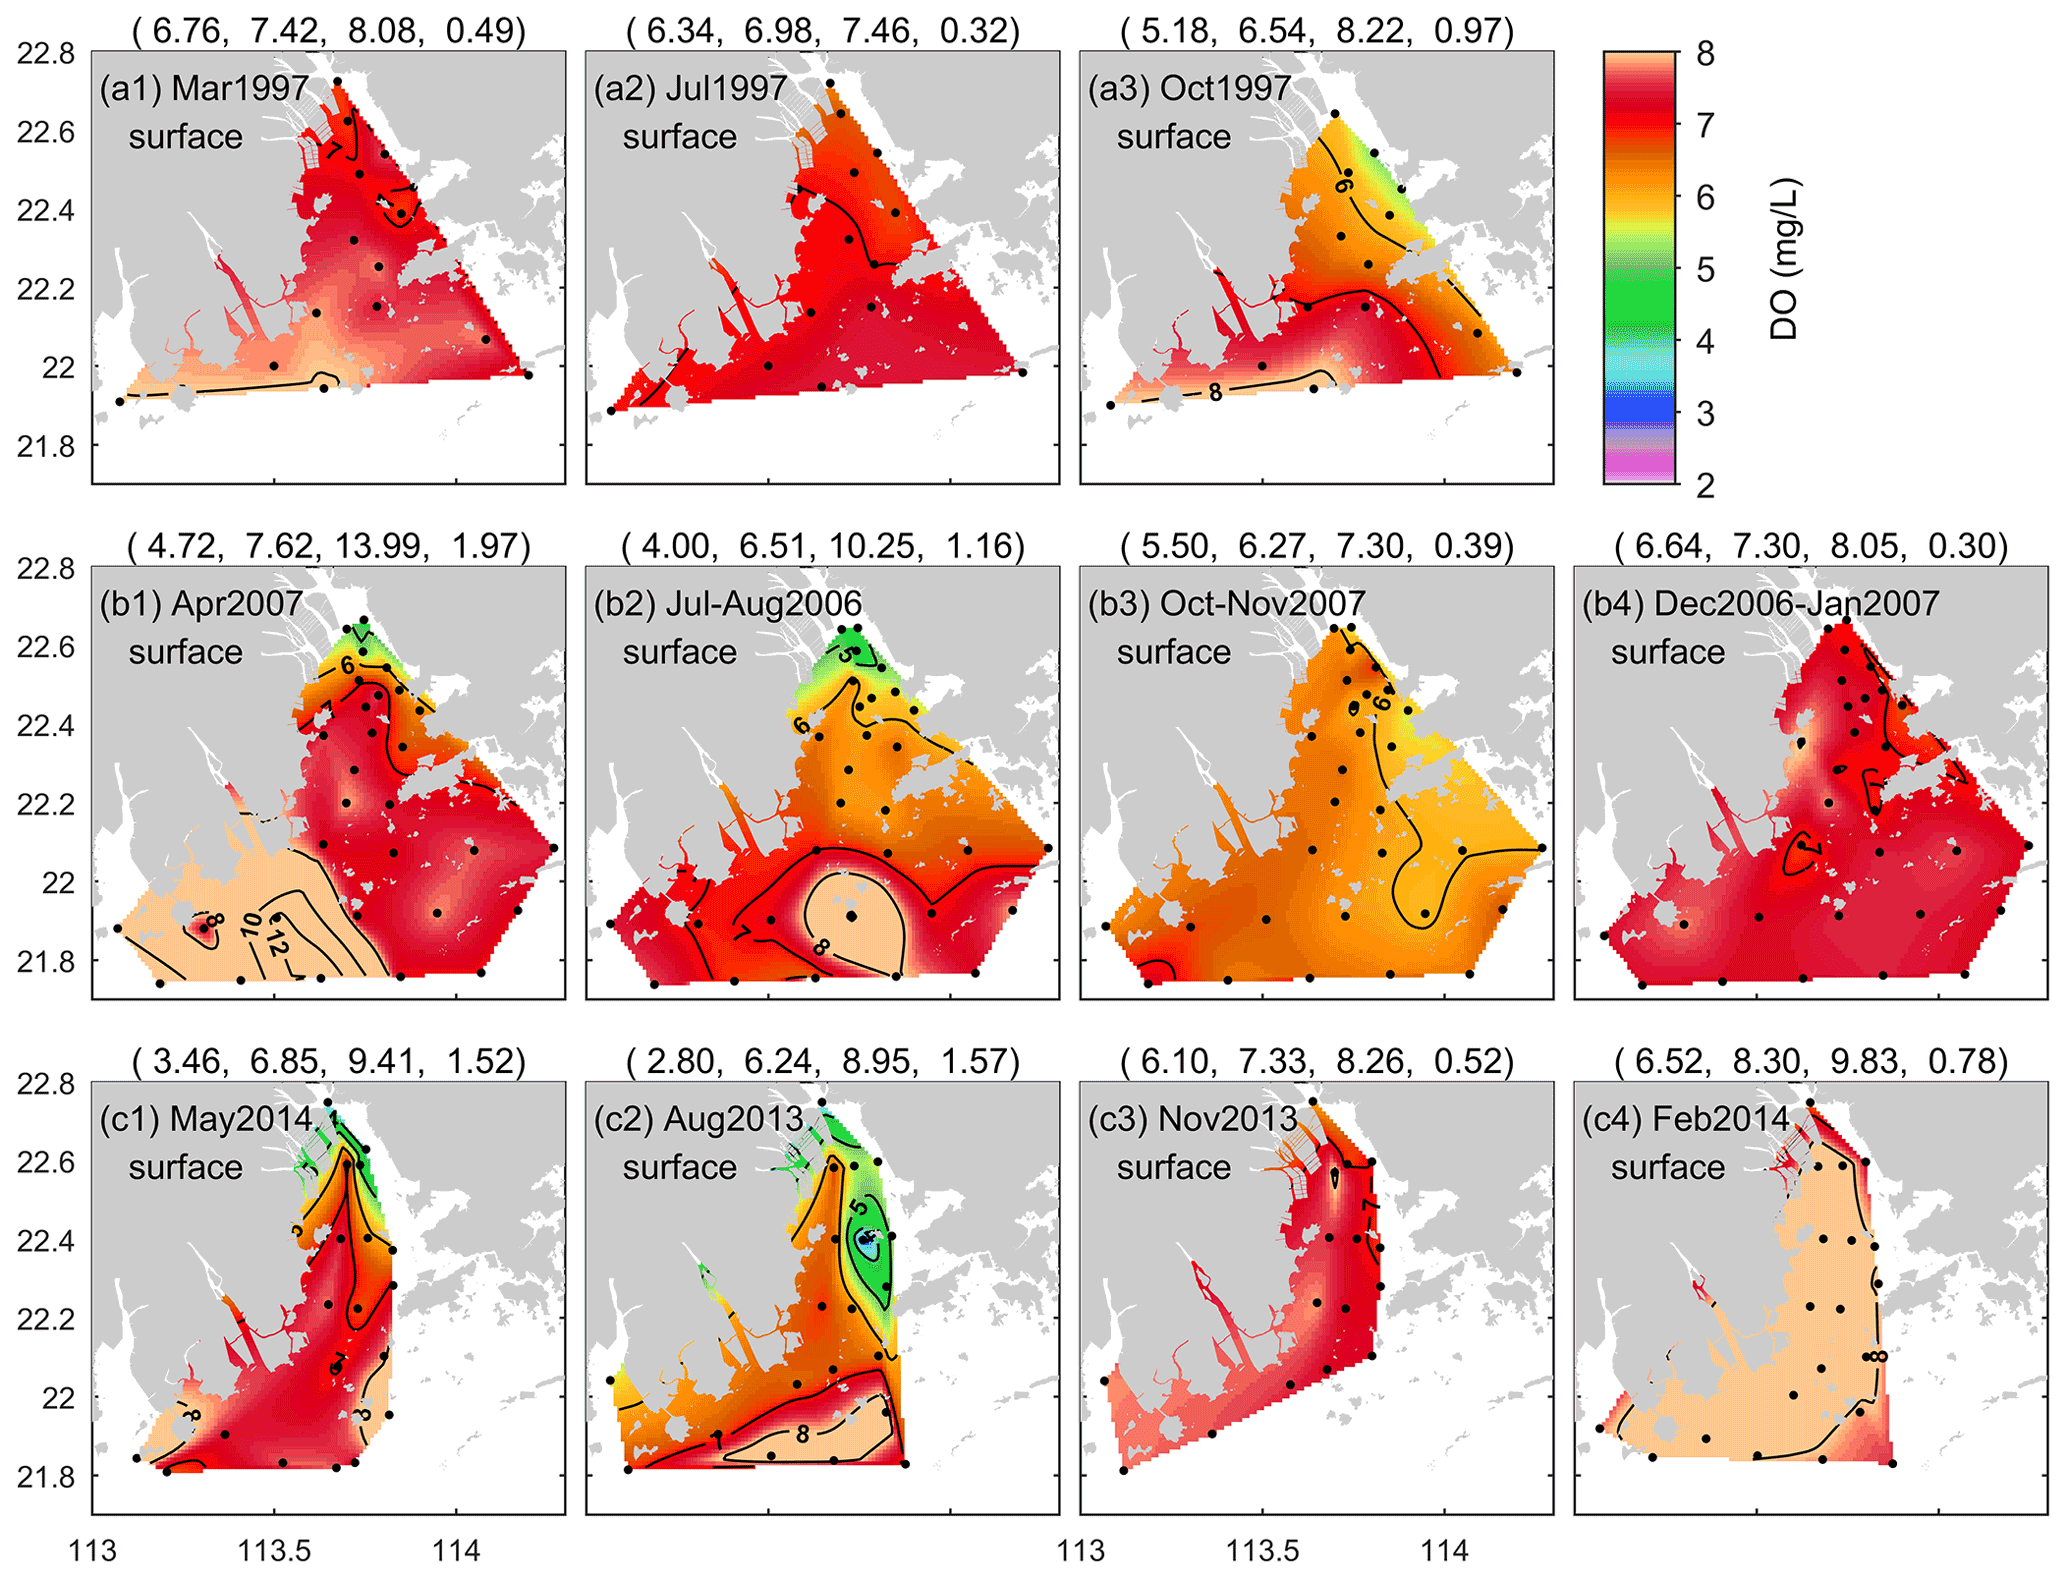
Figure 3Seasonal variations in surface DO distributions in the PRE for (a) 1997, (b) 2006–2007, and (c) 2013–2014. The first to last columns of the figure correspond to spring, summer, autumn, and winter, respectively. Note that the numbers in parentheses in the titles are the minimum, mean, maximum, and standard deviation values of DO in sequence; the black dots show the locations of the sampling stations.

Figure 4Same as Fig. 3 but for the bottom water. Note that HA4, HA3, and HA2 represent the areal extent (km2) with DO < 4, DO < 3, and DO < 2 mg L−1 estimated from the available monitoring data, respectively.
To further explore the spatial characteristics of DO in the PRE, Figs. 3 and 4 present the DO distributions at the surface and bottom in different seasons over 3 decades. As shown, the surface DO in March was high overall and homogenous in space (Fig. 3a1), but in April and May, the spatial difference became relatively large (Fig. 3b1 and c1). The surface water with DO < 5 mg L−1 appeared near the four eastern river outlets (see Fig. 1 for their locations) in April 2007 and May 2014 (with DO as low as 3.5 mg L−1). With respect to summer, the surface DO in the open sea was higher than that inside the estuary and often had high values, for example, in the coastal water surrounding the Wanshan Archipelago (Fig. 3b2 and c2); low oxygen was observed in the inner Lingdingyang Bay. As for autumn, the surface DO showed a northwest–southeast distribution pattern in October (Fig. 3a3 and b3), relatively high on the western side of the PRE, and it exhibited a northwest–southeast pattern in November (Fig. 3c3). Compared with other seasons, the surface DO in winter was higher, mostly exceeding 7 mg L−1, and it was more uniformly distributed over the PRE (Fig. 3b4 and c4).
Regarding the bottom DO, its distribution pattern in March closely resembled the surface one, showing small spatial differences as well (Fig. 4a1). Subsequently, the DO content became progressively lower from April to May (Fig. 4b1 and c1), and low oxygen appeared near the eastern river outlets, similarly to at the surface. In summer, the bottom water was frequently subject to apparent low-oxygen conditions. As shown in Fig. 4a2, there was a low-oxygen zone extending from the west of Lantau Island to the Wanshan Archipelago in July 1997, and the observed areas of low oxygen (HA4) and oxygen deficiency (HA3) were estimated at 704 and 157 km2, respectively. In July–August 2006, a relatively large areal extent of low oxygen was observed, distributed in patchy waters (Fig. 4b2); HA4 in total reached 955 km2. In autumn, the bottom water was re-oxygenated and reinstated to relatively high DO levels (Fig. 4a3–c3), displaying spatial patterns analogous to those at the surface. It is also noted that the phenomenon of DO < 5 mg L−1 was observed in the bottom water adjacent to the eastern river outlets in November 2013 (Fig. 4c3) as well as in February 2014 (Fig. 4c4).
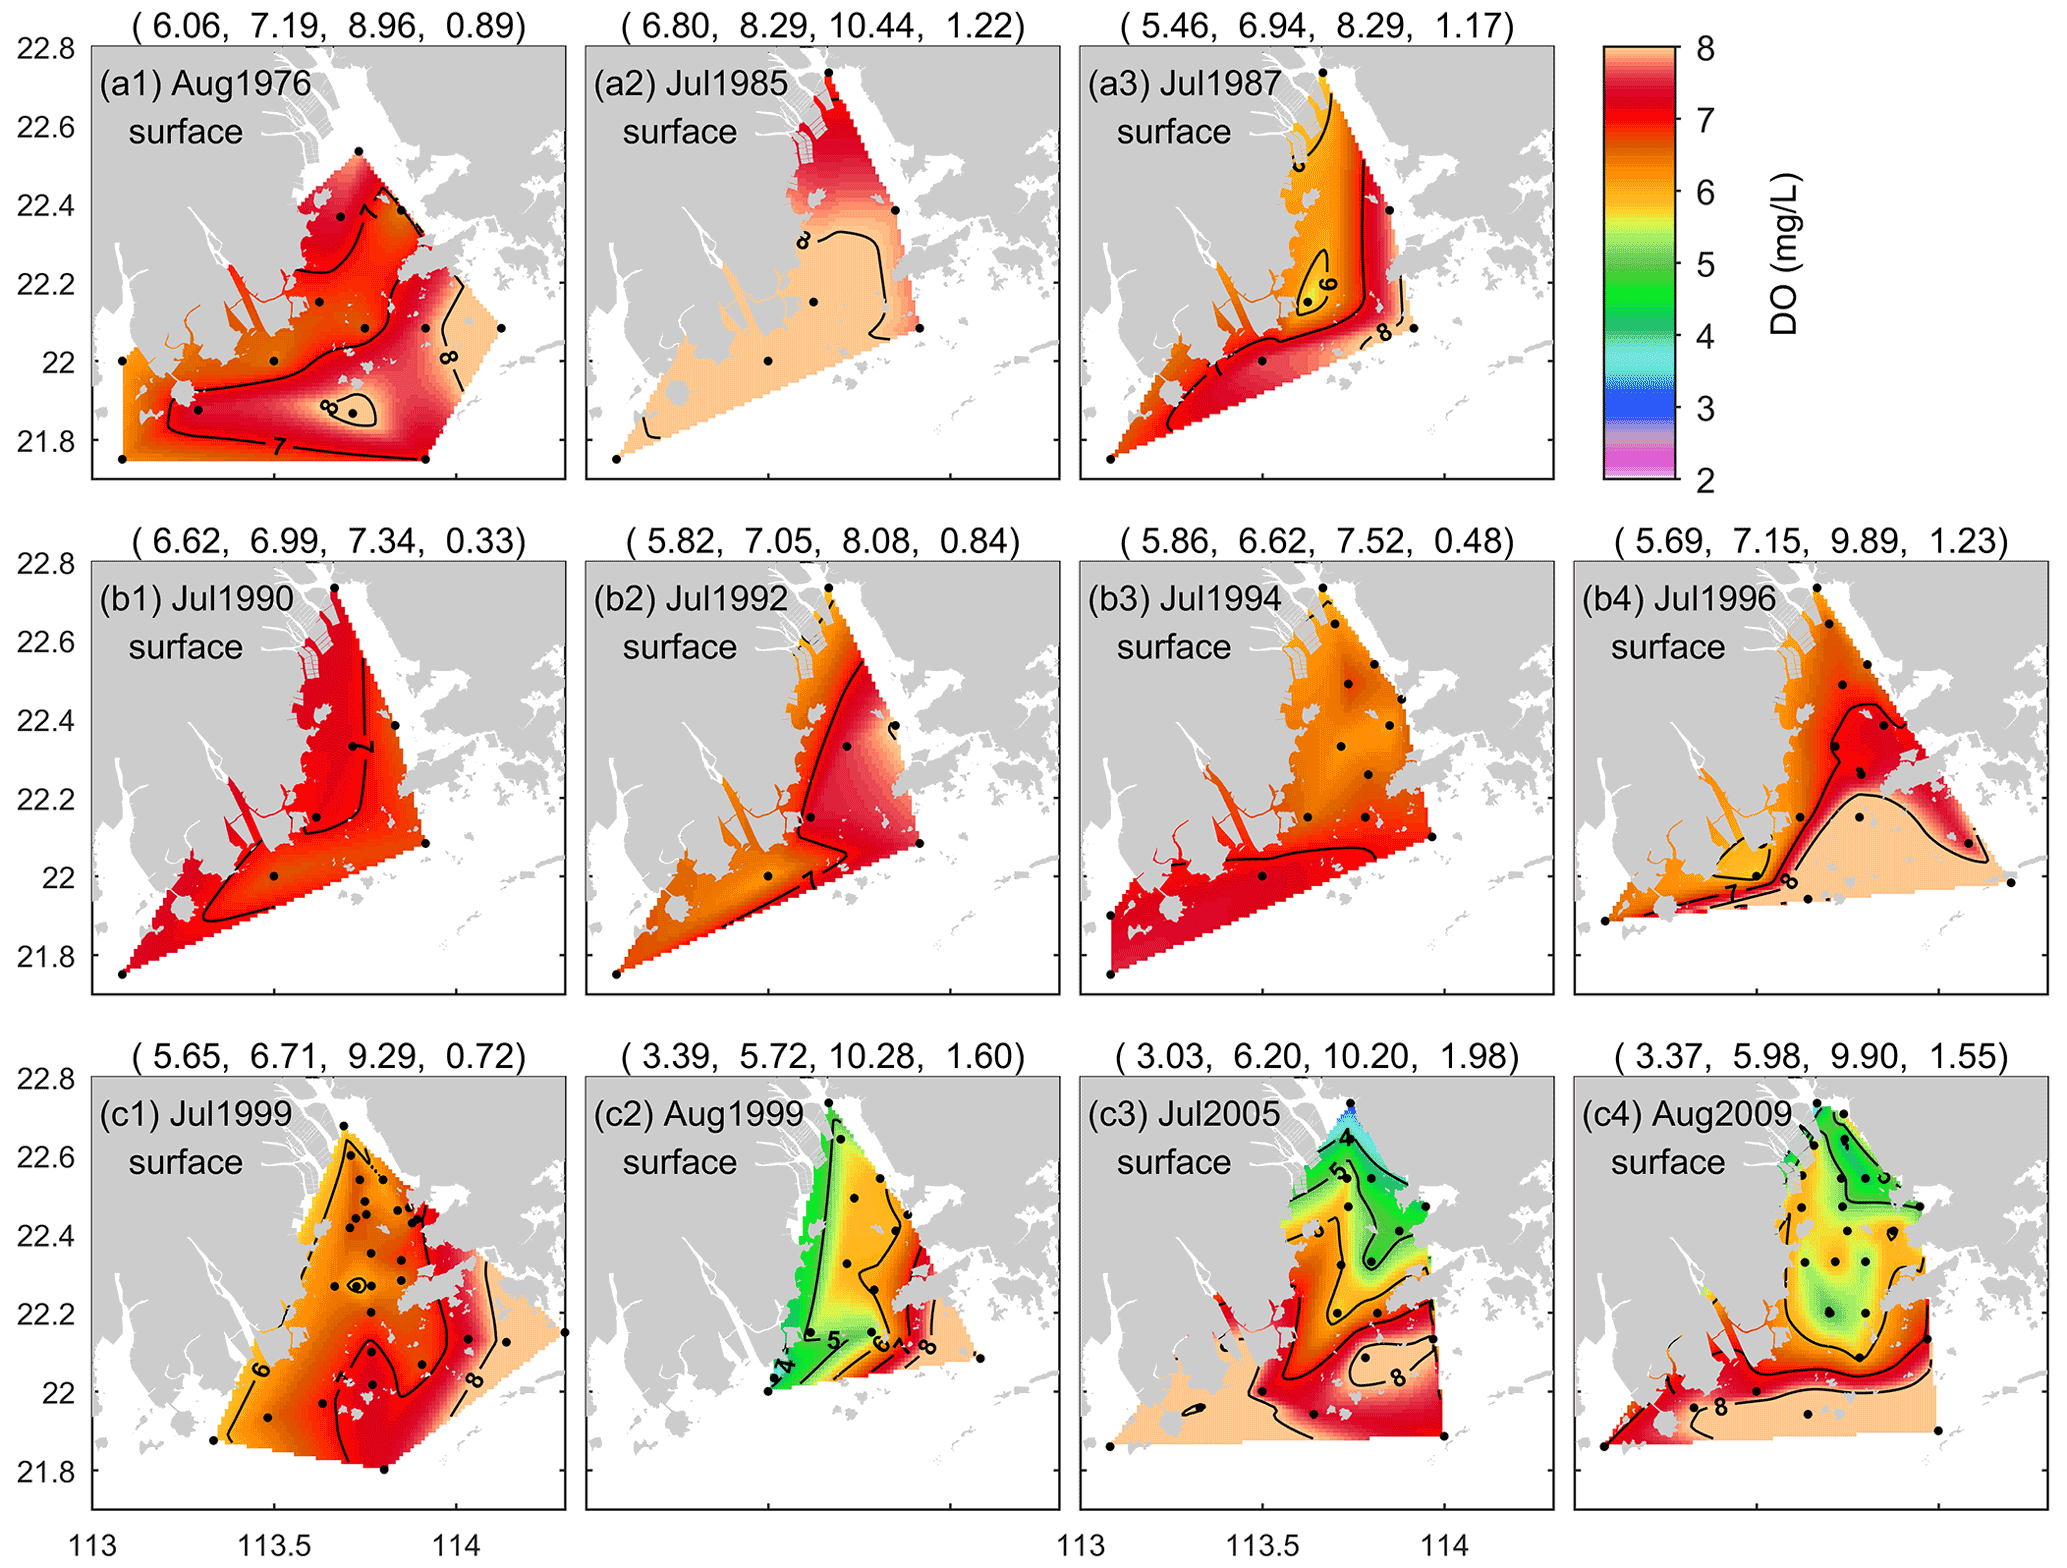
Figure 5DO distributions at the surface of the PRE in summer.

Figure 6DO distributions at the bottom of the PRE for the summer months of 1976–2017. Due to the influence of Typhoon Rammasun, the cruise in July 2014 was divided into two legs, including (e1) Leg 1 on 13–16 July and (e2) Leg 2 on 19–27 July (Su et al., 2017). Note that HA4, HA3, and HA2 represent the observation-based estimates of the areal extent (km2) with DO < 4, DO < 3, and DO < 2 mg L−1, respectively.
3.2 Long-term changes and hotspot areas of low-oxygen conditions in the summer of the PRE
In order to gain a thorough insight into the interannual and long-term changes in the summertime low-oxygen conditions, Figs. 5 and 6 present the DO distributions at the surface and bottom of the PRE in the summer months during 1976–2017 (note that the distributions in 1997, 2006, and 2013 are shown in Figs. 3 and 4 and are not repeated here). In the surface water, the average DO content varied between 5.7 and 8.3 mg L−1, and high DO values (> 8.0 mg L−1) were often observed in the open sea (Fig. 5). It is interesting to note that the lowest DO observed at the surface before 1999 was 4.8 mg L−1 (Fig. 2b1), which is well above the threshold of low oxygen, but since 1999, low-oxygen water with DO < 4 mg L−1 has frequently appeared in the inner Lingdingyang Bay; for example, surface DO levels as low as 3.0 and 2.8 mg L−1 were observed in July 2005 (Fig. 5c3) and August 2013 (Fig. 3c2), respectively, as also shown in Fig. 2b1. This emerging exacerbation of low-oxygen conditions in the surface water was primarily attributed to the influence of low-oxygen inflows from the upstream reaches (Zhai et al., 2005; He et al., 2014) and increasing sewage discharge brought by rapid economic development and urbanization in the Pearl River Delta over the past 30 years (X. Li et al., 2020).
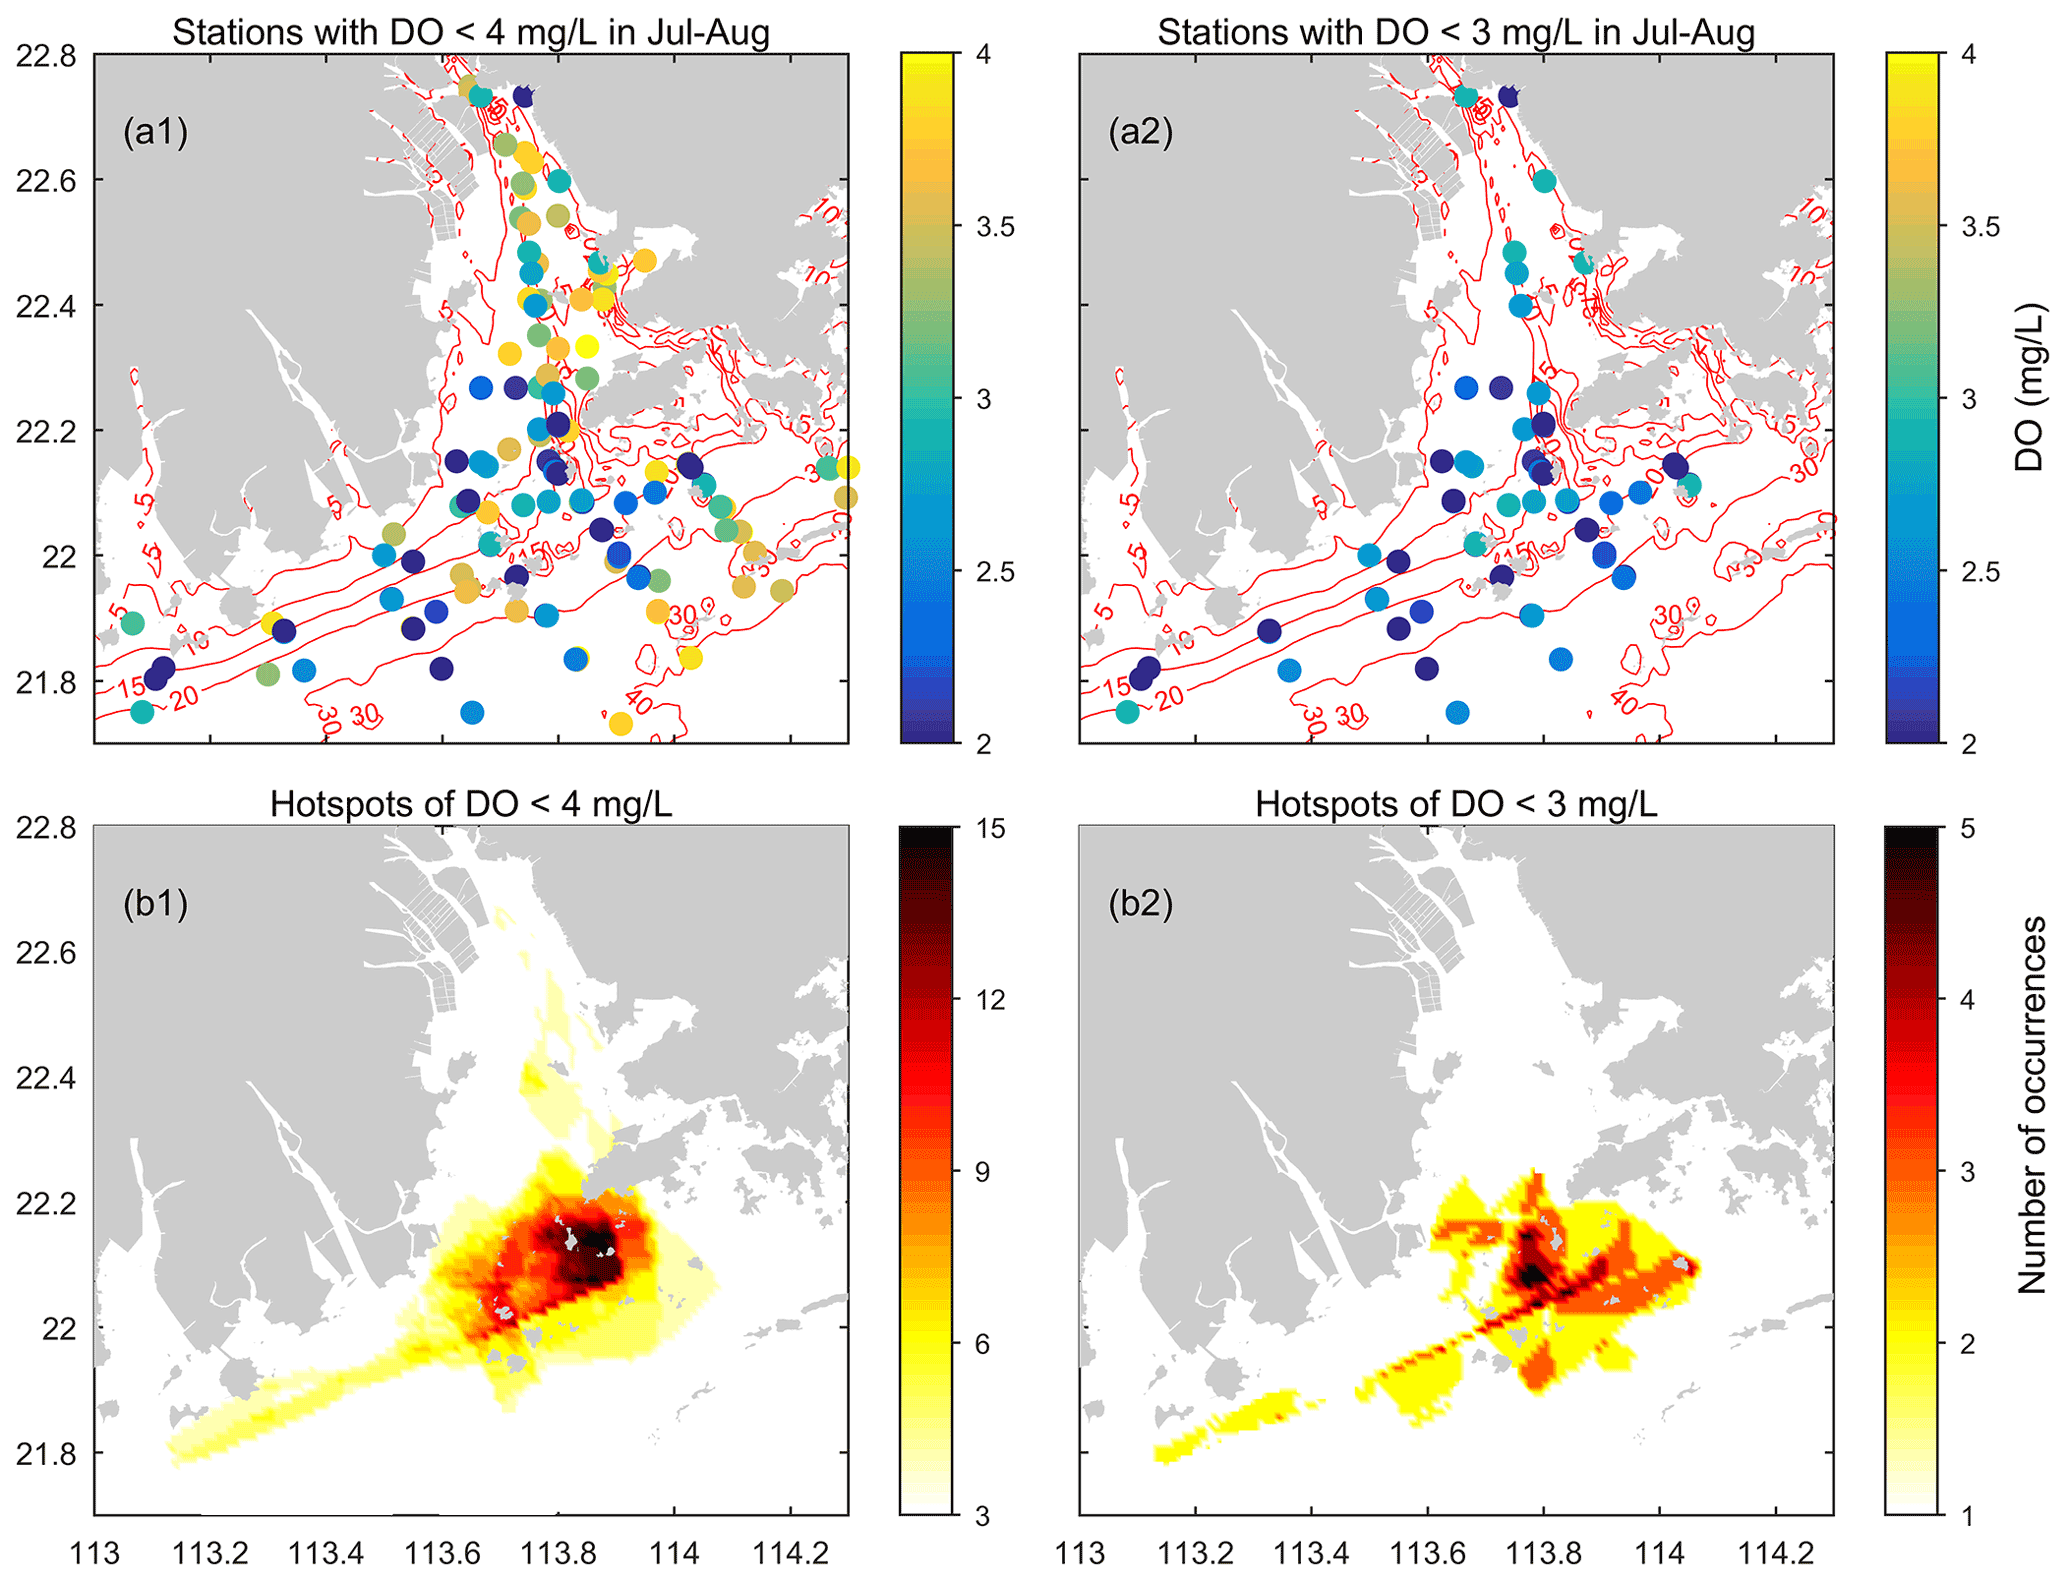
Figure 7(a) The sites where low-oxygen conditions have been observed in the summer of the PRE and the corresponding lowest DO values measured (based on the data compiled from 1976 to 2017). (b) Maps showing the incidence of low-oxygen conditions at the bottom of the PRE in summer. Note that the darker color delineates a higher occurrence of low-oxygen events.
At the bottom, apparent low-oxygen conditions prevailed in all the summer months except August 1976 (a period prior to the implementation of China's reform and opening-up policy), and their locations and spatial extent varied substantially between different periods (Fig. 6). Overall, a majority of the low-oxygen events congregated at the bottom of 5–30 m isobaths and were present in the vicinity of Humen, at the nearshore of the east of the inner Lingdingyang Bay (including Shenzhen Bay), along the deep navigation channel (extending from the north of Nei Lingding Island to the southwest of Lantau Island), in the shallow water (between 5–10 m isobaths) on the western side of the middle Lingdingyang Bay, at the outer Modaomen–Jitimen–Huangmaohai bays, and in the waters from the south of Lantau Island to the Wanshan Archipelago (Fig. 7a1–a2). Moreover, the coastal area in the lower estuary, extending from the southwest of Lantau Island to the northeast of the Wanshan Archipelago, was the hotspot with the highest incidence of bottom low-oxygen events, followed by the shallow area east of the island of Hengqin (Fig. 7b1 and b2).
In terms of the spatial extent, low-oxygen conditions in the 1980s and 1990s were restricted to a very small scale, with all the HA4 and HA3 values estimated as smaller than 760 and 160 km2, respectively (Fig. 6). The areal extent of low-oxygen conditions was relatively large in July of 1987 (Fig. 6a3), 1994–1995 (Fig. 6c2 and c3) and 1997 (Fig. 4a2). However, since the 2000s, the area affected by low-oxygen conditions has increased, with HA4 > 1600 km2 being frequently reported. For instance, a more fully developed low-oxygen zone was generated in July 1999 (Fig. 6d1). Its central area covered the entire waters of the middle part of the PRE. HA4 and HA3 were estimated 1602 and 263 km2, respectively. As for July 2005, HA4 and HA3 reached 2683 and 304 km2, respectively (Fig. 6d3). A majority of the bottom water resided in low-oxygen conditions, and hypoxia (∼ 6 km2) occurred at the nearshore of the inner Lingdingyang Bay. In particular, recent field investigations during 2014–2017 further indicate the occurrence of large-scale low-oxygen events in the PRE (Fig. 6e1–e4). HA2 observed in the bottom waters surrounding Lantau Island and the Wanshan Archipelago on 13–16 July 2014 (Leg 1) reached 338 km2, with a minimum DO of 0.9 mg L−1, and HA4 and HA3 were estimated at 1290 and 1037 km2, respectively. Subsequently, a hypoxic zone of a similar size was found on 19–27 July (Leg 2) as well, primarily located in the offshore water south of the Wanshan Archipelago where DO dropped to 0.2 mg L−1. HA4 and HA3 reached 3101 and 1123 km2, respectively. In July 2015, the low-oxygen zone observed was even larger (reaching 4453 km2), but the hypoxic area was relatively small (∼ 51 km2, Fig. 6e3). With respect to July 2017, a large area affected by low oxygen was observed, with HA4, HA3, and HA2 of 2863, 962, and 138 km2, respectively (Fig. 6e4). Hypoxia was generated mainly to the south of Lantau Island, with a minimum DO of 0.5 mg L−1.
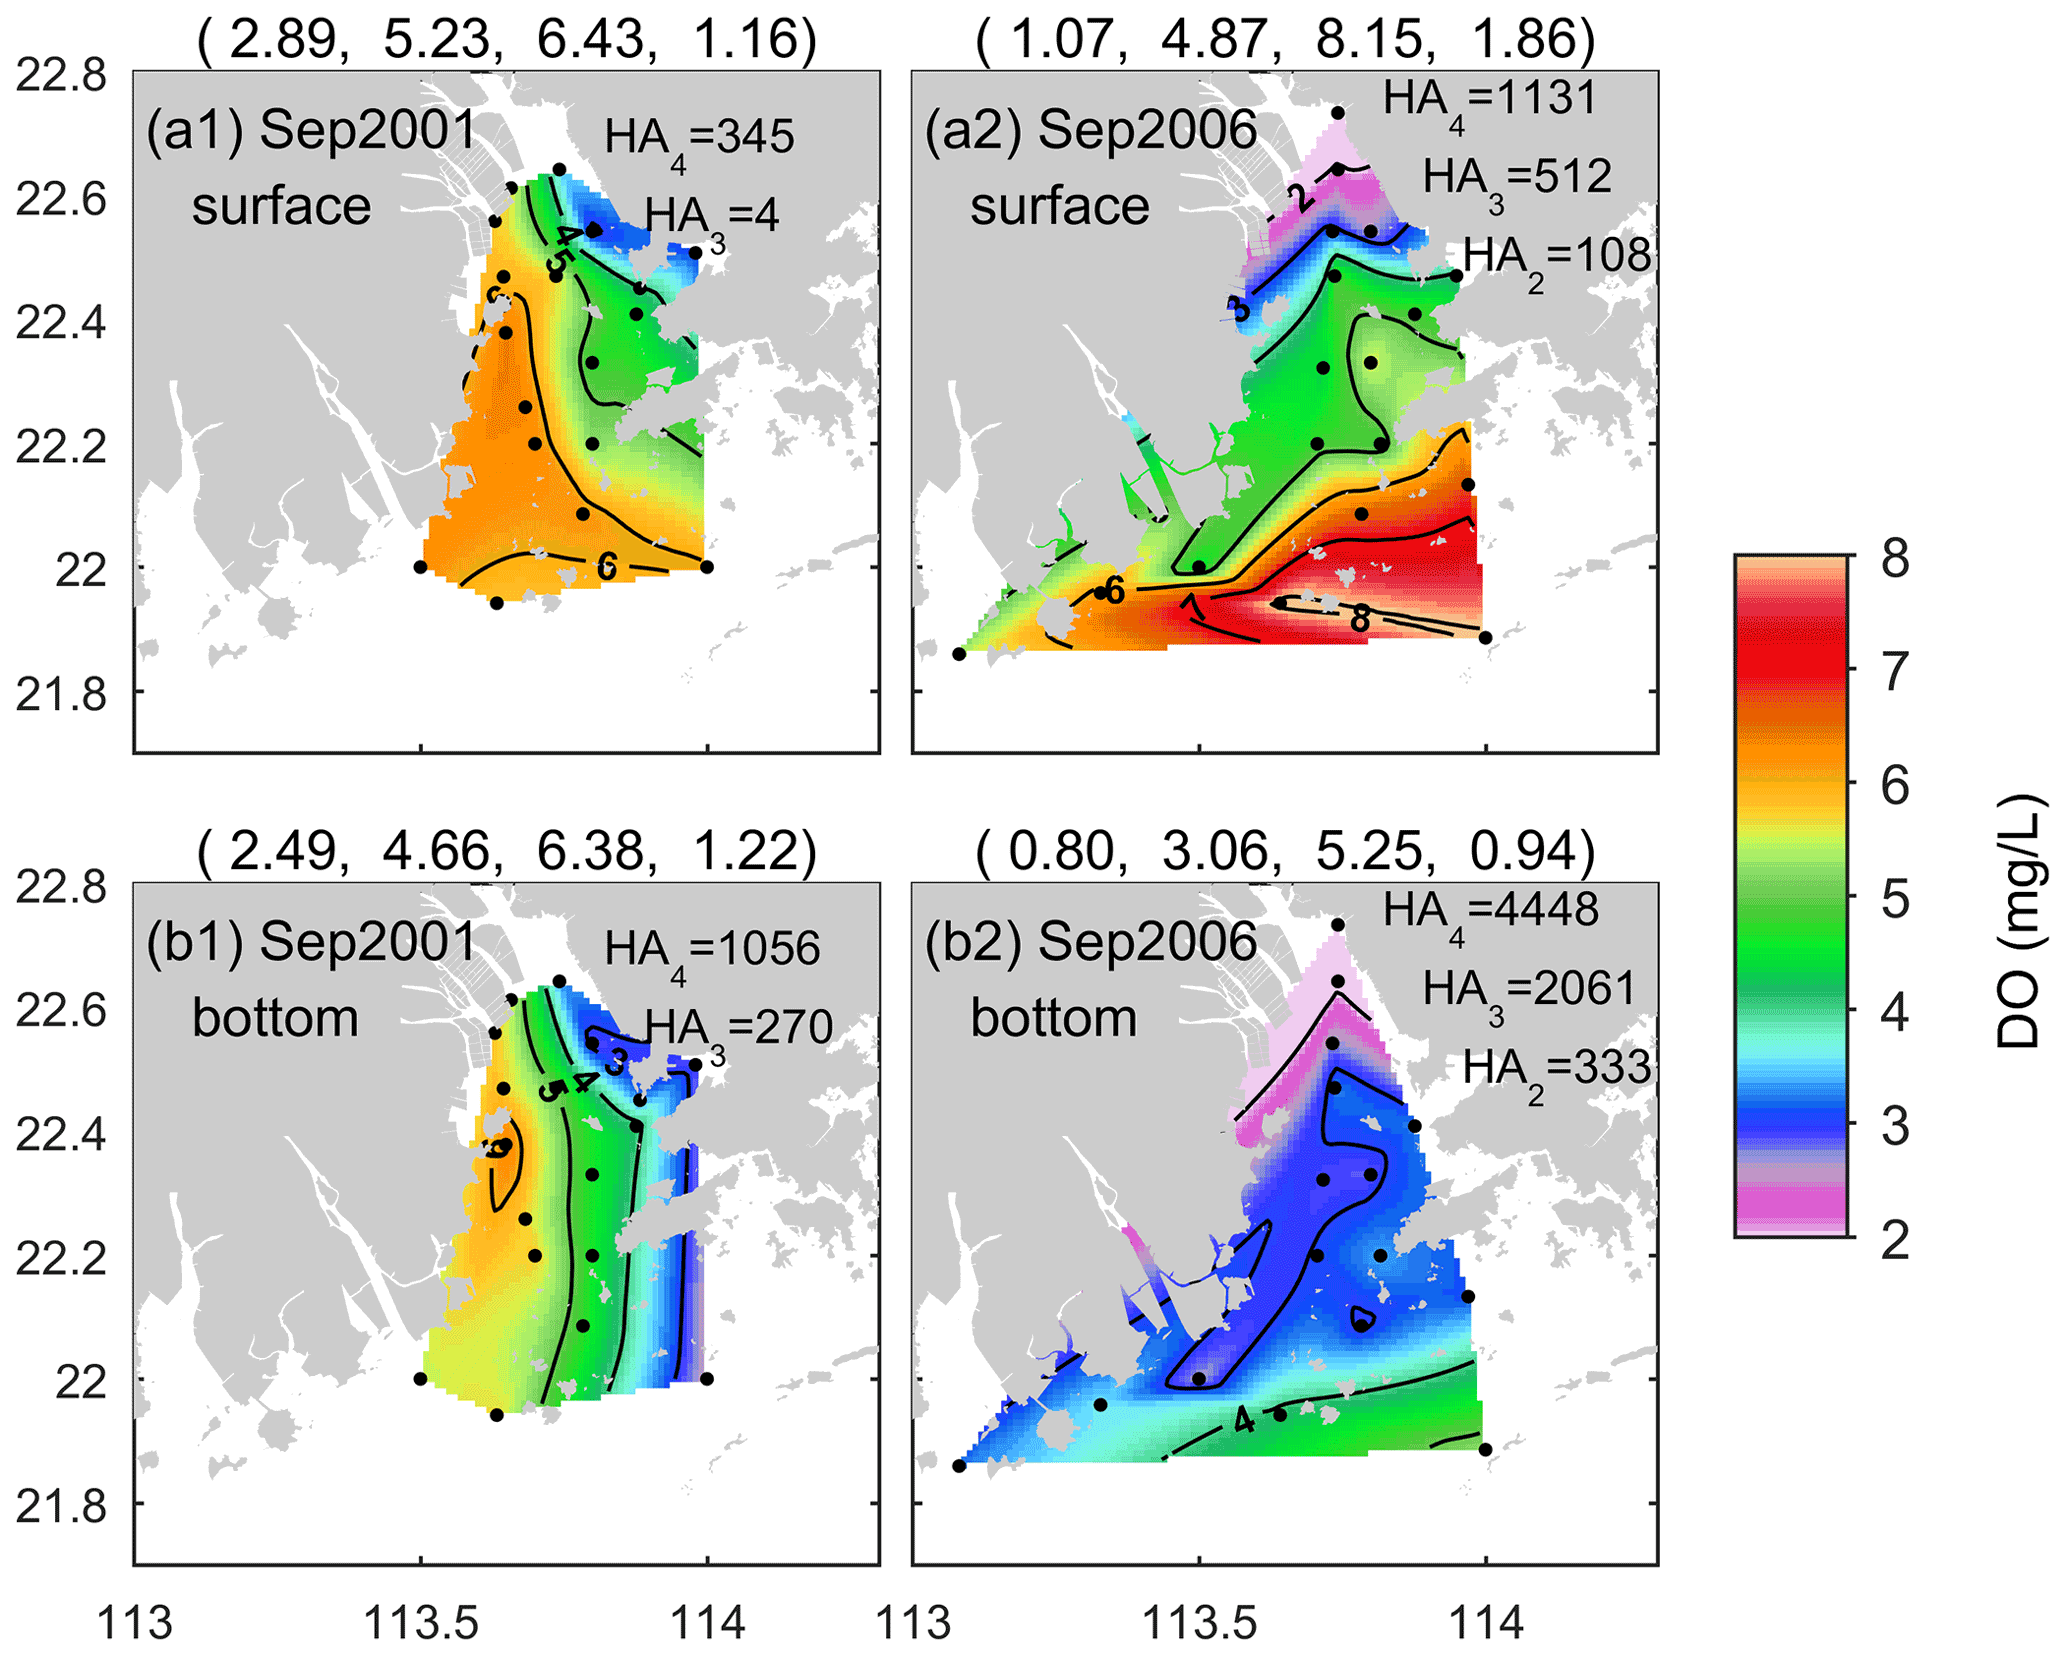
Figure 8DO distributions in the (a) surface and (b) bottom waters of the PRE for the early autumn (September) of 2001 (a1, b1) and 2006 (a2, b2).
3.3 Spatial patterns of DO and low-oxygen conditions in the early autumn of the PRE
In addition to the summer season, low-oxygen conditions also existed in the early autumn in the PRE. Figure 8 shows the DO distributions in September 2001 and September 2006. In general, DO displayed remarkable spatial variations in both periods, but its distribution patterns as well as the location and severity of low-oxygen conditions were quite different. In September 2001, DO exhibited a northwest–southeast pattern at the surface (Fig. 8a1) and a north–south pattern at the bottom (Fig. 8b1). The DO content was relatively low on the eastern side of the PRE. HA4 in the surface water was estimated at 345 km2, while HA4 and HA3 at the bottom were estimated at 1056 and 270 km2, respectively.
In comparison, spatial variation in the surface DO in September 2006 was more significant, generally showing a northeast–southwest pattern with low DO at the nearshore and high DO in the open sea (Fig. 8a2). Low-oxygen water almost covered the entire surface of the inner Lingdingyang Bay, and hypoxia (with DO as low as 1.1 mg L−1) occurred in the upper region, with HA2 reaching 108 km2; HA4 and HA3 were estimated 1131 and 512 km2, respectively. In regard to the bottom, most of the PRE was occupied by water low in oxygen, which extended from the inner Lingdingyang Bay to the western PRE and the southwest of Lantau Island (Fig. 8b2). The estimated HA2 reached 333 km2, with a minimum DO of 0.8 mg L−1, while HA4 and HA3 reached 4448 and 2061 km2, respectively.
4.1 Mechanisms controlling the summertime low-oxygen conditions in the PRE
Our results demonstrate that the PRE has frequently experienced low-oxygen events in summer. For all the 22 summer months investigated (during 1976–2017), there were 21 records with low oxygen, 17 (accounting for 77 %) with oxygen deficiency, and 5 (23 %) with hypoxia, reflecting a feature of seasonal low oxygen and episodic hypoxia in the PRE. In addition to our study, there have also been many other reports on the low-oxygen and hypoxic events during the summer months, including the June of 2001–2005, 2009–2010, and 2015; July of 2000, 2003–2004, and 2010; and August of 2001–2002, 2005, 2007, 2010–2011, and 2017 (Zhai et al., 2005; Yang et al., 2011; Huang et al., 2012; Ye et al., 2013; Li et al., 2018; Qian et al., 2018; X. Li et al., 2020; Cui et al., 2019).
Table 2Pearson correlation coefficients (r) between DO and other water quality metrics.
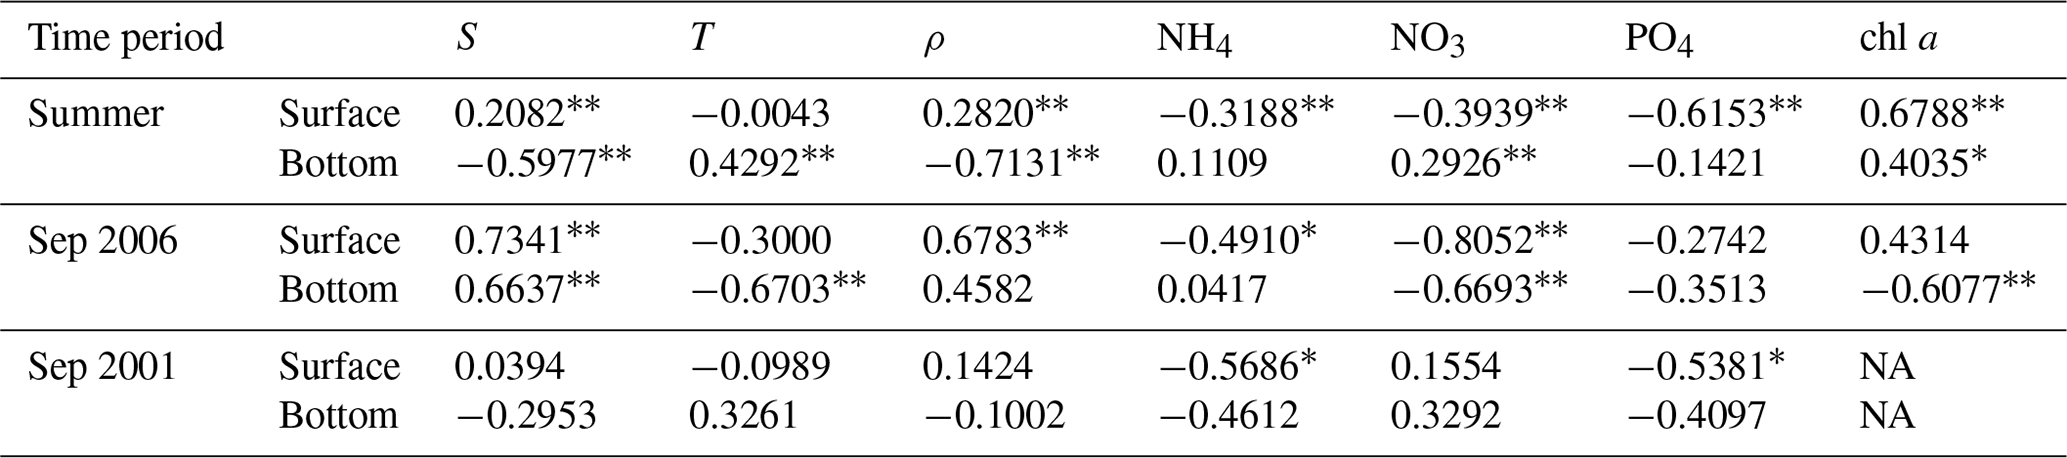
S and T are salinity and temperature, respectively; ρ represents the difference in density between the surface and bottom waters (bottom density minus surface density); NH4, NO3, and PO4 are the concentrations of ammonia, nitrate, and phosphate, respectively; chl a represents the chlorophyll a content. The double asterisk indicates significance correlations at p < 0.01, and ∗ indicates significant correlations at p < 0.05. NA: not available.
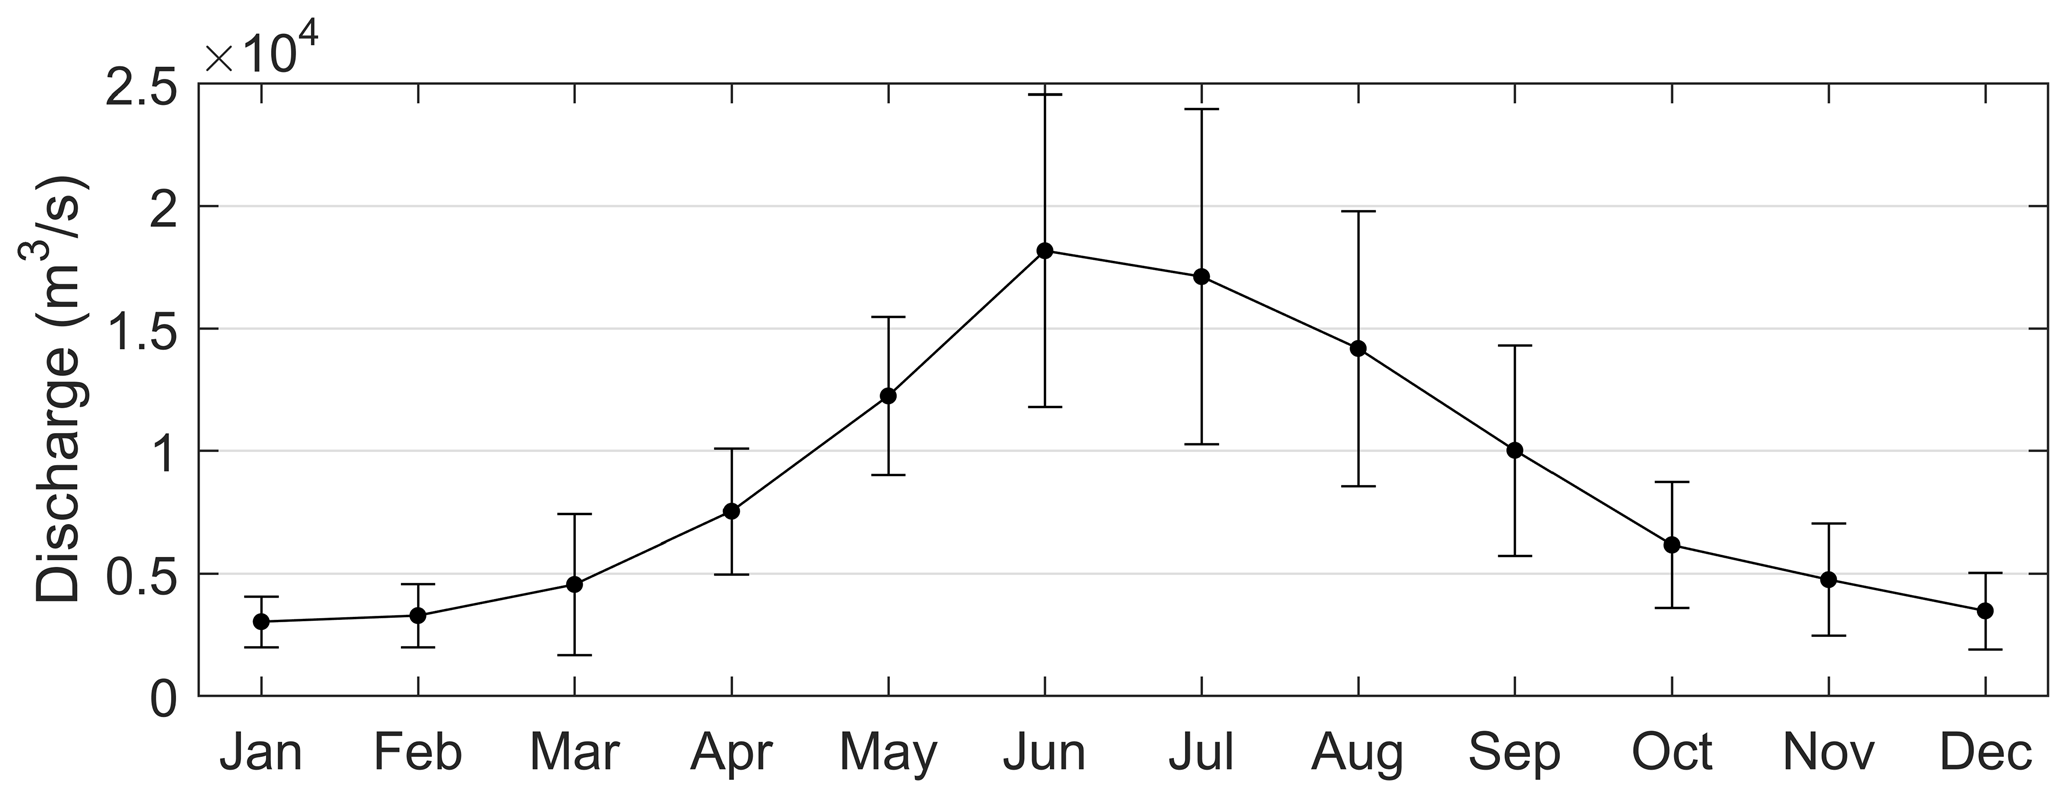
Figure 9Monthly means and standard deviations of the Pearl River discharges calculated over 1979–2015.

Figure 10Comparison of water quality metrics observed in the PRE between (a) July 1999 (summer) and (b) September 2006 (early autumn): surface and bottom salinity (a1, a2, b1, b2), vertical density difference and bottom DO saturation (DOs) (a3, a4, b3, b4), and surface suspended sediment concentrations (SSCs) and chlorophyll (chl) a contents (a5, a6, b5, b6). Note that the numbers in parentheses in the titles are the minimum, mean, maximum, and standard deviation values of the associated water quality metrics in sequence.
For the PRE, the formation and development of low-oxygen conditions is closely related to multiple factors including Pearl River diluted water and it carrying terrestrial substances, local productivity, vertical stratification intensity, water residence time, and topography. Specifically, the increased water temperature in summer (Fig. 2) could result in a notable decrease in oxygen solubility in water and accelerated oxygen consumption by microbial respiration (Breitburg et al., 2018). In addition, the runoff also increased, with the summertime discharge approaching 16 500 m3 s−1 (Fig. 9). Massive freshwater inputs formed a distinct plume structure at the surface (Fig. 10a1) together with the intrusion of high-salinity bottom waters along the deep navigation channel (Fig. 10a2). This two-layer circulation driven by the density gradient (Wong et al., 2003) largely determines the distributions of biochemical components and the subsequent development of low-oxygen conditions in the PRE. As shown in Table 2, the bottom DO in summer had a significantly negative correlation with the vertical density difference (r = −0.7131; p < 0.01). This confirms that intense stratification was a critical physical setting for the generation and maintenance of bottom low-oxygen conditions, as demonstrated by previous studies (e.g., Rabouille et al., 2008; X. Li et al., 2020).
In the stratified waters (Fig. 10a3), the bottom DOS was comparatively low (Fig. 10a4), implying the presence of significant oxygen consumption in the region. Multiple reports have shown that sediment oxygen uptake was the dominant oxygen sink in the PRE and was fueled primarily by the remineralization of organic matter accumulated in the sediments (Zhang and Li, 2010; Wang et al., 2017), which originated from terrestrial inputs and/or marine-sourced inputs through local production (Su et al., 2017; Ye et al., 2017). The dominance of terrestrial- and marine-sourced organic matter varied greatly in space. More specifically, a large fraction of terrestrial particulate matter settled on the sediments after entering the PRE (Hu et al., 2011) and ultimately experienced diagenetic decomposition by heterotrophic bacteria (Li et al., 2018), resulting in high oxygen demand (Wang et al., 2017; Lu et al., 2018). This was considered the primary cause for the low oxygen and sporadic hypoxic events observed in the shallow water east of Hengqin, the outer Modaomen Bay, and the deep channel (Fig. 7b1–b2), where considerable deposition of organic matter and intense stratification occurred simultaneously (Hu et al., 2011). While in the offshore area of the PRE, water transparency improved due to the consecutive settling and dilution of suspended particles (Fig. 10a5). Data showed that the surface SSC in the offshore waters was significantly lower than that at the nearshore (Fig. S1 in the Supplement). Moreover, the local flow convergence induced by the cyclonic vortices in this coastal transition zone, which was formed by the interaction between freshwater buoyancy discharge and wind forcing, was also conducive to a long residence time and nutrient accumulation and thus favored the growth of phytoplankton biomass within the region (D. Li et al., 2020). As shown in Fig. 10a6, the chl a content was higher offshore than in the main estuary, especially on the eastern side where algae blooms and red tides have frequently been reported (Dai et al., 2008; Harrison et al., 2008), accompanied by supersaturated DO at the surface (Figs. 3 and 5). Moreover, the offshore water of the eastern PRE is comparatively deep (> 15 m, Fig. 1) and thus possessed a more stable profile of vertical stratification. The resulting restricted oxygen supply, coupled with the substantial delivery of labile organic matter from the surface water with phytoplankton blooms, made the coastal area from the southwest of Lantau Island to the northeast of the Wanshan Archipelago vulnerable to the frequent occurrence of low oxygen and episodic hypoxia (Fig. 7b1–b2). The close linkage between the development of bottom low-oxygen conditions and nutrient-stimulated high productivity at the surface for this hotspot (hypoxia-prone) area has also been illustrated in several works (Su et al., 2017; Qian et al., 2018; X. Li et al., 2020), showing the dominant role of marine-sourced organic matter over the terrestrial inputs with respect to oxygen depletion. Moreover, under the control of the two-layer estuarine circulation, the local low-oxygen water generated in the lower estuary could be transported to the inner Lingdingyang Bay along the bottom of the deep channel (Cui et al., 2019; X. Li et al., 2020), which would further exacerbate the low-oxygen conditions in the bay.
4.2 Influential factors and underlying mechanisms of the low-oxygen conditions in the early autumn
In contrast to summer, there have been very few studies concerning the problem of low-oxygen conditions in the early autumn of the PRE. Although Qian et al. (2018) discovered the existence of low oxygen in the waters adjacent to Humen as well as Hengqin and Lantau Island in September 2010, this issue did not attract much attention because the actual coverage and severity of low oxygen have not been fully unveiled owing to the small scale of field surveys. Here the observations we used show prominent low-oxygen conditions in the early autumn (September) of 2001 and 2006 (both with the areal extent of low oxygen > 1000 km2, Fig. 8). In particular, over 100 and 330 km2 of hypoxia were observed at the surface and bottom, respectively, in September 2006, which witnessed a hypoxic scale comparable to that of July 2014 (the period with the largest hypoxic area), a low-oxygen area very close to that of July 2015 (the period with the largest low-oxygen area), and an oxygen-deficiency extent that was significantly larger than those in all the summer months. Besides, it should be noted that the low-oxygen conditions in September 2006 were much more severe than those in the summer of 2006 (Fig. 4b2), indicating that this issue was not a simple succession of the summer issues but likely a spontaneous phenomenon that formed independently.
Unlike in the summer, the freshwater discharge in September decreased to approximately 10 000 m3 s−1 (Fig. 9), equivalent to ∼ 61 % of the summertime discharge, but it was still much larger than values in the middle to late autumn and winter. The drawdown of freshwater inputs led to a weaker extension of the diluted water (Fig. 10b1–b2) and smaller vertical density difference (Fig. 10b3) compared with summer. The estuary was weakly stratified overall except for the waters from the outer Modaomen Bay to the Wanshan Archipelago where moderate stratification was found. Table 2 shows that there was no significant correlation between the bottom DO and the vertical density difference in either September 2001 or September 2006. This implies that the mild stratification had a small effect on the low-oxygen conditions in early autumn, which seems to have a different underlying mechanism from that in summer.
As for September 2006, we speculate that the severe hypoxia occurring at the surface and bottom of the inner Lingdingyang Bay (Fig. 8a2 and b2) resulted mainly from the inflows of low-oxygen waters from the upstream reaches, as evidenced by the significantly positive correlations between salinity and DO in Table 2 (with the correlation coefficients r reaching 0.7341 and 0.6637 at the surface and bottom, respectively; p < 0.01). Other factors including sewage effluents discharged from the runoff and coastal cities (as evidenced by the significant correlation between the surface DO and NH4 concentrations) and the respiration related to phytoplankton imported from the upstream reaches (as indicated by the high regional chl a contents in Fig. 10b6 and also in accordance with the finding by Ye et al., 2013) supplement the maintenance of hypoxia. With respect to the waters from the middle part of the Lingdingyang Bay to the Modaomen Bay, marked low-oxygen conditions were largely restricted to the bottom (with DOS ranging between 40 % and 50 %, Fig. 10b4) and possibly controlled by a complex interplay of various processes. Since the river discharge was weakened compared with that in summer, a greater fraction of terrestrial organic matter would have shifted towards being deposited at this area while the water residence time became longer (Sun et al., 2014) and thus favored the retention of organic matter and its eventual decomposition at the bottom. The influx of low-oxygen waters from the inner Lingdingyang Bay was an additional stressor that could also have contributed to the substantial oxygen deficit in this region. Regarding the lower estuary, a large area of high phytoplankton biomass (with maximum chl a content > 23 mg m−3) was observed (Fig. 10b6) because of the good light conditions attributed to the low concentrations of suspended particles (Fig. 10b5). Meanwhile, the prolonged water residence time was conducive to the retention and degradation of organic matter supplied by the elevated primary production in the region, thus resulting in significant oxygen consumption and a decline in the bottom water.
Overall, the combined actions of the upstream low-oxygen inflows and enhanced oxygen depletion driven by an intricate coupling of physical and biogeochemical processes eventually led to the emergence of a large-scale (estuary-wide) low-oxygen event in September 2006. By contrast, the low-oxygen conditions were much less severe in September 2001 (Fig. 8a1 and b1). In addition, no significant correlation was found between the bottom DO and other water quality parameters (e.g., salinity, temperature, and NO3; Table 2), implying that the key factor controlling low-oxygen conditions in September 2001 was likely different from that in September 2006. These differences suggest that in the periods of early autumn, there was considerable interannual variability in the spatial extent, intensity, and mechanisms of low-oxygen conditions, which has also been observed in summer. Plausible drivers for such interannual variability include the associated changes in freshwater discharge and wind forcing (both of which are major factors controlling the spreading of the nutrient-rich river plume; Xu et al., 2019) as well as terrestrial material inputs (including organic matter, nutrients, and suspended particles), which could induce significant alterations to physical conditions (e.g., vertical density stratification and mixing, estuarine circulation, retention time) and the internal production of organic matter. Further studies are needed to clarify the role of changes related to different dynamic factors in the generation of and variations in low-oxygen conditions in the PRE.
4.3 Long-term expansion of low-oxygen and hypoxic areas in the PRE
The global ocean and coastal waters have been experiencing notable oxygen declines over the past several decades, with significant increases in the number and severity of hypoxic areas in recent years (Breitburg et al., 2018; Diaz and Rosenberg, 2008). This rapid oxygen loss is largely attributed to intensive anthropogenic activities that have caused global warming and nutrient enrichment of coastal waters. The apparent long-term expansion of hypoxic conditions has been documented in several coastal systems where sustained seasonal hypoxia has been reported. For instance, the hypoxic volume in the Baltic Sea has expanded dramatically with increasing nutrient inputs from its watershed and enhanced water-column respiration resulting from warming (Fennel and Testa, 2019, and references therein). In Chesapeake Bay, the hypoxia can be tracked back to the 1930s and has witnessed an expansion of its volume since the 1950s due to increased nutrient loads (Hagy et al., 2004). Moreover, the hypoxia in the northern Gulf of Mexico has been documented since 1985 (Rabalais et al., 2002). However, models suggest that large-scale hypoxia could have occurred as early as the 1970s (Scavia and Donnelly, 2007). Despite large interannual variability, the hypoxic area has increased from an average of 8300 km2 in 1985–1992 to 16 000 km2 in 1993–2001 (Scavia et al., 2003). To mitigate hypoxia, nutrient reduction plans have been proposed. In addition to the nutrient loads, the long-term climate change can also exaggerate hypoxia and reduce the positive impacts from nutrient reduction. Modeling studies have suggested that the worsened physical conditions since the 1980s in Chesapeake Bay, e.g., prolonged vertical exchange time and elevated temperature, have contributed to the increased hypoxia (Du and Shen, 2015; Du et al., 2018). A more recent study shows that the impacts from climate change and nutrient reduction cancel each other out, and therefore the hypoxic volume in Chesapeake Bay has shown no significant long-term trends in the past 3 decades (Ni et al., 2020). Similar findings have also been recorded in other hypoxic systems, e.g., in the northern Gulf of Mexico (Kemp et al., 2009; Obenour et al., 2013). However, it has to be noted that the susceptibility of hypoxia to increased anthropogenic activities varies across different coastal systems due to their physical and biological features.
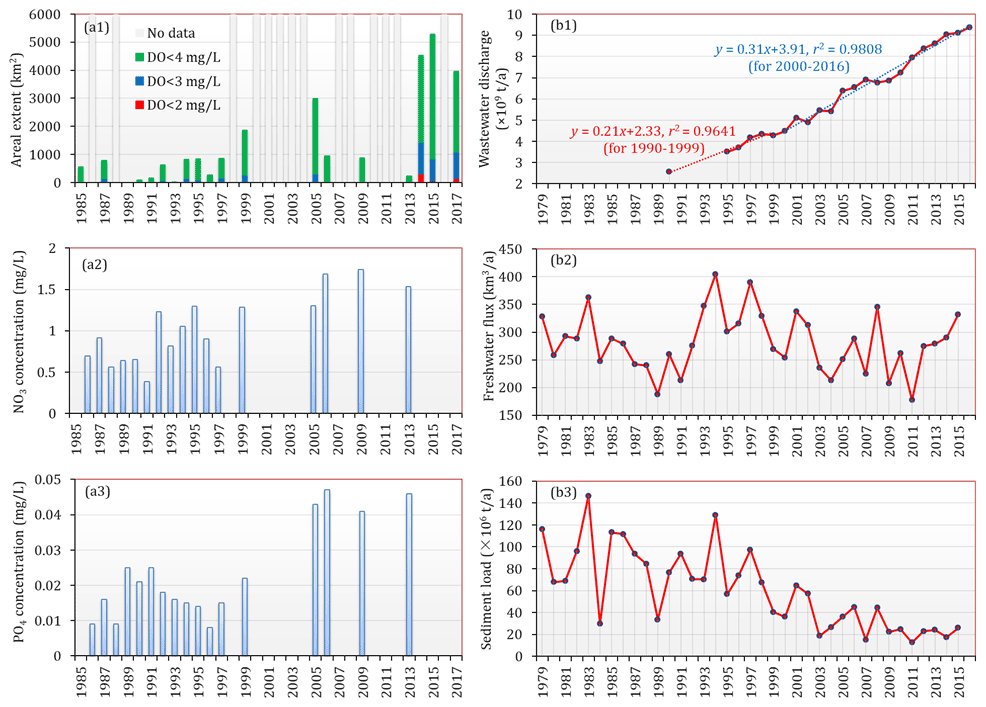
Figure 11(a1) The estimated area extent of low-oxygen conditions in the bottom waters of the PRE (note that these results was estimated based on the data available so far and may have underestimated the actual extent in certain periods due to lack of sufficient observations) and the(a2) NO3 and (a3) PO4 concentrations near the four eastern outlets in summer during 1985–2017. (b1) Annual wastewater discharge in Guangdong Province during 1990–2016. The data before 1998 were taken from X. Li et al. (2020), and the remaining data were obtained from the environmental statistics bulletin published by the Department of Ecology and Environmental of Guangdong Province (http://gdee.gd.gov.cn/tjxx3187/index.html, last access: 24 September 2021). (b2) Freshwater discharge and (b3) sediment load of the Pearl River from 1979 to 2015, adopted from Wu et al. (2020).
It is commonly recognized that the PRE did not develop a persistent, large-scale low-oxygen zone similar to those in other hypoxic systems (e.g., the northern Gulf of Mexico, Chesapeake Bay). A combination of intriguing features including shallow and turbid waters, rapid physical exchanges, and unstable vertical stratification provides a good buffering capacity for the PRE to mitigate eutrophication and hypoxic conditions in summer. Moreover, the freshwater input has been characterized by excess nitrogen (N) and low phosphorus (P), yielding an N:P ratio beyond 100 (Harrison et al., 2008; Hu and Li, 2009). Therefore, the growth of phytoplankton has been heavily inhibited over a large area of the PRE due to strong phosphorus limitation, together with high water turbidity (Figs. 10a5 and S1) and a short residence time (Sun et al., 2014). However, with the rapidly changing environments in recent years, the summertime low-oxygen conditions in the PRE have undergone an apparent expansion in areal extent, as indicated in Figs. 4, 6, and 11a1; large areas of low oxygen, oxygen deficiency, and hypoxia exceeding 4450, 1120, and 330 km2, respectively, were present during 2014–2017. This emerging declining trend of bottom oxygen and spatial expansion of low-oxygen conditions in the PRE have been supported by previous studies (Ye et al., 2012; Qian et al., 2018). By analyzing the sediment cores in the PRE, Ye et al. (2012) discovered that due to the influence of human activities, eutrophic conditions in the estuary have been exacerbated since the 1970s, and the relative abundance of hypoxia-resistant foraminifera has substantially increased, implying that the DO conditions in the bottom waters have been deteriorating. Based on the monitoring data collected by the Hong Kong Environmental Protection Department from a coastal site (SM18) during 1990–2014, Qian et al. (2018) also identified a significant decrease in the bottom DO over the past 25 years. Collectively, the results from our study and previous research described above have consistently corroborated the gradual exacerbation of low-oxygen conditions in the PRE. Besides, the years around 2000 appear to be a key time for the emergence of apparent deoxygenation, which coincided with the sharp environment changes along with the growing economy and population in China.
Firstly, the long-term decline in oxygen was thought to be principally driven by the increasing wastewater discharge in the Pearl River Delta region. As shown in Fig. 11b1, the annual wastewater discharge in Guangdong Province has increased from ∼ 2.5 × 10⁹ t in 1990 to ∼ 9.4 × 10⁹ t in 2016, thereby resulting in remarkable nutrient enrichment and water quality deterioration. Figure 11a2 and a3 show a long-term increasing trend in the nutrient concentrations near the four eastern outlets; although there existed data gaps in certain years, it is still clear that the nutrient concentrations after 2000 were higher than those before. According to X. Li et al. (2020), nutrient concentrations in the upstream reaches, which receive a large amount of sewage effluents from Guangzhou and Dongguan, have been mostly higher than 50 µg L−1 for NH4, 1000 µg L−1 for NO3, and 30 µg L−1 for PO4 since 2000, coincident with the accelerated growth of wastewater discharge (Fig. 11b1). The elevated nutrients, especially PO4, which almost doubled from the 1990s to the 2010s (X. Li et al., 2020; Fig. 11a3), has very likely promoted the phytoplankton biomass and local production of organic matter in the PRE; indeed, X. Li et al. (2020) reported an increasing trend of chl a in the surface waters of the lower estuary from 2001 to 2011, with concentrations exceeding 10 µg L−1 in recent years. Furthermore, as a result of intense nitrification and aerobic respiration of organic matter from direct anthropogenic inputs (He et al., 2014), the DO content in the upstream reaches has been declining since 1998, with periodic low oxygen and episodic hypoxia starting from 2000 (X. Li et al., 2020). Therefore, the inflows from the upstream reaches preconditioned the freshwater delivered into the PRE with increasingly high levels of nutrients and organic matter as well as low-oxygen waters, which have had significant contributions to the low DO levels in the inner Lingdingyang Bay since 1999 (Figs. 5 and 6).
Secondly, in addition to the continued rise in nutrients and various pollutants, dramatic alterations to sediment load were identified as well because of regional high-intensity human activities (e.g., the construction of dams and reservoirs, soil–water conservation measures, altered land-use patterns). As recently reported by Wu et al. (2020), the sediment load of the nine major rivers (including the Yangtze, Pearl, and Yellow rivers) in China has dramatically dropped by 85 % over the past 6 decades, and the year 1999 was identified as one of the important times for the sediment declines. As for the Pearl River, its water discharge showed a slight downward trend during 1979–2015 (Fig. 11b2); however, the sediment load was characterized with a more significant decline (Fig. 11b3), approximately by 63 % between 1979–1998 (∼ 85 × 106 t a−1) and 1999–2015 (∼ 31 × 106 t a−1), primarily attributed to anthropogenic impacts (Wu et al., 2020). The observed data have also shown that the averaged values of SSC in the PRE in the 2000s–2010s were generally lower than those in the early 1990s (Fig. S1), which is consistent with the long-term declining trend of the sediment load. One potential consequence of this abrupt change is that the PRE could become more susceptible to widespread eutrophication and strengthened oxygen depletion as the light-shading effect of suspended sediments on primary production is greatly weakened. This inference can be supported to a certain extent by the negative correlation between DO and SSC (i.e., the lower the SSC, the higher the DO) in the surface waters of the PRE (Fig. S2 in the Supplement), which suggests that with the decrease in SSC, water transparency would be greatly improved and conducive to the growth of phytoplankton; therefore, the surface DO level would increase as a result of the oxygen release via photosynthesis, whereas the bottom DO consumption would be enhanced due to the substantial supply and decomposition of organic matter associated with the aggravated eutrophication. With respect to other stressors, including ocean warming and upwelling of subsurface low-oxygen, nutrient-rich waters from the South China Sea, it has been clarified that they made minor contributions to the observed long-term decline in oxygen in the PRE (Qian et al., 2018).
Collectively, the significant decline in the Pearl River sediment load, superimposed with the considerable changes in nutrients, could play an important role in controlling the expansion of low-oxygen conditions in the PRE. Future work is needed to further clarify the role and relative contributions of these changes in the long-term deoxygenation trend in the PRE.
4.4 Implication and limitations
By using the field observations over 42 years, this study is a first attempt to reveal the long-term evolution of low-oxygen conditions in the PRE in terms of spatial extent. Although there existed data gaps in certain years and lack of conformity in observational coverage, the observations witnessed a distinct exacerbation of summertime low-oxygen conditions and increased frequencies in extremes (e.g., HA4 > 1600 km2, Fig. 11a1). In the context of global oxygen declines, unveiling this potential decadal change in low-oxygen conditions could be helpful for us to project and better understand the future oxygen status in the PRE as well as in other coastal systems subject to intense anthropogenic disturbances. In addition, our results also identified two prominent low-oxygen events in the early autumn of the PRE, which were not inherited from summer ones but were formed by different mechanisms. Given the insufficient attention to this issue so far, our finding is not merely a supplement to the understanding of oxygen dynamics in the PRE but also a critical reminder for the community to realize the importance and severity of the low-oxygen problem in early autumn. It is highly essential to strengthen scientific research and field investigations into this issue in order to fully elucidate its current status, formation process, and controlling factors, especially in the context of the spatial expansion of low-oxygen conditions observed in summer.
Nevertheless, a caveat to the historical observations for the PRE is that they were undersampled in some years, especially before the 2010s. Besides, the available numbers of different data types were also different; the historical data on DO, nutrient concentrations, temperature, and salinity were relatively abundant, while the long-term data on chl a and nutrient loadings were lacking. This largely limits our ability to quantify the long-term changes in low-oxygen conditions and to further investigate the associated mechanisms. For instance, low oxygen was observed in some summer months (Fig. 6), e.g., July 1992, July 1994, and August 1999, but we were unable to estimate its coverage and intensity due to the lack of sufficient observations. It is thus important to note that caution should be maintained when interpreting these low-oxygen areas estimated from the available data (Fig. 11a1), which are inappropriate for direct use in quantifying the long-term oxygen changes due to the data limitations. To this end, we would like to emphasize the importance of conducting estuary-wide surveys to collect extensive data on DO and its related factors in the PRE in a consistent way. Furthermore, we could also collect more in situ observations to fill the data gaps and merge the data into sophisticated numerical models through model calibration and/or data assimilation to provide a more thorough insight into the temporal and spatial variability in, development of, and underlying processes of low-oxygen conditions in the PRE.
This study explores the long-term spatiotemporal variations in DO as well as the locations and severity of low-oxygen conditions in the PRE by utilizing a collection of observations during 1976–2017. Our analysis has revealed a number of important aspects concerning low-oxygen status (including the hotspots with a high incidence of low-oxygen events) and its associated long-term changes over the past 42 years. The spatial patterns of DO and low-oxygen conditions exhibited significant seasonal, intra-seasonal, and interannual variations. Low-oxygen conditions were frequently observed in summer and primarily present in the bottom waters affected by intense vertical stratification and oxygen uptake by the sediments. Furthermore, the summertime low-oxygen conditions have experienced an apparent expansion in spatial extent over recent years. The synergetic effects of substantially increased loads of anthropogenic nutrients and organic matter, a sharply decreased load of suspended sediments, and direct inflows of low-oxygen waters from the Pearl River act to promote the exacerbation of low-oxygen conditions in the PRE. Prominent low-oxygen events were also present in early autumn, showing different characteristics and underlying mechanisms from those in summer. To sum up, our results indicate that large areas of low oxygen can form in the PRE under certain environmental conditions, as exemplified in September 2006 and the summer months of 2014–2017, and that this river-dominated estuary has shown a clear trend of developing into a seasonal, estuary-wide oxygen-deficient/hypoxic zone in summer.
The in situ observations during 1976–2014 (Dataset 1–4 as listed in Table 1) are available at https://doi.org/10.5281/zenodo.5195759 (Hu, 2021), while the oxygen data in July of 2014–2017 (Dataset 5) derived from literatures can be downloaded directly via the links provided in the corresponding literatures.
The supplement related to this article is available online at: https://doi.org/10.5194/bg-18-5247-2021-supplement.
JHu contributed to conceptualization, data analysis, drafting, and review and editing. ZZ contributed to graphic visualization and review and editing. BW contributed to writing and review. JHua contributed to data compilation and analysis.
The authors declare that they have no conflict of interest.
Publisher's note: Copernicus Publications remains neutral with regard to jurisdictional claims in published maps and institutional affiliations.
Jiatang Hu would like to express special thanks to Shiyu Li for his long-time support and help. This work celebrates his retirement after a successful career in environmental science, with great endeavor and contributions in the field of water environment modeling and management.
This research has been supported by the Joint Research Fund of the National Natural Science Foundation of China and Guangdong Province (grant no. U1901209).
This paper was edited by Peter Landschützer and reviewed by two anonymous referees.
Bianchi, T. S., DiMarco, S. F., Cowan, J. H., Hetland, R. D., Chapman, P., Day, J. W., and Allison, M. A.: The science of hypoxia in the Northern Gulf of Mexico: A review, Sci. Total Environ., 408, 1471–1484, https://doi.org/10.1016/j.scitotenv.2009.11.047, 2010.
Breitburg, D., Levin, L. A., Oschlies, A., Grégoire, M., Chavez, F. P., Conley, D. J., Garçon, V., Gilbert, D., Gutiérrez, D., Isensee, K., Jacinto, G. S., Limburg, K. E., Montes, I., Naqvi, S. W. A., Pitcher, G. C., Rabalais, N. N., Roman, M. R., Rose, K. A., Seibel, B. A., Telszewski, M., Yasuhara, M., and Zhang, J.: Declining oxygen in the global ocean and coastal waters, Science, 359, 1–13, https://doi.org/10.1126/science.aam7240, 2018.
Cai, W. J., Hu, X., Huang, W. J., Murrell, M. C., Lehrter, J. C., Lohrenz, S. E., Chou, W. C., Zhai, W., Hollibaugh, J. T., Wang, Y., Zhao, P., Guo, X., Gundersen, K., Dai, M., and Gong, G. C.: Acidification of subsurface coastal waters enhanced by eutrophication, Nat. Geosci., 4, 766–770, https://doi.org/10.1038/ngeo1297, 2011.
Chen, J. C., Heinke, G. W., and Zhou, M. J.: The Pearl River Estuary Pollution Project (PREPP), Cont. Shelf Res., 24, 1739–1744, https://doi.org/10.1016/j.csr.2004.06.004, 2004.
Cui, Y., Wu, J., Ren, J., and Xu, J.: Physical dynamics structures and oxygen budget of summer hypoxia in the Pearl River Estuary, Limnol. Oceanogr., 64, 131–148, https://doi.org/10.1002/lno.11025, 2019.
Dai, M., Zhai, W., Cai, W.-J., Callahan, J., Huang, B., Shang, S., Huang, T., Li, X., Lu, Z., Chen, W., and Chen, Z.: Effects of an estuarine plume-associated bloom on the carbonate system in the lower reaches of the Pearl River estuary and the coastal zone of the northern South China Sea, Cont. Shelf Res., 28, 1416–1423, https://doi.org/10.1016/j.csr.2007.04.018, 2008.
Diaz, R. J. and Rosenberg, R.: Spreading Dead Zones and Consequences for Marine Ecosystems, Science, 321, 926–929, https://doi.org/10.1126/science.1156401, 2008.
Du, J. and Shen, J.: Decoupling the influence of biological and physical processes on the dissolved oxygen in the Chesapeake Bay, J. Geophys. Res.-Oceans, 120, 78–93, https://doi.org/10.1002/2014JC010422, 2015.
Du, J., Shen, J., Park, K., Wang, Y. P., and Yu, X.: Worsened physical condition due to climate change contributes to the increasing hypoxia in Chesapeake Bay, Sci. Total Environ., 630, 707–717, https://doi.org/10.1016/j.scitotenv.2018.02.265, 2018.
Feng, Y., Fennel, K., Jackson, G. A., Dimarco, S. F., and Hetland, R. D.: A model study of the response of hypoxia to upwelling-favorable wind on the northern Gulf of Mexico shelf, J. Marine Syst., 131, 63–73, https://doi.org/10.1016/j.jmarsys.2013.11.009, 2014.
Fennel, K. and Testa, J. M.: Biogeochemical Controls on Coastal Hypoxia, Annu. Rev. Mar. Sci., 11, 105–130, https://doi.org/10.1146/annurev-marine-010318-095138, 2019.
Garcia, H. E. and Gordon, L. I.: Oxygen solubility in seawater: Better fitting equations, Limnol. Oceanogr., 37, 1307–1312, https://doi.org/10.4319/lo.1992.37.6.1307, 1992.
Hagy, J. D., Boynton, W. R., Keefe, C. W., and Wood, K. V.: Hypoxia in Chesapeake Bay, 1950–2001: Long-term change in relation to nutrient loading and river flow, Estuaries, 27, 634–658, https://doi.org/10.1007/BF02907650, 2004.
Harrison, P. J., Yin, K., Lee, J. H. W., Gan, J., and Liu, H.: Physical-biological coupling in the Pearl River Estuary, Cont. Shelf Res., 28, 1405–1415, https://doi.org/10.1016/j.csr.2007.02.011, 2008.
He, B., Dai, M., Zhai, W., Guo, X., and Wang, L.: Hypoxia in the upper reaches of the Pearl River Estuary and its maintenance mechanisms: A synthesis based on multiple year observations during 2000–2008, Mar. Chem., 167, 13–24, https://doi.org/10.1016/j.marchem.2014.07.003, 2014.
Hu, J.: In-situ observations during 1976–2014 (Version v1), Zenodo [data set], https://doi.org/10.5281/zenodo.5195759, 2021.
Hu, J. and Li, S.: Modeling the mass fluxes and transformations of nutrients in the Pearl River Delta, China, J. Marine Syst., 78, 146–167, https://doi.org/10.1016/j.jmarsys.2009.05.001, 2009.
Hu, J., Li, S., and Geng, B.: Modeling the mass flux budgets of water and suspended sediments for the river network and estuary in the Pearl River Delta, China, J. Marine Syst., 88, 252–266, https://doi.org/10.1016/j.jmarsys.2011.05.002, 2011.
Huang, X., Lin, J., Zhang, S., and Liang, K.: The distribution of seawater chemical elements in Pearl River Estuary and seawater quality assessment, Transactions of Oceanology and Limnology, 162–174, https://doi.org/10.13984/j.cnki.cn37-1141.2012.03.023, 2012 (in Chinese with English abstract).
Kemp, W. M., Testa, J. M., Conley, D. J., Gilbert, D., and Hagy, J. D.: Temporal responses of coastal hypoxia to nutrient loading and physical controls, Biogeosciences, 6, 2985–3008, https://doi.org/10.5194/bg-6-2985-2009, 2009.
Li, D., Gan, J., Hui, R., Liu, Z., Yu, L., Lu, Z., and Dai, M.: Vortex and biogeochemical dynamics for the hypoxia formation within the coastal transition zone off the Pearl River Estuary, J. Geophys. Res.-Oceans, 125, e2020JC016178, https://doi.org/10.1029/2020JC016178, 2020.
Li, G., Liu, J., Diao, Z., Jiang, X., Li, J., Ke, Z., Shen, P., Ren, L., Huang, L., and Tan, Y.: Subsurface low dissolved oxygen occurred at fresh- and saline-water intersection of the Pearl River estuary during the summer period, Mar. Pollut. Bull., 126, 585–591, https://doi.org/10.1016/j.marpolbul.2017.09.061, 2018.
Li, X., Lu, C., Zhang, Y., Zhao, H., Wang, J., Liu, H., and Yin, K.: Low dissolved oxygen in the Pearl River estuary in summer: Long-term spatio-temporal patterns, trends, and regulating factors, Mar. Pollut. Bull., 151, 110814, https://doi.org/10.1016/j.marpolbul.2019.110814, 2020.
Lin, H., Liu, S., and Han, W.: Potential trigger CTB, from seasonal bottom water hypoxia in the Pearl River Estuary, Journal of Zhanjiang Ocean University, 21, 25–29, 2001 (in Chinese with English abstract).
Lu, Z., Gan, J., Dai, M., Liu, H., and Zhao, X.: Joint Effects of Extrinsic Biophysical Fluxes and Intrinsic Hydrodynamics on the Formation of Hypoxia West off the Pearl River Estuary, J. Geophys. Res.-Oceans, 123, 6241–6259, https://doi.org/10.1029/2018JC014199, 2018.
Luo, L., Li, S., and Wang, D.: Hypoxia in the Pearl River Estuary, the South China Sea, in July 1999, Aquat. Ecosyst. Health, 12, 418–428, https://doi.org/10.1080/14634980903352407, 2009.
Middelburg, J. J. and Levin, L. A.: Coastal hypoxia and sediment biogeochemistry, Biogeosciences, 6, 1273–1293, https://doi.org/10.5194/bg-6-1273-2009, 2009.
Ni, W., Li, M., and Testa, J. M.: Discerning effects of warming, sea level rise and nutrient management on long-term hypoxia trends in Chesapeake Bay, Sci. The Total Environ., 737, 139717, https://doi.org/10.1016/j.scitotenv.2020.139717, 2020.
Obenour, D. R., Scavia, D., Rabalais, N. N., Turner, R. E., and Michalak, A. M.: Retrospective analysis of midsummer hypoxic area and volume in the northern Gulf of Mexico, 1985–2011, Environ. Sci. Technol., 47, 9808–9815, https://doi.org/10.1021/es400983g, 2013.
Parsons, T. R., Maita, Y., and Lalli, C. M.: A Manual of Chemical and Biological Methods for Seawater Analysis, Pergamon Press, Oxford, https://doi.org/10.1016/C2009-0-07774-5, 1984.
Qian, W., Gan, J., Liu, J., He, B., Lu, Z., Guo, X., Wang, D., Guo, L., Huang, T., and Dai, M.: Current status of emerging hypoxia in a eutrophic estuary: The lower reach of the Pearl River Estuary, China, Estuar. Coast. Shelf S., 205, 58–67, https://doi.org/10.1016/j.ecss.2018.03.004, 2018.
Rabalais, N. N., Turner, R. E., and William Jr., J. W.: Gulf of Mexico Hypoxia, A. K. A. “The Dead Zone”, Annu. Rev. Ecol. Syst., 33, 235–263, https://doi.org/10.1146/annurev.ecolsys.33.010802.150513, 2002.
Rabalais, N. N., Díaz, R. J., Levin, L. A., Turner, R. E., Gilbert, D., and Zhang, J.: Dynamics and distribution of natural and human-caused hypoxia, Biogeosciences, 7, 585–619, https://doi.org/10.5194/bg-7-585-2010, 2010.
Rabouille, C., Conley, D. J., Dai, M. H., Cai, W. J., Chen, C. T. A., Lansard, B., Green, R., Yin, K., Harrison, P. J., Dagg, M., and McKee, B.: Comparison of hypoxia among four river-dominated ocean margins: The Changjiang (Yangtze), Mississippi, Pearl, and Rhne rivers, Cont. Shelf Res., 28, 1527–1537, https://doi.org/10.1016/j.csr.2008.01.020, 2008.
Scavia, D. and Donnelly, K. A.: Reassessing Hypoxia Forecasts for the Gulf of Mexico, Environmental Science and Technology, 41, 8111–8117, https://doi.org/10.1021/es0714235, 2007.
Scavia, D., Rabalais, N. N., Turner, R. E., Justić, D., and Wiseman Jr., W. J.: Predicting the response of Gulf of Mexico hypoxia to variations in Mississippi River nitrogen load, Limnol. Oceanogr., 48, 951–956, https://doi.org/10.4319/lo.2003.48.3.0951, 2003.
Shi, Z., Liu, K., Zhang, S., Xu, H., and Liu, H.: Spatial distributions of mesozooplankton biomass, community composition and grazing impact in association with hypoxia in the Pearl River Estuary, Estuar. Coast. Shelf S., 225, 106237, https://doi.org/10.1016/j.ecss.2019.05.019, 2019.
Su, J., Dai, M., He, B., Wang, L., Gan, J., Guo, X., Zhao, H., and Yu, F.: Tracing the origin of the oxygen-consuming organic matter in the hypoxic zone in a large eutrophic estuary: the lower reach of the Pearl River Estuary, China, Biogeosciences, 14, 4085–4099, https://doi.org/10.5194/bg-14-4085-2017, 2017.
Sun, J., Lin, B., Li, K., and Jiang, G.: A modelling study of residence time and exposure time in the Pearl River Estuary, China, J. Hydro-Environ. Res., 8, 281–291, https://doi.org/10.1016/j.jher.2013.06.003, 2014.
Wang, B., Hu, J., Li, S., and Liu, D.: A numerical analysis of biogeochemical controls with physical modulation on hypoxia during summer in the Pearl River estuary, Biogeosciences, 14, 2979–2999, https://doi.org/10.5194/bg-14-2979-2017, 2017.
Wei, Q. S., Wang, B. D., Zhigang, Y. U., Chen, J. F., and Xue, L.: Mechanisms leading to the frequent occurrences of hypoxia and a preliminary analysis of the associated acidification off the Changjiang estuary in summer, Sci. China Earth Sci., 60, 360–381, https://doi.org/10.1007/s11430-015-5542-8, 2017.
Wong, L. A., Chen, J., Xue, H., Dong, L. X., Su, J. L., and Heinke, G.: A model study of the circulation in the Pearl River Estuary (PRE) and its adjacent coastal waters: 1. Simulations and comparison with observations, J. Geophys. Res.-Oceans, 108, 3156, https://doi.org/10.1029/2002jc001451, 2003.
Wu, Z., Zhao, D., Syvitski, J. P. M., Saito, Y., and Wang, M.: Anthropogenic impacts on the decreasing sediment loads of nine major rivers in China, 1954–2015, Sci. Total Environ., 739, 1–21, https://doi.org/10.1016/j.scitotenv.2020.139653, 2020.
Xu, C., Xu, Y. J., Hu, J. T., Li, S. Y., and Wang, B.: A numerical analysis of the summertime Pearl River plume from 1999 to 2010: Dispersal patterns and intraseasonal variability, J. Marine Syst., 192, 15–27, https://doi.org/10.1016/j.jmarsys.2018.12.010, 2019.
Yang, W., Luo, L., Gao, Y., Zu, T., and Wang, D.: Comparison of environmental constituents in the Pearl River Estuary during summer of 1999 and 2009, Journal of Tropical Oceanography, 30, 16–23, 2011 (in Chinese with English abstract).
Ye, F., Huang, X., Zhang, X., Zhang, D., Zeng, Y., and Tian, L.: Recent oxygen depletion in the Pearl River Estuary, South China: geochemical and microfaunal evidence, J. Oceanogr., 68, 387–400, https://doi.org/10.1007/s10872-012-0104-1, 2012.
Ye, F., Huang, X., Shi, Z., and Liu, Q.: Distribution characteristics of dissolved oxygen and its affecting factors in the Pearl River Estuary during the summer of the extremely drought hydrological year 2011, Environ. Sci., 34, 1707–1714, https://doi.org/10.13227/j.hjkx.2013.05.009, 2013 (in Chinese with English abstract).
Ye, F., Guo, W., Shi, Z., Jia, G., and Wei, G.: Seasonal dynamics of particulate organic matter and its response to flooding in the Pearl River Estuary, China, revealed by stable isotope (δ13C and δ15N) analyses, J. Geophys. Res.-Oceans, 122, 6835–6856, https://doi.org/10.1002/2017JC012931, 2017.
Yin, K., Lin, Z., and Ke, Z.: Temporal and spatial distribution of dissolved oxygen in the Pearl River Estuary and adjacent coastal waters, Cont. Shelf Res., 24, 1935–1948, https://doi.org/10.1016/j.csr.2004.06.017, 2004.
Yu, L., Fennel, K., and Laurent, A.: A modeling study of physical controls on hypoxia generation in the northern Gulf of Mexico, J. Geophys. Res.-Oceans, 120, 5019–5039, https://doi.org/10.1002/2014JC010634, 2015.
Zhai, W., Dai, M., Cai, W. J., Wang, Y., and Wang, Z.: High partial pressure of CO2 and its maintaining mechanism in a subtropical estuary: the Pearl River estuary, China, Mar. Chem., 93, 21–32, https://doi.org/10.1016/j.marchem.2004.07.003, 2005.
Zhang, H. and Li, S.: Effects of physical and biochemical processes on the dissolved oxygen budget for the Pearl River Estuary during summer, J. Marine Syst., 79, 65–88, https://doi.org/10.1016/j.jmarsys.2009.07.002, 2010.
Zhang, J., Gilbert, D., Gooday, A. J., Levin, L., Naqvi, S. W. A., Middelburg, J. J., Scranton, M., Ekau, W., Peña, A., Dewitte, B., Oguz, T., Monteiro, P. M. S., Urban, E., Rabalais, N. N., Ittekkot, V., Kemp, W. M., Ulloa, O., Elmgren, R., Escobar-Briones, E., and Van der Plas, A. K.: Natural and human-induced hypoxia and consequences for coastal areas: synthesis and future development, Biogeosciences, 7, 1443–1467, https://doi.org/10.5194/bg-7-1443-2010, 2010.
Zhang, W., Wu, H., and Zhu, Z.: Transient Hypoxia Extent Off Changjiang River Estuary due to Mobile Changjiang River Plume, J. Geophys. Res.-Oceans, 123, 9196–9211, https://doi.org/10.1029/2018JC014596, 2018.