the Creative Commons Attribution 4.0 License.
the Creative Commons Attribution 4.0 License.
 | 01 Oct 2021
Riverine nitrogen supply to the global ocean and its limited impact on global marine primary production: a feedback study using an Earth system model
Miriam Tivig
David P. Keller
Andreas Oschlies
A common notion is that negative feedbacks stabilize the natural marine nitrogen inventory. Recent modeling studies have shown, however, some potential for localized positive feedbacks leading to substantial nitrogen losses in regions where nitrogen fixation and denitrification occur in proximity to each other. Here we include dissolved nitrogen from river discharge in a global 3-D ocean biogeochemistry model and study the effects on near-coastal and remote-open-ocean biogeochemistry. We find that at a steady state the biogeochemical feedbacks in the marine nitrogen cycle, nitrogen input from biological N2 fixation, and nitrogen loss via denitrification mostly compensate for the imposed yearly addition of 22.8 to 45.6 Tg of riverine nitrogen and limit the impact on global marine productivity to < 2 %. Global experiments that regionally isolate river nutrient input show that the sign and strength of the feedbacks depend on the location of the river discharge and the oxygen status of the receiving marine environment. Marine productivity generally increases in proximity to the nitrogen input, but we also find a decline in productivity in the modeled Bay of Bengal and near the mouth of the Amazon River. While most of the changes are located in shelf and near-coastal oceans, nitrogen supply from the rivers can impact the open ocean, due to feedbacks or knock-on effects.
- Article
(15167 KB) - Full-text XML
-
Supplement
(91 KB) - BibTeX
- EndNote


Nitrogen plays a key role in marine biogeochemistry in coastal and open oceans as it is one of the major limiting nutrients for algal photosynthesis. Variations in the oceanic fixed-nitrogen (N) inventory are known to have driven marine productivity changes contributing to atmospheric CO2 variations in Earth's history (Falkowski, 1997).
Although several studies have questioned the stability of the global N budget (Codispoti et al., 2001; Gruber and Sarmiento, 1997; Codispoti, 1995), the present marine N inventory is generally considered to be in a steady state (Deutsch et al., 2007; Altabet, 2006; Gruber, 2004; Tyrrell, 1999; Redfield et al., 1963). Oceanic fixed-nitrogen concentrations are mainly controlled by the balance between denitrification and N fixation, creating negative feedbacks which damp the often strong perturbations of the marine N content with respect to the more slowly overturning phosphorus (P) inventory (Somes et al., 2013; Deutsch et al., 2007; Gruber, 2004; Ruttenberg, 2003).
In regions where fixed N is sparse, organisms that fix atmospheric nitrogen (N2) dissolved in seawater, commonly called diazotrophs, can compensate for N deficits (Deutsch et al., 2007, 2001; Capone et al., 1997). However, as diazotrophs consume phosphate while adding fixed N to their environment, they are generally considered to regulate their own population. Previous studies have shown that at least the most commonly cultured diazotrophs, especially Trichodesmium, have low growth rates relative to many non-fixing phytoplankton (e.g., Capone et al., 1997). Indeed, while these organisms are able to fix N2 when reactive nitrogen is scarce, this turns into an disadvantage in regions where N is more abundant, because N2 fixation requires more energy (Tyrrell, 1999). According to common conceptual models of controls on nitrogen fixation, the slowly growing diazotrophs are then outcompeted by non-fixing phytoplankton if enough P and other nutrients are present (Tyrrell, 1999). Note that part of our knowledge of N2 fixation and most modern model concepts are still based on the original limited assumptions based on a few species, especially Trichodesmium. Also, emphasis has traditionally been put on bottom-up controls, despite accumulating evidence that top-down controls such as selective grazing on dominant species may have substantial impacts on the distribution of diazotrophs and nitrogen fixation (Landolfi et al., 2021).
Denitrification is a metabolic process in which nitrate (NO3) replaces oxygen (O2) as the terminal electron acceptor for respiration and is reduced to N2, which is not bioavailable for most marine organisms, except diazotrophs (Gruber, 2004; Deutsch et al., 2001). Denitrification represents the main sink for fixed N in the ocean and occurs both in marine sediments and in the water columns under suboxic conditions (Gruber, 2004; Codispoti et al., 2001). But denitrification limits itself by reducing the concentrations of fixed N at the surface, which in turn limits the growth of phytoplankton and the heterotrophic O2 consumption during organic matter remineralization, eventually making NO3 less competitive as an electron acceptor where O2 remains available (Landolfi et al., 2013; Gruber, 2004). These two processes, N2 fixation and denitrification, both contribute to regulating the global marine N budget.
Besides the fixation of atmospheric N2, rivers are also a major source of N to the coastal and the open ocean. Rivers are estimated to add 36–60 Tg N yr−1 to the coastal waters (Beusen et al., 2016; Mayorga et al., 2010; Seitzinger et al., 2005). These N inputs are regionally highly diverse and range over several orders of magnitude (Meybeck et al., 2006).
Although riverine N is not the main source of N to the marine environments, it can become a key player, as it is directly influenced by human activities. Seitzinger et al. (2010), for example, estimated that global nitrogen export by rivers to the coastal waters increased by 17.7 % from 1970 to 2000. Nitrogen is known to impact coastal marine biology and biogeochemistry, leading for example to eutrophication, algal blooms, or hypoxia (e.g., Seitzinger et al., 2010; Billen and Garnier, 2007; Smith et al., 2003). Previous studies have shown that nutrient input from land also has consequences for seawater composition and through this impacts biogeochemical processes in the open ocean farther away from the coasts (e.g., Barron and Duarte, 2015; Bauer et al., 2013; Bernard et al., 2011; Jahnke, 2010).
At this place it is appropriate to include some remarks about the anthropogenic perturbation of the N cycle. In the Anthropocene, human activities have led to increased inputs of fixed nitrogen from the atmosphere and through different sources of runoff from land (e.g., Somes et al., 2016; Kim et al., 2014; Lamarque et al., 2013). At the same time, warming and deoxygenation can lead to increased N loss (Oschlies et al., 2019). The question has therefore been raised of if the global N budget could still be considered to be in a steady state. While these combined effects on the N budget are still very uncertain, some studies suggest that imbalances could be limited due to internal feedbacks of the N cycle (Landolfi et al., 2017; Somes et al., 2016; Krishnamurthy et al., 2006).
As global measurements of N concentrations and fluxes are difficult, models are often used to study the marine N cycle and its feedbacks. However, global biogeochemical ocean models often still omit riverine nutrient input to the ocean or represent it in a very simplified form (Séférian et al., 2020). Giraud et al. (2008), for example, tested the sensitivity of the global ocean biogeochemistry to coastal nutrient fluxes in a global ocean biogeochemistry model by introducing nutrients in different scenarios into the coastal grid boxes. They found that excess nutrients in the coastal ocean could impact the biological activity not only locally but also in the open ocean and that the effect depended more on the ratio between these nutrients and iron and silicate than on the actual quantities. Nevertheless, the study by Giraud et al. (2008) was an idealized experiment without observed nutrient fluxes and with a relatively simple representation of the ecosystem dynamics, where total nitrogen nutrient and phosphate were linked by the Redfield ratio and indifferently represented by one model variable. Da Cunha et al. (2007) used an ocean biogeochemistry model to analyze the impact of river nutrient fluxes (N, Si, Fe, and carbon) on the global and coastal ocean primary production but concentrated on a short time period of a few decades, likely not long enough to study the feedbacks of the N cycle in the open ocean considering that the mean residence time of fixed nitrogen in the ocean has been estimated to be a few thousand years (Gruber, 2004).
More recently, Lacroix et al. (2020) implemented estimated riverine nutrient loads in a global ocean model to analyze their implications for global oceanic nutrient concentrations, primary production, and CO2 fluxes. Their focus was on pre-industrial nutrient input from rivers, estimated as a function of precipitation, surface runoff, and temperature. N was calculated from the simulated P using a fixed N : P ratio, but Lacroix et al. (2020) did not analyze the N-cycle feedbacks.
For our study, we used the Earth system climate model of intermediate complexity of the University of Victoria (UVic), version 2.9 (Eby et al., 2009; Weaver et al., 2001). Earth system models of intermediate complexity (EMICs) have been developed to fill the gap between more abstract conceptual models and comprehensive global and Earth system models (ESMs) (Claussen et al., 2002). EMICs allow the integration of a large number of processes, more than conceptual models do, often using a coarser resolution and simplifying assumptions, e.g., describing the atmospheric circulation compared to ESMs, and thus substantially reducing computational costs. UVic has been developed as a tool that helps to understand processes and feedbacks operating within the climate system on decadal and longer timescales (Weaver et al., 2001).
Atmospheric deposition is known to be another important source of N to the ocean. Although it is estimated to add nitrogen at the same magnitude as the rivers and will also become more important with increasing anthropogenic activities (e.g., Tyrell, 1999; Cornell et al., 1995), it will not be considered in this study. Previously, Landolfi et al. (2017) and Somes et al. (2016) used UVic to study the response of the marine N cycle to idealized atmospheric N deposition and its impact on marine productivity. While Somes et al. (2016) performed a series of idealized sensitivity experiments to evaluate the spatial and temporal scales of N-cycle feedbacks, Landolfi et al. (2017) used an atmospheric N deposition forcing reconstructed using the multimodel mean of the Atmospheric Chemistry and Climate Model Intercomparison Project (Lamarque et al., 2013). Both found that N-cycle feedbacks stabilize the model's marine N inventory and limit global changes to the marine N cycle and productivity. But none of these studies included riverine N supply.
In order to disentangle the effects of the different sources of N, we are using UVic without atmospheric N deposition to focus on the marine biogeochemical response to riverine N inputs to the coastal ocean. To do this we make use of modeled estimates of riverine dissolved inorganic nitrogen (DIN) export from watersheds (Mayorga et al., 2010). While atmospheric deposition is more spread out over the whole ocean, river export of dissolved N reaches the ocean as point sources at different locations and in different concentrations. The global amount of N added to the ocean is comparable between our river-supply study and the atmospheric-supply ones by Somes et al. (2016) and Landolfi et al. (2017). Nevertheless, we hypothesize that the response of the marine ecosystem differs with highly concentrated nutrient injections associated with individual rivers.
In order to test the N-cycle mechanisms and feedbacks found and described before, we set up an experiment where we simulate differential riverine nitrogen supply to the coastal oceans. Although riverine nitrogen supply is highly influenced by anthropogenic activities, our focus is on the natural nitrogen cycle. Analogously to earlier studies (Lacroix et al., 2020; Da Cunha et al., 2007), we first evaluate the global N inventory and marine primary production after sustained addition of riverine DIN. In a second step, we additionally performed a series of experiments where we studied the responses of the ocean to riverine nutrient supply to individual regions in order to find out if N impacts the global ocean differently, depending on the region where river supply takes place.
Nutrients from the Global Nutrient Export from WaterSheds 2 (NEWS 2) model (Mayorga et al., 2010) are added to the University of Victoria Earth System Climate Model (UVic) 2.9 (Keller et al., 2012; Eby et al., 2009; Weaver et al., 2001). The model is outlined, before describing the NEWS 2 data set and our experimental design below.
2.1 The Earth system model UVic 2.9
UVic (Weaver et al., 2001) version 2.9 (Keller et al., 2012; Eby et al., 2009) is an Earth system model of intermediate complexity (Claussen et al., 2002). It consists of a three-dimensional (, 19 levels) general circulation model of the ocean: a two-dimensional, single-layer energy–moisture balance atmospheric model; a dynamic–thermodynamic sea ice model; and a terrestrial vegetation model.
The atmospheric component dynamically calculates heat and water fluxes between the atmosphere and the ocean and land and sea ice and is forced by monthly climatological winds prescribed by National Centers for Environmental Predictions/National Center for Atmospheric Research (NCEP/NCAR). The 19 vertical levels of the oceanic component, Modular Ocean Model 2 (MOM2), are 50 m thick near the surface and up to 500 m in the deep ocean. The oceanic physical settings are the same as in Keller et al. (2012). The marine ecosystem module of UVic is based on Keller et al. (2012) with updates of some of the equation parameters as noted in Partanen et al. (2016), where a small error in the code was corrected. Seven prognostic variables are embedded within the ocean circulation: two phytoplankton classes (nitrogen-fixing diazotrophs PD and other phytoplankton PO), zooplankton (Z), sinking particulate detritus (D), nitrate (NO3), phosphate (PO4), and oxygen (O2) (Fig. 1). NO3 and PO4 are linked through exchanges with the biological variables by constant (Redfield) stoichiometry of organic matter. All biological variables as well as the detritus are expressed in terms of nitrogen (mmol N m−3), using Redfield stoichiometry to calculate carbon and P. Since diazotrophs can fix nitrogen gas dissolved in seawater, they are not limited by NO3 or by a maximum NO3 concentration, while the growth of other phytoplankton is limited by NO3 and PO4 (note that both are additionally limited by iron, light, and temperature). The explicit integration of diazotrophs permitting the computation of nitrogen fixation is not given in all ocean models but makes UVic a good choice to study nitrogen cycle feedbacks. The maximum potential growth rate of diazotrophs is based not only on temperature as in most models but also on dissolved iron, which is necessary, for example, for photosynthesis or the reduction of nitrate to ammonium (Keller et al., 2012; Galbraith et al., 2010). Keller et al. (2012) found that the observational estimates were within the range of global nitrate fixation rates from estimations and that the patterns of N2 fixation from the new model were mostly consistent with the relatively sparse available observations (Sohm et al., 2011). See Keller et al. (2012) for a full description and evaluation of simulated marine biogeochemistry.
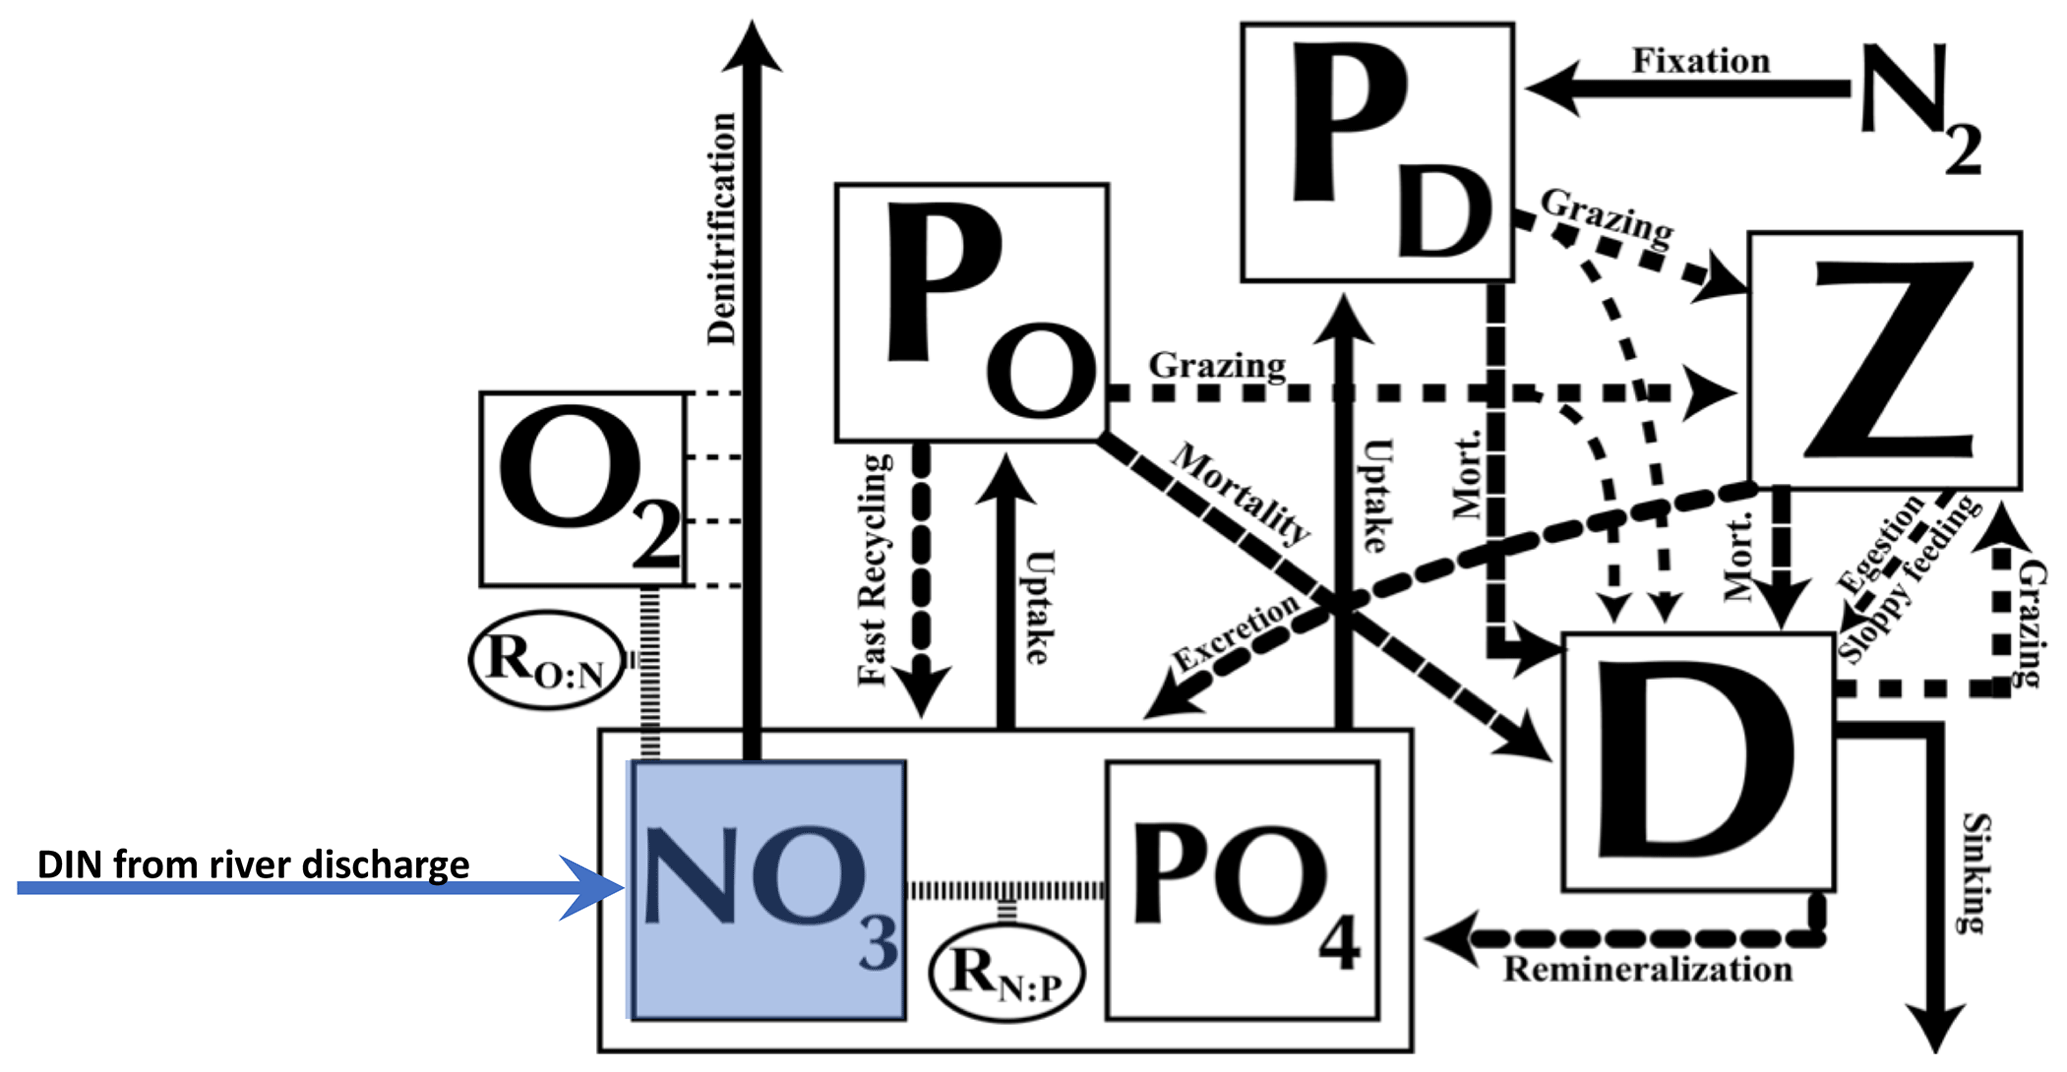
Figure 1Ecosystem model schematics for the NPZD model with the prognostic variables (in square boxes) and the fluxes of material between them, indicated by arrows. The prognostic variables include two nutrients, nitrate (NO3) and phosphate (PO4), two phytoplankton (nitrogen fixers PD and other phytoplankton PO) as well as zooplankton (Z), sinking detritus (D), and dissolved oxygen (O2). Nitrate (NO3) and phosphate (PO4) are linked through exchanges with the biological variables by constant (Redfield) stoichiometry of organic matter. See further details in the text. Figure updated from Keller et al. (2012).
In the global ocean, fixed N is regulated by the major input fluxes, N2 fixation and riverine input, and the major removal flux, denitrification (here implicitly including anammox). Benthic denitrification in particular is believed to be the major sink for fixed N (Voss et al., 2013; Galloway et al., 2004). It is included here through empirical transfer functions derived from benthic flux measurements (Bohlen et al., 2012). The functions are based on dynamic vertically integrated sediment models and estimate denitrification from the rain rate of particulate organic carbon to the seafloor and bottom-water O2 and NO3 concentrations. Like Somes and Oschlies (2015) and Somes et al. (2013) we use a subgrid bathymetry scheme for shallow continental shelves and other topographical features that are too fine to be resolved on the coarse UVic grid in order to better resolve particulate organic matter sinking and remineralization at the seafloor. For each cell near the coast this scheme calculates the seafloor area within the cell at a higher resolution following Somes et al. (2010b).
2.2 Including riverine nutrient supply to the UVic ocean
2.2.1 Global Nutrient Export from WaterSheds 2 – NEWS 2
Riverine N added to UVic has been generated by a global, spatially explicit model of nutrient exports by rivers. NEWS 2 (Mayorga et al., 2010) is the second version of a system of sub-models, which estimate the present-day annual export yield for each river basin (kg N km−2 yr−1) at the river mouths for dissolved and particulate forms of organic and inorganic N and P, as well as for dissolved organic and particulate carbon. See Mayorga et al. (2010) for more details on the model configuration. Each sub-model predicts the river export of a nutrient element for the base year 2000. This export is calculated as a function of natural and anthropogenic biogeophysical properties of each of the 5761 exoreic basins considered (Seitzinger et al., 2005). NEWS DIN includes DIN from sewage point sources, as well as N from diffuse sources, mobilized from watershed soils and sediments (Dumont et al., 2005). Despite uncertainties and errors, NEWS DIN predicts 54 %–78 % of the variability in the DIN export yield (kg N km−2 yr−1) and 72 %–83 % of the DIN export load (kg N per basin per year) of the validation data set used by Dumont et al. (2005). Note that NEWS 2 excludes runoff from the Antarctic continent.
2.2.2 NEWS DIN for UVic
To estimate the total export per river mouth, we multiplied the yields (kg N km−2 yr−1) of DIN and dissolved organic nitrogen (DON) by the respective basin area (in km2). Data from the NEWS 2 models have been interpolated on the coarser UVic grid, and the total exports per river basins have been added to the nearest discharge points, as not every river mouth from NEWS 2 has its equivalent discharge point in UVic (Fig. 2). Because there can be strong seasonal variations in nutrient fluxes and fluvial nutrient imports can have different effects on the biogeochemistry of a coastal ecosystem depending on the timing of the fluxes (Eisele and Kerimoglu, 2015; Holmes et al., 2012; Townsend-Small et al., 2011), we used the seasonally cycling climatology of freshwater runoff from UVic to estimate seasonal variations in N supply. Although freshwater discharge and riverine nutrient export are not always correlated, the discharge has an important impact on the nutrient loads of rivers (e.g., Lu et al., 2011, 2009; Sigleo and Frick, 2007; DeMaster and Pope, 1996). Here, we assumed a constant seasonal cycle in runoff and that nitrogen concentrations in the discharged river water are constant throughout the seasonal cycle. We then distributed the annual load over the months, weighted by the fraction of monthly freshwater discharge.
Riverine phosphorus is not added in this experiment, and we assume a fixed marine P inventory, like in most previous studies with UVic. The inclusion of a dynamic P cycle (like in Niemeyer et al., 2017; Kemena et al., 2019) with riverine P supply from NEWS 2 will be the subject of a follow-up study.
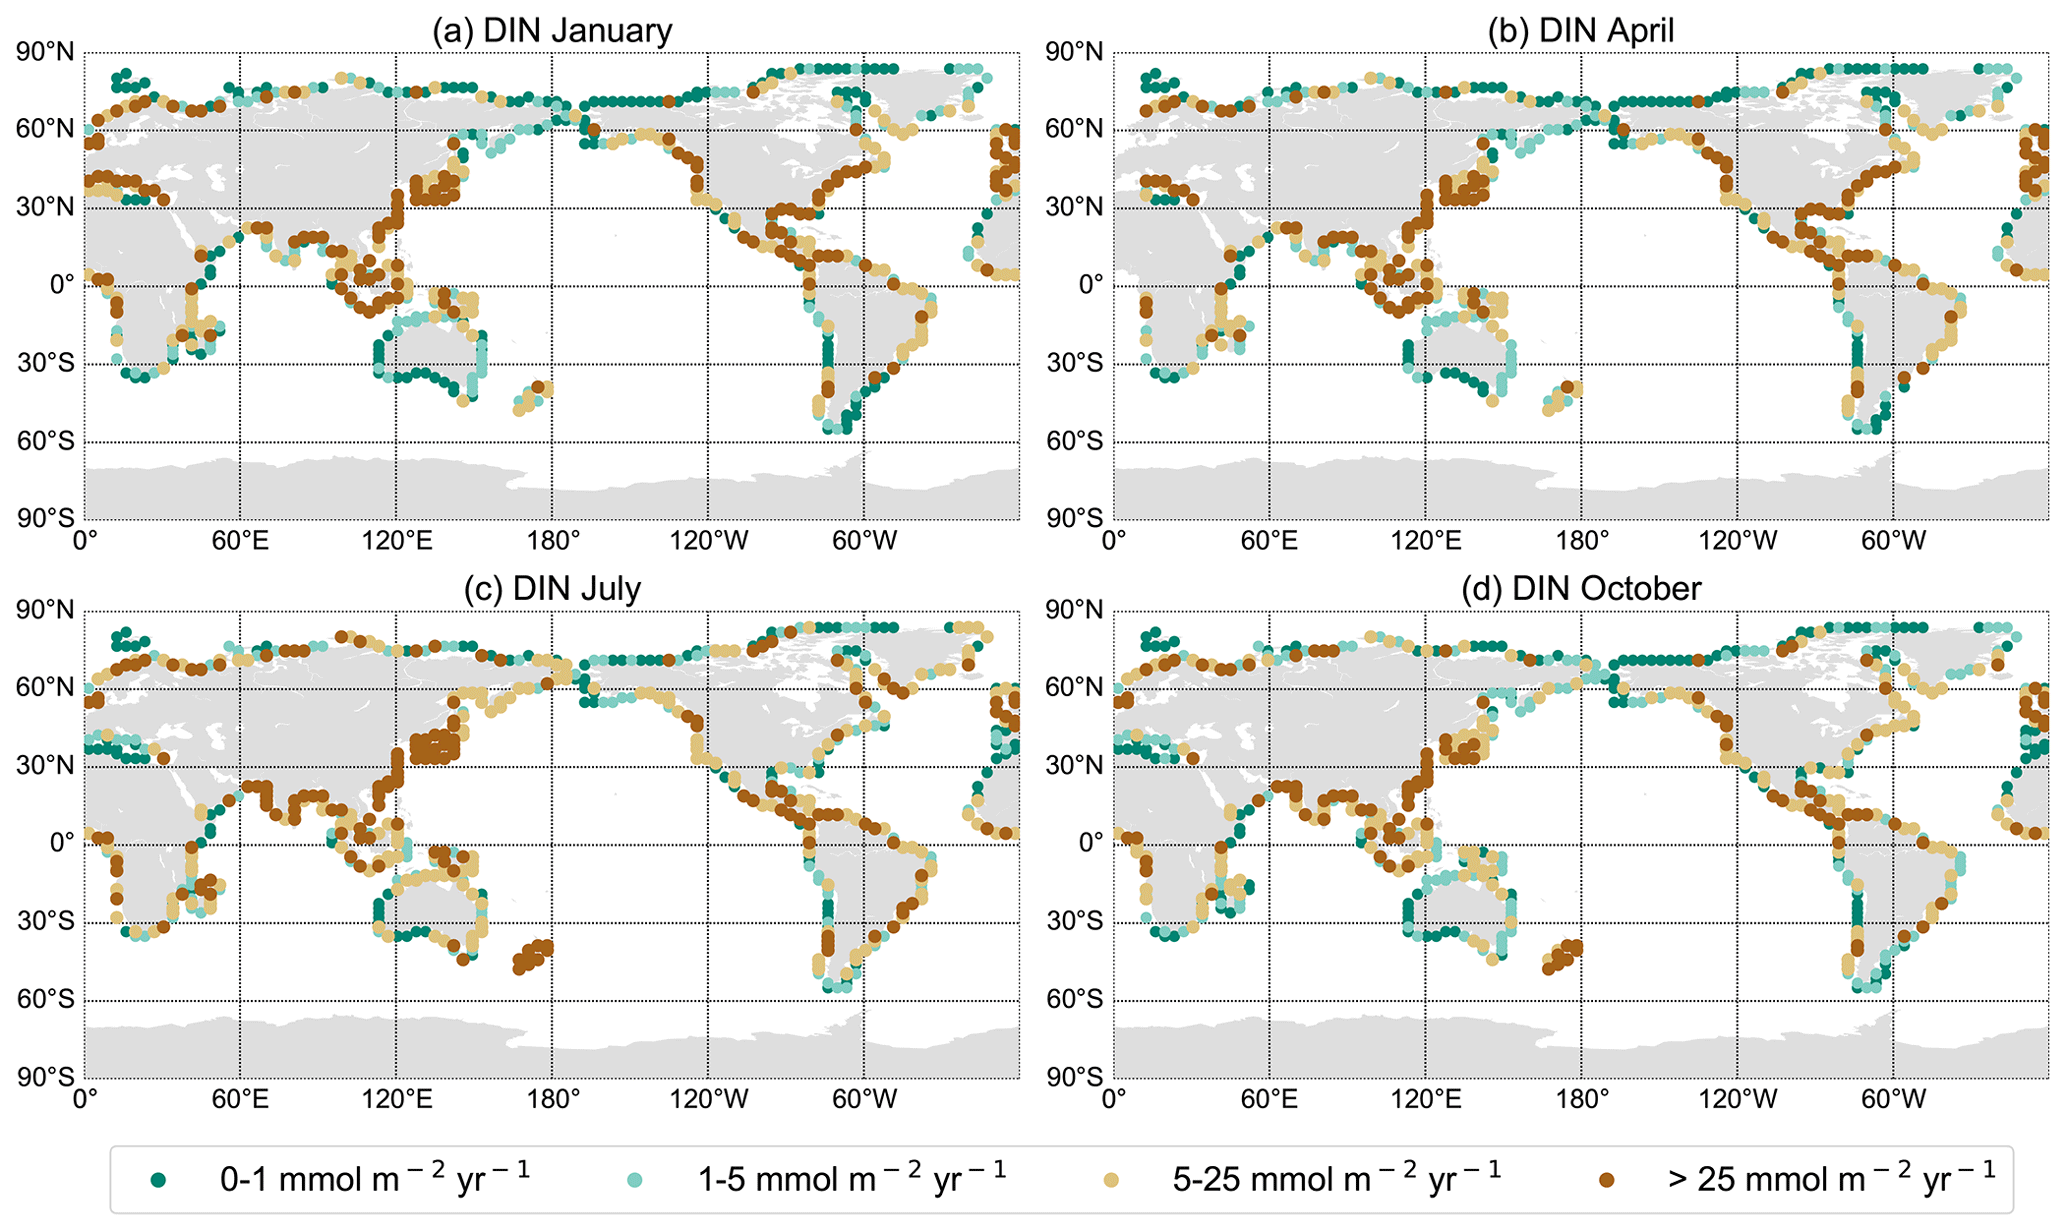
Figure 2DIN export yield for each discharge point in mmol m−2 yr−1 from the NEWS 2 data set interpolated on the UVic grid for January (a), April (b), July (c), and October (d).
2.3 Experimental design
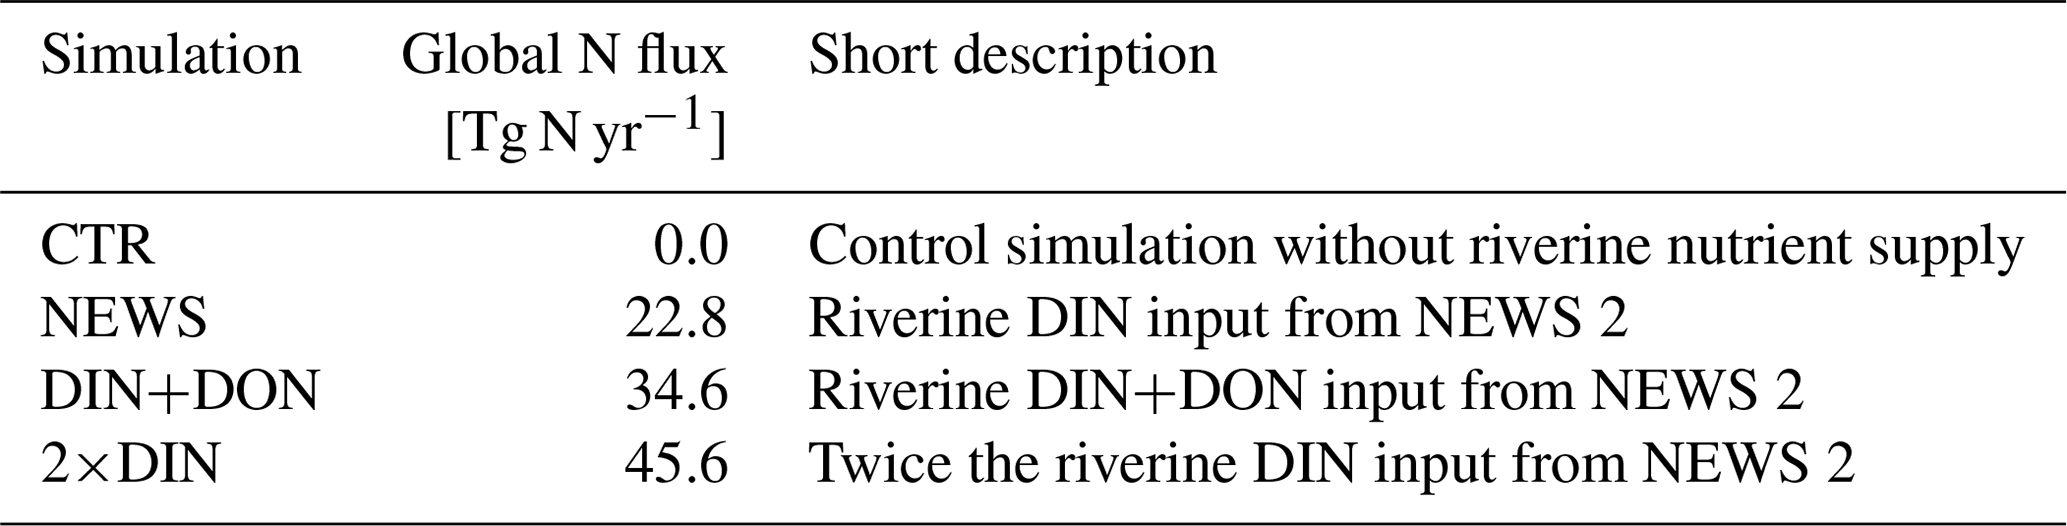
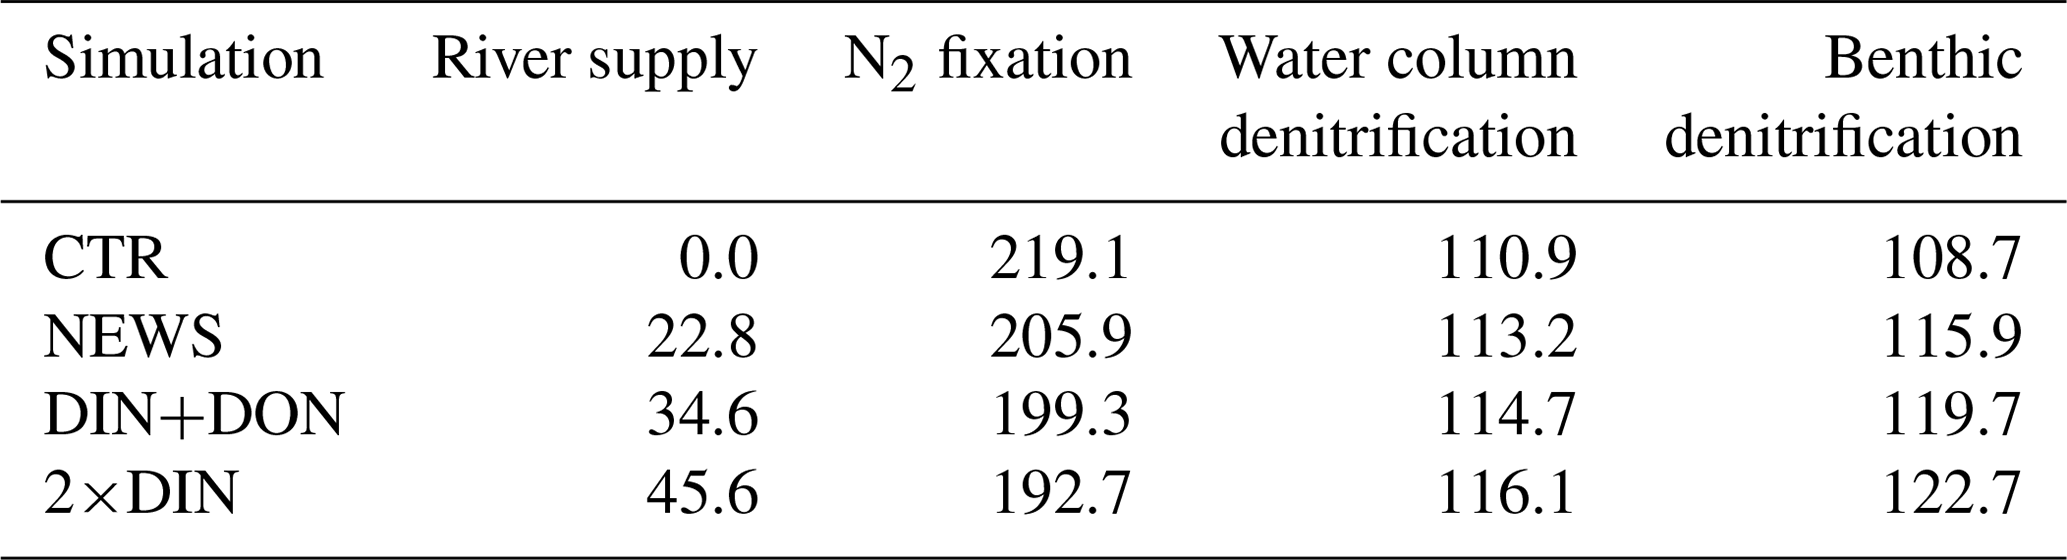
To analyze the effect of riverine nutrient export in the UVic model, three experiments have been performed: NEWS, DIN+DON, and 2×DIN (Table 1). All simulations were run for 10 000 years with benthic denitrification and subgrid bathymetry, starting from an already-spun-up steady state with the standard model version (i.e., with no riverine nutrient input) with pre-industrial conditions for insolation and a fixed atmospheric CO2 concentration of 283 ppm (Keller et al., 2012). In NEWS only DIN from NEWS 2 was added to the discharge points in UVic. Here, we evaluate how the model and especially the nitrogen cycle react to the riverine nutrient input. In DIN+DON we added DIN and DON from NEWS 2. In 2×DIN twice the yield of DIN from NEWS 2 has been added. These simulations with increased N supply are scaling experiments to test the mechanisms and feedbacks described for example by Landolfi et al. (2017) and Somes et al. (2016). For comparison, a control simulation has been run for 10 000 years without riverine DIN supply (referred to as CTR). Globally, NEWS 2 predicts a riverine N supply of 22.8 Tg N yr−1 for DIN and 11.8 Tg N yr−1 for DON. Both enter the biogeochemical model as NO3 fluxes in mol N m−2 s−1, thereby implicitly assuming that all DON is bioavailable or rapidly turned over to DIN. The marine ecosystem dynamics as well as the biogeochemical cycles of the model run have been evaluated in previous studies under the standard boundary conditions, without riverine nutrients (e.g., Somes et al., 2013; Keller et al., 2012; Somes et al., 2010b; Schmittner et al., 2008, 2005). We therefore concentrate on the evaluation of the response of the marine biogeochemical model to the new model component of riverine nutrient discharge. The global ocean biology reacts to the new N-cycle components in the first 3000 to 4000 years of the simulations. After this first phase, the N budget slowly equilibrates towards a steady state (see figure in the Supplement). For the evaluation of the resulting ocean biogeochemistry, we analyze in the following the mean of the last 100 years of each 10 000-year-long simulation.
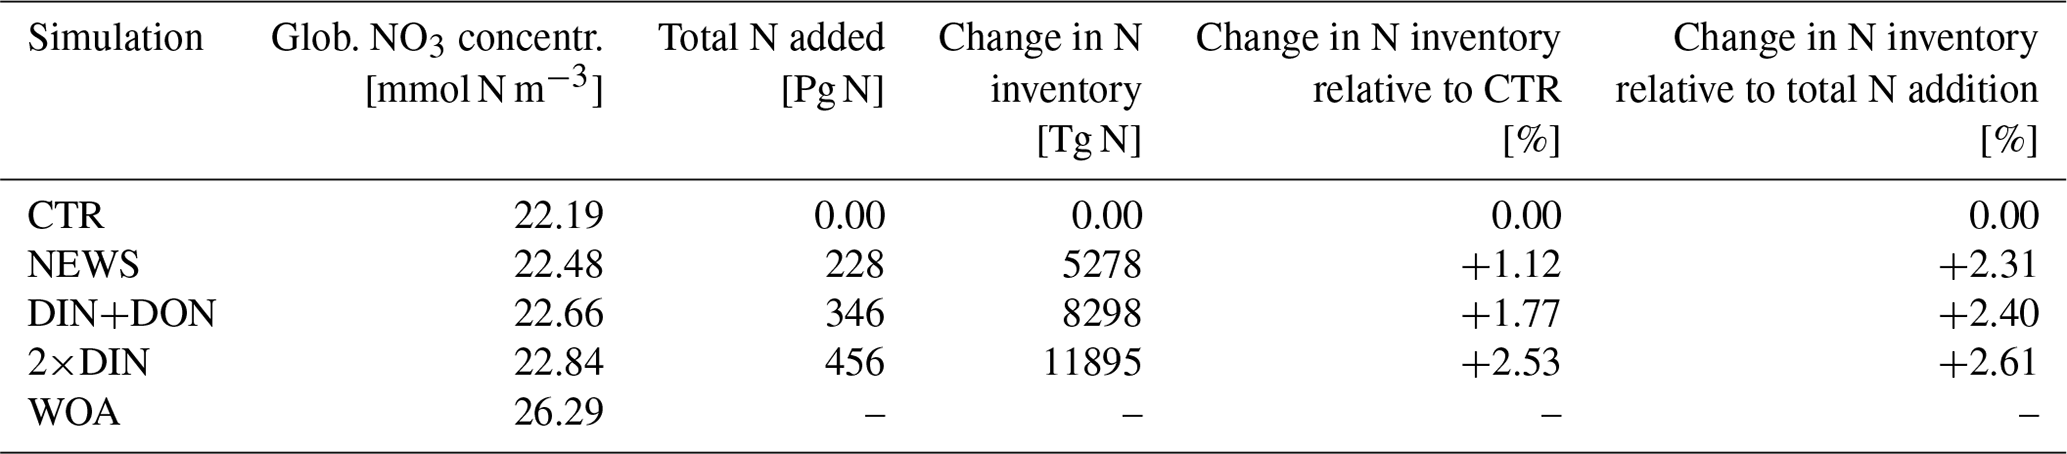
Table 1UVic simulations and global annual nutrient flux from river discharge from Global Nutrient Export from WaterSheds 2 (Mayorga et al., 2010).
3.1 Nitrogen
3.1.1 Global nitrate distribution
In comparison with observational data of the World Ocean Atlas (Garcia et al., 2019), the model simulates the general structure of the profiles fairly well but underestimates the observed NO3 in the water column in each ocean basin by 3 to 4 mmol m−3, especially omitting the midwater maximum at around 1000 m (Fig. 3). Global average NO3 concentrations only vary a little between the simulations (from 22.19 mmol m−3 in CTR to 22.48 mmol m−3 in NEWS and 22.84 mmol m−3 in 2×DIN), and the differences from CTR correspond to +1.1 %, +1.8 %, and +2.5 % of the total observed inventory for NEWS, DIN+DON, and 2×DIN, respectively. Nevertheless, in all three simulations (NEWS, DIN+DON, and 2×DIN), NO3 concentrations are globally higher compared to CTR (Figs. 5, 6). The absolute error between model and observations decreases with higher riverine N supply (top right panel in Fig. 3). At the surface, the global ocean NO3 distribution patterns are very similar between the model and the observations, as well as between the control (CTR) and the NEWS simulation (Fig. 4).
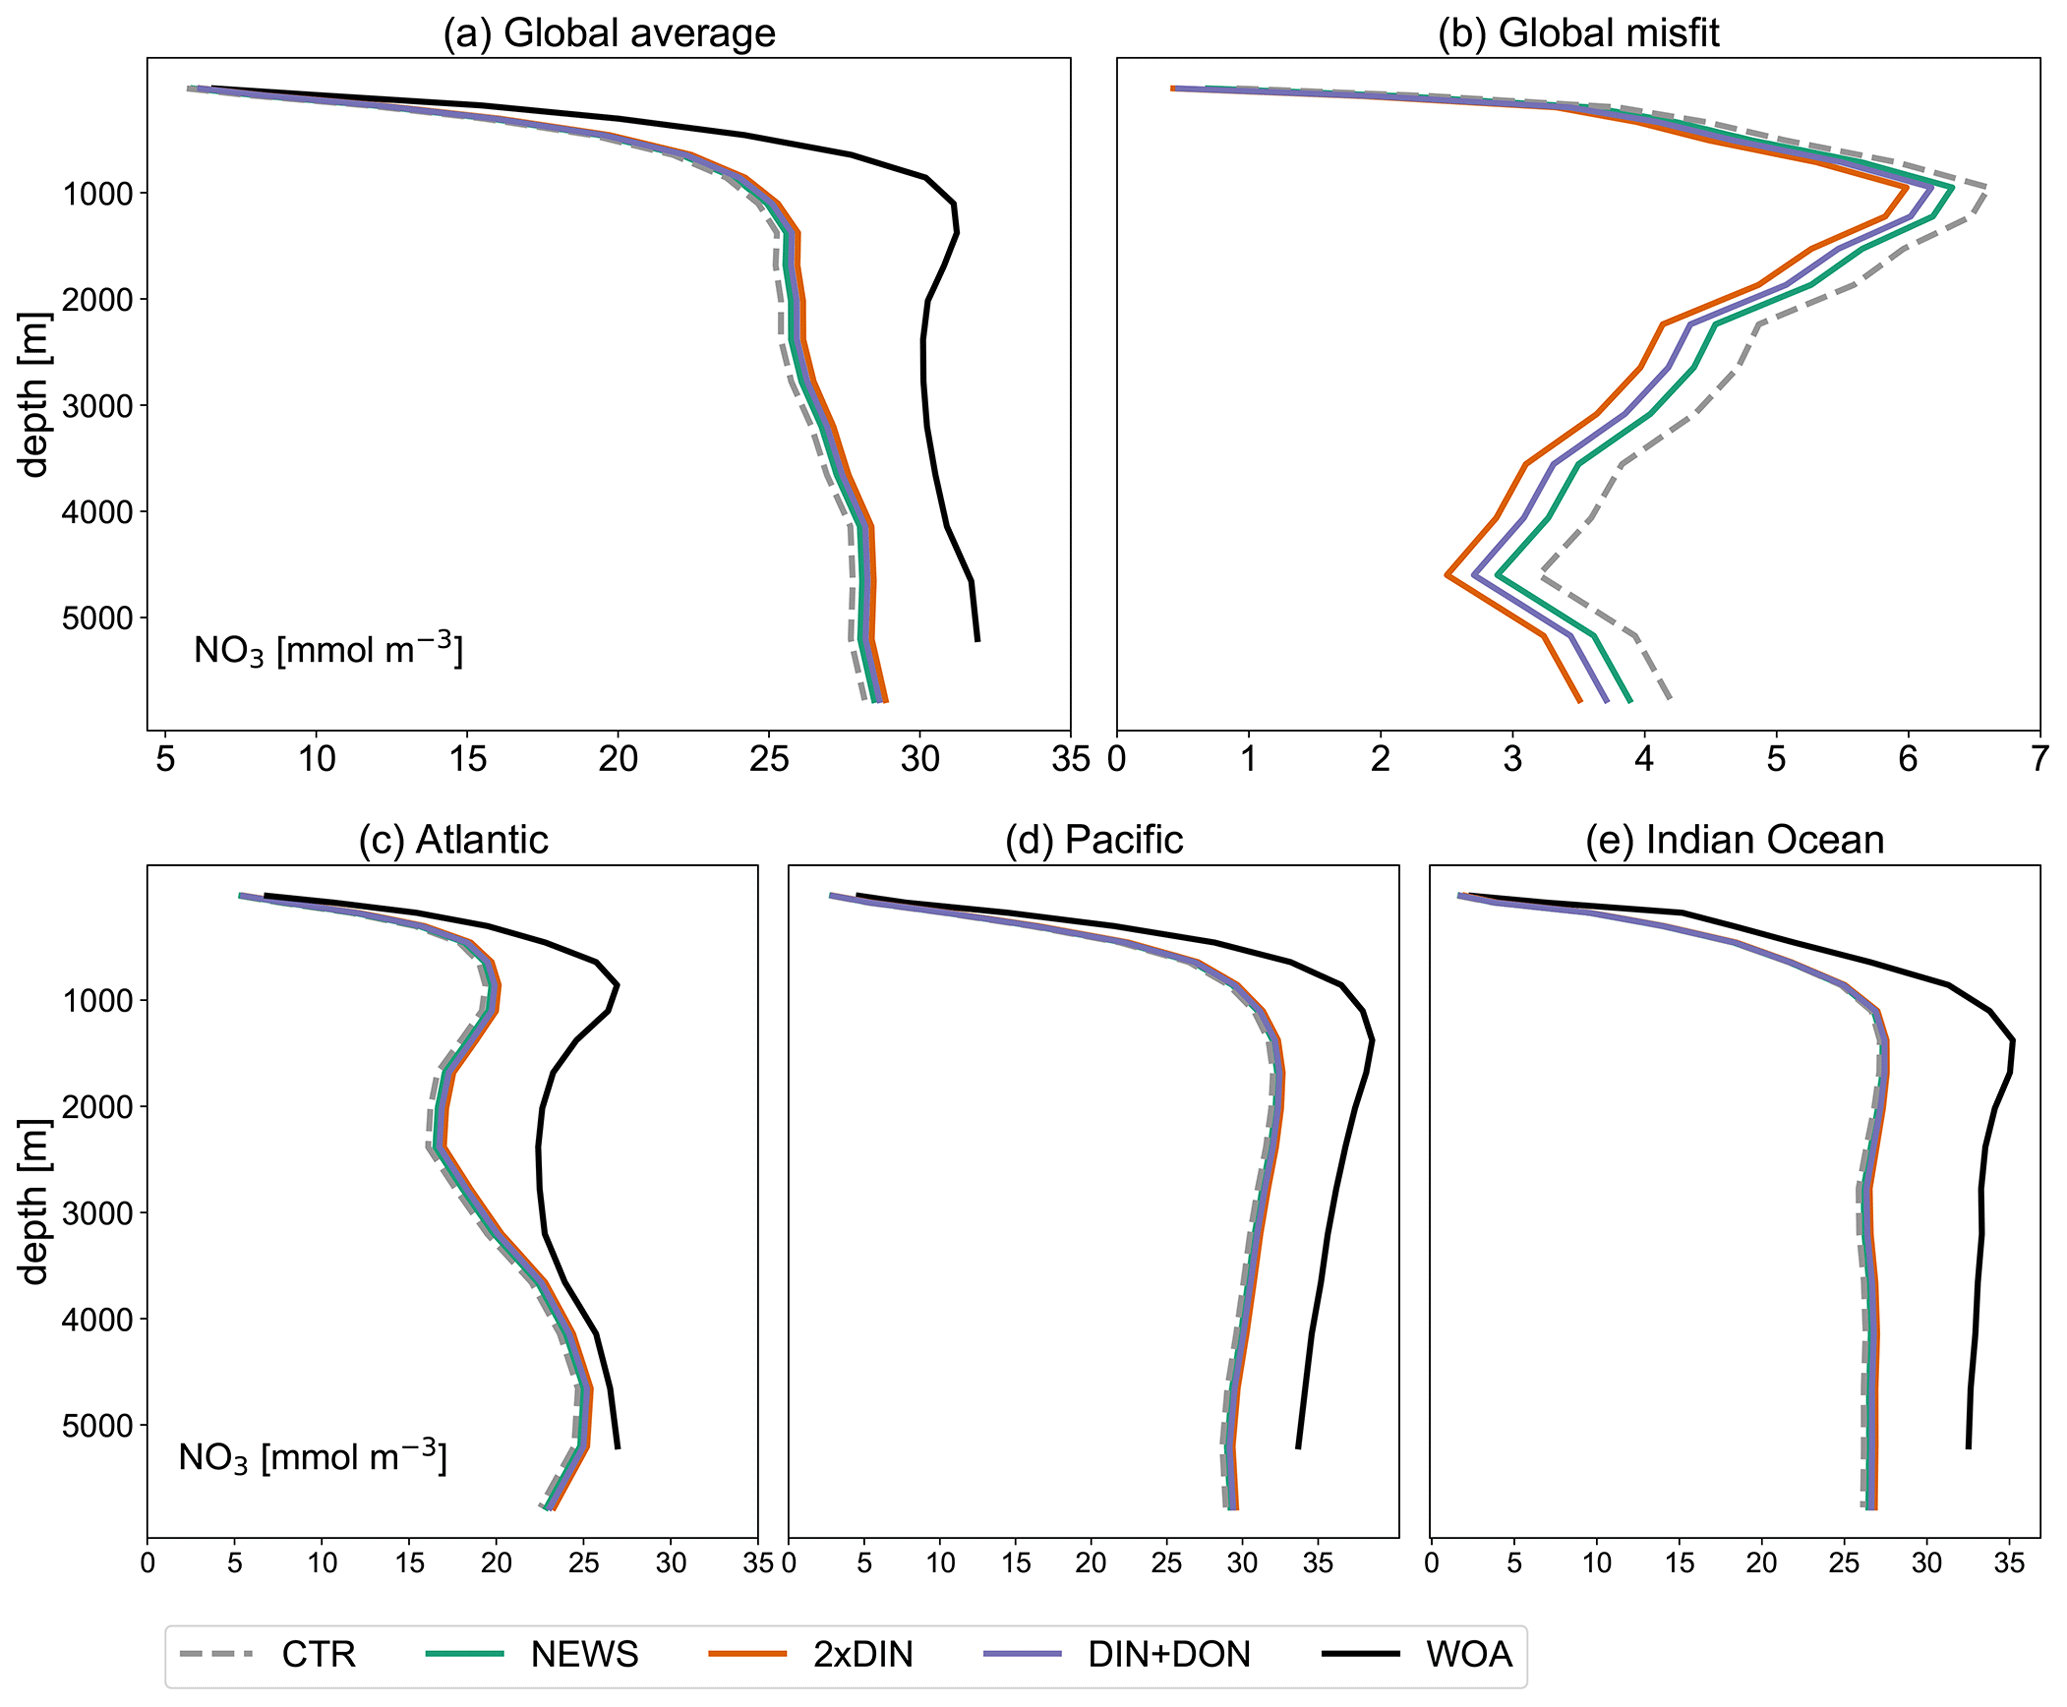
Figure 3Profiles of global averaged NO3 in mmol m−3 from UVic simulations with and without riverine DIN export from NEWS data sets and observations with the WOA. (a) Global ocean average of NO3. (b) Global profiles of misfit in NO3 compared to the observations. (c–e) NO3 profiles for the three main ocean basins: the Atlantic Ocean (ATL), Pacific Ocean (PAC), and Indian Ocean (IND).
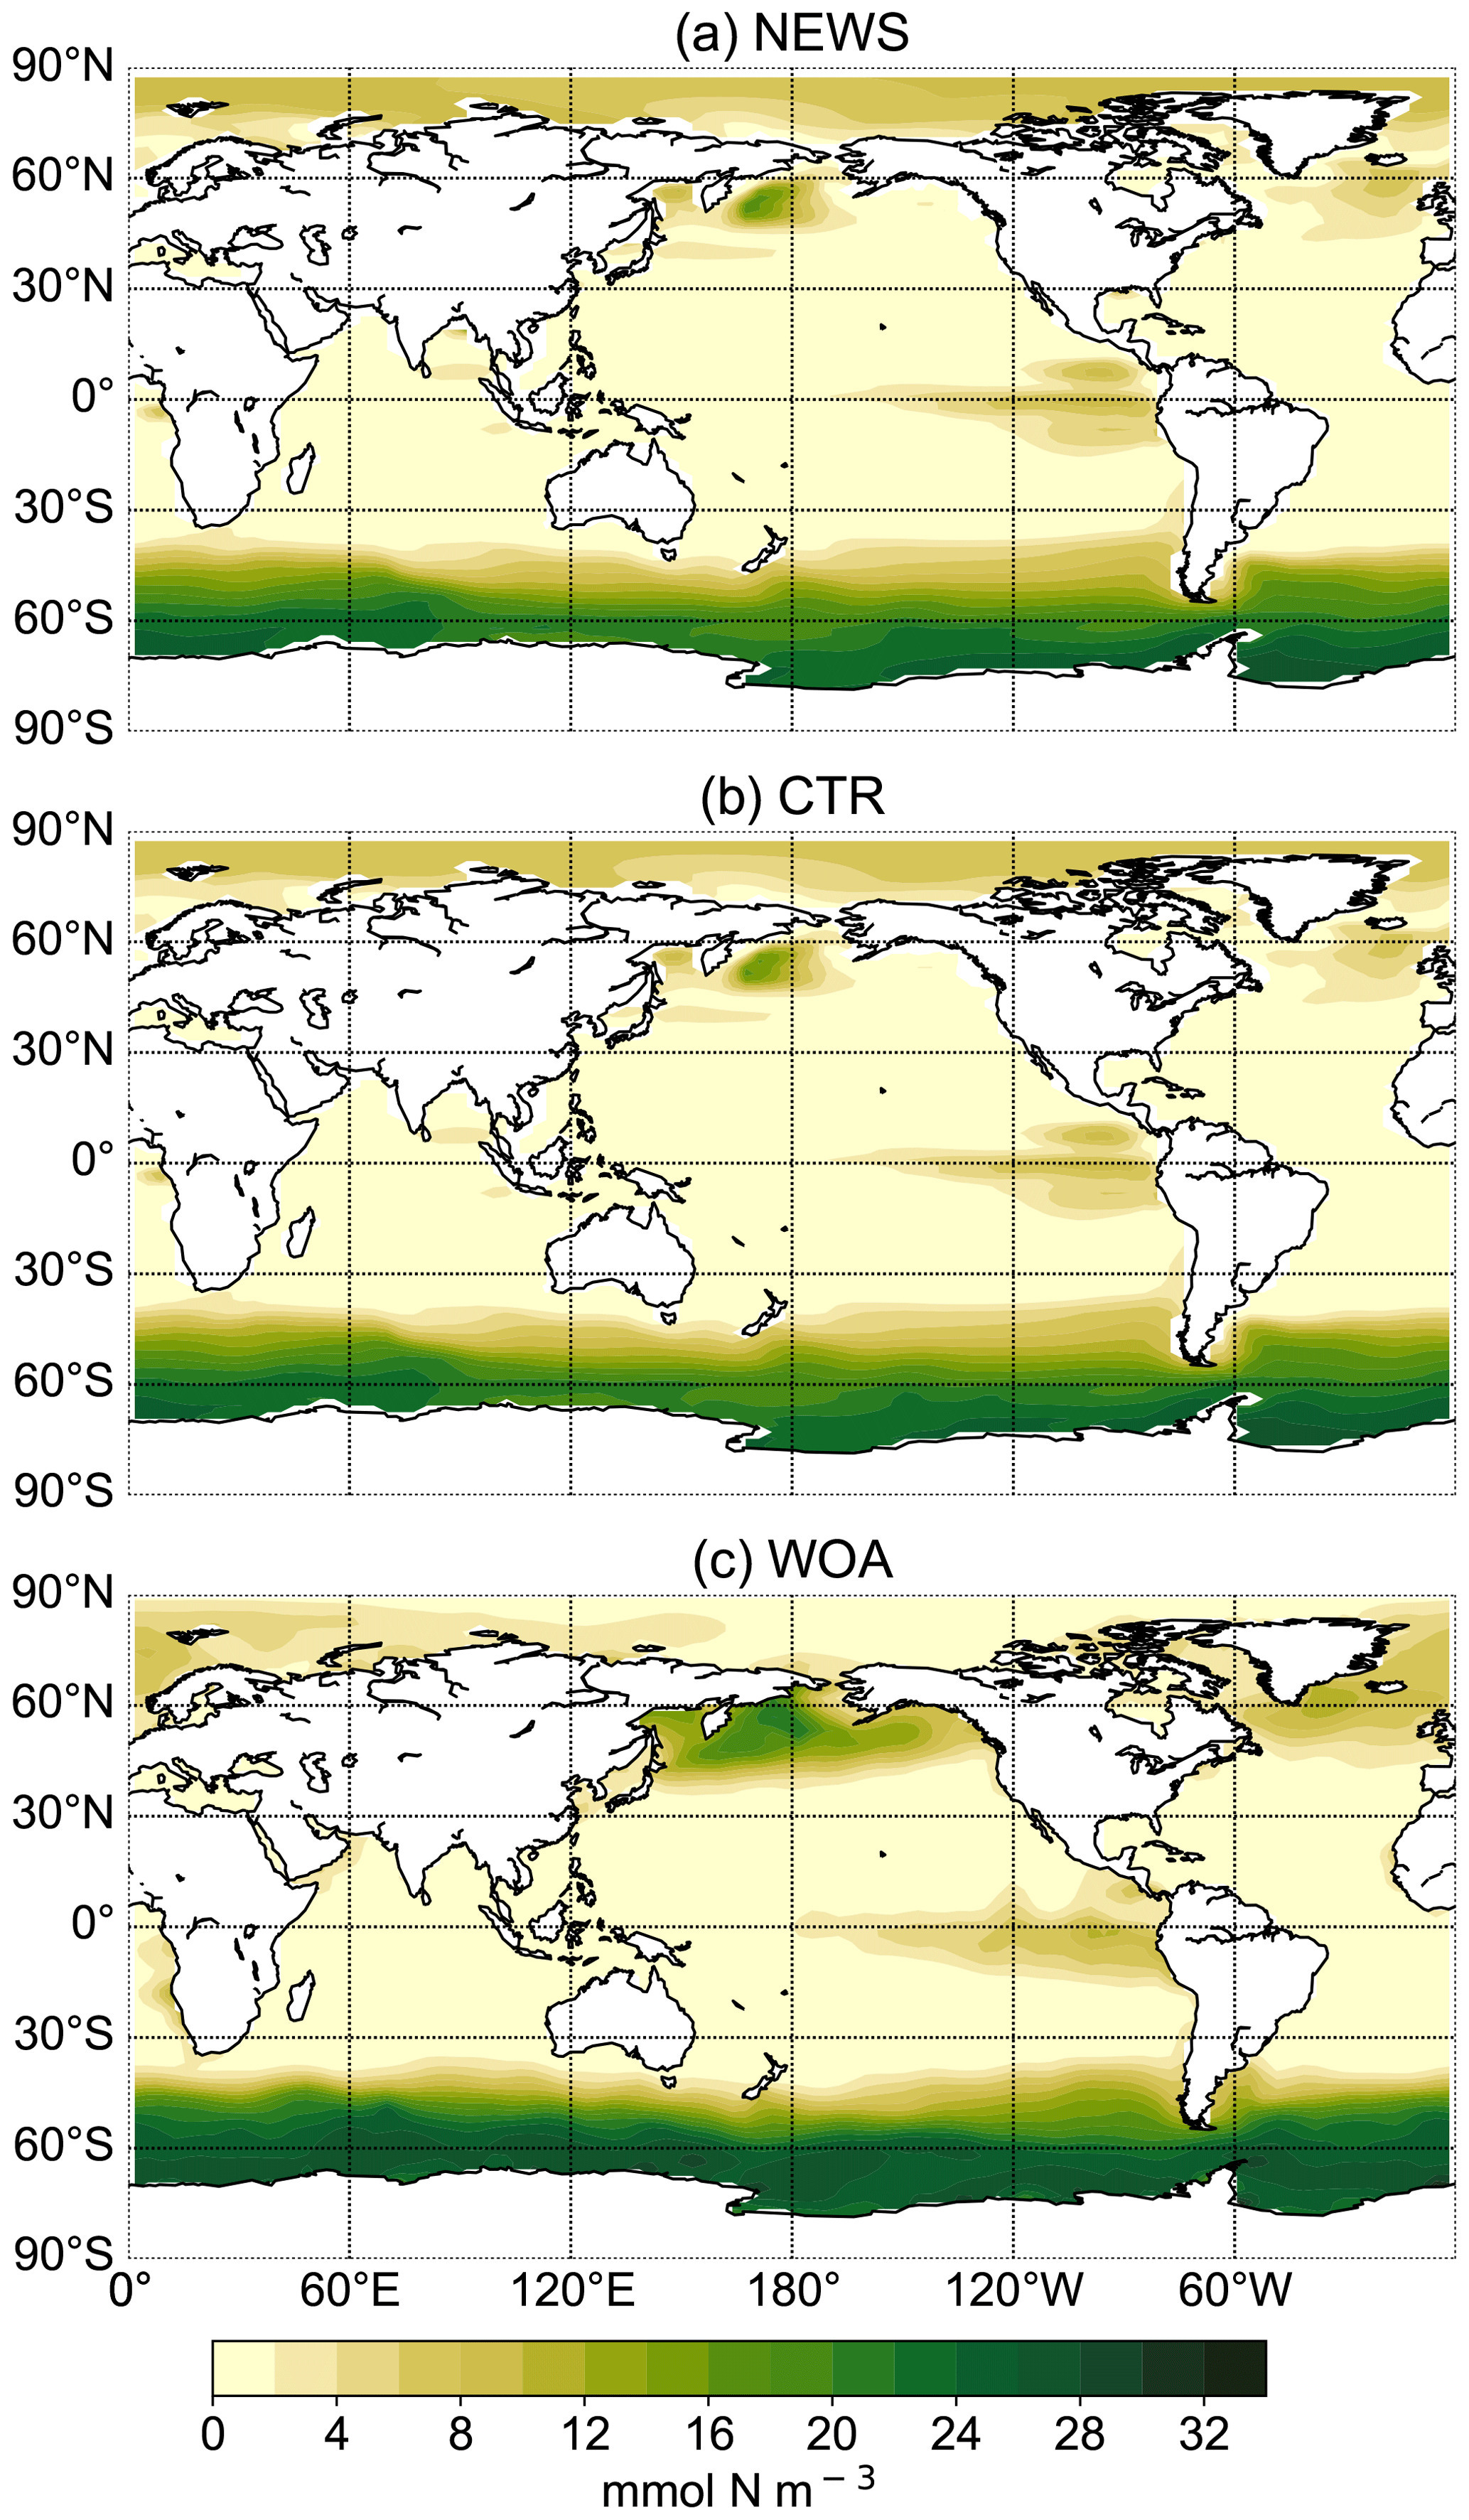
Figure 4Surface NO3 concentrations for simulations UVic NEWS (a) and UVic control (b) and from observations from the World Ocean Atlas (Garcia et al., 2019) (c).
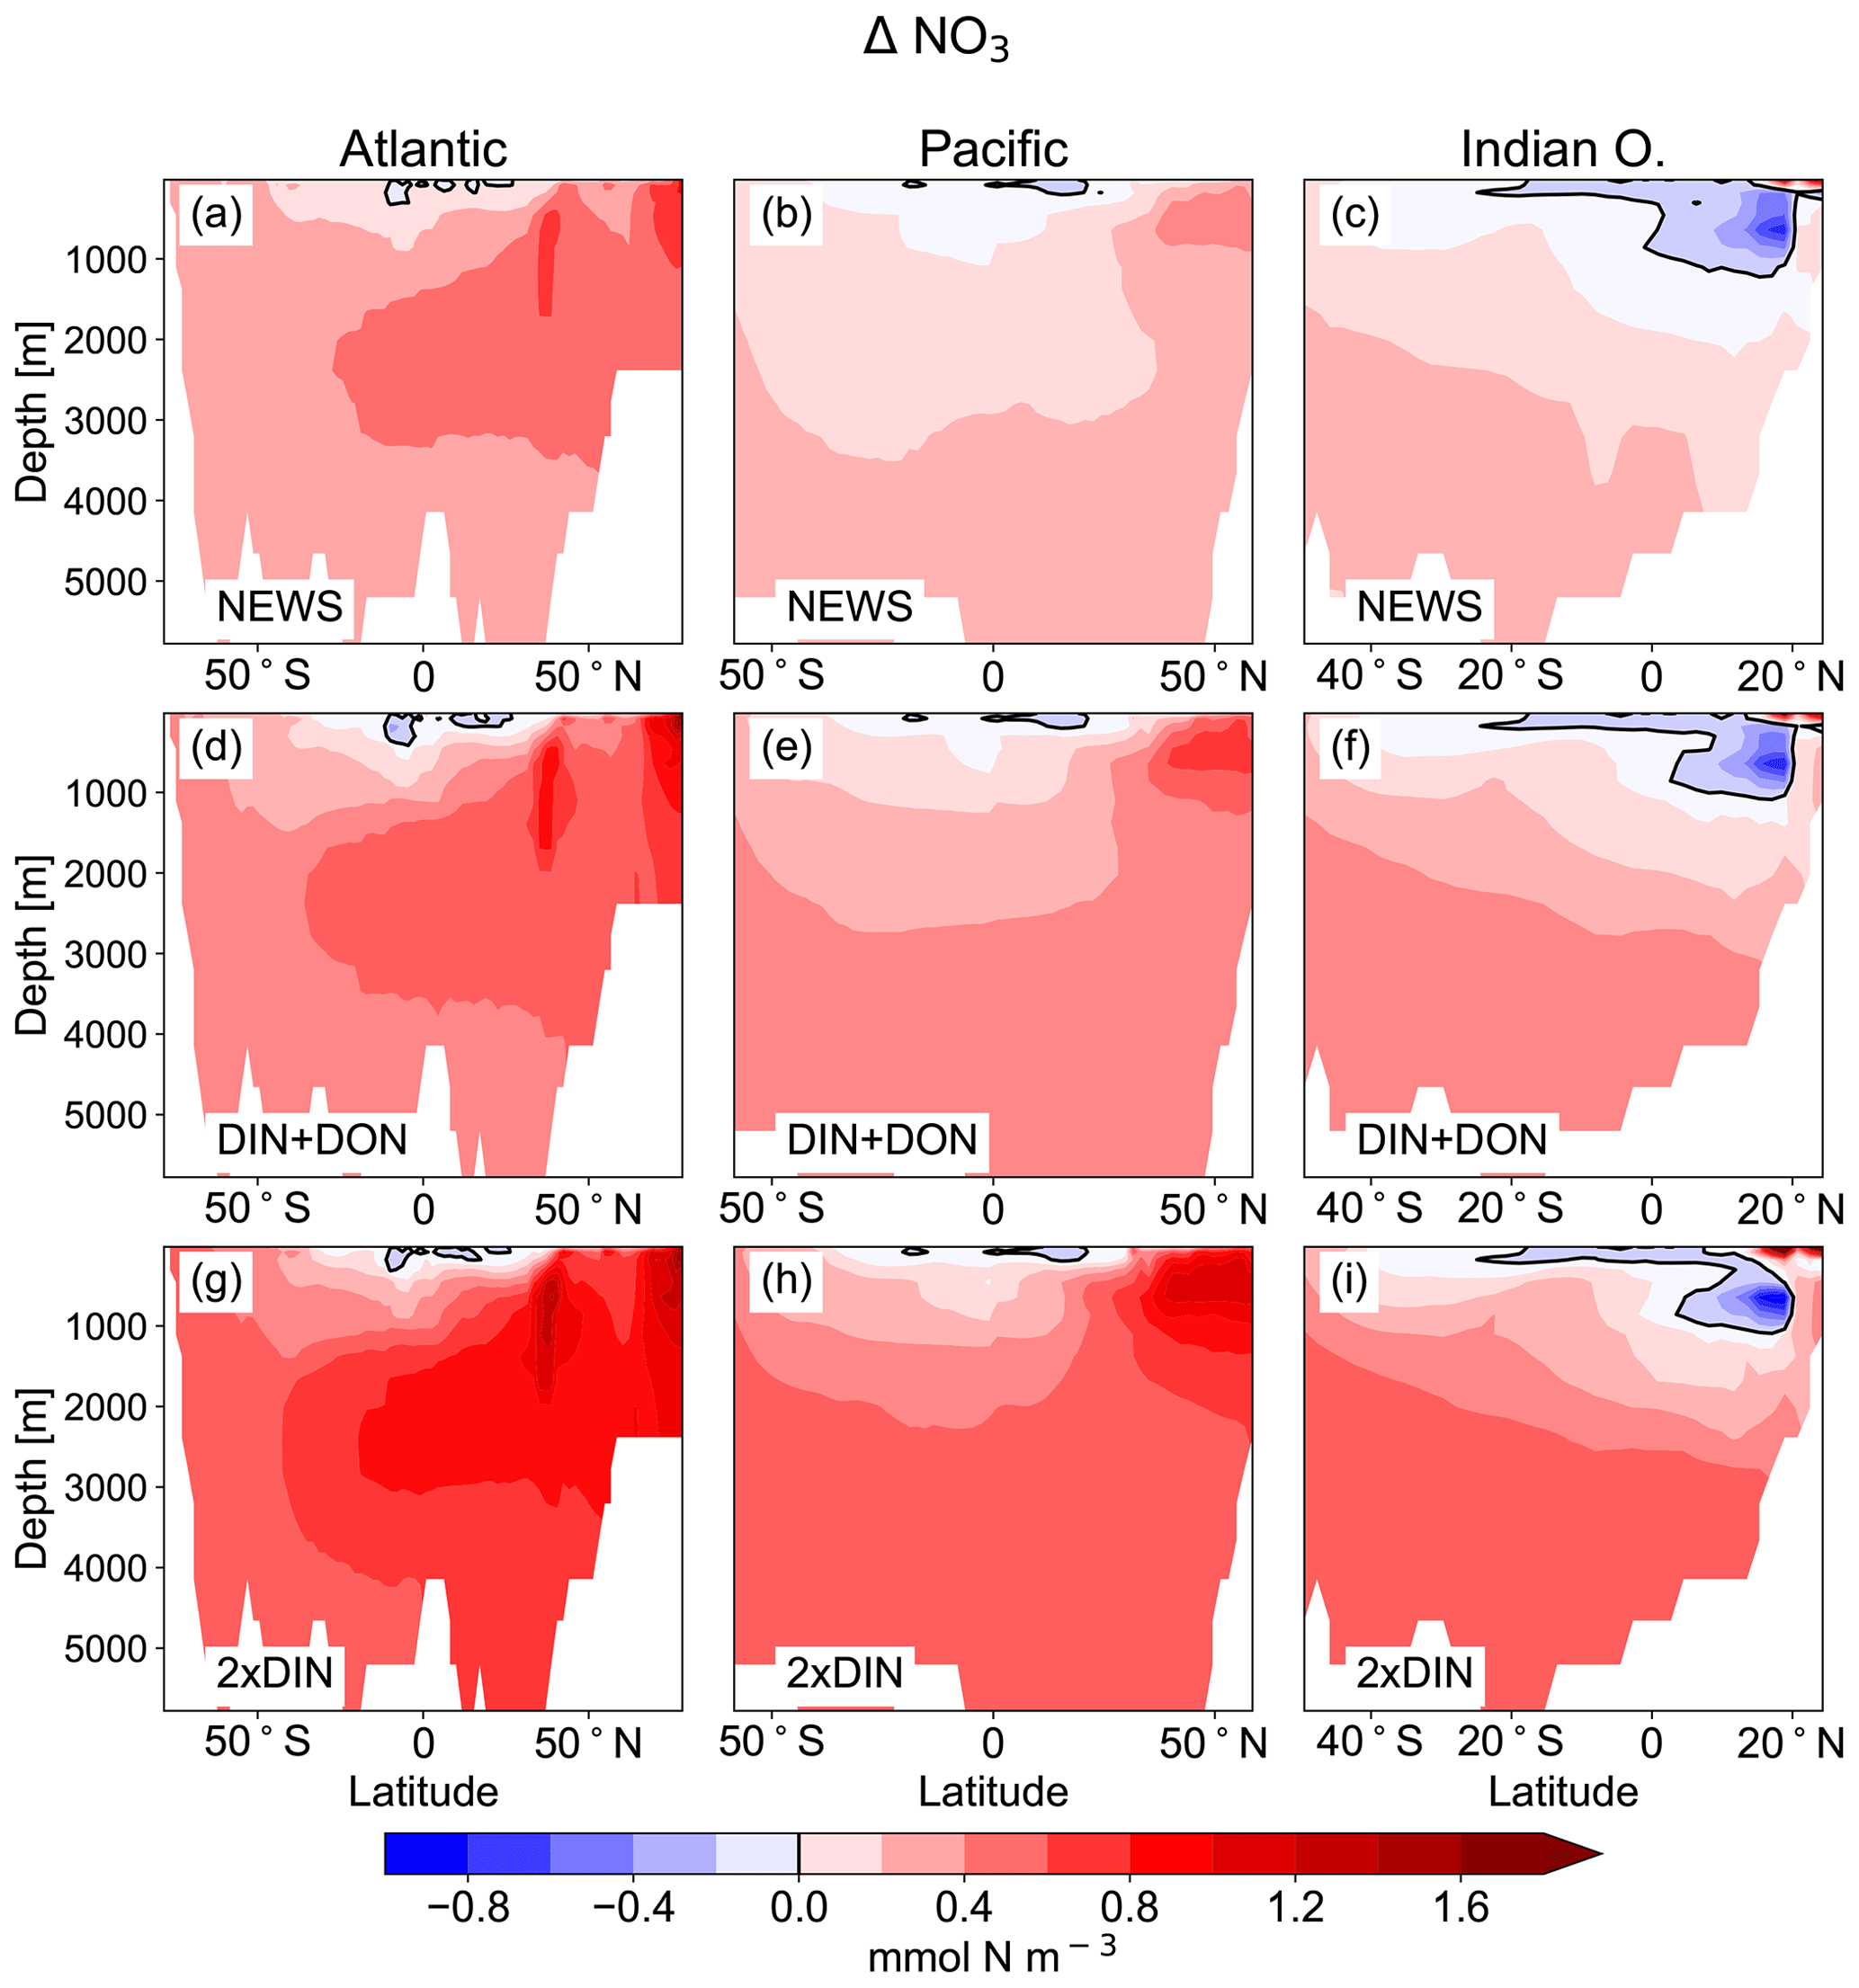
Figure 5Difference in zonal mean ocean concentrations of NO3 between the UVic simulations with riverine DIN export and the control simulation. (a, b, c) Difference between NEWS and CTR; (d, e, f) difference between DIN+DON and CTR; (g, h, i) difference between 2×DIN and CTR. The columns show the zonal mean of the Atlantic Ocean (a, d, g), the Pacific Ocean (b, e, h), and the Indian Ocean (c, f, i) basins. The difference in zonal averaged NO3 concentrations is higher than the color bar maximum at the surface in the northern Indian Ocean basin with a maximum for 2×DIN at 7.2 mmol N m−3. Note that the three ocean basins have different sizes in terms of latitudes but for layout reasons the panels have the same dimensions.
The supply of riverine NO3 affects the ocean nutrient concentration not only locally near the river mouths but also in regions far away from the coasts. Surface NO3 concentrations increase with higher river supply in the coastal regions and in the higher latitudes. The globally highest increase in NO3 can be found in the 2×DIN experiment (see also Table 2), and the NO3 increase is higher in the deeper ocean than at the surface. Interestingly, the increase in the oceanic N inventory is more than twice as high in UVic 2×DIN compared to UVic NEWS, indicating non-linear feedbacks.
While higher NO3 concentrations due to riverine input are not entirely surprising, some regions present lower concentrations compared to CTR. In all simulations NO3 is slightly lower at the surface in large parts of the tropical and subtropical oceans. At 850 m depth, the ocean loses NO3 upon the addition of riverine N in our simulations in low-oxygen regions where denitrification occurs, such as the Benguela Current system, the Bay of Bengal, and the eastern equatorial Pacific near the coast of Central America (Fig. 6).
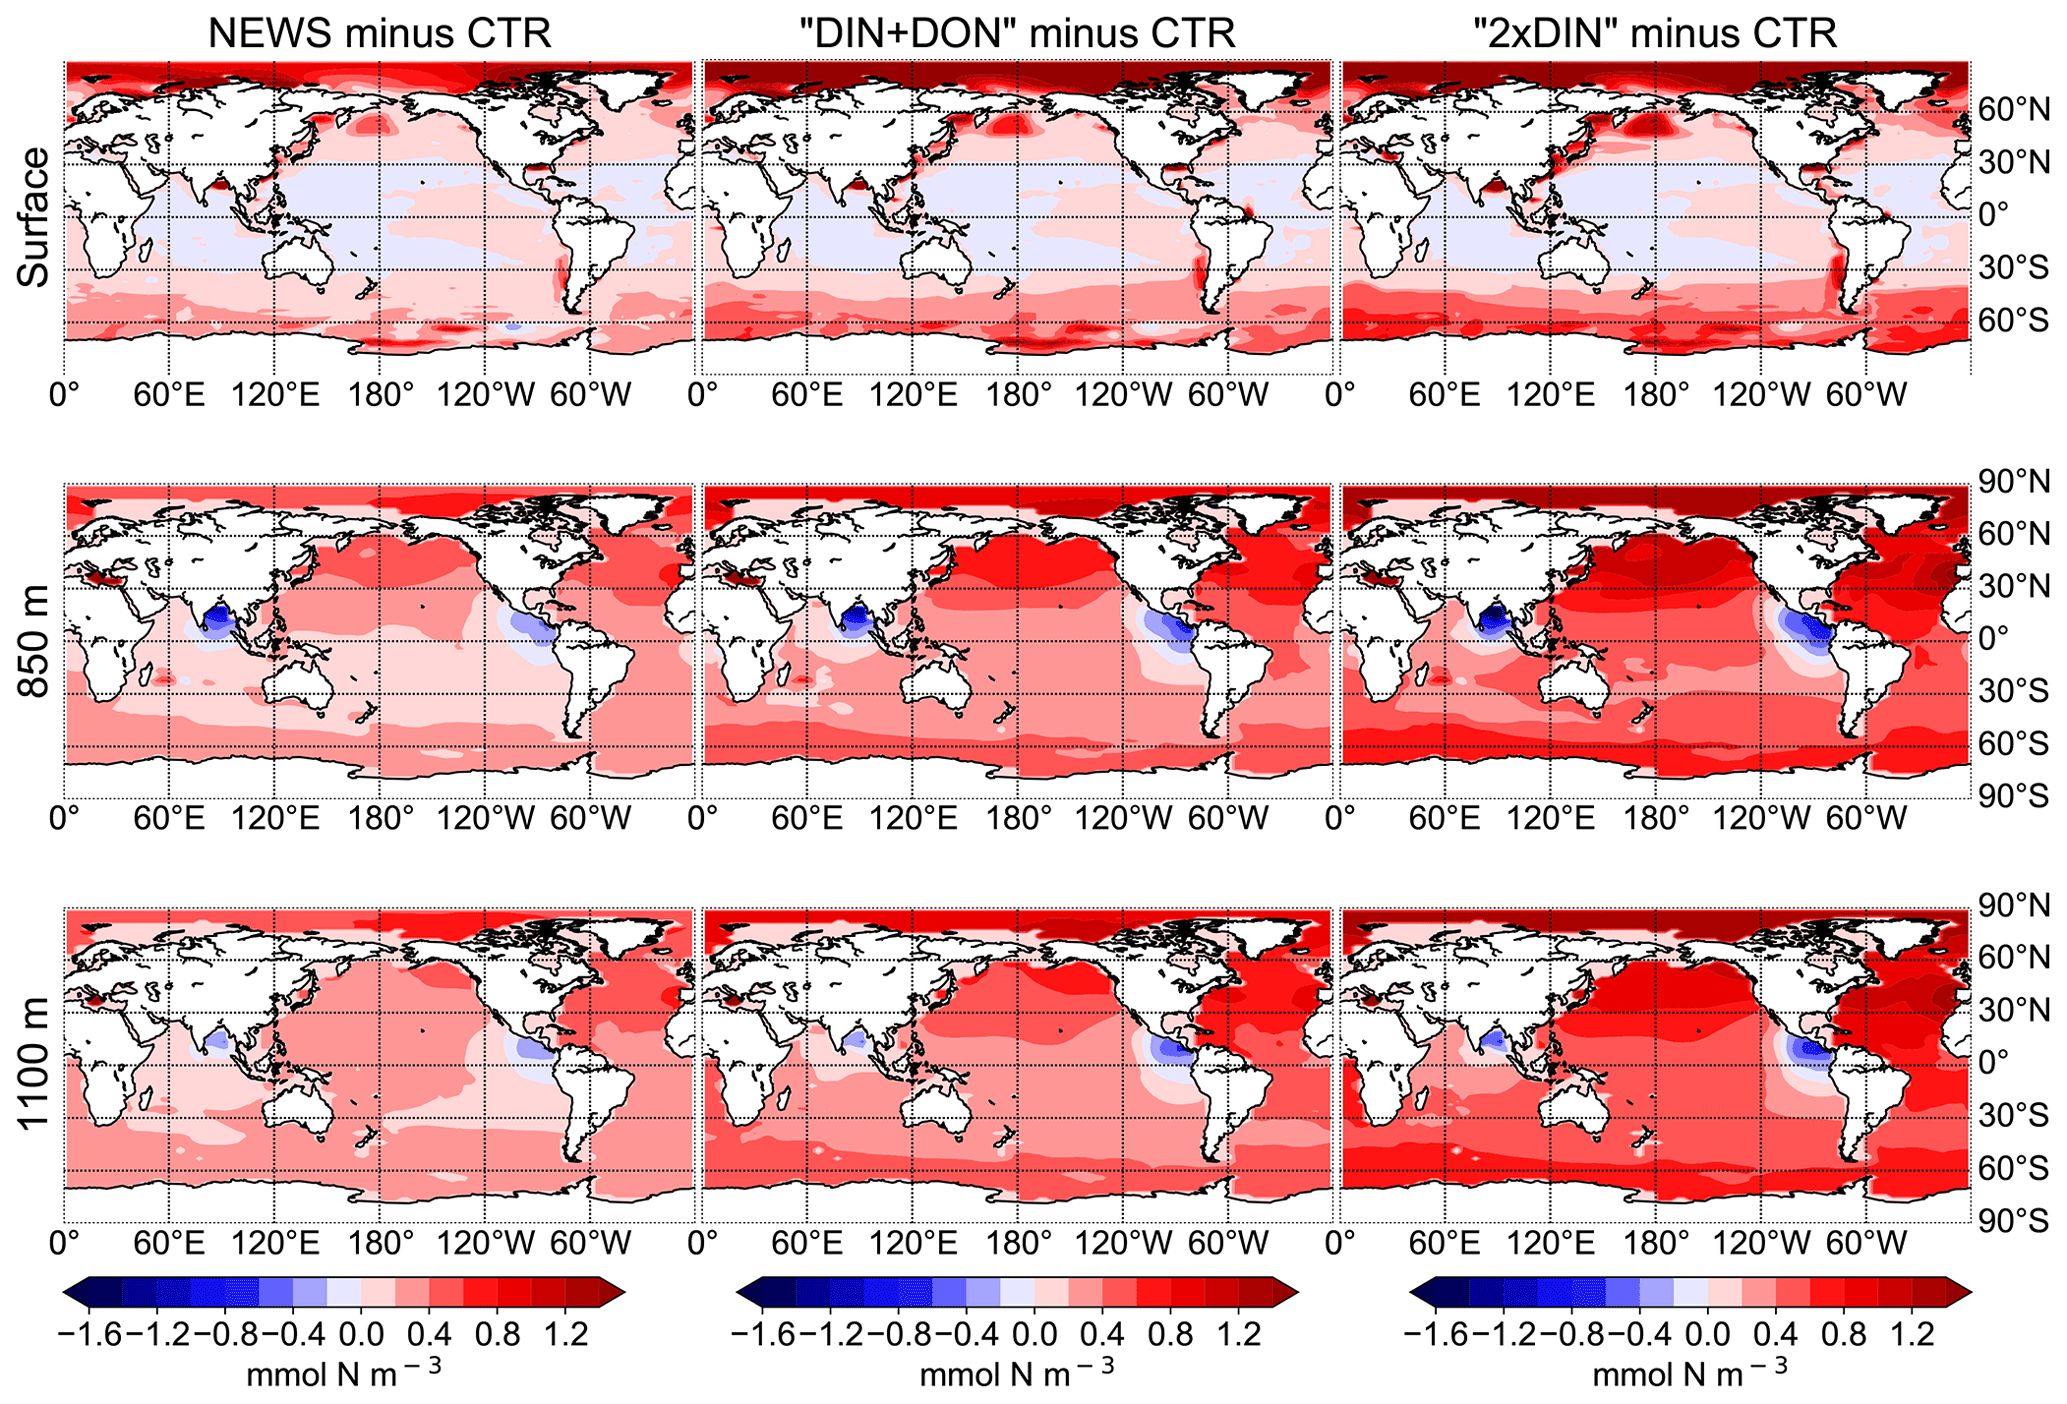
Figure 6Difference in global distribution of NO3 concentrations between experimental simulation and the control simulation in mmol N m−3. The different simulations are NEWS, DIN+DON, and 2×DIN. The differences are shown at three different depths: surface (top), 850 m (middle), and 1100 m (bottom).
Table 2Amount of additional nitrogen in teragrams of N at the end of each simulation compared to CTR.
In major parts of the Atlantic Ocean and Pacific Ocean basins, NO3 concentrations are higher in NEWS than in CTR (Fig. 5). NO3 is particularly elevated in the upper 2000 m in the North Atlantic Ocean (up to 2 mmol N m−3 in 2×DIN, corresponding to +18 %) and upper 1000 m in the North Pacific, but the difference between the simulations is positive across the whole of both basins, indicating that a substantial part of the additional riverine N is exported into the open and deeper ocean. At the surface of the tropical and subtropical oceans, however, NO3 concentrations are lower by a maximum of 0.9 mmol N m−3 in the UVic NEWS experiments compared to CTR (Fig. 6).
The Indian Ocean basin comprises the Arabian Sea and the Bay of Bengal. Zonally averaged NO3 concentrations reflect essentially the behavior of the Bay of Bengal, where the rivers of the Ganges Delta supply high amounts of nutrients to the northern basin (Figs. 5, 7). Here, the model simulates high NO3 concentrations at the surface (in the north, several hundred percent higher in NEWS when compared to CTR). But in the deeper northern Indian Ocean basin down to approximately 2000 m, NO3 concentrations are significantly lower in NEWS than in CTR. Considering the zonal average of the Indian Ocean, NO3 concentrations are lower by 0.7 to 0.9 mmol N m−3 and even more if only the zonal average of the Bay of Bengal is considered.
Part of the global NO3 patterns can be explained by the interaction of ocean circulation and biology. N is transported into the interior ocean via circulation and also accumulates due to the biological pump. But these processes do not explain the loss in N in the subtropical surface oceans or the Bay of Bengal. The same applies to the total amounts of N. Despite the continuous supply from the rivers, the additional NO3 in NEWS, DIN+DON, and 2×DIN compared to CTR amounts to an increase of only 1.1 %, 1.8 %, and 2.5 %, respectively (Table 2). What limits the increase in the global oceanic N inventory is the combination of the N-cycle processes denitrification and N2 fixation.
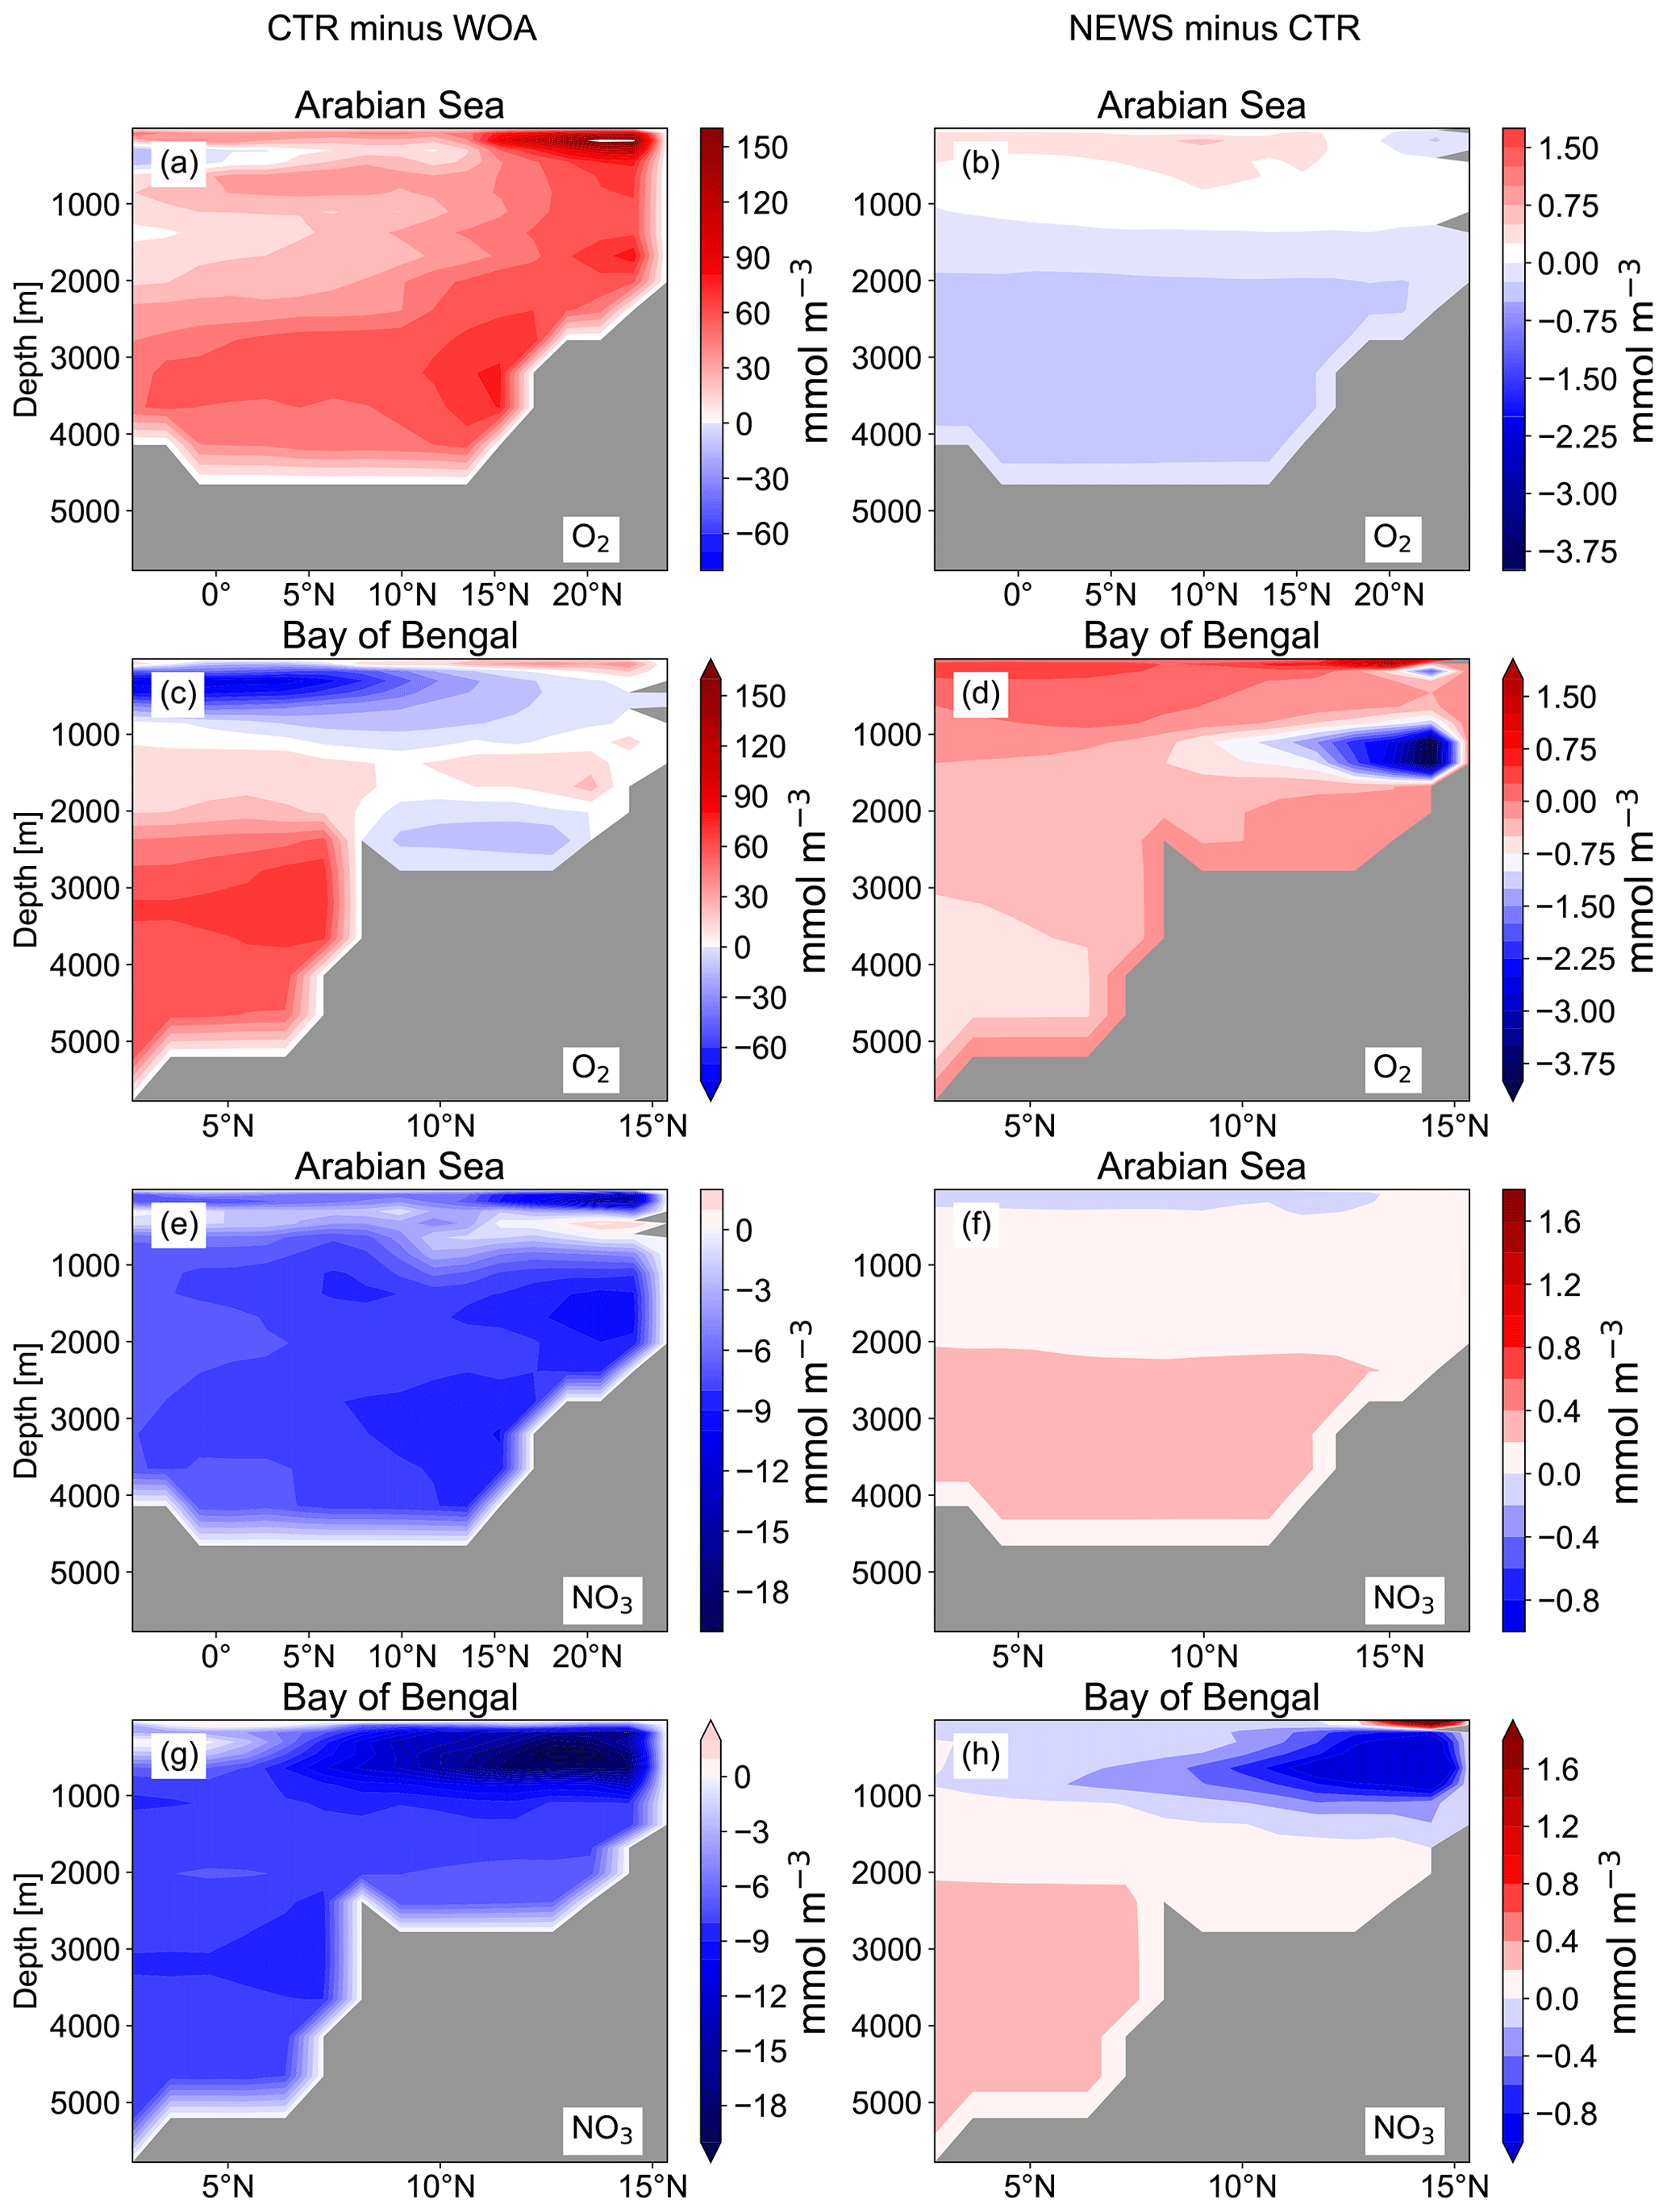
Figure 7Difference in zonal average of NO3 and O2 in the basins of the Arabian Sea (a, b, e, f) and the Bay of Bengal (c, d, g, h). The panels in the left column show the difference between CTR and the World Ocean Atlas (WOA), and in the right column the difference between NEWS and CTR is shown. All results are shown in mmol m−3.
3.1.2 Denitrification and nitrogen fixation
Denitrification is known to be the main sink for fixed N in the ocean (Gruber, 2004; Codispoti et al., 2001). It occurs both in marine sediments and in the water columns under suboxic conditions, for example in the simulated Bay of Bengal. As a result of these dynamics, if N is added via river discharge, UVic simulates globally higher water column and benthic denitrification rates (Table 3). Note that in these simulations global benthic denitrification and global water column denitrification amount to similar magnitudes, indicating the importance of both in the global N cycle (Somes et al., 2016, 2013). For both processes estimates vary considerably: for water column denitrification estimates are between 50 and 150 Tg N yr−1; for benthic denitrification they are between 100 and 300 Tg N yr−1 (Galloway et al., 2004; Gruber, 2004; Bohlen et al., 2012; Somes et al., 2013). In all our simulations, denitrification rates stay in the range assumed for a balanced fixed-N budget in the pre-industrial ocean (e.g., Somes et al., 2013). However, benthic denitrification is more evenly distributed than water column denitrification. In order to study regional effects it is helpful to include both processes. Nevertheless, models can have a balanced nitrogen budget without including benthic denitrification.
While the global pattern of denitrification is very similar in the simulations with additional riverine N compared to CTR, in proximity to river discharge points, total denitrification rates are higher by up to 1 mol N m−2 yr−1 (Fig. 9). Somewhat off the coasts however, total denitrification appears lower in the simulations with riverine nutrient supply (by up to 50 mmol N m−2 yr−1). At the same time, total global N2 fixation rates decrease in all three simulations compared to CTR (Table 3). Nitrogen fixation is a significant process in the marine nitrogen cycle and a major source of nitrogen in the open ocean. Nitrogen-fixing organisms are able to convert dissolved nitrogen gas (N2) into ammonia but are limited in their growth by phosphate and iron (Deutsch et al., 2007; Moore and Doney, 2007; Karl et al., 1997; Redfield et al., 1963), and phosphate is not altered by the additional N from river supply. The global rate and geographical distribution of nitrogen fixation are still uncertain. Observations remain sparse and highly variable in space and time. Combined with insufficient understanding of the controls of marine N2 fixation, this results in high uncertainties in the global pattern of marine nitrogen fixation (Wang et al., 2019; Landolfi et al., 2018; Somes et al., 2013). Deutsch et al. (2007) and Luo et al. (2012) estimated a global nitrogen fixation rate of 140 Tg N yr−1, and most recent studies stay in this range, although some studies suggest that the global rates could be much higher (Wang et al., 2019; Landolfi et al., 2018; Somes et al., 2013; Karl et al., 2002).
The global rates calculated from our experiments with UVic (Table 3) are also higher than the estimates from Deutsch et al. (2007) and Luo et al. (2012). Although previous studies with UVic have given rates of N2 fixation between 128 and 150 Tg N yr−1 (Landolfi et al., 2017; Keller et al., 2012), the CTR simulation in our configuration estimates global N2 fixation rates of 219 Tg N yr−1. In our case, this is due to the additional integration of benthic denitrification, which has not always been considered in previous UVic studies. The additional N sink in the form of benthic denitrification promotes conditions that favor N fixers, i.e., diazotrophs, leading to higher nitrogen fixation rates.
In the UVic CTR simulation, N2 fixation is mostly confined to the tropical and subtropical oceans and is especially concentrated in the northern Indian Ocean, the eastern Pacific Ocean, and the eastern Atlantic Ocean (Fig. 8a). This is comparable to the distribution in Keller et al. (2012) and Somes et al. (2010a), both using UVic in different configurations. The patterns of N2 fixation are therefore consistent with observations, as far as they are known, with the same limitations as for Keller et al. (2012) and Somes et al. (2010a). For example, in the subtropical North Atlantic, where some of the highest rates of N2 fixation have been measured (Capone et al., 2005), UVic simulates almost no N2 fixation at all. The simulation NEWS, DIN+DON, and 2×DIN show that adding riverine N leads to a net decrease in N2 fixation in nearly the whole area where it occurs but especially near the river mouths (Fig. 8b–d). The main regions where N2 fixation is significantly decreasing are the Gulf of Guinea, the Bay of Bengal, and near the Amazon River mouth.
In a previous study with UVic, Somes et al. (2016) have shown that increasing atmospheric N deposition could lead to a reduction in N2 fixation, due to non-nitrogen-fixing phytoplankton being more competitive than N fixers when key nutrients like iron and phosphate are limiting. Here, it is the input of riverine nitrogen that stimulates the reduction in N2 fixation locally, where N reaches the ocean. Reductions in N2 fixation can then partly explain the lower NO3 concentrations at the surface of the tropical and subtropical oceans in NEWS, even though these areas are far from riverine N input (see Sect. 3.1.1 and Fig. 6, first row). Note that these results show the distribution at a steady state after 10 000 years of riverine nitrogen supply. Not all fixed nitrogen is consumed by biological activity, but part of the additional N is also transported with ocean circulation and can “replace” N from nitrogen fixation in regions far off the coast, leading to decreasing N2 fixation at the surface of the tropical and subtropical oceans.
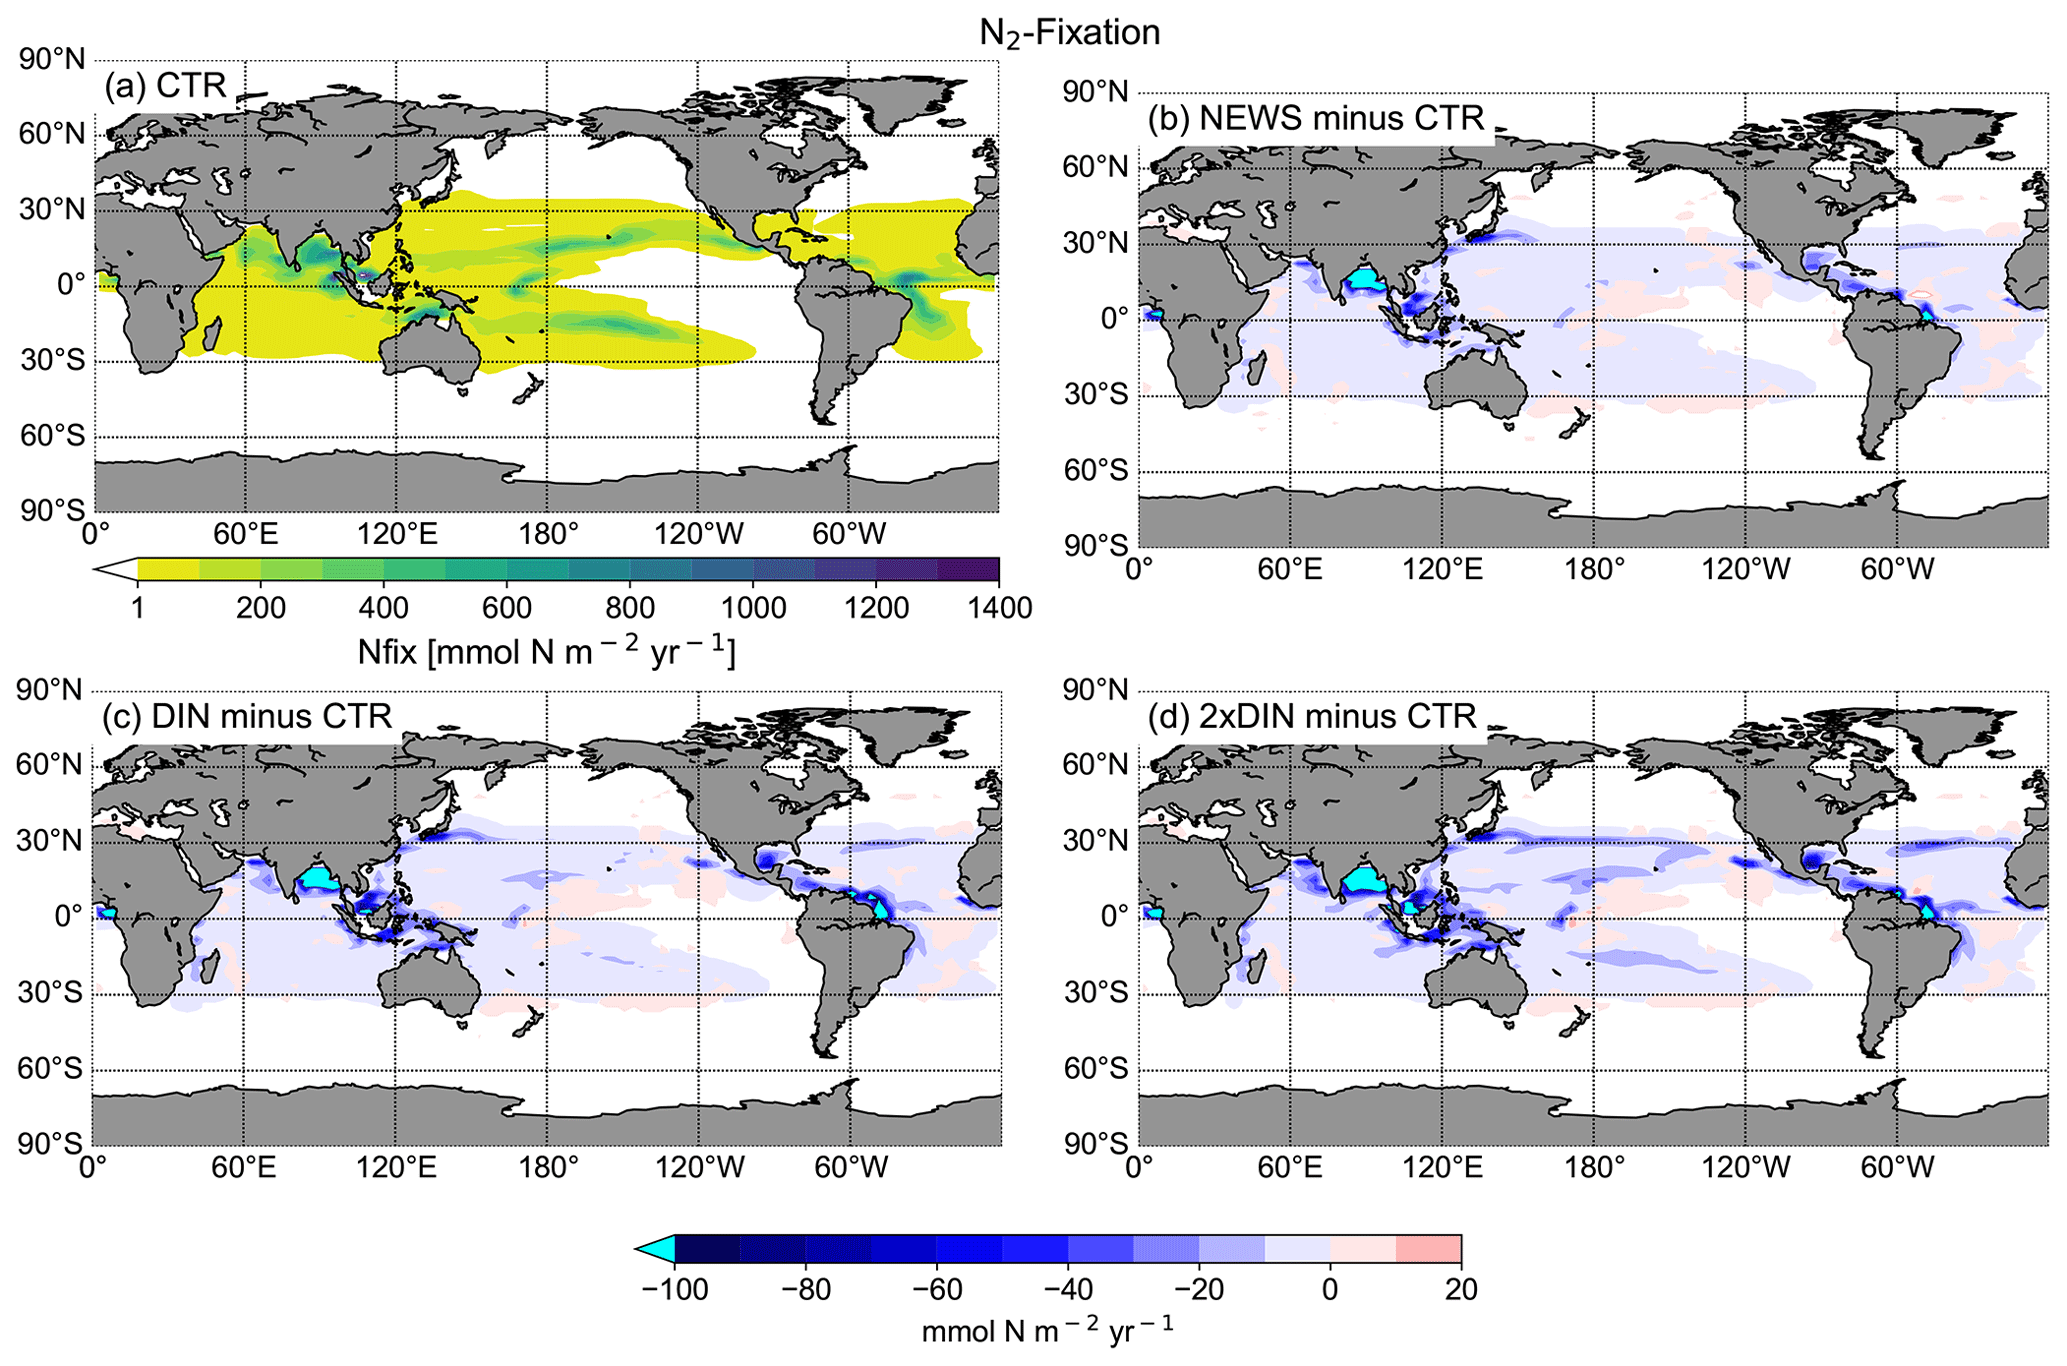
Figure 8(a) Global distribution of N2 fixation in CTR in mmol N m−2 yr−1. The white areas show regions where rates are smaller than 1 mmol N m−2 yr−1. (b) Difference in annual vertically integrated rates of N2 fixation calculated from UVic NEWS and CTR in mmol N m−2 yr−1. (c) Difference in N2 fixation in the simulation with riverine DIN and DON. (d) Difference in N2 fixation in the simulation with twice the amount of DIN. The white areas show regions where differences are smaller than 0.01 mmol N m−2 yr−1. Local minima can be found near the Amazon River basin (from −356 mmol N m−2 yr−1 in NEWS − CTR to −382 mmol N m−2 yr−1 in DIN − CTR), in the Bay of Bengal (from −347 to −646 mmol N m−2 yr−1 in 2×DIN − CTR), and in the Gulf of Guinea (from −180 mmol N m−2 yr−1 in NEWS − CTR to −303 mmol N m−2 yr−1 in 2×DIN − CTR).

Figure 9(a) Global distribution of total denitrification in CTR in mmol N m−2 yr−1. The white areas show regions where rates are smaller than 100 mmol N m−2 yr−1. (b) Difference in annual vertically integrated rates of total denitrification calculated from UVic NEWS and CTR in mmol N m−2 yr−1. (c) Difference in total denitrification in the simulation with riverine DIN and DON. (d) Difference in total denitrification in the simulation with twice the amount of DIN.
3.1.3 The N-cycle feedback mechanisms
The interaction between N2 fixation, denitrification, and riverine nitrogen supply can also explain the significant loss in NO3 in some regions identified before: the Gulf of Guinea, the Bay of Bengal, and the western coast of Central America (Figs. 5 and 7). In addition, these three regions also have in common that they are known to have very low oxygen concentrations. Note that the global volume of ocean minimum zones, defined here as regions with O2 concentration lower than 70 µmol kg−1, is increasing with higher nitrogen supply, from 52×106 km3 in CTR to 54×106 km3 in NEWS, 56×106 km3 in DIN+DON, and 58×106 km3 in 2×DIN. In the Bay of Bengal, oxygen concentrations, even though higher at the surface in NEWS than in CTR, are very low in the NEWS simulations in the subsurface waters and the whole deeper basin (Fig. 7). These suboxic waters are furthermore located in proximity to riverine N input and high denitrification rates (Fig. 10). While total denitrification rates (benthic and water column denitrification) are already quite high in CTR, they are further increased in NEWS, DIN+DON, and 2×DIN in the northern Bay of Bengal, adjacent to the river delta.
Landolfi et al. (2013) found that the negative feedback mechanism between N2 fixation and denitrification, generally stabilizing the marine N inventory, can turn into a destabilizing positive feedback, generating runaway N loss, if a close spatial association of N2 fixation and denitrification occurs. This is due to the stoichiometric imbalance created by the combination of these processes. Denitrification occurs in anoxic or suboxic environments, where nitrate or nitrite can be used as a substitute terminal electron acceptor instead of oxygen. Denitrification consumes 7 mol of NO3 for every mole of organic N provided by N2 fixation and remineralized anaerobically via denitrification. If more than one-seventh of the organic N provided via N2 fixation is denitrified, this leads to a net loss of N by more N lost during denitrification than added via N2 fixation, called a “vicious cycle” by Landolfi et al. (2013).
In the Bay of Bengal, oxygen concentrations appear higher at the surface in NEWS than in CTR by around 1.5 mmol m−3 at least in the southern part of the bay, which could be due to enhanced production. However, compared to the WOA, the oxygen concentrations are still very low in the upper 800 m in NEWS like in CTR, and they are particularly low in the NEWS simulations in the subsurface waters and the whole deeper basin (Fig. 7). The vicious cycle is triggered here by the input of new N from riverine export near oxygen minimum zones, explaining the NO3 deficit found in the simulated Bay of Bengal (Fig. 5). Note that UVic, similarly to most other biogeochemical ocean models, misplaces the main oxygen minimum zone from the Arabian Sea to the Bay of Bengal (Séférian et al., 2020). In reality, high water column denitrification has been observed in the Arabian Sea, while in the Bay of Bengal highly variable oxygen concentrations seem to inhibit denitrification (Johnson et al., 2019; Bange et al., 2005).
At the end of the simulation, the global marine N inventory is higher by 5278 Tg N in NEWS compared to CTR, which corresponds to 1.12 % of the global N inventory in CTR and 2.3 % of the total riverine N input over the 10 000 years of the simulation. Even for the highest scenario (2×DIN), the total increase in global N represents only +2.53 % of the reference N inventory. Most of the additional N input through river discharge is thus compensated for by the feedbacks of the N cycle. However, relative to the total additional input, the N increase in 2×DIN is higher than in NEWS (+2.6 % compared to +2.3 %), which means that the negative feedbacks are not compensated for in 2×DIN as much as in NEWS. A possible reason for this result could be that the main positive N-loss feedback becomes smaller or that the positive feedbacks, resulting in loss of N, take place in very localized low-oxygen areas that can not expand further (e.g., Bay of Bengal, Amazon River mouth), while riverine N is supplied through river mouths scattered over the world.
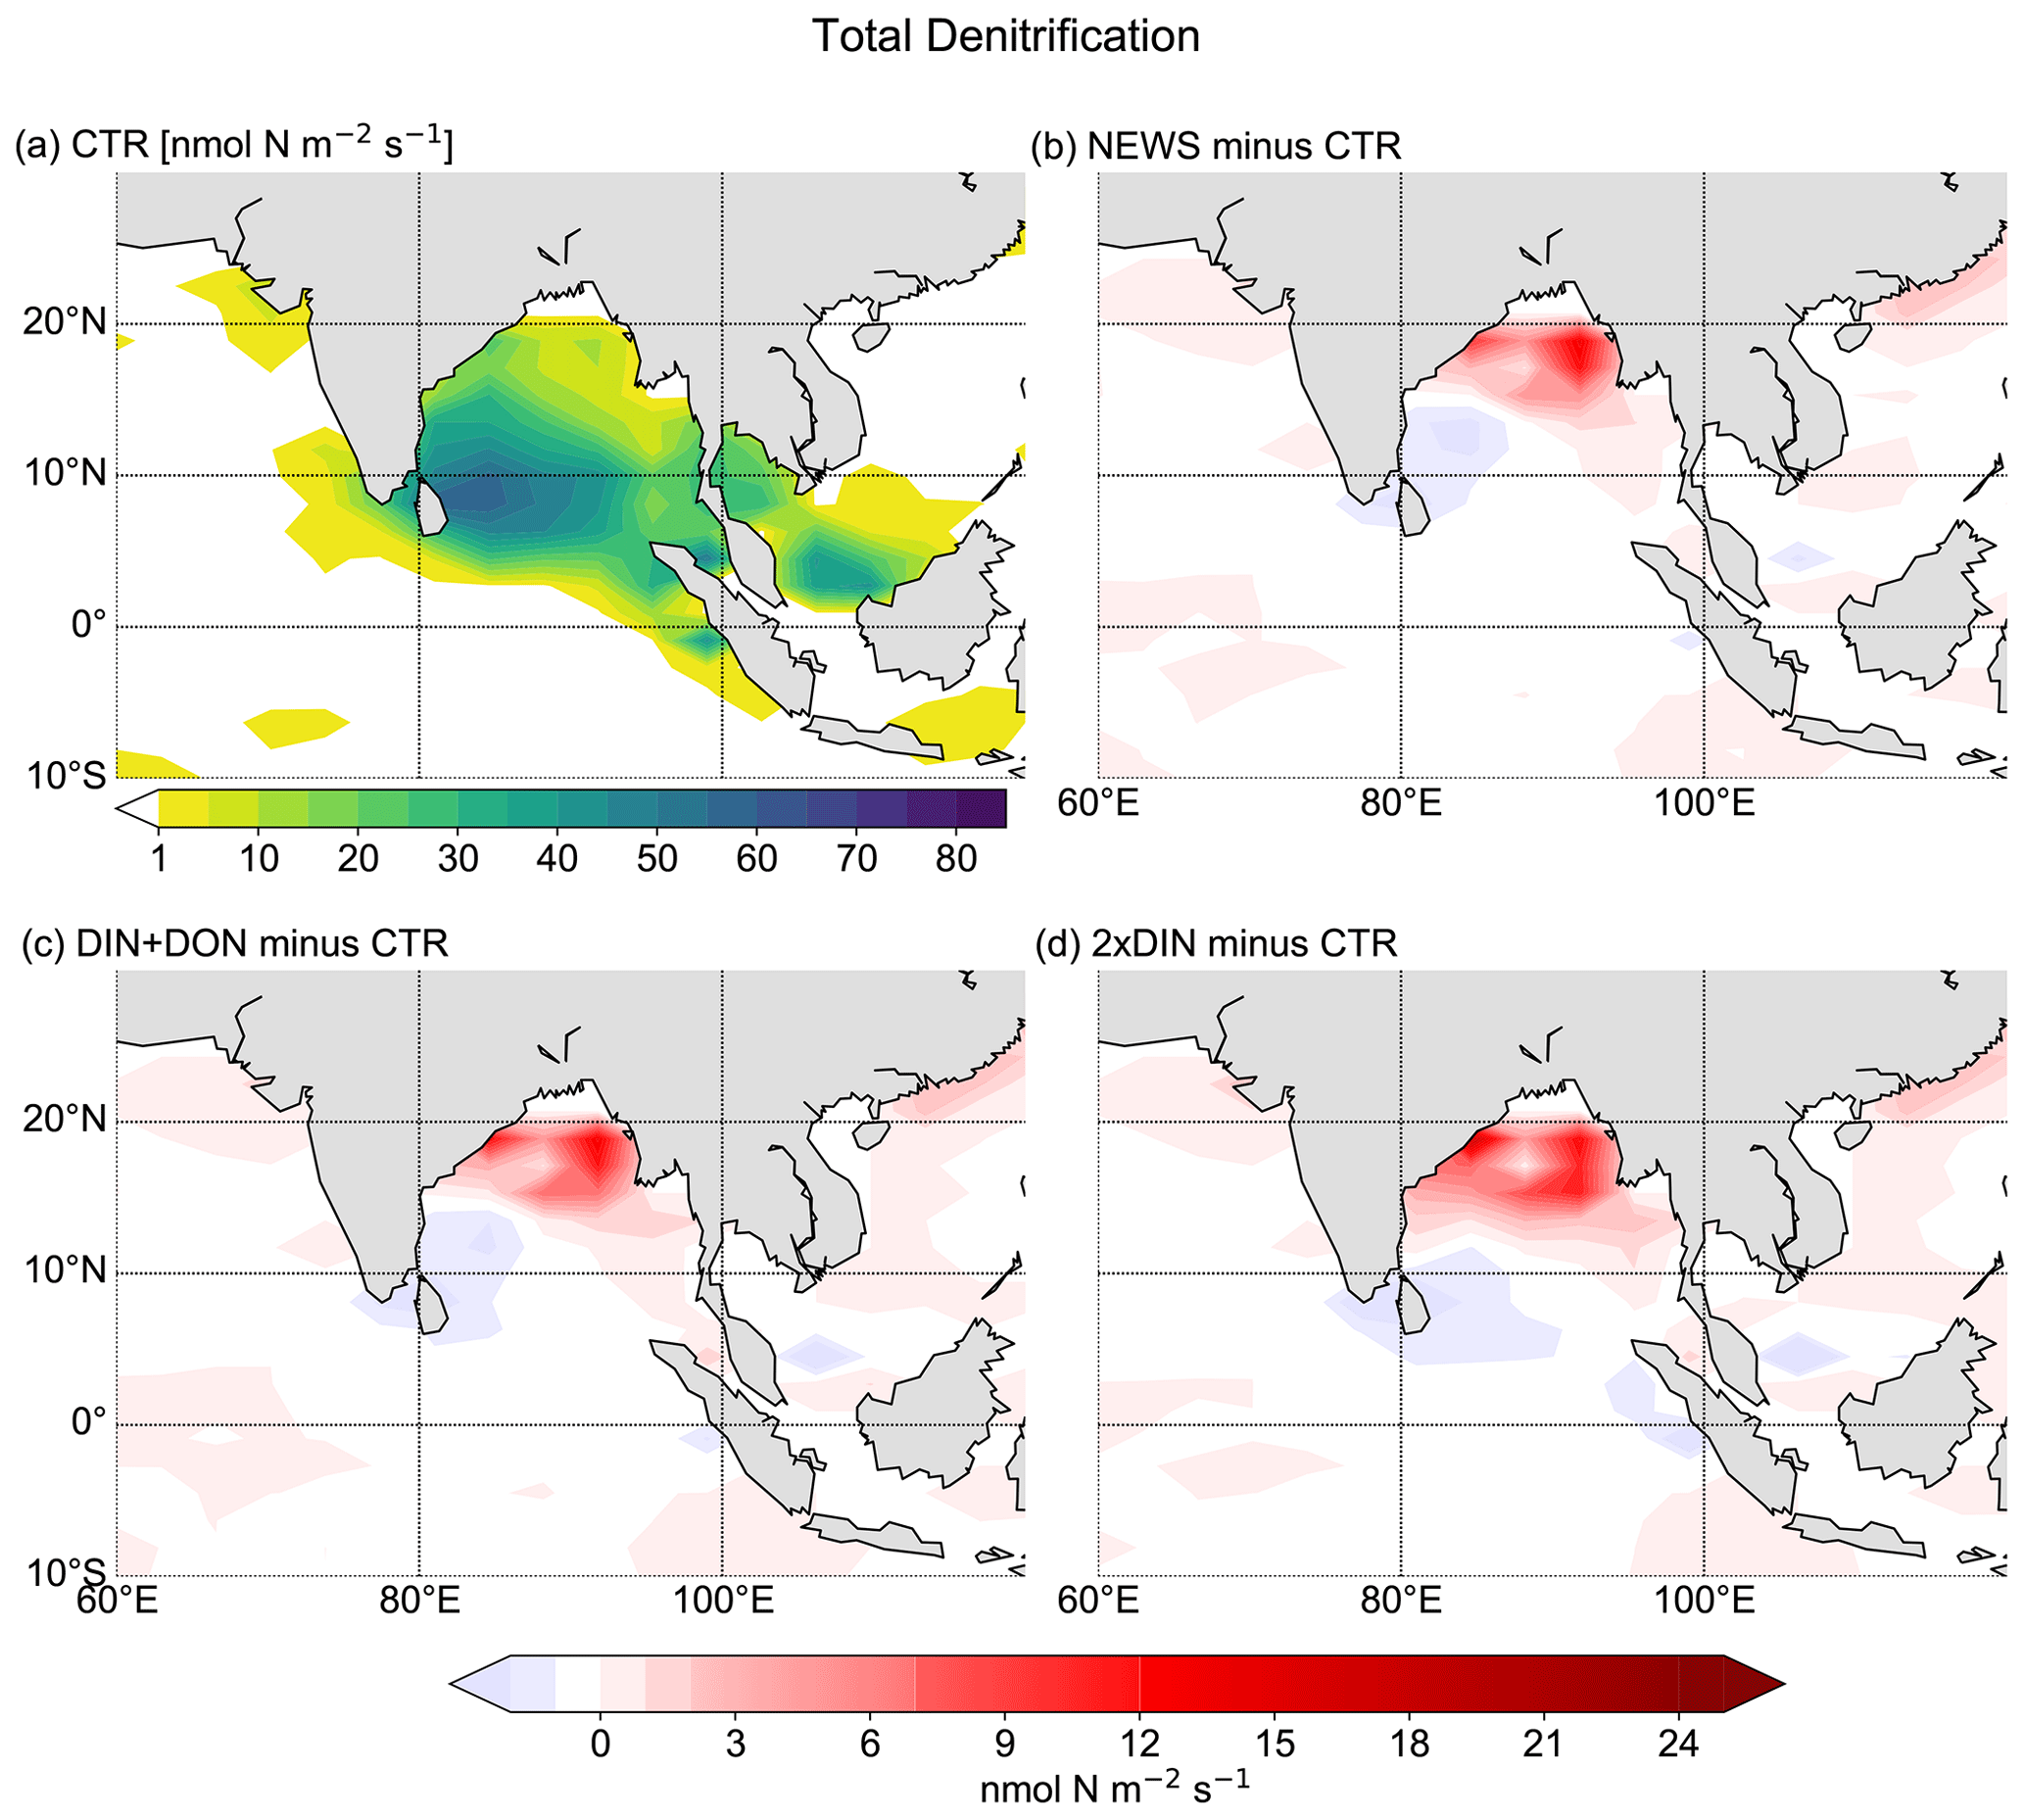
Figure 10Total (water column and benthic) denitrification in the Bay of Bengal. (a) Total denitrification from CTR in nmol N m−2 s−1. In the white areas total denitrification rates are smaller than 1 nmol N m−2 s−1. (b) Difference in denitrification between NEWS and CTR. (c) Difference in denitrification between DIN+DON and CTR. (d) Difference in denitrification between 2×DIN and CTR.
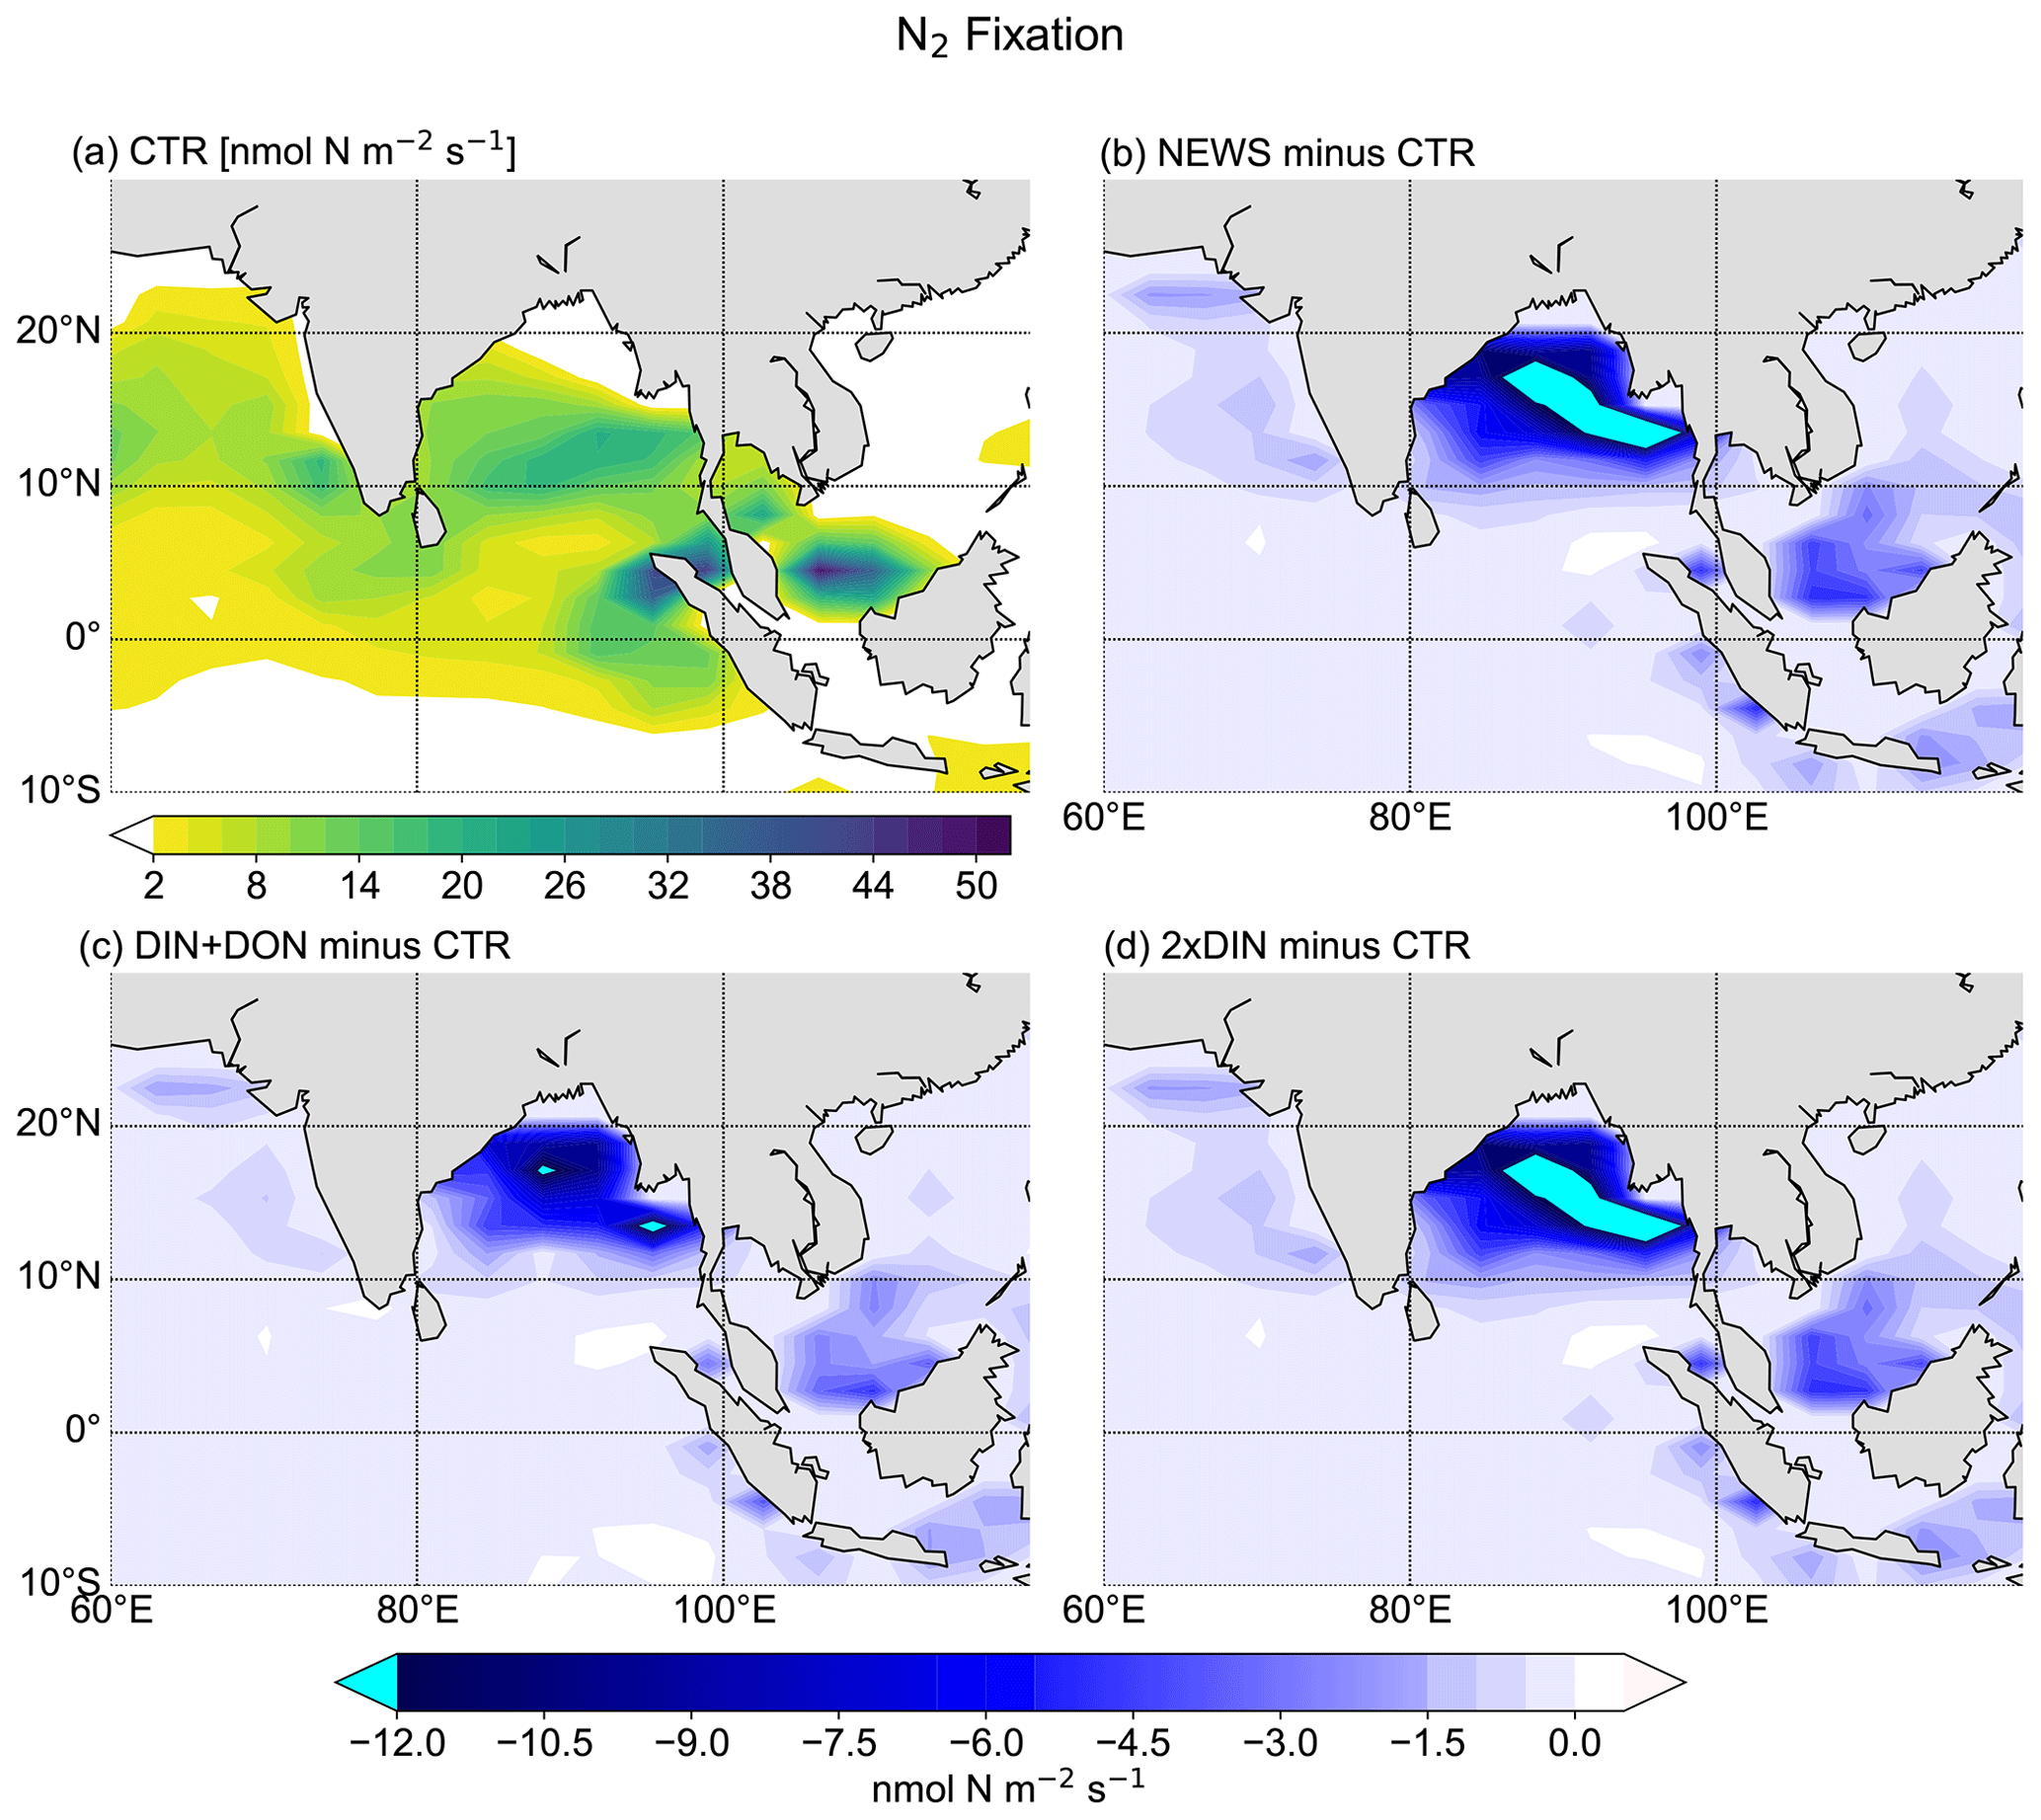
Figure 11N2 fixation in the Bay of Bengal. (a) N2 fixation from CTR in nmol N m−2 s−1. The white color indicates regions where N2 fixation is smaller than 2 nmol N m−2 s−1. (b) Difference in N2 fixation between NEWS and CTR. (c) Difference in N2 fixation between DIN+DON and CTR. (d) Difference in N2 fixation between 2×DIN and CTR.
Table 3Global nitrogen sources (river supply, N2 fixation) and sinks (denitrification) averaged over the last 100 years of the simulations. All fluxes are given in Tg N yr−1. Note that the global sums from sources and sinks do not exactly add up to zero due to natural variability in the modeled N cycle.
3.2 Marine primary production
The rates of simulated annual global net primary production (NPP) compare well to present-day estimates of annual global NPP (43.5 to 67 Pg C yr−1) derived from satellite measurements (Buitenhuis et al., 2013; Westberry et al., 2008; Carr et al., 2006; Behrenfeld et al., 2005) and vary little between the simulations (Table 4). That is NPP increases only slightly with riverine N supply.
Annually averaged and vertically integrated primary production rates from CTR shows high rates in the equatorial eastern Pacific Ocean, Atlantic Ocean, and Indian Ocean as well as in the upwelling region of the western South Atlantic Ocean (Fig. 12a). This global pattern persists in the simulations with riverine N supply (differences are small in Fig. 12b–d). Nevertheless, with rivers supplying N to the ocean, differences are visible at coastal scales: NPP increases locally, close to the river mouths, especially near the coasts of Europe, China, parts of North America, and parts of South America. Most changes range between −60 and +100 g C m−2 yr−1. In isolated regions, marine primary production rates are lower in the three NEWS simulations than in CTR. This is particularly striking in parts of the Bay of Bengal but also in the equatorial west Atlantic Ocean to the north of the Amazon River mouth. In large regions of the subtropical and tropical oceans where surface NO3 concentrations in our simulations are lower than in CTR, NPP differences also show a decrease.
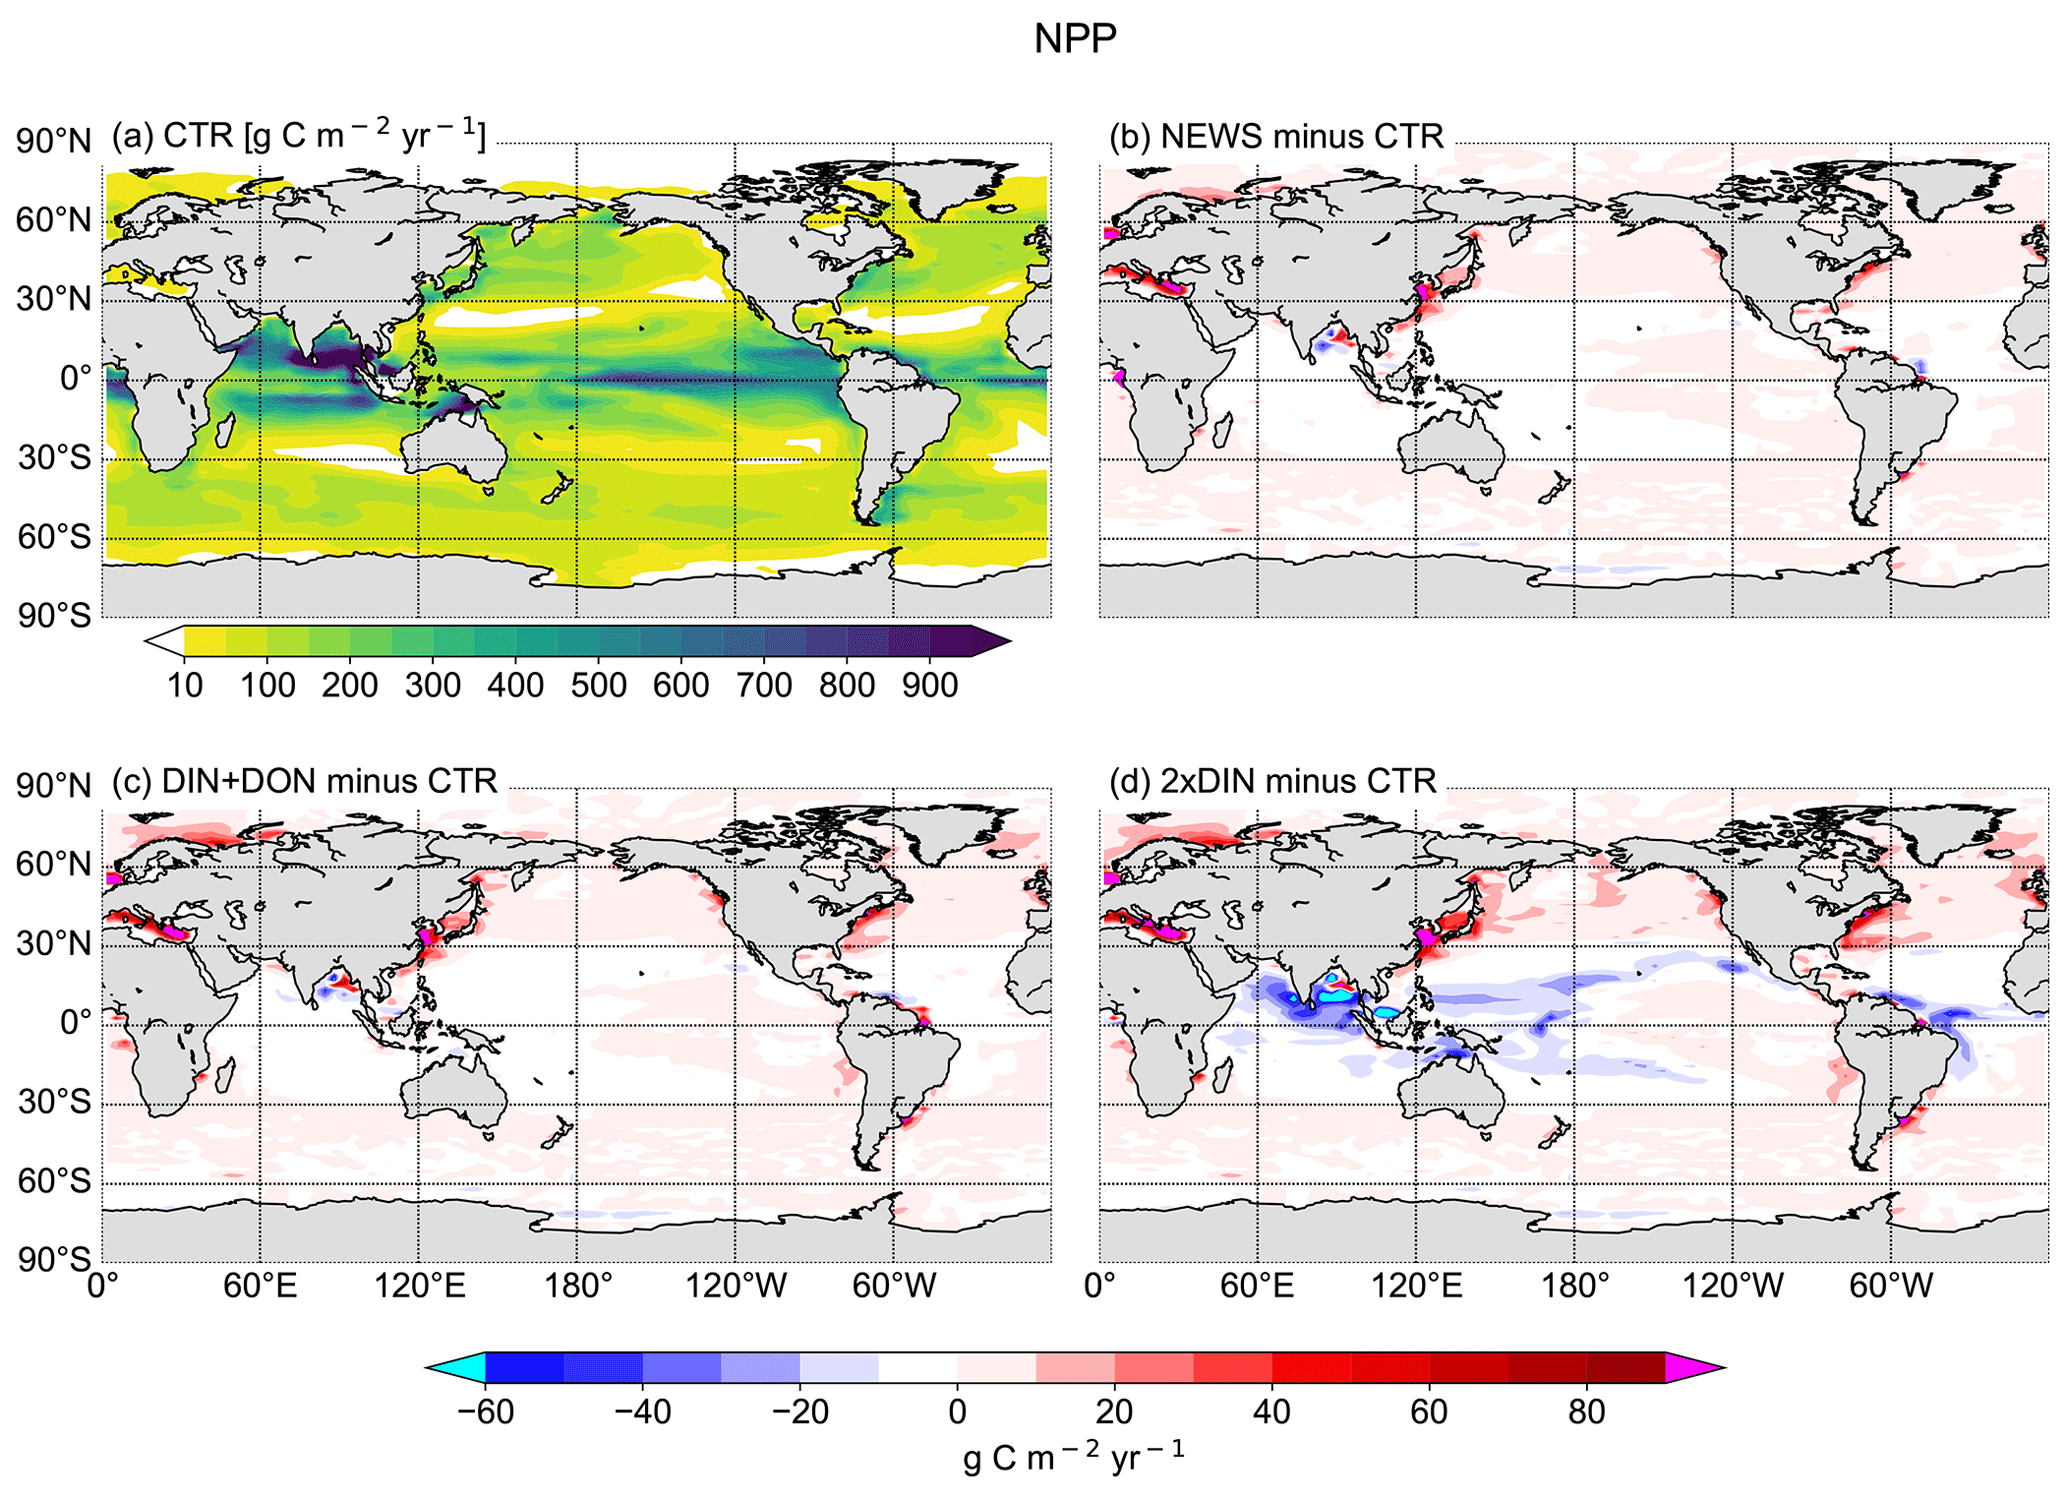
Figure 12(a) Annual vertically integrated rates of primary production (NPP) calculated from UVic CTR in g C m−2 yr−1. (b–d) Differences in NPP distribution calculated from different UVic simulations with riverine N export and from UVic simulation without riverine nutrient input (CTR) in g C m−2 yr−1. (b) NPP from NEWS with riverine DIN. (c) NPP in the simulation with riverine DIN and DON. (d) NPP in the simulation with twice the amount of DIN. The extreme values shown in cyan and magenta in these panels are listed in Table 5.
Table 4Mean annual depth-integrated NPP from model data and observations.
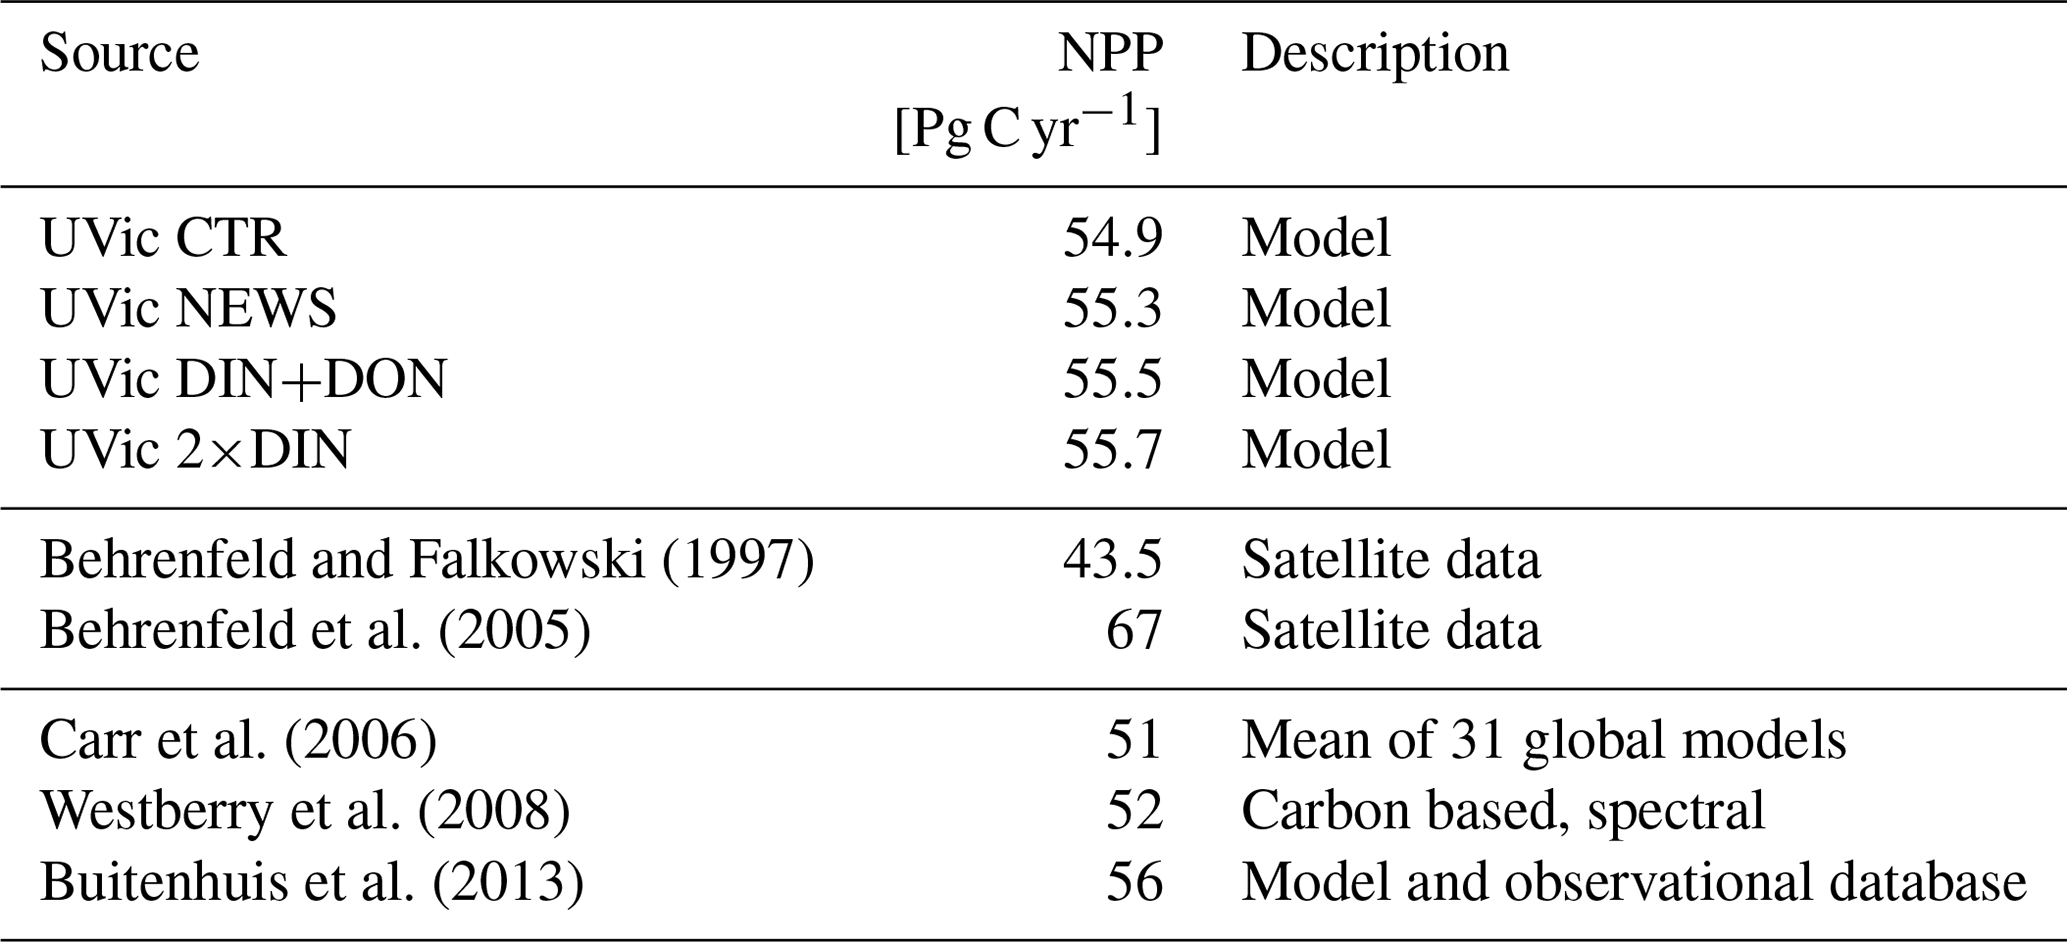
Table 5Minimum and maximum values of NPP difference from CTR simulation as a supplement to Fig. 12.
In NEWS, where only DIN is supplied by the rivers, NPP increases mainly in shelf and near-coastal oceans. The main differences are in the magnitude rather than in the patterns of NPP; however, higher amounts of N added by the rivers in DIN+DON and 2×DIN also impact marine productivity in the open ocean, far away from the river mouths. In the western subtropical and tropical waters NPP decreases with higher N input. These regions correspond to the regions where diazotrophs can be found and where N2 fixation also decreases in our simulations. In the higher northern latitudes primary production is enhanced off the coastal oceans and in the North Atlantic and the western North Pacific oceans as well as on the Arctic Ocean shelf (Fig. 12d). Two “physical” explanations suggest themselves: first, near the coast the riverine N is consumed until phosphate becomes limiting. Then, the excess N is exported from the coastal oceans, leading to higher productivity farther away. Second, decreasing NPP in the open ocean can be the consequence of a seesaw effect, also called “nutrient robbing”. Because higher N concentrations increase NPP in the coastal ocean, other nutrients, like P, are also consumed here instead of being exported to the open ocean. This can lead to lower rates of primary production farther away (Giraud et al., 2008).
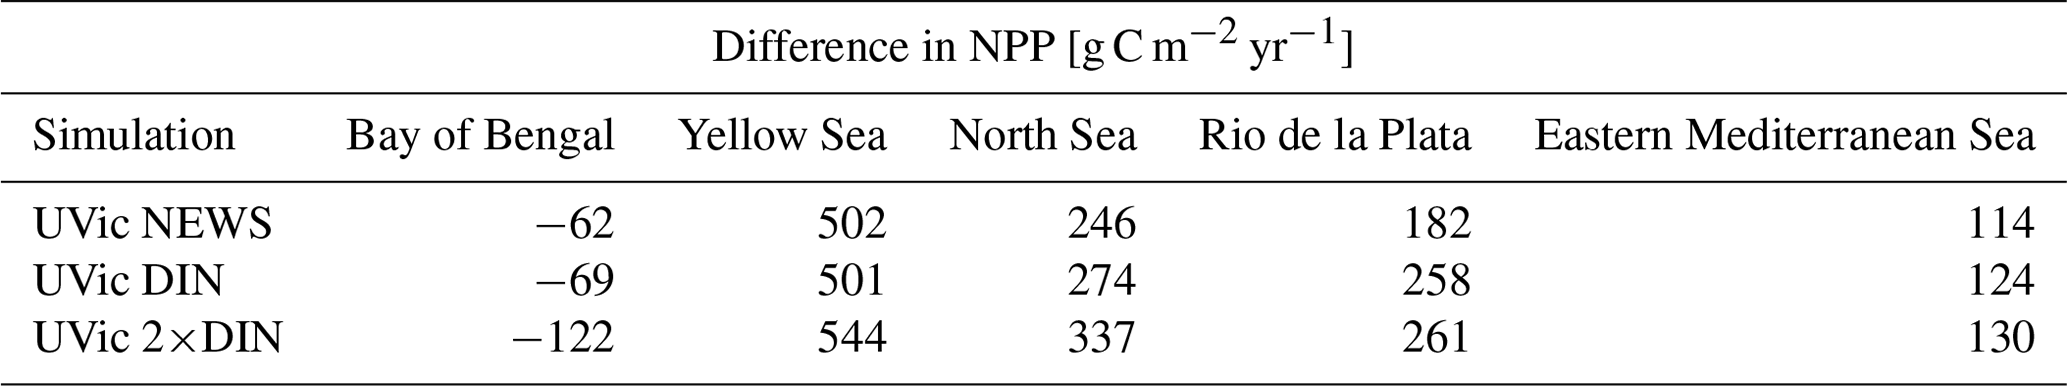
Globally the differences in NPP in NEWS compared to the control simulation are close to the spatial variance of annually averaged NPP in the model (∼ 57 g C m−2 yr−1). Most changes are smaller than ± 40 g C m−2 yr−1 (± 2 %), even though locally the changes can be high (down to −122 g C m−2 yr−1 in the Bay of Bengal or even higher than +500 g C m−2 yr−1 in the East China Sea). The total increase in NPP varies between +0.7 % (NEWS) and +1.3 % (2×DIN) compared to CTR. These changes reflect in wide parts changes in NO3 due to the riverine inputs, except for at the higher latitudes and in other regions where light, temperature, or iron limitation occur. In the higher-DIN experiment, NPP is globally a little higher than in the other simulations including CTR, but the distribution shows NPP hot spots near the river mouths, which are compensated for by losses in the subtropical and tropical oceans. In the Bay of Bengal in particular, NPP is enhanced near the outflow of the Meghna River (up to +36 Tg C yr−1), but due to important loss of N further south, total NPP in the basin is lower in all simulations compared to CTR (Table 6).
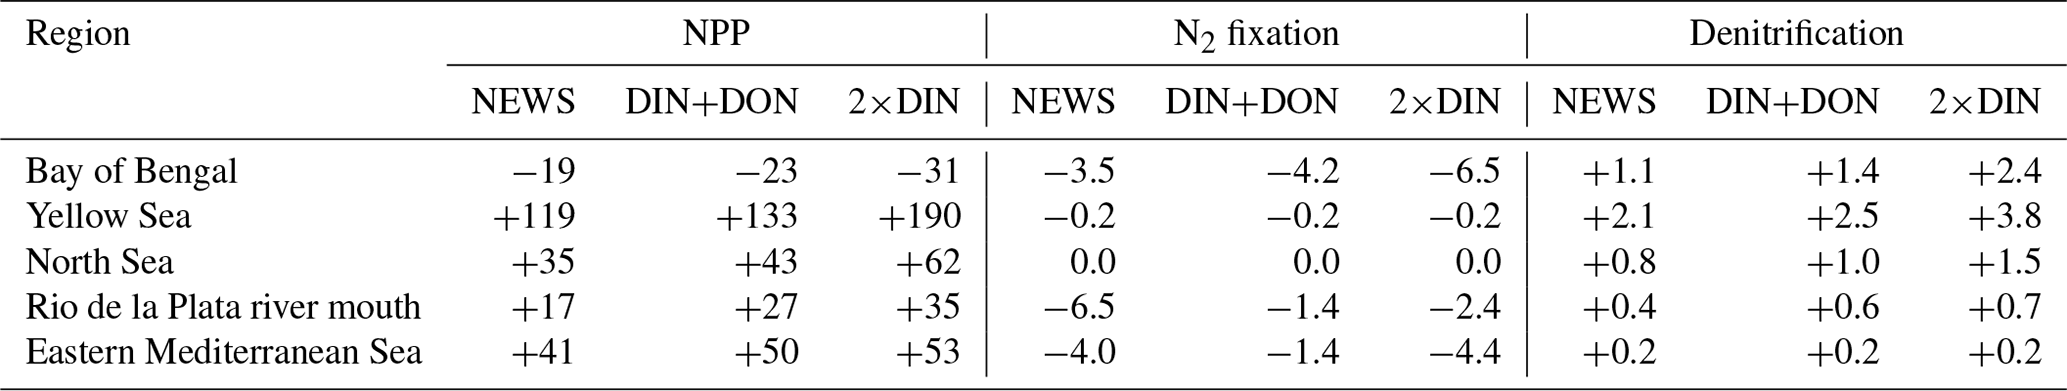
Table 6Total NPP, N2 fixation, and total denitrification from all simulations compared to CTR in some regions with significant decrease or increase in NPP as seen in Fig. 12. NPP is shown in g C yr−1 and N2 and denitrification in Tg N yr−1.
As stated before, decreasing N2 fixation together with higher rates of denitrification partly compensates for the additional N from riverine export and thereby buffers the increase in NPP. Note in this regard that a small fraction of NPP is primary production by diazotrophs, which is lower in the NEWS simulations than in CTR (−0.09 Pg C yr−1 for NEWS, not shown here).
In comparison with the NPP pattern in observation (e.g., Behrenfeld and Falkowski, 1997), simulated primary production in UVic is higher in the tropical upwelling regions along the Equator and the northern Indian Ocean, while there is too little productivity on the shelves (Keller et al., 2012). In the simulations with riverine N supply, NPP is increased in the coastal regions and, at least for the 2×DIN experiment, lower in the tropical upwelling regions than in CTR.
The increase in NPP is mainly driven by higher rates near the river mouths, whereas primary production declines in regions where rates of N2 fixation are lower as a reaction to the input of riverine N, like in the Bay of Bengal and near the Amazon River mouth but also in parts of the open subtropical and tropical oceans (Figs. 8, 11, and 12). This also shows that the response of ocean biogeochemistry depends on the region where riverine DIN first reaches the ocean.
3.3 Simulations with regionally activated riverine nitrogen supply
To answer the question of which rivers have the highest influence on global marine biogeochemistry, we performed five additional experiments with the same configuration as in the NEWS simulation before, but this time with only the rivers of one of five parts of the world transport NO3 to the ocean. The five scenarios simulate the nutrient supply from North American rivers (NAM), South American rivers (SAM), European and Russian rivers (EUR), Asian rivers (ASIA), and African rivers (AFR).

Figure 13Difference in the zonal mean concentrations of NO3 in the main ocean basins (Atlantic Ocean, Pacific Ocean, and Indian Ocean) between regional NEWS and the control simulation (CTR). The regional simulations show export from rivers in North America (a–c), South America (d–f), Europe and Russia (g–i), Asia (j–l), and Africa (m–o). The violet line indicates the 0.0 mmol N contour line. Maximum differences can be found in the Indian Ocean ASIA, with minimum values at −0.9 mmol N m−3 and maximum values at 2.5 mmol N m−3.
Total riverine N input varies depending on the rivers. Therefore, the amount of N added to the ocean is different in each of the five scenarios. The highest amount of N is added by Asian rivers (11.7 Tg N yr−1). Rivers from South America export 3.5 Tg N yr−1, followed by rivers in EUR (3.2 Tg N yr−1). The lowest-input scenarios are NAM (2.6 Tg N yr−1) and AFR (2.3 Tg N yr−1). The three ocean basins are then affected differently depending on the scenario.
Compared to the control simulation, the differences in NO3 concentrations are small (0–2 mmol m3), but the patterns differ depending on the origin of NO3 (Fig. 13). It appears that all ocean basins are most affected by rivers in Europe and Russia (EUR) and least affected by rivers from South America (SAM), although rivers from this region provide the second-highest N supply to the global oceans. The Atlantic Ocean is most affected by rivers in EUR and to a lesser extent in NAM. Asian rivers lead to a local increase in NO3 concentrations in the North Pacific in the upper 2000 m. Here, NO3 is trapped because North Pacific waters upwell in the North Pacific. Extra nitrogen is used by local biota and recycled within the North Pacific. But globally and over all depths, rivers in EUR and to a lesser extent in NAM have the biggest impact on NO3 concentrations in the Pacific. Rivers in SAM slightly decrease NO3 concentrations in large parts of the Pacific Ocean.
In the Indian Ocean basin, NO3 concentrations are higher in the simulations NAM, EUR, and AFR. This is because global circulation transports N to remote ocean basins but is not consumed by local primary production, nor does it trigger the vicious cycle described before. In contrast, zonally averaged NO3 concentrations are lower in the northern Indian Ocean if Asian rivers supply N and thereby enhance denitrification (Fig. 13). N from other regions does not trigger the vicious cycle (Landolfi et al., 2013) in the Bay of Bengal, in the model because it arrives and is used in biological production in other regions before it can reach the Bay of Bengal.
In all simulations with regionally activated riverine nutrient input, N2 fixation rates are lower than in CTR, with differences ranging between −0.8 Tg N yr−1 in EUR to −7.7 Tg N yr−1 in ASIA (not shown here). This decrease is most prominent in the Bay of Bengal for experiment ASIA because high DIN export from the Ganges Delta gives the advantage to non-N-fixing phytoplankton, which outcompete diazotrophs.
Generally, rivers that enter well-oxygenated eutrophic oceans with little N2 fixation have the largest impact on the global ocean N inventory. This is especially the case for rivers from EUR and NAM, entering the Atlantic and Arctic oceans at higher northern latitudes. In contrast, the Amazon in SAM is located in an oxygen-deficient region in the tropical Atlantic. The main riverine N supply in ASIA increases N concentrations in the higher northern latitudes of the Pacific but leads to a net loss of N in the Bay of Bengal.
This has consequences for marine productivity: although NPP is higher in NEWS in most of the coastal oceans, where rivers export DIN, NPP is considerably lower in three regions, where the positive vicious-cycle feedbacks dominate – in AFR in the Gulf of Guinea, in ASIA in the Bay of Bengal, and in SAM where the river plume of the Amazon River enters the tropical Atlantic Ocean (Fig. 14).
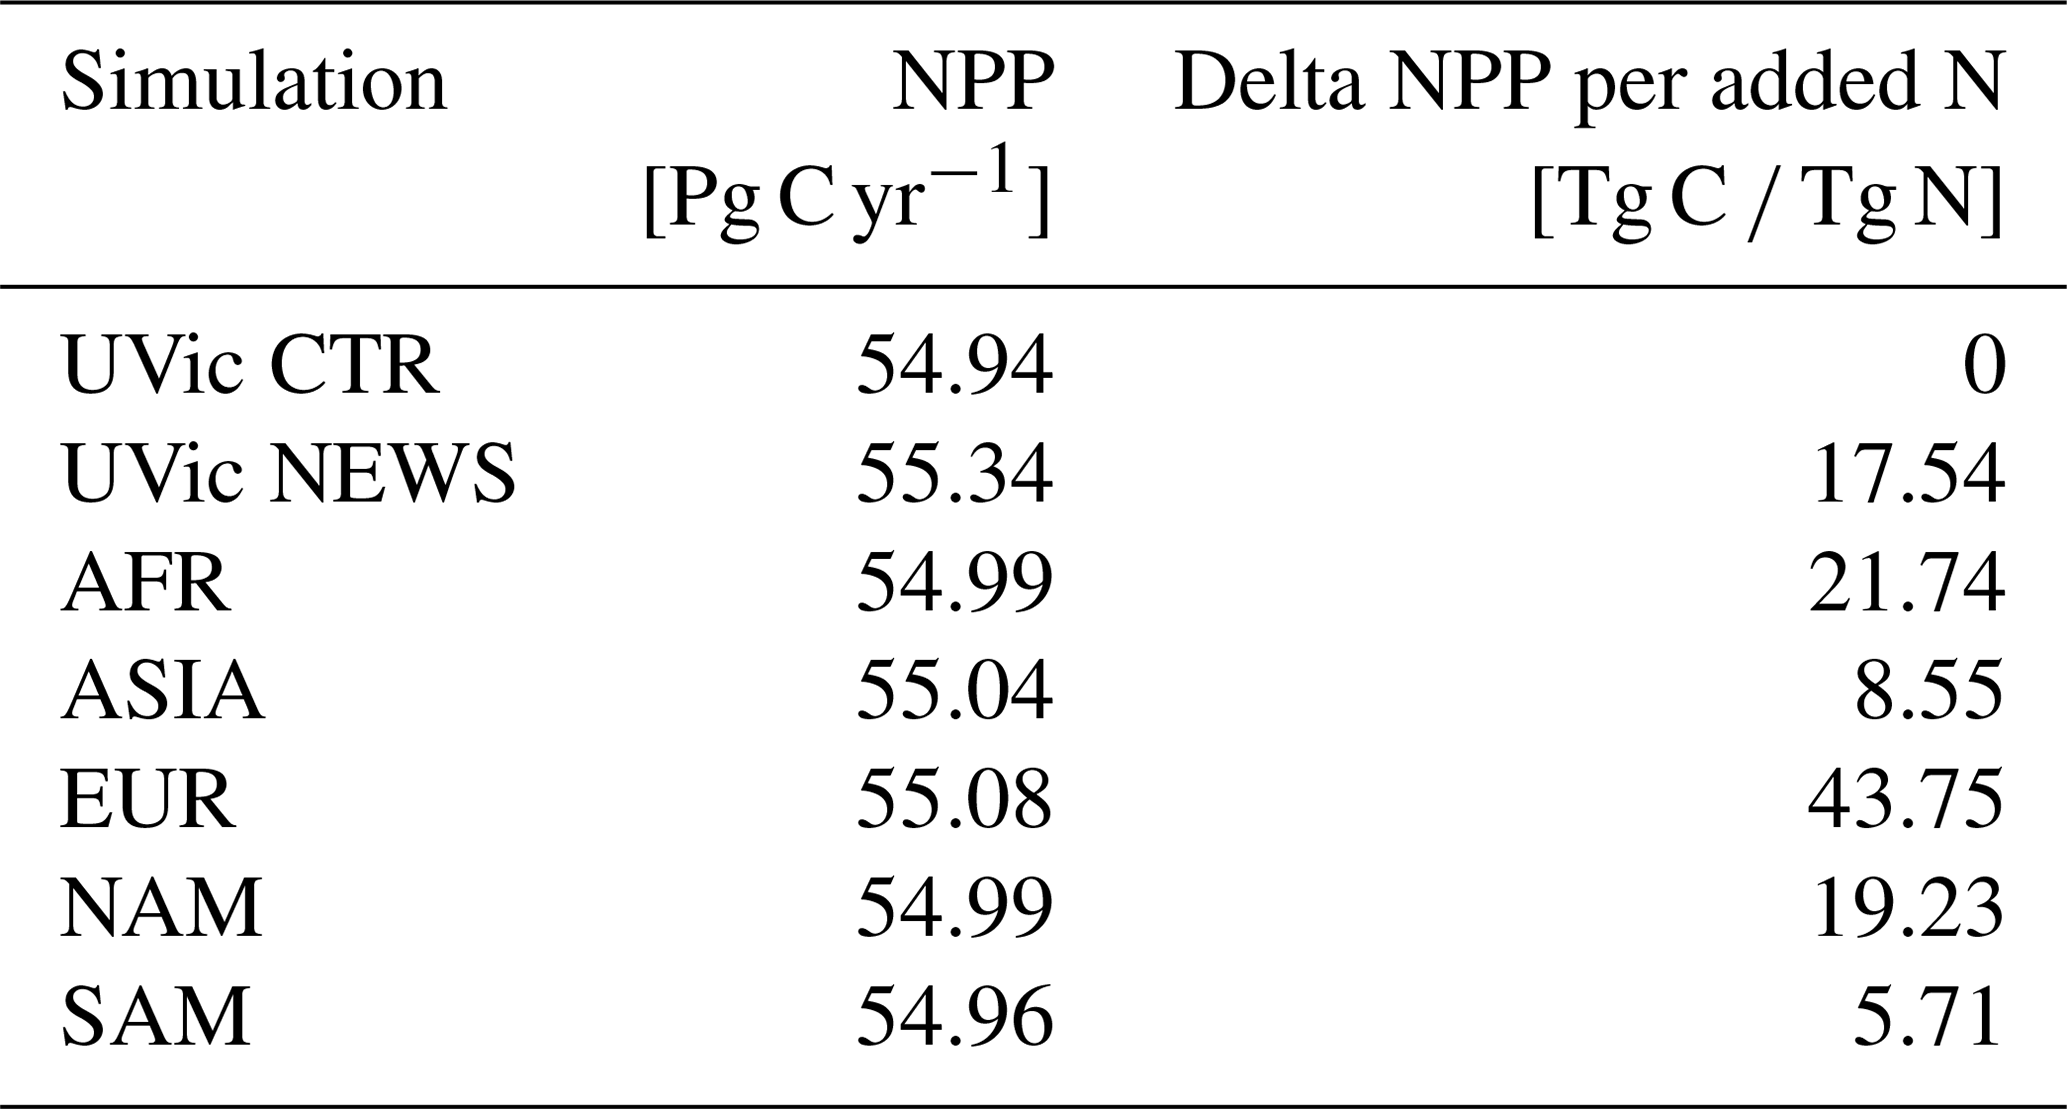
The global NPP rates range from 54.96 Pg C yr−1 in SAM to 55.08 Pg C yr−1 in the EUR simulation (Table 7). Related to the total amount of N added to the respective simulations via river supply however, EUR contributes considerably more to a widespread increase in NPP, while SAM contributes the least (Table 7). ASIA only increases NPP in a confined part of the Pacific Ocean and mainly decreases primary production in other regions like the Bay of Bengal (Fig. 14).
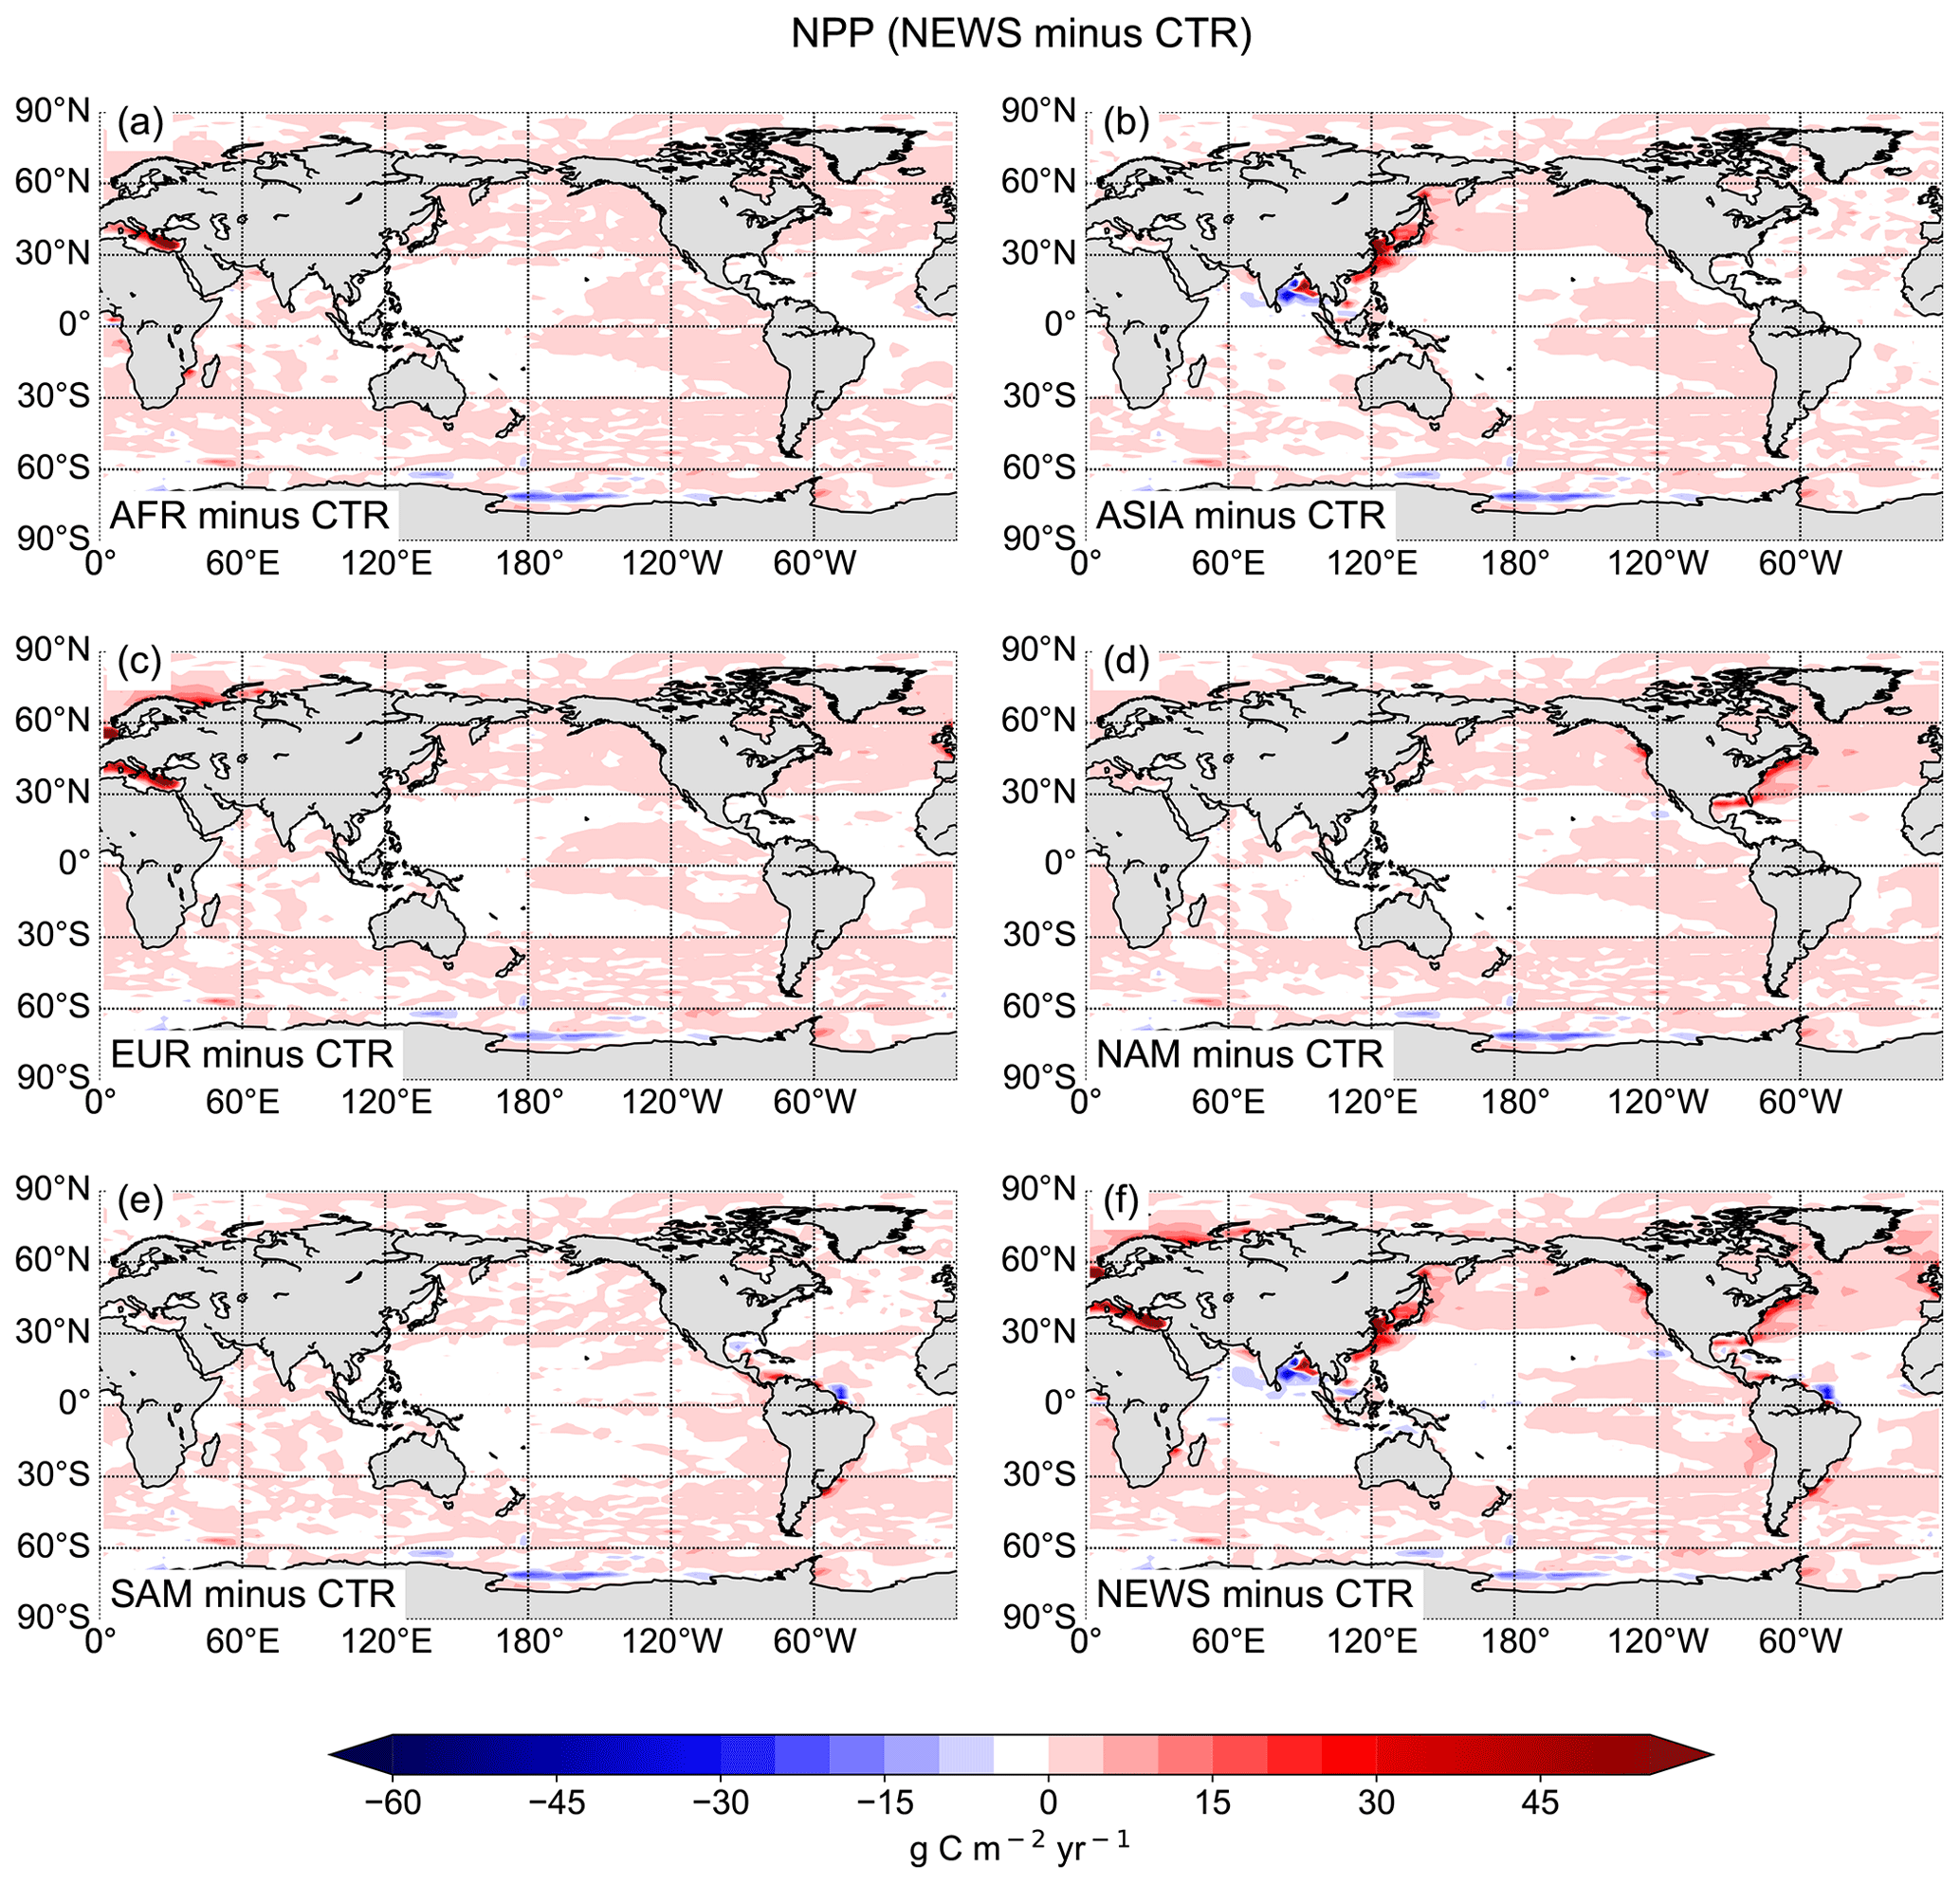
Figure 14Difference in the global vertically integrated rates of primary production (NPP) between regional NEWS and the control simulation (CTR). The regional simulations show export from rivers in Africa (a), Asia (b), Europe and Russia (c), North America (d), and South America (e).
According to our simulations, the ecosystem's response to riverine N supply differs depending on the region of the supply and does not always result in an increase in marine NPP. Note that the sum of the NPP changes in the regional experiments is equal to the change in NEWS, except for parts of the Southern Ocean and the eastern Mediterranean Sea. In the Mediterranean Sea, the sum of the regional NPP changes compared to CTR is higher by 1.8 % than the change in global NEWS. This is due to phosphate limitation in this region in the model, limiting increases in NPP in the NEWS simulation.
The results of the simulations with UVic and riverine N have to be evaluated in the context of previous studies. Lacroix et al. (2020) for example found that adding riverine nutrient supply increased primary production essentially in some “hot spots” near the river mouths. While we have observed a qualitatively similar phenomenon in our simulations, these hot spots differ between both studies. This is due partly to the coarser resolution of UVic. The grid configuration used by Lacroix et al. (2020) (GR15) consists of a bipolar grid which resolves the ocean horizontally at around 1.5∘ and through 40 unevenly spaced vertical layers. Although riverine N is simulated as a fixed percentage of P, dynamic nitrogen fixation by cyanobacteria is included as well as nitrogen deposition and denitrification. From the semi-enclosed seas, which present higher NPP in the study by Lacroix et al. (2020), only the Yellow Sea is adequately resolved in UVic and also shows a significant increase in NPP. But the patterns of primary production differ in several other aspects. Where NPP is substantially increased in the subtropical and tropical eastern Pacific in Lacroix et al. (2020), there is hardly any change in UVic NEWS. In the Bay of Bengal, where we found decreased NPP upon addition of riverine N supply in UVic, their model simulates an increase. The main reason for these differences is the fact that Lacroix et al. (2020) included more than just N from river discharge. Especially the supply in additional phosphate plays an important role in NPP and is for example particularly high in the Bay of Bengal in their simulation. Furthermore, the magnitudes of oceanic nutrient inputs do not differ substantially between the two simulations analyzed in the study of Lacroix et al. (2020): the total N input is 25.2 Tg N yr−1 for the reference simulation (REF) and 27.0 Tg N yr−1 for the simulation with riverine nutrient supply (RIV). The reference distributions of NPP (REF) in Lacroix et al. (2020) also differ with regard to UVic. NPP from UVic is notably higher in the Indian Ocean and the western tropical Atlantic but lower in the Southern Ocean. These higher absolute values of NPP in the open oceans can be accounted for by the parameterization of NPP in our model, where open oceans have to compensate for the lack of higher coastal production in order to achieve estimated annual NPP within the range of 51 to 67 Pg C yr−1 that includes coastal NPP (Keller et al., 2012). But as both reference distributions of NPP differ (from Lacroix et al., 2020, and CTR), it is no surprise that NPP also presents different patterns in the simulations with riverine nutrient supply (RIV and NEWS).
Riverine nutrients only reach the ocean in very localized areas. In our simulation with the NEWS data set from Mayorga et al. (2010), we overestimate the effects of adding N from river discharge because DIN is exported directly from the river mouth to the ocean, as our global model does not fully resolve shelf seas and coastal oceans. In reality, a part of these nutrients stays on the shelf or is buried or denitrified in coastal sediments. We also do not account for the buffer effect of the coasts that could be parameterized, as shown by Sharples et al. (2017) and Izett and Fennel (2018). Nevertheless, even without taking these trapping processes into account, the biogeochemical feedbacks of the ocean buffer higher increases in N concentrations. The absolute increase in marine primary production is small (between +0.7 % in NEWS and +1.3 % in 2×DIN). However, relative to the amount of N added to the global ocean, primary production increases yearly by 17.5 Tg C per additional 1 Tg N in NEWS (16.0 Tg C per 1 Tg N in 2×DIN). As we have shown, primary production increases mainly near the river mouths where high nutrient loads are injected in shallow ocean areas, creating production hot spots, while only small changes in production have been found in the open ocean.
Other studies with additional N supply also found only a moderate increase in global primary production rates. Da Cunha et al. (2007) for example predict increases in NPP of up to +5 % for the global ocean but using a high-DIN scenario which includes 7.1 Tmol N yr−1 (corresponding to ∼ 100 Tg N yr−1). Da Cunha et al. (2007) also include silicate, iron, and dissolved inorganic carbon but conclude that riverine N may have the higher impact on primary production.
Like Somes et al. (2016), who also simulated a very small increase in NPP upon the addition of N deposition in their model, we found that decreasing N2 fixation and increasing denitrification act globally as negative feedbacks. Compared to the total amount of N added by the rivers at the end of the simulation, only 2.3 % (NEWS) to 2.6 % (2×DIN) is retained in the global inventory. The feedbacks compensate for much of the nitrogen addition. In regions of low oxygen concentrations, these feedbacks even overcompensate for the external perturbation in terms of riverine N supply, by forming a vicious cycle (Landolfi et al., 2013), consuming more N than provided by the rivers. This is especially the case in the Bay of Bengal. However, we are aware of the fact that UVic, like several other models, currently misplaces the oxygen minimum zone from the Arabian Sea to the Bay of Bengal. It is likely that N supply by Asian rivers would lead to a somewhat larger increase in the oceanic N inventory if the high nutrient input from the Ganges Delta were not to meet the high denitrification zone in the Indian Ocean (Johnson et al., 2019).
Including other nutrients in addition to N, especially P, could change the setting, especially in regions that are phosphate limited. While this is the logical continuation of the current study, the scope of this project was to explore the consequences of locally high N injections on the N cycle and its feedbacks. Furthermore, as rivers supply relatively more N than P to the global ocean, excess N would still be supplied to the coastal oceans (Turner et al., 2003).
In this study a new model component was added to the global Earth system model UVic, simulating DIN supply from river discharge. At the end of the 10 000 years of simulations, the N budget reached a new steady state. The main conclusions regarding the N cycle and marine productivity include the following:
-
Riverine N added to the coastal ocean is taken up by near-coastal biology but also exported in the deeper ocean and circulated worldwide.
-
Despite the continuous addition of N to the system, global marine N concentrations and marine productivity do not increase substantially (+1.12 % N and +0.72 % for NPP) in our simulations.
-
In the coastal regions and especially in some hot-spot regions near the river mouths, riverine nitrogen input leads to higher primary production. Globally, NPP rates increase to up to 17.5 Tg C yr−1 per 1 Tg N yr−1 added to the ocean.
-
The globally negative feedbacks of the N cycle buffer most of the increase in NO3 concentrations and in NPP. N2 fixation decreases promptly after the beginning of the simulations, partly compensating for the additional N at the surface of the ocean, like the N deposition experiments by Somes et al. (2016) and Landolfi et al. (2017). Water column and benthic denitrification are higher compared to a control simulation without riverine N input and play an important role in low-oxygen regions that moreover tend to expand upon the addition of riverine N supply and generate a net N loss.
-
In our regional simulations we have shown that NPP can even decrease locally depending on the region where N reaches the ocean. While N from river discharges from North America and Europe (and Russia) is also circulated and exported to the deeper ocean, N from Asian rivers is trapped in the western Pacific or even partly lost via denitrification in oxygen-deficient regions, like it is in the case of the modeled Bay of Bengal.
-
The biogeochemical feedbacks of the ocean buffer further increases in global N concentrations and global NPP. Hence, the result also suggests that ocean fertilization with nitrogen alone (as proposed for example by Harrison, 2017) may not have the desired effect. Indeed, simulated carbon export, evaluated at the 122 m level and including all the shelf regions, increases globally by only 0.06 Pg C yr−1 in our NEWS simulation, representing less than 10 % of the amount estimated by Harrison (2017) to be the upper limit of sequestered carbon in the ocean from ongoing fertilization with nitrogen. On short timescales targeted N fertilization might have some impact, but once the vicious cycle has a chance to start, then the findings would probably be the same, as shown, for example, by Somes et al. (2016). But further research would need to be carried out for targeted spatial and temporal N additions at different levels in N-limited regions.
We have found that like atmospheric deposition, river supply of nitrogen is not only relevant for the coastal system but also for marine biology in the global ocean. But while atmospheric deposition provides only N, rivers also supply P to the ocean. Adding P in addition to N in the coastal oceans may change the response of the ecosystem, especially if N limitation is overcome. Tyrrell (1999) stated that nitrate is the “proximate limiting” nutrient in surface waters, the most limiting nutrient for instantaneous growth. Including phosphate, as the “ultimately limiting nutrient”, could change our story on longer timescales. Future research will therefore include model experiments with the combination of riverine nitrogen and phosphorus.
The model code we used and input and output data are available online at https://data.geomar.de/thredds/20.500.12085/59977a36-e8e7-4348-a4e8-2b13f3913590/catalog.html (Tivig et al., 2020). More information on the original NEWS 2 data set is available from the Global NEWS group at the website http://icr.ioc-unesco.org/index.php?option=com_content&view=article&id=45&Itemid=100002 (Mayorga and Seitzinger, 2010). Please email Emilio Mayorga at mayorga@marine.rutgers.edu to obtain this data set.
The supplement related to this article is available online at: https://doi.org/10.5194/bg-18-5327-2021-supplement.
MT developed the research concept in discussion with AO and DPK. DPK provided the initial model code, which was further developed, run, and analyzed by MT. MT analyzed the model output and visualized the results. MT wrote the manuscript with contributions from all co-authors.
The contact author has declared that neither they nor their co-authors have any competing interests.
The work reflects only the authors' view; the European Commission and their executive agency are not responsible for any use that may be made of the information the work contains.
Publisher’s note: Copernicus Publications remains neutral with regard to jurisdictional claims in published maps and institutional affiliations.
We gratefully acknowledge Emilio Mayorga, Sybil P. Seitzinger, and their co-authors for making their database of Global Nutrient Export from WaterSheds 2 (NEWS 2) available for our study. We would also thank GEOMAR's Biogeochemical Modelling group for many fruitful discussions.
We thank the two anonymous referees for their very helpful and constructive comments and suggestions.
This research has been supported by Horizon 2020 (grant nos. COMFORT (820989) and OceanNETs (869357)) and the Deutsche Forschungsgemeinschaft (grant no. SFB 754).
The article processing charges for this open-access publication were covered by the GEOMAR Helmholtz Centre for Ocean Research Kiel.
This paper was edited by Carolin Löscher and reviewed by two anonymous referees.
Altabet, M. A.: Constraints on oceanic N balance/imbalance from sedimentary 15N records, Biogeosciences, 4, 75–86, https://doi.org/10.5194/bg-4-75-2007, 2006. a
Bange, H., Naqvi, S., and Codispoti, L.: The nitrogen cycle in the Arabian Sea, Prog. Oceanogr., 65, 145–158, https://doi.org/10.1016/j.pocean.2005.03.002, 2005. a
Barron, C. and Duarte, C. M.: Dissolved organic carbon pools and export from the coastal ocean, Global Biogeochem. Cy., 29, 1725–1738, https://doi.org/10.1002/2014GB005056, 2015. a
Bauer, J. E., Cai, W. J., Raymond, P. A., Bianchi, T. S., Hopkinson, C. S., and Regnier, P. A. G.: The changing carbon cycle of the coastal ocean, Nature, 504, 61–70, https://doi.org/10.1038/nature12857, 2013. a
Behrenfeld, M. and Falkowski, P. G.: Photosynthetic rates derived from satellite-based chlorophyll concentrations, Limnol. Oceanogr., 42, 1–20, 1997. a, b
Behrenfeld, M. J., Boss, E., Siegel, D. A., and Shea, D. M.: Carbon-based ocean productivity and phytoplankton physiology from space, Global Biogeochem. Cyc., 19, GB1006, https://doi.org/10.1029/2004GB002299, 2005. a, b
Bernard, C. Y., Dürr, H. H., Heinze, C., Segschneider, J., and Maier-Reimer, E.: Contribution of riverine nutrients to the silicon biogeochemistry of the global ocean – a model study, Global Biogeochem. Cy., 8, 551–564, https://doi.org/10.5194/bg-8-551-2011, 2011. a
Beusen, A. H. W., Bouwman, A. F., Beek, L. P. H. V., Mogollon, J. M., and Middelburg, J. J.: Global riverine N and P transport to ocean increased during the 20th century despite increased retention along the aquatic continuum, Biogeosciences, 13, 2441–2451, https://doi.org/10.5194/bg-13-2441-2016, 2016. a
Billen, G. and Garnier, J.: River basin nutrient delivery to the coastal sea: Assessing its potential to sustain new production of non-siliceous algae, Mar. Chem., 106, 148–160, https://doi.org/10.1016/j.marchem.2006.12.017, 2007. a
Bohlen, L., Dale, A. W., and Wallmann, K.: Simple transfer functions for calculating benthic fixed nitrogen losses and C:N:P regeneration ratios in global biogeochemical models, Global Biogeochem. Cy., 26, GB3029, https://doi.org/10.1029/2011GB004198, 2012. a, b
Buitenhuis, E. T., Hashioka, T., and Quéré, C. L.: Combined constraints on global ocean primary production using observations and models, Global Biogeochem. Cy., 27, 847–858, https://doi.org/10.1002/gbc.20074, 2013. a, b
Capone, D. G., Zehr, J. P., Paerl, H. W., Bergmann, B., and Carpenter, E. J.: Trichodesmium, a globally significant marine cyanobacterium, Science, 276, 1221–1229, 1997. a, b
Carr, M.-E., Friedrichs, M. A. M., Schmeltz, M., Aita, M. N., Antoine, D., Arrigo, K. R., Asanuma, I., Aumont, O., Barber, R., Behrenfeld, M., Bidigare, R., Buitenhuis, E. T., Campbell, J., Ciotti, A., Dierssen, H., Dowell, M., Dunne, J., Esaias, W., Gentili, B., Gregg, W., Groom, S., Hoepffner, N., Ishizaka, J., Kameda, T., Quéré, C. L., Lohrenz, S., Marra, J., Mélin, F., Moore, K., Morel, A., Reddy, T. E., Ryan, J., Scardi, M., Smyth, T., Turpie, K., Tilstone, G., Waters, K., and Yamanaka, Y.: A comparison of global estimates of marine primary production from ocean color, Deep-Sea Res. Pt. II, 53, 741–770, https://doi.org/10.1016/j.dsr2.2006.01.028, 2006. a, b
Claussen, M., Mysak, L. A., Weaver, A. J., Crucifix, M., Fichefet, T., Loutre, M.-F., Weber, S., Alcamo, J., Alexeev, V., Berger, A., Calov, R., Ganopolski, A., Goosse, H., Lohmann, G., Lunkeit, F., Mokhov, I., Petoukhov, V., Stone, P., and Wang, Z.: Earth System Models of Intermediate Complexity: Closing the Gap in the Spectrum of Climate System Models, Clim. Dynam., 18, 579–586, https://doi.org/10.1007/s00382-001-0200-1, 2002. a, b
Codispoti, L. A.: Is the ocean losing nitrate?, Nature, 376, 724, 1995. a
Codispoti, L. A., Brandes, J. A., Christensen, J. P., Devol, A. H., Naqvi, S. A., Paerl, H. W., and Yoshinari, T.: The oceanic fixed nitrogen and nitrous oxide budgets: Moving targets as we enter the anthropocene?, Sci. Mar., 65, 85–105, 2001. a, b, c
Da Cunha, L., Buitenhuis, E., Le Quéré, C., Giraud, X., and Ludwig, W.: Potential impact of changes in river nutrient supply on global ocean biogeochemistry, Global Biogeochem. Cy., 521, GB4007, https://doi.org/10.1029/2006GB002718, 2007. a, b, c, d
DeMaster, D. J. and Pope, R. H.: Nutrient dynamics in Amazon shelf waters: results from AMASSEDS, Cont. Shelf Res., 16, 263–289, 1996. a
Deutsch, C., Gruber, N., Key, R. M., and Sarmiento, J. L.: Denitrification and N2 fixation in the Pacific Ocean, Global Biogeochem. Cy., 15, 483–506, 2001. a, b
Deutsch, C., Sarmiento, J. L., Sigman, D. M., Gruber, N., and Dunne, J. P.: Spatial coupling of nitrogen inputs and losses in the ocean, Nature, 445, 163–167, 2007. a, b, c, d, e, f
Dumont, E., Harrison, J. A., Kroeze, C., Bakker, E. J., and Seitzinger, S. P.: Impacts of Atmospheric Anthropogenic Nitrogen on the Open Ocean, Global Biogeochem. Cy., 19, GB4S02, https://doi.org/10.1029/2005GB002488, 2005. a, b
Eby, M., Zickfeld, K., Montenegro, A., Archer, D., Meissner, K. J., and Weaver, A. J.: Lifetime of Anthropogenic Climate Change: Millennial Time Scales of Potential CO2 and Surface Temperature Perturbations, J. Clim., 22, 2501–2511, https://doi.org/10.1175/2008JCLI2554.1, 2009. a, b, c
Eisele, A. and Kerimoglu, O.: MOSSCO River data basis – Riverine Nutrient inputs, Tech. rep., Helmholtz-Zentrum Geesthacht, available at: https://www.hzg.de/imperia/md/images/hzg/institut_fuer_kuestenforschung/kosystemmodellierung/kosystemmodellierung/riverine_nutrient_inputs.pdf (last access: 27 September 2021), 2015. a
Falkowski, P. G.: Evolution of the nitrogen cycle and its influence on the biological sequestration of CO2 in the ocean, Nature, 387, 272–275, https://doi.org/10.1038/387272a0, 1997. a
Galbraith, E. D., Gnanadesikan, A., Dunne, J. P., and Hiscock, M. R.: Regional impacts of iron-light colimitation in a global biogeochemical model, Biogeosciences, 7, 1043–1064, https://doi.org/10.5194/bg-7-1043-2010, 2010. a
Galloway, J. N., Dentener, F., Capone, D., Boyer, E., Howarth, R., Seitzinger, S., Asner, G., Cleveland, C., Green, P., Holland, E., Karl, D., Michaels, A., Porter, J., Townsend, A., and Vörösmarty, C.: Nitrogen cycles: past, present, and future, Biogeochemistry, 70, 153–226, https://doi.org/10.1007/s10533-004-0370-0, 2004. a, b
Garcia, H. E., Weathers, K., Paver, C. R., Smolyar, I., Boyer, T. P., Locarnini, R. A., Zweng, M. M., Mishonov, A. V., Baranova, O. K., Seidov, D., and Reagan, J. R.: Dissolved Inorganic Nutrients (phosphate, nitrate and nitrate+nitrite, silicate), in: World Ocean Atlas 2018, edited by: Editor, A. M. T., NOAA Atlas NESDIS 84, Vol. 4, 35 pp., available at: https://www.ncei.noaa.gov/data/oceans/woa/WOA18/DOC/woa18_vol4.pdf (last access: 27 September 2021), 2019. a, b
Giraud, X., Quéré, C. L., and da Cunha, L. C.: Importance of coastal nutrient supply for global ocean biogeochemistry, Global Biogeochem. Cy., 22, GB2025, https://doi.org/10.1029/2006GB002717, 2008. a, b, c
Gruber, N.: The Dynamics of the Marine Nitrogen Cycle and its Influence on Atmospheric CO2 Variations, in: The Ocean Carbon Cycle and Climate, edited by: Follows, M. and Oguz, T., Springer Netherlands, Dordrecht, 97–148, https://doi.org/10.1007/978-1-4020-2087-2_4, 2004. a, b, c, d, e, f, g, h
Gruber, N. and Sarmiento, J. L.: Global patterns of marine nitrogen fixation and denitrification, Global Biogeochem. Cy., 11, 235–266, https://doi.org/10.1029/97GB00077, 1997. a
Harrison, D. P.: Global negative emissions capacity of ocean macronutrient fertilization, Environ. Res. Lett., 12, 035001, https://doi.org/10.1088/1748-9326/aa5ef5, 2017. a, b
Holmes, R. M., McClelland, J. W., Peterson, B. J., Tank, S. E., Bulygina, E., Eglinton, T. I., Gordeev, V. V., Gurtovaya, T. Y., Raymond, P. A., Repeta, D. J., Staples, R., Striegl, R. G., Zhulidov, A. V., and Zimov, S. A.: Seasonal and Annual Fluxes of Nutrients and Organic Matter from Large Rivers to the Arctic Ocean and Surrounding Seas, Estuar. Coast., 35, 369–382, https://doi.org/10.1007/s12237-011-9386-6, 2012. a
Izett, J. G. and Fennel, K.: Estimating the Cross-Shelf Export of Riverine Materials: Part 1. General Relationships From an Idealized Numerical Model, Global Biogeochem. Cy., 32, 160–175, https://doi.org/10.1002/ 2017GB005667, 2018. a
Jahnke, R. A.: Global Synthesis, in: Carbon and Nutrient Fluxes in Continental Margins, Global Change – The IGBP Series, edited by: Liu, K., Atkinson, L., Quiñones, R., and Talaue-McManus, L., Springer, Berlin, Heidelberg, https://doi.org/10.1007/978-3-540-92735-8-16, 2010. a
Johnson, K. S., Riser, S. C., and Ravichandran, M.: Oxygen Variability Controls Denitrification in the Bay of Bengal Oxygen Minimum Zone, Geophys. Res. Lett., 46, 804–811, https://doi.org/10.1029/2018GL079881, 2019. a, b
Karl, D., Letelier, R., Tupas, L., Dore, J., Christian, J., and Hebel, D.: The role of nitrogen fixation in biogeochemical cycling in the subtropical North Pacific Ocean, Nature, 388, 533–539, 1997. a
Karl, D., Micheals, A., B.Bergman, Capone, D., Carpenter, E., Letelier, R., Lipschultz, F., Paerl, H., Sigman, D., and Stal, L.: Dinitrogen fixation in the world’s oceans, Biogeochemistry, 57/58, 47–98, 2002. a
Keller, D. P., Oschlies, A., and Eby, M.: A new marine ecosystem model for the University of Victoria Earth System Climate Model, Geosci.c Model Dev., 5, 1195–1220, https://doi.org/10.5194/gmd-5-1195-2012, 2012. a, b, c, d, e, f, g, h, i, j, k, l, m
Lacroix, F., Ilyina, T., and Hartmann, J.: Oceanic CO2 outgassing and biological production hotspots induced by pre-industrial river loads of nutrients and carbon in a global modeling approach, Biogeosciences, 17, 55–88, https://doi.org/10.5194/bg-17-55-2020, 2020. a, b, c, d, e, f, g, h, i, j, k
Lamarque, J. F., Dentener, F., McConell, J., Ro, C.-U., Shaw, M., Vet, R., Bergmann, D., Cameron-Smith, P., Dalsoren, S., Doherty, R., Faluvegi, G., Ghan, S. J., Lee, Y. H., MacKenzie, I. A., Plummer, D., Shindell, D. T., Skeie, R. B., Stevenson, D. S., Strode, S., Zeng, G., Curran, M., Dahl-Jensen, D., Das, S., Fritzsche, D., and Nolan, M.: Multi-model mean nitrogen and sulfur deposition from the Atmospheric Chemistry and Climate Model Intercomparison Project (ACCMIP): evaluation of historical and projected future changes, Atmos. Chem. Phys., 13, 7997–8018, https://doi.org/0.5194/acp-13-7997-2013, 2013. a
Landolfi, A., Dietze, H., Koeve, W., and Oschlies, A.: Overlooked runaway feedback in the marine nitrogen cycle: the vicious cycle, Biogeosciences, 10, 1351–1363, https://doi.org/10.5194/bg-10-1351-2013, 2013. a, b, c, d, e
Landolfi, A., Somes, C. J., Koeve, W., Zamora, L. M., and Oschlies, A.: Oceanic nitrogen cycling and N2O flux perturbations in the Anthropocene, Global Biogeochem. Cy., 31, 1236–1255, https://doi.org/10.1002/2017GB005633, 2017. a, b, c, d, e, f
Landolfi, A., Kähler, P., Koeve, W., and Oschlies, A.: Global Marine N2 Fixation Estimates: From Observations to Models, Front. Microbiol., 9, 2112, https://doi.org/10.3389/fmicb.2018.02112, 2018. a, b
Landolfi, A., Prowe, A. E. F., Pahlow, M., Somes, C. J., Chien, C.-T., Schartau, M., Koeve, W., and Oschlies, A.: Can Top-Down Controls Expand the Ecological Niche of Marine N2 Fixers?, Front. Microbiol., 12, 690200, https://doi.org/10.3389/fmicb.2021.690200, 2021. a
Lu, F.-H., Niab, H.-G., Liu, F., and Y.Zeng, E.: Occurrence of nutrients in riverine runoff of the Pearl River Delta, South China, J. Hydrol., 376, 107–115, https://doi.org/10.1016/j.jhydrol.2009.07.018, 2009. a
Lu, X., Li, S., He, M., Zhou, Y., Bei, R., Li, L., and Ziegler, A. D.: Seasonal changes of nutrient fluxes in the Upper Changjiang basin: An example of the Longchuanjiang River, China, J. Hydrol., 205, 344–351, https://doi.org/10.1016/j.jhydrol.2011.05.032, 2011. a
Luo, Y.-W., Doney, S. C., Anderson, L. A., Benavides, M., Berman-Frank, I., Bode, A., Bonnet, S., Boström, K. H., Böttjer, D., Capone, D. G., Carpenter, E. J., Chen, Y. L., Church, M. J., Dore, J. E., Falcón, L. I., Fernández, A., Foster, R. A., Furuya, K., Gómez, F., Gundersen, K., Hynes, A. M., Karl, D. M., Kitajima, S., Langlois, R. J., LaRoche, J., Letelier, R. M., Marañón, E., McGillicuddy Jr., D. J., Moisander, P. H., Moore, C. M., Mouriño Carballido, B., Mulholland, M. R., Needoba, J. A., Orcutt, K. M., Poulton, A. J., Rahav, E., Raimbault, P., Rees, A. P., Riemann, L., Shiozaki, T., Subramaniam, A., Tyrrell, T., Turk-Kubo, K. A., Varela, M., Villareal, T. A., Webb, E. A., White, A. E., Wu, J., and Zehr, J. P.: Database of diazotrophs in global ocean: abundance, biomass and nitrogen fixation rates, Earth Syst. Sci. Data, 4, 47–73, https://doi.org/10.5194/essd-4-47-2012, 2012. a, b
Mayorga, E., Seitzinger, S. P., Harrison, J. A., Dumont, E., Beusen, A. H. W., Bouwman, A., Fekete, B. M., Kroeze, C., and van Drecht, G.: Global Nutrient Export fromWaterSheds 2 (NEWS 2): Model development and implementation, Environ. Model. Softw., 25, 837–853, https://doi.org/10.1016/j.envsoft.2010.01.007, 2010. a, b, c, d, e, f, g
Mayorga, E. and Seitzinger, S.: Global Nutrient Export from WaterSheds (NEWS2), Integrated Coastel Research [data set], available at: http://icr.ioc-unesco.org/index.php?option=com_content&view=article&id=49&Itemid=100008 (last access: 27 September 2021), 2010. a
Meybeck, M., Dürr, H. H., and Vörösmarty, C. J.: Global coastal segmentation and its river catchment contributors: A new look at land-ocean linkage, Global Biogeochem. Cy., 20, GB1S90, https://doi.org/10.1029/2005GB002540, 2006. a
Moore, J. K. and Doney, S. C.: Iron availability limits the ocean nitrogen inventory stabilizing feedbacks between marine denitrification and nitrogen fixation, Global Biogeochem. Cy., 21, GB2001, https://doi.org/10.1029/2006GB002762, 2007. a
Partanen, A.-I., Keller, D. P., Korhonen, H., and Matthews, H. D.: Nutrient-enhanced productivity in the northern Gulf of Mexico: past, present and future, Geophys. Res. Lett., 43, 7600–7608, https://doi.org/10.1002/2016GL070111, 2016. a
Redfield, A. C., Ketchum, B. H., and Richards, F. A.: The Influence of Organisms on the Composition of Sea-Water, in: The Sea, Vol. 2, edited by: Hill, M. N., Interscience, New York, 26–27, 1963. a, b
Ruttenberg, K. C.: The Global Phosphorus Cycle, in: Treatise on Geochemistry, edited by: Schlesinger, W., Elsevier, University of Hawaii at Manoa, Honolulu, HI, USA, https://doi.org/10.1016/B0-08-043751-6/08153-6, 2003. a
Schmittner, A., Oschlies, A., Giraud, X., Eby, M., and Simmons, H. L.: A global model of the marine ecosystem for long-term simulations: Sensitivity to ocean mixing buoyancy forcing, particle sinking, and dissolved organic matter cycling, Global Biogeochem. Cy., 19, GB3004, https://doi.org/10.1029/2004GB002283, 2005. a
Schmittner, A., Oschlies, A., Matthews, H. D., and Galbraith, E. D.: Future changes in climate, ocean circulation, ecosystems, and biogeochemical cycling simulated for a business-as-usual CO2 emission scenario until year 4000 AD, Global Biogeochem. Cy., 22, GB1013, https://doi.org/10.1029/2007GB002953, 2008. a
Seitzinger, S. P., Harrison, J. A., Dumont, E., Beusen, A. H. W., and Bouwman, A. F.: Sources and delivery of carbon, nitrogen, and phosphorus to the coastal zone: An overview of Global Nutrient Export from Watersheds (NEWS) models and their application, Global Biogeochem. Cy., 19, GB4S01, https://doi.org/10.1029/2005GB002606, 2005. a, b
Seitzinger, S. P., Mayorga, E., Bouwman, A. F., Kroeze, C., Beusen, A. H. W., Billen, G., Drecht, G. V., Dumont, E., Fekete, B. M., Garnier, J., and Harrison, J. A.: Global river nutrient export: A scenario analysis of past and future trends, Global Biogeochem. Cy., 24, GB0A08, https://doi.org/10.1029/2009GB003587, 2010. a
Sharples, J., Middelburg, J. J., Fennel, K., and Jickells, T. D.: What proportion of riverine nutrients reaches the open ocean?, Global Biogeochem. Cy., 31, 39–58, https://doi.org/10.1002/ 2016GB005483, 2017. a
Sigleo, A. C. and Frick, W. E.: Seasonal variations in river discharge and nutrient export to a Northeastern Pacific estuary, Estuarine, Coast. Shelf Sci., 73, 368–378, https://doi.org/10.1016/j.ecss.2007.01.015, 2007. a
Smith, S. V., Swaney, D. P., Talaue-McManus, L., Bartley, J. D., Sandhei, P. T., McLaughlin, C. J., Dupra, V. C., Crossland, C. J., Buddemeier, R. W., Maxwell, B. A., and Wulff, F.: Humans, Hydrology, and the Distribution of Inorganic Nutrient Loading to the Ocean, BioScience, 53-3, 235–245, 2003. a
Sohm, J. A., Webb, E. A., and Capone, D. G.: Emerging patterns of marine nitrogen fixation, Nat. Rev. Microbiol., 9, 499–508, https://doi.org/10.1038/nrmicro2594, 2011. a
Somes, C. J. and Oschlies, A.: On the influence of “non-Redfield” dissolved organic nutrient dynamics on the spatial distribution of N2 fixation and the size of the marine fixed nitrogen inventory, Global Biogeochem. Cy., 29, 973–993, https://doi.org/10.1002/2014GB005050, 2015. a
Somes, C. J., Schmittner, A., Galbraith, E. D., Lehmann, M. F., Altabet, M. A., Montoya, J. P., Letelier, R. M., Mix, A. C., Bourbonnais, A., and Eby, M.: Simulating the global distribution of nitrogen isotopes in the ocean, Global Biogeochem. Cy., 24, GB4019, https://doi.org/10.1029/2009GB003767, 2010b. a, b
Somes, C. J., Oschlies, A., and Schmittner, A.: Isotopic constraints on the pre-industrial oceanic nitrogen budget, Biogeosciences, 10, 5889–5910, https://doi.org/10.5194/bg-10-5889-2013, 2013. a, b, c, d, e, f, g, h
Somes, C. J., Landolfi, A., Koeve, W., and Oschlies, A.: Simulating the global distribution of nitrogen isotopes in the ocean, Geophys. Res. Lett., 43, 4500–4509, https://doi.org/10.1002/2016GL068335, 2016. a, b, c, d, e, f, g, h, i
Séférian, R., Berthet, S., Yool, A., Palmiéri, J., Bopp, L., Tagliabue, A., Kwiatkowski, L., Aumont, O., Christian, J., Dunne, J., Gehlen, M., Ilyina, T., John, J. G., Li, H., Long, M. C., Luo, J. Y., Nakano, H., Romanou, A., Schwinger, J., Stock, C., Santana-Falcón, Y., Takano, Y., Tjiputra, J., Tsujino, H., Watanabe, M., Wu, T., Wu, F., and Yamamoto, A.: Tracking Improvement in Simulated Marine Biogeochemistry Between CMIP5 and CMIP6, Curr. Clim. Change Rep., 6, 95–119, https://doi.org/10.1007/s40641-020-00160-0, 2020. a, b
Tivig, M., Keller, D. P., and Oschlies, A.: Supplement Data to “Feedbacks in the marine nitrogen cycle limit the impact of riverine nitrogen supply on global marine biology and biogeochemistry in an Earth System Model”, GEOMAR [data set], https://data.geomar.de/thredds/20.500.12085/59977a36-e8e7-4348-a4e8-2b13f3913590/catalog.html (last access: 27 September 2021), 2020. a
Townsend-Small, A., McClelland, J. W., Holmes, R. M., and Peterson, B. J.: Seasonal and hydrologic drivers of dissolved organic matter and nutrients in the upper Kuparuk River, Alaskan Arctic, Biogeochemistry, 103, 109–124, https://doi.org/10.07/s10533-010-9451-4, 2011. a
Turner, R. E., Rabelais, N. N., Justic, D., and Dortch, Q.: Global patterns of dissolved N, P and Si in large rivers, Biogeochemistry, 64, 297–317, https://doi.org/10.1023/A:1024960007569, 2003. a
Tyrrell, T.: The relative influences of nitrogen and phosphorus on oceanic primary production, Nature, 400, 525–531, 1999. a, b, c, d
Voss, M., Bange, H. W., Dippner, J. W., Middelburg, J. J., Montoya, J. P., and Ward, B.: The marine nitrogen cycle: recent discoveries, uncertainties and the potential relevance of climate change, Philos. T. R. Soc. B, 368, 20130121, https://doi.org/10.1098/rstb.2013.0121, 2013. a
Wang, W.-L., Moore, J. K., Martiny, A. C., and Primeau, F. W.: Convergent estimates of marine nitrogen fixation, Nature, 566, 205–211, https://doi.org/10.1038/s41586-019-0911-2, 2019. a, b
Weaver, A. J., Eby, M., Wiebe, E. C., Bitz, C., Duffy, P. B., Ewen, T. L., Fanning, A. F., Holland, M. M., MacFadyen, A., Matthews, H. D., Meissner, K. J., Saenko, O., Schmittner, A., Wang, H., and Yoshimori, M.: The UVic Earth System Climate Model: Model Description, Climatology, and Applications to Past, Present and Future Climates, Atmos.-Ocean, 39, 361–428, https://doi.org/10.1080/07055900.2001.9649686, 2001. a, b, c, d
Westberry, T., Behrenfeld, M. J., Siegel, D. A., and Boss, E.: Carbon-based primary production modeling with vertically resolved photoacclimation, Global Biogeochem. Cy., 22, GB2024, https://doi.org/10.1029/2007GB003078, 2008. a, b