the Creative Commons Attribution 4.0 License.
the Creative Commons Attribution 4.0 License.
 | 04 Oct 2021
Validation of a coupled δ2Hn-alkane–δ18Osugar paleohygrometer approach based on a climate chamber experiment
Johannes Hepp
Christoph Mayr
Kazimierz Rozanski
Imke Kathrin Schäfer
Mario Tuthorn
Bruno Glaser
Dieter Juchelka
Willibald Stichler
Roland Zech
Michael Zech
The hydrogen isotope composition of leaf-wax-derived biomarkers, e.g., long-chain n-alkanes (δ2Hn-alkane), is widely applied in paleoclimate. However, a direct reconstruction of the isotope composition of source water based on δ2Hn-alkane alone is challenging due to the enrichment of heavy isotopes during evaporation. The coupling of δ2Hn-alkane with δ18O of hemicellulose-derived sugars (δ18Osugar) has the potential to disentangle this limitation and additionally to allow relative humidity reconstructions. Here, we present δ2Hn-alkane as well as δ18Osugar results obtained from leaves of Eucalyptus globulus, Vicia faba, and Brassica oleracea, which grew under controlled conditions. We addressed the questions of (i) whether δ2Hn-alkane and δ18Osugar values allow reconstructions of leaf water isotope composition, (ii) how accurately the reconstructed leaf water isotope composition enables relative humidity (RH) reconstruction, and (iii) whether the coupling of δ2Hn-alkane and δ18Osugar enables a robust source water calculation.
For all investigated species, the n-alkane n-C29 was most abundant and therefore used for compound-specific δ2H measurements. For Vicia faba, additionally the δ2H values of n-C31 could be evaluated robustly. Regarding hemicellulose-derived monosaccharides, arabinose and xylose were most abundant, and their δ18O values were therefore used to calculate weighted mean leaf δ18Osugar values. Both δ2Hn-alkane and δ18Osugar yielded significant correlations with δ2Hleaf water and δ18Oleaf water, respectively (r2=0.45 and 0.85, respectively; p<0.001, n=24). Mean fractionation factors between biomarkers and leaf water were found to be −156 ‰ (ranging from −133 ‰ to −192 ‰) for and +27.3 ‰ (ranging from +23.0 ‰ to 32.3 ‰) for , respectively. Modeled RHair values from a Craig–Gordon model using measured Tair, δ2Hleaf water and δ18Oleaf water as input correlate highly significantly with modeled RHair values (R2=0.84, p<0.001, RMSE = 6 %). When coupling δ2Hn-alkane and δ18Osugar values, the correlation of modeled RHair values with measured RHair values is weaker but still highly significant, with R2=0.54 (p<0.001, RMSE = 10 %). Finally, the reconstructed source water isotope composition (δ2Hs and δ18Os) as calculated from our coupled approach matches the source water in the climate chamber experiment (δ2Htank water and δ18Otank water). This highlights the great potential of the coupled δ2Hn-alkane–δ18Osugar paleohygrometer approach for paleoclimate and relative humidity reconstructions.
- Article
(2050 KB) - Full-text XML
-
Supplement
(1704 KB) - BibTeX
- EndNote


Leaf-wax-derived biomarkers such as long-chain n-alkanes and their stable hydrogen isotope composition (δ2Hn-alkane) are widely applied in paleoclimatology. Sedimentary δ2Hn-alkane values correlate with δ2H of precipitation (Huang et al., 2004; Mügler et al., 2008; Sachse et al., 2004; Sauer et al., 2001), confirming the high potential of δ2Hn-alkane to establish δ2H records of past precipitation (Hou et al., 2008; Rao et al., 2009; Sachse et al., 2012). However, this interpretation is challenged by heavy-isotope enrichment during evapotranspiration (e.g., Zech et al., 2015). Apart from studies of sedimentary cellulose (Heyng et al., 2014; Wissel et al., 2008), the oxygen stable isotope composition of sugar biomarkers (δ18Osugar) emerged as a complementary paleoclimate proxy during the last decade (Hepp et al., 2015, 2017; Zech et al., 2013a, 2014a; Zech and Glaser, 2009). The interpretation of the δ18Osugar values is comparable to those of δ2Hn-alkane. When sugars originate primarily from leaf biomass of higher terrestrial plants, they reflect the plant source water (which is often directly linked to the local precipitation) modified by evapotranspirative enrichment of the leaf water (Tuthorn et al., 2014; Zech et al., 2014a). The coupling of δ2Hn-alkane with δ18Osugar values allows the quantification of the leaf water isotope enrichment and relative air humidity (Zech et al., 2013a). This approach was validated by Tuthorn et al. (2015) by applying it to topsoil samples along a climate transect in Argentina. Accordingly, the biomarker-derived relative air humidity values correlate significantly with actual relative air humidity, highlighting the potential of the δ2Hn-alkane–δ18Osugar paleohygrometer approach.
The coupled approach is based on the observation that the isotope signature of precipitation (δ2Hprecpitation and δ18Oprecpitation) typically plots near the global meteoric water line (GMWL) in a two-dimensional δ2H–δ18O diagram. The GMWL is characterized by the equation δ2HOprecipitation+10 (Craig, 1961; Dansgaard, 1964). In many cases, the local precipitation is directly linked to the source water of plants, which is indeed soil water and shallow groundwater. The isotope composition of xylem water readily reflects these sources (e.g., Dawson, 1993). However, leaf-derived biomarkers reflect the leaf water isotope composition, which is, unlike xylem water, prone to evapotranspiration (e.g., Barbour and Farquhar, 2000; Helliker and Ehleringer, 2002a; Cernusak et al., 2003; Barbour et al., 2004; Cernusak et al., 2005; Feakins and Sessions, 2010; Kahmen et al., 2011; Sachse et al., 2012; Kahmen et al., 2013; Tipple et al., 2013; Lehmann et al., 2017; Liu et al., 2017). During daytime, the leaf water is typically enriched in the heavy isotopes compared to the source water because of evapotranspiration through stomata. Thereby, lighter water isotopes evaporate preferentially, which leads to gradual enrichment of heavier isotopes compared to precipitation. The degree of enrichment by evapotranspiration is mainly controlled by the relative air humidity (RHair) in the direct surroundings of the plant leaves (e.g., Cernusak et al., 2016). Although the biomarkers reflect the isotope composition of leaf water, there is still a modification of its isotope signature by fractionation during biosynthesis, leading to an offset between leaf water and biomarker isotope compositions. In case the biosynthetic fractionation is known and constant, RHair can be calculated from coupling δ2Hn-alkane with δ18Osugar values.
First applications of this approach for paleoclimatic reconstruction (Hepp et al., 2017, 2019; Zech et al., 2013a) and climate transect validation studies (Hepp et al., 2020; Lemma et al., 2021; Strobel et al., 2020; Tuthorn et al., 2015) revealed promising results. Furthermore, the stability of the biomarker isotope signals during degradation was studied (Zech et al., 2011, 2012). In brief, n-alkanes and sugars can be extracted compound-specifically from plants, soils and a wide range of different sediments retaining the isotope signal of intact plant tissues.
The overall aim of this study is to evaluate the δ2Hn-alkane–δ18Osugar paleohygrometer approach by applying it to plant leaf material from three different plants grown in a climate chamber experiment under controlled conditions. More specifically, we addressed the following questions.
- i.
Which n-alkanes and monosaccharides can be used to obtain δ2Hn-alkane and δ18Osugar results of the leaves grown in our climate chamber experiment, respectively?
- ii.
How precisely do δ2Hn-alkane and δ18Osugar values allow the reconstruction of δ2Hleaf water and δ18Oleaf water, respectively?
- iii.
How accurately does the leaf water isotope composition reflect RHair?
- iv.
Does the coupling of δ2Hn-alkane and δ18Osugar enable an RHair reconstruction?
- v.
How robust are source water calculations?
2.1 Climate chamber experiment
A phytotron experiment was conducted at the Helmholtz Zentrum München in Neuherberg during winter 2000/2001 (Mayr, 2002). Three different dicotyledon plant species (Eucalyptus globulus, Vicia faba var. minor and Brassica oleracea var. medullosa) were grown in eight chambers for 56 d under seven distinct climatic conditions (same conditions in chambers 4 and 8). All three species belong to C3 plants and were primarily chosen because they are different in terms of morphology and physiology. Two of the species are herbaceous (Vicia faba var. minor and Brassica oleracea var. medullosa), while Eucalyptus globulus is a lignifying tree. Nevertheless, all three species form a stem. The different habitus of the three plants allows us to check for inter-species differences in isotope fractionation (Mayr, 2002). Similar isotope patterns in the three plants could allow the generalization of our results for a wide range of C3 plants, independent of their habitus. An additional, equally important criterion for the choice of the plants was the resilience of the taxa to the experimental climatic conditions and sufficient growth during the experiments. Air temperature (Tair) was set to 14, 18, 24 and 30 ∘C and RHair to around 20 %, 30 %, 50 %, and 70 % during the daytime of constant climate conditions (between 11:00 and 16:00 CET) (Fig. 1). During the rest of the day diurnal variations typical for natural conditions were aimed for (for more details see Mayr, 2002).
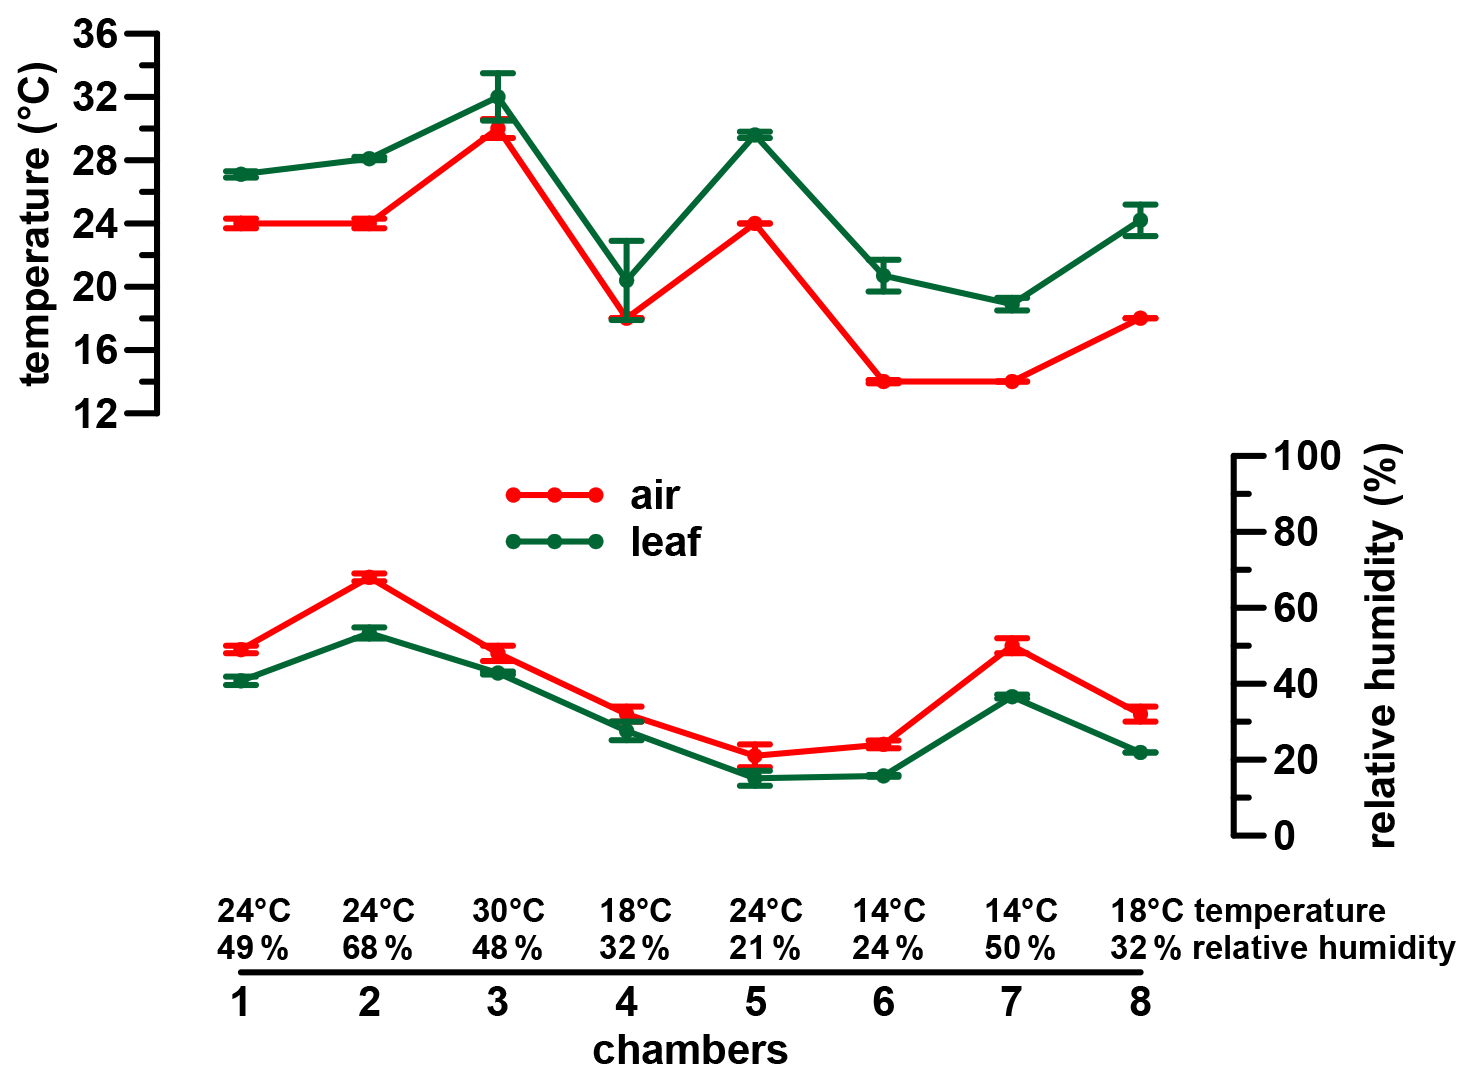
Figure 1Climate chamber conditions. Error bars represent analytical standard deviation of the respective measurements. For more details see Sect. 2.2 and Mayr (2002).
The chambers had a high fresh air supply rate (750 m3 h−1), therefore avoiding an evaporative isotope enrichment in the chambers. Furthermore, uniform irrigation conditions were guaranteed via an automatic irrigation system, which was controlled by tensiometers installed at 9 cm substrate depth. The tank water used for irrigation was sampled periodically (intervals of 1 to 3 d) over the whole experiment and revealed only minor variability in its isotope composition (δ18O ‰ standard deviation (σ), δ2H ‰ σ). Once a week, soil water (via ceramic cups at 13 cm soil depth) and atmospheric water vapor (via dry ice condensation traps) were sampled (δ2Hsoil water, δ18Osoil water and δ2Hatmospheric water vapor, δ18Oatmospheric water vapor). Additionally, leaf temperature (Tleaf) was calculated from gas exchange measurements at least once a week (Mayr, 2002).
In order to analyze stable hydrogen and oxygen isotope composition of leaf (δ2Hleaf water, δ18Oleaf water) and stem water, the plants were harvested at the end of the experiment. The vacuum distillation method was used for the extraction of the plant water. It should be noted that stem water is a mixture between phloem and xylem water. Only the latter reflects the isotope composition of soil water. For simplification, stem water is referred to as xylem water in the following (δ2Hxylem water, δ18Oxylem water).
For more details about the experiment, the (plant) water isotope results and gas exchange measurements we refer to the original publication (Mayr, 2002).
2.2 Leaf biomarker extraction and compound-specific stable isotope analysis
A total of 24 leaf samples were prepared according to Schäfer et al. (2016) for compound-specific δ2H measurements of n-alkanes at the Institute of Geography, Group of Biogeochemistry and Paleoclimate, University of Bern. Microwave extraction with 15 mL dichloromethane (DCM) methanol (MeOH) at a ratio of 9 : 1 (v : v) at 100 ∘C for 1 h was conducted. The resulting total lipid extracts were purified and separated using aminopropyl silica gel (Supelco, 45 µm) pipette columns. The hydrocarbon fractions (containing n-alkanes) were eluted with n-hexane and cleaned via silver-nitrate-coated silica gel pipettes (Supelco, 60–200 mesh) and zeolite (Geokleen Ltd.) columns. The δ2H measurements of the dominant n-alkanes (n-C29 and n-C31) were performed on a GC–2H-pyrolysis–IRMS system, consisting of an Agilent 7890A gas chromatograph (GC) coupled to an IsoPrime 100 isotope ratio mass spectrometer (IRMS) via a GC5 pyrolysis–combustion interface operating in pyrolysis mode with a Cr (ChromeHD) reactor at 1000 ∘C. The compound-specific δ2H values were calibrated against a standard alkane mix (n-C27, n-C29, n-C33) with known isotope composition (Arndt Schimmelmann, University of Indiana, personal communication, 2008), measured twice every six sample injections. Standard deviation of the triplicate measurements was typically ≤ 5 ‰. The H3+ factor stayed constant during the measurements.
Additionally, the leaf samples were dried and finely ground in preparation for δ18O analysis of hemicellulose-derived sugars (modified from Zech and Glaser, 2009) at the Institute of Agricultural and Nutritional Sciences, Soil Biogeochemistry, Martin Luther University of Halle–Wittenberg. The hemicellulose sugars were hydrolytically extracted for 4 h at 105 ∘C using 4M trifluoroacetic acid (Amelung et al., 1996) and purified via XAD-7 and Dowex 50WX8 columns. Prior to the methylboronic acid (MBA) derivatization (4 mg of MBA in 400 µL dry pyridine for 1 h at 60 ∘C), the cleaned sugars were frozen and freeze-dried overnight (Gross and Glaser, 2004; Knapp, 1979). Compound-specific δ18O measurements were performed on a Trace GC 2000 coupled to a Delta V Advantage IRMS via an 18O-pyrolysis reactor (GC IsoLink) and a ConFlo IV interface (all devices from Thermo Fisher Scientific, Bremen, Germany). The sample batches were measured along with embedded co-derivatized standard batches, which contained arabinose, fucose, xylose and rhamnose in different concentrations of known δ18O value. The δ18O values of the standard sugars were determined via temperature conversion–elemental analysis–IRMS coupling at the Institute of Plant Sciences, ETH Zurich, Switzerland (Zech and Glaser, 2009). This procedure allows corrections for possible amount dependencies (Zech and Glaser, 2009) and ensures the “principle of identical treatment” (Werner and Brand, 2001). Standard deviations for the triplicate measurements were 0.9 ‰ and 2.2 ‰ (average over all investigated samples) for arabinose and xylose, respectively. We focus on arabinose and xylose in this study because they were (i) the dominant peaks in all chromatograms and (ii) previously found to strongly predominate over fucose (and rhamnose) in terrestrial plants and soils (Hepp et al., 2016).
All δ values are expressed in per mille as isotope ratios ( or ) relative to the Vienna Standard Mean Ocean Water (VSMOW) standard in the common delta notation (; e.g., Coplen, 2011).
2.3 Framework for coupling δ2Hn-alkane with δ18Osugar results
2.3.1 Deuterium excess of leaf water and relative humidity
The coupled approach is based on the observation that isotope composition of global precipitation plots typically close to the GMWL (δ2HOprecipitation+10 ‰; Craig, 1961; Fig. 4). The soil water and shallow groundwater, which acts as source water for plants, can often directly be related to the local precipitation. However, especially during daytime, leaf water is typically enriched in heavy isotopes compared to the precipitation due to evapotranspiration through the stomata, therefore plotting to the right of the GMWL (Fig. 4; e.g., Allison et al., 1985; Bariac et al., 1994; Walker and Brunel, 1990). Under natural climatic conditions, the leaf water reservoir at the evaporative sites is frequently assumed to be in an isotope steady state (Allison et al., 1985; Bariac et al., 1994; Gat et al., 2007; Walker and Brunel, 1990), meaning that isotope composition of transpired water vapor is equal to the isotope composition of the source water utilized by plants during the evapotranspiration process. The Craig–Gordon model (e.g., Flanagan et al., 1991; Roden and Ehleringer, 1999) approximates the isotope processes in leaf water in δ terms (e.g., Barbour et al., 2004):
where δe, δs and δa are the hydrogen and oxygen isotope compositions of leaf water at the evaporative sites, source water and atmospheric water vapor, respectively. The equilibrium enrichment (ε*) is expressed as () × 103, where is the equilibrium fractionation between liquid and vapor in per mille. The kinetic fractionation parameter (εk) describes the water vapor diffusion from intracellular air space through the stomata and the boundary layer into to the atmosphere, and is the ratio of the atmospheric to intracellular vapor pressure.
In a δ2H–δ18O diagram, the isotope composition of the leaf water as well as the source water can be described as deuterium excess (d) values by using the equation of Dansgaard (1964), with O. This allows Eq. (1), in which hydrogen and oxygen isotopes have to be handled in separate equations, to be rewritten as one equation:
where de, ds and da are the deuterium excess values of leaf water at evaporative sites, source water and atmospheric water vapor, respectively. The kinetic fractionation (εk) is typically related to stomata and boundary layer resistances to water flux (Farquhar et al., 1989). We used the kinetic enrichment factor (Ck) instead of εk to be close to paleostudies where direct measurements of plant physiology are not possible. The kinetic enrichment factor is derived from a more generalized form of the Craig–Gordon model for describing the kinetic isotope enrichment for 2H and 18O ( and , respectively) (Craig and Gordon, 1965; Gat and Bowser, 1991). If the plant source water and the local atmospheric water vapor are in isotope equilibrium, the term δa−δs in Eq. (1) can be approximated by . Thus, Eq. (2) can be reduced to
The actual atmospheric vapor pressure (ea) and the leaf vapor pressure (ei) in kilopascals can be derived from Eqs. (4) and (5) by using Tair (Buck, 1981):
When ei is calculated as in Eq. (5), represents RHair (ranging between 0 and 1, representing 0 % to 100 % relative humidity). We are aware that the Craig–Gordon model would require Tleaf values for calculating ei values. However, the RH reconstruction methodological framework presented is attempted for paleostudies for which the Tleaf parameter is probably rather difficult to achieve. However, as can be seen in Fig. 1, leaf temperature is very close to air temperature.
With rearranging Eq. (3), an equation is given to derive relative humidity values (Eq. 6):
Equilibrium fractionation parameters ( and ) can be calculated from empirical equations of Horita and Wesolowski (1994) by using the climate chamber Tair values. The kinetic fractionation parameters ( and ) for 2H and 18O, respectively, are set to 25.1 ‰ and 28.5 ‰ according to Merlivat (1978), who reported maximum values during the molecular diffusion process of water through a stagnant boundary layer. When using supplementary data of Cernusak et al. (2016), εk values of broadleaf trees and shrubs over broad climatic conditions can be calculated and are well in the range with the used and values (23.9±0.9 ‰ and 26.7 ± 1.0 ‰ for and , respectively).
If δ2Hleaf water and δ18Oleaf water can be reconstructed from the measured δ values of n-alkane and sugar biomarkers, this framework provides a powerful tool to establish relative humidity records from sedimentary archives (Hepp et al., 2017; Zech et al., 2013a).
To reconstruct the isotope composition of leaf water it is assumed that fractionation factors of −160 ‰ for 2H of alkanes n-C29 and n-C31 (; Sachse et al., 2012; Sessions et al., 1999) and +27 ‰ for 18O of the hemicellulose-derived sugars arabinose and xylose (; Cernusak et al., 2003; Schmidt et al., 2001; Sternberg et al., 1986; Yakir and DeNiro, 1990) can be applied:
2.3.2 Isotope composition of plant source water
In a δ2H–δ18O diagram, the hydrogen and oxygen isotope composition of the plant source water (δ2Hs and δ18Os, respectively) can be reconstructed via the slope of the individual leaf water evapotranspiration lines (LELs; Craig and Gordon, 1965; Gat and Bowser, 1991). The LEL slope (SLEL) can be derived from Eq. 9:
where all variables are defined as in Sect. 2.3.1. The δ2Hs and δ18Os values can then be calculated for each leaf water data point via the intersect between the individual LELs with the GMWL. The δ2Hs and δ18Os model results can then be compared to the measured δ2Htank water and δ18Otank water values.
2.4 Modeling and isotope fractionation calculations
The de values are modeled using Eq. (3) and measured RHair as input, which can be compared to the deuterium excess via the measured δ2Hleaf water and δ18Oleaf water values. The RHair can be derived from Eq. (6) and compared to the measured ones. In a next step, reconstructed (biomarker-based) deuterium excessleaf water was used as input for Eq. (6) and compared to the measured RHair values. This model represents a simplified approach because δa−δs is approximated by (see Sect. 2.3). In all equations where δs and ds are needed as input, the measured δ2Htank water and δ18Otank water were used for calculations. The equilibrium and kinetic fractionation factors were set as described in Sect. 2.3.
Model quality was overall assessed by calculating the coefficient of determination (R2=1 and the root mean square error . The R2 is not equal to the r2, which provides here the fraction of variance explained by a linear regression between a dependent (y) and an explanatory variable (R Core Team, 2015).
The fractionation between the measured leaf biomarkers and leaf water can be described by the following equations (e.g., Coplen, 2011):
In order to provide a 1σ range bracketing the modeled results and calculations, they were additionally run with values generated by subtracting or adding the individual σ to the average.
All calculations and statistical analysis were realized in R (version 3.2.2; R Core Team, 2015).
3.1 Compound-specific isotope results
3.1.1 Leaf-wax-derived n-alkanes
The investigated leaf material shows a dominance of the n-C29 alkane homologue. Such a dominance of n-C29 in Brassica oleracea and Eucalyptus globulus was also reported by Ali et al. (2005) and Herbin and Robins (1968). Vicia faba leaf samples additionally revealed a high abundance of n-C31. This agrees with results from Maffei (1996) and enables a robust determination of compound-specific δ2H values for C29 and C31, respectively. The δ2Hn-alkane values of Vicia faba are therefore calculated as a weighted mean. Figures 2 and 4 illustrate the δ2Hn-alkane results along with isotope data for leaf, xylem and soil water (the latter were originally published in Mayr, 2002). The δ2Hn-alkane values ranged from −213 ‰ to −144 ‰ across all three plant species. As revealed by overlapping notches in the respective box plots, there is no statistically significant difference in the median between the three species (Fig. S1a in the Supplement; McGill et al., 1978). Figures S1a and 2 moreover show that the range of δ2Hn-alkane values is largest for Eucalyptus globulus. However, the low number of samples per plant species prohibits a robust interpretation. The δ2Hn-alkane values are given in the Supplement.
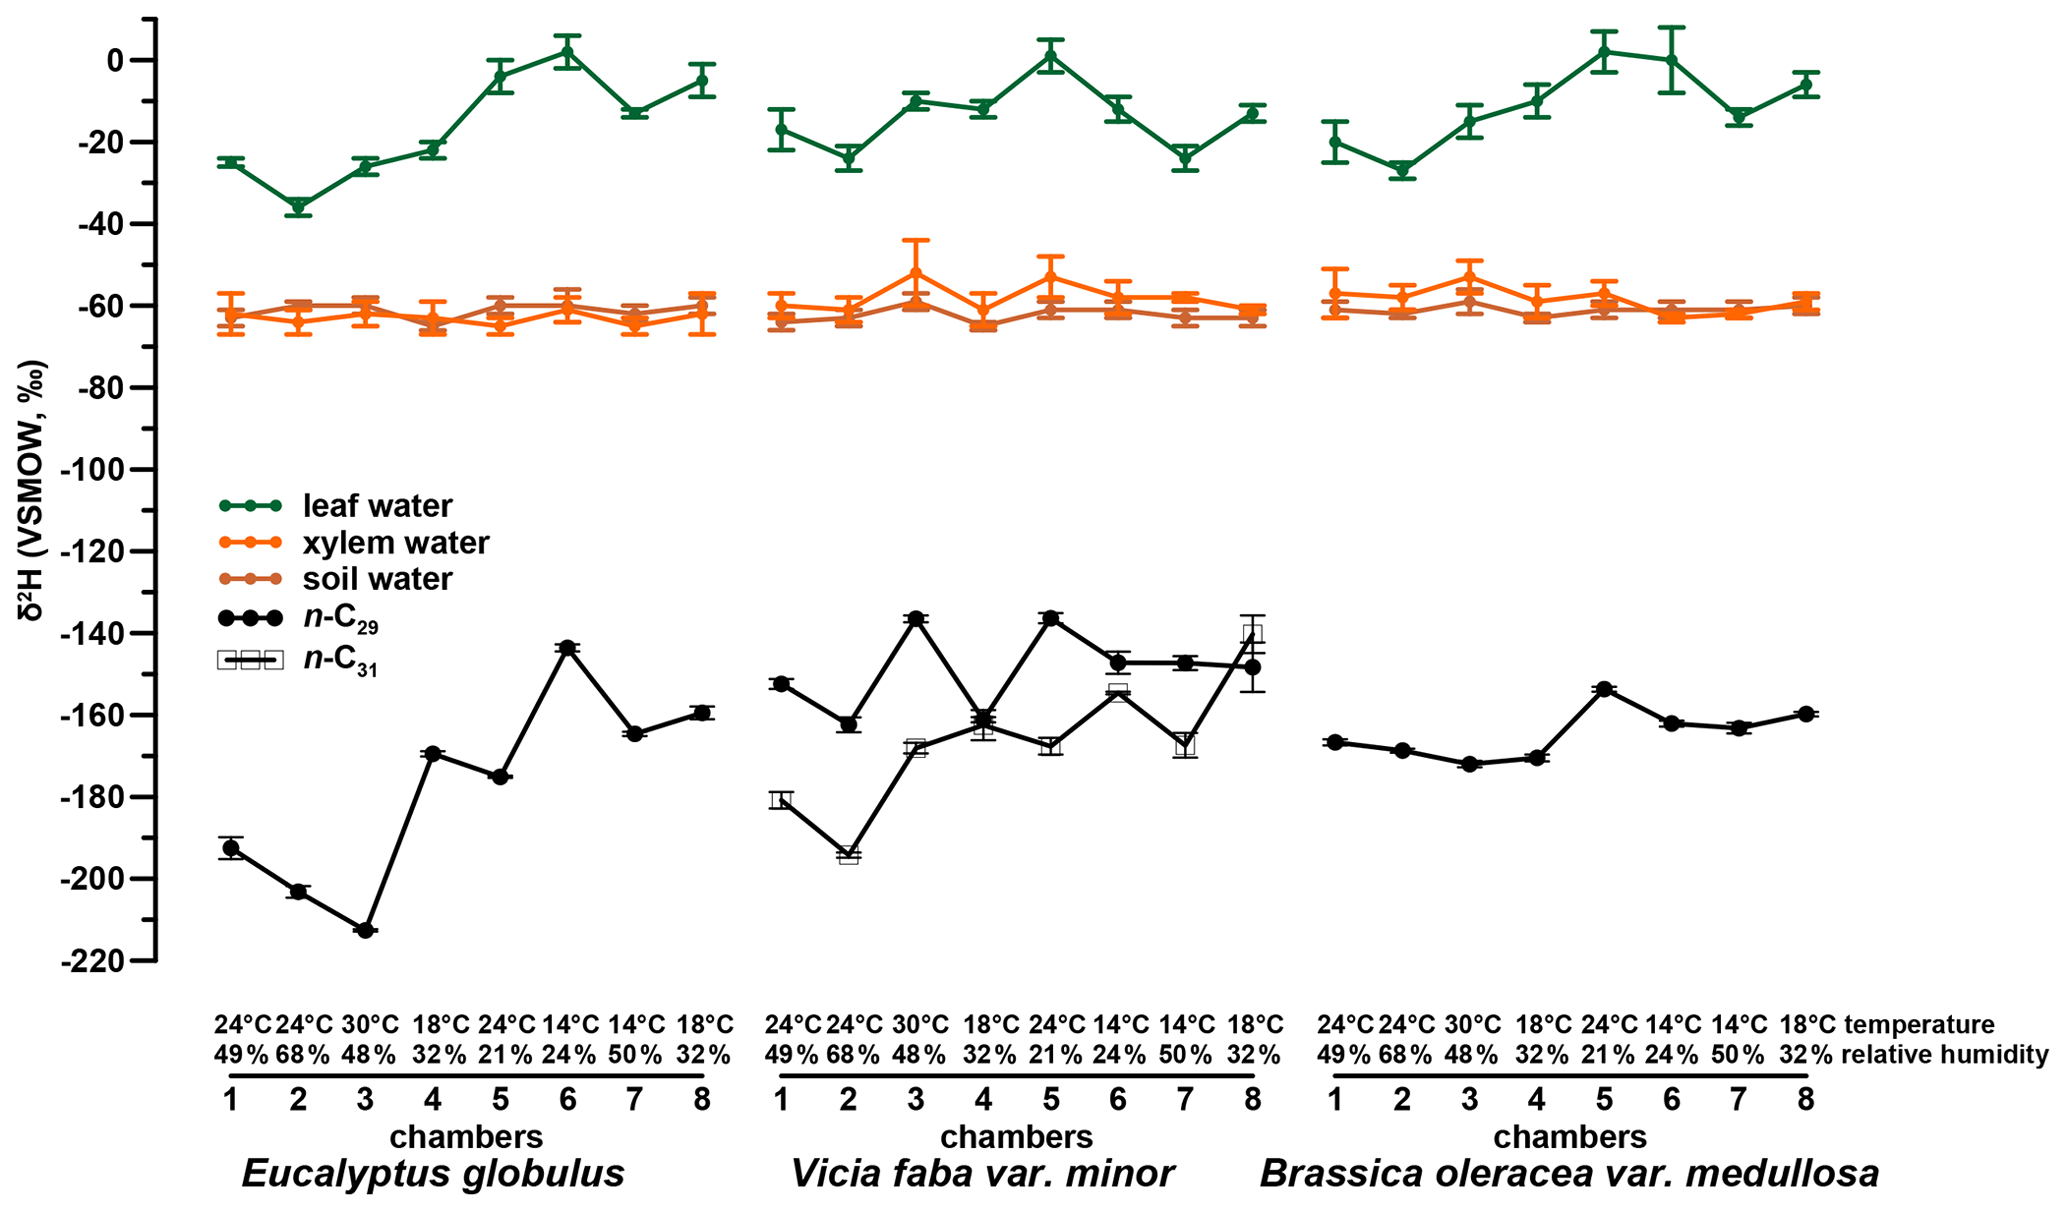
Figure 2δ2H values of plant water (leaf water, xylem water and soil water) isotope compositions (in green, orange and brown, respectively) and the isotope composition of the investigated leaf wax n-alkanes n-C29 and n-C31 as dots and open squares, respectively.
3.1.2 Hemicellulose-derived sugars
The investigated leaf samples yielded substantially higher amounts of arabinose and xylose compared to fucose and rhamnose. This is in agreement with sugar patterns reported for higher plants (D'Souza et al., 2005; Hepp et al., 2016; Jia et al., 2008; Prietzel et al., 2013; Zech et al., 2012, 2014a) and hampers a robust data evaluation of fucose and rhamnose. Therefore, the δ18O values were investigated for the pentoses arabinose and xylose and range from 30 ‰ to 47 ‰ and 30 ‰ to 50 ‰ (Fig. 3), respectively. Additionally, the isotope data for leaf, xylem and soil water are shown in Figs. 3 and 4 (originally published in Mayr, 2002). No considerable difference in the δ18O values of arabinose and xylose can be seen in the δ18O data (r2=0.7, p<0.001, n=24). This is in line with the findings of Zech and Glaser (2009) and Zech et al. (2012, 2013b, 2014b) but contradicts slightly more positive δ18Oarabinose values compared to δ18Oxylose values reported by Zech et al. (2013a) and Tuthorn et al. (2014). Zech et al. (2013a) and Tuthorn et al. (2014) argue that a biosynthetic fractionation could be the reason for that difference. This is based on the fact that arabinose is biosynthesized via an epimerase from xylose (Altermatt and Neish, 1956; Burget et al., 2003; Harper and Bar-Peled, 2002). Nevertheless, the δ18O values of arabinose and xylose were combined here as a weighted mean (as δ18Osugar values) for further data interpretation. Overall, the δ18Osugar values are not significantly different between the three investigated plant species (Fig. S1b). The δ18Osugar values are given in the Supplement.
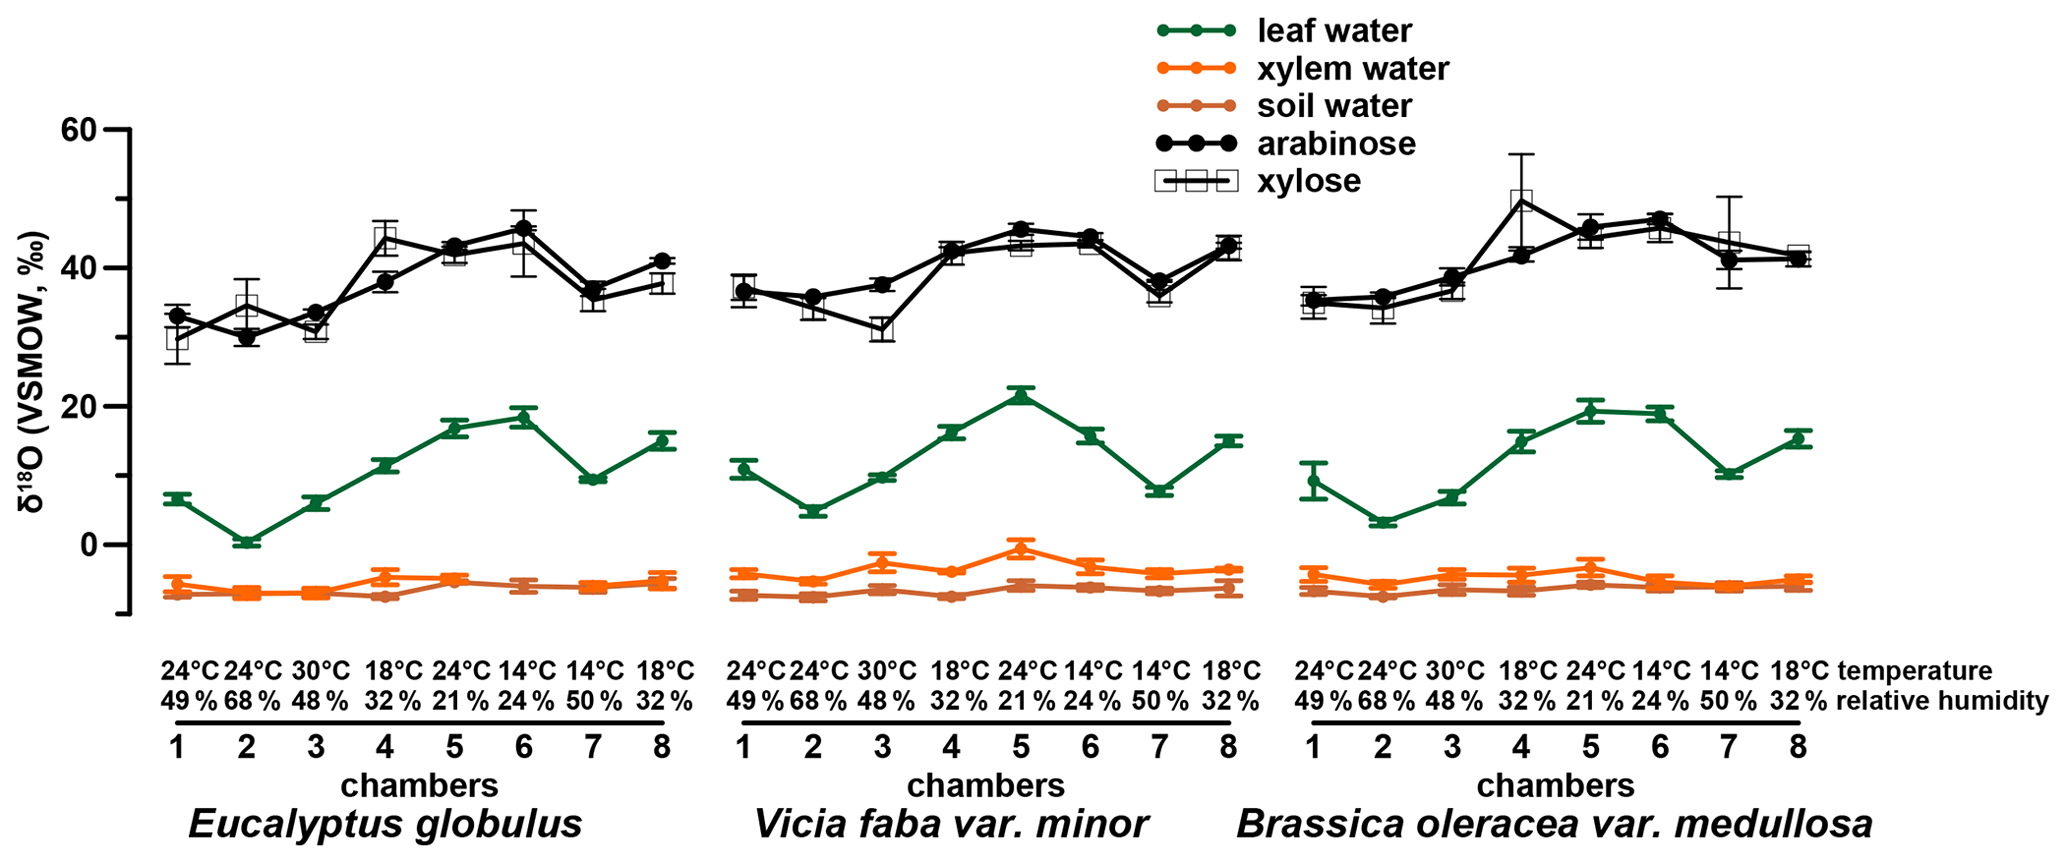
Figure 3δ18O values of plant water (leaf water, xylem water and soil water) isotope compositions (in green, orange and brown, respectively) and the isotope composition of the investigated hemicellulose-derived sugars: arabinose and xylose as dots and open squares, respectively.
3.1.3 δ2H–δ18O diagram
A comparison of compound-specific isotopes of leaf-hemicellulose-derived sugars and leaf-wax-derived n-alkanes with leaf, xylem, soil and tank water (compare Figs. 2, 3 and 4) reveals that soil and xylem water plot close to the tank water. Only a slight heavy-isotope enrichment in the soil and xylem water was observed (see the offset between soil and xylem water compared to the tank water). A larger evaporation effect of these water pools was inhibited by the high fresh air supply to the climate chambers (see Sect. 2.1). Thus, the leaf water shows a clear heavy-isotope enrichment due to evapotranspiration. This enrichment strongly differs between the climate chambers, depending mainly on T and RH conditions. The biomarker results furthermore follow the leaf water with a certain offset, which is εbio.
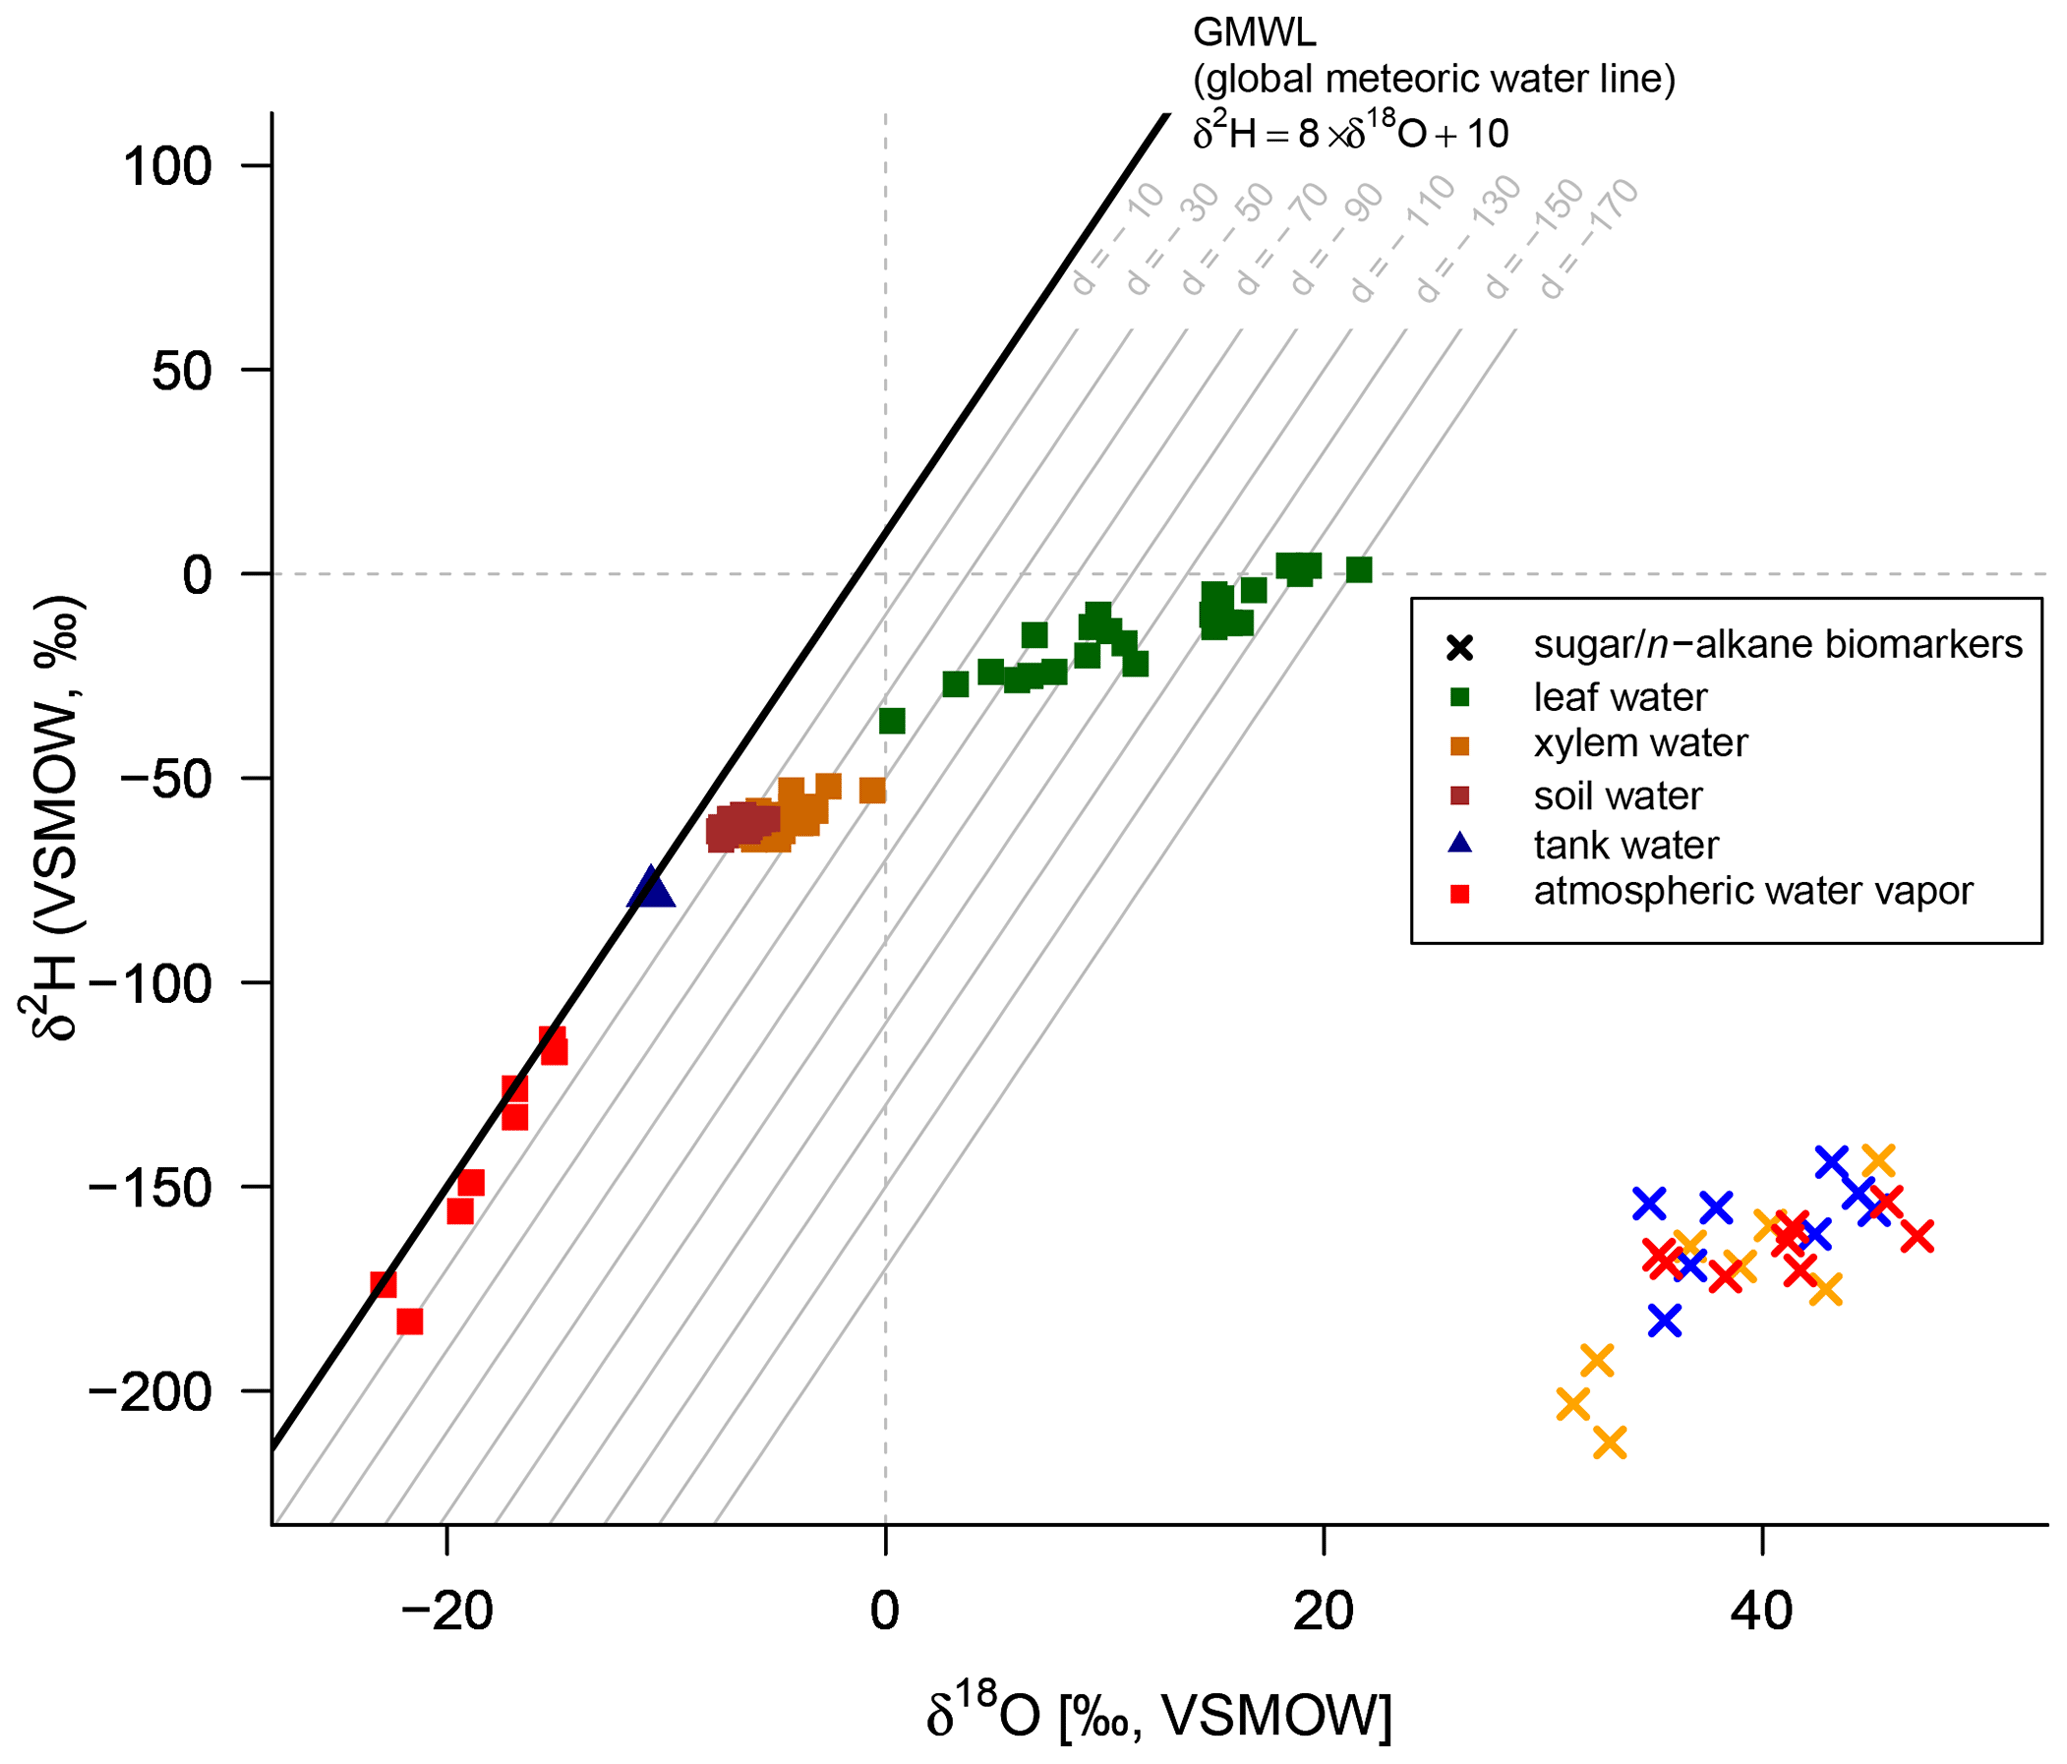
Figure 4δ2H–δ18O diagram illustrating the isotope composition of the biomarkers: δ2H values of the leaf wax n-alkanes (C29 for Eucalyptus globulus and Brassica oleracea and weighted mean of C29 and C31 for Vicia faba) and δ18O values of the hemicellulose-derived sugars arabinose and xylose (red crosses: Brassica oleracea; orange crosses: Eucalyptus globulus; blue crosses: Vicia faba). The measured isotope compositions of leaf water (green squares), xylem water (orange squares), soil water (brown squares), atmospheric water vapor (red squares) and the tank water used for irrigation (blue triangle), which plot very close to the global meteoric water line (GMWL). The deuterium excess with respect to the GMWL is marked as d in per mille.
3.2 Do n-alkane and sugar biomarkers reflect the isotope composition of leaf water?
3.2.1 δ2Hn-alkane vs. δ2Hleaf water
The δ2Hn-alkane data including all plant species reveals a significant correlation with δ2Hleaf water (r2=0.45 with p<0.001) (Fig. 5a). A slope of 1.1 and an intercept of −152 ‰ characterize the linear relationship. Since it is well known that measured leaf water is not always equal to the specific water pool in which the n-alkanes were biosynthesized (e.g., Tipple et al., 2015), this could explain the observed rather low r2 value. The correlation between the δ2Hn-alkane and δ2Hleaf water presented here is still well in the range found in the literature. Feakins and Sessions (2010) presented n-alkane (C29 and C31) and leaf water δ2H data from typical plant species (excluding grasses) along a southern California aridity gradient, revealing that only δ2H of n-C29 is significantly correlated with leaf water (r2=0.24, p<0.1, n=16, based on the associated supplementary data). Another field dataset from the temperate forest at Brown's Lake Bog, Ohio, USA, revealed significant correlations between δ2H of n-C29 or n-C31 and leaf water of Prunus serotina, Acer saccharinum, Quercus rubra, Quercus alba, and Ulmus americana (r2=0.49, p<0.001, n=38 and r2=0.59, p<0.001, n=29, respectively, as derived from the Supplement of Freimuth et al., 2017). Data from a controlled climate chamber experiment using two tree species show a highly significant relationship between δ2H of leaf wax n-alkanes and leaf water (with C31 of Betula occidentalis and C29 of Populus fremontii; r2=0.96, p<0.001, n=24, as derived from the Supplement of Tipple et al., 2015).

Figure 5(a) Scatterplot depicting the relationship between δ2Hn-alkane and δ2Hleaf water. Error bars of the δ values represent standard deviation of repeated measurements (see Sect. 2.2 and Mayr, 2002). (b) Boxplot comprising the plant-specific fractionation according to Eq. (10), showing median (thick black line) and interquartile range (IQR) with upper (75 %) and lower (25 %) quartiles and lower and upper whiskers, which are restricted to 1.5 ⋅ IQR. Outside the 1.5 ⋅ IQR space, the data points are marked with a dot. The notches are extended to by convention and give a 95 % confidence interval for the difference of two medians (McGill et al., 1978). Brassica oleracea, Eucalyptus globulus and Vicia faba samples are shown in red, orange and blue, respectively.
It seems that each plant type shows a different δ2Hn-alkane-to-δ2Hleaf water relation, with the highest slope for Vicia faba and the lowest slope for Brassica oleracea (Fig. 5a) However, we argue that the number of replicates for each plant species is simply too low to interpret this finding robustly. In order to explore possible species-specific effects on the fractionation between the biomarkers and the leaf water in more detail, boxplots of the individual plant species of values are shown in Fig. 5b. Median values are −155 ‰ for Brassica oleracea, −164 ‰ for Eucalyptus globulus and −149 ‰ for Vicia faba, with an overall mean value of −156 ‰ (ranging from −133 ‰ to −192 ‰). The boxplots of reveal that the median of the three investigated plant species can statistically not be distinguished due to overlapping notches. Due to the low sample number from each species, the 95 % confidence interval is larger than the interquartile range in some cases. However, it seems that at least small species-specific differences cannot be ruled out. Our values well resemble the data from a laboratory study (Kahmen et al., 2011), reporting a median value of −162 ‰ for n-C25, n-C27 and n-C29 of Populus trichocarpa. Furthermore, they are well comparable to climate chamber data of Betula occidentalis (n-C31) and Populus fremontii (n-C29) from Tipple et al. (2015), reporting a median value of −155 ‰. In addition, field experiments reveal similar median values of −151 ‰ (for n-C29) and −142 ‰(for n-C31) from typical plant species (excluding grasses) from southern California (Feakins and Sessions, 2010) and −144 ‰ (for n-C29 of the species Prunus serotina, Acer saccharinum, Quercus rubra, Quercus alba and Ulmus americana) from the temperate forest at Brown's Lake Bog, Ohio, USA. The large range in values from our study (−192 ‰ to −133 ‰) is also found in different laboratory and field studies (−198 ‰ to −115 ‰, derived from n-C29 and n-C31 data from Feakins and Sessions, 2010; Kahmen et al., 2011; Tipple et al., 2015; and Freimuth et al., 2017).
The observed large range in and the rather low r2 of the relationship between δ2Hn-alkane and δ2Hleaf water could point to a more specific water pool being used during biosynthesis rather than bulk leaf water (Sachse et al., 2012; Schmidt et al., 2003). Furthermore, as also nicotinamide adenine dinucleotide phosphate (NADPH) is acting as a hydrogen source during n-alkane biosynthesis, its δ2H is clearly more negative than the biosynthetic water pool (Schmidt et al., 2003), further contributing to a weakening of the correlation between δ2Hn-alkane and δ2Hleaf water and enlarging the range of . In more detail, alkane synthesis takes place by modifying or expanding fatty acids in the cytosol, while fatty acids are synthesized in the chloroplasts (Schmidt et al., 2003). Thus, the cytosol and chloroplast waters are two hydrogen sources. However hydrogen can additionally be added to the alkanes and fatty acids by NADPH, which originates from different sources (photosynthesis and pentose phosphate cycle; Schmidt et al., 2003). It is therefore challenging to measure directly the water pool from which the alkanes are biosynthesized (Tipple et al., 2015). Moreover, biosynthetic and metabolic pathways in general (Kahmen et al., 2013; Sessions et al., 1999; Zhang et al., 2009), the carbon and energy metabolism of plants more specifically (Cormier et al., 2018), and the number of carbon atoms of the n-alkane chains (Zhou et al., 2010) may have an influence on the fractionation. Our values correlate with Tair (Fig. S2a), whereas the correlation with RHair (Fig. S2b) is not significant. This could point to a relationship between and plant physiological processes (affecting various plants differently). In summary, the fractionation between leaf water and n-alkanes is strongly influenced by the metabolic pathway of the n-alkane biosynthesis including direct hydrogen transfers, exchange reactions and NADPH as a hydrogen source.
3.2.2 δ18Osugar vs. δ18Oleaf water
A highly significant correlation is observed for the correlation between δ18Osugar and δ18Oleaf water (r2=0.84, p<0.001; Fig. 6a). The regression reveals a slope of 0.74 and an intercept of 30.7 ‰. The observed slope of the δ18Osugar vs. δ18Oleaf water relationship could serve as an indicator of a leaf water (heavy-isotope enrichment) signal transfer damping of approximately 26 %.
The theory behind the signal damping is adopted from the cellulose research (e.g., Barbour and Farquhar, 2000). Barbour and Farquhar (2000) related the extent of the signal damping to the proportion of unenriched source water, which contributes to the local synthesis water pool and to the proportion of exchangeable oxygen during cellulose synthesis. Our damping of 26 % is within the range of values reported for cellulose synthesis in Gossypium hirsutum leaves (between 35 % and 38 %; Barbour and Farquhar, 2000), for Eucalyptus globulus leaf samples (38 %; Cernusak et al., 2005), and for five C3 and C4 grasses (25 %; Helliker and Ehleringer, 2002a). Recently, Cheesman and Cernusak (2017) provided damping for leaf cellulose synthesis based on plant data grown under the same conditions at Jerusalem Botanical Gardens published by Wang et al. (1998), ranging between 4 % and 100 % with a mean of 49 %, revealing large variations among and between ecological groups (namely conifers, deciduous, evergreen and shrubs). A large range of signal damping associated with leaf cellulose was also reported by Song et al. (2014) for Ricinus communis grown under controlled conditions. A common disadvantage of the abovementioned studies is the absence of direct measurements of the proportion of depleted source water contribution to the local synthesis water (as noticed by Liu et al., 2017), which largely contributes to the extent of the signal damping (Barbour and Farquhar, 2000). However, when transferring cellulose results to pentoses, such as hemicellulose-derived arabinose and xylose, it should be noted that they are biosynthesized via decarboxylation of the carbon at position six (C6) from glucose (Altermatt and Neish, 1956; Burget et al., 2003; Harper and Bar-Peled, 2002). Waterhouse et al. (2013) showed that the oxygen atoms at the C6 position in glucose moieties, used for heterotrophic cellulose synthesis, are strongly affected by the exchange with local water (up to 80 %). Based on these findings, it can be suggested that the influence of the non-enriched source water during the synthesis of leaf hemicelluloses is rather small.
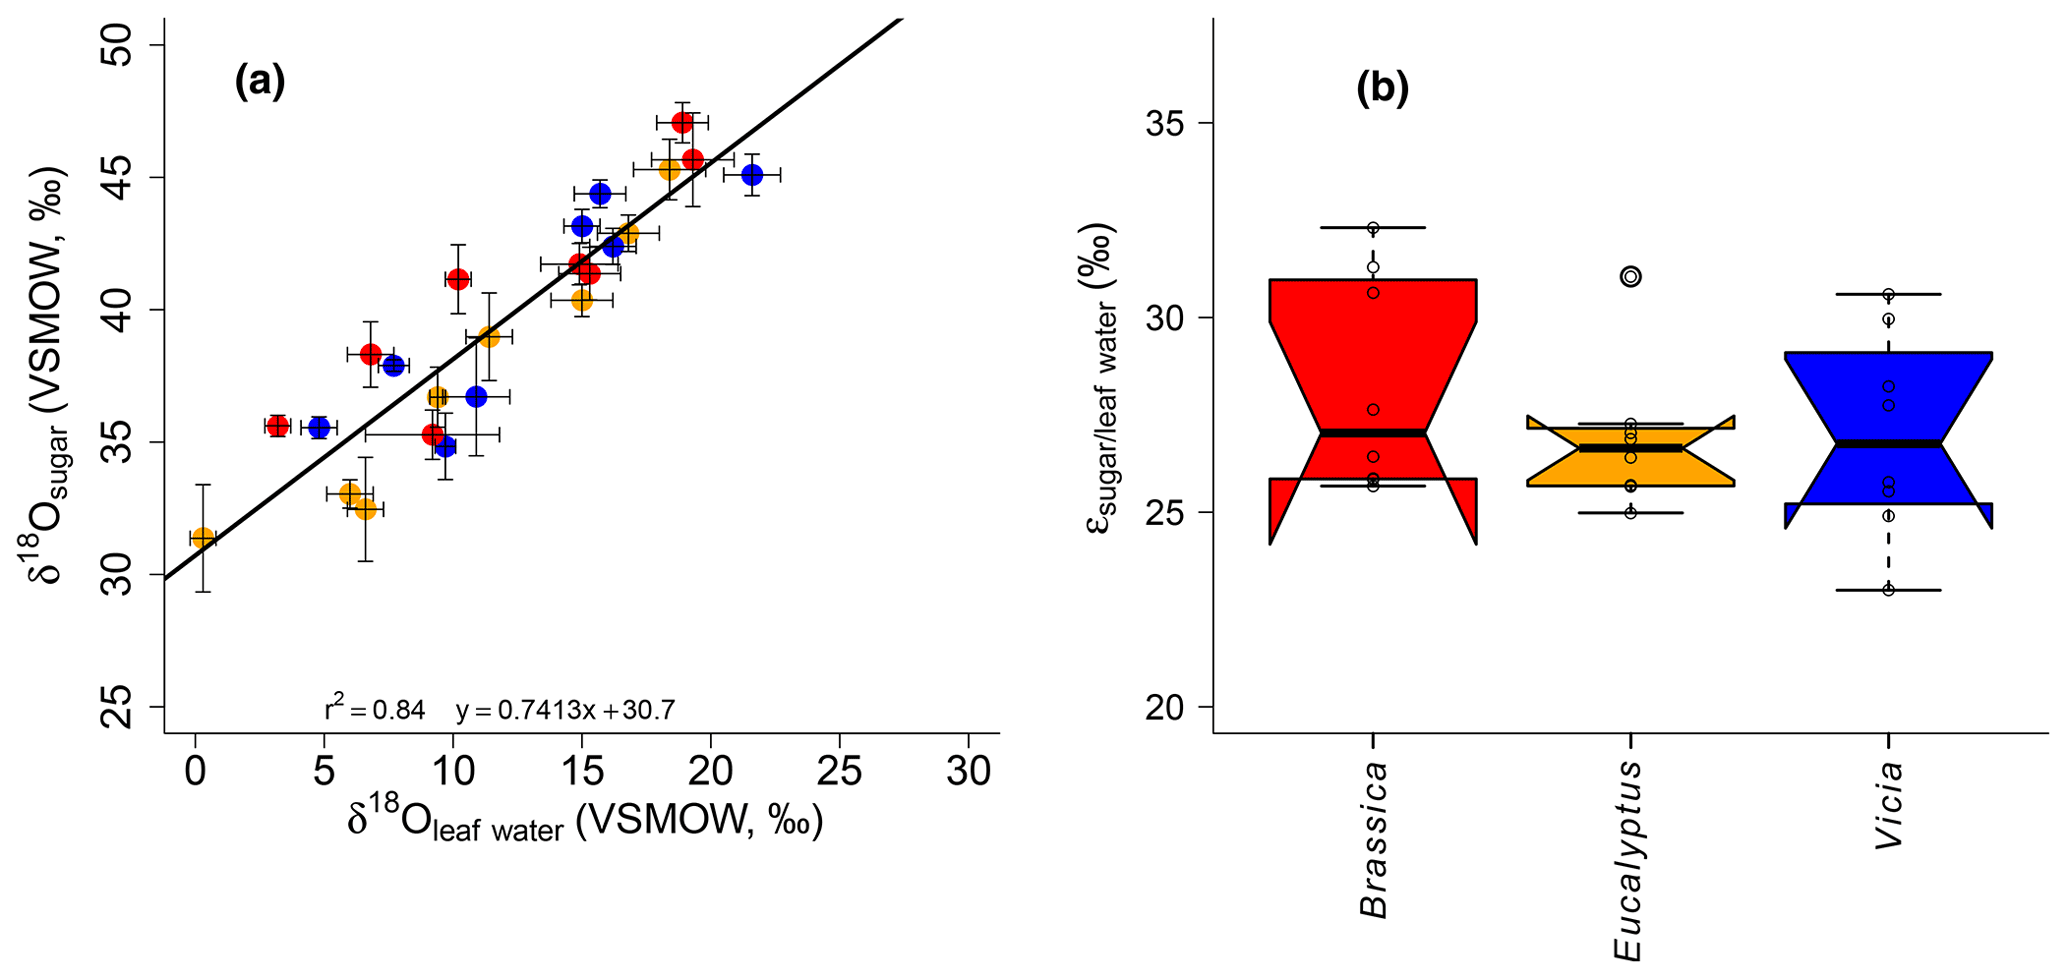
Figure 6(a) Scatterplot depicting the relationship between δ18Osugar vs. δ18Oleaf water. Error bars of the δ values represent standard deviation of repeated measurements (see Sect. 2.2 and Mayr, 2002). (b) Boxplot comprising the plant-specific fractionation according to Eq. (11), showing median (thick black line) and interquartile range (IQR) with upper (75 %) and lower (25 %) quartiles and lower and upper whiskers, which are restricted to 1.5 ⋅ IQR. Outside the 1.5 ⋅ IQR space, the data points are marked with a dot. The notches are extended to by convention and give a 95 % confidence interval for the difference of two medians (McGill et al., 1978). Brassica oleracea, Eucalyptus globulus and Vicia faba samples are shown in red, orange and blue, respectively.
The oxygen isotope composition of leaf sugars (e.g., sucrose and cellulose) is strongly influenced by O exchange processes, which cause more positive δ18O values of sugars compared to leaf water (Barbour et al., 2004; Cernusak et al., 2003). Therefore, median values of +27.0 ‰ for Brassica oleracea, +26.6 ‰ for Eucalyptus globulus and +26.8 ‰ for Vicia faba are observed (Fig. 6b). The overall average value of the three investigated species is +27.3 ‰ (ranging from +23.0 ‰ to +32.3 ‰). No systematic difference between the individual species is evident. Moreover, the values do not correlate significantly with Tair but significantly with RHair (Fig. S2c and d). A temperature dependence of the is not supported by this experiment in contrast to results from Sternberg and Ellsworth (2011), where a temperature effect on oxygen fractionation during heterotrophic cellulose biosynthesis is observed. The fractionation observed here between hemicellulose-derived sugars and leaf water, with regard to values, is well in agreement with the values reported for sucrose (exported from photosynthesizing leaves) and leaf water, which was shown to be +27 ‰ (Cernusak et al., 2003). The cellulose biosynthesis is also associated with an heavy-isotope enrichment of around +27 ‰ compared to the synthesis water as shown in growth experiments (Sternberg et al., 1986; Yakir and DeNiro, 1990). The relatively uniform fractionation is explained via the isotope exchange between the carbonyl oxygens of the organic molecules and the surrounding water (cf. Schmidt et al., 2001). This equilibrium fractionation effect was indeed described earlier by the reversible hydration reaction of acetone in water by Sternberg and DeNiro (1983) to be +28 ‰, +28 ‰ and +26 ‰ at 15, 25 and 35 ∘C, respectively. However, the observed range of approximately 9 ‰ (Fig. 6b) could indicate that partially not only the oxygen equilibrium fractionation between organic molecules and medium water has to be considered. Presumably, isotope as well as sucrose synthesis gradients within the leaf have to be taken into account when interpreting leaf sugar oxygen isotope compositions and their correlation with leaf water (Lehmann et al., 2017). Lehmann et al. (2017) reported a fractionation between sucrose and leaf water of +33.1 ‰. Based on this they proposed a conceptual scheme of how such gradients can lead to discrepancies between the isotope composition of the bulk leaf water and the synthesis water. Thus, the fractionation between carbohydrates and bulk leaf water can exceed the common average of +27 ‰. Also Mayr et al. (2015) found a fractionation between aquatic cellulose δ18O and lake water larger than this value of around +29 ‰.
3.2.3 Inter-species variability
The differences observed in (Fig. 5b) and (Fig. 6b) between the taxa might be explained by different leaf sizes and geometries. Please note that these differences are statistically not significant. We do not know whether this is caused by the rather low sample number of our study (n=24) or not. Still, the yielded mean biosynthetic fractionation factors over all species are −156 ‰ and +27 ‰ for δ2Hn-alkanes and δ18Osugars, respectively. This is well in agreement with data from the literature (usually −160 ‰ and +27 ‰, respectively).
When reviewing Figs. 2 and 3, we observe differences between chamber 4 and 8 for Eucalyptus globulus, which is mainly related to different sampling time of leaves between the two experiments. Because of the diurnal course of light, which was simulated in each chamber, relative humidity and temperature steady-state conditions prevailed only at 11:00 and 16:00 CET (see Sect. 2.1). While the leaf samples of Eucalyptus globulus from chambers 5 to 8 were sampled during the simulated steady-state daytime conditions, chambers 1 to 4 were sampled after these simulated steady-state daytime conditions due to time restrictions, explaining the deviations in leaf water isotope composition. The sampling time, however, does not influence isotope values of tissue samples, which represent the integrated signal over the entire growing period and do not explain the observed differences in δ2Hn-alkane. The δ2Hn-alkane values differ for all plant types, whereas δ18Osugar and δ18Oleaf water do not. The differences in δ2Hn-alkane are most likely explainable via the fractionation occurring during biosynthesis of n-alkanes, which depends not only on leaf water isotope composition but also on plant physiological factors (e.g., water pressure deficit between air and leaf, transpiration rate, assimilation rate; see discussion in Sect. 3.2.1).
3.2.4 Implications for paleoclimatic reconstructions
The damping of the leaf water oxygen isotope signal caused by the exchange between sugars and water is an important issue, especially in stem, trunk and root tissues. While these tissues hardly produce n-alkanes, (hemi-)celluloses and sugars extracted from such tissues do not show the full leaf water heavy-isotope enrichment because of a partial oxygen exchange with non-enriched stem water (e.g., Zech et al., 2014a). This has to be kept in mind for paleoclimatic reconstructions, especially for the sugars of grasses, which do not record the full leaf water enrichment (e.g., Helliker and Ehleringer, 2002b). In the case of grasses, this signal damping affects n-alkanes, too. However, such uncertainties can be included in the RH reconstruction via assumptions and sensitivity analysis of the used model, thus allowing the quantification of uncertainties in reconstructed RH records as shown by Hepp et al. (2019).
3.3 Strong control of relative humidity over deuterium excess of leaf water
3.3.1 Calculating relative humidity based on measured leaf water
The correlations between leaf-water-based and measured RHair and modeled de and measured deuterium excessleaf water are illustrated in Fig. 7a and b, respectively. Since the climate chambers had a high fresh air supply (see Sect. 2.1) the variability in the leaf water deuterium excess is predominantly the result of leaf water heavy-isotope enrichment and thus strongly driven by relative humidity.
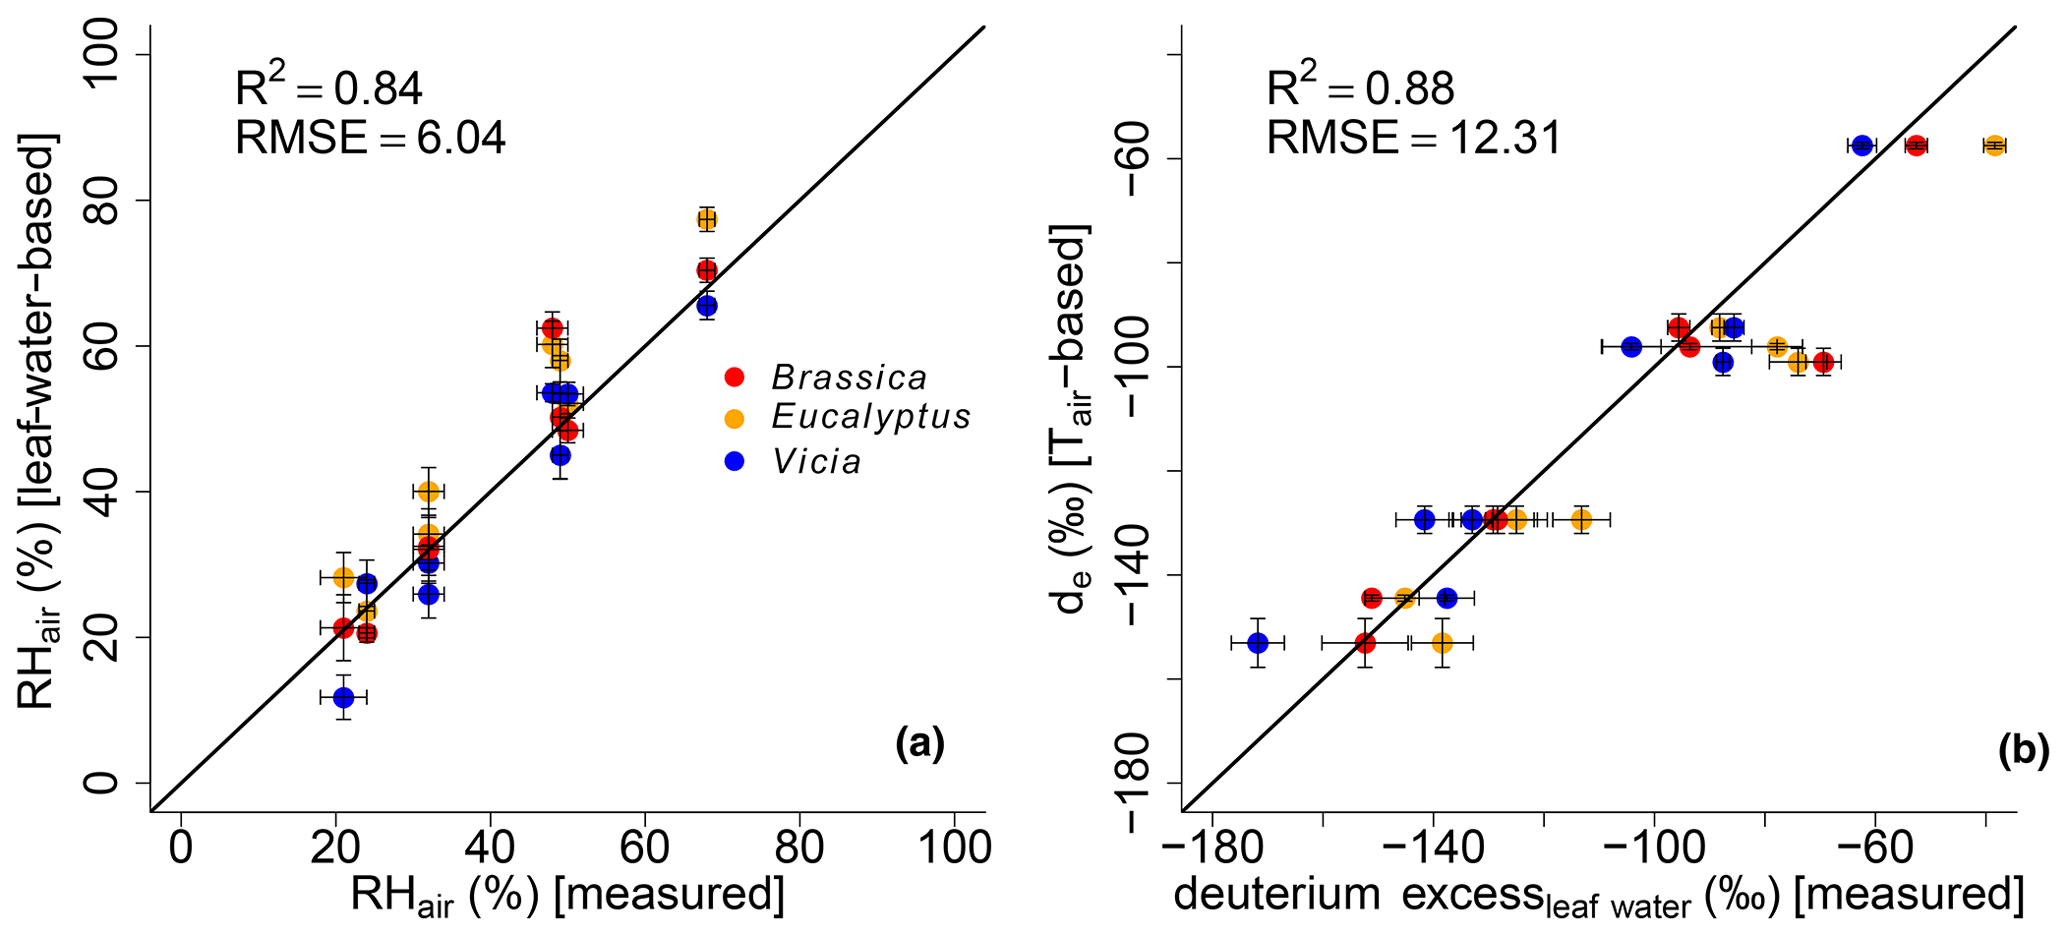
Figure 7Scatterplots illustrating the correlation between (a) modeled (leaf-water-based) and measured air relative humidity (RHair) and modeled (Tair-based) vs. measured leaf water deuterium excess. Black lines indicate the 1 : 1 relationship. R2 and RMSE are calculated as described in Sect. 2.4, while the RMSE values have the dimensions of the respective variables. Error bars for the measured RH values represent analytical standard deviations (see Mayr, 2002). See Sect. 2.4 for the uncertainties in the calculated and modeled results.
Evidence for the strong control of relative humidity on deuterium excess of leaf water comes from multivariate regression analysis between the measured deuterium excessleaf water values versus RHair and Tair. The results reveal that the deuterium excessleaf water significantly correlates with RHair of the climate chambers (p<0.001), with an r2 of 0.92. The strong control of RH on the deuterium excess of leaf water is furthermore supported by the significant correlations between calculated versus measured RHair values (Fig. 7a). This is in line with the strong correlation between modeled de based on Tair and measured deuterium excessleaf water values (Fig. 7b).
The modeled de values show a high agreement with measured deuterium excess of leaf water without being too positive. This could be expected from the literature because the output of the Craig–Gordon-based leaf water enrichment model (e.g., Allison et al., 1985; Barbour et al., 2004; Cernusak et al., 2016; Sect. 2.3) reflects leaf water at the evaporative sites, which should be more positive than the measured bulk leaf water. Especially under low-relative-humidity conditions, the discrepancy between Craig–Gordon model results and the measured values is shown to be more pronounced. This is associated with higher transpiration fluxes and higher isotope heterogeneity within the leaf water due to a non-uniform closure of the stomata (Flanagan et al., 1991; Santrucek et al., 2007). An overestimation of the Craig–Gordon models can hardly be observed here (Fig. 7b). However, based on the accepted leaf water enrichment theory (e.g., Cernusak et al., 2016), higher transpiration rates (e.g., under low-humidity conditions) should still lead to a larger discrepancy between Craig–Gordon-modeled and measured leaf water because the lower the back diffusion of enriched leaf water from the evaporative sites gets, the higher the transpiration flux is.
It should be noted that there is the possibility of building up a more detailed model based on Eq. (2). With this, a model is given to derive de values with the usage of da and ds, which can be compared to the measured deuterium excessleaf water values. However, when modeling de without the simplification , the R2 results in 0.86, and RMSE equals 13.07 ‰ compared to the presented 0.88 and 12.31 ‰. Furthermore, in Eq. (5) Tair can be replaced by Tleaf. With this, Eq. (2) results in values based on leaf temperature. This would consider that the Craig–Gordon model requires the temperature of the evaporating surface rather than the air temperature for ei. However, with this model extension the R2 and the RMSE are 0.55 ‰ and 23.54 ‰, respectively. By rearranging Eq. (2), RH values can be modeled, which can be compared to RHair as well as RHleaf values ( multiplied by 100 with Tleaf). The respective model characteristics are again lower for the RHleaf case (R2=0.27 and RMSE = 11.84 %) than for the RHair comparison (R2=0.81 and RMSE = 6.56 %). Still Eq. (6) provides better results, as presented in this paragraph (R2=0.84 and RMSE = 6.04 %). This discussion is in line with the differences between Tleaf vs. Tair and RHleaf vs. RHair conditions in the climate chambers. They reveal the same trends and magnitude, but Tleaf is consequently higher than Tair along with higher RHleaf values compared to RHair (Fig. 1; Mayr, 2002). In summary, we therefore argue that the model presented in Eq. (6) (including the simplifications of and using Tair in Eq. 5) is able to reconstruct RHair values based on δ2Hleaf water and δ18Oleaf water values.
3.3.2 Calculating relative humidity based on reconstructed leaf water
In order to test the proposed paleohygrometer approach, the alkane- and sugar-based (reconstructed) leaf water values were used to calculate RHair. The measured RHair is well reflected by the biomarker-based relative air humidity values (R2=0.54; Fig. 8). Overall, a lower coefficient of determination of the biomarker-based model compared to the leaf-water-based reconstructions (compare black with gray data points in Fig. 8) is observed. This can be attributed to the uncertainties in reconstructed leaf water using δ2Hn-alkane and δ18Osugar data as discussed in Sect. 3.2.1 and 3.2.2. Briefly, the limitations regarding δ2H arise from the rather weak relationship between the δ2H of the n-alkanes and the leaf water, probably linked with the large range in (Fig. 5b). The applied equation for reconstructing δ2Hleaf water by using δ2Hn-alkane using a constant biosynthetic fractionation of −160 ‰ (Eq. 10) was considered to be suitable (Sachse et al., 2012; Sessions et al., 1999). However, this equation also contributes some uncertainty to the final relative humidity reconstruction. With regard to δ18O, the relatively large variations in of 9 ‰ have to be considered (Fig. 6b) because in the δ18Oleaf water reconstructions a fixed value of +27 ‰ is used (Eq. 11). Such a uniform biosynthetic fractionation is just an approximation of the real, probably more variable values. When biomarkers are used to derive leaf water, the measured bulk leaf water does not capture the isotope value of the water in which the biomarkers are biosynthesized. This could thus partly explain the weaker relationship between measured and calculated RHair. Especially the underestimation of the biomarker-based RHair values under the 68 % relative humidity conditions as well as the large range in reconstructed RHair values for the 48 %, 49 % and 50 % RHair chambers can be attributed to the leaf water reconstruction uncertainties. It should be mentioned that using Eqs. (7) and (8) to calculate leaf water isotope composition based on the biomarkers via biosynthetic fractionation values implies that the fractionation process in principle can be treated as a single process with a unique source. While this approximation can be questioned (see discussion in Sect. 3.2), the overall correlation between biomarker-based and measured RHair highlights the potential of the approach (Hepp et al., 2017; Tuthorn et al., 2015; Zech et al., 2013a), also for future paleoclimate reconstructions.
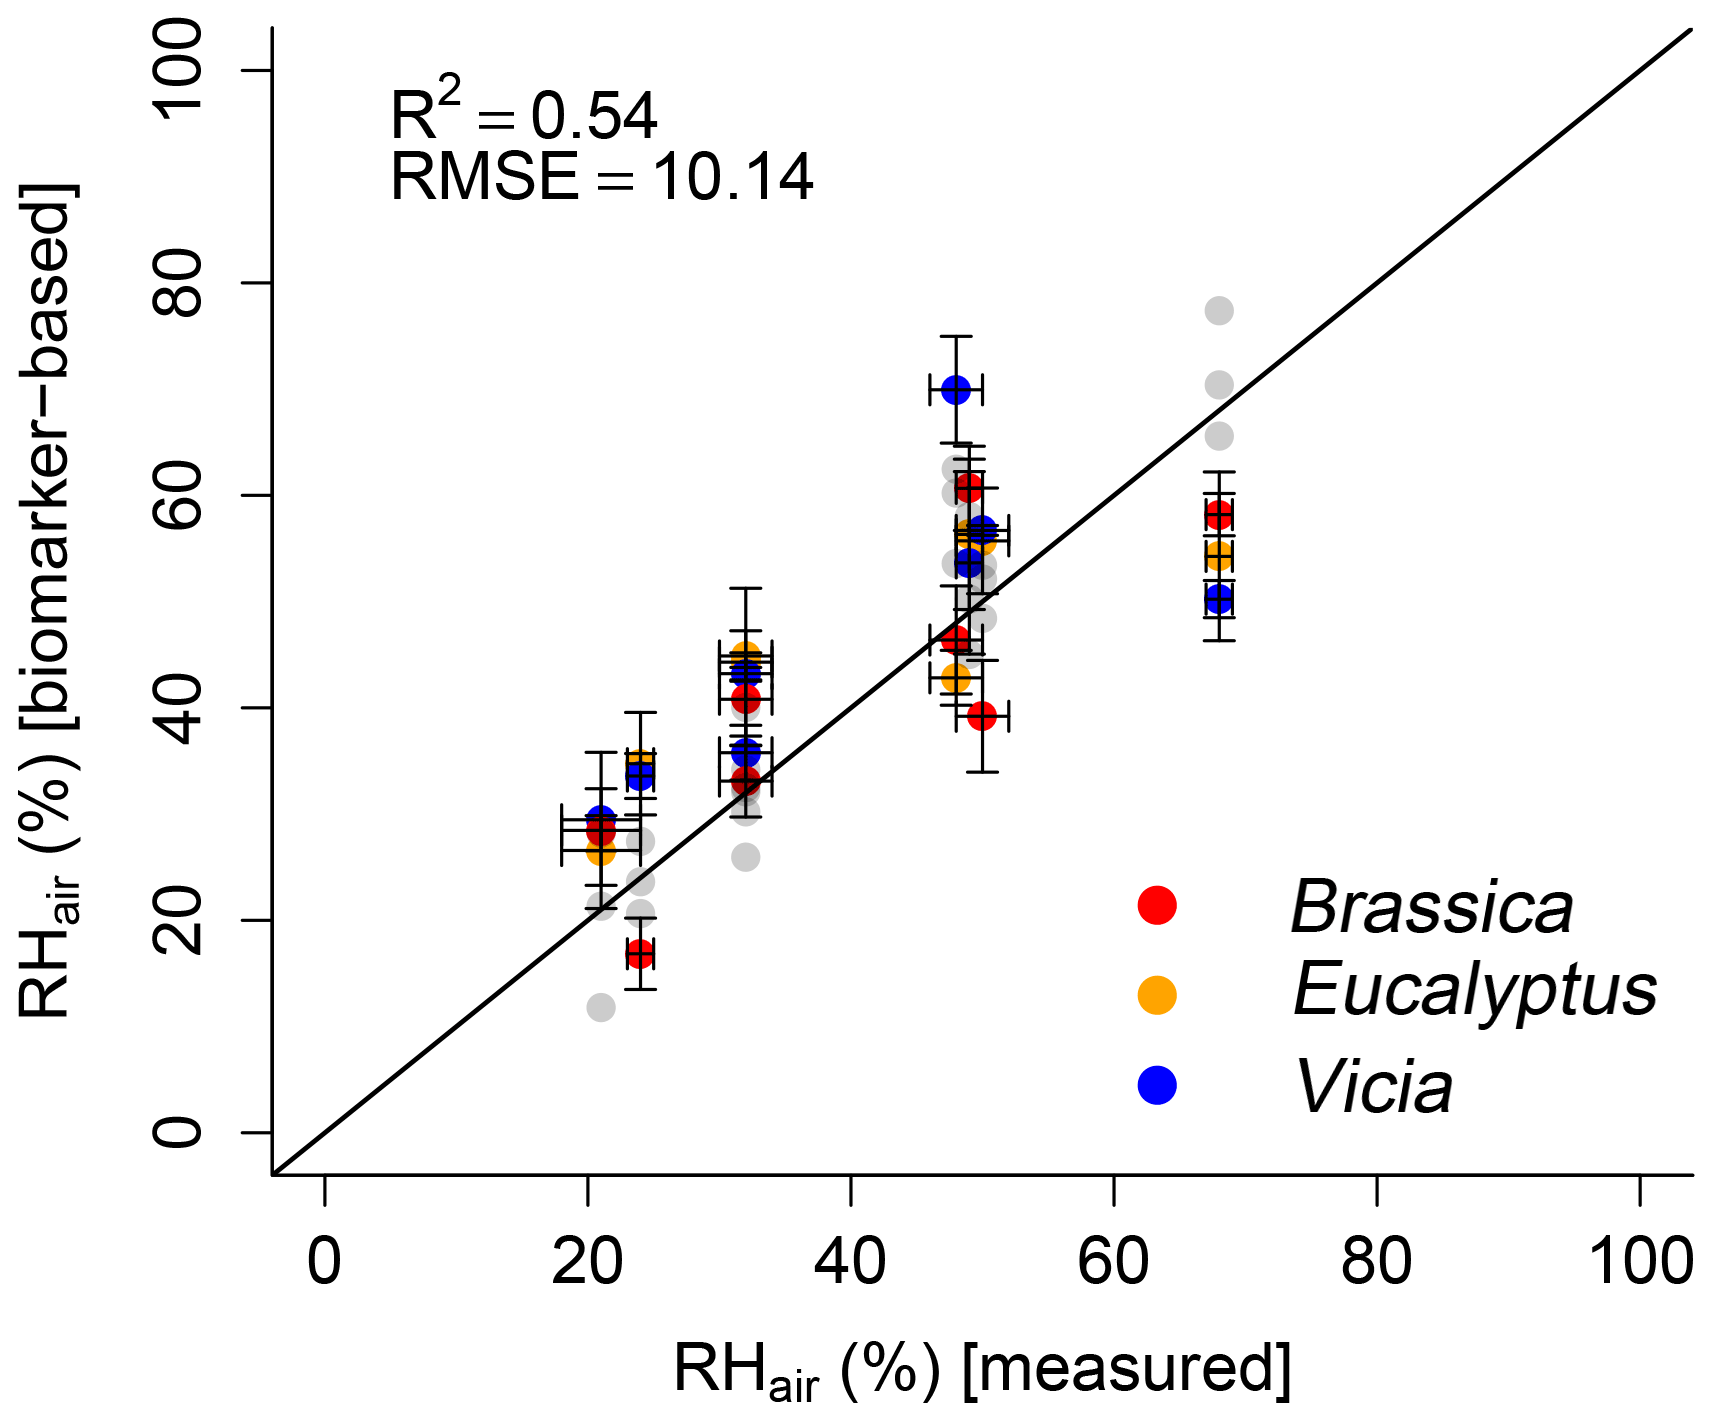
Figure 8Scatterplot depicting the relationship between modeled (biomarker-based) and measured relative air humidity (RHair). The black line indicates the 1 : 1 relationship. R2 and RMSE was calculated as described in Sect. 2.4, while the RMSE values have the dimensions of the respective variables. Error bars for the measured values represent analytical standard deviations (see Mayr, 2002). For uncertainty calculation of the results, see Sect. 2.4. In addition, the leaf-water-based relative air humidity results are shown in light gray for comparison.
3.4 Coupling δ2Hn-alkane and δ18Osugar for δ2Hsource water and δ18Osource water calculation
The second advantage of the proposed coupled δ2Hn-alkane–δ18Osugar approach is a more robust reconstruction of the isotope composition of the source water, which can often be directly linked to the local precipitation signal (Hepp et al., 2015, 2017; Tuthorn et al., 2015; Zech et al., 2013a). Therefore, we calculated the source water isotope compositions via the slopes of the LELs and the GMWL. In order to show the difference in the approaches using either δ2Hn-alkane or δ18Osugar for source water reconstruction, Fig. 9 depicts (i) the leaf water isotope composition reconstructed from δ2Hn-alkane and δ18Osugar results using the biosynthetic fractionation factors, (ii) the measured δ2Hleaf water and δ18Oleaf water values, (iii) the source water isotope composition based on reconstructed leaf water, and (iv) the source water isotope composition based on measured leaf water along with the (v) tank water isotope composition.
For δ2H, neither the range nor the median of the δ2Hleaf water is well captured by the alkane-based leaf water values. However, the overlapping notches do not support a statistical difference in the median values (Fig. 9a). The median is on average 13 ‰ more positive than the measured δ2Htank water. A higher agreement between measured and modeled values is observed from leaf-water-based δ2Hs compared to δ2Htank water. The average offset is reduced to 2 ‰, and the range is reduced by approximately 70 ‰ compared to the biomarker-based reconstruction.
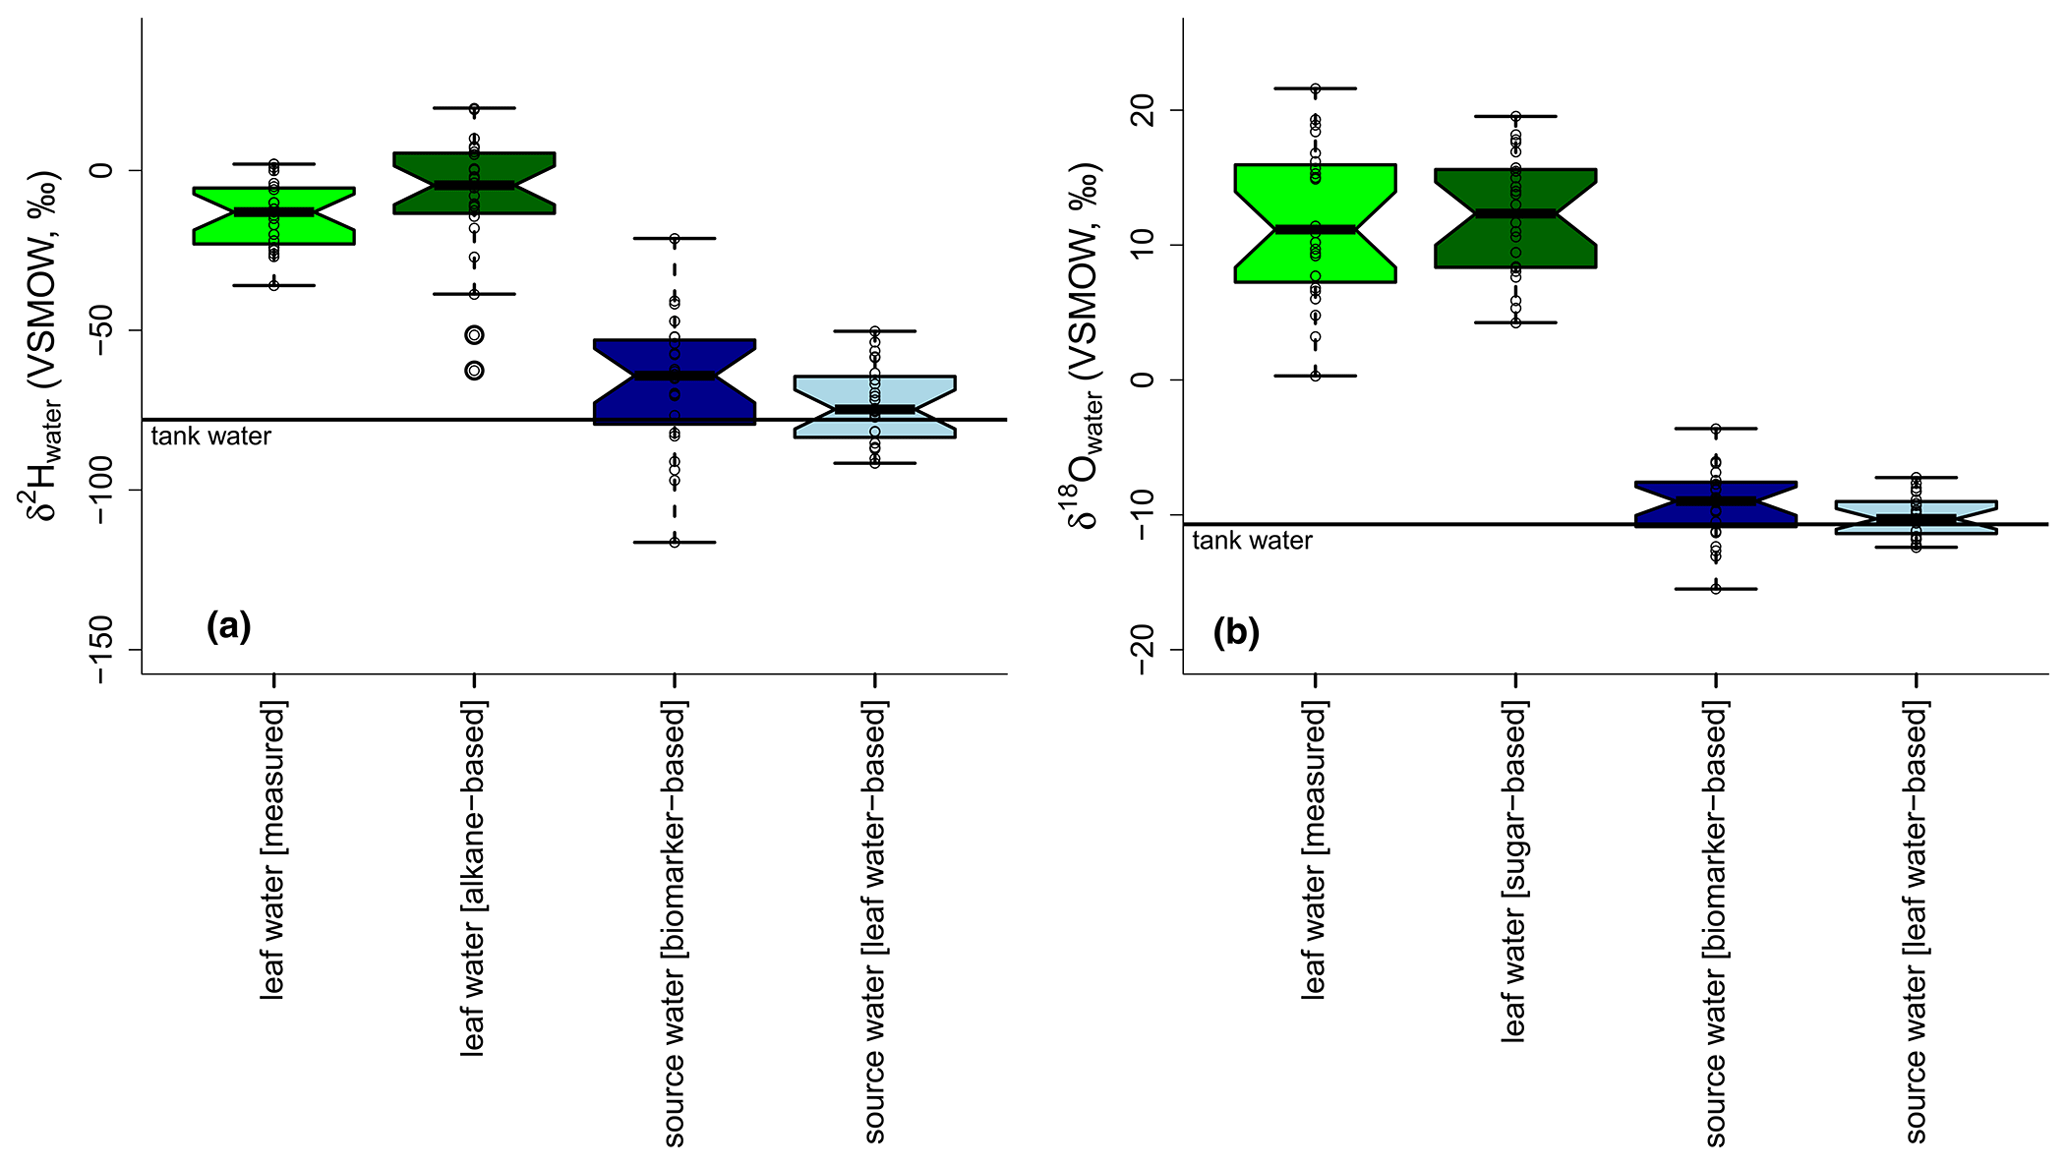
Figure 9Boxplots showing the measured leaf water in comparison to the biomarker-based leaf water, source water calculated with biomarker-based leaf water values and source water based on measured leaf water (a: δ2Hleaf water; b: δ18Oleaf water). Tank water is given as a solid black line in both plots. Source water isotope compositions were calculated via the slopes of the LELs (with either biomarker-based or measured leaf water values) and the GMWL. Boxplots show median (thick black line) and interquartile range (IQR) with upper (75 %) and lower (25 %) quartiles and lower and upper whiskers, which are restricted to 1.5 ⋅ IQR. Outside the 1.5 ⋅ IQR space, the data points are marked with a dot. The notches are extended to by convention and give a 95 % confidence interval for the difference of two medians (McGill et al., 1978).
For δ18O, the sugar-based leaf water values agree with the measured ones regarding the median values, as supported by the largely overlapping notches (Fig. 9b). The range of the reconstructed leaf water is about 6 ‰ lower than for the measured δ18Oleaf water data. All reconstructed δ18Os values, regardless of whether they are biomarker- or leaf-water-based, are comparable to the measured δ18Otank water. While the biomarker-based data depict an average offset of 2 ‰, the leaf-water-based values only differ by 0.3 ‰ from the tank water δ18O values, referring to the median.
The overall larger range of modeled δ2Hs and δ18Os compared to measured δ2Htank water and δ18Otank water can be related to uncertainties in SLEL modeling (see equations in Sect. 2.3.2). Bariac et al. (1994) found no agreement between the intersects of modeled LELs with the GMWL and the plant source water. Allison et al. (1985) explained such results with changing environmental conditions, leading to various LELs with a locus line not necessarily passing the δ2Hs and δ18Os data point, in a system that approaches rapidly new steady-state conditions. However, when a larger isotope range of source water is used in the studies, leaf water seems to be a good tracer for source water changes when a Craig–Gordon model is applied (Benettin et al., 2021; Bush et al., 2017).
The climate chamber results suggest that leaf-wax-derived n-alkane and hemicellulose-derived sugar biomarkers are valuable δ2Hleaf water and δ18Oleaf water recorders, respectively. The coupling of δ2Hn-alkane and δ18Osugar by using a simplified Craig–Gordon equation allows moreover a more robust RHair reconstruction of the chambers in which the plants were grown compared to single isotopes. With regard to the research questions, we conclude the following:
- i.
n-C29 predominated and occurred at abundances suitable for compound-specific δ2H measurements in the leaf samples from all investigated species (Eucalyptus globulus, Vicia faba var. minor and Brassica oleracea var. medullosa). For Vicia faba, additionally n-C31 could be evaluated robustly. δ18Osugar values could be obtained for the hemicellulose-derived monosaccharides arabinose and xylose.
- ii.
Both the δ2Hn-alkane and δ18Osugar values yielded highly significant correlations with δ2Hleaf water and δ18Oleaf water (r2=0.45 and 0.85, respectively; p<0.001, n=24). Mean fractionation factors between biomarkers and leaf water were found to be −156 ‰ (ranging from −133 ‰ to −192 ‰) for and +27.3 ‰ (ranging from +23.0 ‰ to +32.3 ‰) for .
- iii.
RHair can be derived robustly by using the measured leaf water isotope composition (δ2Hleaf water and δ18Oleaf water) and a rearranged Craig–Gordon model (R2=0.84; p<0.001; RMSE = 6 %).
- iv.
Biomarker-based and measured RHair correlation with R2 of 0.54 (p<0.001) and RMSE of 10 % highlights the great potential of the coupled δ2Hn-alkane–δ18Osugar paleohygrometer approach for reliable relative humidity reconstructions. Uncertainties regarding relative humidity reconstructions via biomarker-based leaf water isotope composition arose from leaf water reconstructions and model uncertainties, as shown in (ii) and (iii).
- v.
The coupled δ2H–δ18O approach enables a better back calculation of the plant source water compared to single isotopes. Reconstructed source water isotope composition (δ2Hs, δ18Os) is in the range of the measured tank water (δ2Htank water, δ18Otank water). However, modeled δ2Hs and δ18Os showed a clearly larger range compared to δ2Htank water and δ18Otank water. The uncertainties for source water determination are thus considerably higher compared to the relative humidity reconstructions.
The temperature, relative humidity, leaf water δ2H and δ18O, xylem water δ2H and δ18O, soil water δ2H and δ18O, the tank water δ2H and δ18O, and the atmospheric water vapor δ2H and δ18O data are available from Mayr (2002). The δ2H n-alkane and δ18O sugar data are available in the Supplement.
The supplement related to this article is available online at: https://doi.org/10.5194/bg-18-5363-2021-supplement.
JH, MZ and CM wrote the paper; CM was responsible for the climate chamber experiment together with WS and provided the leaf samples and the data; MZ and RZ were responsible for compound-specific isotope analysis on the biomarkers; JH, MT and IKS did laboratory work and data evaluation of the biomarker compound-specific isotope analysis; BG, DJ, KR and all co-authors contributed to the discussion and commented on the manuscript.
The authors declare that they have no conflict of interest.
Publisher’s note: Copernicus Publications remains neutral with regard to jurisdictional claims in published maps and institutional affiliations.
We would like to thank Marcel Bliedtner and Jana Zech (both from the University of Bern) for help during lipid biomarker and δ2Hn-alkane analysis. We thank Marianne Benesch (Martin Luther University of Halle–Wittenberg) and Maria Schaarschmidt (University of Bayreuth) for laboratory assistance during sugar biomarker and δ18Osugar analysis. We also acknowledge Natalie Orlowski (University of Freiburg), Marco Marius Lehmann (Swiss Federal Institute WSL, Birmensdorf) and Lorenz Wüthrich (University of Bern) for helpful discussions. We are very grateful for the constructive discussion on an earlier version of this paper as a preprint at Biogeosciences. We cordially thank Helge Niemann and the two anonymous reviewers for the great editorial support and their constructive and encouraging reviews. Involvement of Kazimierz Rozanski was supported by the Polish Ministry of Science and Higher Education. Johannes Hepp greatly acknowledges the support given by the German Federal Environmental Foundation. The experiment carried out by Christoph Mayr was gratefully supported by the HGF project “Natural climate variations from 10 000 years to the present”. The experiments were possible due to the assistance of Jana Barbro Winkler, Harald Lowag, Dietrich Strube, Dieter Arthofer, Harald Seidlitz, Dagmar Schneider, Hans-Dieter Payer and technical staff at the phytotron facility of the Helmholtz Zentrum München.
This research has been supported by the Schweizerischer Nationalfonds zur Förderung der Wissenschaftlichen Forschung (grant no. PP00P2 150590), the Deutsche Bundesstiftung Umwelt (grant no. 20015/408), the Helmholtz-Gemeinschaft (grant no. 01SF9813) and the Ministerstwo Nauki i Szkolnictwa Wyższego (grant no. 16.16.220.842 B02).
This open-access publication was funded by the University of Bayreuth.
This paper was edited by Helge Niemann and reviewed by two anonymous referees.
Ali, H. A. M., Mayes, R. W., Hector, B. L., Verma, A. K., and Ørskov, E. R.: The possible use of n-alkanes, long-chain fatty alcohols and long-chain fatty acids as markers in studies of the botanical composition of the diet of free-ranging herbivores, J. Agr. Sci., 143, 85–95, https://doi.org/10.1017/S0021859605004958, 2005.
Allison, G. B., Gat, J. R., and Leaney, F. W. J.: The relationship between deuterium and oxygen-18 delta values in leaf water, Chem. Geol., 58, 145–156, 1985.
Altermatt, H. A. and Neish, A. C.: The biosynthesis of cell wall carbohydrates: III. Further studies on formation of cellulose and xylan from labeled monosaccharides in wheat plants, Can. J. Biochem. Phys., 34, 405–413, https://doi.org/10.1139/o56-042, 1956.
Amelung, W., Cheshire, M. V., and Guggenberger, G.: Determination of neutral and acidic sugars in soil by capillary gas-liquid chromatography after trifluoroacetic acid hydrolysis, Soil Biol. Biochem., 28, 1631–1639, 1996.
Barbour, M. M. and Farquhar, G. D.: Relative humidity-and ABA-induced variation in carbon and oxygen isotope ratios of cotton leaves, Plant Cell Environ., 23, 473–485, 2000.
Barbour, M. M., Roden, J. S., Farquhar, G. D., and Ehleringer, J. R.: Expressing leaf water and cellulose oxygen isotope ratios as enrichment above source water reveals evidence of a Péclet effect, Oecologia, 138, 426–435, https://doi.org/10.1007/s00442-003-1449-3, 2004.
Bariac, T., Gonzalez-Dunia, J., Katerji, N., Béthenod, O., Bertolini, J. M., and Mariotti, A.: Spatial variation of the isotopic composition of water (18O, 2H) in the soil-plant-atmosphere system, 2. Assessment under field conditions, Chem. Geol., 115, 317–333, 1994.
Benettin, P., Nehemy, M. F., Cernusak, L. A., Kahmen, A. and Jeffrey, J.: On the use of leaf water to determine plant water source: A proof of concept, Scientific Briefing to Hydrological Processes, 35, e14073, https://doi.org/10.1002/hyp.14073, 2021.
Buck, A. L.: New Equations for Computing Vapor Pressure and Enhancement Factor, J. Appl. Meteorol., 20, 1527–1532, 1981.
Burget, E. G., Verma, R., Mølhøj, M., and Reiter, W.-D.: The Biosynthesis of L-Arabinose in Plants: Molecular Cloning and Characterization of a Golgi-Localized UDP-D-Xylose 4-Epimerase Encoded by the MUR4 Gene of Arabidopsis, Plant Cell, 15, 523–531, https://doi.org/10.1105/tpc.008425, 2003.
Bush, R. T., Berke, M. A., and Jacobson, A. D.: Plant water dD and δ18O of tundra species from West Greenland, Arct. Antarct. Alp. Res., 49, 341–358, 2017.
Cernusak, L. A., Wong, S. C., and Farquhar, G. D.: Oxygen isotope composition of phloem sap in relation to leaf water in Ricinus communis, Funct. Plant Biol., 30, 1059–1070, 2003.
Cernusak, L. A., Farquhar, G. D., and Pate, J. S.: Environmental and physiological controls over oxygen and carbon isotope composition of Tasmanian blue gum, Eucalyptus globulus, Tree Physiol., 25, 129–146, https://doi.org/10.1093/treephys/25.2.129, 2005.
Cernusak, L. A., Barbour, M. M., Arndt, S. K., Cheesman, A. W., English, N. B., Feild, T. S., Helliker, B. R., Holloway-Phillips, M. M., Holtum, J. A. M., Kahmen, A., Mcinerney, F. A., Munksgaard, N. C., Simonin, K. A., Song, X., Stuart-Williams, H., West, J. B., and Farquhar, G. D.: Stable isotopes in leaf water of terrestrial plants, Plant Cell Environ., 39, 1087–1102, https://doi.org/10.1111/pce.12703, 2016.
Cheesman, A. W. and Cernusak, L. A.: Infidelity in the outback: Climate signal recorded in Δ18O of leaf but not branch cellulose of eucalypts across an Australian aridity gradient, Tree Physiol., 37, 554–564, https://doi.org/10.1093/treephys/tpw121, 2017.
Coplen, T. B.: Guidelines and recommended terms for expression of stable-isotope-ratio and gas-ratio measurement results, Rapid Commun. Mass Sp., 25, 2538–2560, https://doi.org/10.1002/rcm.5129, 2011.
Cormier, M.-A., Werner, R. A., Sauer, P. E., Gröcke, D. R., Leuenberger, M. C., Wieloch, T., Schleucher, J., and Kahmen, A.: 2H fractiontions during the biosynthesis of carbohydrates and lipids imprint a metabolic signal on the δ2H values of plant organic compounds, New Phytol., 218, 479–491, https://doi.org/10.1111/nph.15016, 2018.
Craig, H.: Isotopic Variations in Meteoric Waters, Science, 133, 1702–1703, 1961.
Craig, H. and Gordon, L. I.: Deuterium and oxygen-18 variations in the ocean and the marine atmosphere, in: Proceedings of a Conference on Stable Isotopes in Oceanographic Studies and Palaeotemperatures, edited by: Tongiorgi, E., 9–130, Lischi and Figli, Pisa, 1965.
Dansgaard, W.: Stable isotopes in precipitation, Tellus, 16, 436–468, https://doi.org/10.1111/j.2153-3490.1964.tb00181.x, 1964.
Dawson, T. E.: Hydraulic lift and water use by plants: implications for water balance, performance and plant-plant interactions, Oecologia, 95, 565–574, 1993.
D'Souza, F., Garg, A., and Bhosle, N. B.: Seasonal variation in the chemical composition and carbohydrate signature compounds of biofilm, Aquat. Microb. Ecol., 41, 199–207, https://doi.org/10.3354/ame041199, 2005.
Farquhar, G. D., Hubick, K. T., Condon, A. G., and Richards, R. A.: Carbon Isotope Fractionation and Plant Water-Use Efficiency, in: Stable Isotopes in Ecological Research, Ecological Studies (Analysis and Synthesis), Vol. 68, edited by: Rundel, P. W., Ehleringer, J. R., and Nagy, K. A., 21–40, Springer-Verlag, New York, 1989.
Feakins, S. J. and Sessions, A. L.: Controls on the ratios of plant leaf waxes in an arid ecosystem, Geochim. Cosmochim. Ac., 74, 2128–2141, https://doi.org/10.1016/j.gca.2010.01.016, 2010.
Flanagan, L. B., Comstock, J. P., and Ehleringer, J. R.: Comparison of Modeled and Observed Environmental Influences on the Stable Oxygen and Hydrogen Isotope Composition of Leaf Water in Phaseolus vulgaris L., Plant Physiol., 96, 588–596, 1991.
Freimuth, E. J., Diefendorf, A. F., and Lowell, T. V.: Hydrogen isotopes of n-alkanes and n-alkanoic acids as tracers of precipitation in a temperate forest and implications for paleorecords, Geochim. Cosmochim. Ac., 206, 166–183, https://doi.org/10.1016/j.gca.2017.02.027, 2017.
Gat, J. R. and Bowser, C. J.: The heavy isotope enrichment of water in coupled evaporative systems, in: Stable Isotope Geochemistry: A Tribute to Samuel Epstein, Vol. 3, edited by: Tayler, H. P., O'Neil, J. R., and Kaplan, I. R., 159–168, The Geochemical Society, Lancester, 1991.
Gat, J. R., Yakir, D., Goodfriend, G., Fritz, P., Trimborn, P., Lipp, J., Gev, I., Adar, E., and Waisel, Y.: Stable isotope composition of water in desert plants, Plant Soil, 298, 31–45, https://doi.org/10.1007/s11104-007-9321-6, 2007.
Gross, S. and Glaser, B.: Minimization of carbon addition during derivatization of monosaccharides for compound-specific δ13C analysis in environmental research, Rapid Commun. Mass Sp., 18, 2753–2764, https://doi.org/10.1002/rcm.1684, 2004.
Harper, A. D. and Bar-Peled, M.: Biosynthesis of UDP-Xylose. Cloning and Characterization of a Novel Arabidopsis Gene Family, UXS, Encoding Soluble and Putative Membrane-Bound UDP-Glucuronic Acid Decarboxylase Isoforms, Gene, 130, 2188–2198, https://doi.org/10.1104/pp.009654, 2002.
Helliker, B. R. and Ehleringer, J. R.: Differential 18O enrichment of leaf cellulose in C3 versus C4 grasses, Funct. Plant Biol., 29, 435–442, 2002a.
Helliker, B. R. and Ehleringer, J. R.: Grass blades as tree rings: environmentally induced changes in the oxygen isotope ratio of cellulose along the length of grass blades, New Phytol., 155, 417–424, 2002b.
Hepp, J., Tuthorn, M., Zech, R., Mügler, I., Schlütz, F., Zech, W., and Zech, M.: Reconstructing lake evaporation history and the isotopic composition of precipitation by a coupled δ18O–δ2H biomarker approach, J. Hydrol., 529, 622–631, 2015.
Hepp, J., Rabus, M., Anhäuser, T., Bromm, T., Laforsch, C., Sirocko, F., Glaser, B., and Zech, M.: A sugar biomarker proxy for assessing terrestrial versus aquatic sedimentary input, Org. Geochem., 98, 98–104, https://doi.org/10.1016/j.orggeochem.2016.05.012, 2016.
Hepp, J., Zech, R., Rozanski, K., Tuthorn, M., Glaser, B., Greule, M., Keppler, F., Huang, Y., Zech, W., and Zech, M.: Late Quaternary relative humidity changes from Mt. Kilimanjaro, based on a coupled 2H-18O biomarker paleohygrometer approach, Quaternary Int., 438, 116–130, https://doi.org/10.1016/j.quaint.2017.03.059, 2017.
Hepp, J., Wüthrich, L., Bromm, T., Bliedtner, M., Schäfer, I. K., Glaser, B., Rozanski, K., Sirocko, F., Zech, R., and Zech, M.: How dry was the Younger Dryas? Evidence from a coupled δ2H–δ18O biomarker paleohygrometer applied to the Gemündener Maar sediments, Western Eifel, Germany, Clim. Past, 15, 713–733, https://doi.org/10.5194/cp-15-713-2019, 2019.
Hepp, J., Schäfer, I. K., Lanny, V., Franke, J., Bliedtner, M., Rozanski, K., Glaser, B., Zech, M., Eglinton, T. I., and Zech, R.: Evaluation of bacterial glycerol dialkyl glycerol tetraether and 2H–18O biomarker proxies along a central European topsoil transect, Biogeosciences, 17, 741–756, https://doi.org/10.5194/bg-17-741-2020, 2020.
Herbin, G. A. and Robins, P. A.: Studies on plant cuticular waxes – II. Alkanes from members of the genus Agave (Agavaceae), the genera Kalanchoe, Echeveria, Crassula and Sedum (Crassulaceae) and the genus Eucalyptus (Myrtaceae) with an examination of Hutchinson, Phytochemistry, 7, 257–268, 1968.
Heyng, A., Mayr, C., Lücke, A., Wissel, H., and Striewski, B.: Late Holocene hydrologic changes in northern New Zealand inferred from stable isotope values of aquatic cellulose in sediments from Lake Pupuke, J. Paleolimnol., 51, 485–497, https://doi.org/10.1007/s10933-014-9769-3, 2014.
Horita, J. and Wesolowski, D. J.: Liquid-vapor fractionation of oxygen and hydrogen isotopes of water from the freezing to the critical temperature, Geochim. Cosmochim. Ac., 58, 3425–3437, https://doi.org/10.1016/0016-7037(94)90096-5, 1994.
Hou, J., D'Andrea, W. J., and Huang, Y.: Can sedimentary leaf waxes record ratios of continental precipitation? Field, model, and experimental assessments, Geochim. Cosmochim. Ac., 72, 3503–3517, https://doi.org/10.1016/j.gca.2008.04.030, 2008.
Huang, Y., Shuman, B., Wang, Y., and Iii, T. W.: Hydrogen isotope ratios of individual lipids in lake sediments as novel tracers of climatic and environmental change: a surface sediment test, J. Paleolimnol., 31, 363–375, 2004.
Jia, G., Dungait, J. A. J., Bingham, E. M., Valiranta, M., Korhola, A., and Evershed, R. P.: Neutral monosaccharides as biomarker proxies for bog-forming plants for application to palaeovegetation reconstruction in ombrotrophic peat deposits, Org. Geochem., 39, 1790–1799, https://doi.org/10.1016/j.orggeochem.2008.07.002, 2008.
Kahmen, A., Dawson, T. E., Vieth, A., and Sachse, D.: Leaf wax n-alkane δD values are determined early in the ontogeny of Populus trichocarpa leaves when grown under controlled environmental conditions, Plant Cell Environ., 34, 1639–1651, https://doi.org/10.1111/j.1365-3040.2011.02360.x, 2011.
Kahmen, A., Schefuß, E., and Sachse, D.: Leaf water deuterium enrichment shapes leaf wax n-alkane δD values of angiosperm plants I: Experimental evidence and mechanistic insights, Geochim. Cosmochim. Ac., 111, 39–49, 2013.
Knapp, D. R.: Handbook of Analytical Derivatization Reactions, John Wiley & Sons, New York, Chichester, Brisbane, Toronto, Singapore, 1979.
Lehmann, M. M., Gamarra, B., Kahmen, A., Siegwolf, R. T. W., and Saurer, M.: Oxygen isotope fractionations across individual leaf carbohydrates in grass and tree species, Plant Cell Environ., 40, 1658–1670, https://doi.org/10.1111/pce.12974, 2017.
Lemma, B., Bittner, L., Glaser, B., Kebede, S., Nemomissa, S., Zech, W., and Zech, M.: δ2Hn-alkanes and δ18Osugar biomarker proxies from leaves and topsoils of the Bale Mountains, Ethiopia, and implications for paleoclimate reconstructions, Biogeochemistry, 153, 135–153, https://doi.org/10.1007/s10533-021-00773-z, 2021.
Liu, H. T., Schäufele, R., Gong, X. Y., and Schnyder, H.: The δ18O and δ2H of water in the leaf growth-and-differentiation zone of grasses is close to source water in both humid and dry atmospheres, New Phytol., 214, 1423–1431, https://doi.org/10.1111/nph.14549, 2017.
Maffei, M.: Chemotaxonomic significance of leaf wax n-alkanes in the umbelliferae, cruciferae and leguminosae (subf. Papilionoideae), Biochem. Syst. Ecol., 24, 531–545, https://doi.org/10.1016/0305-1978(96)00037-3, 1996.
Mayr, C.: Möglichkeiten der Klimarekonstruktion im Holozän mit δ13C- und δ2H-Werten von Baum-Jahrringen auf der Basis von Klimakammerversuchen und Rezentstudien, PhD thesis, Ludwig-Maximilians-Universität München, GSF-Bericht 14/02, 152 pp., ISSN 0721-1694, 2002.
Mayr, C., Laprida, C., Lücke, A., Martín, R. S., Massaferro, J., Ramón-Mercau, J., and Wissel, H.: Oxygen isotope ratios of chironomids, aquatic macrophytes and ostracods for lake-water isotopic reconstructions – Results of a calibration study in Patagonia, J. Hydrol., 529, 600–607, https://doi.org/10.1016/j.jhydrol.2014.11.001, 2015.
McGill, R., Tukey, J. W., and Larsen, W. A.: Variations of Box Plots, Am. Stat., 32, 12–16, 1978.
Merlivat, L.: Molecular diffusivities of HO, HD16O, and HO in gases, J. Chem. Phys., 69, 2864–2871, https://doi.org/10.1063/1.436884, 1978.
Mügler, I., Sachse, D., Werner, M., Xu, B., Wu, G., Yao, T., and Gleixner, G.: Effect of lake evaporation on δD values of lacustrine n-alkanes: A comparison of Nam Co (Tibetan Plateau) and Holzmaar (Germany), Org. Geochem., 39, 711–729, 2008.
Prietzel, J., Dechamps, N., and Spielvogel, S.: Analysis of non-cellulosic polysaccharides helps to reveal the history of thick organic surface layers on calcareous Alpine soils, Plant Soil, 365, 93–114, https://doi.org/10.1007/s11104-012-1340-2, 2013.
Rao, Z., Zhu, Z., Jia, G., Henderson, A. C. G., Xue, Q., and Wang, S.: Compound specific δD values of long chain n-alkanes derived from terrestrial higher plants are indicative of the δD of meteoric waters: Evidence from surface soils in eastern China, Org. Geochem., 40, 922–930, https://doi.org/10.1016/j.orggeochem.2009.04.011, 2009.
R Core Team: R: A Language and Environment for Statistical Computing, available at: https://www.r-project.org/ (last access: 21 October 2018), 2015.
Roden, J. S. and Ehleringer, J. R.: Observations of Hydrogen and Oxygen Isotopes in Leaf Water Confirm the Craig-Gordon Model under Wide-Ranging Environmental Conditions, Plant Physiol., 120, 1165–1173, 1999.
Sachse, D., Radke, J., and Gleixner, G.: Hydrogen isotope ratios of recent lacustrine sedimentary n-alkanes record modern climate variability, Geochim. Cosmochim. Ac., 68, 4877–4889, https://doi.org/10.1016/j.gca.2004.06.004, 2004.
Sachse, D., Billault, I., Bowen, G. J., Chikaraishi, Y., Dawson, T. E., Feakins, S. J., Freeman, K. H., Magill, C. R., McInerney, F. A., van der Meer, M. T. J., Polissar, P., Robins, R. J., Sachs, J. P., Schmidt, H.-L., Sessions, A. L., White, J. W. C., and West, J. B.: Molecular Paleohydrology: Interpreting the Hydrogen-Isotopic Composition of Lipid Biomarkers from Photosynthesizing Organisms, Annu. Rev., 40, 221–249, https://doi.org/10.1146/annurev-earth-042711-105535, 2012.
Santrucek, J., Kveton, J., Setlik, J., and Bulickova, L.: Spatial Variation of Deuterium Enrichment in Bulk Water of Snowgum Leaves, Plant Physiol., 143, 88–97, https://doi.org/10.1104/pp.106.089284, 2007.
Sauer, P. E., Eglinton, T. I., Hayes, J. M., Schimmelmann, A., and Sessions, A. L.: Compound-specific ratios of lipid biomarkers from sediments as a proxy for environmental and climatic conditions, Geochim. Cosmochim. Ac., 65, 213–222, https://doi.org/10.1016/S0016-7037(00)00520-2, 2001.
Schäfer, I. K., Lanny, V., Franke, J., Eglinton, T. I., Zech, M., Vysloužilová, B., and Zech, R.: Leaf waxes in litter and topsoils along a European transect, SOIL, 2, 551–564, https://doi.org/10.5194/soil-2-551-2016, 2016.
Schmidt, H.-L., Werner, R. A., and Roßmann, A.: 18O Pattern and biosynthesis of natural plant products, Phytochemistry, 58, 9–32, https://doi.org/10.1016/S0031-9422(01)00017-6, 2001.
Schmidt, H.-L., Werner, R. A., and Eisenreich, W.: Systematics of 2H patterns in natural compounds and its importance for the elucidation of biosynthetic pathways, Phytochem. Rev., 2, 61–85, https://doi.org/10.1023/B:PHYT.0000004185.92648.ae, 2003.
Sessions, A. L., Burgoyne, T. W., Schimmelmann, A., and Hayes, J. M.: Fractionation of hydrogen isotopes in lipid biosynthesis, Org. Geochem., 30, 1193–1200, 1999.
Song, X., Farquhar, G. D., Gessler, A., and Barbour, M. M.: Turnover time of the non-structural carbohydrate pool influences δ18O of leaf cellulose, Plant Cell Environ., 37, 2500–2507, https://doi.org/10.1111/pce.12309, 2014.
Sternberg, L. and Ellsworth, P. F. V.: Divergent Biochemical Fractionation, Not Convergent Temperature, Explains Cellulose Oxygen Isotope Enrichment across Latitudes, PLoS ONE, 6, e28040, https://doi.org/10.1371/journal.pone.0028040, 2011.
Sternberg, L. da S. L. O. and DeNiro, M. J. D.: Biogeochemical implications of the isotopic equilibrium fractionation factor between the oxygen atoms of acetone and water, Geochim. Cosmochim. Ac., 47, 2271–2274, https://doi.org/10.1016/0016-7037(83)90049-2, 1983.
Sternberg, L. S. L., DeNiro, M. J., and Savidge, R. A.: Oxygen Isotope Exchange between Metabolites and Water during Biochemical Reactions Leading to Cellulose Synthesis, Plant Physiol., 82, 423–427, 1986.
Strobel, P., Haberzettl, T., Bliedtner, M., Struck, J., Glaser, B., Zech, M., and Zech, R.: The potential of δ2Hn-alkanes and δ18Osugar for paleoclimate reconstruction – A regional calibration study for South Africa, Sci. Total Environ., 716, 137045, https://doi.org/10.1016/j.scitotenv.2020.137045, 2020.
Tipple, B. J., Berke, M. A., Doman, C. E., Khachaturyan, S., and Ehleringer, J. R.: Leaf-wax n-alkanes record the plant-water environment at leaf flush, P. Natl. Acad. Sci., 110, 2659–2664, https://doi.org/10.1073/pnas.1213875110, 2013.
Tipple, B. J., Berke, M. A., Hambach, B., Roden, J. S., and Ehleringer, J. R.: Predicting leaf wax n-alkane ratios: Controlled water source and humidity experiments with hydroponically grown trees confirm predictions of Craig-Gordon model, Plant Cell Environ., 38, 1035–1047, https://doi.org/10.1111/pce.12457, 2015.
Tuthorn, M., Zech, M., Ruppenthal, M., Oelmann, Y., Kahmen, A., del Valle, H. F., Wilcke, W., and Glaser, B.: Oxygen isotope ratios () of hemicellulose-derived sugar biomarkers in plants, soils and sediments as paleoclimate proxy II: Insight from a climate transect study, Geochim. Cosmochim. Ac., 126, 624–634, https://doi.org/10.1016/j.gca.2013.11.002, 2014.
Tuthorn, M., Zech, R., Ruppenthal, M., Oelmann, Y., Kahmen, A., del Valle, H. F., Eglinton, T., Rozanski, K., and Zech, M.: Coupling δ2H and δ18O biomarker results yields information on relative humidity and isotopic composition of precipitation – a climate transect validation study, Biogeosciences, 12, 3913–3924, https://doi.org/10.5194/bg-12-3913-2015, 2015.
Walker, C. D. and Brunel, J.-P.: Examining Evapotranspiration in a Semi-Arid Region using Stable Isotopes of Hydrogen and Oxygen, J. Hydrol., 118, 55–75, 1990.
Wang, X.-F., Yakir, D., and Avisha, M.: Non-climatic variations in the oxygen isotopic composition of plants, Glob. Change Biol., 4, 835–849, 1998.
Waterhouse, J. S., Cheng, S., Juchelka, D., Loader, N. J., McCarroll, D., Switsur, V. R., and Gautam, L.: Position-specific measurement of oxygen isotope ratios in cellulose: Isotopic exchange during heterotrophic cellulose synthesis, Geochim.t Cosmochim. Ac., 112, 178–191, https://doi.org/10.1016/j.gca.2013.02.021, 2013.
Werner, R. A. and Brand, W. A.: Referencing strategies and techniques in stable isotope ratio analysis, Rapid Commun. Mass Sp., 15, 501–519, https://doi.org/10.1002/rcm.258, 2001.
Wissel, H., Mayr, C., and Lücke, A.: A new approach for the isolation of cellulose from aquatic plant tissue and freshwater sediments for stable isotope analysis, Org. Geochem., 39, 1545–1561, https://doi.org/10.1016/j.orggeochem.2008.07.014, 2008.
Yakir, D. and DeNiro, M. J.: Oxygen and Hydrogen Isotope Fractionation during Cellulose Metabolism in Lemna gibba L., Plant Ecol., 93, 325–332, 1990.
Zech, M. and Glaser, B.: Compound-specific δ18O analyses of neutral sugars in soils using gas chromatography-pyrolysis-isotope ratio mass spectrometry: problems, possible solutions and a first application, Rapid Commun. Mass Sp., 23, 3522–3532, https://doi.org/10.1002/rcm.4278, 2009.
Zech, M., Pedentchouk, N., Buggle, B., Leiber, K., Kalbitz, K., Markovic, S. B., and Glaser, B.: Effect of leaf litter degradation and seasonality on isotope ratios of n-alkane biomarkers, Geochim. Cosmochim. Ac., 75, 4917–4928, https://doi.org/10.1016/j.gca.2011.06.006, 2011.
Zech, M., Werner, R. A., Juchelka, D., Kalbitz, K., Buggle, B. and Glaser, B.: Absence of oxygen isotope fractionation/exchange of (hemi-) cellulose derived sugars during litter decomposition, Org. Geochem., 42, 1470–1475, https://doi.org/10.1016/j.orggeochem.2011.06.006, 2012.
Zech, M., Tuthorn, M., Detsch, F., Rozanski, K., Zech, R., Zöller, L., Zech, W., and Glaser, B.: A 220 ka terrestrial δ18O and deuterium excess biomarker record from an eolian permafrost paleosol sequence, NE-Siberia, Chem. Geol., 360–361, 220–230, https://doi.org/10.1016/j.chemgeo.2013.10.023, 2013a.
Zech, M., Tuthorn, M., Glaser, B., Amelung, W., Huwe, B., Zech, W., Zöller, L., and Löffler, J.: Natural abundance of δ18O of sugar biomarkers in topsoils along a climate transect over the Central Scandinavian Mountains, Norway, J. Plant Nutr. Soil Sc., 176, 12–15, https://doi.org/10.1002/jpln.201200365, 2013b.
Zech, M., Mayr, C., Tuthorn, M., Leiber-Sauheitl, K., and Glaser, B.: Oxygen isotope ratios () of hemicellulose-derived sugar biomarkers in plants, soils and sediments as paleoclimate proxy I: Insight from a climate chamber experiment, Geochim. Cosmochim. Ac., 126, 614–623, https://doi.org/10.1016/j.gca.2013.10.048, 2014a.
Zech, M., Mayr, C., Tuthorn, M., Leiber-Sauheitl, K., and Glaser, B.: Reply to the comment of Sternberg on “Zech et al. (2014) Oxygen isotope ratios () of hemicellulose-derived sugar biomarkers in plants, soils and sediments as paleoclimate proxy I: Insight from a climate chamber experiment. GCA, Geochim. Cosmochim. Ac., 141, 680–682, https://doi.org/10.1016/j.gca.2014.04.051, 2014b.
Zech, M., Zech, R., Rozanski, K., Gleixner, G., and Zech, W.: Do n-alkane biomarkers in soils/sediments reflect the δ2H isotopic composition of precipitation? A case study from Mt. Kilimanjaro and implications for paleoaltimetry and paleoclimate research, Isot. Environ. Healt. S., 51, 508–524, https://doi.org/10.1080/10256016.2015.1058790, 2015.
Zhang, X., Gillespie, A. L., and Sessions, A. L.: Large variations in bacterial lipids reflect central metabolic pathways, P. Natl. Acad. Sci. USA, 106, 12580–12586, 2009.
Zhou, Y., Grice, K., Stuart-Williams, H., Farquhar, G. D., Hocart, C. H., Lu, H., and Liu, W.: Biosynthetic origin of the saw-toothed profile in δ13C and δ2H of n-alkanes and systematic isotopic differences between n-, iso- and anteiso-alkanes in leaf waxes of land plants, Phytochemistry, 71, 388–403, https://doi.org/10.1016/j.phytochem.2009.11.009, 2010.