the Creative Commons Attribution 4.0 License.
the Creative Commons Attribution 4.0 License.
 | 20 Oct 2021
Towards a history of Holocene P dynamics for the Northern Hemisphere using lake sediment geochemical records
John F. Boyle
Richard C. Chiverrell
Present-day lake water phosphorus (P) enrichment and accelerated P cycling are changes superimposed on a dynamic Holocene history of landscape development following glaciation, changes in climate, and long-term low-intensity human activity. Knowledge of the history of long-term P dynamics is essential for understanding present-day landscape P export and for managing both terrestrial and aquatic environments. This study is the first attempt to constrain the timing and magnitude of terrestrial changes in Holocene P dynamics across the Northern Hemisphere using lake sediment records.
Here we reconstruct trajectories in terrestrial Holocene P dynamics for the Northern Hemisphere. We apply a simple process model to published lake sediment geochemical P records from 24 sites, producing records of landscape P yield and reconstructing lake water total phosphorus (TP) concentrations. Individual site trajectories of landscape P yield and lake water TP vary systematically, with differences attributable to local landscape development history. Three distinct traits are apparent. Mountain sites with minimal direct human impact show falling P supply and conform to conceptual models of natural soil development (Trait 1). Lowland sites where substantial (pre-)historic agriculture was present show progressively increasing P supply (Trait 2). Lowland sites may also show a rapid acceleration in P supply over the last few centuries, where high-intensity land use, including settlements and farming, is present (Trait 3). Where data availability permitted comparison, our reconstructed TP records agree well with monitored lake water TP data, and our sediment-inferred P yields are comparable to reported catchment export coefficients. Comparison with diatom-inferred TP reveals good agreement for recent records.
Our reconstructions form the first systematic assessment of average terrestrial P export for the Northern Hemisphere over the Holocene and provide the empirical data needed for constraining long-term landscape P cycling models and values for terrestrial P export that could be used for ocean P cycling models. The long-term perspective provided by our sediment-inferred TP can be used to identify pre-disturbance baselines for lake water quality, information essential to target-driven lake management. We find the first detectable anthropogenic impacts on P cycling ca. 6000 BP, with more substantial impacts as early as 3000 BP. Consequently, to characterize pre-disturbance lake P conditions at Trait 2 and Trait 3 sites, it is necessary to consider time periods before the arrival of early farmers. Our use of trait classifications has a predictive power for sites without sediment records, allowing prediction of TP baselines and P trajectories based on regional landscape development history.
- Article
(4791 KB) - Full-text XML
- BibTeX
- EndNote


Present-day lake water phosphorus (P) enrichment and accelerated P cycling are changes superimposed on a dynamic Holocene history of landscape development following glaciation, changes in climate, and long-term low-intensity human activity (Boyle et al., 2015; Filippelli and Souch, 1999). Recent moves to mitigate the effects of anthropogenic nutrient enrichment on lakes, through the identification of lake water total phosphorus (TP) reference conditions and targets, require a thorough quantitative knowledge of this dynamic past, because lake P availability ultimately depends on the terrestrial P cycle. Consequently, a crucial task in palaeolimnology is to provide accurate histories of catchment P yield and lake water TP.
Reconstructed P yield records have application beyond limnology. For example, they can provide the empirical data needed for constraining long-term landscape P cycling models. Furthermore, there are parallels between records of catchment P yield and monitored riverine P flux data, both describing export from terrestrial systems. Values for terrestrial P export are applied to ocean biogeochemical models and are currently supplied by riverine data which lack the long-term (millennial) temporal perspective of lake sediment P yield records (Sharples et al., 2017).
Total phosphorus records and reference values based on diatom inference models are well established (Battarbee and Bennion, 2012; Hall and Smol, 2010) and extensively applied to quantify TP changes in recent centuries. However, at Holocene timescales diatom TP records are scarce, whereas geochemical records of lake sediment phosphorus concentrations are more numerous. These geochemical records have previously been considered unsuitable for inferring quantitative lake water TP records because lake sediment P concentrations are not correlated with TP concentrations in the overlying lake water (Ginn et al., 2012). However, Moyle and Boyle (2021) show that, at suitable sites, lake-wide average sediment P burial rates provide an unbiased record of long-term average past catchment P yield and lake water TP, and their mass balance model is process-realistic, based on simple measurable parameters, and uses a universal calibration.
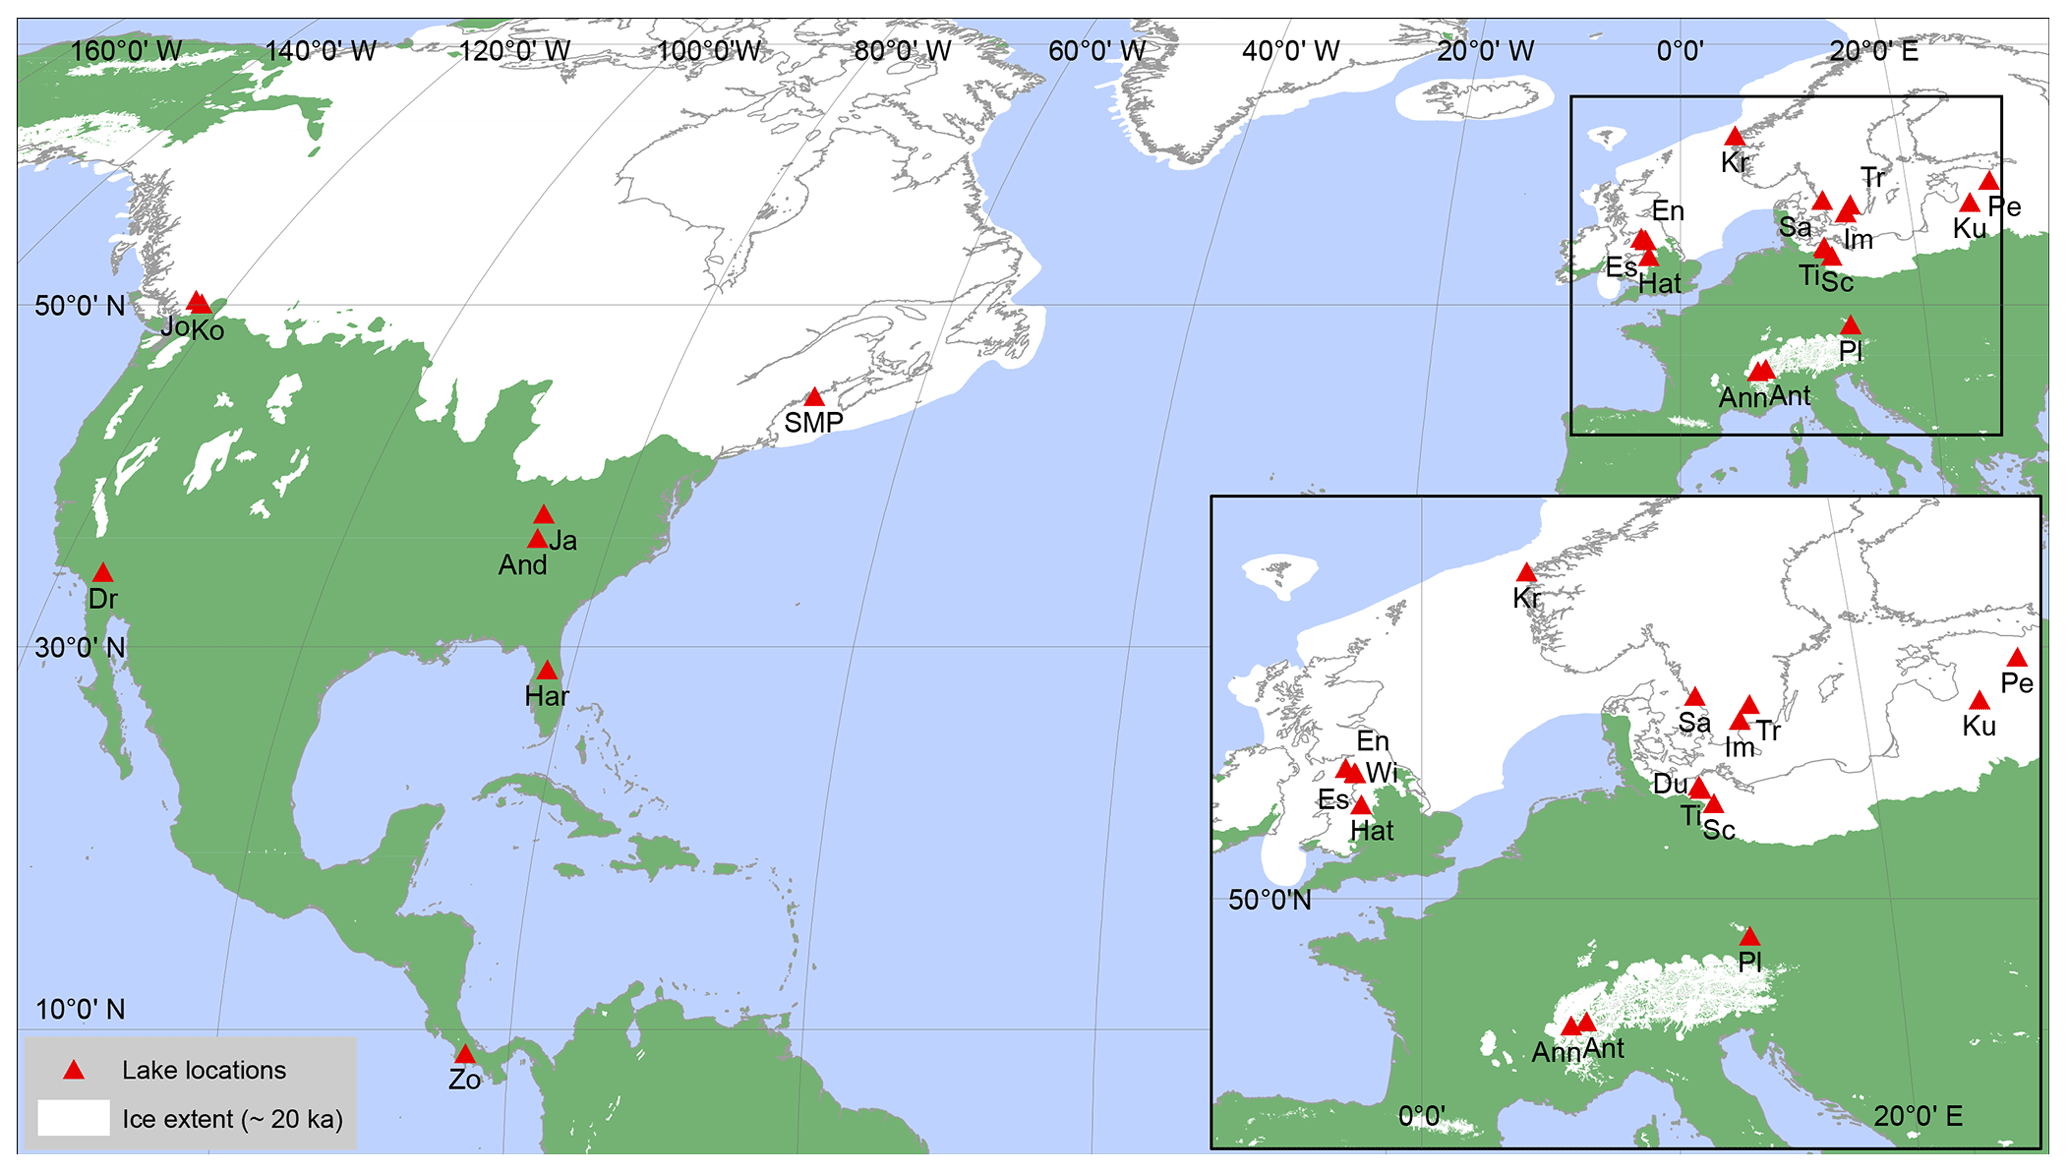
Figure 1Spatial distribution of the 24 lake sites: Lac d'Annecy (Ann), Plešné Lake (Pl), Hatchmere, (Hat), Lake Peipsi (Pe), Sargent Mountain Pond (SMP), Dudinghauser See (Du), Schulzensee (Sc), Tiefer See (Ti), Lac d'Anterne (Ant), Lake Harris (Har), Jackson Pond (Ja), Anderson Pond (And), Dry Lake (Dr), Kokwaskey Lake (Ko), Windermere (Wi), Ennerdale Water (En), Esthwaite (Es), Kråkenesvatn (Kr), Laguna Zoncho (Zo), Lower Joffre Lake (Jo), Sämbosjön (Sa), Lake Trummen (Tr), Lake Immeln (Im), and Ķūži (Ku).
Here we apply the SI-TP (Sediment-inferred TP) model of Moyle and Boyle (2021) to a set of published lake sediment P concentration profiles, generating P yield and sediment-inferred lake water TP records. This improves the value of the data for a range of research applications. A total of 24 lake sites were found that had both useable published Holocene P records and the relevant catchment information needed to apply the mass balance model (Fig. 1). Several other sites with Holocene P records were excluded for lack of catchment data. While our search will undoubtedly have missed other suitable studies, our dataset has sufficient spatial coverage to start addressing geographical variation in long-term P dynamics, constrained to the Northern Hemisphere due to site locations.
Our objectives were to
-
compile a dataset of lake-sediment-derived P yield and lake water TP histories from published sediment geochemical records representing a diverse range of lake sites,
-
(Moyle and Boyle, 2021) analyse Holocene P yield and lake water TP trajectories to evaluate natural and anthropogenic controls over long-term variation, and
-
consider the temporal patterns and likely controls in relation to the quantification of lake water TP reference conditions and restoration targets.
2.1 The SI-TP model
The SI-TP model, described in detail and validated in Moyle and Boyle (2021), is a simple process model based on lake mass balance models developed in the 1970s but reframed from a lake sediment perspective. Lake sediment core data for apparent P burial loading (Lcore, where L refers to a lake-bed normalized flux) are adjusted for focussing effects to estimate the lake-wide mean P sediment burial loading (Lsed; Eq. 1). This key variable is then used to estimate the input loading (Lin; Eq. 2), and from that the catchment P yield (Pyield; Eq. 3), and to estimate past lake water TP (TPlake; Eq. 4) (Moyle and Boyle, 2021). This means that the calculated P yield values come directly from the sediment record and not from a hydrochemical mass balance, i.e. runoff and inflow TP concentration. The phosphorus retention coefficient, RP, is the only model parameter that cannot easily be measured at each site owing to the time and cost of obtaining suitable data. However, it may be predicted using empirical models, and we use three different values to obtain a range of estimated TP and P yield values. The first RP value is estimated using the model of Kirchner and Dillon (1975). The second and third RP values are estimated using the Vollenweider (1975) model and are based on two values for apparent settling velocity (v): v = 10, from Vollenweider's original model, and v = 29, representing the Great Lakes, which are known to have exceptionally high apparent settling velocities (Chapra and Dolan, 2012). These represent the typical upper and lower limits of published v values and capture the range of possible TP and P yield reconstructed values. The Moyle and Boyle (2021) SI-TP model thus has a universal calibration and requires no local parameterization. In the following equations is lake mean depth (m), zcore is water depth at coring location (m), AL is lake area (km2), AC is terrestrial catchment area (km2), and qs is the lake water loading (m yr−1), equal to the total annual water supply (m3 yr−1) divided by the lake area (m2).
2.2 Sediment-inferred lake water TP
For the SI-TP model, all outputs represent long-term average values, where long-term means ≫ annual (i.e. at least multi-annual to decadal scales) but is not precisely defined (Moyle and Boyle, 2021). This constrains the temporal resolution of any reconstructed record, which therefore cannot represent individual (sub)annual values of lake water TP. The temporal resolution of the reconstructed record is further constrained by the nature of the sediment record on which it is based. Lsed represents the long-term average P burial rate, which is subject to smoothing due to both sediment bioturbation and diagenetic migration (Moyle and Boyle, 2021) prior to the signal being locked in (Jilbert et al., 2020). Resolution can vary considerably, but we assume typical values on the order of multi-annual to decadal; however in very slowly accumulating sediments this may be longer. The temporally smoothed nature of the sediment-inferred TP record is in sharp contrast with the instantaneous spot values obtained by monitoring, the former representing an attractor value about which the latter varies. In the original model paper, Moyle and Boyle (2021) refer to the sediment-inferred long-term average lake water TP as TPlake, labelled after the parameter it estimates. However, to avoid confusion with high-resolution monitored TP values (also TPlake) we introduce the term SI-TP to represent the long-term average sediment-inferred TP values. Analogous to diatom-inferred TP (DI-TP) and chironomid-inferred TP (CI-TP) (Brooks et al., 2001), this term aids clarity by distinguishing the smoothed response in the sediment record from the more volatile response of lake water TP. SI-TP can now be substituted for TPlake in Eq. (4).
Throughout this study, SI-TP concentrations are reported in mg m−3 rather than µg L−1. The two units are numerically identical; however the former is preferred in this modelling context because it allows for easier conversion to unit area in metres.
2.3 Data extraction from published records
The lake sediment dataset comes from many different publications spanning more than 40 years. These studies vary greatly in formatting, terminology, methodology, and what information is included (including whether data are available as a supplement or in a repository). In particular, units and naming conventions were found to lack standardization. The availability of reported geochemical, hydrological, and morphological information needed for this study was also found to vary between the publications; therefore a fully standardized methodology was not possible. Where suitable data were published, standard methods have been used as detailed along with the data references in Tables B1 to B3. However, where available information required an alternative approach, data and calculations are described below on a site-specific basis with further references in Tables B1, B2, and B5.
2.3.1 Dry density models
Where water contents have been reported, dry density (g cm−3) is given by
where W is water content (mass fraction), dw is the density of water (taken as 1 g cm−3), and ds is the particle solid density (typically 2.7 g cm−3 for minerogenic sediment).
Several studies did not report either density or water content data, from which dry density can be estimated reliably. We have taken two approaches to estimating dry density data in these cases. First, for sites that reported loss on ignition (LOI) we applied an empirical model based on the association of LOI with dry density (Eq. 6; Fig. A1). Sites in this category include Lake Windermere, Ennerdale Water, Esthwaite Water, Schulzensee, Dudinghauser See, Tiefer See, and Laguna Zoncho. The relationship between dry density and LOI was established using data from three of the sites reported in this paper (Hatchmere, Lake Immeln, and Lake Ķūži), together with data from Linsley Pond (Livingstone and Boykin, 1962) and Crosemere (Beales, 1980). Dry density (g cm−3) was calculated from LOI (wt %) where
Second, in the case of Lac d'Anterne, where LOI was not reported, we assumed a density based on an analogue site with carbonate-rich sediment. We assumed the sediment to have 40 % water content based on the typical content at Lac d'Annecy (Loizeau et al., 2001).
2.3.2 Lake depth
Where lake mean depth ( or core depth (zcore) was not reported, a default focussing factor () of 0.5 was used to calculate Lsed, following Boyle et al. (2013). This rounded value, which assumes the coring took place at the deepest point of the lake, compares well with the study lakes for which we have measured depths (focussing factor 0.47 ± 0.12).
2.3.3 Individual site methodology
Lac d'Annecy
Holocene P data came from Loizeau et al. (2001). The age–depth model was created using rbacon (Blaauw and Christen, 2011) with 14C ages from Brauer and Casanova (2001), with a base depth of 1000 cm. Dry density (g cm−3) was calculated from the water content record (Loizeau et al., 2001) using a density of 2.7 g cm−3 (calcite) for particulate matter using Eq. (5). Mass accumulation rate () was calculated using reported sediment accumulation rate (cm yr−1) from the age–depth model output and calculated dry density. Runoff was calculated from qs using AL and AC (Tables B1 and B4).
Lac d'Anterne
Holocene P (P2O5) and sediment accumulation rate data came from Giguet-Covex et al. (2011). To get matching ages, sediment accumulation rate was interpolated in R using approxfun(method = linear) from the “stats” package (R Core Team, 2020). Dry density was calculated using Eq. (5), assuming the same average sediment water content as Lac d'Annecy (40 wt %) and a density of 2.7 g cm−3 (calcite) for particulate matter. Runoff was calculated from MAP and MAT (Tables B1 and B4) using the equation of Turc (1954).
Tiefer See
Holocene P data and sediment accumulation rate came from Selig et al. (2007). LOI also came from Selig et al. (2007) and was interpolated in R using approxfun(method = linear) from the “stats” package (R Core Team, 2020) to match the depths in the P data. Dry density was calculated using Eq. (6). The age–depth model was created using rbacon (Blaauw and Christen, 2011) with 14C ages from Schwarz (2006). zcore was assumed to be equal to zmax. Runoff was calculated from MAP and MAT (Tables B1 and B4) using the equation of Turc (1954).
Schulzensee
Holocene P data and sediment accumulation rate came from Selig et al. (2007). P concentration was smoothed using a five-point moving average. LOI also came from Selig et al. (2007) and was interpolated in R using approxfun(method = linear) from the “stats” package (R Core Team, 2020) to match the depths in the P data. Dry density was calculated using Eq. (6). The age–depth model was created in R using rbacon (Blaauw and Christen, 2011) with 14C ages from Schwarz (2006) and the age of Laacher See Tephra (12 900 BP) from Bronk Ramsey et al. (2015). zcore was assumed to be equal to zmax.
Dudinghauser See
Holocene P data and sediment accumulation rate came from Selig et al. (2007). LOI also came from Selig et al. (2007) and was interpolated in R using approxfun(method = linear) from the “stats” package (R Core Team, 2020) to match the depths in the P data. Dry density was calculated using Eq. (6). The age–depth model was created using rbacon (Blaauw and Christen, 2011) with 14C ages from Dreßler et al. (2006). zcore was assumed to be equal to zmax. Runoff was calculated from MAP and MAT (Tables B1 and B4) using the equation of Turc (1954).
Lake Ķūži
Holocene P concentration and mass accumulation rate data came from Terasmaa et al. (2013). zcore was assumed to be equal to zmax. Runoff was calculated from qs using AL and AC (Tables B1 and B4).
Ennerdale Water
Holocene P concentration and LOI data came from Mackereth (1966). Dry density was calculated using Eq. (6). The age model assumes constant accumulation, and the clay junction at 580 cm was taken to represent the start of the Holocene at 11 700 b2k (11 650 cal BP). zcore was assumed to be equal to zmax.
Windermere
Holocene P concentration and LOI data came from Mackereth (1966). Dry density was calculated using Eq. (6). The age model assumes constant accumulation, and the clay junction at 450 cm was taken to represent the start of the Holocene at 11 700 b2k (11 650 BP). zcore was assumed to be equal to zmax.
Esthwaite Water
Holocene P concentration and LOI data came from Mackereth (1966). Dry density was calculated using Eq. (6). The age model assumes constant accumulation, and the clay junction at 460 cm was taken to represent the start of the Holocene at 11 700 b2k (11 650 BP). zcore was assumed to be equal to zmax.
Lake Peipsi
Holocene P concentration data came from Kisand et al. (2017). Water content came from Leeben et al. (2010) and was interpolated in R using approxfun(method = linear) from the “stats” package (R Core Team, 2020) to match the P depths. This was used to calculate dry density using a density of 2.7 for particulate matter (Eq. 5). Annual depth equivalent runoff (m yr−1) was assumed to be the same as the closest river (Stålnacke et al., 1998). The age–depth model was created using rbacon (Blaauw and Christen, 2011) with 14C ages from Leeben et al. (2010) in order to generate depths to calculate sediment accumulation rate.
Plešné Lake
We obtained raw data from Jiri Kopáček (2019, personal communication) for the P concentration data in Kopáček et al. (2007) and mass accumulation rate data in Norton et al. (2016).
Hatchmere
Holocene P concentration and flux (Lcore) data came from Boyle et al. (2015).
Sargent Mountain Pond
Holocene P flux (Lcore) data came from Norton et al. (2011). A default focussing factor of 0.5 was used to calculate Lsed, because is not known. Runoff was calculated from MAP and MAT (Tables B1 and B4) using the equation of Turc (1954).
Kråkenesvatn
Holocene P flux (Lcore) data are as reported by Boyle et al. (2013), with additional unpublished sample data from 4000 BP to the recent period. A default focussing factor value of 0.5 was used because and zcore are poorly known. Runoff (m yr−1) was estimated using gridded climate data (averaged between 1971 and 2000) from the Norwegian Meteorological Institute (Norsk Klimaservicesenter, 2021) using the Turc equation (Turc, 1954).
Lake Immeln
Holocene P concentration, dry density, and sediment accumulation rate came from Digerfeldt (1974). The core was assumed to be representative of the entire lake, and the full AL and AC values were used. A focussing factor of 1 was used to calculate Lsed because zcore was very similar to the approximate . The age–depth model was created using rbacon (Blaauw and Christen, 2011) with 14C ages from Digerfeldt (1974). The age for the top of the core was assumed to be 1970 CE because no coring year was given. Runoff was calculated from MAP and MAT (Tables B1 and B4) using the equation of Turc (1954).
Lake Trummen
Holocene P flux data came from Digerfeldt (1972). zcore was assumed to be equal to zmax. The output of the Lake Immeln age–depth model was used to provide recalibrated ages for the zone boundaries identified in Lake Trummen (Digerfeldt, 1974). Runoff was calculated from MAP and MAT (Tables B1 and B4) using the equation of Turc (1954).
Jackson Pond
P flux data came from Filippelli and Souch (1999). A default focussing factor value of 0.5 was used because the site is now terrestrialized such that and zcore are meaningless here. There are no catchment area data available, so an AC:AL ratio of 10 was used for calculation of P yield and SI-TP. Runoff was calculated from MAP and MAT (Tables B1 and B4) using the equation of Turc (1954).
Anderson Pond
P flux data came from Filippelli and Souch (1999). A default focussing factor value of 0.5 was used because the site is now terrestrialized such that and zcore are meaningless here. There are no catchment area data available, so an AC:AL ratio of 10 was used for calculation of P yield and lake SI-TP. Runoff was calculated from MAP and MAT (Tables B1 and B4) using the equation of Turc (1954).
Kokwaskey Lake
P flux data came from Filippelli and Souch (1999). A default focussing factor value of 0.5 was used because and zcore are not stated. Runoff was estimated from nearby stream data (Menounos, 2002). AC is approximated from Souch (2004), and AL was estimated from map data.
Lower Joffre Lake
Holocene P concentration came from Filippelli et al. (2006) and was interpolated in R using approxfun(method = linear) from the “stats” package (R Core Team, 2020) to match the dry density intervals. The age–depth model was created using rbacon (Blaauw and Christen, 2011) with 14C ages from Menounos (2002), truncated at 600 cm, and the sediment accumulation rate output from the model was combined with dry density from Menounos (2002) to calculate mass accumulation rate.
Lake Harris
Holocene P concentration and water content came from Kenney et al. (2016). Water content was used to calculate dry density using a density of 2.7 g cm−3 for particulate matter. The age–depth model was created using rbacon (Blaauw and Christen, 2011) with 14C ages from Kenney et al. (2016), and the sediment accumulation rate output from the model was combined with dry density to calculate mass accumulation rate. An AL:AC ratio of 1:10 has been used because AC is not known. Since zcore was not quoted, a value of 7 m was used based on coring location sediment thickness (Kenney et al., 2016) and the likely coring location determined from a map of lake sediment thickness (Danek et al., 1991).
Sämbosjön
Holocene P concentration and flux (Lcore) came from Digerfeldt and Håkansson (1993). A default focussing factor value of 0.5 was used because is not reported. Runoff was calculated from MAP and MAT (Tables B1 and B4) using the equation of Turc (1954).
Dry lake
Holocene P flux (Lcore) data came from Filippelli and Souch (1999). A default focussing factor value of 0.5 was used because and zcore are not stated. Runoff (m yr−1) was estimated from nearby river flow data (USGS 11051499 Santa Ana R nr Mentone (River Only), CA. (U.S. Geological Survey, 2020)). AL was estimated from map data.
Laguna Zoncho
Holocene P concentration and inorganic content came from Filippelli et al. (2010). Dry density was calculated from inorganic content (100-LOI) using Eq. (6). The age–depth model was created using rbacon (Blaauw and Christen, 2011) with 14C ages from Clement and Horn (2001), and the sediment accumulation rate output from the model was combined with dry density to calculate mass accumulation rate. A default focussing factor value of 0.5 was used because is not reported. Runoff was calculated from MAP and MAT (Tables B1 and B4) using the equation of Turc (1954).
2.4 Temporal subdivisions
In addition to analysing the overall patterns in each record, we have separated the records into early, middle, and late Holocene to further analyse change through time. The ages used for these three periods broadly follow the IUGS Holocene subdivisions (Walker et al., 2018). We have further subdivided the late Holocene to separate out the recent period of rapid change towards the present day, using a boundary at 100 BP (1850 CE), broadly coincident with the end of the Little Ice Age (Grove, 1988). In the case of the recent period, the ages chosen capture the post-1850 increase in TP concentrations seen in many lake records (Battarbee et al., 2011). The four periods used are early Holocene (11 650 to 8200 BP), mid-Holocene (8200 to 4200 BP), late Holocene (4200 to 100 BP), and the recent period (100 BP to present).
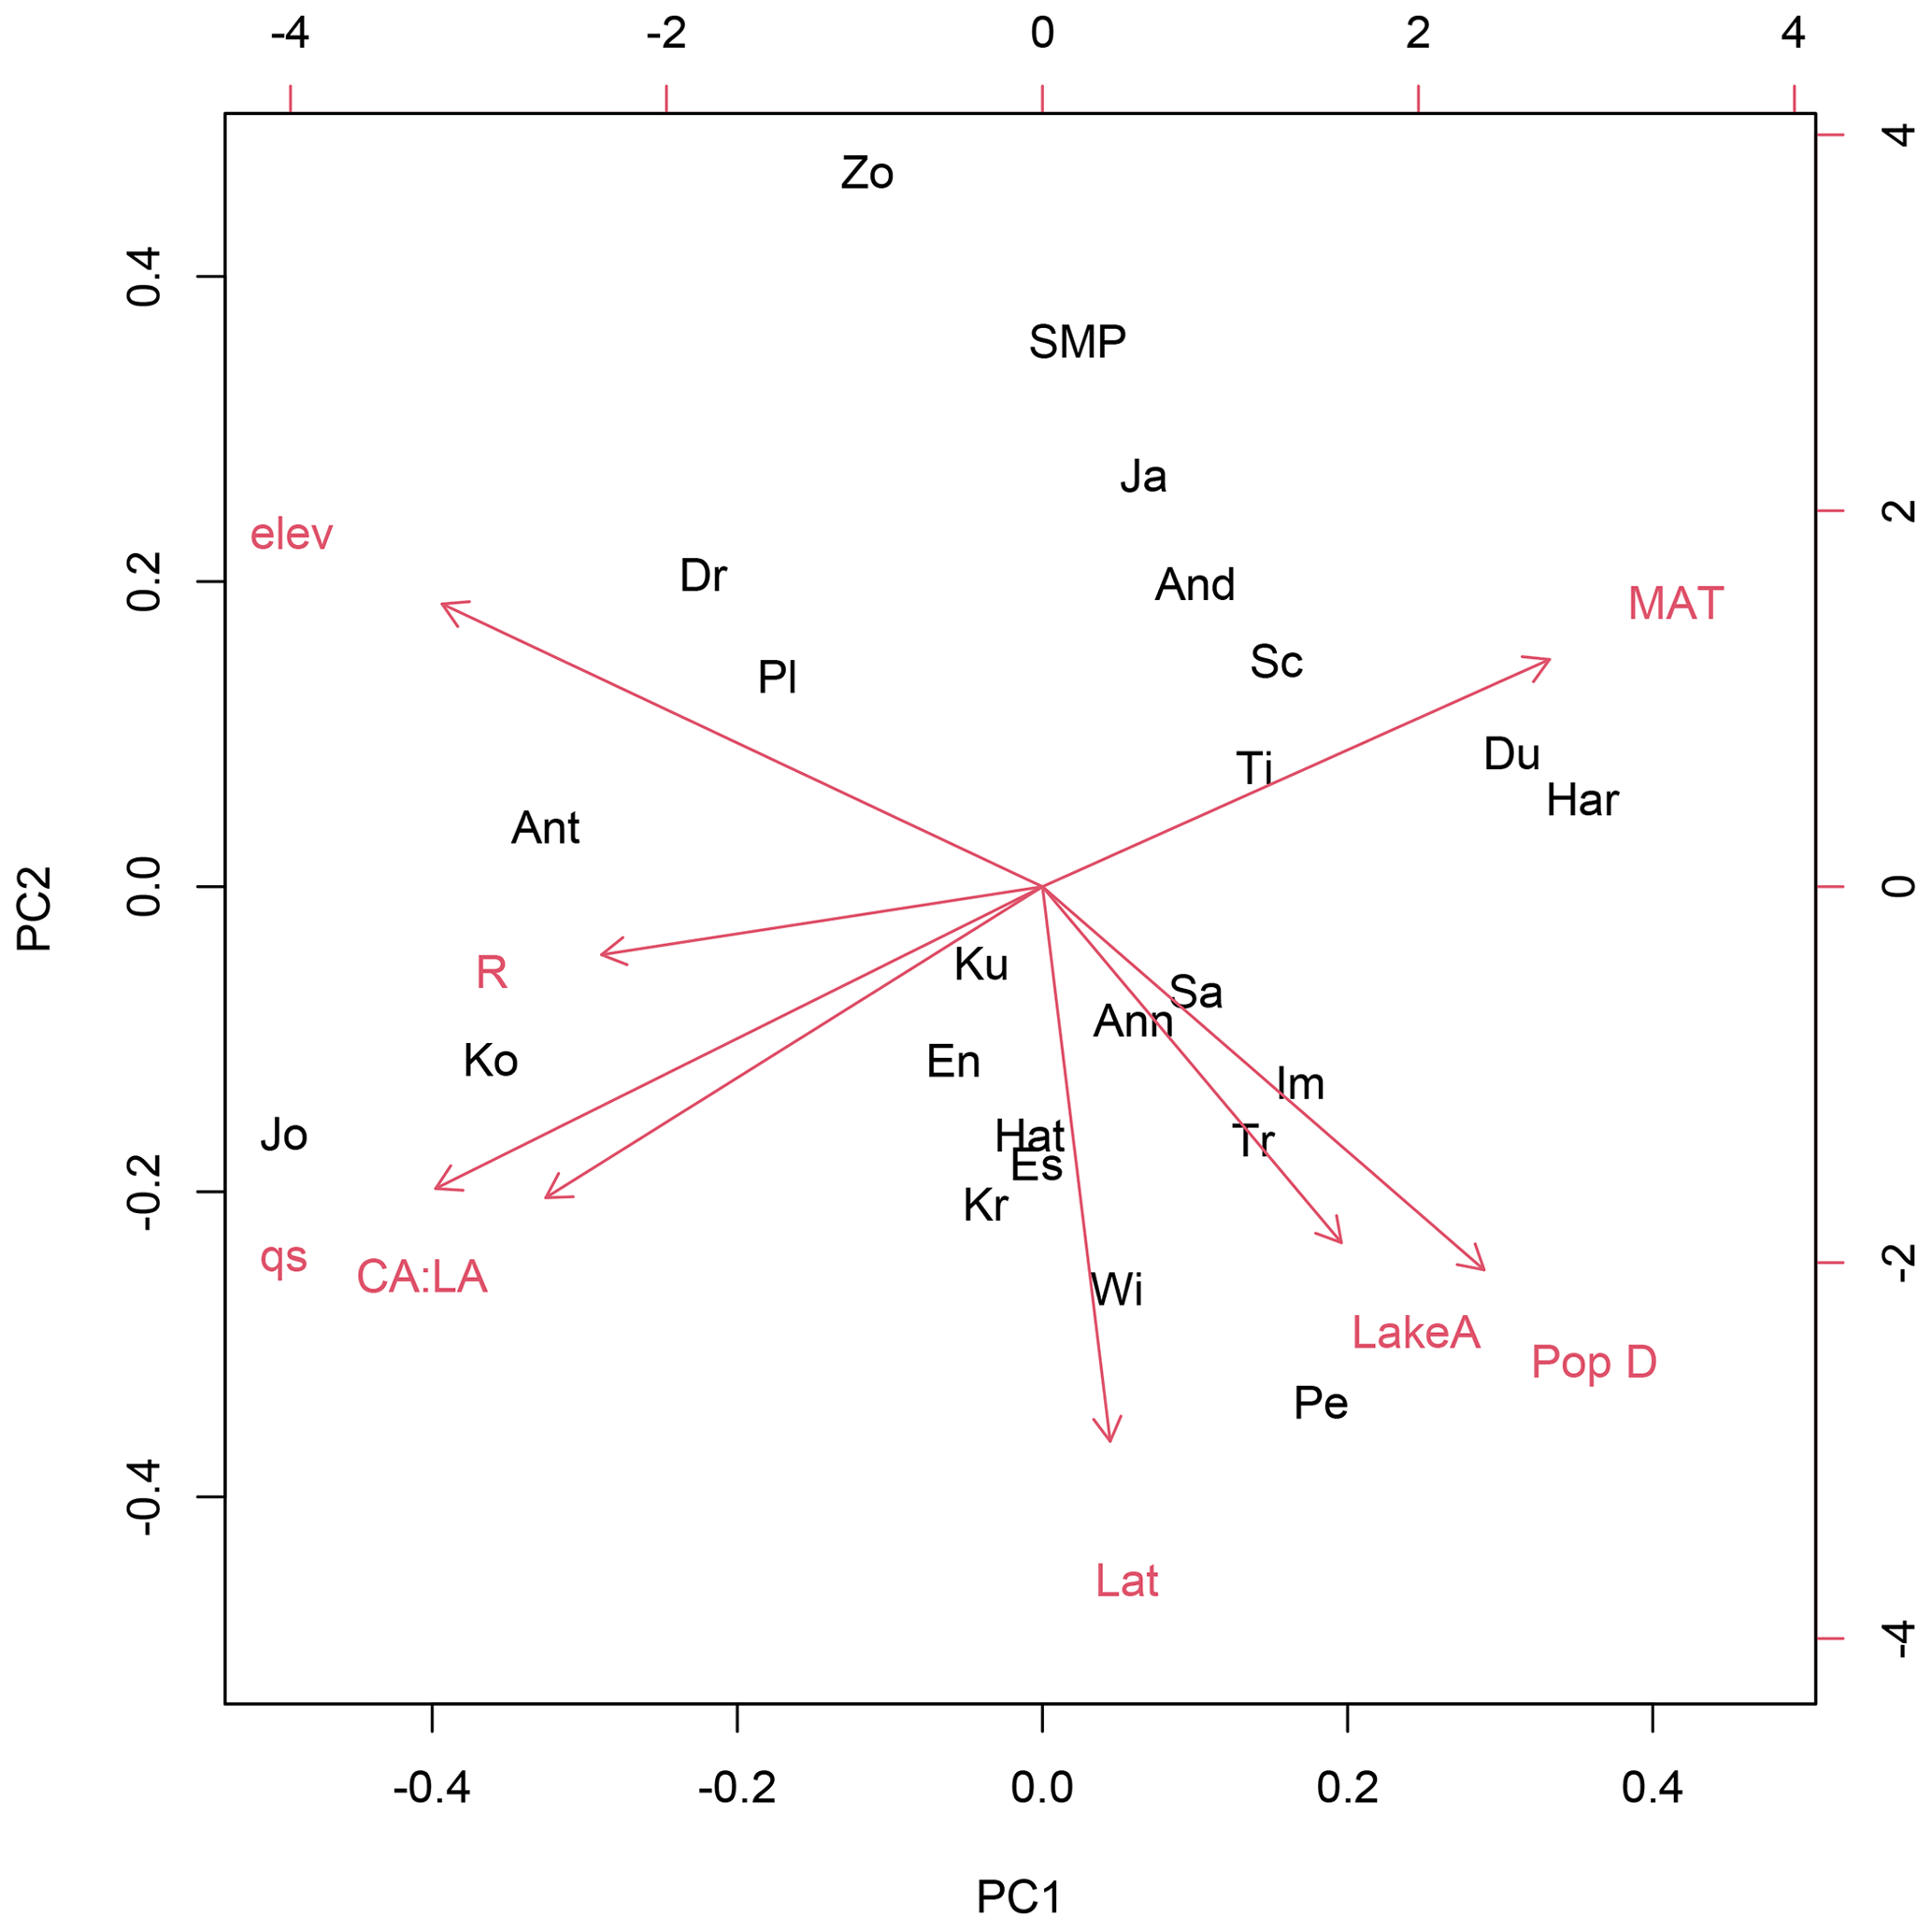
Figure 2Correlation matrix PCA biplot illustrating the spatial association of lake properties in the dataset. For site abbreviations see Fig. 1 caption.
The 24 lakes in our dataset are situated across the Americas and Europe (northwest and central) (Fig. 1) and have a variety of climatic and physical properties (Table B4). The range of lake proprieties is illustrated using a correlation matrix principal component analysis (PCA) (Fig. 2). The biplot of PC1 and PC2, representing 62 % of the variance, positions the lakes quite well in terms of comparative properties. Thus, large low-elevation, lakes with relatively high population density (plotting lower right) contrast with small, high-elevation lakes with low direct human impact (upper left). Lakes with warmer climates, lower runoff, and low water loadings (right) contrast with high-water-loading, high-AC:AL lakes (left). The mountain lakes are separated according to climate, with cooler, wetter locations to the left and warm or temperate mountain sites at the top.
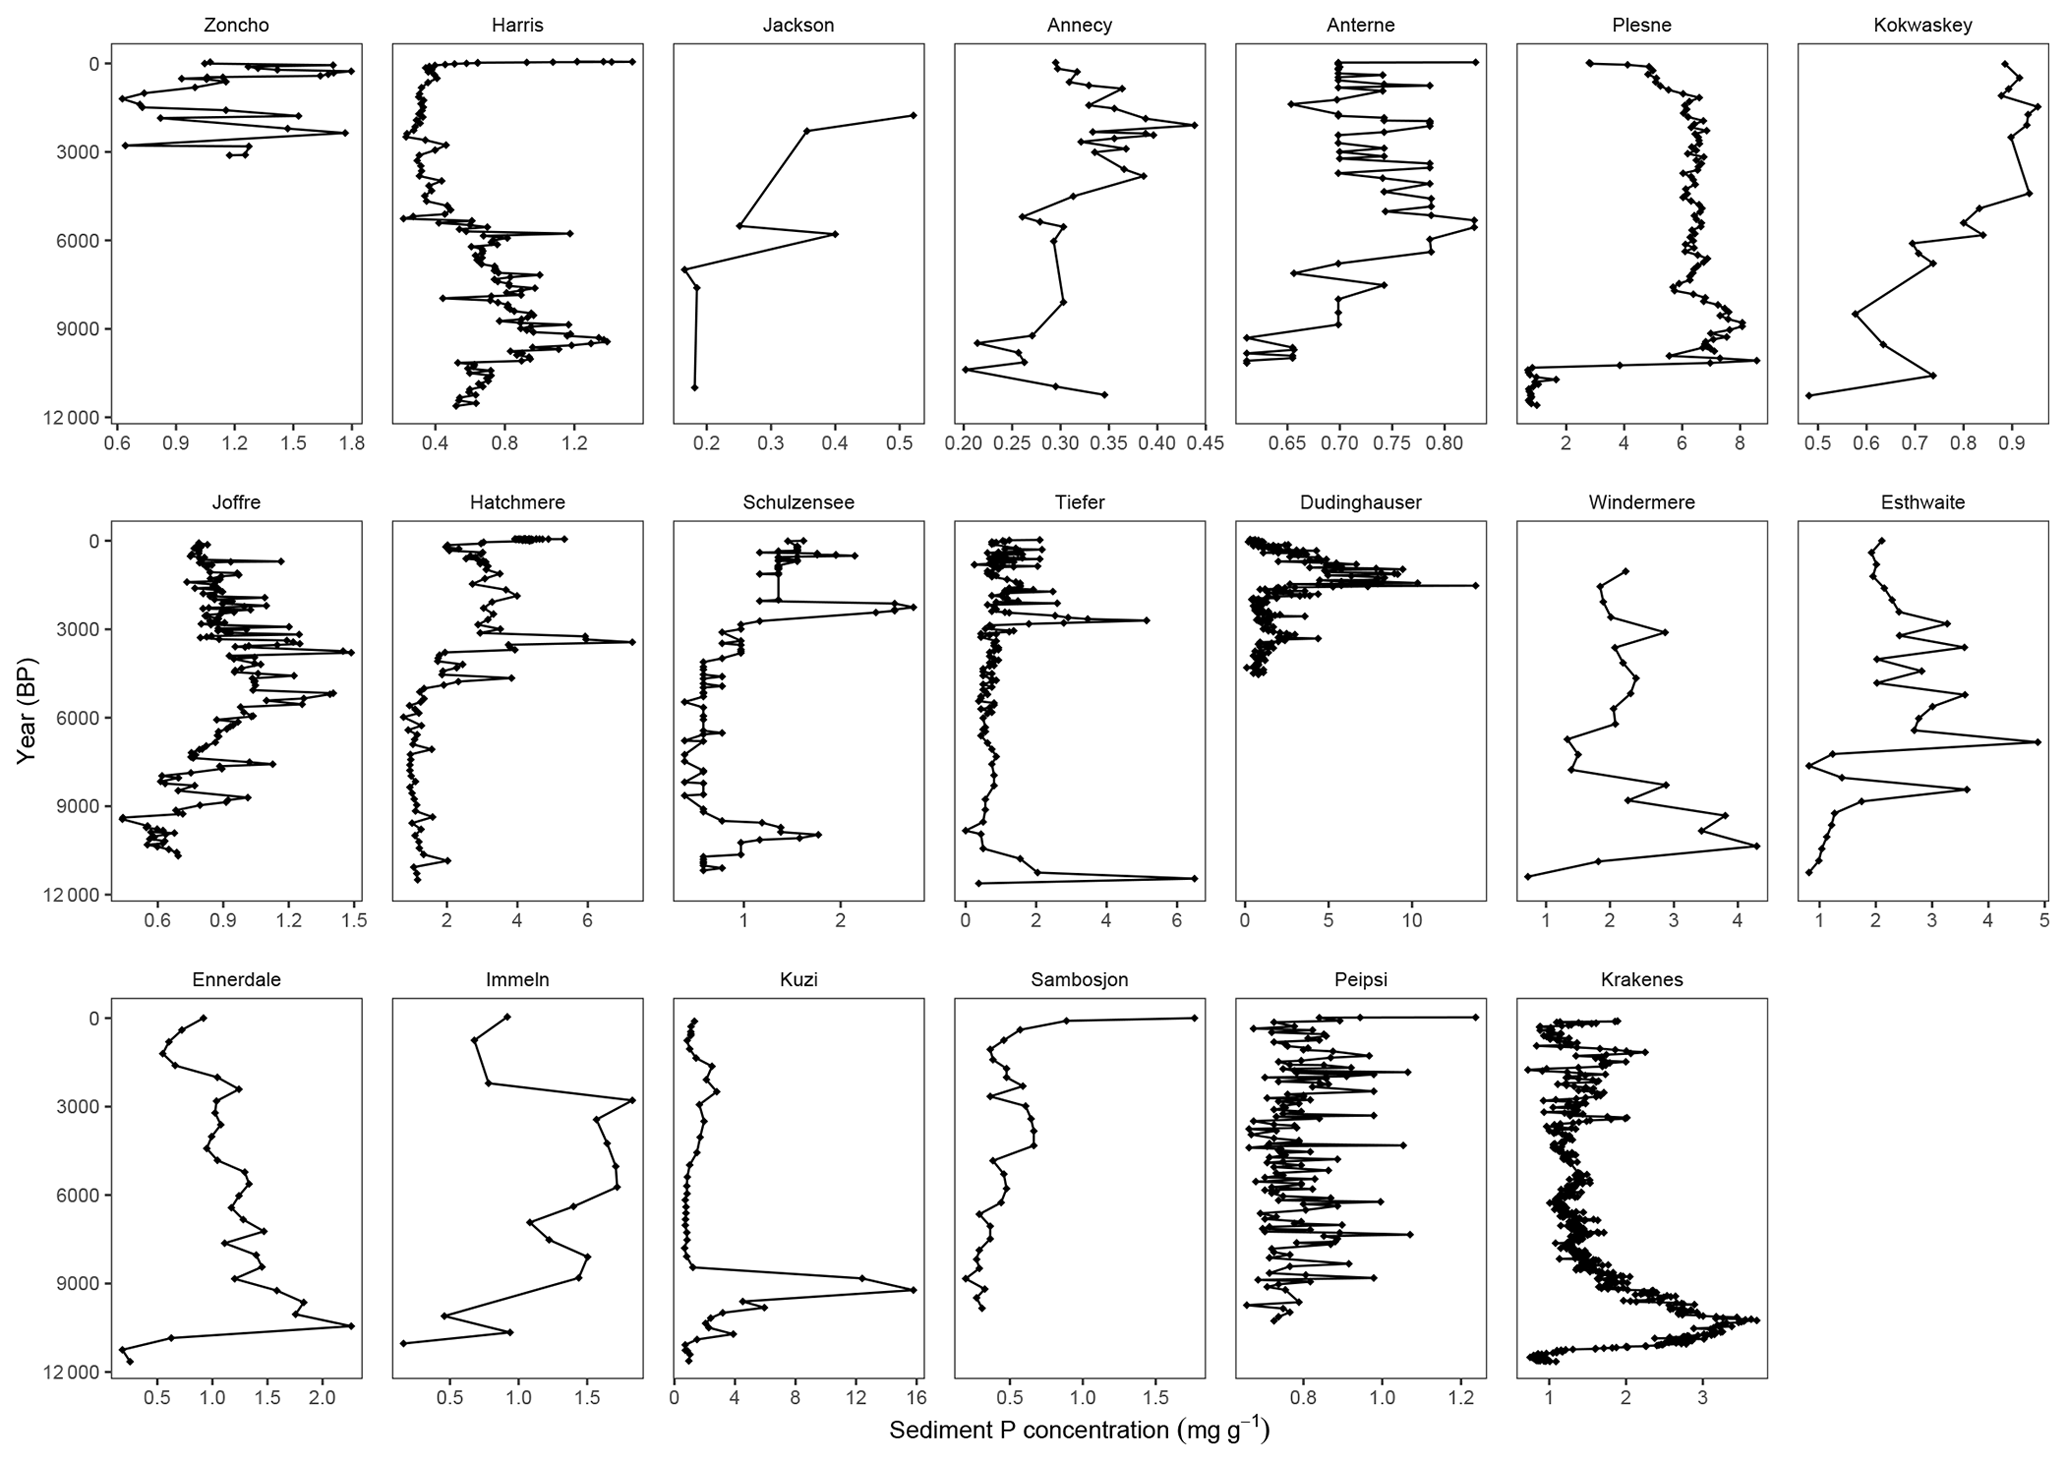

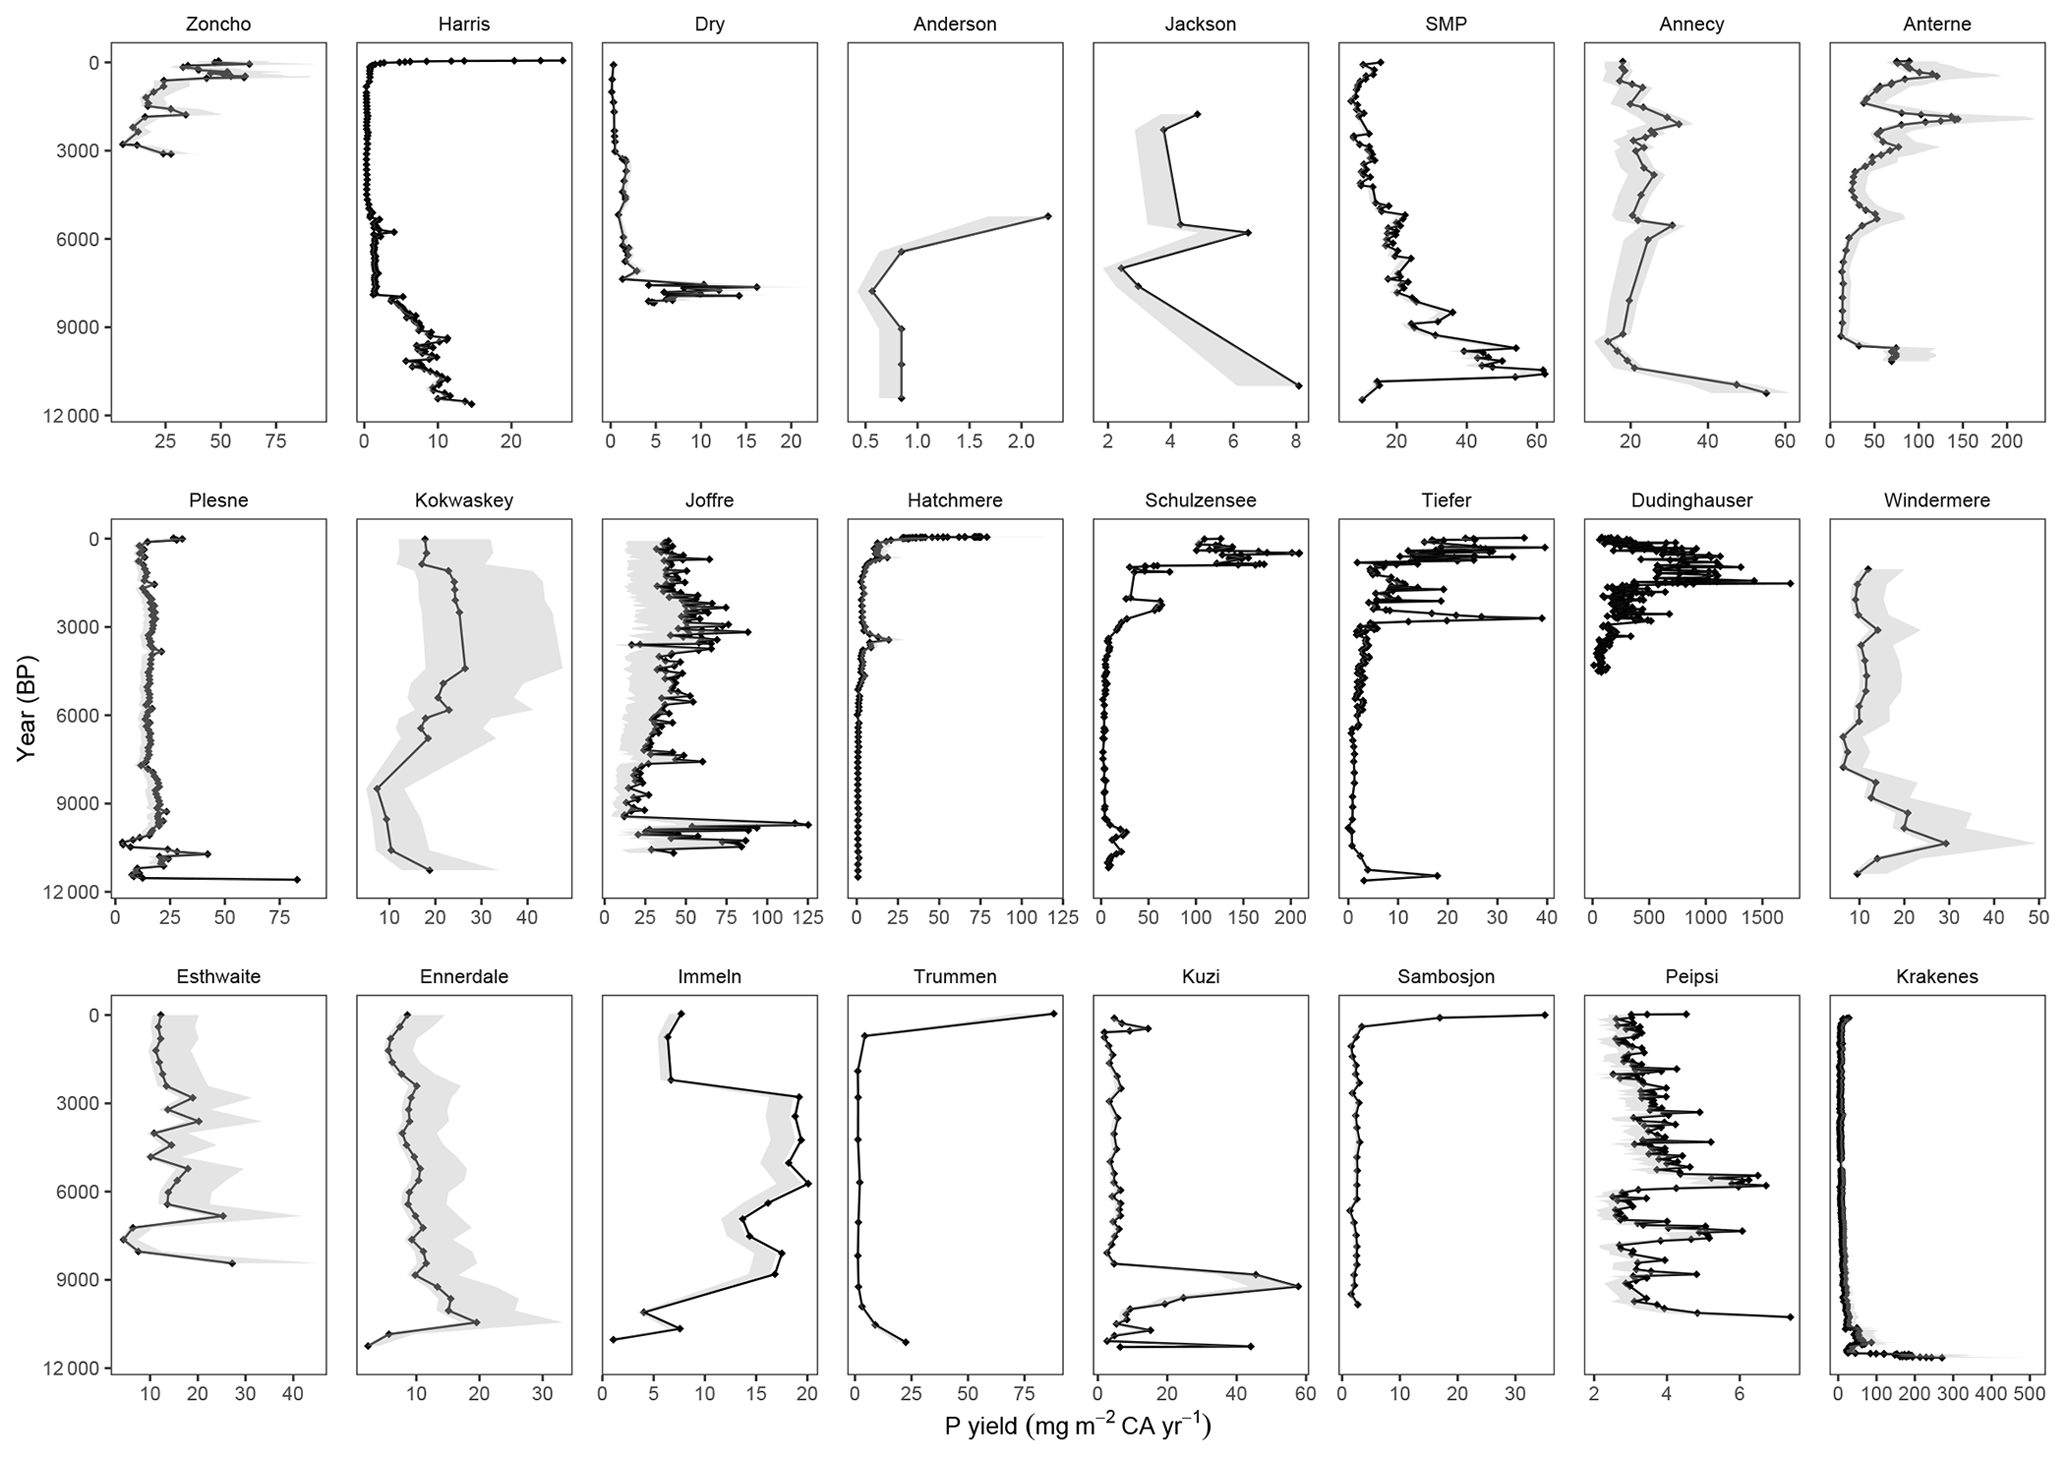
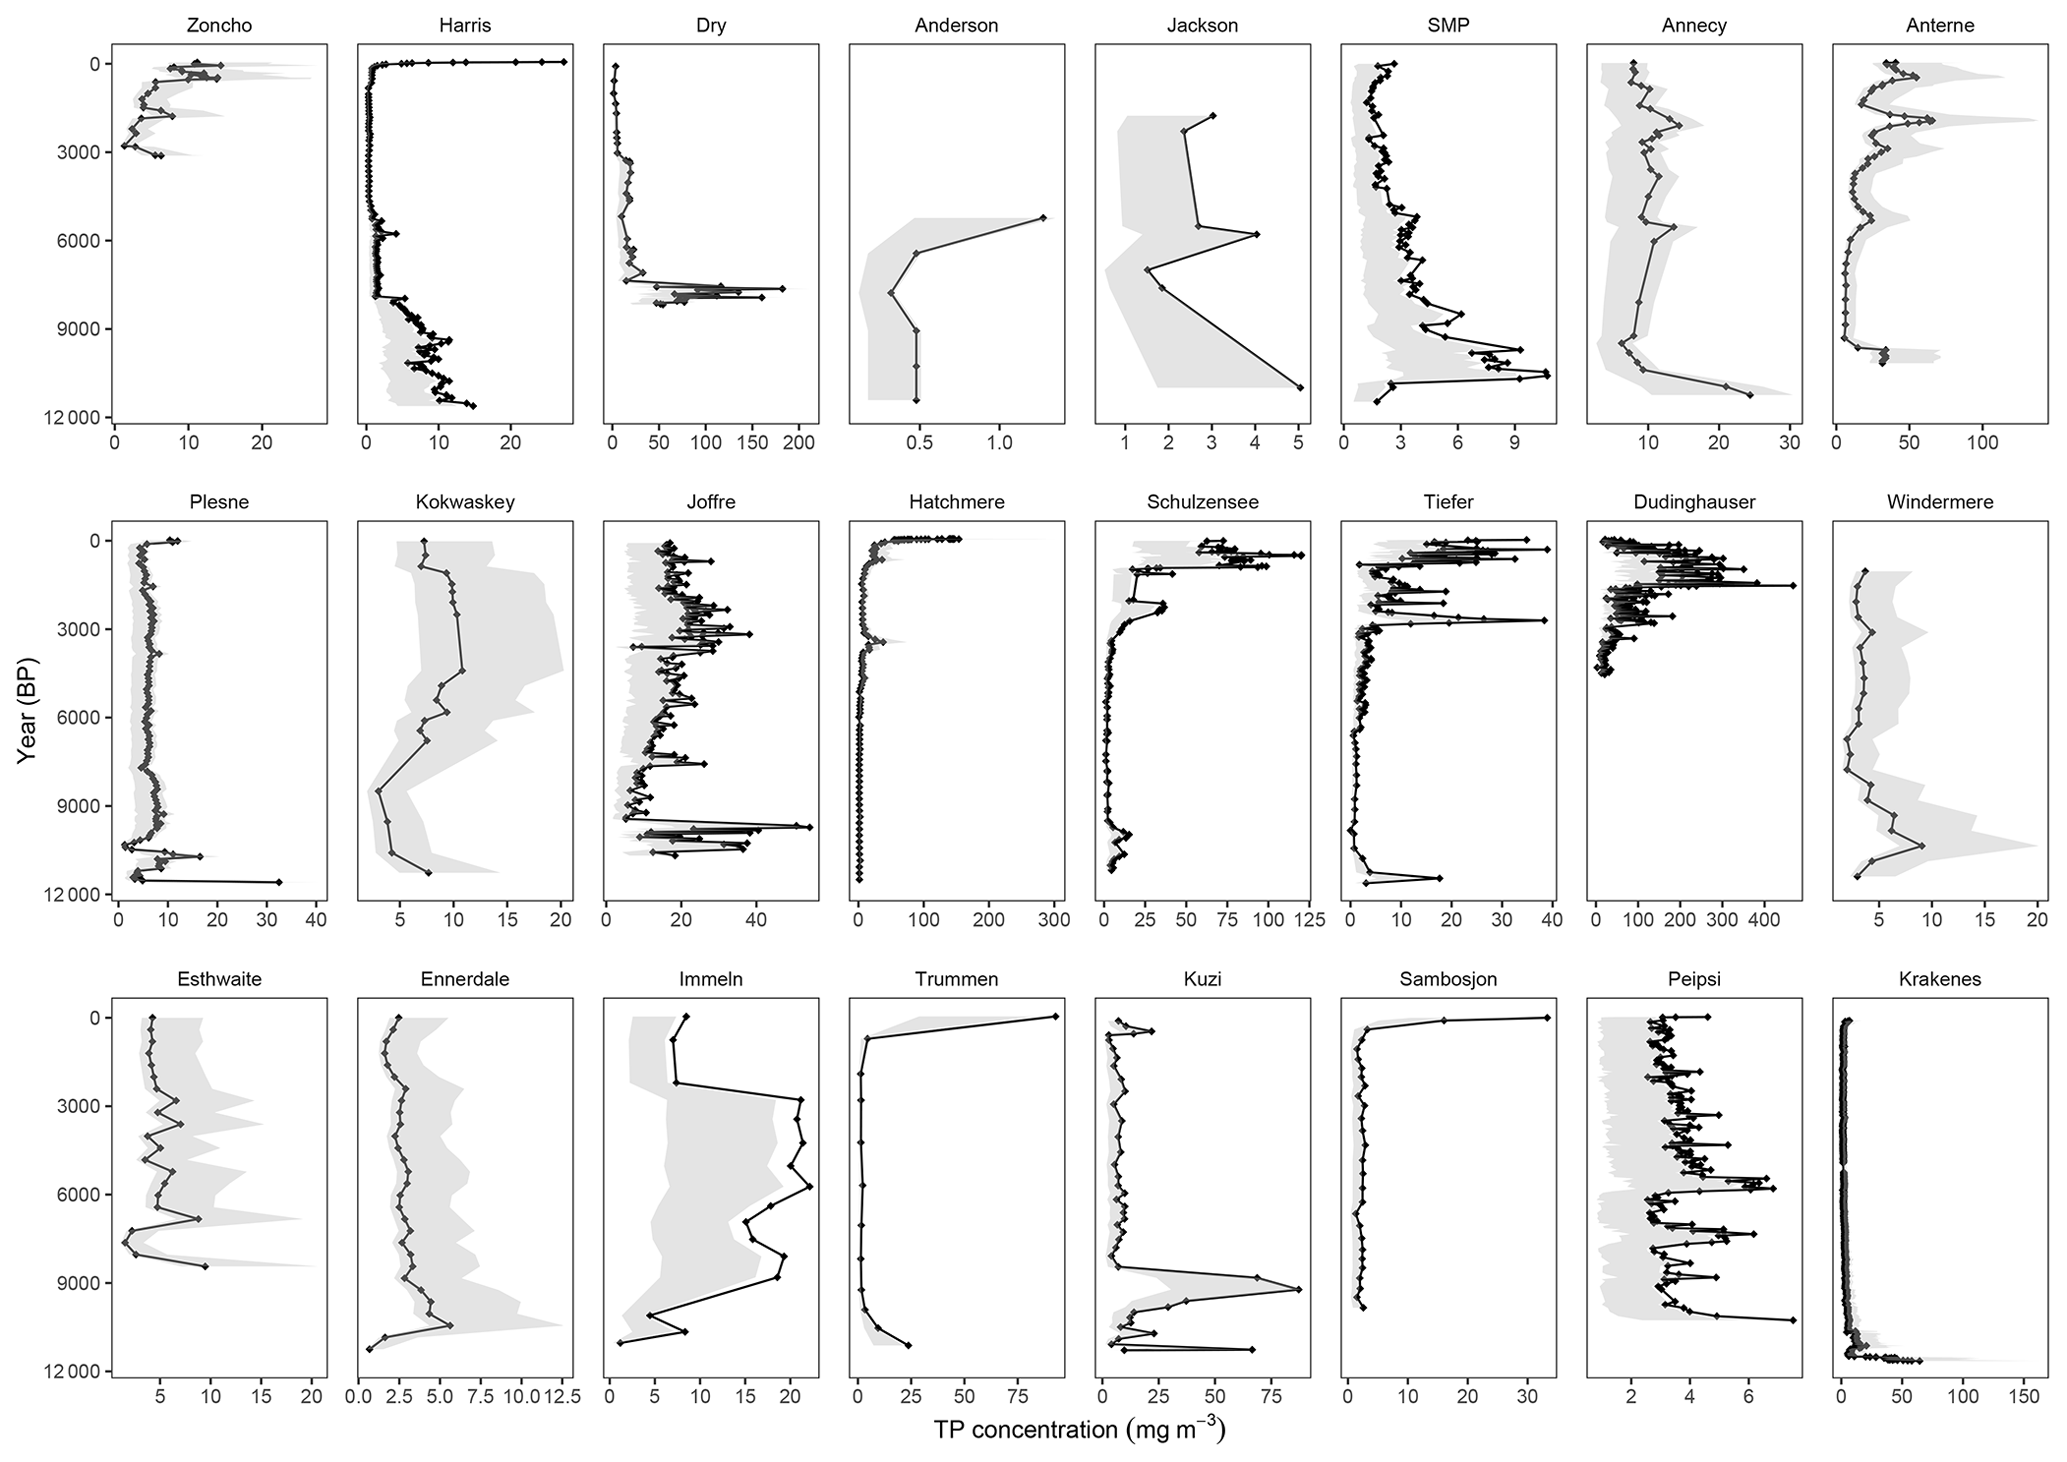
Figure 6The reconstructed sediment-inferred lake water TP (SI-TP) records for all 24 lakes. The records represent long-term mean TP values.
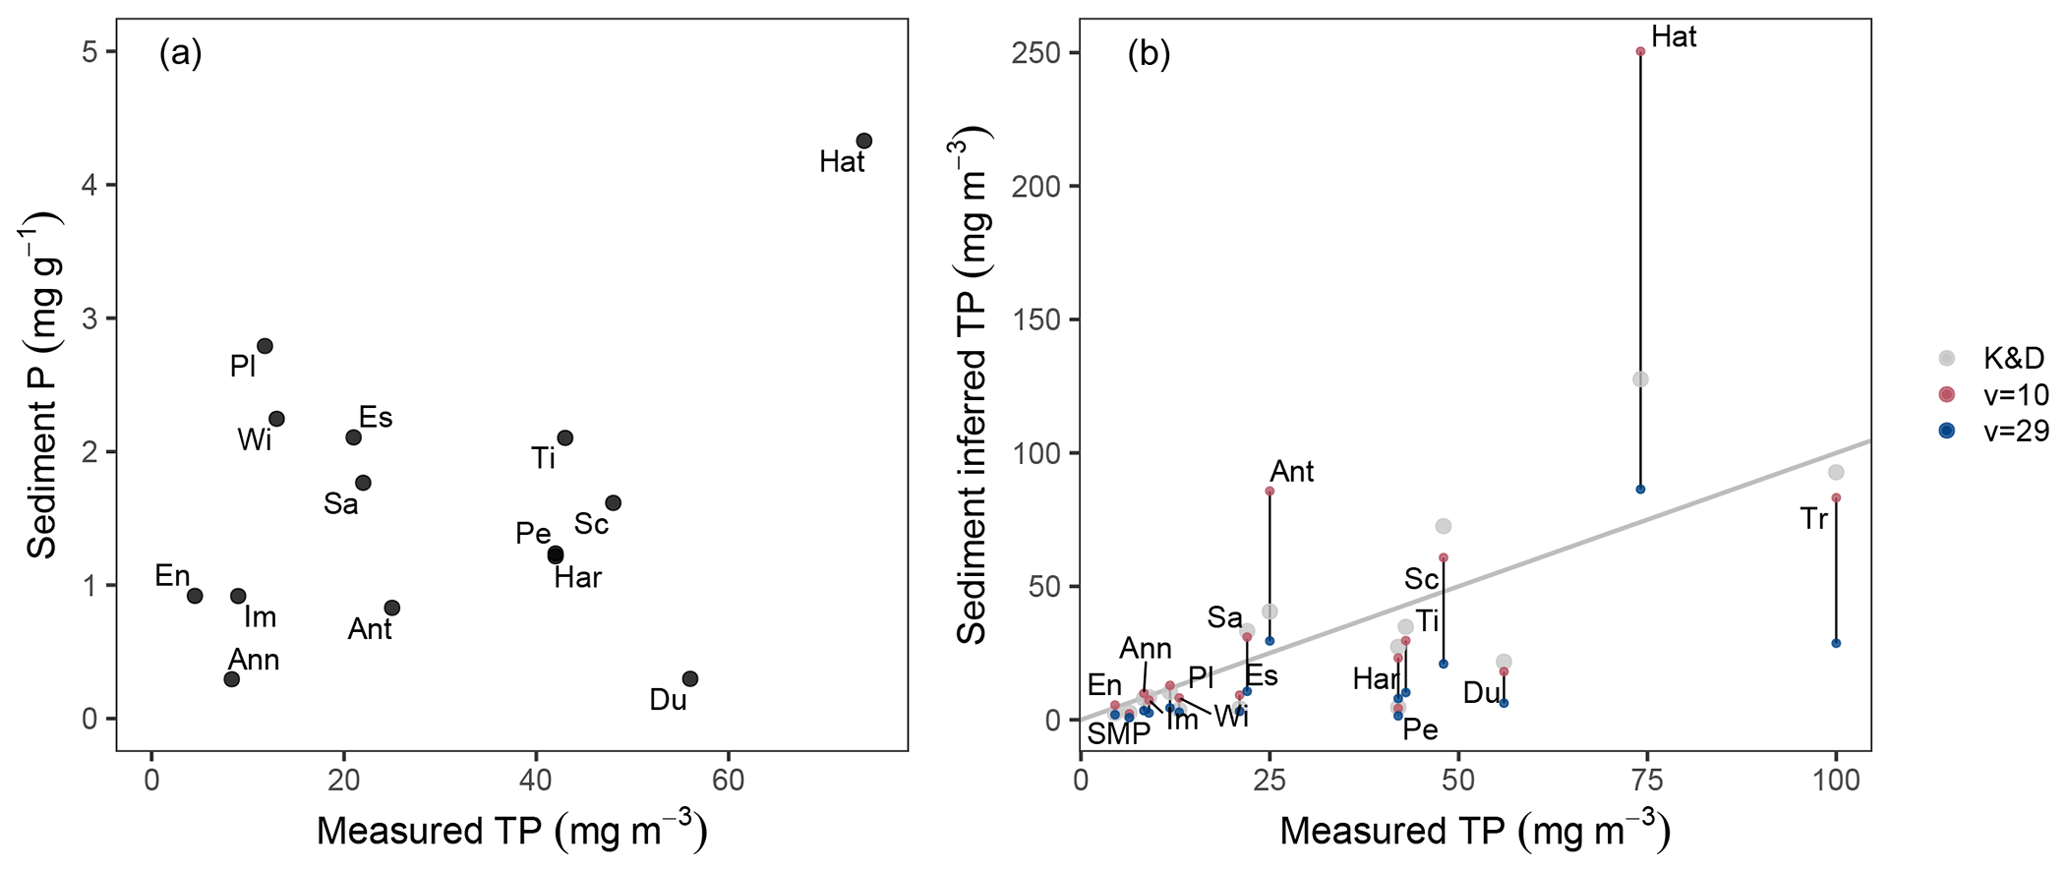
Figure 7A comparison of measured lake water TP concentration with (a) sediment P concentration and (b) sediment-inferred lake water TP for the 16 sites where lake water monitoring data exist. Three values of SI-TP are shown for each site which are calculated using the three RP values described in Sect. 2.1. The grey line shows the 1:1 relationship between TP and SI-TP. For site abbreviations see Fig. 1 caption.
The published Holocene P records from the 24 sites vary in their reporting; some sites reported only P flux (n = 4), some reported only P concentration (n = 16), and some reported both P concentration and P flux records (n = 4). The 20 sites with reported Holocene P concentration records are shown in Fig. 3. The reported or calculated Lcore records were converted to lake-wide loading (Lsed) (Fig. 4). Application of the SI-TP model to the Lsed values yields reconstructions of catchment P yield and SI-TP (Figs. 5 and 6). Comparison of recent period SI-TP with TP monitoring data, available for 16 of the sites (Table B5), yields good agreement (Fig. 7b). Regression on log-transformed values gives an adjusted R2 of 0.74 (F = 41.6), with a range of R2 = 0.68 (F = 30.4) to R2 = 0.79 (F = 57.6) based on leave-one-out subsamples, for SI-TP calculated using RP from the model of Kirchner and Dillon (1975). Consistent with Ginn et al. (2012) there is no relationship between sediment P concentrations and measured lake water TP (Fig. 7a).
A single site, Dudinghauser See in northern Germany, stands out as having the highest persistent sediment P concentration, with a prolonged spell with values greater than 8 mg g−1 (Fig. 3). Dudinghauser also has a cumulative P yield amounting to 2.2 kg P m−2 of catchment area (Fig. 8), which is 4 times greater than would typically be present in even glacially reset soil (Boyle et al., 2015) and an order of magnitude greater than would have been supplied from such soil by leaching. It is likely that our empirical LOI model overestimated the dry density over the high-P interval, illustrating the limitation of not having measured density data. We include the Dudinghauser See profile in the figures, but the data are excluded from the statistical analysis.
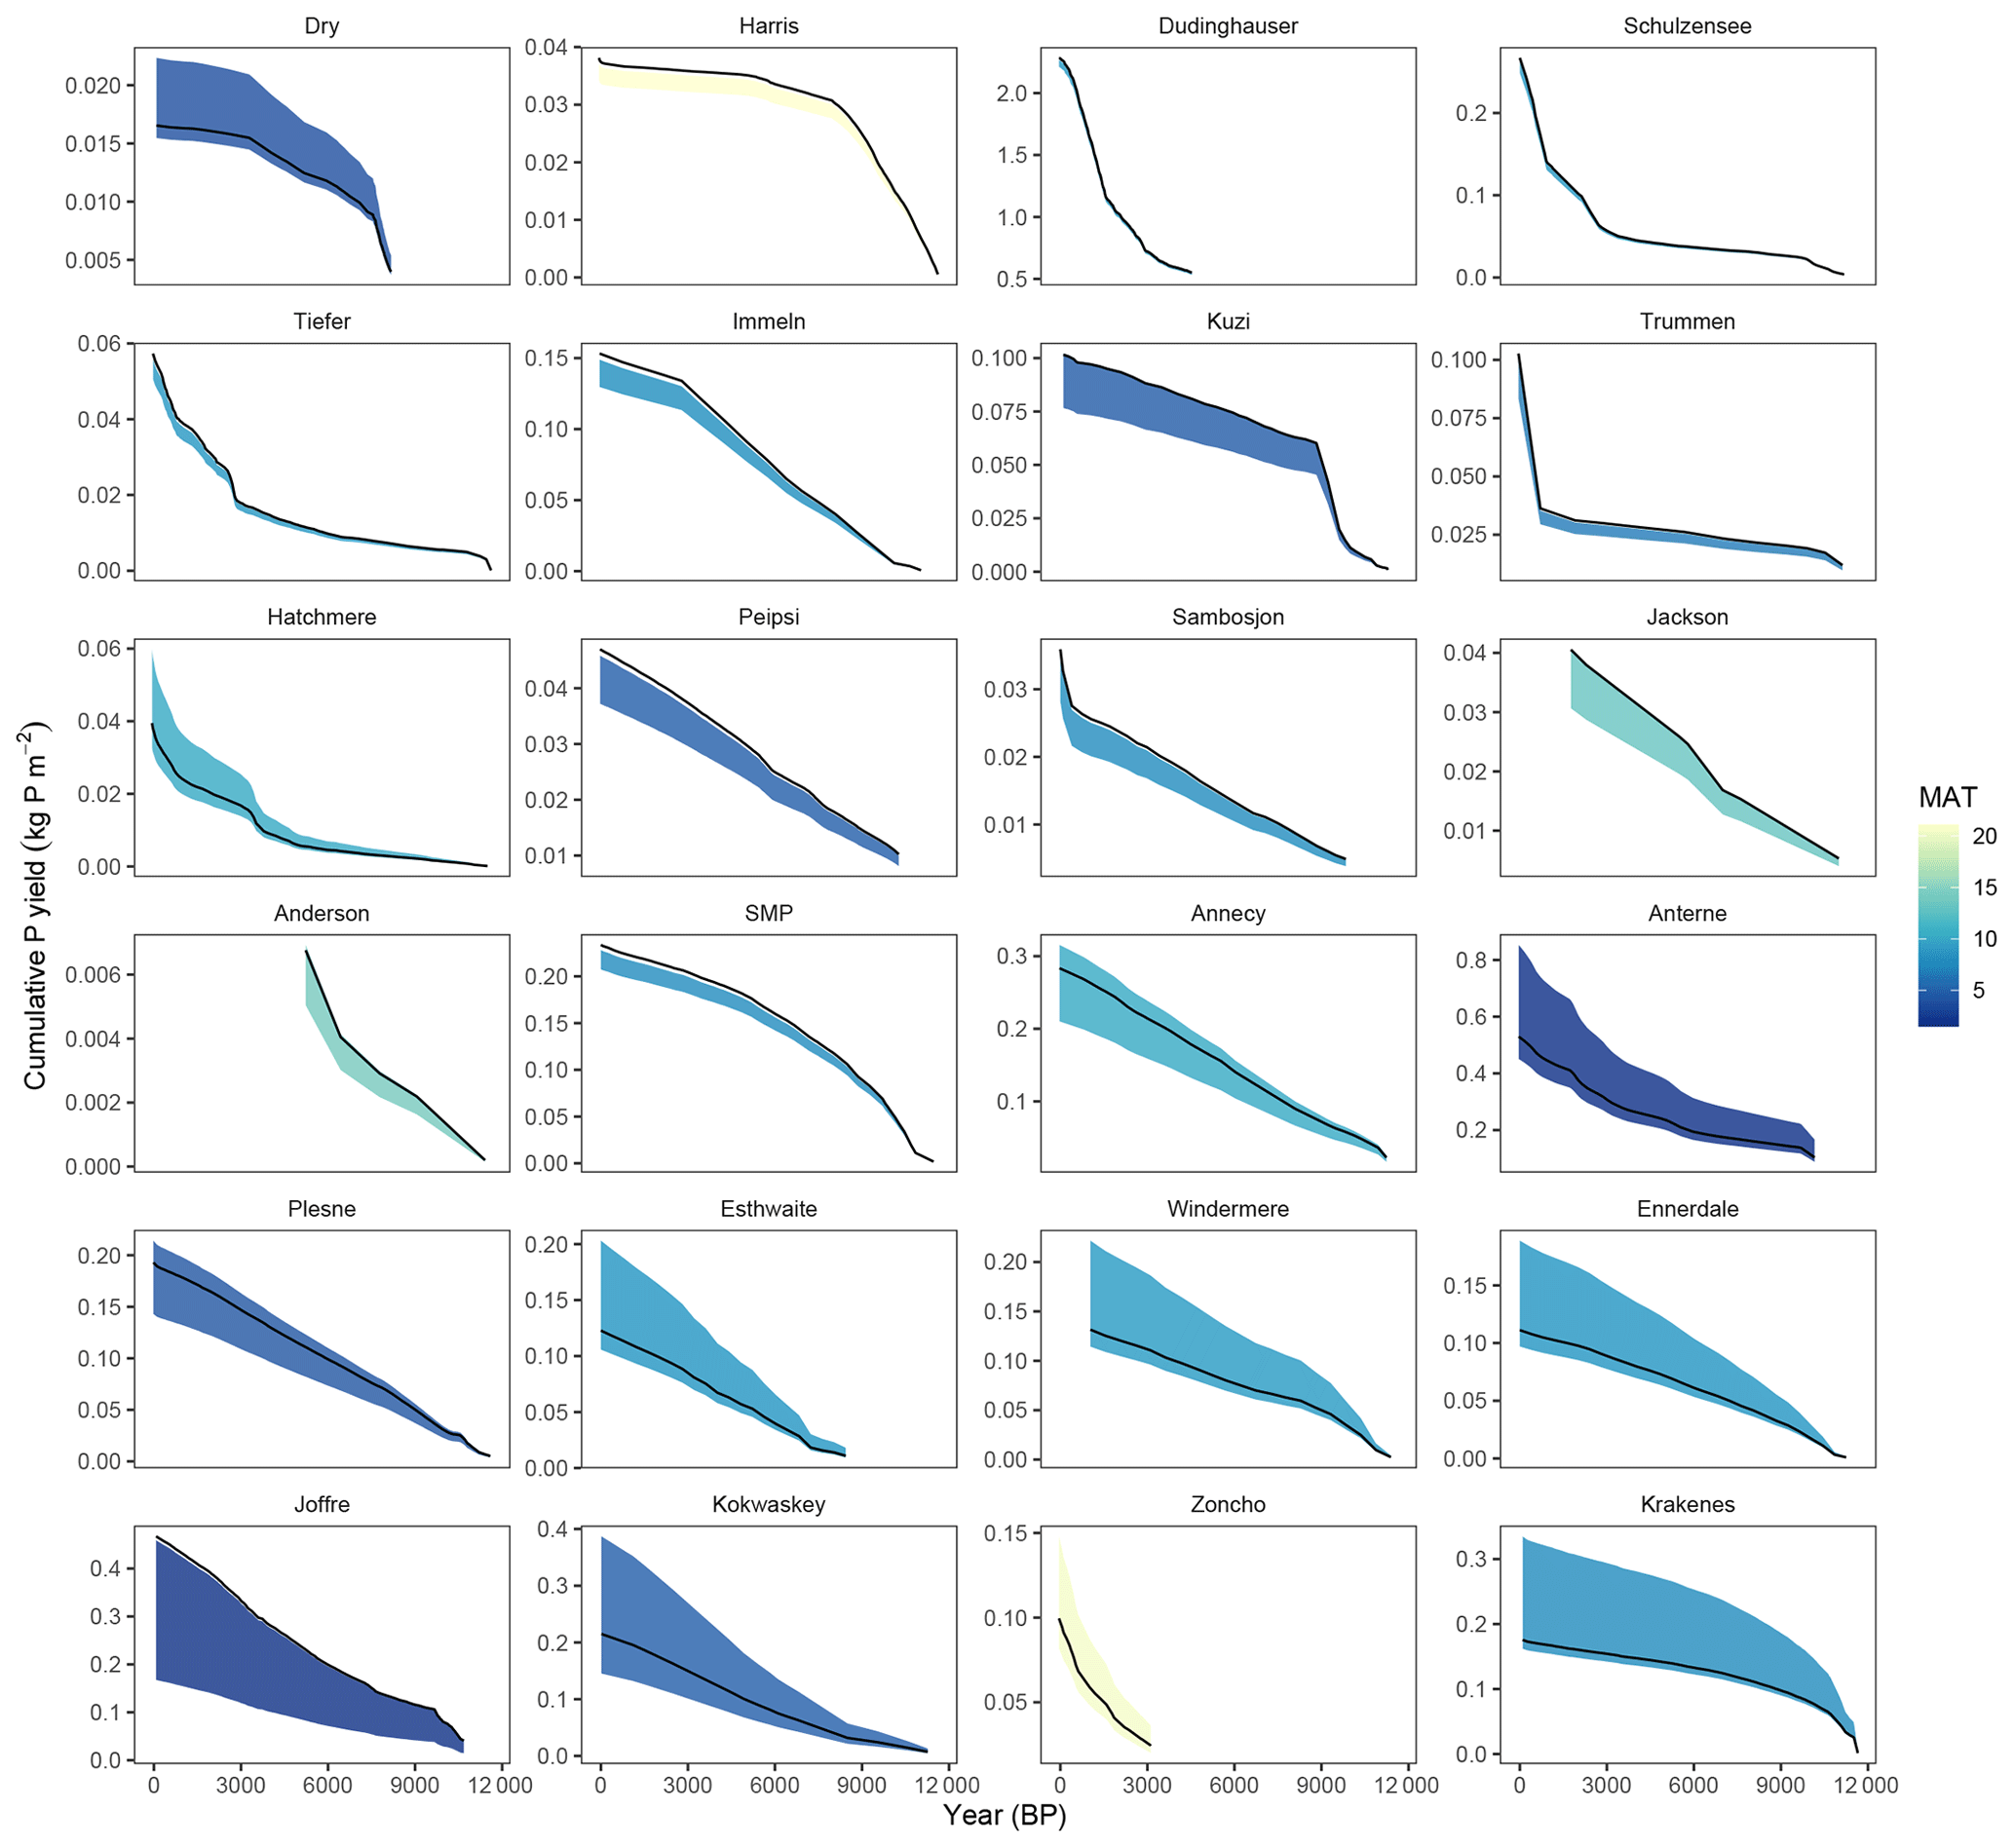
Figure 8Cumulative sediment-inferred P yield for all 24 lakes, shaded by mean annual temperature and ordered by mean annual runoff (low to high).
3.1 Classifying P profiles by trait
The P yield profiles (Fig. 5), and particularly the cumulative yield profiles (Fig. 8), reveal considerable variability in shape, demonstrating differing yield histories. Upland sites with no or low historic human impact typically show convex upwards profiles, whereas lowland sites with long histories of human activity have concave upwards profiles with mid-Holocene increases, and often a recent acceleration. The high-mountain sites that currently have glacial ice in their catchments also show abrupt increases in the mid-Holocene. It is possible to identify consistent commonalities and contrasts across most sites in the overall trends in Holocene P yield. These are described here as three traits that are displayed across the sites to a greater or lesser degree.
-
Trait 1. Early Holocene P yield maximum.
Sites that show elevated early Holocene P supply appear as convex upwards trends in the cumulative yield plots (Fig. 8). Early P increases are predicted by the Walker and Syers (1976) model of soil evolution, and the effect has been previously described in lake sediments by Filippelli and Souch (1999) and Boyle et al. (2013), occurring at sites on young landscapes initially rich in geological P. Trait 1 is seen most strongly at Lake Harris, Dry Lake, Sargent Mountain Pond, Lake Ķūži, and Kråkenesvatn, with a weaker profile at Windermere and Ennerdale Water.
-
Trait 2. Mid-Holocene increase in P yield.
Sites that are dominated by a mid-Holocene increase in P supply appear as concave upwards trends in the cumulative yield plots (Fig. 8). This is particularly striking at Dudinghauser See, Schulzensee, Tiefer See, Hatchmere, and Laguna Zoncho but is also partially present at high-mountain sites: Lac d'Anterne, Kokwaskey Lake, and Lower Joffre Lake. The breaks of slope in these curves coincide with independent palaeolimnological evidence (e.g. mineral influx, pollen, and charcoal) for landscape disturbance due to either early farming or neoglacial activity, depending on lake location.
-
Trait 3. Recent sharp increases in P supply.
Recent (post 1850 CE) increases in P supply are apparent in the cumulative yield plots (Fig. 8) as an abrupt steepening of the cumulative profile in the recent part of the record. Typically, these increases contribute only weakly to the total cumulative P yield record, because while the increase is intense it is also short-lived in Holocene terms. Trait 3 is particularly striking at Lake Trummen, Sämbosjön, Schulzensee, Tiefer See, Hatchmere, and Laguna Zoncho and is also present at Lake Harris. These are sites at which farming has continued, intensified by modern practices, or where urban areas have been built.
Anderson Pond and Jackson Pond do not clearly show any of the three traits over the Holocene (Fig. 8). However, on a longer timescale they show convex upwards cumulative P profiles (not shown) after the climate amelioration that follows the Late Glacial Maximum, thus conforming to the Walker and Syers (1976) model (Filippelli and Souch, 1999). They are therefore considered to be Trait 1 sites.
Five lakes do not appear to display any of the traits described above: Lac d'Annecy, Esthwaite, Lake Immeln, Lake Peipsi, and Plešné Lake (Fig. 8). These sites show neither strong curvature nor clear recent increases in their cumulative P yield profiles. We have not classed these as a separate trait. The reasons for this are explored in the discussion.
Though they differ in relative magnitude due to between-site differences in water loading (qs), the Holocene profiles for SI-TP concentration (Fig. 6) are identical in shape to the P yield profiles (Fig. 5). Consequently, the Holocene dynamics of SI-TP conform to the P yield traits. Trait 1 sites show SI-TP concentration peaking at the start of the Holocene, with a subsequent broadly exponential decline, attributed by Boyle (2007) to apatite weathering and depletion. Trait 2 and 3 sites have low early Holocene SI-TP concentrations, soil apatite having been depleted through prolonged weathering since glacial resetting that long preceded the Holocene (Boyle et al., 2015). Recent human settlements near Trait 3 sites contribute to strongly elevated SI-TP.
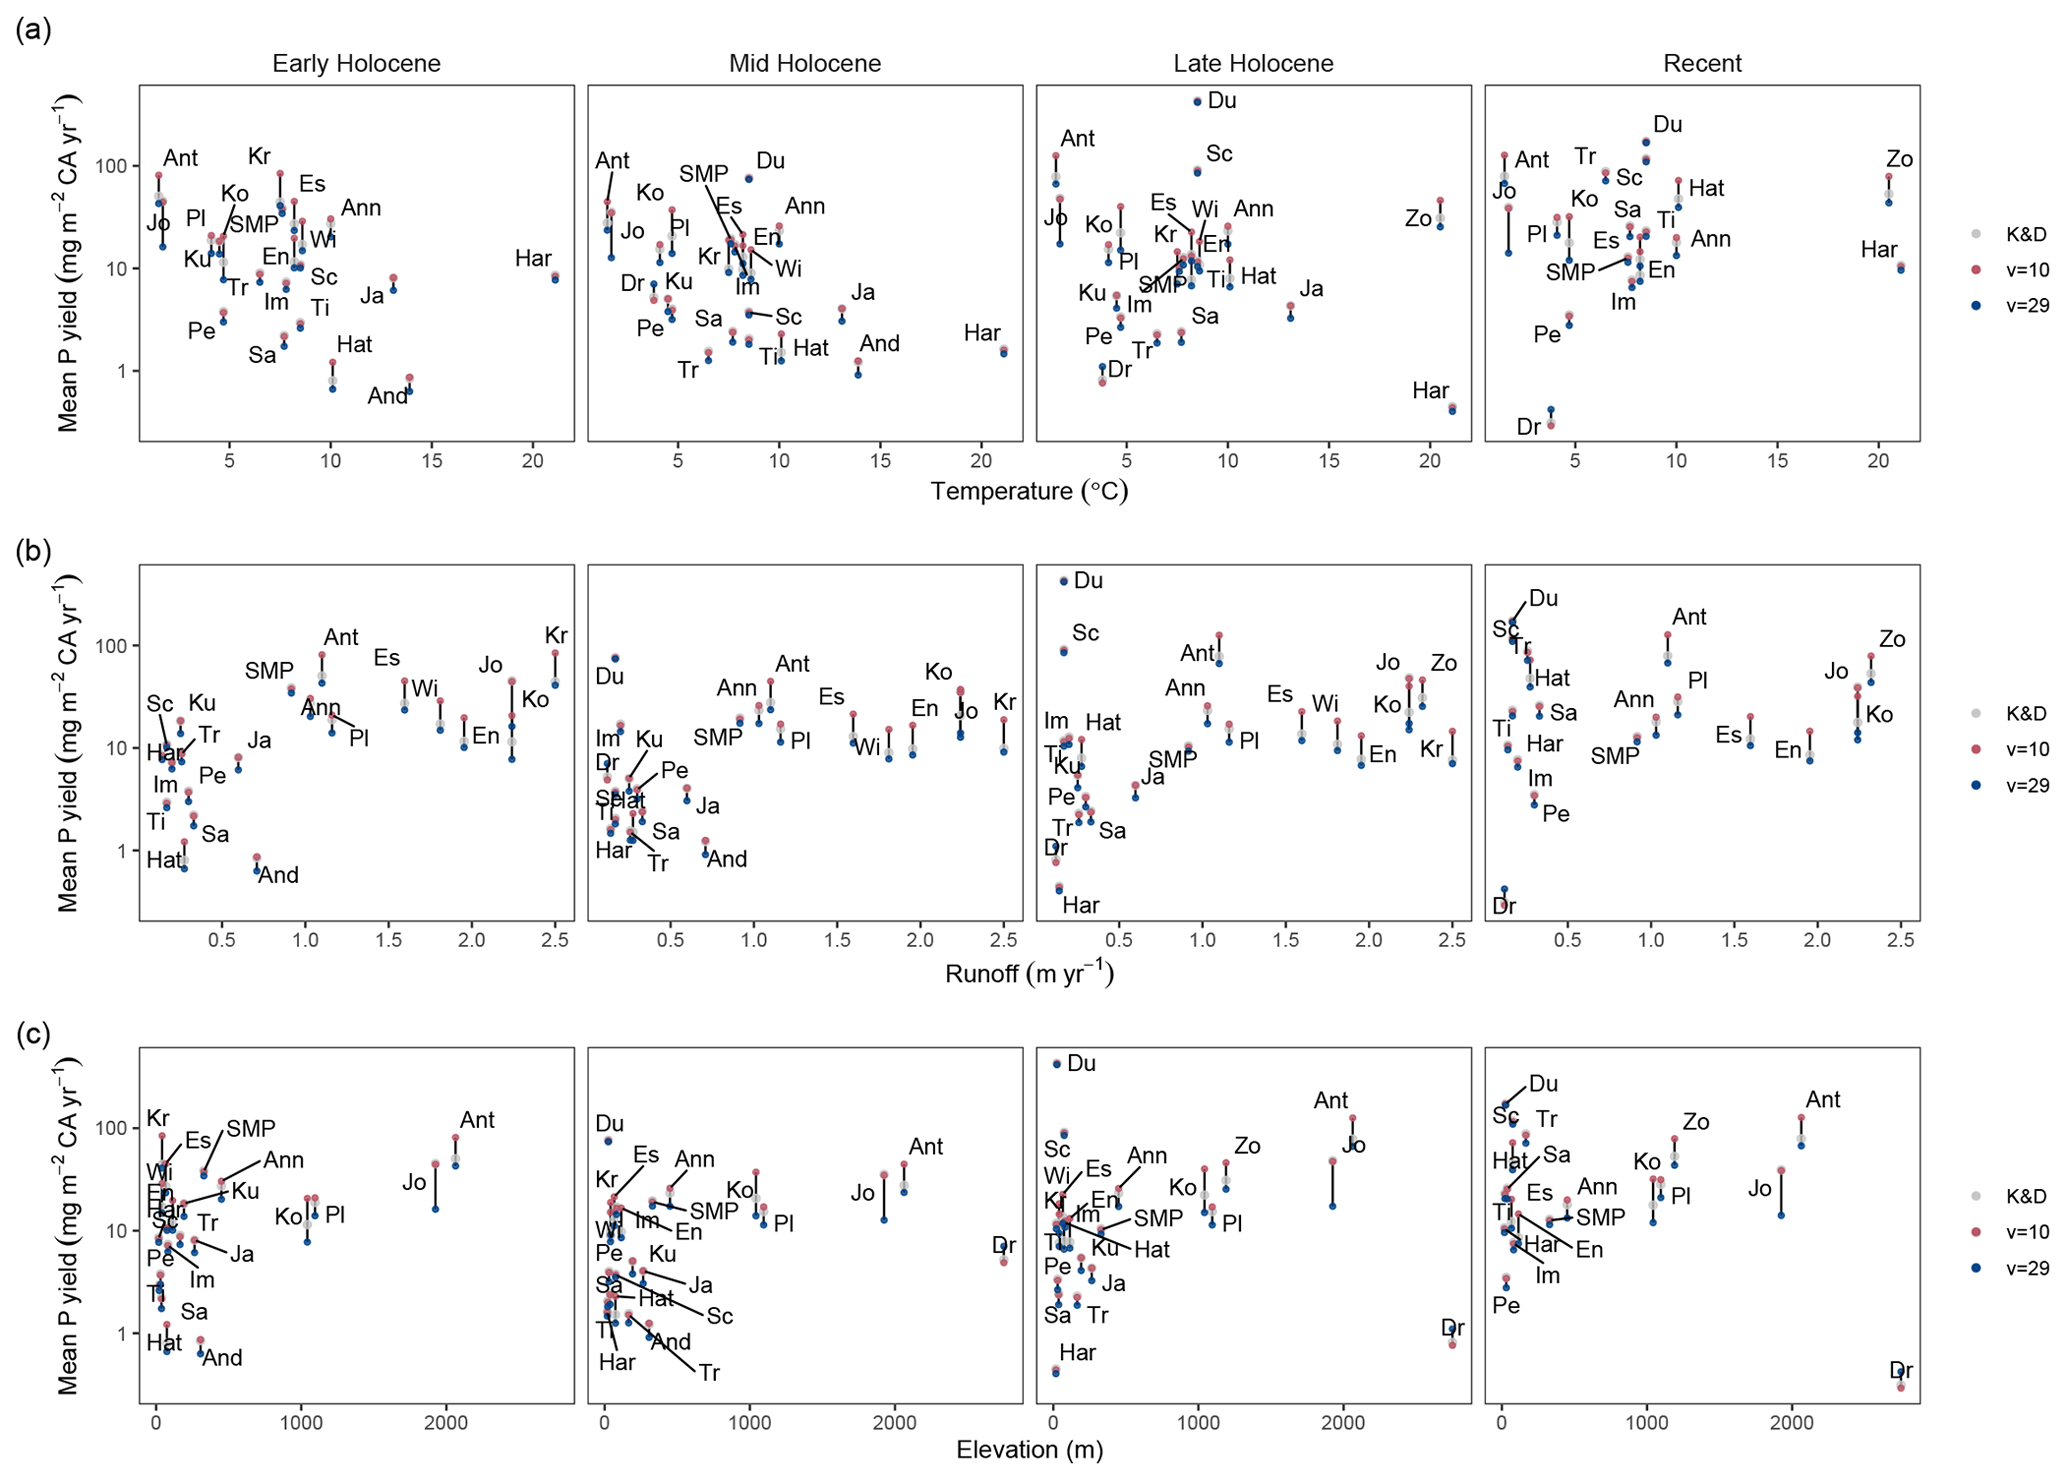
Figure 9Association of mean sediment-inferred P yield for each site with (a) modern mean annual temperature, (b) modern mean annual runoff, and (c) lake elevation for the four Holocene time intervals. Mean sediment-inferred P yield is estimated using three values of RP. For site abbreviations see Fig. 1 caption, and for correlations see Tables 1 and 2.
3.2 Environmental drivers
For each lake site we have estimates for both modern mean annual temperature and modern mean annual depth equivalent runoff (Table B4). Because between-site differences are large relative to likely temporal change through the Holocene, we assume these values are representative of the long-term between-site differences. Comparing site average values for the different time periods, we find a weak negative association of mean P yield with temperature and weak positive associations of mean P yield with both runoff and altitude in the early and mid-Holocene (Fig. 9). These relationships weaken in the late Holocene and recent period. In the case of SI-TP concentration (not shown), significant negative associations are seen with temperature, except in the recent period. These relationships are tested further using multiple regression (Tables 1 and 2), which can take combined temperature and runoff effects into account. For all periods, SI-TP is no better fitted by multiple regression than by simple regression. However, P yield gives optimal significant regression models on both runoff and temperature for each interval of the Holocene, with particularly strong associations for the mid-Holocene. For runoff, the coefficients are positive, while for temperature the coefficients are negative. For the recent period, no correlation for either is observed. In all time periods, altitude is non-significant in the multiple regression, with any effect being captured by runoff and temperature.
4.1 Holocene P: concentration vs. flux
Most of the studies used in our analysis report only sediment P concentration records while a smaller number report P flux. Comparing the P concentration records (Fig. 3) with those of Lsed (P flux normalized to lake area and adjusted for focussing) (Fig. 4), we can see differences in the profile shapes through the Holocene. Concentration is a measure of relative flux, describing an amount per unit mass (e.g. mg g−1), and since inputs of both P and sediment to a lake are variable, the changes in P concentration cannot be fully interpreted unless the rate of sedimentation is also known (Anderson et al., 1993; Edmondson, 1974). By turning concentrations into loadings, we get absolute values that tell us about the rate of P supply and allow us to calculate both past nutrient budgets and past lake water TP concentrations. Following the original application of the SI-TP model by Moyle and Boyle (2021), we also find SI-TP correlates with measured lake water TP (Fig. 7b), giving an R2 of 0.74 on the log-transformed data. At the same time, fully consistent with Ginn et al. (2012), we find no relationship between sediment P concentrations and measured lake water TP concentrations (Fig. 7a). Consequently, there is no further discussion of sediment P concentrations.
4.2 Holocene P yield magnitude and dynamics
The three traits in catchment P yield we have identified can be interpreted in terms of differing properties of the landscape, including history in relation to glaciation, anthropogenic forcing (particularly farming and settlement), and climate change though the Holocene. Indeed, based on location and an understanding of the landscape history, including human manipulation, the traits apparent at a specific lake can be anticipated. This finding is of potential significance for predicting regional lake water TP reference conditions that can be used to assess the ecological status of lakes and could be used alongside current methods (e.g. Battarbee et al., 2011).
The P yield and SI-TP profiles at Trait 1 sites, with a maximum at the start of the Holocene followed by gradual decline through to recent times (Fig. 8), can be attributed to progressive and undisturbed development of rejuvenated soils. For most of these sites the explanation for the rejuvenation is glacial resetting (Boyle, 2007; Engstrom et al., 2000), where glacial or periglacial activity immediately prior to the Holocene has replaced ancient soils with unweathered mineral matter. However, Lake Harris, Jackson Pond, and Anderson Pond are not in such landscapes. In the case of Lake Harris, which is thought to have been a groundwater-fed fen before ca. 6000 BP and did not reach its current depth until ca. 2600 BP (Kenney et al., 2016), the SI-TP reconstruction may be regarded as unreliable during the early Holocene. At Anderson Pond and Jackson Pond the early high P flux cannot be explained by erosional landscape rejuvenation because both sites had boreal forest cover extending back to at least 25 ka (Liu et al., 2013). However, both locations received substantial aeolian particle loads during the Last Glacial Maximum (Roberts et al., 2007) and thus experienced depositional rejuvenation. The Walker and Syers (1976) model predicts the Trait 1 convex cumulative trend, as initially high leaching of P from the soil should fall exponentially in the absence of later disturbance of the soil profile. Thus, sites dominated by Trait 1 occur mainly at high altitude and high latitude, where population densities are low and farming is minor or absent. At lower altitudes and higher latitudes, disturbance of the soil by human activity, in particular agriculture and ploughing, would have altered the cumulative P profile (Boyle et al., 2015). It is noteworthy that the only lowland mid-latitude sites that display Trait 1 (Lake Harris, Anderson Pond, and Jackson Pond) occur in regions that did not experience early farming.
Traits 2 and 3 are found in landscapes that have experienced some disturbance during the Holocene. In the case of Trait 2, this can be either human or climatic disturbance, or a combination of both. At Hatchmere, weak Neolithic and stronger Bronze Age increases in P yield are attributed to the substantial impact of early farming, with its dependence on livestock (Boyle et al., 2015). At Dudinghauser See, Schulzensee, and Tiefer See there is evidence of Neolithic forest clearance and Bronze and Iron Age farming, and all three sites had permanent settlement beginning in the Middle Ages (Selig et al., 2007). At Laguna Zoncho the temporal pattern differs slightly because the step changes in yield occur later in the Holocene than at the European sites. Here the lake is much younger, only forming around 3100 BP; however it too has been impacted by farming, with the entire record considered dominated by human activity (Filippelli et al., 2010). At all these sites it is likely that the mid-Holocene increase in P supply can be explained by human activity disrupting the P cycle.
The three high-mountain sites are rather different. At Lac d'Anterne, in the French Alps, there is a human impact signal; for each of the increases in P yield, Giguet-Covex et al. (2011) also find evidence that points to possible human activity in the catchment, particularly cattle-based farming. However, an increase in minerogenic supply also coincides with the onset of regional neoglaciation at ca. 5500 BP (Giguet-Covex et al., 2011), with a corresponding increase in P yield (Fig. 5), presumably of mineral origin. Similar shifts in supply are also seen coinciding with regional glacial advances between 4600 and 2400 BP and during the Little Ice Age (Giguet-Covex et al., 2011). Thus, increases in P supply in the mid-Holocene cannot be attributed to purely anthropogenic or climate-driven factors. In contrast, the two British Columbia sites (Kokwaskey Lake and Lower Joffre Lake) certainly experienced no substantial direct human impact. The P increases at various points in the Holocene are attributed to cooler and moister climates leading to increased glacial activity, and the main part of the enhanced P supply is particulate (Filippelli et al., 2006; Filippelli and Souch, 1999). The sediment record at Lower Joffre Lake is dominated by mineral P from glacial sources, particularly during the early Holocene but also the last ca. 3500 years, and the patterns of increasing mineral P fraction seen in the record match known cold events and glacial advances in the area (Filippelli et al., 2006). Kokwaskey Lake also has a high mineral P fraction throughout the record (Filippelli and Souch, 1999). The increases in yield at Kokwaskey Lake (Fig. 5) are attributed to the early neoglaciation, beginning at ca. 7.4 ka in western Canada (Menounos et al., 2009), and increasing mineral P supply from glacial sources. The effects of the Little Ice Age are also identified in the sediment record (Filippelli and Souch, 1999).
Trait 3 sites also occur in landscapes that have experienced disturbance. Here we have separated those lakes that have experienced a recent (post ca. 1850 CE), and often very large, acceleration in P yield caused by an increase in human activity. At Lake Harris, yield accelerated as a result of cultural eutrophication after ca. 1900 CE (Kenney et al., 2016), while at Lake Trummen the expansion of the town of Växjö on the lake shore caused extreme nutrient pollution (Digerfeldt, 1972). Were it not for truncated records, Trait 3 would also be present at Esthwaite, Windermere, and Lake Peipsi, reflecting 20th century contamination by domestic sewage. Sämbosjön shows a particularly strong surface enrichment due partially to farming-related nutrient pollution, but also due to surface sediment P cycling (Digerfeldt and Håkansson, 1993), a phenomenon known as a stationary peak where recycled P is stored temporarily near the sediment surface but has no direct bearing on lake P supply history (Moyle and Boyle, 2021). Trait 3 is found at sites suitable for human settlement, whether towns with connected sewers or rural areas with septic systems. In many cases Traits 2 and 3 are coincident. However, recent changes in upland farming economies, and falling population densities in marginal land, mean that not all Trait 2-affected sites display Trait 3 (Collantes, 2006).
Five lakes do not appear to conform to any of the three traits: Lac d'Annecy, Esthwaite, Lake Immeln, Lake Peipsi, and Plešné Lake (Fig. 8). These sites are all in relatively low-altitude catchments which have not experienced substantial lowland farming and therefore do not show Trait 2 characteristics. At least three of these sites (Lac d'Annecy, Lake Peipsi, and Esthwaite) might be expected to show Trait 3 if the sediment record had extended to the present day, while the other two sites contain no human settlements and therefore would not show this trait. At all five sites deglaciation occurred some thousands of years before the Holocene, which explains why they do not show the Trait 1 characteristic of initially rapid and decreasing P supply over the Holocene. However, these sites are essentially exhibiting the stable phase seen in the middle to late Holocene at the Trait 1 sites and can therefore effectively be considered Trait 1 sites without the initial disturbance. This, along with the absence of any visible human disturbance on terrestrial P cycling (Traits 2 and 3), makes these sites ideal for examining the impacts of natural environmental change on lake–catchment systems, including their use in predicting response to future climate change (Dearing et al., 2006). It is worth noting that the absence of clear Trait 2 signals at these sites need not indicate a lack of anthropogenic disturbance, rather that such signals of human impact on P cycling are dwarfed by natural fluxes to the extent that they are not visible in cumulative P yield profiles (Fig. 8).
4.3 Environmental correlations
The three traits capture part of the environmental controls over pathways of P supply to the lakes, particularly the roles for glacially reset soils at high latitudes or altitudes, and for anthropogenic disturbance of the P supply at warmer lowland locations. However, other environmental factors will have influenced the total P supply to each of the lake sites. We anticipate that high values of depth equivalent runoff will promote export of terrestrial P, while high mean annual temperatures associate with and may be a proxy for levels of human activity in temperate landscapes. We do not here consider the role of geology. The success of the morphoedaphic index in predicting lake water TP at sites with low human impact (Cardoso et al., 2007) suggests that geology plays a role, particularly the presence of limestone, but at present regional-scale maps of lithological data are not available, precluding any generalized assessment of bedrock.
Table 1P yield modelled on R (depth equivalent modern mean annual runoff; m yr−1) and MAT (modern mean annual temperature; ∘C). See Fig. 9 for graphs.
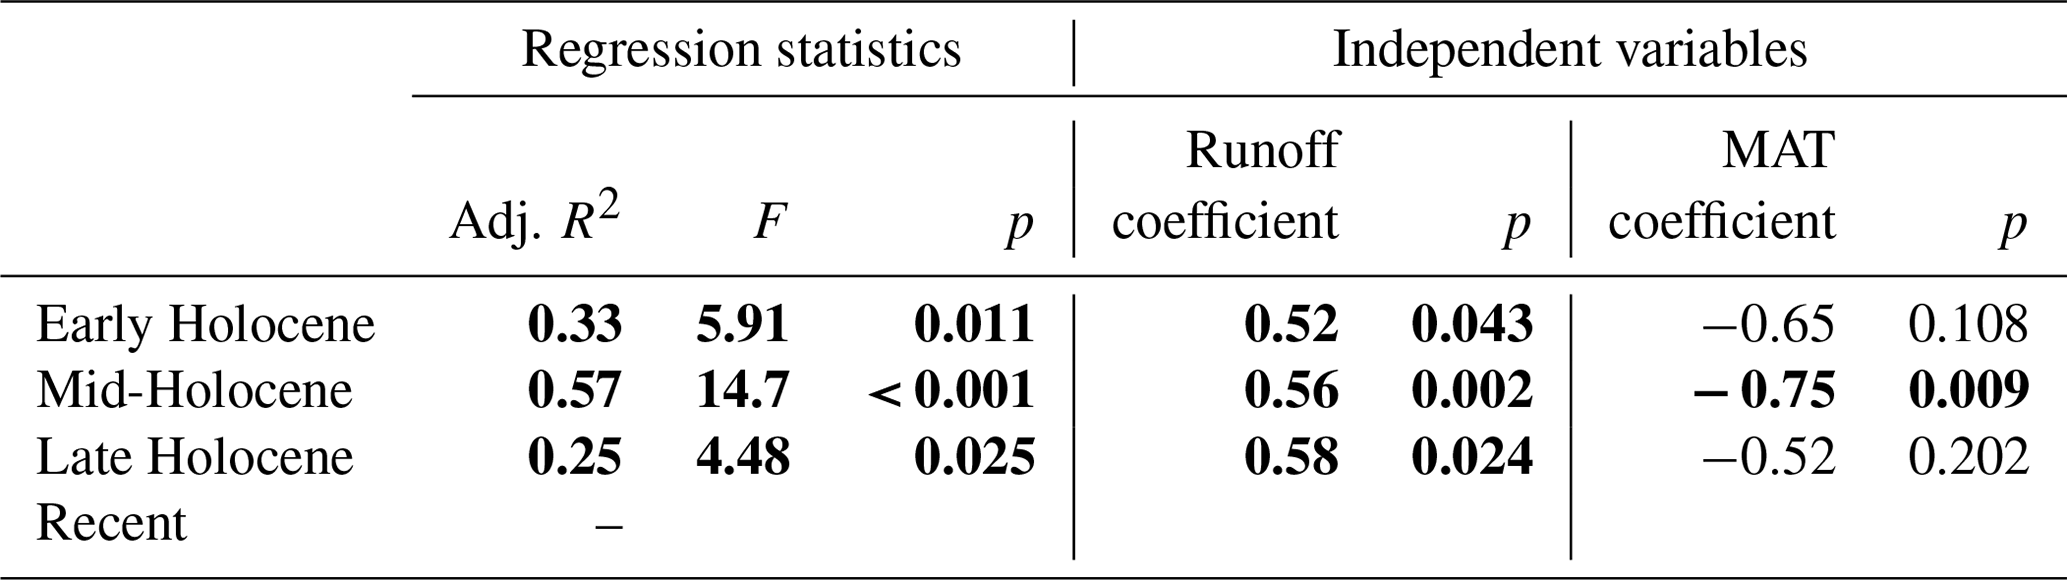
Note: Dudinghauser See is excluded from this analysis. Bold values are significant at the 5 % level.
The positive association of mean P yield with modern mean annual runoff (Fig. 9, Table 1) for all periods except the recent period is consistent with runoff-enhanced leaching of soil P playing an important role in P export from terrestrial landscapes (Boyle et al., 2013). The breakdown in this relationship in the recent period might be attributed to masking by direct human impacts. For example, the rate of supply of P from domestic sewage is little related to runoff (Withers and Jarvie, 2008). A negative association of P yield with modern mean annual temperature (Fig. 9, Table 1) is also present through the Holocene. Given that a positive association is expected if temperature is a proxy for the levels of local human activity, direct human impact appears not to explain this effect. Instead, this result is consistent with cooler sites being more likely to have glacially reset P-enriched soils (e.g. Filippelli and Souch, 1999) and thus more likely to conform to Trait 1. The breakdown in relationship of P yield with both temperature and runoff in the late Holocene (Fig. 9, Table 1) may in part be due to the decreasing availability of apatite after soil development and increasing landscape stability (Boyle et al., 2013), changing the role of climate in P supply. However, we know that direct human P supply is increasingly important from the mid-Holocene and may dominate the total P load. The scale and timing of this impact of human activity will depend on lake location and land use, with lowland sites much more heavily affected than upland sites (Boyle et al., 2015).
It appears, therefore, that climate associations with P yield are both direct and indirect. Based on river flux data, weathering rate is known to increase with runoff (Amiotte Suchet and Probst, 1993; Bluth and Kump, 1994), with power coefficients of 0.8 for silicates and 1.0 for limestone (Boyle, 2008), so increases in P yield with runoff are expected. Our observed power coefficients, 0.52 and 0.56 for P yield in the early and mid-Holocene, respectively, though lower, are close enough to show broad consistency with the observations from contemporary rivers. In contrast, a decrease in weathering rate with temperature is not seen in river studies. Instead, the most likely explanation is that temperature is a proxy for landscape age, with low-temperature sites being more likely to have experienced glacial resetting and thus have base-rich soils. This means that we have no evidence that a change in temperature would impact the P yield. Rather, of modern anthropogenic drivers, it is the increasingly intense direct human land use that we would expect to condition future P yield.
Table 2TP modelled on R (depth equivalent modern mean annual runoff; m yr−1) and MAT (modern mean annual temperature; ∘C). See Fig. 9 for graphs.
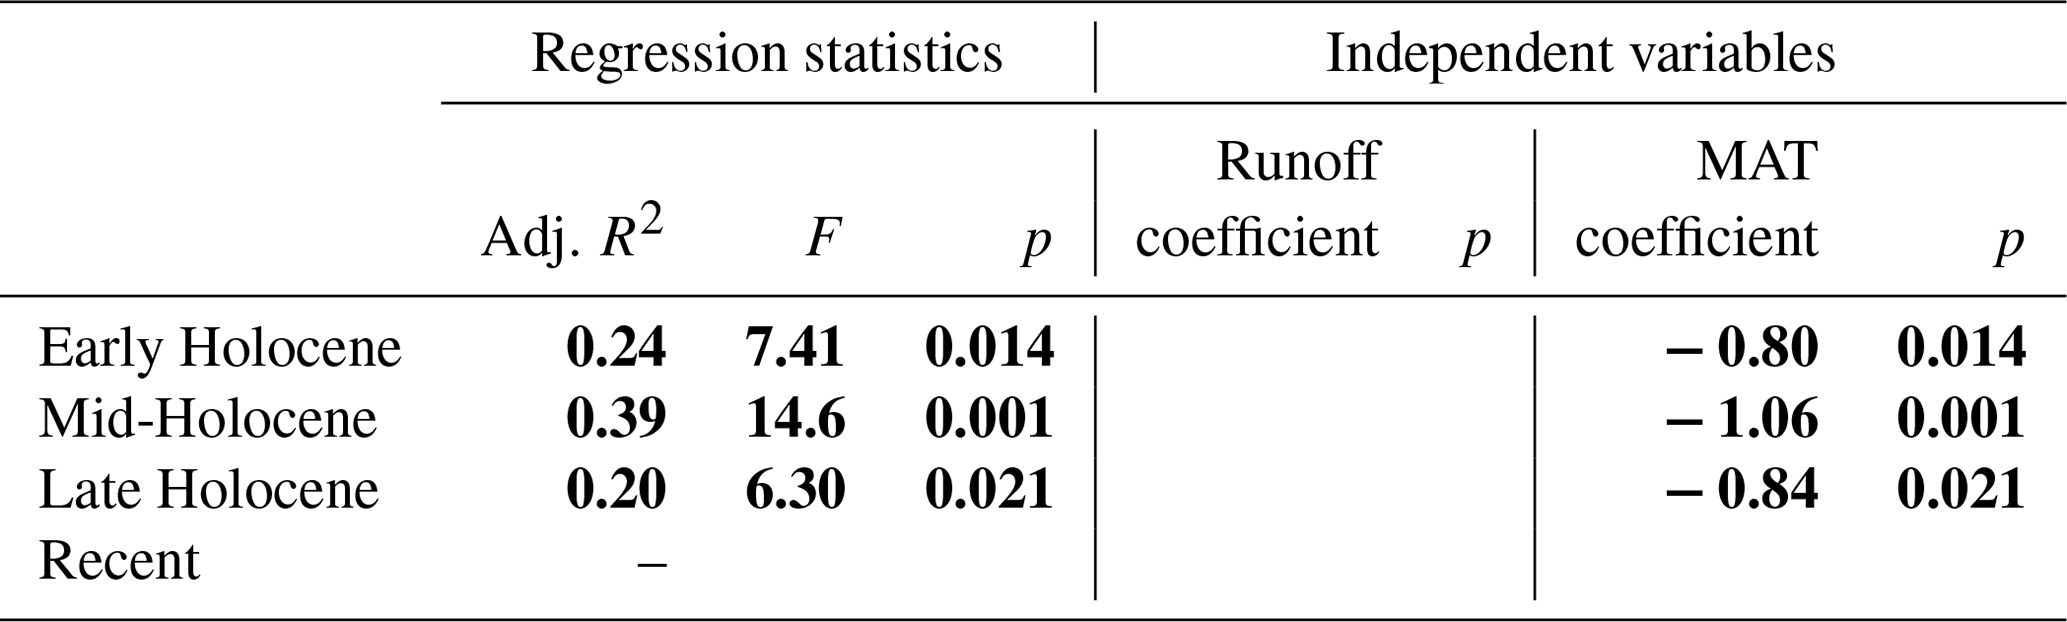
Note: Dudinghauser See is excluded from this analysis. Bold values are significant at the 5 % level.
Climatic control over SI-TP concentration differs somewhat from that over P yield. The P yield-to-runoff coefficients (0.52 to 0.56) imply SI-TP-to-runoff coefficients of −0.44 to −0.48; that is that SI-TP is diluted by increasing runoff. Multiple regression is consistent with this in so far as negative coefficients are obtained. However, the regressions (not shown) are not statistically significant, so we must conclude that any runoff signal present is weak. The SI-TP data do, however, also show strong negative associations with temperature (Table 2) for the middle and late Holocene, which again we must suppose is due to a landscape age association with temperature.
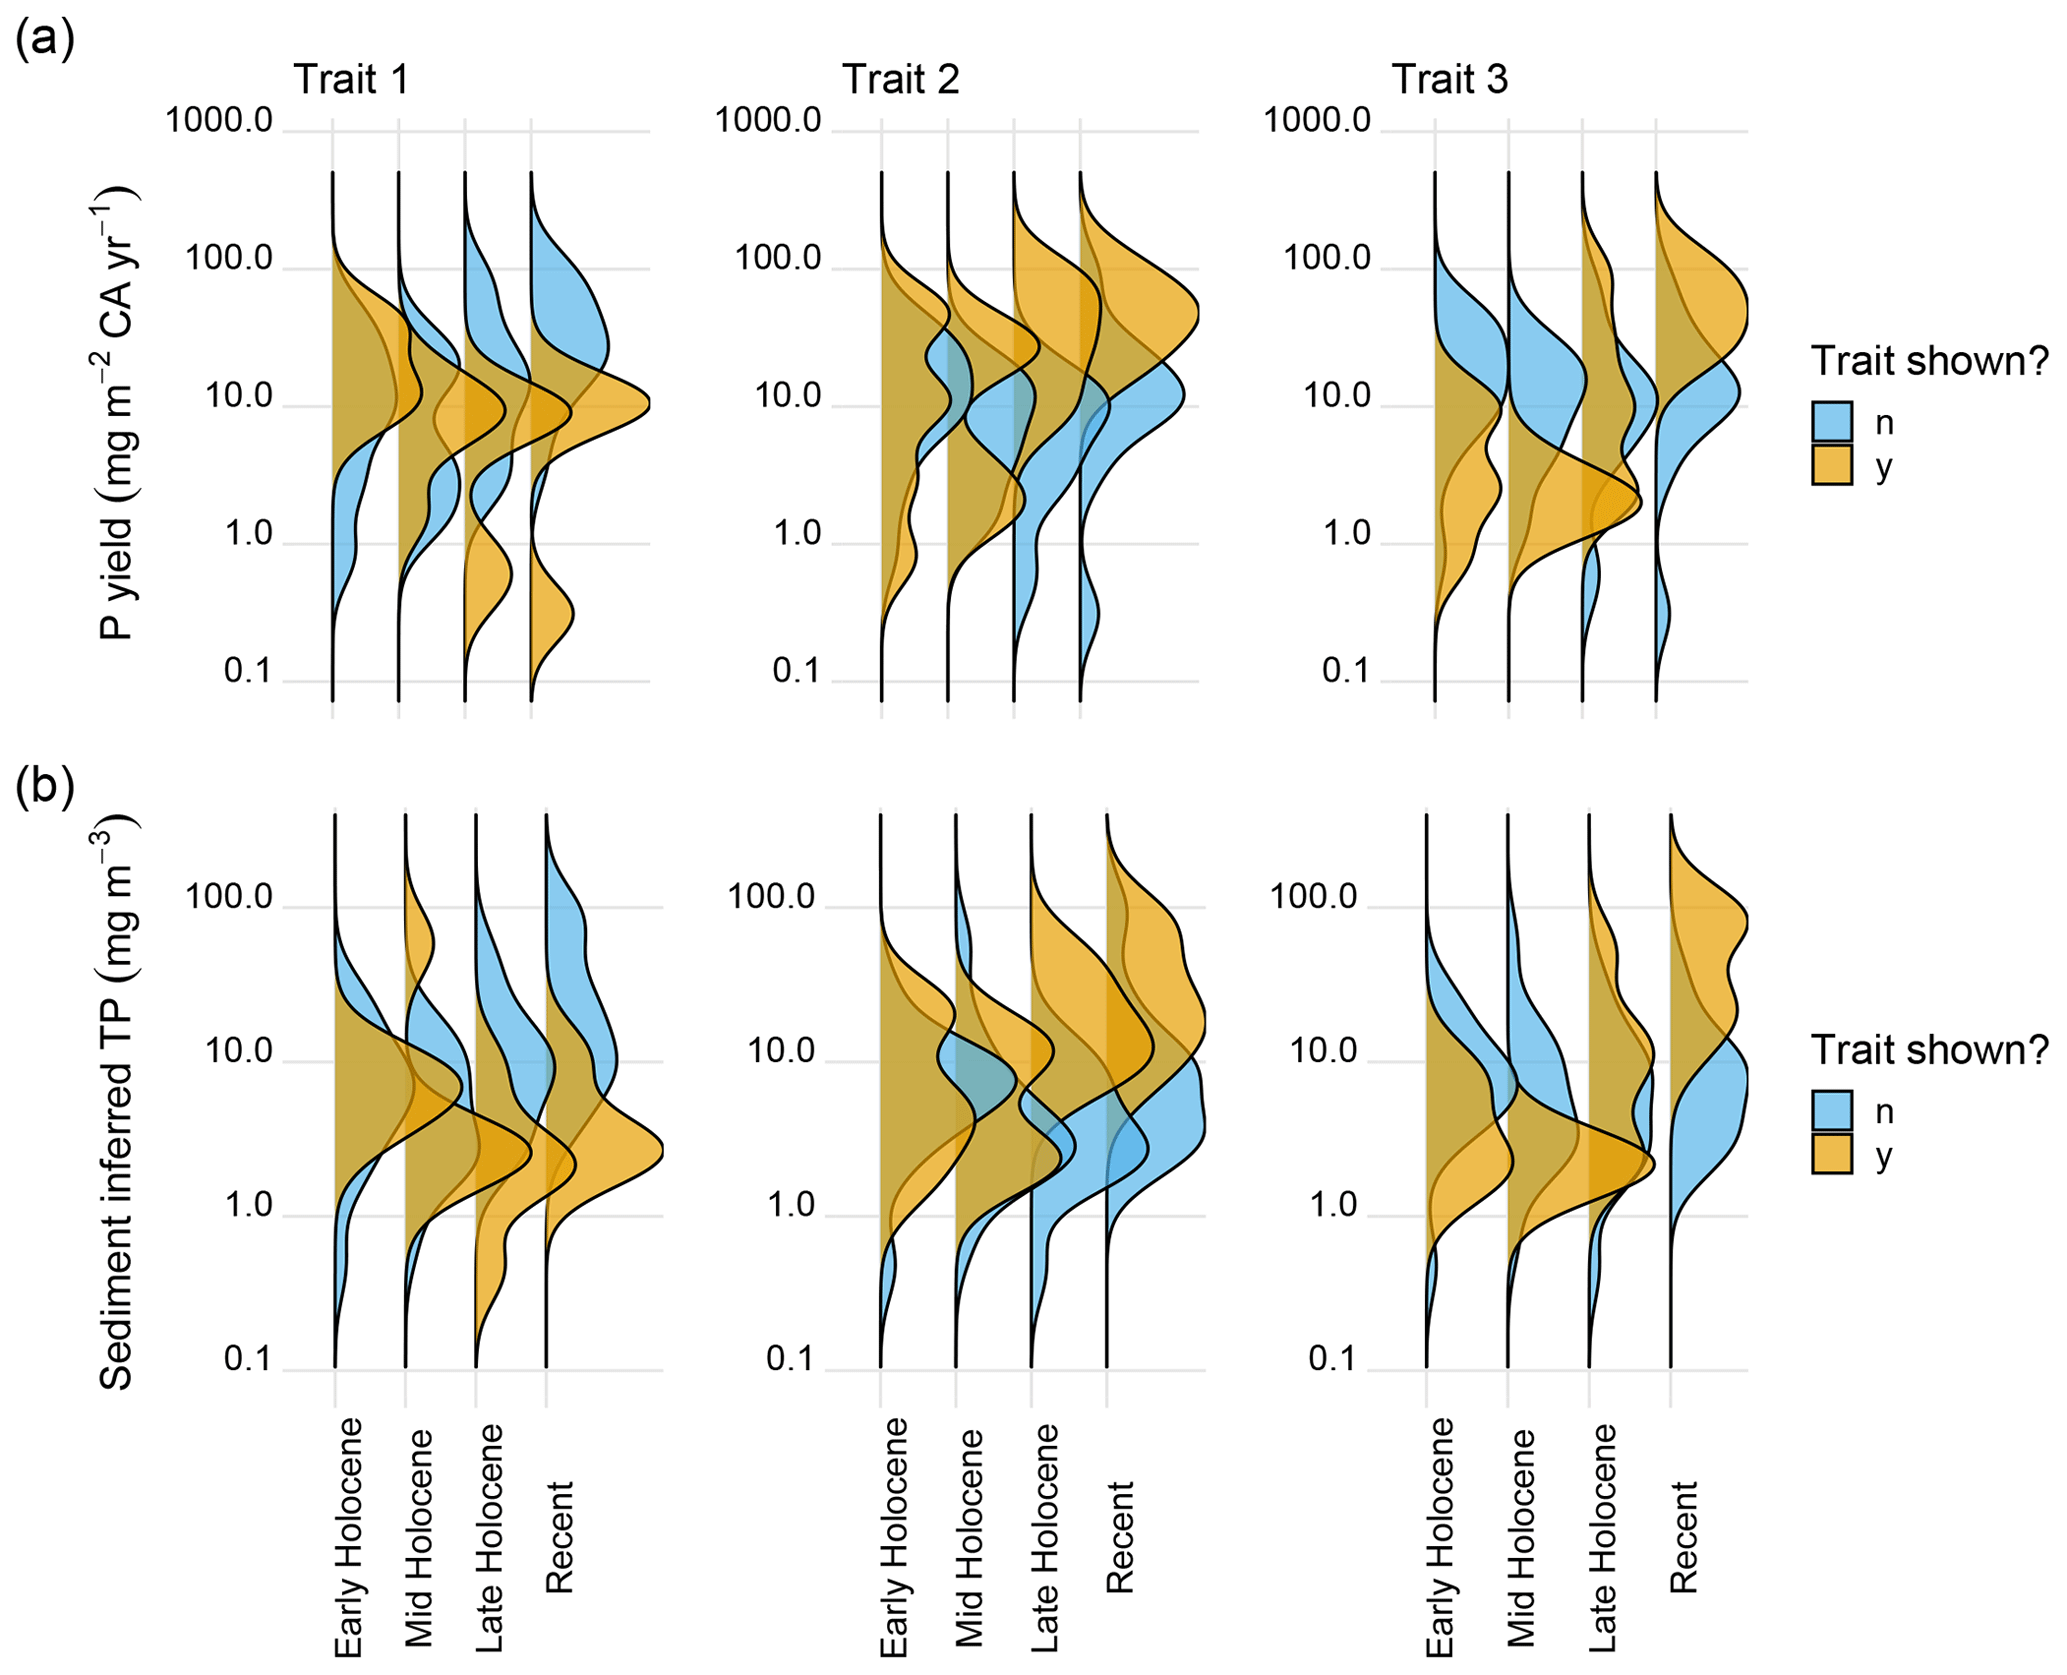
Figure 10Density distribution curves of (a) sediment mean P yield and (b) sediment-inferred mean lake water TP showing changes in the three traits throughout the Holocene. Note Dudinghauser See was removed for this analysis (see Sect. 3).
4.4 Reference values from the past
Our reconstructions of Holocene P dynamics provide long-term context for present-day P supply and lake TP conditions. With these reconstructions we can begin to look at geographic variation in P supply history and address questions about past lake nutrient status and of natural versus climatic drivers of change. Despite the great site-to-site variability across the 24 lake records, some generalization can be made about spatial and temporal variations in past P dynamics by examining mean values associated with the three traits (Fig. 10). To deal with differing sample sizes and skewed datasets, all quoted figures are mean of means on log-transformed data. By comparing patterns in the three traits, we can see both the role of climate and the increasing influence of human activity on the P cycle through the Holocene.
4.4.1 Holocene landscape P supply
Quantitative reconstruction of past landscape P yield is key to understanding present-day terrestrial P cycling, lake water nutrient status, and export of terrestrial P to the oceans. Our identification of traits associated with specific landscape histories offers the possibility of developing a geographically differentiated method of predicting both present-day lake water TP status and landscape P export at sites where no empirical data exist.
For the lakes in our dataset, sites dominated by Trait 1, those with little or no human impact through most of the Holocene, show progressively decreasing average yield through time (Fig. 10a). These sites have the highest average yield values in the early Holocene of 20 , values identical to those reported for modern subglacial soluble reactive phosphorus yield in Greenland (17 to 27 (Hawkings et al., 2016)). In contrast, sites not exhibiting Trait 1 average just 8 .
Sites dominated by Trait 2, which are predominantly those with long histories of human impact, show the opposite trend. Progressively increasing average values are seen through the Holocene (Fig. 10a), with a late Holocene average of 30 increasing to 45 by the recent period, compared to those not displaying Trait 2 having averages of 5 and 10 , respectively. The late Holocene Trait 2 values are consistent with a long-term P export simulation for typical UK conditions of 30 to 45 (Davies et al., 2016). They are also comparable with phosphorus export coefficients for farmed land use categories in Scotland, with improved grassland and arable land giving values of 32 to 62 and 74 to 154 , respectively (Donnelly et al., 2020). The early to mid-Holocene Trait 2 values fit well with P yields for average modern low-intensity land use categories, with reported P yields for montane vegetation of 2.5 to 6 and upland rough grassland and heath of 6 to 12 (Donnelly et al., 2020). These values are much lower than our early Holocene Trait 1 rates, as expected given a prolonged history of mineral depletion at such sites (Boyle et al., 2013).
Finally, the six sites exhibiting Trait 3, those with abrupt increases in recent P yield, have an average recent P yield of 50 , compared with 11 at all other sites. Our Trait 3 rates are low compared with the corresponding export coefficient category (factories and urban, 138 to 283 ; Donnelly et al., 2020), but then none of our catchments are fully occupied by this type of land use. This is not an exhaustive comparison with present-day values; for example similar values are reported in an application of the SPARROW model, used to predict TP export and delivery rates, for a catchment in Ontario (Kim et al., 2017). But the comparison does show that our P yield records are consistent with modern direct observations.
These reconstructed P yield histories are useful for any attempt to model long-term landscape macronutrient cycling, whether simple process models (Boyle et al., 2013, 2015) or more complex coupled soil–ecosystem models (Davies et al. 2016), and provide an opportunity to critically test our understanding of long-term terrestrial ecosystem dynamics. They also provide spatially distributed estimates of P export to the oceans and, crucially, reconstructions of variability in long-term (∼ millennial) trends. Given P availability can impact primary production in the oceans influencing the carbon cycle and global climate (Paytan and McLaughlin, 2007), better constraint of the terrestrial P yield is of considerable importance (Sharples et al., 2017).
4.4.2 Lake water TP concentrations
Reference values play a central role in the management of nutrient-impacted lakes, representing the conditions that would be expected in the absence of significant human impact on the lake system. They often form the basis of water quality assessments, for example the EU Water Framework Directive (WFD) (European Commission, 2000), where they can be compared to present-day values to test how far a lake has deviated from the ideal “status”. Bennion et al. (2011) point out that a distinction must be made between a “pristine” value and a “reference” value as the pristine state, the condition of the lake before any human impact, will vary naturally through time. Lake sediment records provide the opportunity to look at variations in lake condition over long time periods, allowing potential pristine and reference conditions to be identified. Using our Holocene records, we can begin to attempt this here. In separating the lakes by trait, our reconstructed SI-TP values offer an approach for predicting lake nutrient status histories for sites where landscape history is known but no palaeoecological or geochemical data exist for site-specific estimation. By examining whole Holocene trends in lake nutrient dynamics, we also have an opportunity to identify the earliest human impacts on lake TP concentrations, as well as identifying the periods before any impact where the lakes may be considered pristine. Both inform the debate about levels of lake water TP consistent with “high ecological status” and are crucial for the reliable identification of water quality targets (Hübener et al., 2015).
Trait 1 sites are in catchments with minimal human disturbance; therefore the reconstructed Holocene SI-TP profiles represent naturally shifting pristine conditions. These sites show progressively decreasing mean SI-TP concentrations through the Holocene (Fig. 10b; 6.4, 4.3, 2.2 mg m−3, averages for early, middle, and late Holocene, respectively), whereas those not exhibiting Trait 1 deviate from this pattern (Fig. 10b; 5.8, 4.4, 8.5 mg m−3, averages for early, middle, and late Holocene, respectively). The Trait 1 decline is consistent with a dominant role for soil mineral depletion in regulating surface water TP dynamics at undisturbed sites and the decline in P export predicted by the (Walker and Syers, 1976) conceptual model. These sites also show a much narrower range of mean SI-TP concentrations throughout the Holocene than those sites not exhibiting Trait 1 (Fig. 10b).
Apart from the Trait 2 high-mountain sites, the Trait 2 and 3 sites show an increasing impact of human activity on lake nutrient status through the Holocene (Fig. 10b). The eight Trait 2 sites have a recent period mean of 26 mg m−3 and a late Holocene mean SI-TP concentration of 17 mg m−3, compared to 5 mg m−3 in the mid-Holocene. Unsurprisingly, the highest mean Holocene SI-TP concentrations are in the recent period at Trait 3 sites; those defined by a sharp increase in modern P supply. These six sites have a recent mean SI-TP concentration of 40 mg m−3, compared to 7 mg m−3 for the remaining sites (Fig. 10b). This pattern of increasing Holocene P with high modern concentrations is consistent with an observed global increase in lake water TP arising from cultural eutrophication in the last few centuries (Smith, 2003) but also shows there is a much longer history of human impact on lake TP concentrations stretching further back into the Holocene.
The problem of how best to determine the nutrient concentrations expected in a lake with “minimal anthropogenic impairment” is reviewed by Hübener et al. (2015). They compare widely applied empirical modelling approaches with palaeolimnological methods and particularly consider the issue of how far back in time one must look to find minimal human impact. Battarbee et al. (2011) found the first unambiguous lake sediment evidence of nutrient enrichment linked to human activity from 1850 CE onwards and typically after 1900 CE, an observation supported by Bennion and Simpson, (2011). However, other studies have found evidence of enrichment predating 1850 CE (see Hübener et al., 2015, and Bjerring et al., 2008), particularly in lowland agricultural areas, in some cases suggesting that periods of minimal impact can be found “only by considering century to millennial timescales” (Bradshaw et al., 2006). Considering this, Hübener et al. (2015) cautioned against setting a fixed age for pristine lake conditions, themselves finding the age of initial impairment extending back to ca 1100 CE in four of their 14 lakes and beyond the limit of their records (ca 500 CE) in two.
Our Trait 2 lakes, those impacted by early farming, show initial enrichment extending as far back as ca. 6000 BP (Fig. 6), contributing to the evidence for a long history of nutrient enrichment in lowland agricultural areas. The early enrichment is such that reference values based on later periods would be substantial overestimates of minimally impaired conditions. For example, for our Trait 2 sites the late Holocene mean SI-TP of 17 mg m−3 is broadly consistent with the mean pre-disturbance DI-TP value (23 mg m−3), representing the period from 500 CE to more recent enrichment, found for the northern German sites (Hübener et al., 2015). This suggests that the 1500-year sediment profile analysis by Hübener et al. (2015), the longest measured DI-TP reference value records to date, still do not extend back to conditions of minimal human impairment. Of perhaps greater importance is the observation that the model-predicted reference value for these lakes (European lake type CB 1; Poikane, 2009) is 24 mg m−3, much greater than our Trait 2 average mid-Holocene SI-TP value (5.3 mg m−3) and similar instead to our farming-impacted late Holocene average value (17.2 mg m−3). Does this mean that the empirical methods are failing in Trait 2 regions? Proposing a specific CB category predictive model, with higher TP thresholds than for other European regions, Cardoso et al. (2007) warn that the difference might reflect unaccounted for anthropogenic impacts and recommended further research to resolve the question. Our findings offer tentative evidence that concern about the CB region is well-founded. Two other problematic WFD regions (EC and MED) have also been identified by Poikane et al. (2015). These regions have few lakes in a natural condition and complex climatic and morphological factors that make it difficult to define water quality class boundaries. Poikane et al. (2015) suggest these lakes would also benefit from the use of palaeolimnological data to define reference conditions, so there is clearly a need for long sediment records in water quality management.
Our findings reinforce the conclusion of Hübener et al. (2015) that defining specific lake states in terms of fixed timescales is unwarranted. However, unlike Hübener et al. (2015), we do not find broad agreement with WFD modelled reference conditions for the sites in northern Germany; neither do we find agreement for our other Trait 2 sites. While we accept that it is pointless to define lake restoration targets that are unachievable (Bennion et al., 2011), it is nevertheless essential that pristine states are known. We conclude that for lowland lakes in regions subject to prehistoric farming, reference values based on palaeolimnological methods require records that extend at least to the mid-Holocene in order to capture a period without anthropogenic impairment and that current WFD modelling methods may be substantially overestimating the “high status” reference TP values.
4.5 Reliability and limitations
To evaluate the accuracy of our palaeolimnological data, we can compare inferred values for recent sediment with corresponding monitored data and compare our results with those of alternative methods. Of the 16 sites where monitored lake water TP data are available, 11 of the SI-TP values lie within a factor of 2 of the measured TP values (Fig. 7b). Where there is a mismatch between observed and SI-TP, it is typically a function of (1) a stationary P peak in the surface sediment, (2) low-resolution or missing sediment data, or (3) issues with the accuracy or resolution of the age model constraining the calculated fluxes. From this comparison and previous analysis (Moyle and Boyle, 2021), we conclude that our SI-TP values are unbiased. And from this, given that accurate TP inference depends on the sediment-inferred P load and P yield data, we conclude that these too are unbiased.
In principle, a further test of the accuracy of our SI-TP values is provided by comparison with long DI-TP records. This is possible for the whole Holocene at Sargent Mountain Pond using data from Norton et al. (2011), though only at low resolution, and for recent millennia at Schulzensee, Tiefer See, and Dudinghauser See in northern Germany using data from Hübener et al. (2015). At Sargent Mountain Pond, mean Holocene DI-TP is 6.3 mg m−3 (Norton et al., 2011), double the value of mean SI-TP (3.5 mg m−3). Comparing the profiles of the two records, DI-TP (Norton et al., 2011) does not show the early Holocene peak seen in SI-TP (Fig. 6). However, the peak in SI-TP corresponds to a peak in DI-pH (Norton et al., 2011), showing that the diatom assemblage varied in parallel with SI-TP. At the three lowland German lakes the situation is more complex. Averaged across the last 1000 years SI-TP and DI-TP (Hübener et al., 2015) have similar magnitudes at both Tiefer See (DI-TP = 22 ± 15, SI-TP = 19 ± 15, mg m−3) and Schulzensee (DI-TP = 64 ± 24, SI-TP = 74 ± 28, mg m−3). At Schulzensee a large increase in TP concentration is present for both proxies at approximately 1000 BP. The DI-TP record does not extend far enough back in time at Tiefer See to test for a comparable increase. At both sites shorter-term variations are less well matched. At Dudinghauser See the situation is different. The post-1900 sediments are in reasonable agreement (DI-TP = 38 ± 11, SI-TP = 47 ± 25, mg m−3), but for the interval with high sediment P concentration (1600 to 100 BP) there is a poor match (DI-TP = 20 ± 11, SI-TP = 136 ± 63, mg m−3). The mismatch at Dudinghauser See and shorter-term differences at Schulzensee and Tiefer See may be in part attributed to the use of secondary data where not all parameters required for the SI-TP model (Moyle and Boyle, 2021) are available, in this case sediment dry density data. However, biases in the DI-TP for this older sediment cannot be ruled out. The strong influence of pH on diatom flora may interfere with the DI-TP reconstruction (Juggins et al., 2013), not just at Sargent Mountain Pond, but also at the three German lakes. At these sites, high alkalinity makes the pH particularly sensitive to changes in hypolimnetic carbon dioxide (Stumm and Morgan, 1995), potentially influenced by eutrophication via the impact of algal blooms. Evaluation of these issues of covariance in environmental forcing needs a comprehensive assessment of the diatom ecology and would benefit from analysis of additional core sites with full physical and geochemical data supported by high-resolution chronologies.
Hatchmere is a good example of a lake sediment record containing a stationary peak: recycled P temporarily stored near the sediment surface. Here, high values for P concentration in the top of the record are unrelated to P supply and are of little use in reconstructing P yield (Moyle and Boyle, 2021). Stationary peaks are an inevitable occurrence at some sites. However, providing they are identified and the peak disregarded, false interpretation can be avoided.
For the purpose of this study, we assume that sediment focusing at each lake is temporally invariant. While it has long been known that sediment focussing intensity varies through a lake's history, and that reductions through the Holocene are likely to have occurred (Davis and Ford, 1982; Likens and Davis, 1975), the possible large variations inferred from modelling (Lehman, 1975) have not been reported. Until a suitable generalized predictive model exists, we are compelled, with due caution, to assume constancy (Engstrom and Wright, 1984). We also treat RP and qs as constant through the Holocene for two reasons. First, Holocene temporal variation in RP at our sites is likely to be small compared with between-site differences. Second, the palaeoclimatic information needed to calculate temporally resolved values, such as runoff, is not generally available. The assumption of negligible temporal variability is supported by sensitivity testing: varying qs (and consequently RP) by 20 % results in less than 2 % change in RP. However, disregarding temporal variation is not a model constraint: where larger variations are known, and where reliable palaeoclimate data exist, temporally varying RP values can be used to drive the SI-TP model (Moyle and Boyle, 2021). Likewise, a correction might be made for the impact of reduced water supply due to abstraction, but this is not thought to have substantially impacted the lakes of this study.
Missing or low-resolution data are an inherent problem with secondary and legacy data sources. Here, the UK Lake District records (Windermere, Ennerdale Water, and Esthwaite) have not captured the more recent late 20th century peak in lake eutrophication. Similarly, the sediment accumulation rate data for the German records (Schulzensee, Dudinghauser See, Tiefer See) were presented as long intervals at a constant rate, masking likely fluctuation or acceleration of accumulation towards the present day. Problems with age models also impact mass accumulation rate calculations and calculated P yield. At Lake Peipsi, the age model used is based on 14C ages, and the lack of resolution in sediment accumulation rate for the recent period leads to a mismatch between SI-TP and monitored TP values. More problematically, the UK Lake District records (Fig. 1) are dated only by interpolation between basal Holocene and the present but show how reconstructions can still provide valuable information despite a lack of appropriate dating. For some of the records in this study, a degree of additional post processing of the site data could have achieved better matches to monitored data. For example, we tested developing a better recent sediment accumulation rate record at Lake Peipsi using 210Pb radiometric dating (Heinsalu et al., 2007), which produces SI-TP values much closer to the monitored TP values. However, our primary aim was to consider the longer record, and emphasis on the more recent period would have detracted from this. We also aimed to assess just how much can be learned from even rather incomplete datasets.
Moyle and Boyle (2021) address the question of suitable site choice and data collection, pointing out that this method will not necessarily work everywhere. Nevertheless, in most cases, TP reconstruction using the sediment record can still provide valuable information about long-term changes in lake nutrient status and supply. There is a clear need for further data collection at both new and existing study sites, with experimental design built to avoid the issues identified here. For each lake, this should include sufficient appropriately positioned sediment cores with a full suite of measured chemical and physical properties and robust age models. With proper understanding, potential problems with the sediment record can be anticipated, identified, and avoided.
Using published sediment P records from 24 lakes distributed across the Northern Hemisphere, we apply the SI-TP model (Moyle and Boyle, 2021), a simple process model, to generate Holocene records of long-term average lake water TP concentration and landscape P yield. Our findings show that long-term P dynamics are controlled by climate, landscape development, and human activity, such that knowledge of individual site development is essential to understanding present-day terrestrial P cycling and lake water phosphorus enrichment. Examining the role of climate in P yield, we find that for the impact of depth equivalent runoff on weathering rate we get broad agreement between our calculated exponents and those from river-based studies. Given the two approaches are very different, it suggests that the values calculated here are reasonable. We also find that temperature has a negative influence over early Holocene P yield, which we suggest is because of its association with landscape history as warmer sites are less likely to be recently deglaciated. We find good agreement between our reconstructed SI-TP values and contemporaneous monitored lake water TP records. At the three sites with available diatom-inferred TP records, we also find comparable results suggesting the geochemical approach can provide an alternative to diatom reconstructions of past water quality and can fill the gap where there are no monitoring data. Our P yield values are comparable with reported export coefficient values for similar landscape types and are thus suitable for long-term landscape P modelling.
Evaluating temporal and spatial variations in the dataset, we find distinctive patterns in the terrestrial Holocene P profiles which we use to define three traits, each of which is associated with different catchment properties and land use histories.
-
Trait 1 sites show maximal landscape P yields and SI-TP concentrations in the early Holocene and steady subsequent declines. These sites are typically on landscapes reset by glacial activity, at high latitude or altitude, and remote from intense human impact.
-
Trait 2 sites have low values for P yield and SI-TP in the early Holocene, and maximal values in the late Holocene and recent. These sites are found in two distinct circumstances. The first is at locations where landscape resetting long preceded the Holocene and where early farming was practised, usually at lower latitudes and altitudes. The second is at locations at high elevation and without farming, but where climate-induced neoglaciation occurred from the mid-Holocene, mobilizing P stocks in the catchment.
-
Trait 3 sites show strongly increased recent P yields and SI-TP concentrations. These sites are located near modern population centres or in intensive agricultural landscapes.
The long-term SI-TP reconstructions can be used to identify pre-disturbance baselines needed for lake management. Our palaeolimnological approach offers a way of estimating meaningful reference conditions for farming-impacted (Trait 2) areas where current methods are problematic (Cardoso et al., 2007; Poikane et al., 2015). At Trait 2 sites we find initial enrichment as early as ca. 6000 BP, highlighting the need for millennial-scale perspective.
This study is a first attempt to constrain the timing and magnitude of changes in terrestrial Holocene P dynamics across the Northern Hemisphere, providing useful long-term average terrestrial P flux and SI-TP values. The sediment record perspective places present-day lake P dynamics on a long-term trajectory driven by climate, morphometry, landscape setting, human impact, and time. Organized by traits, this approach has a predictive power for sites without sediment records, allowing estimation of trajectories based on regional landscape development history. By characterizing long-term terrestrial exports for the Northern Hemisphere, the reconstructed values could have application to biogeochemical models that simulate ocean nutrient dynamics on millennial timescales. Improving this dataset with further well-dated high-resolution records would enhance the potential contribution of palaeolimnology to both the understanding and management of lake P enrichment and land export to the oceans.
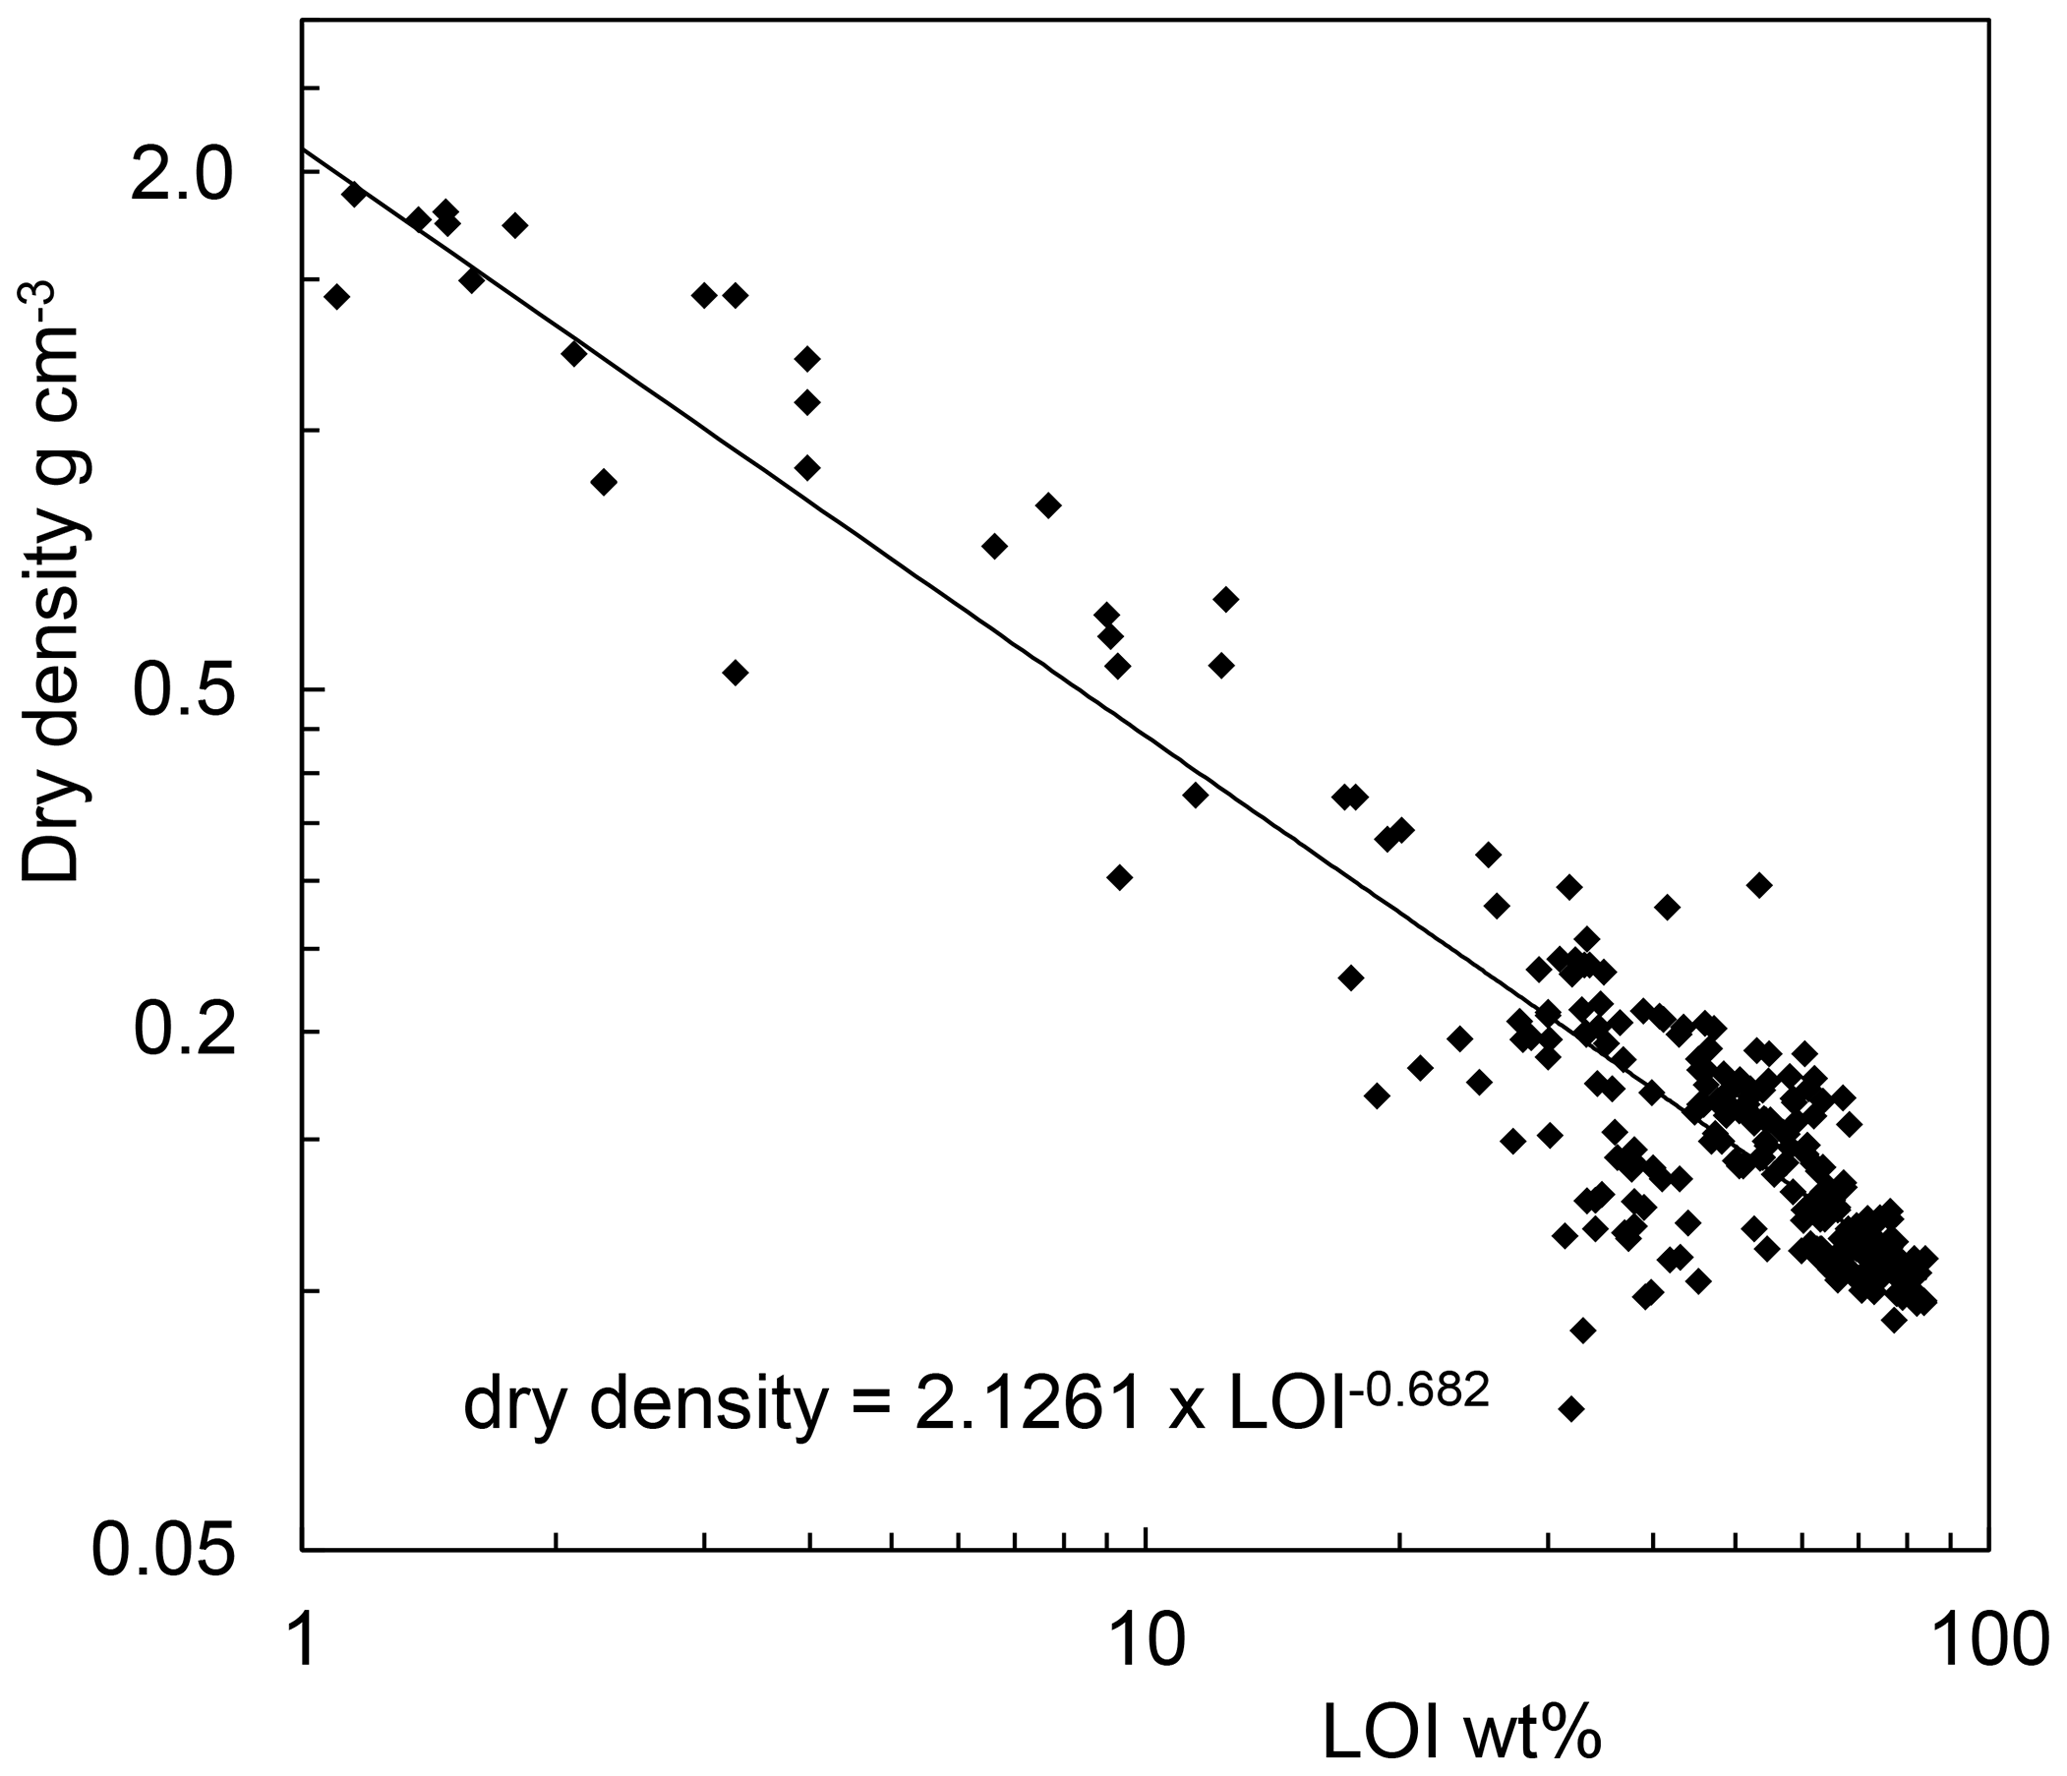
Figure A1An empirical association between dry density and LOI is used to estimate dry density where neither dry density nor water contents were included. Data sources are described in Sect. 2.3.1.
Table B1Parameters used to apply the model. The abbreviations used are: lake area (AL), catchment area (AC), lake volume (V), water residence time (T), water depth at coring site (zcore), mean lake water depth (zmean), maximum lake water depth (zmax), depth equivalent runoff (R), mean annual temperature (MAT), and mean annual precipitation (MAP).
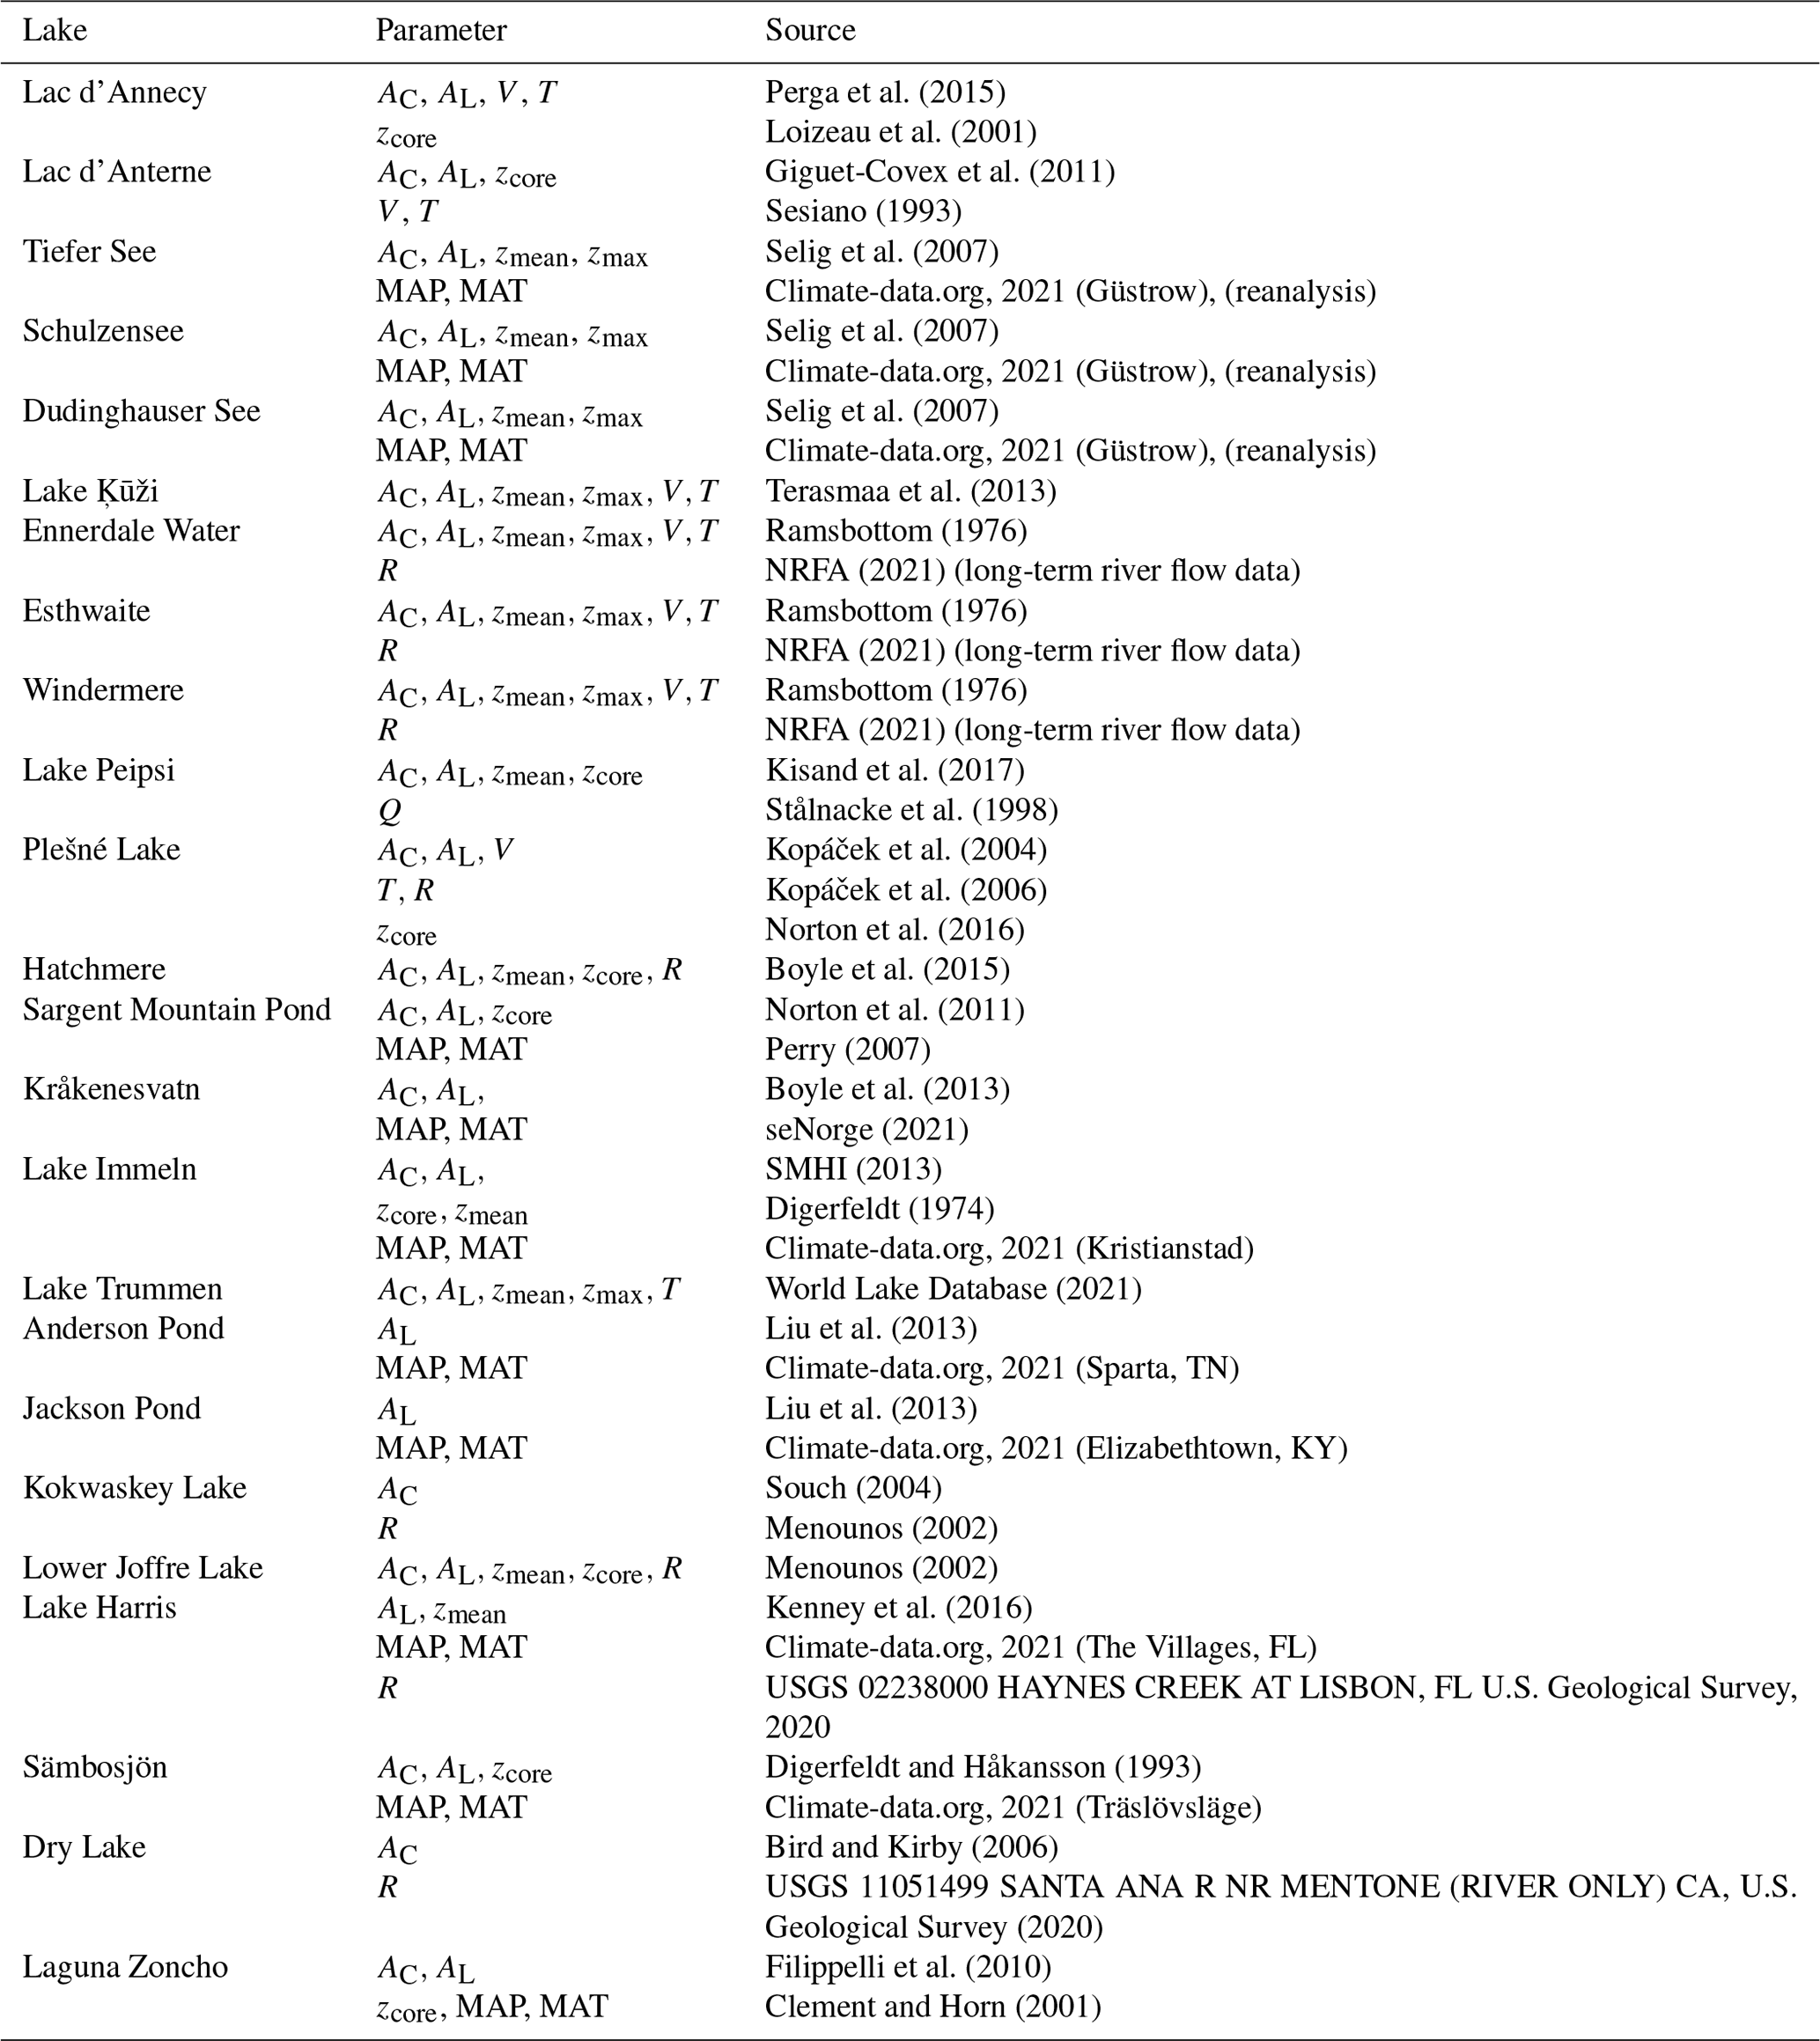
Table B2Sources of data about the sediment records. MAR is mass accumulation rate and SAR is sediment accumulation rate.
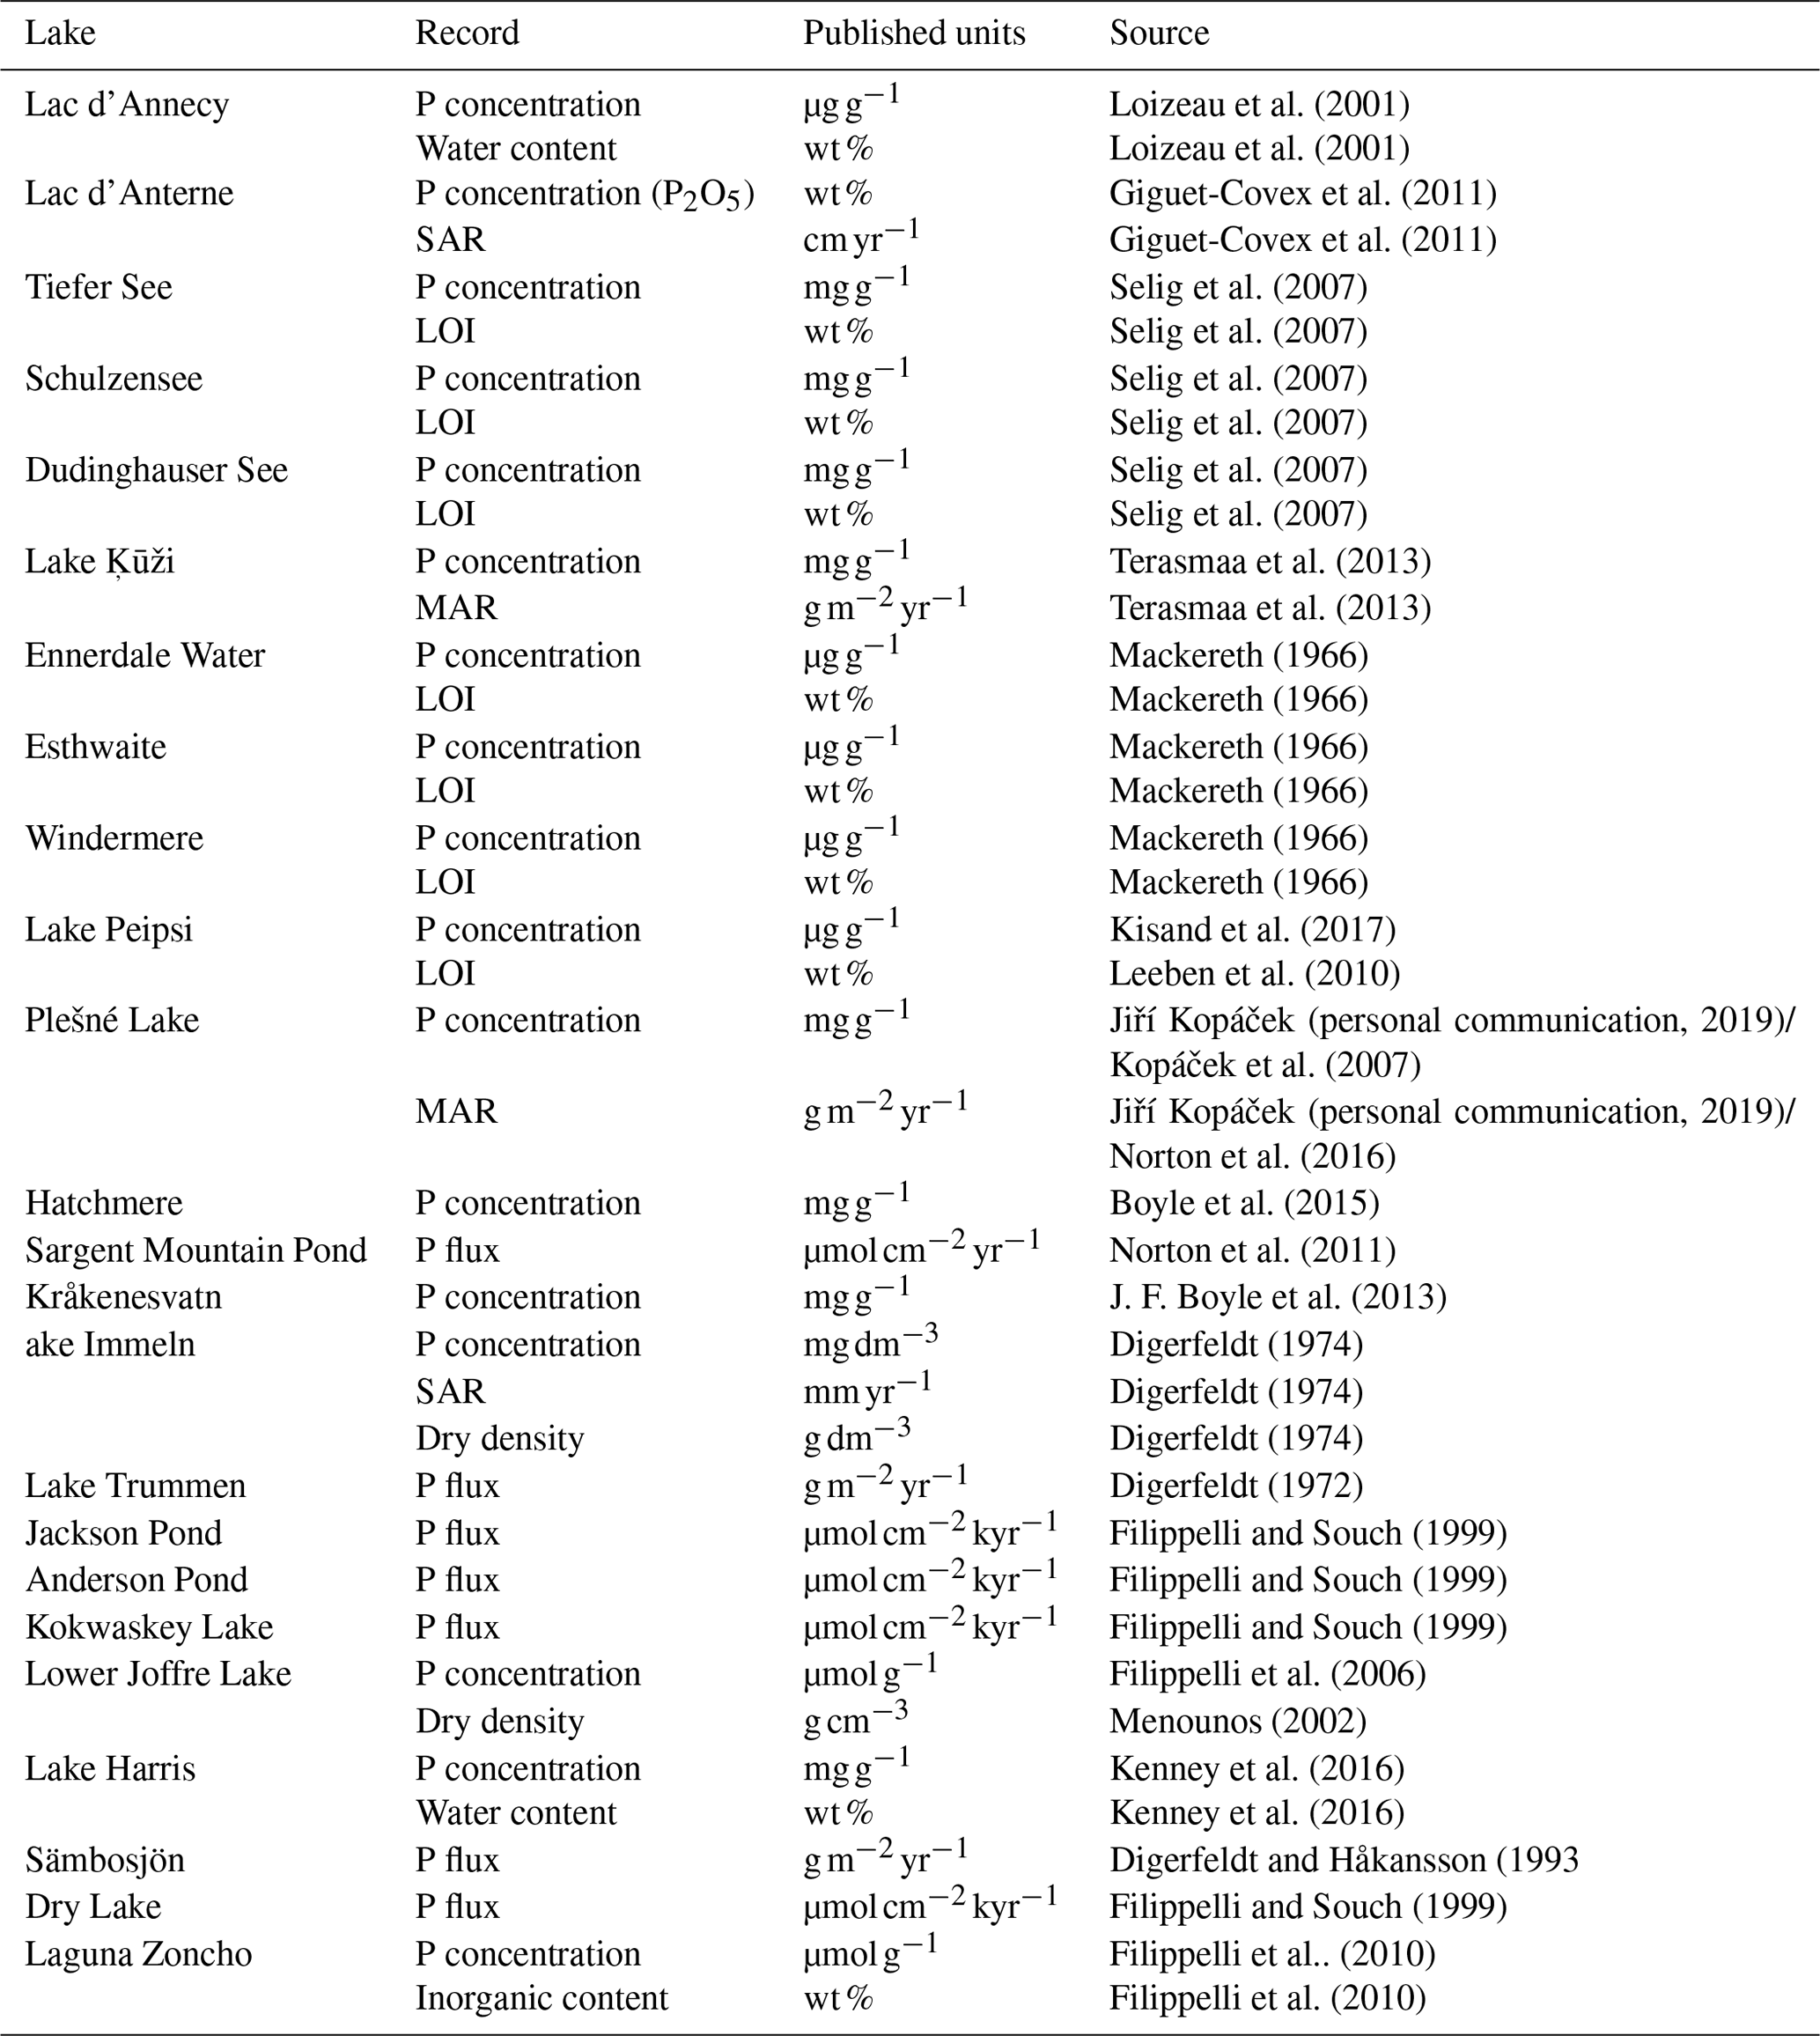
Table B3The rbacon (Blaauw and Christen, 2011) settings for cores where new age models were developed.
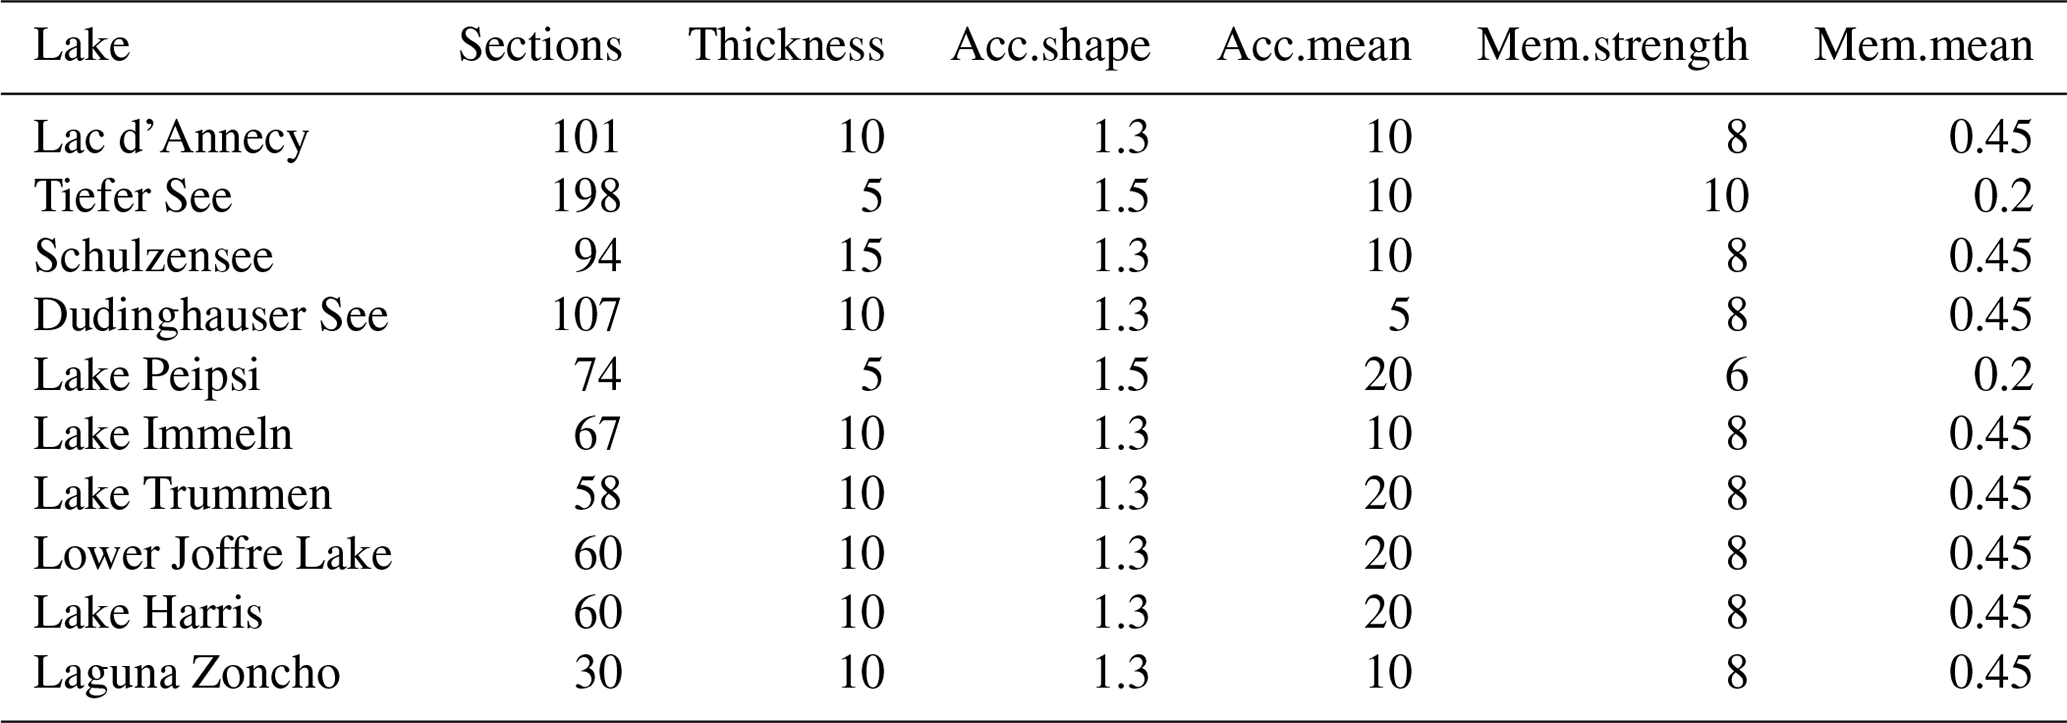
Table B4Site data are from the sources listed in Table B1. The population density data are approximations derived by summing the present-day population totals for settlements within the catchment.
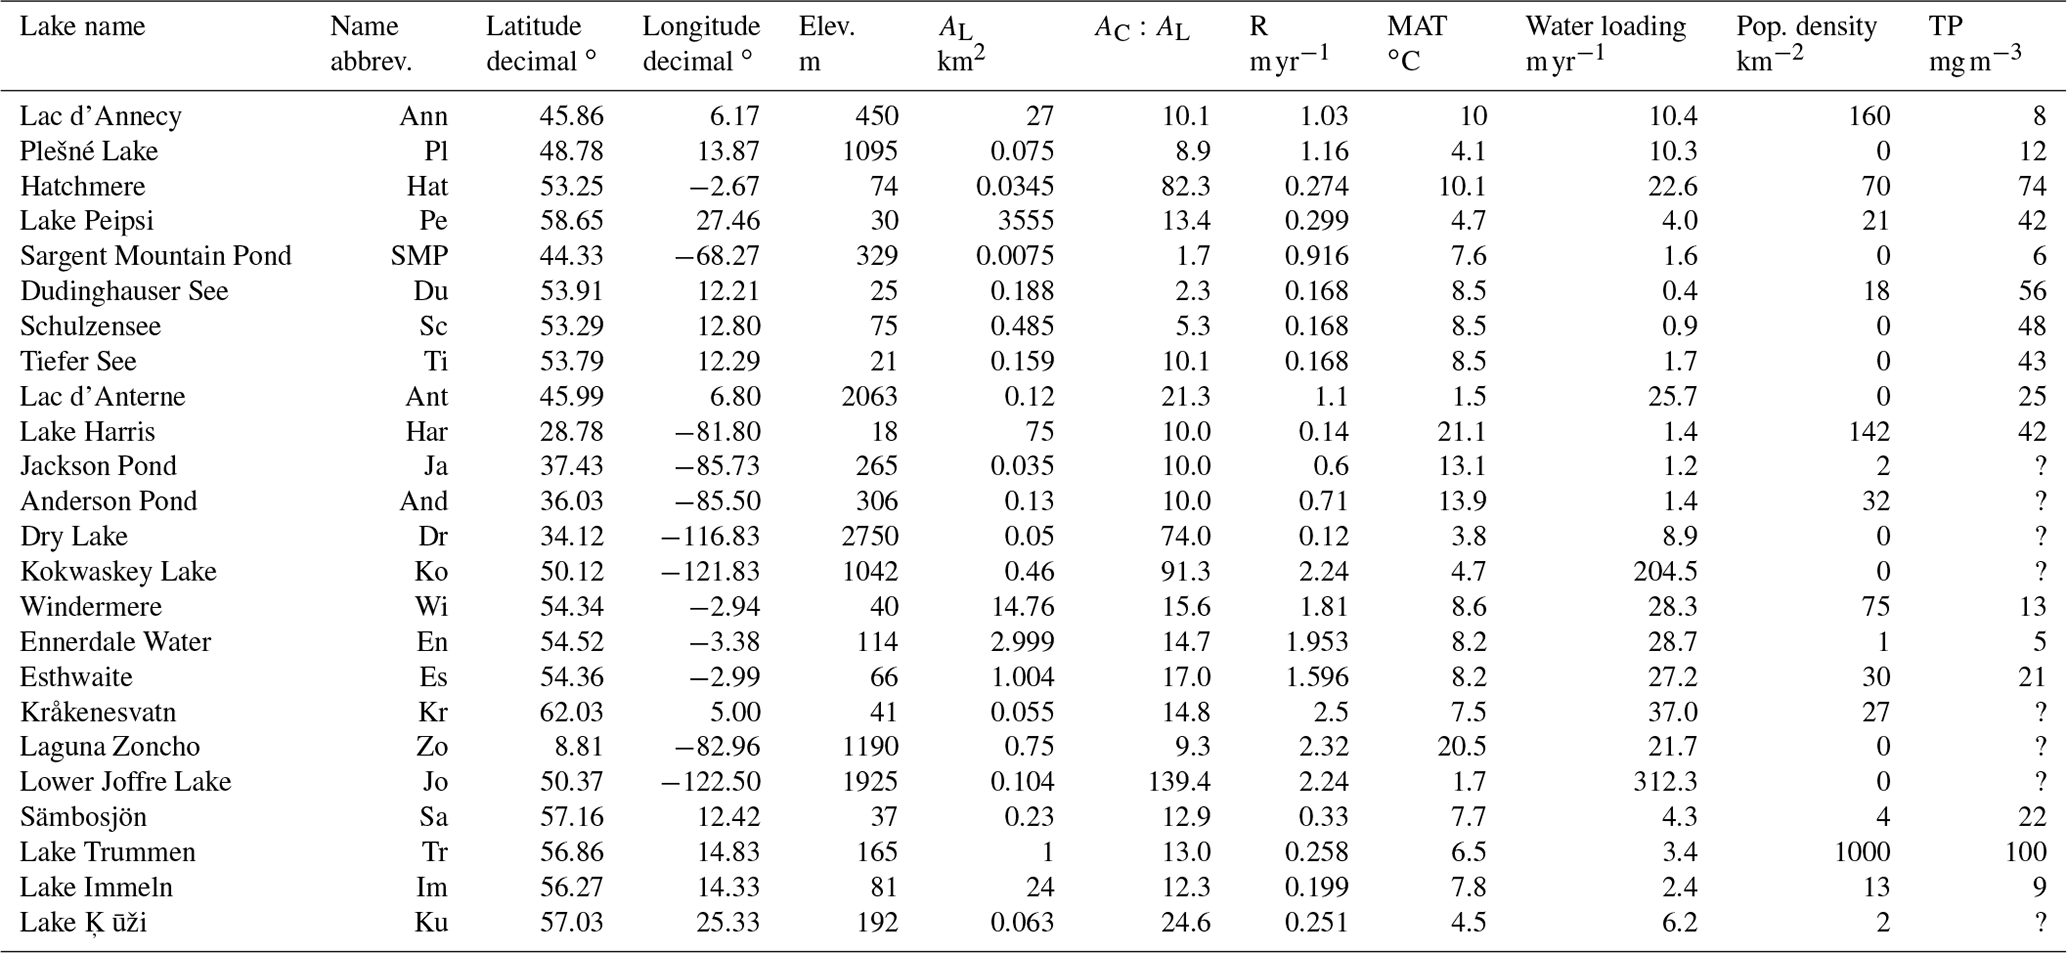
Table B5Recent TP data for comparison with model-inferred TP.
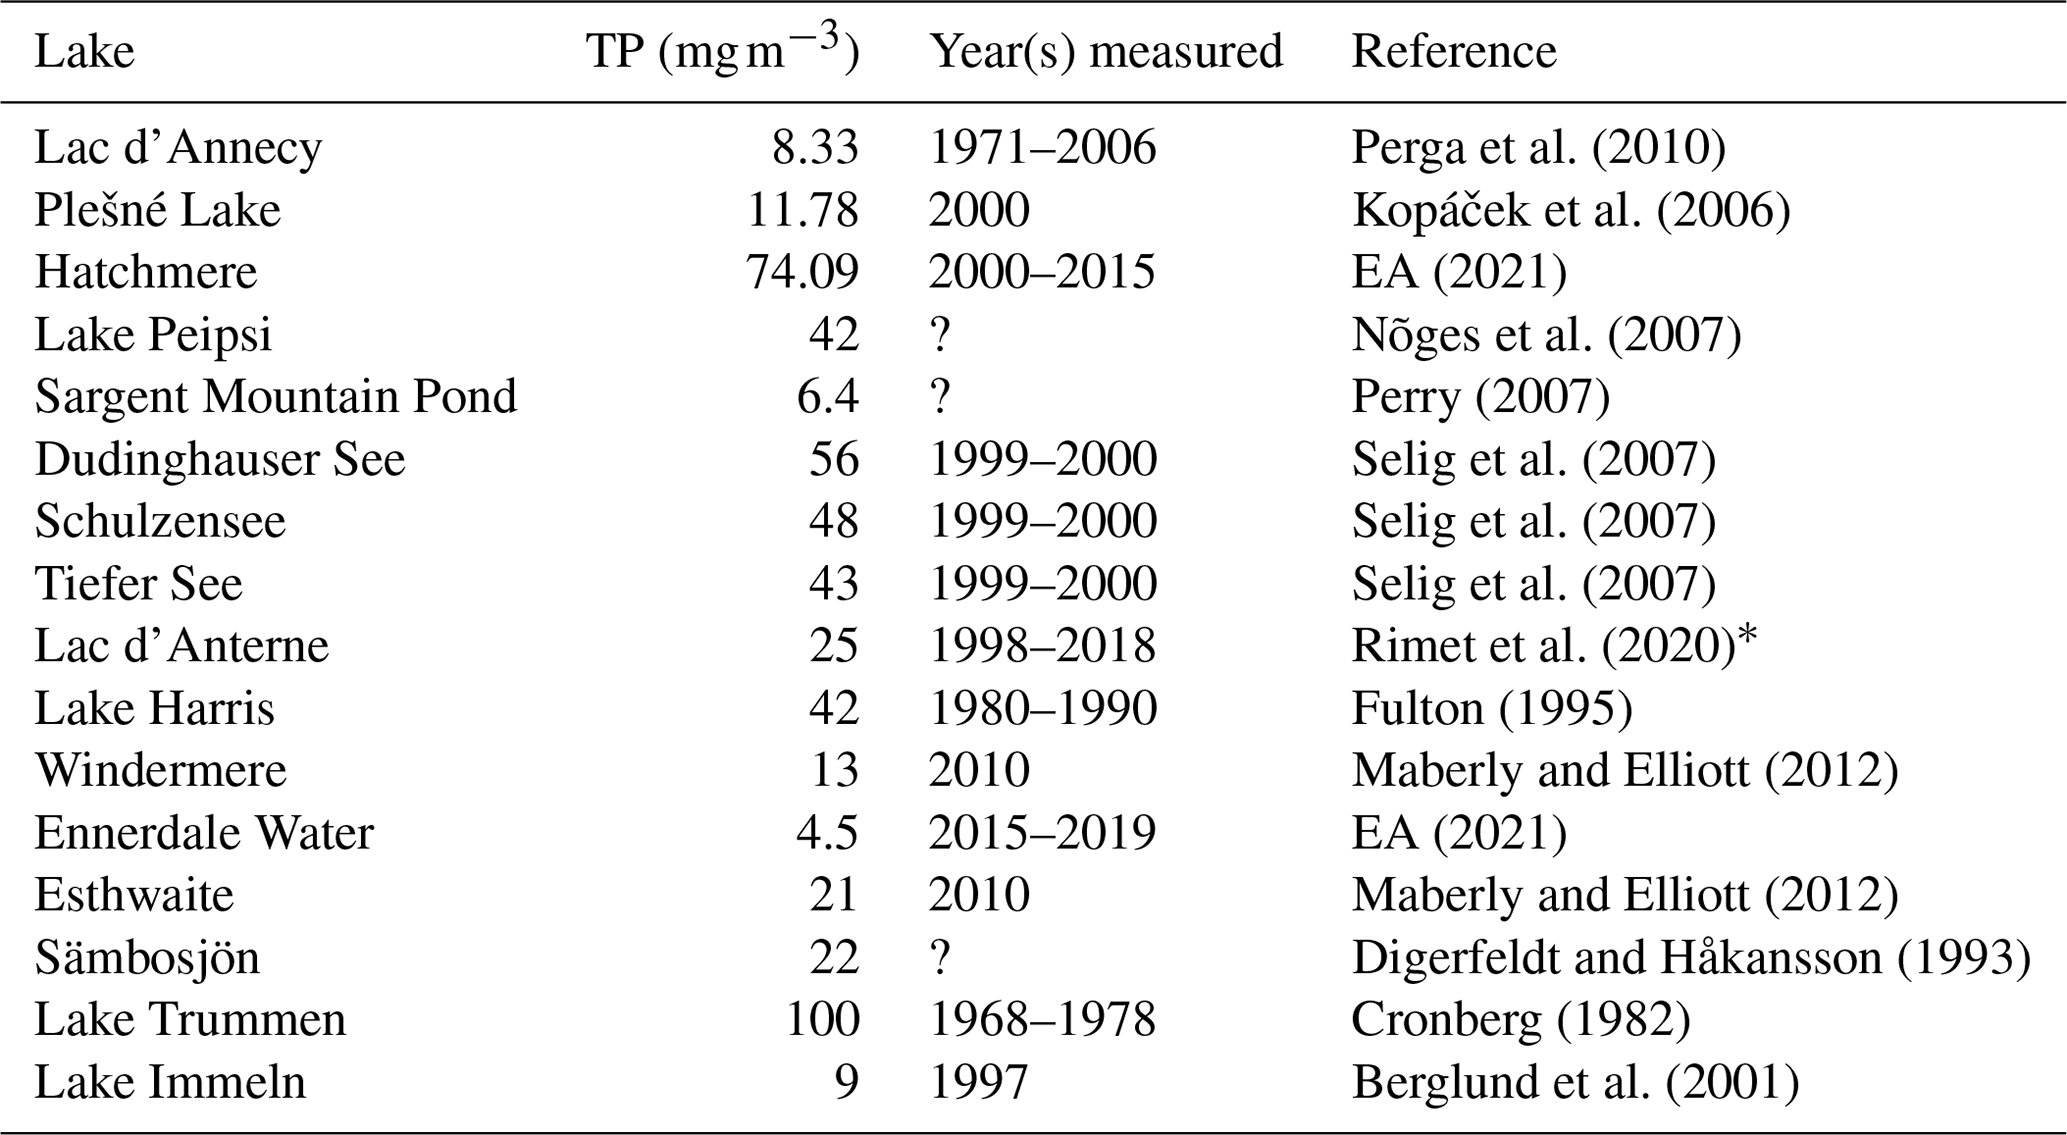
∗ Data from sampling point 1, corresponding to the deepest and pelagic part of the lake. Data were collected twice a month, except for the winter period, for which sampling is performed once a month (©OLA-IS, AnaEE-France, INRAE of Thonon-les-Bains, Asters, GIS LACS SENTINELLES, https://doi.org/10.4081/jlimnol.2020.1944).
Data output for this study is available at Data Catalogue: https://doi.org/10.17638/datacat.liverpool.ac.uk/1272 (Moyle et al., 2021).
The study was conceptualized by all authors. MM led the data collection and processing, model application, and statistical analysis with input from JB. MM produced the plots, and RC produced the map. The first version of the manuscript was written by MM and JB with further improvements and additions by RC.
The authors declare that they have no conflict of interest.
Publisher's note: Copernicus Publications remains neutral with regard to jurisdictional claims in published maps and institutional affiliations.
The raw sediment data for Lake Plešné were kindly provided by Jiří Kopáček and Josef Veselý. We would like to thank the two reviewers, Richard Bindler and Gabriel Filippelli, and the associate editor, Sebastian Naeher, for their thoughtful comments and discussion. The work contained in this paper was conducted as part of MM's PhD research.
This research has been supported by the UK Research and Innovation, Natural Environment Research Council (grant no. NE/L002469/1) and Natural England (grant no. NE/L00246nn9/1).
This paper was edited by Sebastian Naeher and reviewed by Richard Bindler and Gabriel Filippelli.
Amiotte Suchet, P. and Probst, J. L.: Modelling of atmospheric CO2 consumption by chemical weathering of rocks: Application to the Garonne, Congo and Amazon basins, Chem. Geol., 107, 205–210, https://doi.org/10.1016/0009-2541(93)90174-H, 1993.
Anderson, N. J., Rippey, B., and Gibson, C. E.: A comparison of sedimentary and diatom-inferred phosphorus profiles: implications for defining pre-disturbance nutrient conditions, Hydrobiologia, 253, 357–366, https://doi.org/10.1007/BF00050761, 1993.
Battarbee, R. W. and Bennion, H.: Using palaeolimnological and limnological data to reconstruct the recent history of European lake ecosystems: Introduction, Freshwater Biol., 57, 1979–1985, https://doi.org/10.1111/j.1365-2427.2012.02857.x, 2012.
Battarbee, R. W., Morley, D., Bennion, H., Simpson, G. L., Hughes, M., and Bauere, V.: A palaeolimnological meta-database for assessing the ecological status of lakes, J. Paleolimnol., 45, 405–414, https://doi.org/10.1007/s10933-010-9417-5, 2011.
Beales, P. W.: the Late Devensian and Flandrian Vegetational History of Crose Mere, Shropshire, New Phytol., 85, 133–161, https://doi.org/10.1111/j.1469-8137.1980.tb04454.x, 1980.
Bennion, H. and Simpson, G. L.: The use of diatom records to establish reference conditions for UK lakes subject to eutrophication, J. Paleolimnol., 45, 469–488, https://doi.org/10.1007/s10933-010-9422-8, 2011.
Bennion, H., Battarbee, R. W., Sayer, C. D., Simpson, G. L., and Davidson, T. A.: Defining reference conditions and restoration targets for lake ecosystems using palaeolimnology: a synthesis, J. Paleolimnol., 45, 533–544, https://doi.org/10.1007/s10933-010-9419-3, 2011.
Berglund, O., Larsson, P., Göran, E., and Okla, L.: The Effect of Lake Trophy on Lipid Content and PCB Concentrations in Planktonic Food Webs, Ecology, 82, 1078–1088, 2001.
Bird, B. W. and Kirby, M. E.: An alpine lacustrine record of early Holocene North American Monsoon dynamics from Dry Lake, southern California (USA), J. Paleolimnol., 35, 179–192, https://doi.org/10.1007/s10933-005-8514-3, 2006.
Bjerring, R., Bradshaw, E. G., Amsinck, S. L., Johansson, L. S., Odgaard, B. V., Nielsen, A. B., and Jeppesen, E.: Inferring recent changes in the ecological state of 21 Danish candidate reference lakes (EU Water Framework Directive) using palaeolimnology, J. Appl. Ecol., 45, 1566–1575, https://doi.org/10.1111/j.1365-2664.2008.01557.x, 2008.
Blaauw, M. and Christen, J. A.: Flexible paleoclimate age-depth models using an autoregressive gamma process, Bayesian Anal., 6, 457–474, https://doi.org/10.1214/11-BA618, 2011.
Bluth, G. J. S. and Kump, L. R.: Lithologic and climatologic controls of river chemistry, Geochim. Cosmochim. Ac., 58, 2341–2359, https://doi.org/10.1016/0016-7037(94)90015-9, 1994.
Boyle, J., Chiverrell, R., Plater, A., Thrasher, I., Bradshaw, E., Birks, H., and Birks, J.: Soil mineral depletion drives early Holocene lake acidification, Geology, 41, 415–418, https://doi.org/10.1130/G33907.1, 2013.
Boyle, J. F.: Loss of apatite caused irreversible early-Holocene lake acidification, Holocene, 17, 543–547, https://doi.org/10.1177/0959683607077046, 2007.
Boyle, J. F.: Climate and surface water acidity: Development and application of a generalized predictive model, Holocene, 18, 69–81, https://doi.org/10.1177/0959683607085597, 2008.
Boyle, J. F., Chiverrell, R. C., Norton, S. A., and Plater, A. J.: A leaky model of long-term soil phosphorus dynamics, Global Biogeochem. Cy., 27, 516–525, https://doi.org/10.1002/gbc.20054, 2013.
Boyle, J. F., Chiverrell, R. C., Davies, H., and Alderson, D. M.: An approach to modelling the impact of prehistoric farming on Holocene landscape phosphorus dynamics, Holocene, 25, 203–214, https://doi.org/10.1177/0959683614556381, 2015.
Bradshaw, E. G., Nielsen, A. B., and Anderson, N. J.: Using diatoms to assess the impacts of prehistoric, pre-industrial and modern land-use on Danish lakes, Reg. Environ. Change, 6, 17–24, https://doi.org/10.1007/s10113-005-0007-4, 2006.
Brauer, A. and Casanova, J.: Chronology and depositional processes of the laminated sediment record from Lac d'Annecy, French Alps, J. Paleolimnol., 25, 163–177, https://doi.org/10.1023/A:1008136029735, 2001.
Bronk Ramsey, C., Albert, P. G., Blockley, S. P. E., Hardiman, M., Housley, R. A., Lane, C. S., Lee, S., Matthews, I. P., Smith, V. C., and Lowe, J. J.: Improved age estimates for key Late Quaternary European tephra horizons in the RESET lattice, Quaternary Sci. Rev., 118, 18–32, https://doi.org/10.1016/j.quascirev.2014.11.007, 2015.
Brooks, S. J., Bennion, H., and Birks, H. J. B.: Tracing lake trophic history with a chironomid-total phosphorus inference model, Freshwater Biol., 46, 513–533, https://doi.org/10.1046/j.1365-2427.2001.00684.x, 2001.
Cardoso, A. C., Solimini, A., Premazzi, G., Carvalho, L., Lyche, A., and Rekolainen, S.: Phosphorus reference concentrations in European lakes, Hydrobiologia, 584, 3–12, https://doi.org/10.1007/s10750-007-0584-y, 2007.
Chapra, S. C. and Dolan, D. M.: Great Lakes total phosphorus revisited: 2. Mass balance modeling, J. Great Lakes Res., 38, 741–754, https://doi.org/10.1016/j.jglr.2012.10.002, 2012.
Clement, R. M. and Horn, S. P.: Pre-Columbian land-use history in Costa Rica: A 3000 year record of forest clearance, agriculture and fires from Laguna Zoncho, Holocene, 11, 419–426, https://doi.org/10.1191/095968301678302850, 2001.
Climate-data.org: available at: https://en.climate-data.org/ (last access: 31 March 2021), 2021.
Collantes, F.: Farewell to the peasant republic: marginal rural communities and European industrialisation, 1815–1990, Agr. Hist. Rev., 54, 257–273, available at: http://www.jstor.org/stable/40276199 (last access: 11 April 2021), 2006.
Cronberg, G.: Phytoplankton changes in Lake Trummen included by restoration, Folia Limnologica Scandinavica, 18, 1–176, 1982.
Danek, L., Barnard, T., and Tomlinson, M.: Bathymetry and Sediment Thickness Analysis of Seven Lakes in the Upper Ocklawaha River Basin. Final Report 90-170-0400, St. Johns River Water Management District, Palatka, FL, USA, 1991.
Davies, J. A. C., Tipping, E., and Whitmore, A. P.: 150 years of macronutrient change in unfertilized UK ecosystems: Observations vs simulations, Sci. Total Environ., 572, 1485–1495, https://doi.org/10.1016/j.scitotenv.2016.03.055, 2016.
Davis, M. B. and Ford, M. S. (Jesse): Sediment focusing in Mirror Lake, New Hampshire, Limnol. Oceanogr., 27, 137–150, https://doi.org/10.4319/lo.1982.27.1.0137, 1982.
Dearing, J. A., Battarbee, R. W., Dikau, R., Larocque, I., and Oldfield, F.: Human-environment interactions: Learning from the past, Reg. Environ. Change, 6, 1–16, https://doi.org/10.1007/s10113-005-0011-8, 2006.
Digerfeldt, G.: Post-Glacial development of Lake Trummen. regional vegetation history, water level changes and palaeolimnology, Folia Limnol. Scand., 16, 1–104, 1972.
Digerfeldt, G.: The post-glacial development of the ranviken bay in lake Immeln I. The history of the regional vegetation, and II. the water-level changes, GFF, 96, 3–32, https://doi.org/10.1080/11035897409454255, 1974.
Digerfeldt, G. and Håkansson, H.: The Holocene paleolimnology of Lake Sämbosjön, southwestern Sweden, J. Paleolimnol., 8, 189–210, https://doi.org/10.1007/BF00177856, 1993.
Donnelly, D., Helliwell, R. C., May, L., and McCreadie, B.: An assessment of the performance of the plus+ tool in supporting the evaluation of water framework directive compliance in scottish standing waters, Int. J. Env. Res. Pub. He., 17, 391, https://doi.org/10.3390/ijerph17020391, 2020.
Dreßler, M., Selig, U., Dörfler, W., Adler, S., Schubert, H., and Hübener, T.: Environmental changes and the Migration Period in northern Germany as reflected in the sediments of Lake Dudinghausen, Quaternary Res., 66, 25–37, https://doi.org/10.1016/j.yqres.2006.02.007, 2006.
EA (UK Environment Agency): available at: https://environment.data.gov.uk/water-quality/view/landing (last access: 31 March 2012), UK Environment Agency, 2021.
Edmondson, W. T.: The Sedimentary Record of the Eutrophication of Lake Washington, P. Natl. Acad. Sci. USA, 71, 5093–5095, https://doi.org/10.1073/pnas.71.12.5093, 1974.
Engstrom, D. R. and Wright, H. E.: Chemical stratigraphy of lake sediments as a record of environmental change, in: Lake Sediments and Environmental History, edited by: Haworth, E. Y. and Lund, J. W. G., Leicester University Press, Leicester, pp. 11–67, 1984.
Engstrom, D. R., Fritz, S. C., Almendinger, J. E., and Juggins, S.: Chemical and biological trends during lake evolution in recently deglaciated terrain, Nature, 408, 161–166, https://doi.org/10.1038/35041500, 2000.
European Commission: Directive 2000/60/EC of the European Parliament and of the Council of 23 October 2000 establishing a framework for community action in the field of water policy, Off. J. Eur. Communities, L327, 1–72, 2000.
Filippelli, G. M. and Souch, C.: Effects of climate and landscape development on the terrestrial phosphorus cycle, Geology, 27, 171–174, https://doi.org/10.1130/0091-7613(1999)027<0171:EOCALD>2.3.CO;2, 1999.
Filippelli, G. M., Souch, C., Menounos, B., Slater-Atwater, S., Timothy Jull, A. J., and Slaymaker, O.: Alpine lake sediment records of the impact of glaciation and climate change on the biogeochemical cycling of soil nutrients, Quaternary Res., 66, 158–166, https://doi.org/10.1016/j.yqres.2006.03.009, 2006.
Filippelli, G. M., Souch, C., Horn, S. P., and Newkirk, D.: The pre-Colombian footprint on terrestrial nutrient cycling in Costa Rica: insights from phosphorus in a lake sediment record, J. Paleolimnol., 43, 843–856, https://doi.org/10.1007/s10933-009-9372-1, 2010.
Fulton, R. S: External nutrient budget and trophic state modeling for lakes in the Upper Ocklawaha River Basin, Palatka, Florida, 1995.
Giguet-Covex, C., Arnaud, F., Poulenard, J., Disnar, J. R., Delhon, C., Francus, P., David, F., Enters, D., Rey, P. J., and Delannoy, J. J.: Changes in erosion patterns during the holocene in a currently treeless subalpine catchment inferred from lake sediment geochemistry (lake anterne, 2063 , NW french alps): The role of climate and human activities, Holocene, 21, 651–665, https://doi.org/10.1177/0959683610391320, 2011.
Ginn, B. K., Rühland, K. M., Young, J. D., Hawryshyn, J., Quinlan, R., Dillon, P. J., and Smol, J. P.: The perils of using sedimentary phosphorus concentrations for inferring long-term changes in lake nutrient levels: Comments on Hiriart-Baer et al., 2011, J. Great Lakes Res., 38, 825–829, https://doi.org/10.1016/j.jglr.2012.09.002, 2012.
Grove, J. M.: The Little Ice Age, Methuen, London, 1988.
Hall, R. I. and Smol, J. P.: Diatoms as indicators of lake eutrophication, in: The Diatoms, edited by: Smol, J. P. and Stoermer, E. F., Cambridge University Press, Cambridge, pp. 122–151, 2010.
Hawkings, J., Wadham, J., Tranter, M., Telling, J., Bagshaw, E., Beaton, A., Simmons, S.-L., Chandler, D., Tedstone, A., and Nienow, P.: The Greenland Ice Sheet as a hot spot ofphosphorus weathering and export in the Arctic, Global Biogeochem. Cy., 30, 191–210, https://doi.org/10.1111/1462-2920.13280, 2016.
Heinsalu, A., Alliksaar, T., Leeben, A., and Nõges, T.: Sediment diatom assemblages and composition of pore-water dissolved organic matter reflect recent eutrophication history of Lake Peipsi (Estonia/Russia), Hydrobiologia, 584, 133–143, https://doi.org/10.1007/s10750-007-8615-2, 2007.
Hübener, T., Adler, S., Werner, P., Schwarz, A., and Dreßler, M.: Identifying reference conditions for dimictic north German lowland lakes: implications from paleoecological studies for implementing the EU-Water Framework Directive, Hydrobiologia, 742, 295–312, https://doi.org/10.1007/s10750-014-1992-4, 2015.
Jilbert, T., Jokinen, S., Saarinen, T., Mattus-Kumpunen, U., Simojoki, A., Saarni, S., Salminen, S., Niemistö, J., and Horppila, J.: Impacts of a deep reactive layer on sedimentary phosphorus dynamics in a boreal lake recovering from eutrophication, Hydrobiologia, 84, 4401–4423, https://doi.org/10.1007/s10750-020-04289-9, 2020.
Juggins, S., Anderson, N. J., Hobbs, J. M. R., and Heathcote, A. J.: Reconstructing epilimnetic total phosphorus using diatoms: Statistical and ecological constraints, J. Paleolimnol., 49, 373–390, https://doi.org/10.1007/s10933-013-9678-x, 2013.
Kenney, W. F., Brenner, M., Curtis, J. H., Arnold, T. E., and Schelske, C. L.: A holocene sediment record of phosphorus accumulation in shallow Lake Harris, Florida (USA) offers new perspectives on recent cultural eutrophication, PLoS One, 11, https://doi.org/10.1371/journal.pone.0147331, 2016.
Kim, D. K., Kaluskar, S., Mugalingam, S., Blukacz-Richards, A., Long, T., Morley, A., and Arhonditsis, G. B.: A Bayesian approach for estimating phosphorus export and delivery rates with the SPAtially Referenced Regression On Watershed attributes (SPARROW) model, Ecol. Inform., 37, 77–91, https://doi.org/10.1016/j.ecoinf.2016.12.003, 2017.
Kirchner, W. B. and Dillon, P. J.: An Empirical Method of Estimating the Retention of Phosphorus in Lakes, Water Resour. Res., 11, 182–183, 1975.
Kisand, A., Kirsi, A. L., Ehapalu, K., Alliksaar, T., Heinsalu, A., Tõnno, I., Leeben, A., and Nõges, P.: Development of large shallow Lake Peipsi (North-Eastern Europe) over the Holocene based on the stratigraphy of phosphorus fractions, J. Paleolimnol., 58, 43–56, https://doi.org/10.1007/s10933-017-9954-2, 2017.
Kopáček, J., Brzáková, M., Hejzlar, J., Nedoma, J., Porcal, P., and Vrba, J.: Nutrient cycling in a strongly acidified mesotrophic lake, Limnol. Oceanogr., 49, 1202–1213, https://doi.org/10.4319/lo.2004.49.4.1202, 2004.
Kopáček, J., Turek, J., Hejzlar, J., Kaňa, J., and Porcal, P.: Element fluxes in watershed-lake ecosystems recovering from acidification: Plešné Lake, the Bohemian Forest, 2001—2005, Biologica, 61/Supl. 20, S427—S440, https://doi.org/10.2478/s11756-007-0067-7, 2006.
Kopáček, J., Marešová, M., Hejzlar, J., and Norton, S. A.: Natural inactivation of phosphorus by aluminum in preindustrial lake sediments, Limnol. Oceanogr., 52, 1147–1155, https://doi.org/10.4319/lo.2007.52.3.1147, 2007.
Leeben, A., Heinsalu, A., Alliksaar, T., and Vassiljev, J.: High-resolution spectroscopic study of pore-water dissolved organic matter in Holocene sediments of Lake Peipsi (Estonia/Russia), Hydrobiologia, 646, 21–31, https://doi.org/10.1007/s10750-010-0174-2, 2010.
Lehman, J. T.: Reconstructing the rate of accumulation of lake sediment: The effect of sediment focusing, Quaternary Res., 5, 541–550, https://doi.org/10.1016/0033-5894(75)90015-0, 1975.
Likens, G. and Davis, M.: Post-glacial history of Mirror Lake and its watershed in New Hampshire: an initial report, Verhandlungen Internationale Vereinigung Limnologie, 19, 982–993, 1975.
Liu, Y., Andersen, J. J., Williams, J. W., and Jackson, S. T.: Vegetation history in central Kentucky and Tennessee (USA) during the last glacial and deglacial periods, Quaternary Res., 79, 189–198, https://doi.org/10.1016/j.yqres.2012.12.005, 2013.
Livingstone, D. A. and Boykin, J. C.: Vertical Distribution of Phosphorus in Linsley Pond Mud, Limnol. Oceanogr., 7, 52–62, https://doi.org/10.4319/lo.1962.7.1.0057, 1962.
Loizeau, J. L., Span, D., Coppee, V., and Dominik, J.: Evolution of the trophic state of Lake Annecy (eastern France) since the last glaciation as indicated by iron, manganese and phosphorus speciation, J. Paleolimnol., 25, 205–214, https://doi.org/10.1023/A:1008100432461, 2001.
Maberly, S. C. and Elliott, J. A.: Insights from long-term studies in the Windermere catchment: External stressors, internal interactions and the structure and function of lake ecosystems, Freshwater Biol., 57, 233–243, https://doi.org/10.1111/j.1365-2427.2011.02718.x, 2012.
Mackereth, F. J. H.: Some Chemical Observations on Post-Glacial Lake Sediments, Philos. T. R. Soc. B, 250, 165–213, https://doi.org/10.1098/rstb.1966.0001, 1966.
Menounos, B.: Climate, fine-sediment transport linkages, Coast Mountains, British Columbia, Canada, PhD thesis, University of British Columbia, Canada, https://doi.org/10.14288/1.0090450, 2002.
Menounos, B., Osborn, G., Clague, J. J., and Luckman, B. H.: Latest Pleistocene and Holocene glacier fluctuations in western Canada, Quaternary Sci. Rev., 28, 2049–2074, https://doi.org/10.1016/j.quascirev.2008.10.018, 2009.
Moyle, M. and Boyle, J. F.: A method for reconstructing past lake water phosphorus concentrations using sediment geochemical records, J. Paleolimnol., 65, 461–478, https://doi.org/10.1007/s10933-021-00174-0, 2021.
Moyle, M., Boyle, J., and Chiverrell, R.: Holocene records of Sediment Inferred [lake water] Total Phosphorus concentration (SI-TP) and landscape phosphorus yield, Data Catalogue [data set], https://doi.org/10.17638/datacat.liverpool.ac.uk/1272, 2021.
NRFA (UK National River Flow Archive): available at: https://nrfa.ceh.ac.uk/ (last access: 31 March 2021), UK National River Flow Archive, 2021.
Nõges, T., Järvet, A., Kisand, A., Laugaste, R., Loigu, E., Skakalski, B., and Nõges, P.: Reaction of large and shallow lakes Peipsi and Võrtsjärv to the changes of nutrient loading, Hydrobiologia, 584, 253–264, https://doi.org/10.1007/s10750-007-0603-z, 2007.
Norsk Klimaservicesenter: available at: https://klimaservicesenter.no/ (last access: 31 March 2021), 2021.
Norton, S. A., Perry, R. H., Saros, J. E., Jacobson, G. L., Fernandez, I. J., Kopáček, J., Wilson, T. A., and SanClements, M. D.: The controls on phosphorus availability in a Boreal lake ecosystem since deglaciation, J. Paleolimnol., 46, 107–122, https://doi.org/10.1007/s10933-011-9526-9, 2011.
Norton, S. A., Jacobson, G. L., Kopáček, J., and Navrátil, T.: A comparative study of long-term Hg and Pb sediment archives, Environ. Chem., 13, 517–527, https://doi.org/10.1071/EN15114, 2016.
Paytan, A. and McLaughlin, K.: The oceanic phosphorus cycle, Chem. Rev., 107, 563–576, https://doi.org/10.1021/cr0503613, 2007.
Perga, M. E., Desmet, M., Enters, D., and Reyss, J. L.: A century of bottom-up- and top-down-driven changes on a lake planktonic food web: A paleoecological and paleoisotopic study of Lake Annecy, France, Limnol. Oceanogr., 55, 803–816, https://doi.org/10.4319/lo.2010.55.2.0803, 2010.
Perga, M. E., Frossard, V., Jenny, J. P., Alric, B., Arnaud, F., Berthon, V., Black, J. L., Domaizon, I., Giguet-Covex, C., Kirkham, A., Magny, M., Manca, M., Marchetto, A., Millet, L., Paillès, C., Pignol, C., Poulenard, J., Reyss, J. L., Rimet, F., Sabatier, P., Savichtcheva, O., Sylvestre, F., and Verneaux, V.: High-resolution paleolimnology opens new management perspectives for lakes adaptation to climate warming, Front. Ecol. Evol., 3, 1–17, https://doi.org/10.3389/fevo.2015.00072, 2015.
Perry, R.: Post-Glacial Chemical Weathering and Landscape Development at Sargent Pond, Maine, USA: a multiscale investigation, University of Maine, Orono, 2007.
Poikane, S.: Water Framework Directive intercalibration technical report. Part 2: Lakes, European Commission, Luxembourg, 2009.
Poikane, S., Birk, S., Böhmer, J., Carvalho, L., De Hoyos, C., Gassner, H., Hellsten, S., Kelly, M., Lyche Solheim, A., Olin, M., Pall, K., Phillips, G., Portielje, R., Ritterbusch, D., Sandin, L., Schartau, A. K., Solimini, A. G., Van Den Berg, M., Wolfram, G., and Van De Bund, W.: A hitchhiker's guide to European lake ecological assessment and intercalibration, Ecol. Indic., 52, 533–544, https://doi.org/10.1016/j.ecolind.2015.01.005, 2015.
R Core Team: R: A Language and Environment for Statistical Computing, available at: https://www.r-project.org/ (last access: 7 January 2021), 2020.
Ramsbottom, A. E.: Depth charts of the Cumbrian lakes, Freshwater Biol. Assoc. Sci. Publ., 33, 39 pp., 1976.
Rimet, F., Anneville, O., Barbet, D., Chardon, C., Crépin, L., Domaizon, I., Dorioz, J. M., Espinat, L., Frossard, V., Guillard, J., Goulon, C., Hamelet, V., Hustache, J. C., Jacquet, S., Lainé, L., Montuelle, B., Perney, P., Quetin, P., Rasconi, S., Schellenberger, A., Tran-Khac, V., and Monet, G.: The Observatory on LAkes (OLA) database: Sixty years of environmental data accessible to the public, J. Limnol., 79, 164–178, https://doi.org/10.4081/jlimnol.2020.1944, 2020.
Roberts, H. M., Muhs, D. R., and Bettis III, E. A.: Loess Records: North America, in: Encyclopedia of Quaternary Sciences, edited by: Elias, S., Elsevier, Oxford, pp. 1456–1466, 2007.
Schwarz, A.: Rekonstruktion der Entwicklung des Schulzensees und des Tiefen Sees (Mecklenburg-Vorpommern) seit dem Spätglazial mittels Diatomeenanalyse unter besonderer Berücksichtigung der Trophiegeschichte. 2006, Ernst-Moritz-Arndt-Univ., Greifswald, Univ., Math.-Naturwiss. Fak. Zugl.: Rostock, https://doi.org/10.23689/fidgeo-1966, 2006.
Selig, U., Leipe, T., and Dörfler, W.: Paleolimnological records of nutrient and metal profiles in prehistoric, historic and modern sediments of three lakes in North-eastern Germany, Water Air Soil Poll., 184, 183–194, https://doi.org/10.1007/s11270-007-9407-z, 2007.
seNorge: available at: http://www.senorge.no/?p=klima (last access: 31 March 2021), seNorge (a collaboration between The Norwegian Water Resources and Energy Directorate, The Norwegian Meteorological Institute, and The Norwegian Mapping Authority), 2021.
Sesiano, J.: Monographie physique des plans d'eau naturels du département de la Haute-Savoie, France, Université de Genèvre, Département de minéralogie, Genèvre, 1993.
Sharples, J., Middelburg, J. J., Fennel, K., and Jickells, T. D.: What proportion of riverine nutrients reaches the open ocean?, Global Biogeochem. Cy., 31, 39–58, https://doi.org/10.1002/2016GB005483, 2017.
Smith, V. H.: Eutrophication of freshwater and coastal marine ecosystems: A global problem, Environ. Sci. Pollut. R., 10, 126–139, https://doi.org/10.1065/espr2002.12.142, 2003.
Souch, C.: Reconstructing Past Watershed and Ecosystem Development in the Coast Mountains, British Columbia, Canada, in: WorldMinds: Geographical Perspectives on 100 Problems: Commemorating the 100th Anniversary of the Association of American Geographers 1904–2004, edited by: Janelle, D. G., Warf, B., and Hansen, K., Springer Netherlands, Dordrecht, pp. 497–501, 2004.
Stålnacke, P., Grimvall, A., and Sundblad, K.: Estimation of Riverine Loads of Nitrogen and Phosphorus to the Baltic Sea, Environ. Monit. Assess., 1, 173–200, https://doi.org/10.1023/A:1006073015871, 1998.
SMHI (Swedish Meteorological and Hydrological Institute): Sjöareal och sjöhöjd, available at: https://www.smhi.se/polopoly_fs/1.35254!/Sj%C3%B6areal%202012_2.pdf (last access: 31 March 2021), Swedish Meteorological and Hydrological Institute, 2013.
Stumm, W. and Morgan, J.: Aquatic Chemistry: Chemical Equilibria and Rates in Natural Waters, 4th edn., Wiley-Interscience, 1995.
Terasmaa, J., Puusepp, L., Marzecová, A., Vandel, E., Vaasma, T., and Koff, T.: Natural and human-induced environmental changes in Eastern Europe during the Holocene: A multi-proxy palaeolimnological study of a small Latvian lake in a humid temperate zone, J. Paleolimnol., 49, 663–678, https://doi.org/10.1007/s10933-013-9683-0, 2013.
Turc, L.: Turc, L.: Le bilan d'eau des sols: Relations entre les precipitations l'évaporation et l'écoulement, Annales Agronomiques, 5, 491–595, 1954.
U.S. Geological Survey: National Water Information System data available on the World Wide Web (USGS Water Data for the Nation), available at: http://waterdata.usgs.gov/nwis/ (last access: 3 May 2020), 2020.
Vollenweider, R. A.: Input-output models – With special reference to the phosphorus loading concept in limnology, Schweiz. Z. Hydrol., 37, 53–84, https://doi.org/10.1007/BF02505178, 1975.
Walker, M., Head, M. J., Berkelhammer, M., Björck, S., Cheng, H., Cwynar, L., Fisher, D., Gkinis, V., Long, A., Lowe, J., Newnham, R., Rasmussen, S. O., and Weiss, H.: Formal ratification of the subdivision of the Holocene Series/Epoch (Quaternary System/Period): Two new Global Boundary Stratotype Sections and Points (GSSPs) and three new stages/ subseries, Episodes, 41, 213–223, https://doi.org/10.18814/epiiugs/2018/018016, 2018.
Walker, T. W. and Syers, J. K.: The fate of phosphorus during pedogenesis, Geoderma, 15, 1–19, https://doi.org/10.1016/0016-7061(76)90066-5, 1976.
Withers, P. J. A. and Jarvie, H. P.: Delivery and cycling of phosphorus in rivers: A review, Sci. Total Environ., 400, 379–395, https://doi.org/10.1016/j.scitotenv.2008.08.002, 2008.
World lake Database: available at: http://wldb.ilec.or.jp/ (last access: 31 March 2021), 2021.