the Creative Commons Attribution 4.0 License.
the Creative Commons Attribution 4.0 License.
 | 21 Oct 2021
Evaluation of denitrification and decomposition from three biogeochemical models using laboratory measurements of N2, N2O and CO2
Reinhard Well
Rene Dechow
Jan Reent Köster
Mohammad Ibrahim Khalil
Simone Merl
Andreas Rode
Bianca Ziehmer
Amanda Matson
Hongxing He
Biogeochemical models are essential for the prediction and management of nitrogen (N) cycling in agroecosystems, but the accuracy of the denitrification and decomposition sub-modules is critical. Current models were developed before suitable soil N2 flux data were available, which may have led to inaccuracies in how denitrification was described. New measurement techniques, using gas chromatography and isotope-ratio mass spectrometry (IRMS), have enabled the collection of more robust N2, N2O and CO2 data. We incubated two arable soils – a silt-loam and a sand soil – for 34 and 58 d, respectively, with small field-relevant changes made to control factors during this period. For the silt-loam soil, seven treatments varying in moisture, bulk density and contents were included, with temperature changing during the incubation. The sandy soil was incubated with and without incorporation of litter (ryegrass), with temperature, water content and content changing during the incubation. The denitrification and decomposition sub-modules of DeNi, Coup and DNDC were tested using the data. No systematic calibration of the model parameters was conducted since our intention was to evaluate the general model structure or “default” model runs. Measured fluxes generally responded as expected to control factors. We assessed the direction of modeled responses to control factors using three categories: no response, a response in the same direction as measurements or a response in the opposite direction to measurements. DNDC responses were 14 %, 52 % and 34 %, respectively. Coup responses were 47 %, 19 % and 34 %, respectively. DeNi responses were 0 %, 67 % and 33 %, respectively. The magnitudes of the modeled fluxes were underestimated by Coup and DNDC and overestimated by DeNi for the sandy soil, while there was no general trend for the silt-loam soil. None of the models was able to determine litter-induced decomposition correctly. To conclude, the currently used sub-modules are not able to consistently simulate the denitrification and decomposition processes. For better model evaluation and development, we need to design better experiments, take more frequent measurements, use new or updated measurement techniques, address model complexity, add missing processes to the models, calibrate denitrifier microbial dynamics, and evaluate the anaerobic soil volume concept.
- Article
(1145 KB) - Full-text XML
-
Supplement
(886 KB) - BibTeX
- EndNote


Although our understanding of nitrous oxide (N2O) fluxes in agricultural ecosystems has increased in recent decades (Galloway et al., 2004; Singh, 2011; Zaehle, 2013), we still have a limited understanding of soil denitrification and the complex interaction of factors controlling it. Addressing this knowledge gap is crucial for mitigating N fertilizer loss as well as for predicting and reducing N2O emissions.
Denitrification is an anaerobic soil process by which microbes carry out the step-by-step reduction of nitrate () to nitric oxide (NO), N2O and finally dinitrogen (N2) (Groffman et al., 2006). The production and consumption of N2O via denitrification is affected by temperature (Rodrigo et al., 1997), O2 concentration (Müller and Clough, 2014), moisture (Grundmann and Rolston, 1987; Groffman and Tiedje, 1988), pH (Peterjohn, 1991; Simek and Hopkins, 1999; Simek and Cooper, 2002), and gas diffusivity of the soil (Leffelaar, 1988; Leffelaar and Wessel, 1988; Li et al., 1992; Del Grosso et al., 2000; Schurgers et al., 2006). Denitrification is also strongly dependent on substrate availability (N oxides and labile organic carbon) (Heinen, 2006; Groffman et al., 2009). Denitrification processes positively correlated with soluble carbon (Bijay-Singh et al., 1988; Burford and Bremner, 1975; Cantazaro and Beauchamp, 1985; McCarty and Bremner, 1993). The representation of organic matter as a source of electron donor in the root zone has a direct effect on the denitrification rate and indirectly also has an O2 concentration decreasing effect by elevating the microbial activity (Philippot et al., 2007). Field measurements of denitrification that explore the interactions between these factors are challenging, due to the methodological issues surrounding the measurement of N2 fluxes – high background N2 and low soil N2 flux (Groffman et al., 2006). However, the impact of these different factors on denitrification can be assessed with properly designed laboratory experiments (Butterbach-Bahl et al., 2013; Cardenas et al., 2003).
Models are an important tool to explore complex interactions and develop climate-smart strategies for agriculture (Butterbach-Bahl et al., 2013). Although numerous models which predict denitrification in varying environments and at different scales exist (Heinen, 2006), it has always been challenging to evaluate the accuracy of modeled denitrification due to the paucity of suitable measured data (Sgouridis et al., 2016, Scheer et al., 2020). While in many studies N2O emissions alone are used to develop and train models (Chen et al., 2008), measurements of both N2O and N2 fluxes are necessary to develop and test algorithms (Leffelaar and Wessel, 1988; Parton et al., 1996; Del Grosso et al., 2000). Simplified process descriptions, inaccurate model parameters and/or inadequately collected input data may result in poor predictions of N2 and N2O fluxes (Parton et al., 1996). While models are intended for use in the field, and ultimately the goal is for them to be accurate under field conditions, in order to describe processes accurately, it is often necessary to test and develop the sub-modules under controlled conditions, using targeted laboratory experiments (i.e., DNDC Scientific Basis and Processes, 2017). However, even targeted experiments often focus on large differences in control factors (Li et al., 1996; Jiang et al., 2021); in order to validate models and improve their accuracy with respect to denitrification, datasets of small, field-relevant changes in control factors are also necessary.
Three robust, well-used models for describing denitrification processes are Coup (Jansson and Moon, 2001), DNDC (Li et al., 1992) and DeNi (based on the approach of the NGAS and DailyDayCent models; Parton et al., 1996 and Del Grosso et al., 2000). These models were developed between 20 and 30 years ago and, with minor modifications, are still used today. DNDC has been extensively tested globally and has shown reasonable agreements between measured and modeled N2O emissions for many different ecosystems (e.g., Li, 2007; Kurbatova et al., 2009; Giltrap et al., 2010; Khalil et al., 2016; 2018; 2019). Within each of the three models, the denitrification sub-modules use different approaches to address the complexity of denitrification, including how they consider controlling factors (e.g., soil moisture, heat transfer, nitrification, decomposition, growth/death of the denitrifiers) as well as how they simulate temporal and spatial dynamics. However, to our knowledge evaluation of the denitrification sub-modules of these models was limited due to the lack of proper N2 datasets. There is a difficulty in measuring the N2 flux in the field, and the very few laboratory experiments (15N or He/O2 gas flux method) have so far been the only option to validate N2 fluxes and use the data for model evaluation. The development and/or testing of the NGAS and DailyDayCent models (Parton et al., 1996 and Del Grosso et al., 2000) used measured denitrification data based on the acetylene inhibition technique (Weier et al., 1993). This method is no longer considered suitable for quantifying soil denitrification (Bollmann and Conrad, 1997; Nadeem et al., 2013; Sgouridis et al., 2016). Therefore, it is questionable whether past evaluations of N2 flux modeling were valid. The lack of the proper N2 datasets, and new research not being integrated into existing models, has developed into an urgent need for focused model development using newly developed and/or more precise data collection techniques.
Table 1Physical and chemical data of surface soil from Hattorf (silt-loam soil, 0 to 10 cm depth) and Fuhrberg (sand, 5 to 20 cm depth), Germany.

Table 2Initial settings of laboratory incubations of soil from Fuhrberg (Sand) and Hattorf (silt-loam soil; treatments I to VII), Germany.
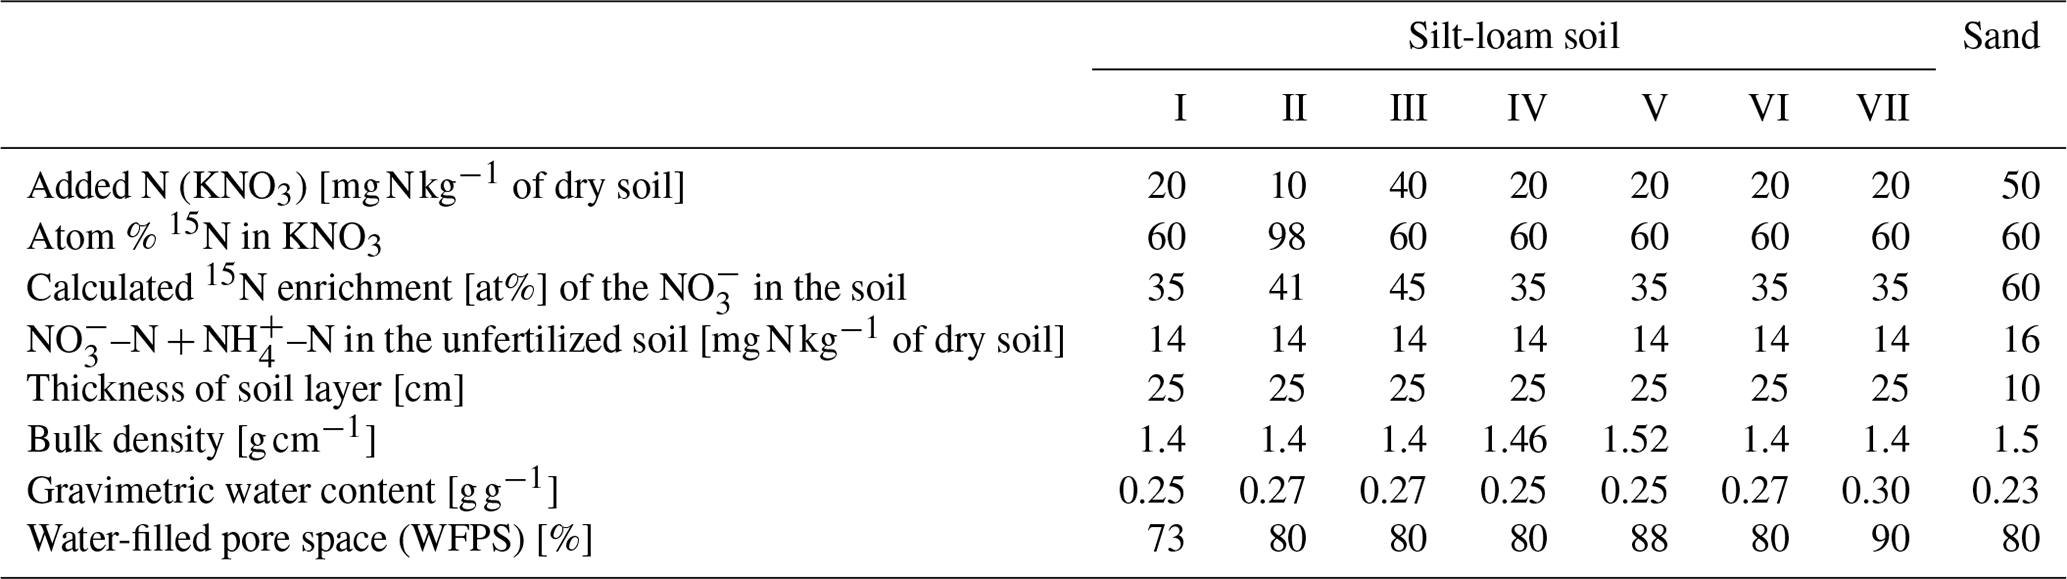
Table 3Average measured (average of the five measurement events for 34 d) and modeled (Coup, DeNi and DNDC models) N2, N2O () and CO2 () fluxes of seven incubation treatments for a silt-loam arable soil from Hattorf, Germany. Treatments include different levels of addition (10, 20 and 40 mg N kg−1), WFPS (73 %–90 %) and soil bulk density (1.4–1.52 g cm−3).

In this study we identify missing processes or limitations in the denitrification and decomposition sub-modules that interfere with process description. We use newly measured data to test the sub-modules of existing biogeochemical models under field-relevant ranges in control factors. No systematic calibration of the model parameters was conducted since our intention was to evaluate the general model structure or “default” model runs. Without calibration, we can compare the performance of the sub-modules with the same (factory) settings for the different experimental treatments. Specifically, our aims were to (i) compile and present unpublished N2, N2O and CO2 results from two laboratory incubations (Ziehmer, 2006; Merl, 2018); (ii) simulate denitrification and decomposition using the three models (Coup, DNDC, DeNi); (iii) compare the measured and modeled temporal dynamics; and (iv) make suggestions for model improvement.
2.1 Denitrification and decomposition data collection
2.1.1 Hattorf field site (silt-loam soil)
Soil samples were taken in October 2005 from an arable soil near Hattorf (hereafter referred to as the silt-loam soil), Lower Saxony, Germany, in the loess-covered Pöhlde basin near the Harz mountains (51∘39.35868′ N, 10∘14.71872′ E; 215 ). The site is in the transition zone of the cool continental/subarctic climate and warm-summer humid continental climate, where the mean annual temperature is between 7 and 8.5 ∘C and the average yearly precipitation is 700 mm. The cropping rotation of the site was winter rape–winter wheat–winter barley, and sampling was conducted when the vegetation was winter rape. The Haplic Luvisol (IUSS Working Group WRB, 2015) soil had a silt-loam texture with relatively low organic carbon content (Table 1). In the field, a 4 m2 area was marked out for sampling. In this area, plants (winter rape) were first removed, and then surface soil (0 to 10 cm depth) was collected with spades and shovels in large plastic boxes. Soil was returned to the lab, where it was sieved to 10 mm and homogenized; subsamples were sieved for 2 mm and analyzed for physical and chemical properties (Table 1); and the remaining field moist soil was stored at 4 ∘C until use.
2.1.2 Fuhrberg field site (sand soil)
Soil samples were taken in August 2016 from an arable soil near Fuhrberg (hereafter referred to as the sand soil), Lower Saxony, Germany (52∘33.17622′ N, 9∘50.85816′ E; 40 ). The site is in the transition zone of the temperate oceanic climate and warm-summer humid continental climate, where the mean annual temperature is 8.2 ∘C and the average yearly precipitation is 680 mm. Typical crops during the preceding decades were winter cereals, potatoes, sugar beet and maize. The soil is a Gleyic Podzol (IUSS Working Group WRB. 2015.) developed in glacifluvial sand (Böttcher et al., 1999; Well et al., 2005). The first 5 cm of soil contained incorporated winter wheat straw residuals. To avoid inaccuracy in the measurement of soil parameters (Table 1), this 5 cm layer was removed by hand in a 100 m2 area followed by the collection of soil from a depth of 5 to 20 cm. After field collection with spades and shovels, soil was transported to the lab, air dried, sieved to 10 mm, homogenized and stored in plastic boxes at 4 ∘C until use. The soil samples for the laboratory analyses were sieved to 2 mm.
2.1.3 Silt-loam laboratory incubation
To avoid measuring the effect of rewetting (increased respiration and mineralization) during the incubation, soil was pre-incubated at room temperature for 2 weeks at 50 % of maximum water holding capacity. Then, 15N–KNO3 solutions (see Tables 2 and 3 for concentrations) were added and thoroughly mixed. Three replicates of each treatments were prepared. Soils were then packed into plexiglass cylinders (14.4 cm inner diameter) at typical field bulk density (1.4–1.5 g cm−3) and a soil depth of 25 cm. Distilled water was added to each cylinder to bring the water-filled pore space (WFPS) up to 73 %–90 % for each treatment (Table 2). The soil cylinders were incubated for 34 d, during which the headspace was continuously flushed with ambient air at a flow rate of 6 mL min−1. During the incubation, only temperature was changed (Table S1 in the Supplement), while the initial settings of water content were not changed and loss of soil water by evaporation was minimized because the mesocosms were kept closed. Temperatures were selected to mimic winter conditions to assess whether previously observed losses during winter could be explained by denitrification (Ziehmer, 2006). Gas samples were collected manually once a day and analyzed by gas chromatography (GC) (Well et al., 2009) to determine N2O and CO2 fluxes and by isotope-ratio mass spectrometry (IRMS) to determine the flux of N2 + N2O originating from the 15N-labeled (Well et al., 1998; Lewicka-Szczebak et al., 2013). Soil samples were collected after pre-incubation immediately before packing of the mesocosm as well as at the end of the incubation and analyzed for , and water content as described in Buchen et al. (2016).
2.1.4 Sand laboratory incubation
Similar to the silt-loam soil, the sandy soil was pre-incubated at 50 % of maximum water holding capacity (determined from the measured water retention curve) for 3 weeks (at room temperature). After pre-incubation, 15N-labeled KNO3 solution (50 mg N kg−1 of dry soil) was added and thoroughly mixed (Table 2). After addition of , the soil was divided, and in half of it, ground ryegrass (sieved with 1 mm mesh; added at a rate of 2.2 g kg−1 of dry soil) was also homogenously incorporated. The ryegrass had a ratio of 25 and N, carbon and sulfur content of 1.3 %, 32.2 % and 0.4 %, respectively. Four replicates of soil from each of the two treatments (with and without ryegrass) were then packed into plexiglass cylinders at typical field bulk density (1.5 g cm−3) and a soil depth of 10 cm (Table 2). The cylinders were incubated for 58 d. An automated incubation system was used, including gas analysis by GC, suction plates at the bottom of the cylinders to control water potential and collect leachate, and an irrigation device to mimic precipitation and/or fertilization (Lewicka-Szczebak et al., 2017; Kemmann et al., 2021; Säurich et al., 2019). Gas samples were also collected every third day manually for IRMS analysis to determine fluxes of N2 and N2O originating from the 15N-labeled (Well et al., 1998; Lewicka-Szczebak et al., 2013).
Instability in the headspace pressure (values between 1 and 3 kPa) occurred near the end of the experiment, due to partial clogging of the hypodermic needles that were used to lead the exhaust gas through sampling vials (Well et al., 2006). Therefore, pressure head in the soil columns was associated with an uncertainty of about 2.5 kPa. Variable pressure resulted in differing water content within and between treatments, so results are shown for individual replicates of both treatments (Figs. S1 and S2 in the Supplement). The water content of the soil was initially set to 0.231 g g−1 (equivalent to 80 % WFPS) and was subsequently changed by establishing defined water potential at the suction plates (Table S1) and by adding water and/or KNO3 solution from the top of the columns as irrigation and/or fertilization events. Phases with defined temperature were set as shown (Table S1).
2.2 Model description and setup
Using the denitrification data collected in the incubations described above, we tested the denitrification and decomposition sub-modules of three biogeochemical models: Coup (Jansson and Moon, 2001), DNDC (Li et al., 1992) and DeNi (based on the approach of the NGAS and DailyDayCent; Parton et al., 1996 and Del Grosso et al., 2000). Selected experimental data for model evaluation included denitrification (N2 and N2O fluxes produced from soil ) and decomposition (CO2 fluxes) and “proximal” and “distal” controls (according to the definition by Groffman and Tiedje, 1988). Proximal controls were temperature, , pH and organic C. Distal controls were soil moisture, texture, –N, bulk density and respiration (as a proxy for O2 consumption). Models were set up according to the initial experimental setups of the two incubations (i.e., seven initial model setups for silt-loam soil and two setups for sand; Table 2). For the silt-loam soil, only soil temperature was changed during the experiment, while for the sand soil temperature, soil water status (change in the water potential and irrigation) and content (by irrigation with KNO3 solution) were changed.
In the two experimental setups, variation of individual control factors was only tested to a limited extent, but measurements reflected the interaction of multiple control factors (see Sects. 2.1.3 and 2.1.4). Those interactions presented additional complexity, which provided valuable data on the temporal dynamics of measured vs. modeled fluxes. Comparing the magnitude of measured and modeled fluxes was considered in the evaluation process, but it was not our primary criterion. Our first criterion of model evaluation was the agreement of measured and modeled results with respect to directional changes of N2, N2O and CO2 (i.e., fluxes increasing or decreasing) in response to the relevant control factors.
2.2.1 Coup
Coup (coupled heat and mass transfer model for soil–plant–atmosphere systems) is a complex, adjustable process-oriented model that uses a modified approach of PnET-N-DNDC to simulate nitrification and denitrification (Norman et al., 2008). Coup gives users the option to choose between different algorithms, each representing the functionality of a sub-module, with each sub-module addressing a different aspect of the soil–atmosphere–vegetation system (Senapati et al., 2016; He et al., 2016; Norman et al., 2008; Nylinder et al., 2011; Conrad and Fohrer, 2009). This complex modular structure allowed us considerable freedom in adapting the model structure to our experimental setup and the available data (Table S2 in the Supplement).
In the model, soil columns of sand were divided into five layers (we are assuming equilibrium, and it was calculated based on the water retention curve and layer depth) with layer extents of 2 cm. The water retention curve was not available for the silt-loam soil. The soil columns were thus modeled as a 25 cm unified, single soil layer. Daily water content and soil temperature were set up in the model as dynamic input parameters coming from water balances and measurements, respectively. The initial contents of organic carbon, total N, and of the silt-loam soil and sand were used in the model (Table S3 in the Supplement). A first-order kinetics approach for two pools (litter and humus) governed by response functions of soil moisture and temperature is used to simulate soil organic carbon dynamics. Soil litter represents the rapidly decomposable organic material (e.g., fresh plant litter), and the humus pool represents the more resistant fraction. The initial amount of soil organic carbon (SOC) allocated into the labile pool was based on default SOC allocation fractions. For the sand soil cores with application of ryegrass, the C and N of ryegrass were exclusively added to the labile pool. Since the basic settings resulted in overestimation of CO2 production, first-order decomposition rate coefficients for litter and humus were changed to modify decomposition and mineralization to fit measured rates. From the two available algorithms to describe denitrification, the algorithm with explicit consideration of denitrifiers was chosen (Table S2), which includes the microbial approach for the denitrification sub-model. The applied settings and parameters are in Tables S2–S4 in the Supplement. Parameters were adjusted separately for each experiment (silt-loam soil and sand) but were identical between treatments. The soil anaerobic fraction is defined by the approach of the anaerobic balloon concept of DNDC (Norman et al., 2008).
2.2.2 DeNi
DeNi was programmed based on the nitrification and denitrification approach of the NGAS model (an early stage of the DailyDayCent model) (Parton et al., 1996) (see Table S4). The approach of the DailyDayCent (and therefore DeNi) model for the description of denitrification is a hybrid between detailed process-oriented models and simpler nutrient-cycling models (Parton et al., 1996). It allows users to separately test the nitrification and denitrification sub-modules. The model runs on daily time steps. The main difference between DailyDayCent and Coup is that Coup explicitly models denitrifier dynamics. In contrast, the DailyDayCent/NGAS model is a relatively simple, semi-empirical model to simulate the N2 + N2O production without directly considering microbes.
Parameter adjustment and data input were accomplished using the DeNi source code. Measured soil texture, bulk density, initial , and ratio were used to initialize the model. For the silt-loam soil we ran the model calculated with one soil layer because water content was assumed homogenous. For the sand soil, five, 2 cm thick soil layers with differing water contents were simulated because significant differences in water content were evident/expected. We used the measured daily temperature and the theoretical (calculated) water content of each of the five layers. Irrigation, seepage and fertilization events were included, and the model was modified with calculated changes in and water content, which were calculated based on the irrigation, seepage and fertilization events. The ryegrass treatment as extra labile organic carbon was added as a higher ratio. The theoretical and concentrations (Table S5 in the Supplement) were changed (modeled production and consumption) by mineralization, nitrification, denitrification, leaching and the added fertilizer (Table S6 in the Supplement) during the simulations. For the calculation of missing soil physical parameters (e.g the soil gas diffusion coefficients) the respective pedotransfer functions were applied (Saxton and Rawls, 2006).
2.2.3 DNDC
The DeNitrification–DeComposition model (DNDC) is a complex, widely used process-based model of C and N biogeochemistry in agricultural ecosystems (e.g., Li et al. 1994). DNDC contains six sub-modules: soil climate, crop growth, decomposition, denitrification (see Table S4), nitrification and fermentation. The model joins denitrification and decomposition processes together to predict emissions of C and N from agricultural soils, based on various soil, climate and environmental factors. Time-dependent variations in soil moisture, temperature, pH, C and N pools are considered by calculating them for each soil layer for each time step. Like in Coup, denitrifiers are explicitly modeled.
Based on the experimental setup for the sand soil, the irrigation with KNO3 solution was simulated as rainfall containing , and the atmospheric background of NH3 and CO2 was considered to be zero and negligible, respectively, since the incubation was in an artificial atmosphere. Minimum and maximum temperatures were set according to the actual experimental values. The mixing of the experimental soil prior to incubation was applied as litter-burying till with no crop and coupled with water and fertilizer addition. Nitrate fertilizer was added twice with ryegrass residue as straw either mixed or omitted. Water was added once in the beginning and twice in the middle of the experiment as per treatments in the form of irrigation following comparative tests with rainfall as well as rainfall and irrigation options. To run the model using inputs from the silt-loam incubation, the microbial activity index, temperature setting, and mixing of soil with water as irrigation and fertilizer were simulated as in the sand incubation, but irrigation and fertilization were assumed to occur only once in the beginning, and rainfall was considered to be zero.
2.3 Statistics and calculations
Statistical calculations were done using the Python 3 (Van Rossum and Drake, 2009) and the R (R Core Team, 2013) programming languages as well as the gnuplot (Williams and Kelley, 2019) interactive plotting program. A multiple comparison of means (Tukey HSD, p<0.05) was performed on the N2 + N2O and CO2 data of the silt-loam soil. The N2 + N2O data of the sand soil were not normally distributed. Therefore, the Wilcoxon signed-rank test was used for these data to test the effect of the ryegrass application (p<0.05).
Responses to control factors were assessed using the ratio of treatment differences between modeled and measured values, e.g., . The ratio between relative treatment differences of measured and modeled values is 1, if the measured and the modeled values changed with the same magnitude in the same direction. If the ratio is bigger than 1, the direction of measured and modeled values is the same, but the magnitude of the response is bigger in the model than was seen in the measured values. If the value is between 0 and 1, the direction is the same, but the magnitude of the response is smaller in the model than was seen in the measured values. If the ratio is negative, the direction of the response is opposite in the model as compared to the measurements. For ratios of 0, there was no model response to differences between treatments.
3.1 Silt-loam soil
In the summary of the results, we discuss general trends seen in the data, with statistical differences specified when relevant. Results of the seven silt-loam treatments are shown in Table S7 in the Supplement. CO2 fluxes were increased with temperature (Fig. S3d in the Supplement, Table S1). Cumulative CO2 fluxes were highest in the treatments with low WFPS and lowest in the treatments with high WFPS and bulk density (Table 2). N2 + N2O fluxes decreased over time in treatments I, II, IV and VI, whereas the opposite was the case in treatments III, V and VII (Fig. S3a). Cumulative N2 + N2O fluxes decreased in the order V ≥ III ≥ IV = VII > I = VI = II (p<0.05; Tukey HSD), showing treatments III to V, which were characterized by elevated bulk density or N level, exhibited higher fluxes than the other treatments. The highest cumulative N2 + N2O fluxes were thus related to higher bulk density and WFPS (Table S7). The treatment with lowest application (II) showed the lowest N2 + N2O flux, while the highest bulk density resulted in higher N2 + N2O flux compared to all other treatments (Table S7). The ratio was generally low (between 0.088 and 0.264, Table S7).
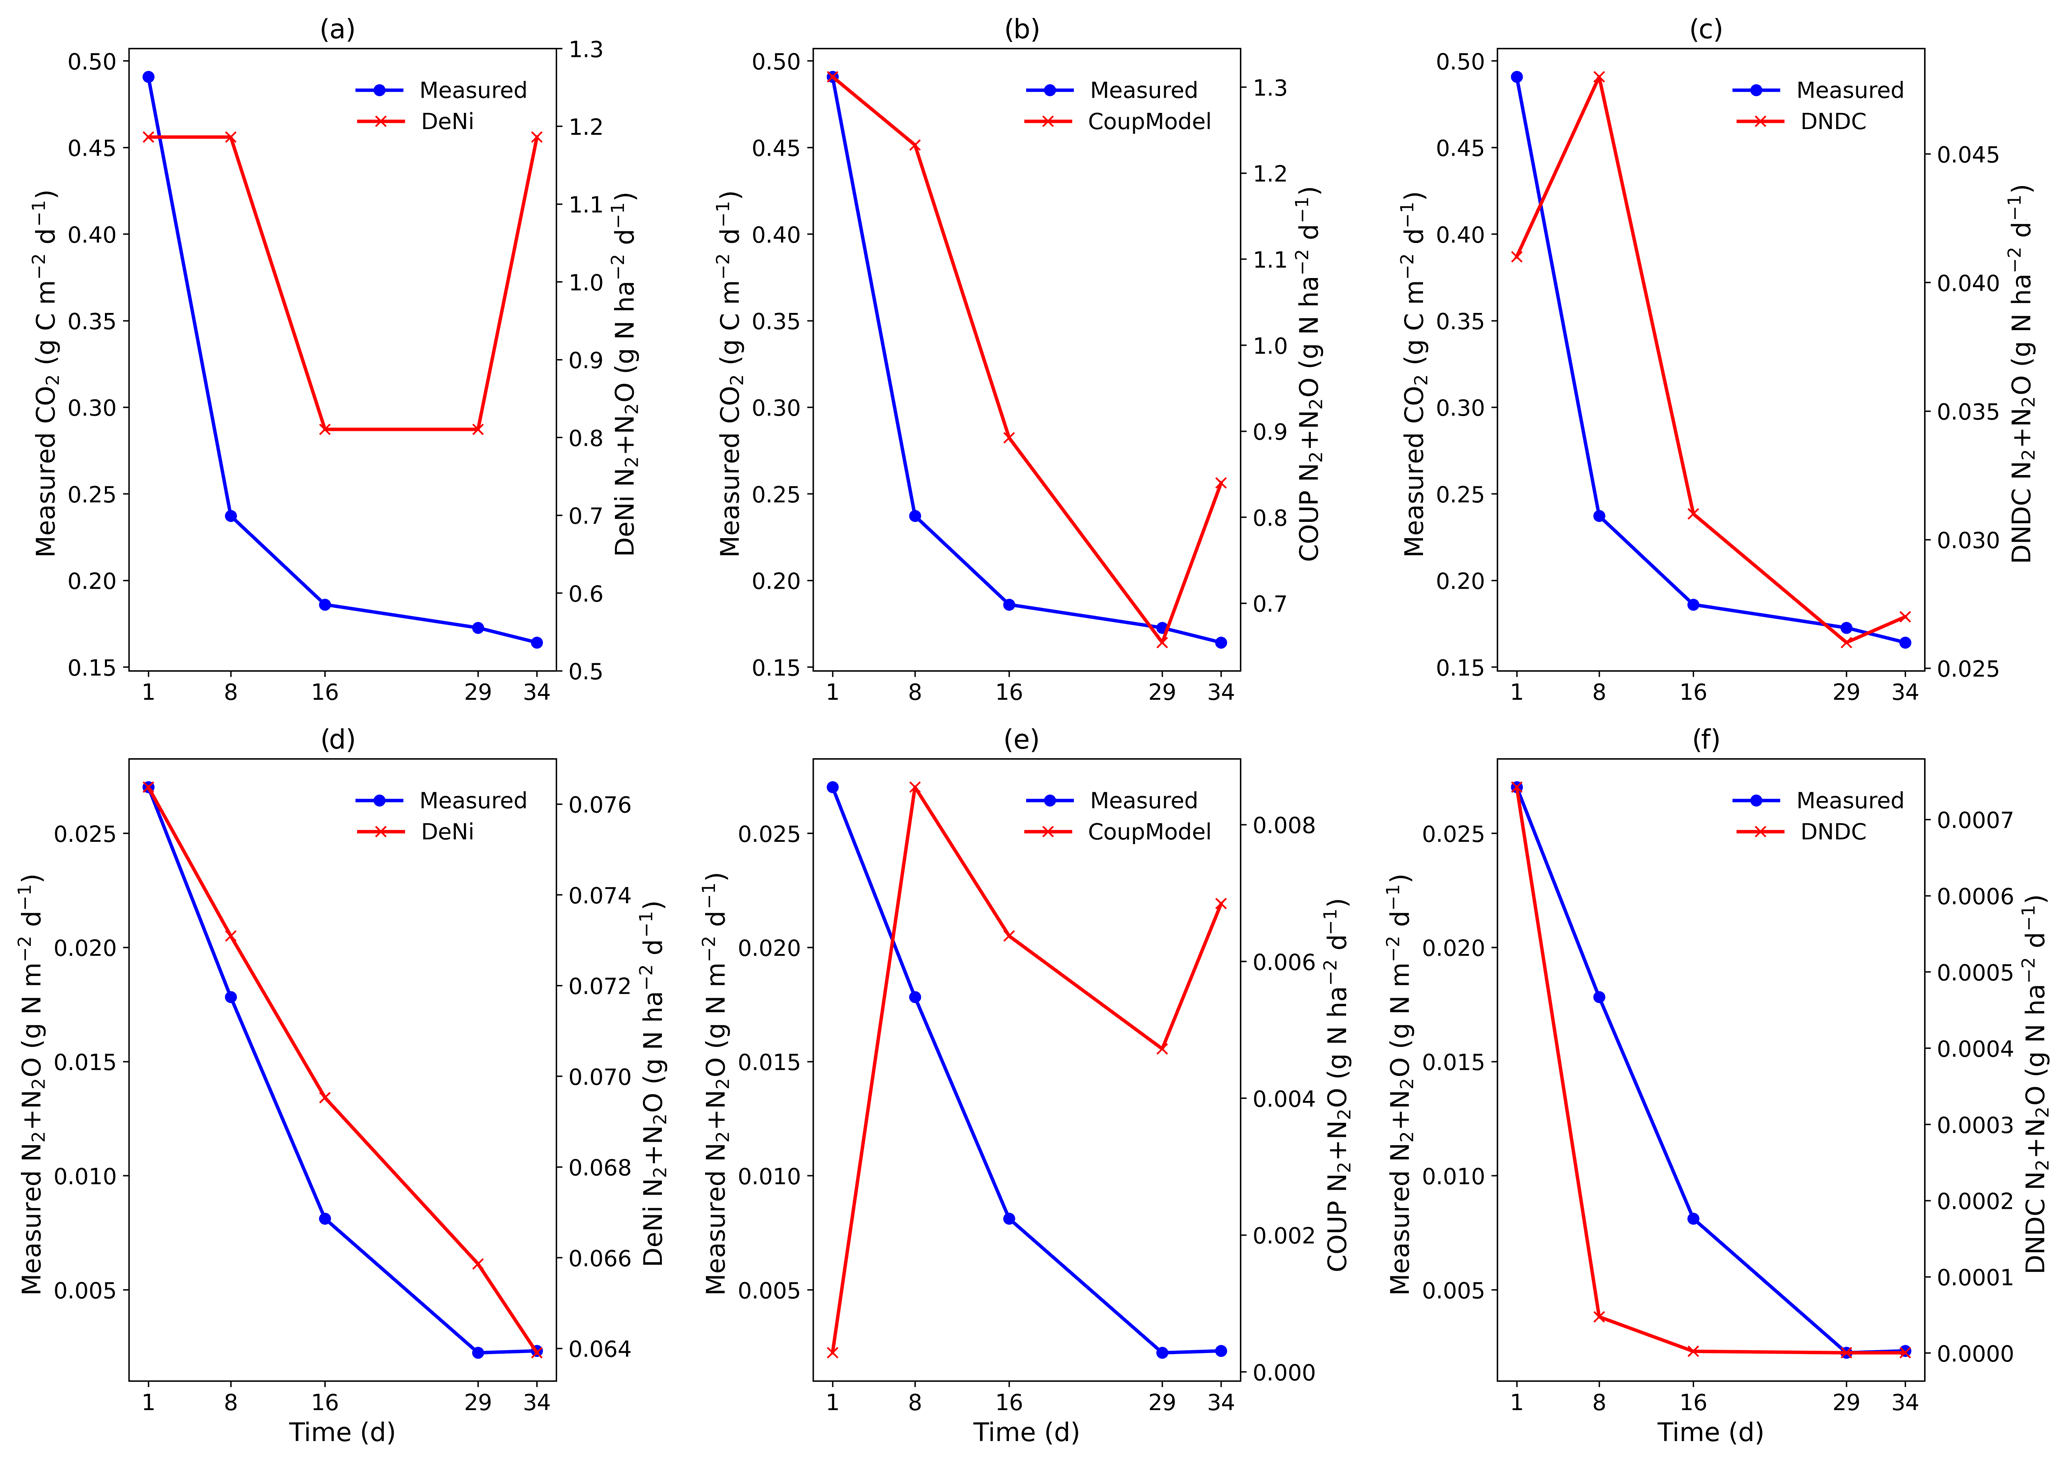
Figure 1(a–f) An example (treatment VI) for the measured and modeled (DeNi, Coup and DNDC) CO2 (a–c) and N2 + N2O (d–f) fluxes of a silt-loam arable soil from Hattorf, Germany
3.2 Sand soil
Comparing the cumulative CO2 fluxes of the two treatments, ryegrass-amended columns were (2–4 times) higher than those without ryegrass (Table S7). The CO2 fluxes reached a maximum after 8–13 d and then slightly decreased until day 32 (Fig. S.2d), when both irrigation (Fig. S4 in the Supplement) and temperature (Table S1) manipulation events occurred. In the control, CO2 fluxes were at a lower level and slowly increased until temperature was changed. Lowering temperature from 20 to 10 ∘C (Table S1, Fuhrberg, day 38) drastically decreased CO2 fluxes in both treatments, whereas further temperature changes had smaller effects.
The cumulative N2 + N2O fluxes were almost 8 times higher in ryegrass compared to the control treatment. N2 + N2O fluxes were initially high in both treatments (Figs. S1a and S2a) but decreased rapidly following the drainage period during the first 12 d of incubation (see Table S6 and Fig. S4). During the remainder of the experiment, fluxes remained low and were only to a minor extent affected by the experimental manipulations. Initially, the ryegrass-treated cores had high N2 + N2O fluxes which rapidly decreased during the incubation.
The ratio of fluxes (Table S7) shows that N2O dominated the N fluxes. The ratio was similar for both treatments. During the irrigation–fertilization period at day 31, the N2 production increased in both treatments (Figs. S1b and S2b) and the ratio decreased (Fig. S5 in the Supplement). This response occurred 1–2 d after the onset of irrigation.
3.3 Modeled results of silt-loam soil
DeNi and Coup overestimated CO2 production, with predicted CO2 fluxes 3 to 10 times higher than the measured values, whereas DNDC mostly underestimated the measured fluxes (Table 3). The variability of the model calculations is quite low, and the fluctuation of the values does not always follow the changes in the measured values. The time series of the CO2 flux calculation of DeNi followed the fluctuation of the temperature settings, whereas the other models mostly predicted only decreasing trends over time as shown for treatment VI (Fig. 1a–c).
On average, DeNi calculated ∼ 4 times higher N2 + N2O fluxes than measured. In contrast to this, N2 + N2O fluxes obtained from Coup were about 4 times lower than the measured values, despite the fact that the N2O estimation of Coup was quite close to the measured values (Table 3). In DNDC, it is notable that N2 fluxes were always zero, and it therefore underestimated N2 + N2O fluxes even more (∼ 30 times) than Coup (Table 3). Coup and DNDC results show little variation between treatments, and both measurements and DeNi exhibit a large range between minimum and maximum N2 + N2O fluxes (Table 3). The DeNi results follow the general trend of the changes in the measured values quite well, responding to increases in (II < VI < III) and WFPS (I < VI < V < VII) though not bulk density (IV = VI). In contrast, N2 + N2O fluxes by Coup increased with decreasing (II with lowest fluxes). DNDC did not calculate any N2 fluxes. The calculated N2O fluxes did not respond to moisture or , calculating almost the same values for all five treatments of the same bulk density (Table 3, I, II, III, VI and VII). However, DNDC responded positively to bulk density (highest values for IV and V). The ratio of DeNi fitted the ratio of the measured values quite well, whereas this was not the case for Coup and DNDC, which overestimated this ratio (Fig. S6 in the Supplement). The time courses of the N2 + N2O fluxes of DNDC and DeNi mostly agreed with measurements but to a lesser extent for Coup (Fig. 1d and f). Coup predictions exhibited an inverse trend with measured values during the first 10 d.
Table 4Normalized treatment effects on N2 + N2O fluxes (silt-loam soil) of modeled relative to observed results. Treatments differ with respect to content (10–40 mg N kg−1 of dry soil), WFPS (73 %–90 %) and bulk density (1.4–1.52 g cm−3). Values shown are the ratio of treatment differences between modeled and measured values, e.g., .
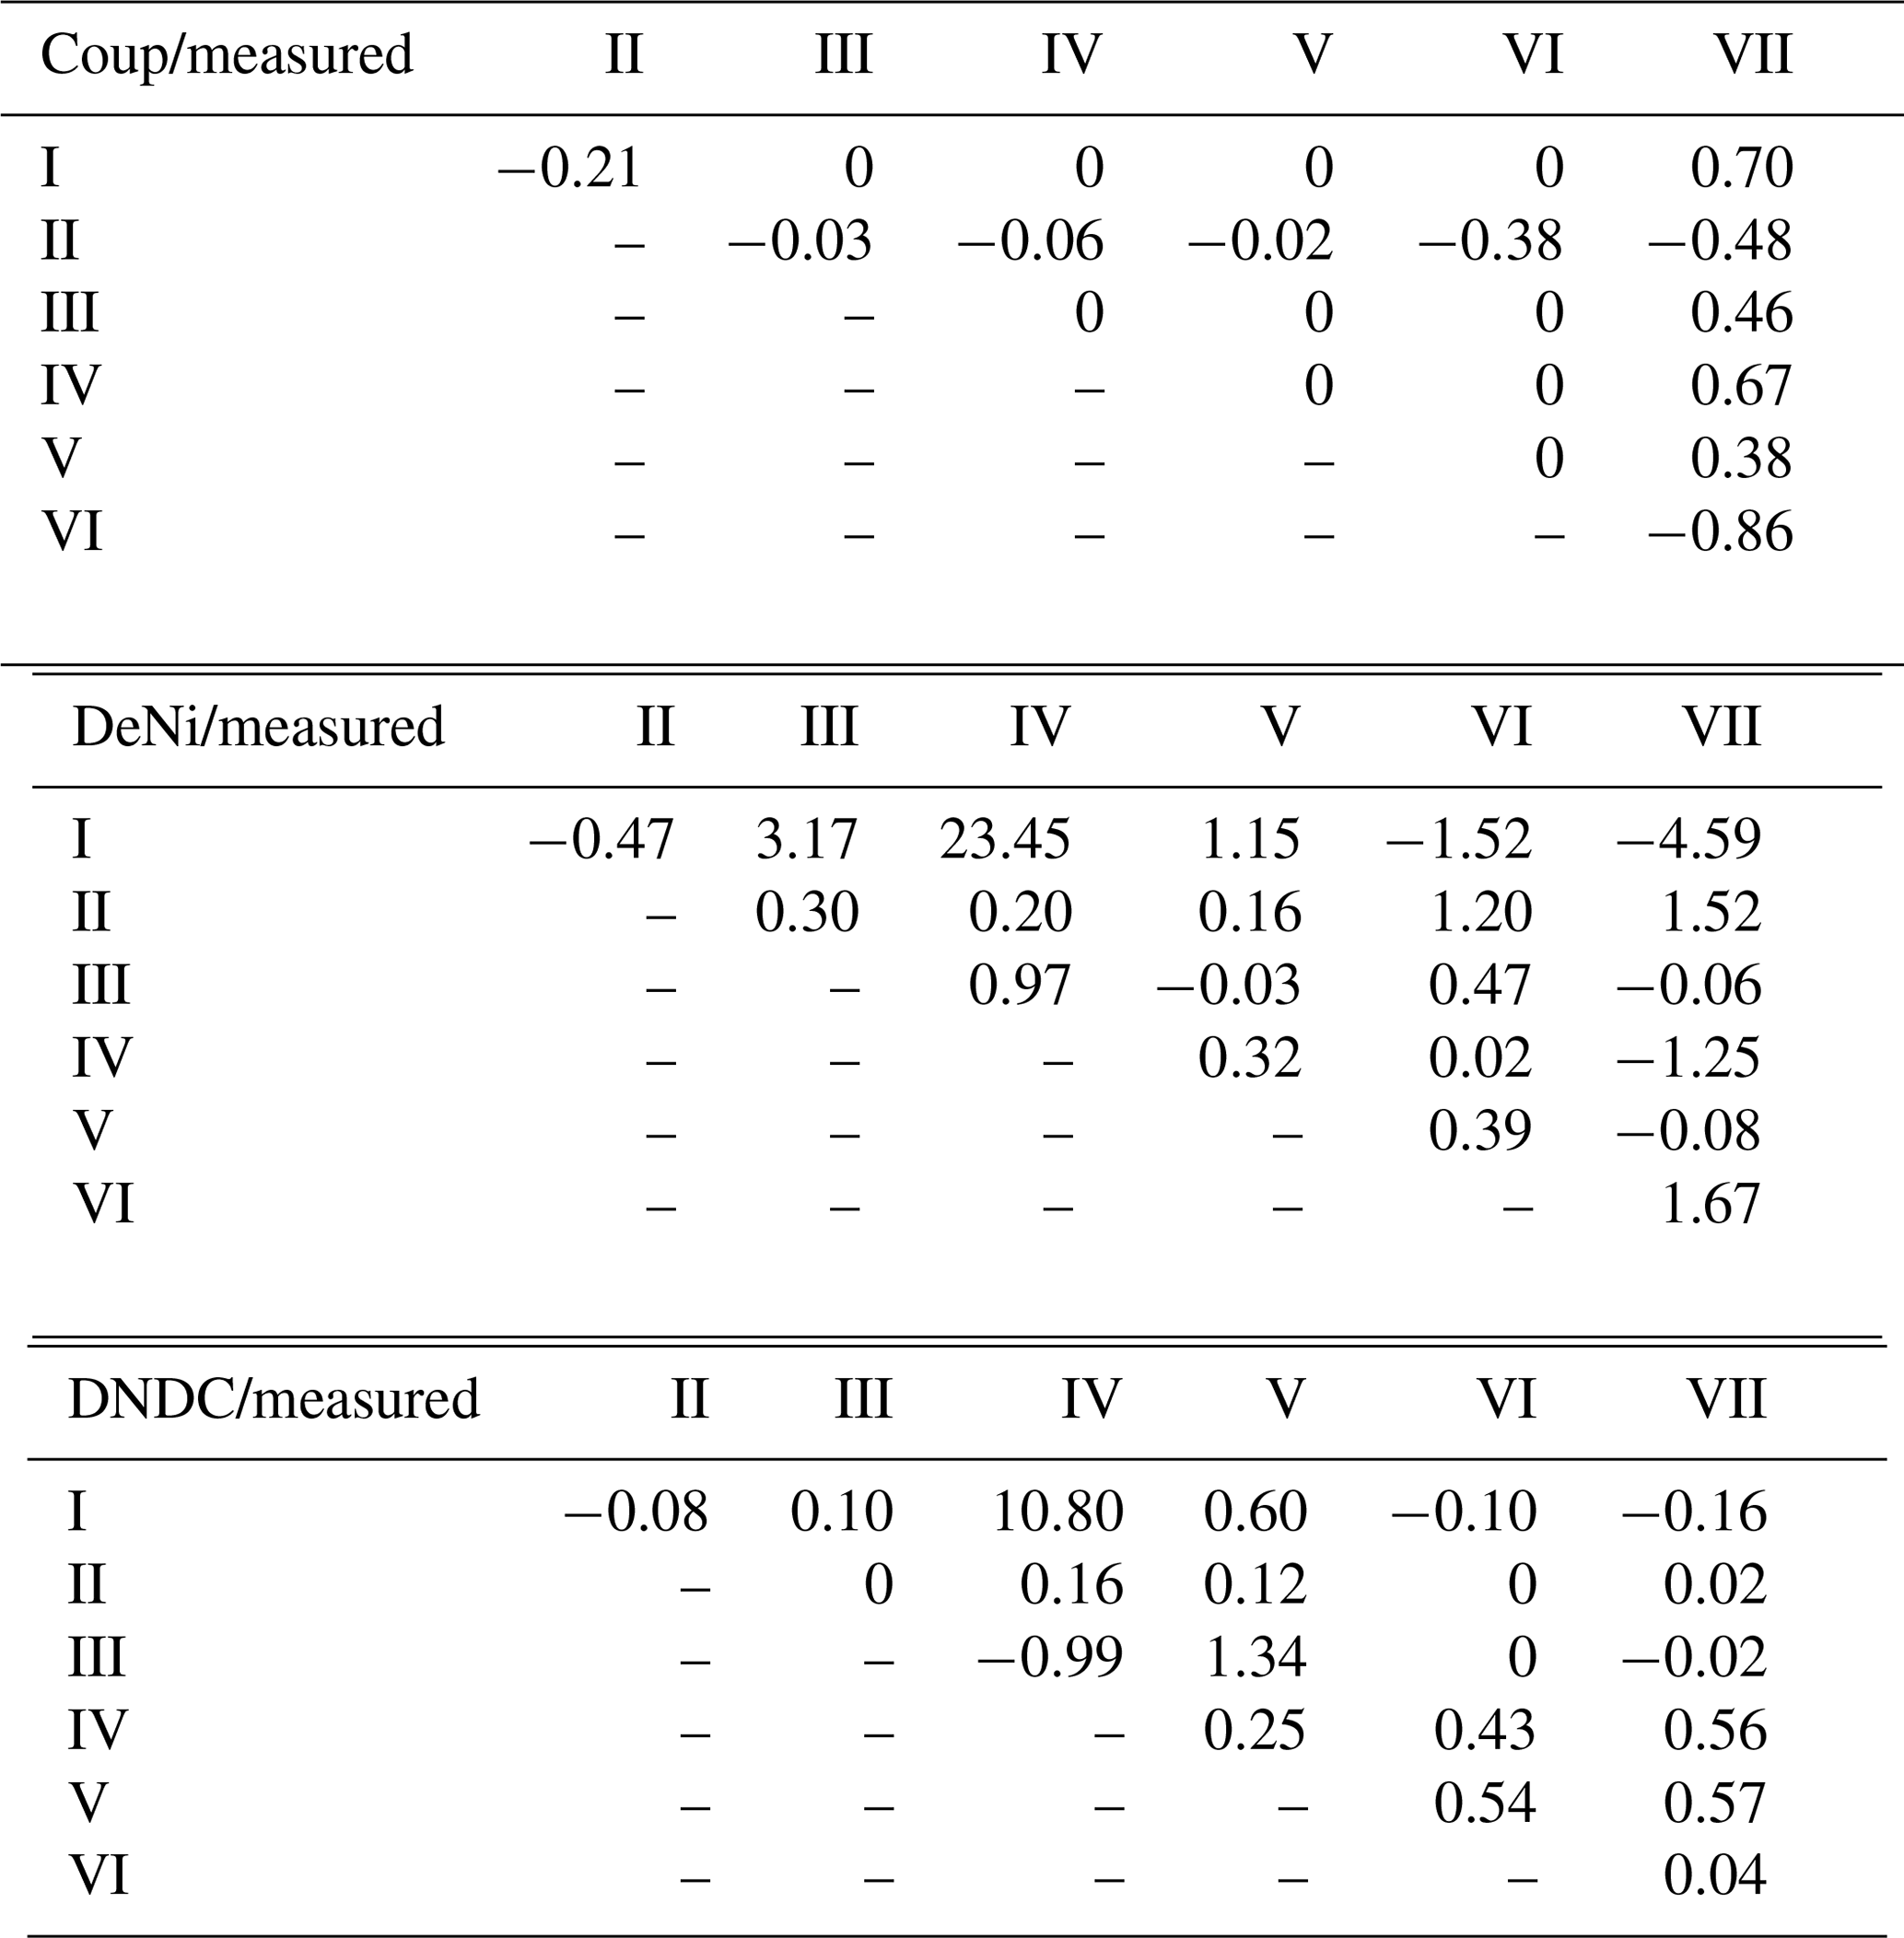
In addition to comparing average fluxes, we also assessed treatment response using normalized ratios (Table 4; see calculation description in Sect. 2.3). For Coup, ratios showed that modeled treatment differences were either absent (10 of 21), lower than (4 of 21) or opposite (7 of 21) to measured differences. For DeNi, the model always responded to treatments (i.e., no 0 ratios), with most (14 of 21) cases showing a model response in the same direction as measured values and two cases where the model had significantly higher ratios than the measured values. For DNDC, with two exceptions, ratios indicated either lower (11 of 21) or opposite (5 of 21) response of the model as compared to measured values, with three instances where the model did not respond (i.e., ratio of 0).
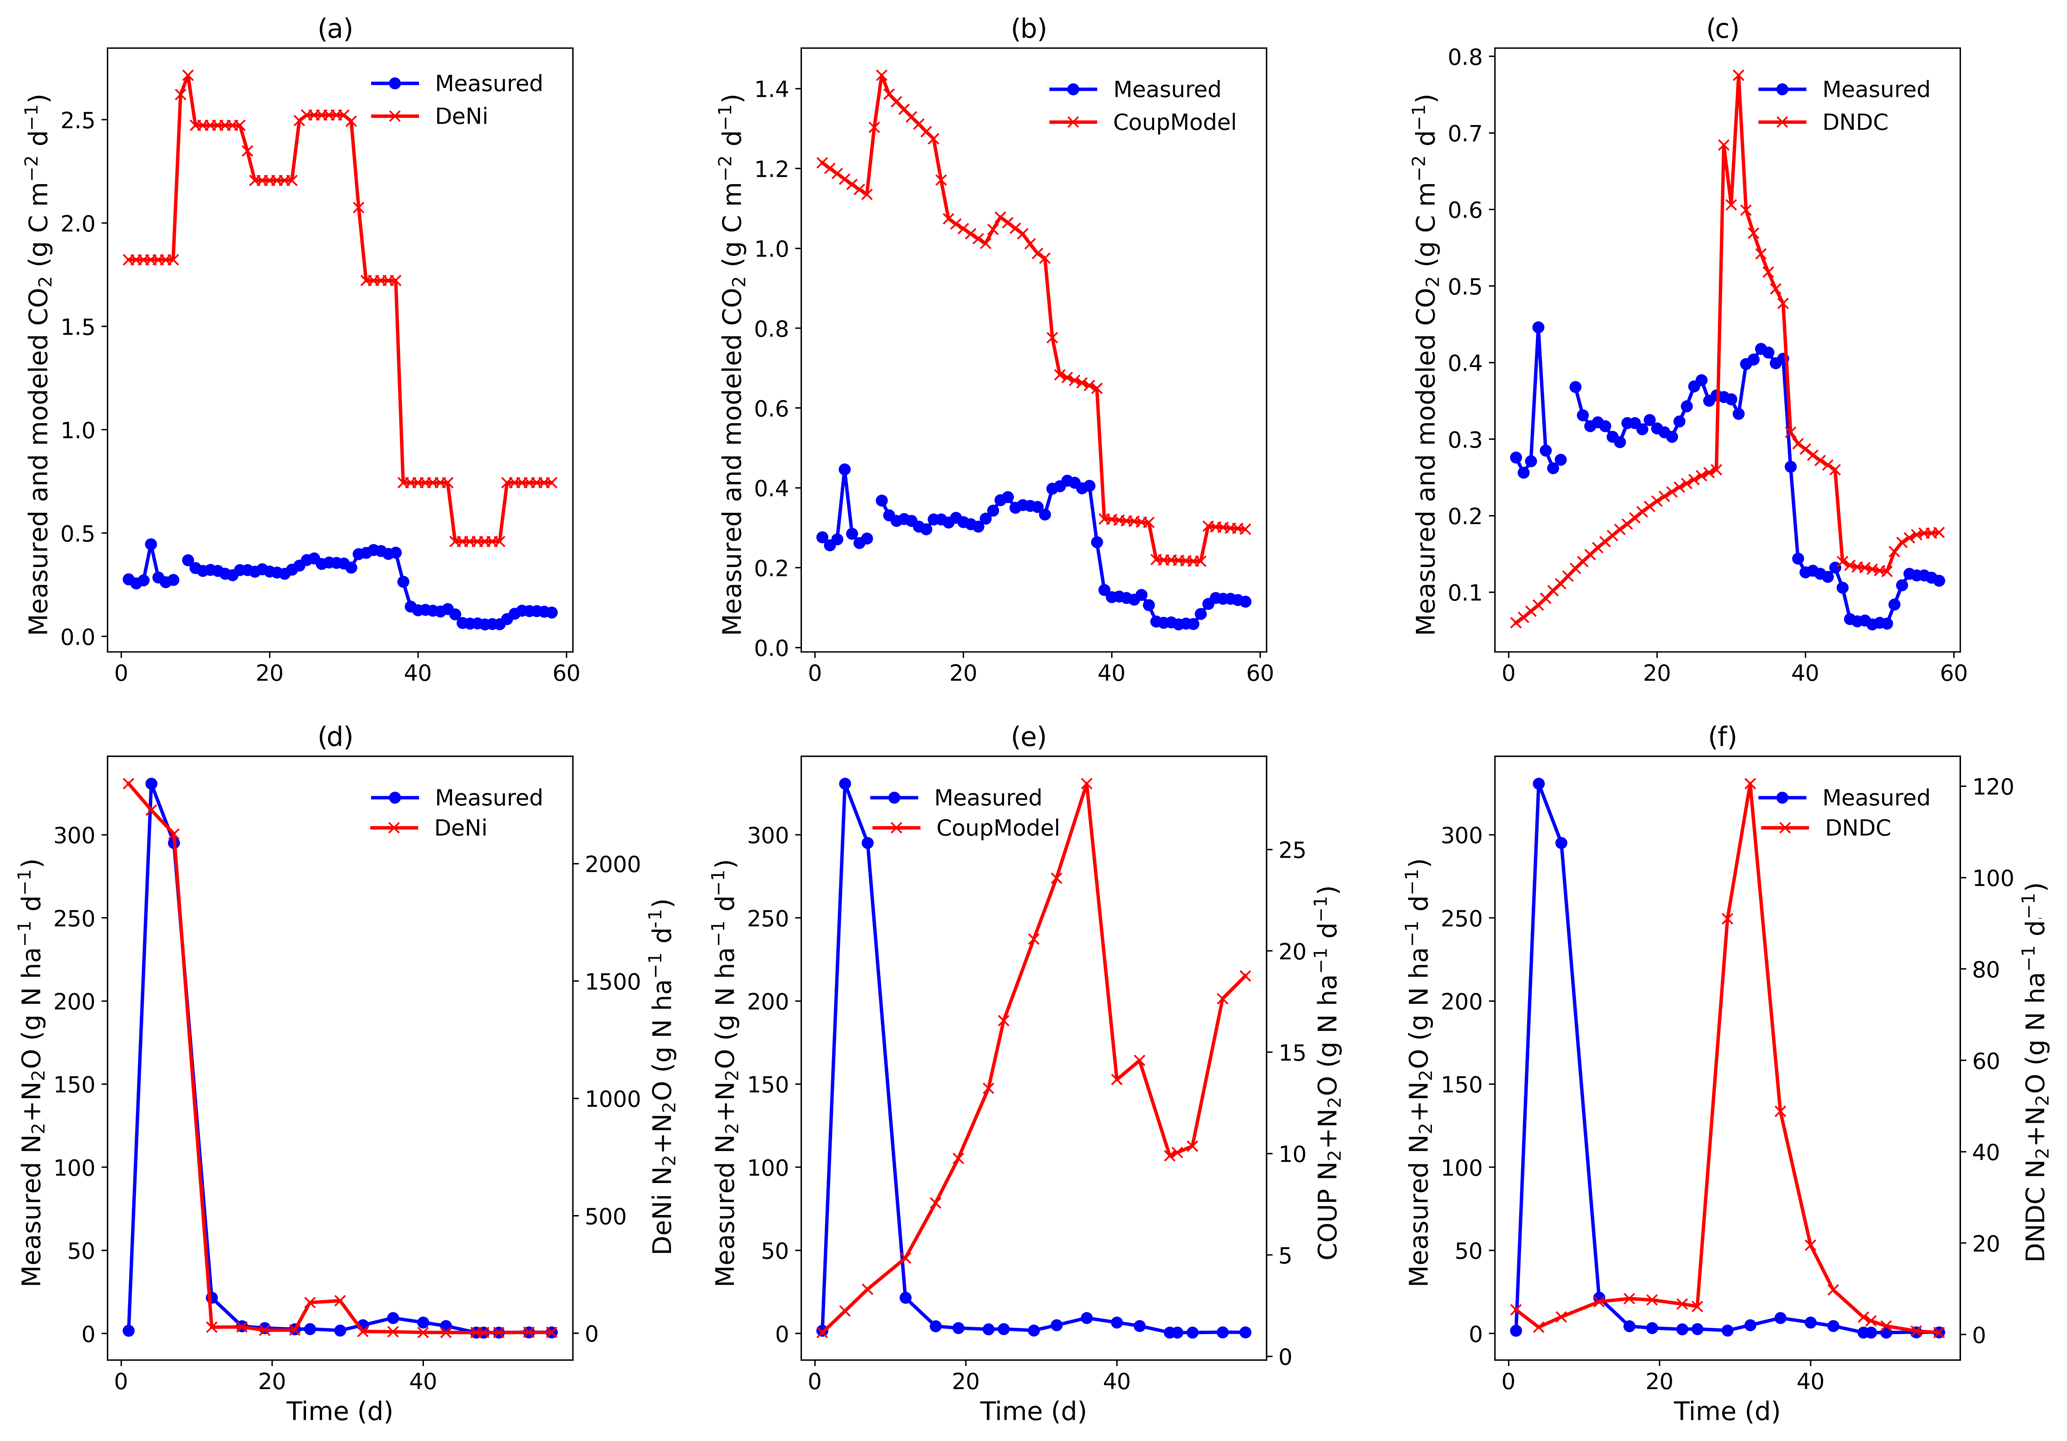
Figure 2(a–f) Measured and modeled (DeNi, Coup and DNDC) CO2 and N2 + N2O fluxes from a 58 d laboratory incubation of soil cores from a sandy, arable site in Fuhrberg, Germany. Measured values shown are the average of the control cores (cores 5–8), which were given no additional substrate.
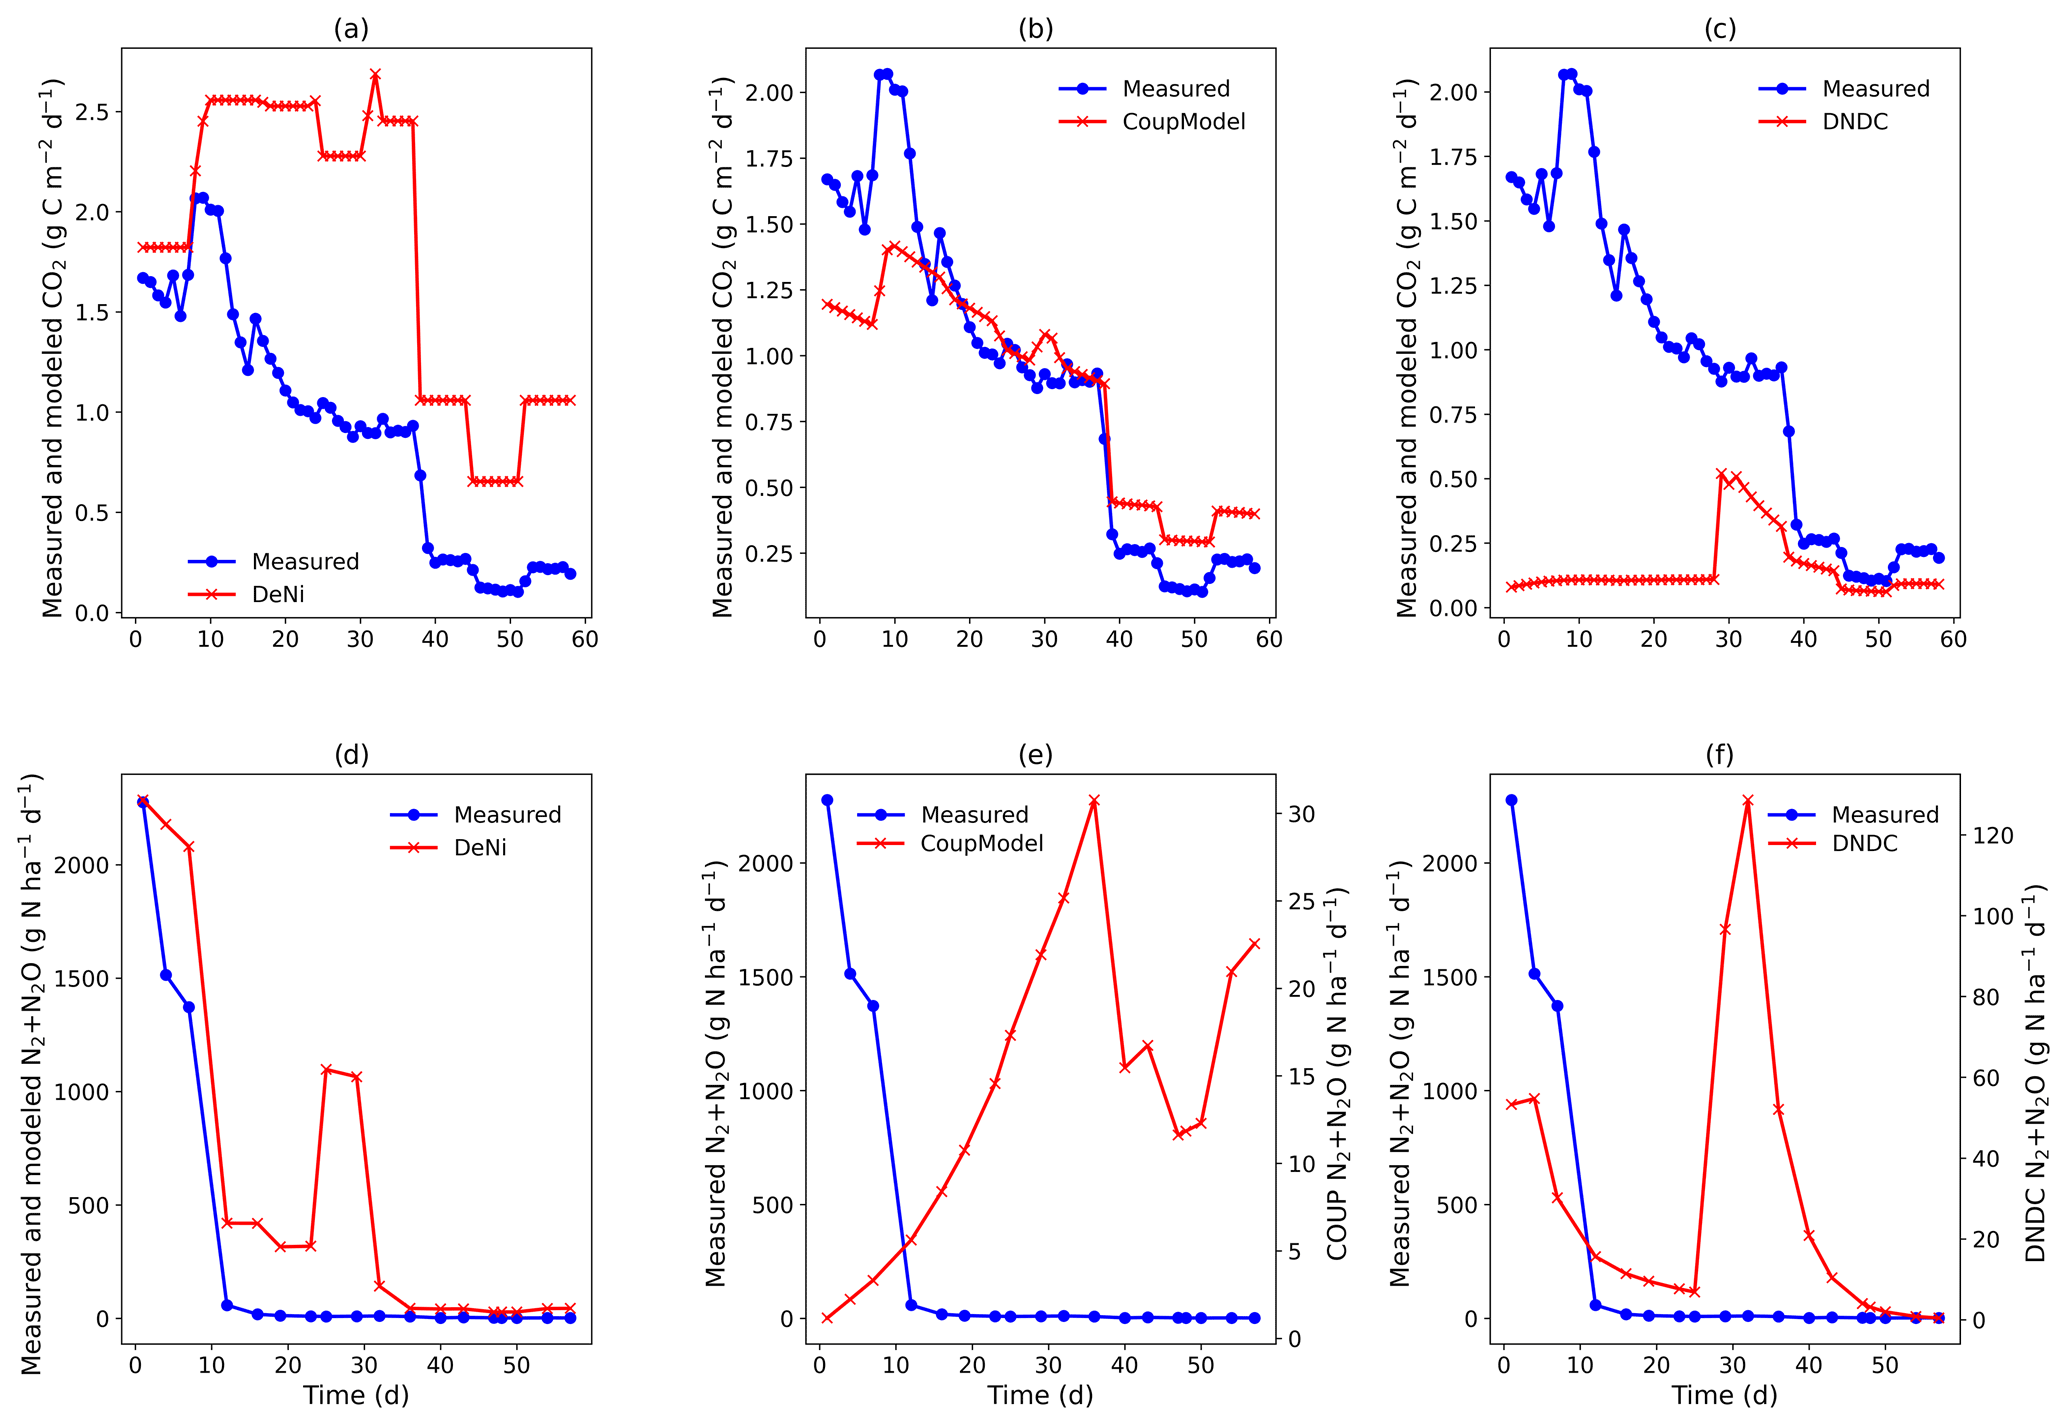
Figure 3(a–f) Measured and modeled (DeNi, Coup and DNDC) CO2 and N2 + N2O fluxes from a 58 d laboratory incubation of soil cores from a sandy, arable site in Fuhrberg, Germany. Shown is the average of the treated cores (cores 1–4), which were amended with ryegrass prior to incubation. It is important to note the difference in magnitude of the modeled and measured N2 + N2O fluxes (e and f, secondary y axis).
3.4 Modeled results of sand soil
Coup overestimated the soil respiration for the control treatment (Fig. 2b), but the temporal pattern of the modeling – especially for the temperature manipulation – fitted the measured values. Similarly, in the ryegrass-treated sand, the pattern and the magnitude of measured and modeled fluxes were almost identical (Fig. 3), except for an initial peak. DeNi overestimated the CO2 fluxes for both treatments and, as shown by the identical CO2 fluxes of both treatments, did not respond to the labile organic C of the ryegrass treatment (Figs. 2a and 3a). DeNi did respond to temperature and soil water content, but the magnitude of the response to these changes was too large. DNDC calculated the smallest CO2 fluxes among the three models. The model provided a reasonable estimation for the magnitude of CO2 fluxes of the control treatment (Fig. 2c) but did not reflect a litter effect and underestimated the measured values for the ryegrass-treated soil (Fig. 3c). While there was not an ideal agreement in the temporal pattern, some of the changes in the environmental conditions were clearly reflected.
Similar to the silt-loam experiment (Fig. 1e), the pattern of the estimated N2 + N2O fluxes by Coup was opposite to the trend of the measured fluxes, exhibiting a constant initial increase in both treatments (Figs. 2e and 3e). The subsequent rapid decrease in CO2 and N2 + N2O fluxes resulted from the temperature manipulation. The modeled patterns of DeNi and DNDC (Fig. 2d and f) are closer to the measured fluxes, and both clearly reflect the wetting phase, which caused an increase in measured N2 + N2O fluxes of the treatment without litter but only elevated N2 fluxes in the ryegrass treatment. The response of N2 + N2O fluxes to soil moisture following irrigation differed among models, with DeNi and DNDC predicting immediate responses (Fig. 3d and f), while no response was observed from Coup during the initial growth of denitrifiers (Fig. 3e). However, the modeled fluxes at Coup and DNDC are definitely lower than the measured fluxes, and they are not in the same magnitude (Fig. 3e and f, secondary y axis).
Table 5The measured and modeled (Coup, DeNi, DNDC) average, cumulative N2, N2O and N2 + N2O, CO2 fluxes (g N ha−1 and kg C ha−1), and product ratios (dimension less) for sand arable soil from Fuhrberg, Germany. C1–4 represent the first four parallel columns for the ryegrass treatment. C5–8 represent the four parallel columns of the control/non-ryegrass treatment.
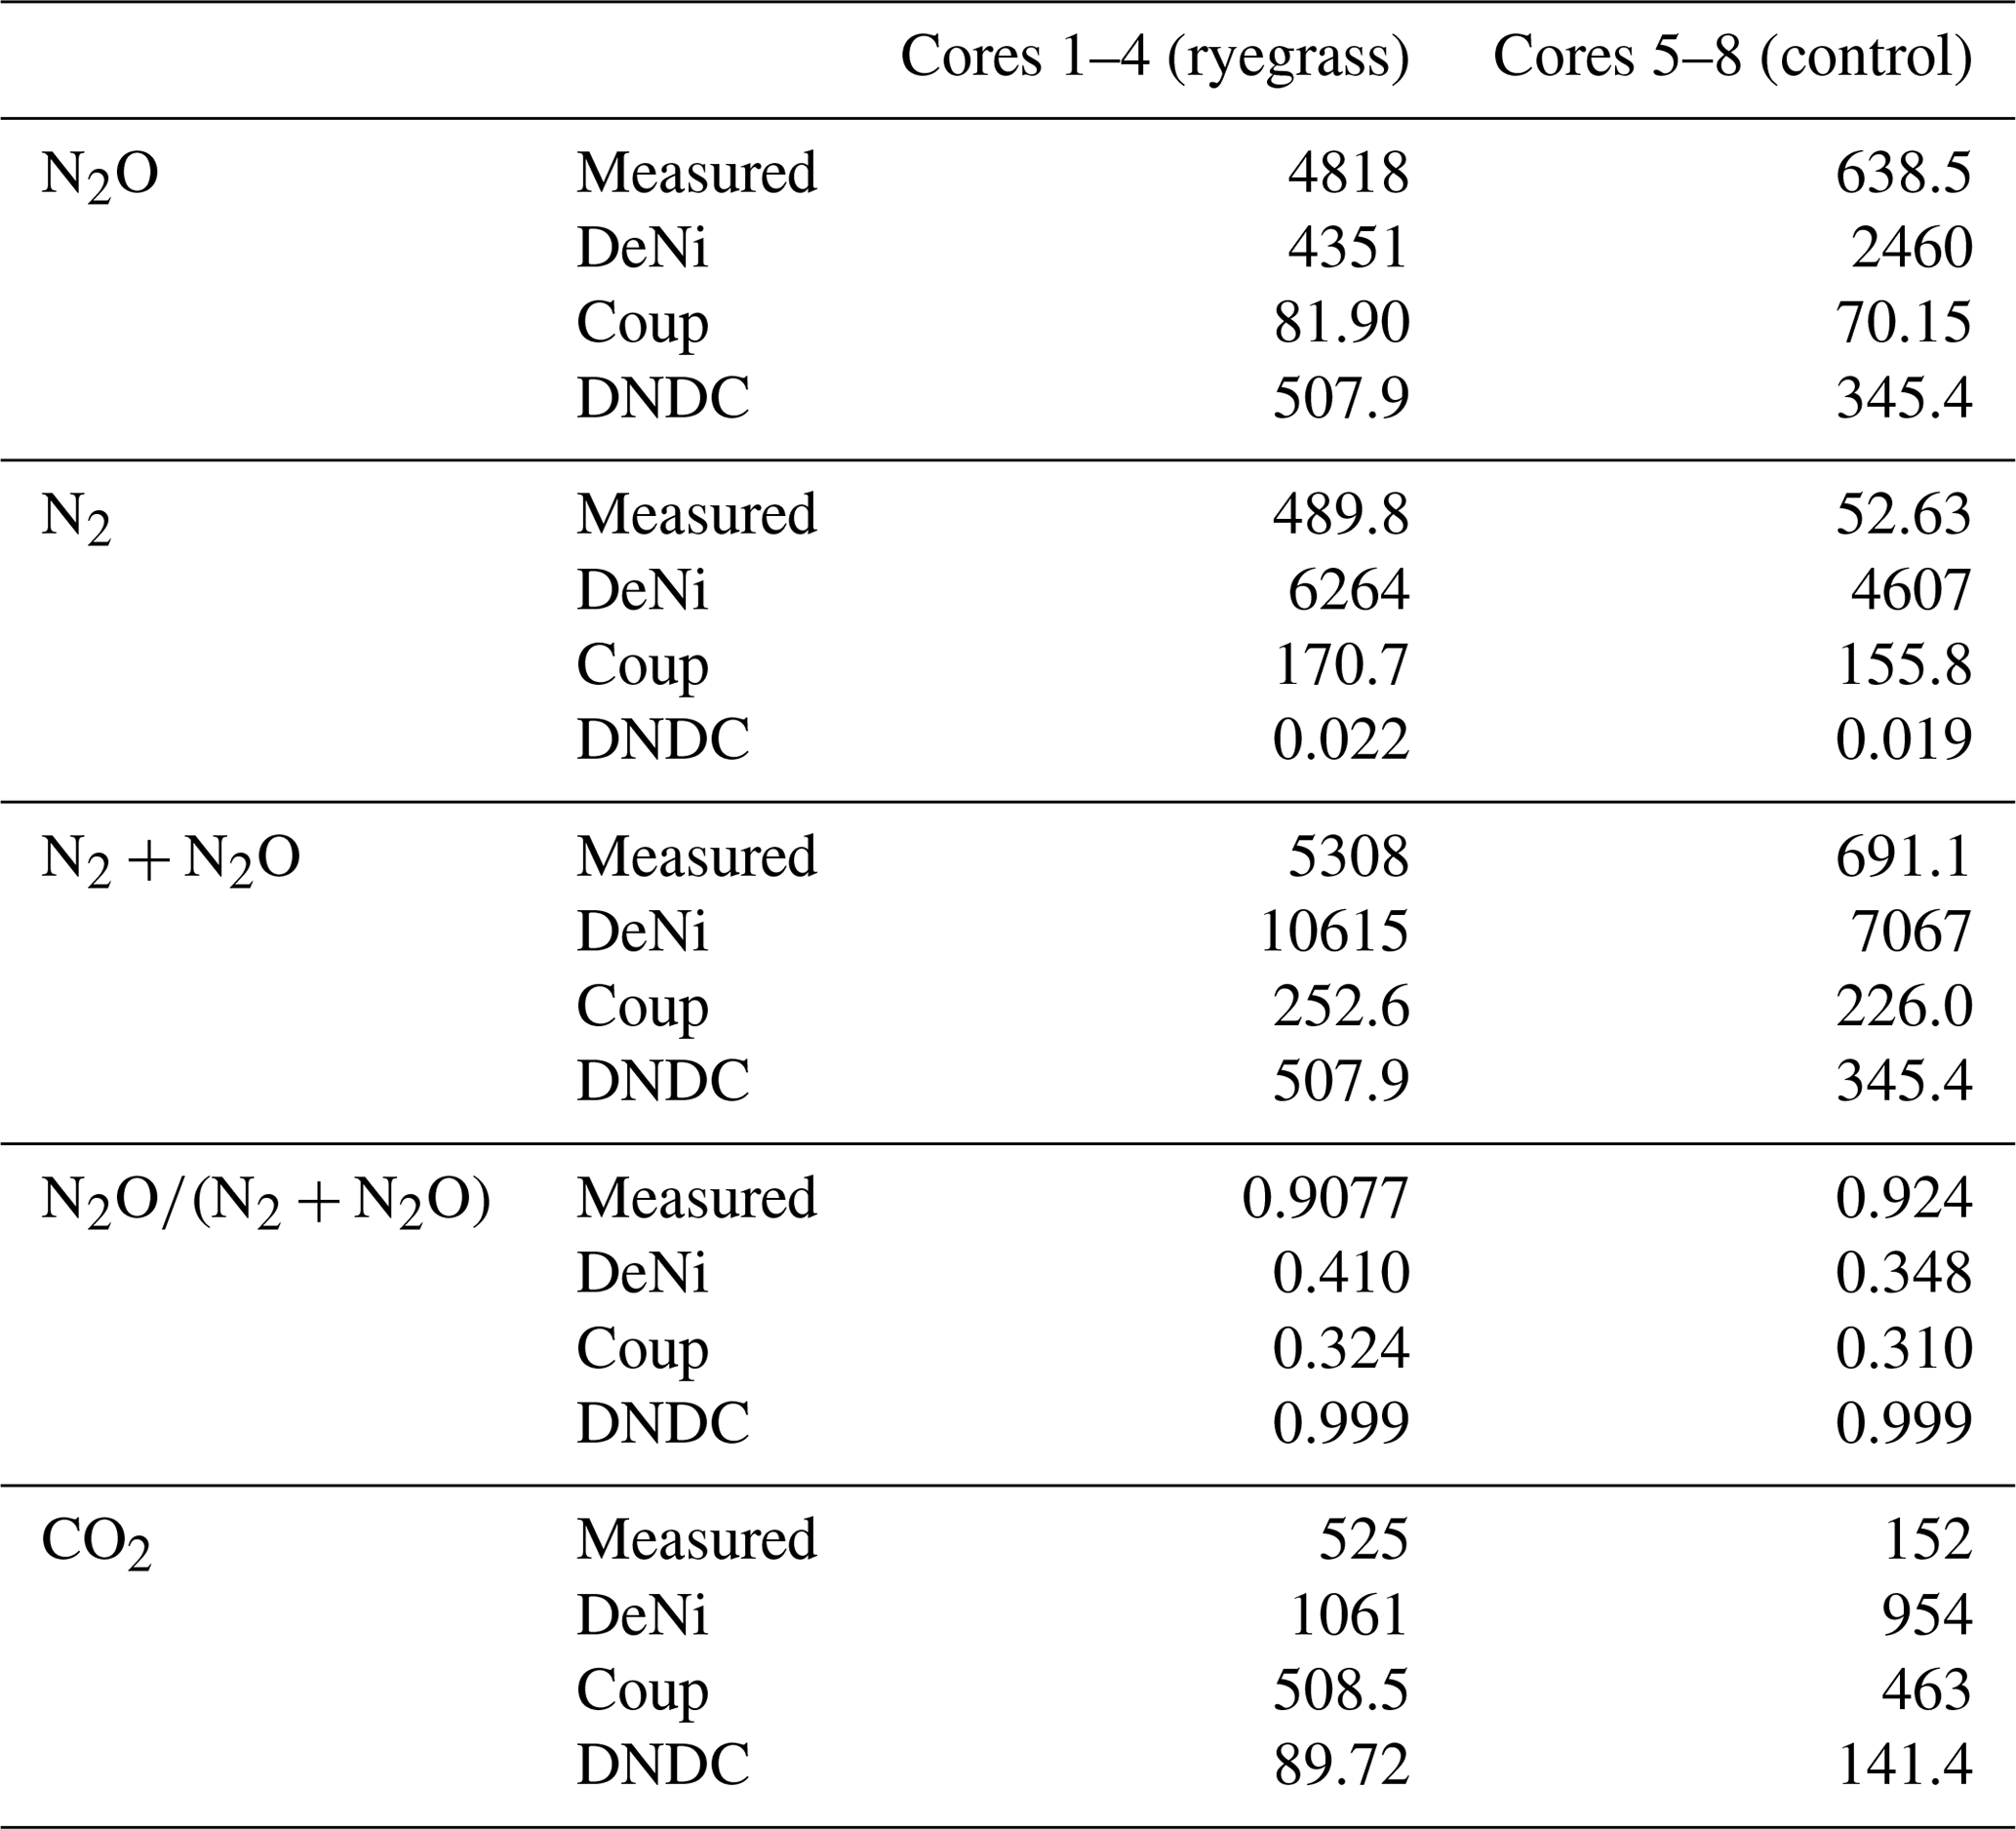
Comparing the order of magnitude of cumulative modeled and measured N2 + N2O fluxes (Table 5), DeNi showed agreement in the ryegrass treatment but overestimated fluxes of the control treatment by 1 order. Conversely, DNDC and Coup showed close agreement in the treatment without ryegrass but underestimated fluxes with ryegrass by 1 to 2 orders.
The ratio of cumulative fluxes modeled by DeNi and Coup was between 0.3 and 0.45 in both treatments (Table 5) and thus much lower than the measured ratios (> 0.9, Table 5). DNDC was close to 1 because the N2 flux estimation of DNDC was almost zero, i.e., 5 orders of magnitude lower than measured fluxes.
4.1 Experimental results
4.1.1 Silt-loam soil
The general trend shows that the highest cumulative CO2 fluxes were measured at low WFPS/bulk density and the lowest fluxes at high WFPS/bulk density (Table S7). Respiration thus reflected the expected response to temperature and aeration (Davidson et al., 2000). Figure 1a shows that the total denitrification was controlled by several interacting factors, where decreasing nitrification can be explained by the combination of substrate exhaustion and temperature (Müller and Clough, 2014). The increasing denitrification in the wettest treatment (VII; treatment description: Table 2.) could be due to ongoing O2 depletion resulting from respiration at low diffusivity during the early phase of the incubation (Well et al., 2019).
The low product ratio (between 0.088 and 0.264, Table S7) indicated that N2O was effectively reduced to N2, so that total fluxes were dominated by N2. Since high contents and low pH are known to inhibit N2O reduction (Müller and Clough, 2014), the low ratios might explained by near-neutral pH values or low contents, below the reported threshold for N2O reduction inhibition (45 mg N kg−1; Senbayram et al., 2019). The relevance of content for controlling the product ratio is supported by the fact that the lowest ratio was observed in the treatment with lowest concentration (II), whereas the highest values were obtained at the highest content (III). However, it is notable that the highest in this study (40 mg N kg−1) was still below the 45 mg N kg−1 threshold.
4.1.2 Sand soil
The dramatic differences between measured fluxes of control and ryegrass soils (2–4 orders of magnitude for CO2 and almost 8 for N2 + N2O; Table S7) can be explained by the effects of labile carbon from ryegrass on microbial respiration and enhancement of denitrification due to increased O2 consumption and supply of reductants for denitrifiers (e.g., Senbayram et al., 2018). The CO2 fluxes of the ryegrass-treated cores (cores 1–4) between days 4 and 12 show a rapid increase (Fig. S2d). The large response of respiration to the ryegrass treatment almost hides the smaller effects resulting from the changing water and content, while these effects were clearly visible in the control. However, small effects with a similar pattern to that seen in the control soils were also evident in the ryegrass treatments (Figs. S1d, S2d, and S4 day 25–35 increasing trend of all cores expect core 2).
Although the control was almost 1 order of magnitude smaller than the ryegrass-treated soil, the initial high water and nitrate content (80 % WFPS, 66 mg N kg−1 of dry soil, Table 2 and S1) resulted in measurable N2 + N2O fluxes in the first 4 d of both treatments. The time course in N2 + N2O fluxes (Figs. 2a and 3a) can be then explained by the combination of easily available carbon, the effect of soil water content and changes in the soil content. The magnitude and variability in water and content might explain some of the measured variability in gaseous N fluxes (initially high fluxes in both treatments but decreasing quickly, Figs. 2a and 3a). While the organic matter amendment clearly enhanced denitrification in the initial phase with high water content, this was not the case during the later phases when fluxes of both treatments were similarly low, likely since anoxic micro-sites disappeared due to improved aeration (Schlüter et al., 2018). The product ratio of fluxes shows that mostly N2O was emitted, which we attribute to the high level and the low pH (Müller and Clough, 2014). The product ratio was similar with and without litter amendment. This might indicate that the combined inhibitory effect on N2O reduction by low pH and high was more effective than the potential enhancement in N2O reduction in the presence of labile C in the ryegrass treatment (Müller and Clough, 2014).
The content and the seepage of leachate show some variability between replicates (Tables S5 and S6), which we attribute to the fact that initial water content (80 % WFPS) was located in the steep-sloping section of the water retention curve (Fig. S7 in the Supplement), where small changes in water potential would be related to large changes in water content. The variable leaching is thus probably due to the limited precision of water potential control (Table S6). At 80 % WFPS, our estimated uncertainty in pressure head control of 20 mbar would lead to an uncertainty in soil water contents equivalent to 0.023 g g−1 or 8.1 % WFPS.
4.2 Possible explanations for the deviations between measurement and modeling
Overall, there were large differences between the measured and modeled results. A clear possibility for some deviations between measurement and modeling is our choice not to calibrate the models. Clearly, after calibration, the models should better simulate our measurements. Our aim, however, was to find the missing processes and limitations of the sub-modules for further model development rather than to harmonize the measured and modeled values by calibration.
4.2.1 Control factors within the experiments
The availability of sufficient and suitable input data is necessary for the proper model estimations, and it is notable that some model parameters were not assessed in our experiments (e.g., labile C content, denitrifier biomass, anaerobicity of the soil) and also that the temporal and spatial resolution in the measurement of control factors such as mineral N and soil moisture was limited; including these may have improved model estimates. Within the sand incubation, another reason for the underestimations of denitrification products by Coup and DNDC could be properties of the soil itself. The soil had a low pH, which has a direct influence on denitrification processes (Leffelaar and Wessel, 1988). However, while the denitrification sub-module of DeNi is sensitive to changes in soil temperature, moisture, and SOC content, the pH of the soil only influences nitrification processes. Therefore, the low pH may have had less effect on the N2O flux estimation of DeNi, as compared to Coup and DNDC. Another reason for the smaller denitrification fluxes of Coup and DNDC could be the soil texture. Texture influences the hydrology, the anaerobe soil volume fraction (ansvf) and the diffusion of the gases, which altogether control denitrification processes (Smith et al., 2003). According to the water retention curve, the range of water contents in the incubation were located in a section of the curve where small changes in water potential could lead to large changes in WFPS (Fig. S4). In Coup and DNDC, WFPS has multiple effects on denitrification through respiration and diffusion processes. The challenge for these models is to describe these direct and indirect effects correctly to match the observed response of denitrification. Because DeNi does not use a fully-process-based approach, the effects of environmental factors – like WFPS – are considered with various empirical functions. We suspect that the use of empirical functions (functions derived from experimental lab data to describe WFPS) was more successful in modeling WFPS effects on denitrification than the fully-process-based approaches.
4.2.2 Complexity of model structure
Model structure and the complexity with which models are developed may have affected the accuracy of results. DNDC and Coup are complex, with more parameters and more elaborate descriptions of denitrification and decomposition than DeNi. However, using a detailed approach may allow some factors to dominate the denitrification calculations and give biased results (Metzger et al., 2016). For example, the almost-zero N2 emissions that DNDC estimated for both experiments may reflect how soil water is managed in the model. There is no option to manually enter daily soil water content, and the soil water management sub-module has been shown to be problematic (Smith et al., 2008, 2019; He et al., 2019, 2018; Brilli et al., 2017; Congreves et al., 2016; Dutta et al., 2016a; Cui et al., 2014; Abdalla et al., 2011; Uzoma et al., 2015; Deng et al., 2011). The DNDC model estimates of water in this study resulted in too much leachate in the first days of the simulations (data not shown) and could be the reason for the lower N2O and the almost-zero N2 production. Another issue with DNDC is response time. In theory, there should be a certain lag time between rainfall or irrigation and the occurrence of denitrification in the soil (Tiedje, 1978; Smith and Tiedje, 1979). DNDC ignores this lag time (Figs. 2c and 3c, day 25), and modeled N2 and N2O fluxes instead occurred almost immediately after the rewetting of the soil.
The simplicity of DeNi could be one reason why it had reasonably good success modeling the measured fluxes and also the treatment effects. The pure nitrification and denitrification approach of DeNi minimizes the influence of the complex sub-modules that are present in Coup and DNDC. Moreover, for DeNi, we were able to input measured daily water and soil content, which allowed those values to be more accurate than model estimates. Coup does have an option to overwrite the calculated daily water, which we used, but this option was not available for DNDC. The option to turn off sub-modules decreases the complexity of models in situations where that added complexity is not relevant or even problematic, as in the case of soil water mentioned above.
4.2.3 Labile organic carbon (litter)
The ryegrass treatment in the sandy soil was established to mimic incorporation of crop residues, a common field practice, and resulted in large amounts of labile organic C. Coup and DNDC provide options to modify the labile C and N pools, and in running these models, the C and N content of the ryegrass was added to the respective labile pools. DeNi has a simple soil respiration calculation, which is not dependent on a defined soil C pool, so the ryegrass treatment was added as a higher ratio. However, none of the models was able to handle the extremely fast decomposition from rapidly decomposable carbon (Figs. 2 and 3). Similar to CO2 fluxes, measured N fluxes in response to added ryegrass were significantly higher (668 % higher) than the modeled estimates, again highlighting that all of the models were too conservative.
In these models, decomposition processes are assumed to be driven by soil water content and temperature (Table S4). The microbial response to treatments (e.g., addition, pH), although they are known to influence microbial carbon use (Manzoni et al., 2012), is not explicitly simulated. It should also be noted that decomposition of the labile and recalcitrant pools in Coup and DNDC models is calculated independently. However, field and empirical data (Kuzyakov, 2010) suggest adding labile C could also enhance the decomposition of resistant pool, e.g., priming effects, which none of these models account for. Our results highlight the importance of better simulating microbial dynamics to better account for the drivers of decomposition, because these ultimately influence the denitrification flux estimations (Philippot et al., 2007). The direct application of these models with first-order kinetics for decomposition to simulate the effects of fertilization or changing N deposition on denitrification fluxes could be largely biased.
4.2.4 Denitrifiers
In Coup, the biomass of denitrifiers directly limits the maximum denitrification rate. We assume that the slow increase in fluxes obtained from Coup (Figs. 2b and 3b) was due to the modeled growth of denitrifiers, since the default setting assumed a low abundance of denitrifiers; hence, the denitrifiers had to first grow before reaching maximum denitrification rates (denitrifier growth was observed in the model output although these data were not shown). It can be concluded that when modeling denitrification in Coup, the model initialization must include inducement of denitrifier growth to match current soil conditions. Although our 3 d sampling interval was able to capture the rapid change in fluxes, to really fine-tune the initial activity after a disturbance (i.e., fertilizer addition), a higher frequency of measurements would be ideal.
The stepwise denitrification growth, death, and respiration for the N2O, NO and N2 approach in Coup were similar to DNDC; thus, they represent the highly complex end of the denitrification process, but the coefficients for these denitrifiers are obtained from culture studies over 30 years old. These coefficients in the denitrification sub-modules (Li et al., 1992) are not universal for different soils, as here a silt-loam soil and sandy soil show contrasting results, which means the microbial community needs specific calibration for each application. Large uncertainties in microbial coefficients must be addresses, as shown in Coup, where the denitrifier biomass was able to override the other known environmental factors for denitrification, leading to biased simulations.
4.2.5 Anaerobic soil volume fraction (ansvf)
DNDC and Coup use a similar calculation of the anaerobic soil volume fraction, and both models use it for the calculation of denitrification processes. While the ansvf estimations of DNDC were not available as an output, the Coup results were obtained and showed that ansvf was almost constant (ansvf was observed in the model output although these data were not shown). This is not plausible since the parameters affecting ansvf (diffusivity and O2 consumption), reflected in this study by soil moisture and respiration, changed significantly between treatments and experimental phases. The underestimation of N2 + N2O fluxes by Coup could therefore result from the inappropriate calculation of ansvf in the model (see in Sect. 4.2.4). The slow increase in the denitrifier biomass that Coup modeled in the silt-loam soil could be the reason that the modeled ansvf is orders of magnitude smaller than the ansvf measured in another silt-loam soil of similar WFPS (Rohe et al., 2021). This non-realistic, too small and slowly increased denitrifier community led therefore to low N2O and N2 fluxes. Ensuring correct ansvf calculations could significantly improve the efficiency of denitrification sub-modules, and thus further work on these algorithms within Coup is one area for future research that we would strongly recommend. Similarly, it would be beneficial to test the ansvf calculations of DNDC, which was not possible in our study, as the source code was not available and the ansvf is not included in output data.
In this study, we presented the N2, N2O and CO2 fluxes from two laboratory incubations, which explored the response of these fluxes to different control factors. In the silt-loam soil, the general trend of CO2 fluxes was a negative correlation with WFPS, while for N2 + N2O fluxes, together with the effect of increased BD, the correlation was positive. The lowest application resulted in the lowest N2 + N2O fluxes. In the sand soil, addition of ryegrass resulted in significantly higher CO2 and N2 + N2O fluxes as compared to control soils without ryegrass addition.
We suggest the following to improve targeted experimental studies for model developments:
-
design experiments to specifically evaluate sensitive input variables (e.g., decomposition of labile organic carbon);
-
take more frequent measurements during periods of suspected activity (ideally daily or more often); and
-
use updated techniques, such as He/O2 or 15N gas flux methods, to take measurements.
We suggest the following to improve models algorithms to reflect denitrification and decomposition:
-
address model complexity to facilitate modeling of all datasets;
-
add the missing priming effect of CO2 fluxes for the models;
-
calibrate denitrifier microbial dynamics; and
-
evaluate anaerobic soil volume concept, given the possibility of measured data.
We have shown that there are a number of possibilities in how experiments are designed and how models could be altered in order to improve denitrification and decomposition modeling. Further development of the models to overcome the identified limitations can largely improve the predicting power of the models. Models should then often be re-evaluated to keep them up to date with current research developments.
The codes and descriptions of the models are available from the authors on request.
The mesocosm experiment and the modeled gas flux data are available from the authors on request.
The supplement related to this article is available online at: https://doi.org/10.5194/bg-18-5681-2021-supplement.
JRK, SM and RW designed the Fuhrberg experiment. JRK and SM carried out the Fuhrberg experiment. BZ, RW and AR designed the Hattorf experiment. BZ and RW carried out the experiment. BG, RD, RW and HH designed the model application. HH, MIK and BG applied the Coup, DNDC and DeNi models. BG, AM, HH and RW prepared the manuscript with contributions from all co-authors.
The authors declare that they have no conflict of interest.
Publisher's note: Copernicus Publications remains neutral with regard to jurisdictional claims in published maps and institutional affiliations.
This study was funded by the Deutsche Forschungsgemeinschaft through the research unit DFG-FOR 2337: Denitrification in Agricultural Soils: Integrated Control and Modelling at Various Scales (DASIM). We thank the laboratory teams of the Institute of Soil Science and Centre for Stable Isotope Research and Analysis of Göttingen University as well as the Thünen Institute of Climate-Smart Agriculture, Braunschweig, for support in analysis and experiments regarding the Hattorf and Fuhrberg studies, respectively. Specifically, we thank Marrtina Heuer, Ute Rieß, Jennifer Giere, Reinhard Langel and Lars Szcwec for isotopic analyses; Ute Tambor, Sabine Watsack, Karin Schmidt and Ingrid Ostermeier for further analysis and sampling; and Stefan Burkart for supporting automated incubations. We further thank Christine von Buttlar, Ingenieurbüro Landwirtschaft und Umwelt (IGLU), Göttingen, for supporting the work at the Hattorf site.
This research has been supported by the Deutsche Forschungsgemeinschaft (grant no. DFG-FOR 2337).
This paper was edited by Akihiko Ito and reviewed by two anonymous referees.
Abdalla, M., Kumar, S., Jones, M., Burke, J., and Williams, M.: Testing DNDC model for simulating soil respiration and assessing the effects of climate change on the CO2 gas flux from Irish agriculture, Global Planet. Change, 78, 106–115, 2011.
Bijay-Singh, J. C., Ryden, A., and Whitehead, D. C.: Some relationships between denitrification potential and fractions of organic carbon in air-dried and filed-most soils, Soil Biol. Biochem., 20, 737–741, 1988.
Bollmann, A. and Conrad, R.: Acetylene blockage technique leads to underestimation of denitrification rates in oxic soils due to scavenging of intermediate nitric oxide, Soil Biol. Biochem., 29, 1067–1077, 1997.
Böttcher, J., Springob, G., and Duijnisveld, W. H. M.: Sandige Böden und deren Wasser- und Stoffhaushalt unter Acker und Nadelwald im Fuhrherger Feld, Mitteilungen der Deutschen bodenkundlichen Gesellschaft, Exkursionsfrüher, 90, 405–425, 1999.
Brilli, L., Bechini, L., Bindi, M., Carozzi, M., Cavalli, D., Conant, R., Dorich, C. D., Doro, L., Ehrhardt, F., Farina, R., Ferrise, R., Fitton, N., Francaviglia, R., Grace, P., Iocola, I., Klumpp, K., Léonard, J., Martin, R., Massad, R.S, Recous, S., Seddaiu, G., Sharp, J., Smith, P., Smith, W. N., Soussana, J. F., and Bellocchi, G. L.: Review and analysis of strengths and weaknesses of agro ecosystem models in representing C and N fluxes, Sci. Total Environ., 598, 445–470, 2017.
Buchen, C., Lewicka-Szczebak, D., Fuß, R., Helfrich, M., Flessa, H., and Well, R.: Fluxes of N2 and N2O and contributing processes in summer after grassland renewal and grassland conversion to maize cropping on a Plaggic Anthrosol and a Histic Gleysol, Soil Biol. Biochem., 101, 6–19, https://doi.org/10.1016/j.soilbio.2016.06.028, 2016.
Burford, J. R. and Bremner, J. M.: Relationships between the denitrification capacities of soils and total, water soluble, and readily decomposable soil organic matter, Soil Biol. Biochem., 19, 377–380, 1975.
Butterbach-Bahl, K., Baggs, E. M., Dannenmann, M., Kiese, R., and Zechmeister-Boltenstern, S.: Nitrous oxide emissions from soils: how well do we understand the processes and their controls?, Philos. T. Roy. Soc. B, 368, 20130122, https://doi.org/10.1098/rstb.2013.0122, 2013.
Cantazaro, J. B. D. and Beauchamp, E. G.: The effect of some carbon substrates on denitrification rates and carbon utilization in soil, Biol. Fert. Soils, 1, 183–187, 1985.
Cardenas, M. B. and Zlotnik. V. A.: Three-dimensional model of modern channel bend deposits, Water Resour. Res., 39, 1141, https://doi.org/10.1029/2002WR001383, 2003.
Chen, D., Li, Y., Grace, P., and Mosier, A.: N2O emissions from agricultural lands: a synthesis of simulation approaches, Plant Soil, 309, 169–189, 2008.
Congreves, K. A., Grant, B. B., Dutta, B., Smith, W. N., Chantigny, M. H., Rochette, P., and Desjardins, R. L.: Predicting ammonia volatilization from swine slurry application using DNDC: model development, Agr. Ecosyst. Environ., 219, 179–189, 2016.
Conrad, Y. and Fohrer, N.: Application of the Bayesian calibration methodology for the parameter estimation in CoupModel, Adv. Geosci., 21, 13–24, https://doi.org/10.5194/adgeo-21-13-2009, 2009.
Cui, F., Zheng, X., Liu, C., Wang, K., Zhou, Z., and Deng, J.: Assessing biogeochemical effects and best management practice for a wheat–maize cropping system using the DNDC model, Biogeosciences, 11, 91–107, https://doi.org/10.5194/bg-11-91-2014, 2014.
Davidson, E. A., Verchot, L. V., Cattanio, H., Ackerman, I. L., and Carvalho, J. E. M.: Effects of soil water content on soil respiration in forests and cattle pastures of eastern Amazonia, Biogeochemistry, 48, 53–69, https://doi.org/10.1023/A:1006204113917, 2000.
Deng, J., Zhu, B., Zhou, Z., Zheng, X., Li, C., Wang, T., and Tang, J.: Modeling nitrogen loadings from agricultural soils in southwest China with modified DNDC, J. Geophys. Res.-Biogeo., 116, G02020, https://doi.org/10.1029/2010JG001609, 2011.
DNDC Scientific Basis and Processes: Version 9.5, available at: https://www.dndc.sr.unh.edu/papers/DNDC_Scientific_Basis_and_Processes.pdf (last access: 25 January 2021), 2017.
Dutta, B., Smith, W. N., Grant, B. B., Pattey, E., Desjardins, R. L., and Li, C.: Model development in DNDC for the prediction of evapotranspiration and water use in temperate field cropping systems, Environ. Modell. Softw., 80, 9–25, 2016.
Galloway, J. N., Dentener, F. J., Capone, D. G., Boyer, E. W., Howarth, R. W., Seitzinger, S. P., Asner, G. P., Cleveland, C. C., Green, P. A., Holland, E. A., Karl, D. M., Michaels, A. F., Porter, J. H., Townsend, A. R., and Vörösmarty, C. J.: Nitrogen cycles: past, present, and future, Biogeochemistry, 70, 153–226, 2004.
Giltrap, D. L., Li, C., and Saggar, S.: DNDC: a process-based model of greenhouse gas fluxes from agricultural soils, Agr. Ecosyst. Environ., 136, 292–300, 2010.
Groffman, P. M. and Tiedje, J. M.: Denitrification hysteresis during wetting and drying cycles in soil, Soil Sci. Soc. Am. J., 52, 1626–1629, 1988.
Groffman, P. M., Altabet, M. A., Böhlke, J. K., Butterbach-Bahl, K., David, M. B., Firestone, M. K., Giblin, A. E., Kana, T. M., Nielsen, L. P., and Voytek, M. A.: Methods for measuring denitrification: diverse approaches to a difficult problem, Ecol. Appl., 16, 2091–2122, 2006.
Groffman, P. M., Butterbach-Bahl, K., Fulweiler, R. W., Gold, A. J., Morse, J. L., Stander, E. K., Tague, C., Tonitto, C., and Vidon, P.: Challenges to incorporating spatially and temporally explicit phenomena (hotspots and hot moments) in denitrification models, Biogeochemistry, 93, 49–77, https://doi.org/10.1007/s10533-008-9277-5, 2009.
Grosso, S. J. D., Parton, W. J., Mosier, A. R., Ojima, D. S., Kulmala, A. E., and Phongpan, S.: General model for N2O and N2 gas emissions from soils due to dentrification, Global Biogeochem. Cy., 14, 1045–1060, https://doi.org/10.1029/1999GB001225, 2000.
Grundmann, G. L. and Rolston, D. E.: A water function approximation to degree of anaerobiosis associated with denitrification, Soil Sci., 144, 437–441, 1987.
He, H., Jansson, P.-E., Svensson, M., Meyer, A., Klemedtsson, L., and Kasimir, Å.: Factors controlling Nitrous Oxide emission from a spruce forest ecosystem on drained organic soil, derived using the CoupModel, Ecol. Model., 321, 46–63, https://doi.org/10.1016/j.ecolmodel.2015.10.030, 2016.
He, W., Yang, J., Drury, C., Smith, W., Grant, B., He, P., Qian, B., Zhou, W., and Hoogenboom, G.: Estimating the impacts of climate change on crop yields and N2O emissions for conventional and no-tillage in Southwestern Ontario, Can. Agr. Syst., 159, 187–198, https://doi.org/10.1016/j.agsy.2017.01.025, 2018.
He, W., Grant, B.B, Smith, W. N., VanderZaag, A. C., Piquette, S., Qian, B., Jing, Q., Rennie, T. J., Bélanger, G., Jégo, G., and Deen, B.: Assessing alfalfa production under historical and future climate in eastern Canada: DNDC development and application, Environ. Modell. Softw., 122, 104540, https://doi.org/10.1016/j.envsoft.2019.104540, 2019.
Heinen, M.: Simplified denitrification models: overview and properties, Geoderma, 133, 444–463, 2006.
IUSS Working Group WRB: World Reference Base for Soil Resources 2014, update 2015, International soil classification system for naming soils and creating legends for soil maps, World Soil Resources Reports No. 106, FAO, Rome, 2015.
Jansson, P.-E. and Moon, D. S.: A coupled model of water, heat and mass transfer using object orientation to improve flexibility and functionality, Environ. Modell. Softw., 16, 37–46, 2001.
Jiang, Z., Yang, S., Ding, J., Sun, X., Chen, X., Liu, X., and Xu, J.: Modeling Climate Change Effects on Rice Yield and Soil Carbon under Variable Water and Nutrient Management, Sustainability, 13, 568, https://doi.org/10.3390/su13020568, 2021.
Kemmann, B., Wöhl, L., Fuß, R., Schrader, S., Well, R., and Ruf, T.: N2 and N2O mitigation potential of replacing maize with the perennial biomass crop Silphium perfoliatum–An incubation study, GCB Bioenergy, 13, 1649–1665, https://doi.org/10.1111/gcbb.12879, 2021.
Khalil, M. I. and Osborne, B.: Improving estimates of soil organic carbon (SOC) stocks and their long-term temporal changes in agricultural soils in Ireland, Geoderma, 322, 172–183, 2018.
Khalil, M. I., Abdalla, M., Lanigan, G., Osborne, B., and Müller, C.: Evaluation of parametric limitations in simulating greenhouse gas fluxes from Irish arable soils using three process-based models, Agricultural Sciences, Special Issue: Agricultural Systems Modelling, 7, 503–520, 2016.
Khalil, M. I., Fornara, D., and Osborne, B.: Simulation and validation of soil organic carbon density and its changes in a long-term permanent grassland of Ireland, Geoderma, 361, 114014, https://doi.org/10.1016/j.geoderma.2019, 2019.
Kurbatova, J., Li, C., Tatarinov, F., Varlagin, A., Shalukhina, N., and Olchev, A.: Modeling of the carbon dioxide fluxes in European Russia peat bogs, Environ. Res. Lett., 4, 045022, https://doi.org/10.1088/1748-9326/4/4/045022, 2009.
Kuzyakov, Y.: Priming effects: Interactions between living and dead organic matter, Soil Biol. Biochem., 42, 1363–1371, https://doi.org/10.1016/j.soilbio.2010.04.003, 2010.
Leffelaar, P. A.: Dynamics of partial anaerobiosis, denitrification, and water in a soil aggregate: simulation, Soil Sci., 146, 427–444, 1988.
Leffelaar, P. A. and Wessel, W. W.: Denitrification in a homogeneous, closed system: experiment and simulation, Soil Sci., 146, 335–349, 1988.
Lewicka-Szczebak, D., Well, R., Giesemann, A., Rohe, L., and Wolf, U.: An enhanced technique for automated determination of 15N signatures of N2, (N2 + N2O) and N2O in gas samples, Rapid Commun. Mass Sp., 27, 1548–1558, 2013.
Lewicka-Szczebak, D., Augustin, J., Giesemann, A., and Well, R.: Quantifying N2O reduction to N2 based on N2O isotopocules – validation with independent methods (helium incubation and 15N gas flux method), Biogeosciences, 14, 711–732, https://doi.org/10.5194/bg-14-711-2017, 2017.
Li, C., Frolking, S., and Frolking, T. A.: A model of nitrous oxide evolution from soil driven by rainfall events: 1. model structure and sensitivity, J. Geophys. Res.-Atmos., 97, 9759–9776, 1992.
Li, C., Narayanan, V., and Harriss, R. C.: Model estimates of nitrous oxide emissions from agricultural lands in the United States, Global Biogeochem. Cy., 10, 297–306, 1996.
Li, C. S., Frolking, S., and Harriss, R.: Modeling carbon biogeochemistry in agricultural soils, Global Biogeochem. Cy., 8, 237–254, 1994.
Li, C. S.: Quantifying greenhouse gas emissions from soils: Scientific basis and modeling approach, J. Soil Sci. Plant Nutr., 53, 344–352, https://doi.org/10.1111/j.1747-0765.2007.00133.x, 2007.
McCarty, G. W. and Bremner, J. M.: Factors affecting the availability of organic carbon for denitrification of nitrate in subsoils, Biol. Fert. Soils, 15, 132–136, 1993.
Manzoni, S., Taylor, P., Richter, A., Porporato, A., and Ågren. G. I.: Environmental and stoichiometric controls on microbial carbon-use efficiency in soils, New Phytol., 196, 79–91, https://doi.org/10.1111/j.1469-8137.2012.04225.x, 2012.
Merl, S.: Inkubationsversuch zur Quantifizierung von N2- und N2O-Emissionen aus einem sandigen Ackerboden unter variablem Einfluss von chemischen und physikalischen Kontrollfaktoren der Denitrifikation, Masterarbeit, Matrikelnummer: 4065499, Technische Universität Braunschweig, 2018.
Metzger, C., Nilsson, M. B., Peichl, M., and Jansson, P.-E.: Parameter interactions and sensitivity analysis for modelling carbon heat and water fluxes in a natural peatland, using CoupModel v5, Geosci. Model Dev., 9, 4313–4338, https://doi.org/10.5194/gmd-9-4313-2016, 2016.
Müller, C. and Clough, T. J.: Advances in understanding nitrogen flows and transformations: gaps and research pathways, J. Agr. Sci., 152, 34–44, 2014.
Nadeem, S., Dorsch, P., and Bakken, L. R.: Autoxidation and acetylene-accelerated oxidation of NO in a 2-phase system: Implications for the expression of denitrification in ex situ experiments, Soil Biol. Biochem., 57, 606–614, 2013.
Norman, J., Jansson, P-E., Farahbakhshazad, N., Butterbach-Bahl, K., Li, C., and Klemedtsson, L.: Simulation of NO and N2O emissions from a spruce forest during a freeze/thaw event using an N-flux submodel from the PnET-N-DNDC model integrated to CoupModel, Ecol. Model., 216, 18–30, https://doi.org/10.1016/j.ecolmodel.2008.04.012, 2008.
Nylinder, J., Stenberg, M., Jansson, P.-E., Klemedtsson, Å. K., Weslien, P., and Klemedtsson, L.: Modelling uncertainty for nitrate leaching and nitrous oxide emissions based on a Swedish field experiment with organic crop rotation. Agr. Ecosyst. Environ., 141, 167–183, https://doi.org/10.1016/j.agee.2011.02.027, 2011.
Parton, W. J., Mosier, A., Ojima, D. S., Valentine, D., Schimel, D., Weier, K. L., and Kulmala, A. E.: Generalized model for N2 and N2O production from nitrification and denitrification, Global Biogeochemical Cycles, 10, 401–412, 1996.
Peterjohn, W. T.: Denitrification: enzyme content and activity in desert soils, Soil Biol. Biochem., 23, 845–855, 1991.
Philippot, L., Hallin, S., and Schloter, M.: Ecology of denitrifying prokaryotes in agricultural soil Advances in Agronomy, Academic Press, 96, 249–305, https://doi.org/10.1016/S0065-2113(07)96003-4, 2007.
R Core Team: R: A language and environment for statistical computing, R Foundation for Statistical Computing, Vienna, Austria, available at: http://www.R-project.org/ (last access: 21 January 2021), 2013.
Rodrigo, A., Recous, S., Neel, C., and Mary, B.: Modelling temperature and moisture effects on C–N transformations in soils: comparison of nine models, Ecol. Model., 102, 325–339, 1997.
Rohe, L., Apelt, B., Vogel, H.-J., Well, R., Wu, G.-M., and Schlüter, S.: Denitrification in soil as a function of oxygen availability at the microscale, Biogeosciences, 18, 1185–1201, https://doi.org/10.5194/bg-18-1185-2021, 2021.
Säurich, A., Tiemeyer, B., Dettmann, U., and Don, A.: How do sand addition, soil moisture and nutrient status influence greenhouse gas fluxes from drained organic soils?, Soil Biol. Biochem., 135, 71–84, 2019.
Saxton, K. E. and Rawls, W. J.: Soil Water Characteristic Estimates by Texture and Organic Matter for Hydrologic Solutions, Soil Sci. Soc. Am. J., 70, 1569–1578, https://doi.org/10.2136/sssaj2005.0117, 2006.
Scheer, C., Fuchs, K., Pelster, D. E., and Butterbach-Bahl, K.: Estimating global terrestrial denitrification from measured product ratios, Curr. Opin. Env. Sust., 47, 72–80, 2020.
Schlüter, S., Henjes, S., Zawallich, J., Bergaust, L., Horn, M., Ippisch, O., Vogel, H.-J., and Dörsch, P.: Denitrification in Soil Aggregate Analogues-Effect of Aggregate Size and Oxygen Diffusion, Front. Environ. Sci., 6, 17, https://doi.org/10.3389/fenvs.2018.00017, 2018.
Schurgers, G., Dörsch, P., Bakken, L., Leffelaar, P., and Haugen, L. E.: Modelling soil anaerobiosis from water retention characteristics and soil respiration, Soil Biol. Biochem., 38, 2637–2644, 2006.
Senapati, N., Chabbi, A., Giostri, A. F., Yeluripati, J. B., and Smith, P.: Modelling nitrous oxide emissions from mown-grass and grain-cropping systems: Testing and sensitivity analysis of DailyDayCent using high frequency measurements, Sci. Total Environ., 572, 955–977, https://doi.org/10.1016/j.scitotenv.2016.07.226, 2016.
Senbayram, M., Well, R., Bol, R., Chadwick, D. R., Jones, D. L., and Wu, D.: Interaction of straw amendment and soil content controls fungal denitrification and denitrification product stoichiometry in a sandy soil, Soil Biol. Biochem., 126, 204–212, https://doi.org/10.1016/j.soilbio.2018.09.005, 2018.
Senbayram, M., Budai, A., Bol, R., Chadwick, D., Marton, L., Gündogan, R., and Wu, D.: Soil level and O2 availability are key factors in controlling N2O reduction to N2 following long-term liming of an acidic sandy soil, Soil Biol. Biochem., 132, 165–173, 2019.
Sgouridis, F., Stott, A., and Ullah, S.: Application of the 15N gas-flux method for measuring in situ N2 and N2O fluxes due to denitrification in natural and semi-natural terrestrial ecosystems and comparison with the acetylene inhibition technique, Biogeosciences, 13, 1821–1835, https://doi.org/10.5194/bg-13-1821-2016, 2016.
Simek, M. and Cooper, J. E.: The influence of soil pH on denitrification: progress towards the understanding of this interactionover the last 50 years, Eur. J. Soil Sci., 53, 345–354, 2002.
Simek, M. and Hopkins, D. W.: Regulation of potential denitrification by soil pH in long-term fertilized arable soils, Biol. Fert. Soils, 30, 41–47, 1999.
Singh, B.: The Nitrogen Cycle: Implications for Management, Soil Health, and Climate Change, Chapter 6, in: Soil Health and Climate Change, edited by: Singh, B., Cowie, A., and Chan, K., Springer-Verlag, Berlin Heidelberg, https://doi.org/10.1007/978-3-642-20256-8_6, 2011.
Smith, M. S. and Tiedje, J. M.: Phases of denitrification following oxygen depletion in soil, Soil Biol. Biochem., 11, 261–267, 1979.
Smith, K. A., Ball, T., Conen, F., Dobbie, K. E., Massheder, J., and Rey, A.: Exchange of greenhouse gases between soil and atmosphere: interactions of soil physical factors and biological processes, Eur. J. Soil Sci., 54, 779–791, https://doi.org/10.1046/j.1351-0754.2003.0567.x, 2003.
Smith, W. N., Grant, B. B., Desjardins, R. L., Rochette, P., Drury, C. F., and Li, C.: Evaluation of two process-based models to estimate soil N2O emissions in Eastern Canada, Can. J. Soil Sci., 88, 251–260, 2008.
Smith, W., Qi, Z., Grant, B., VanderZaag, A., and Desjardins, R.: Comparing hydrological frameworks for simulating crop biomass, water and nitrogen dynamics in a tile drained soybean-corn system: cascade vs computational approach, J. Hydrol. X, 2, 100015, https://doi.org/10.1016/j.hydroa.2018.100015, 2019.
Tiedje, J. M.: Denitrification in soil, in: Microbiology, edited by: Schlessinger, D., American Society of Microbiology, Washington, DC, 362–366, 1978.
Uzoma, K. C., Smith, W. N., Grant, B., Desjardins, R. L., Gao, X., Hanisb, K., Tenutab, M., Goglio, P., and Li, C.: Assessing the effects of agricultural management on nitrous oxide emissions using flux measurements and the CAN-DNDC model, Agr. Ecosyst. Environ., 206, 71–83, 2015.
Van Rossum, G. and Drake, F. L.: Python 3 Reference Manual, CreateSpace, Scotts Valley, CA, 2009.
Weier, K. L., Doran, J. W., and Walks, D. T.: Denitrification and the dinitrogen/nitrous oxide ratio as affected by soil water, available carbon, and nitrate, Soil Sci. Soc. Am. J., 57, 66–72, 1993.
Well, R. and Flessa, H.: Isotopologue signatures of N2O produced by denitrification in soils, J. Geophys. Res.-Biogeo., 114, G02020, https://doi.org/10.1029/2008JG000804, 2009.
Well, R., Becke, K.-W., Meyer, B., Langel, R., and Reineking, A.: Continuous flow equilibration for mass spectrometric analysis of dinitrogen emissions, Soil Sci. Soc. Am. J., 62, 906–910, https://doi.org/10.2136/sssaj1998.03615995006200040008x, 1998.
Well, R., Höper, H., Mehranfar, O., and Meyer, K.: Denitrification in the saturated zone of hydromorphic soils-laboratory measurement, regulating factors and stochastic modeling, Soil Biol. Biochem., 37, 1822–1836, 2005.
Well, R., Kurganova, I., de Gerenyu, V. L., and Flessa, H.: Isotopomer signatures of soil-emitted N2O under different moisture conditions – A microcosm study with arable loess soil, Soil Biol. Biochem., 38, 2923–2933, 2006.
Well, R., Maier, M., Lewicka-Szczebak, D., Köster, J.-R., and Ruoss, N.: Underestimation of denitrification rates from field application of the 15N gas flux method and its correction by gas diffusion modelling, Biogeosciences, 16, 2233–2246, https://doi.org/10.5194/bg-16-2233-2019, 2019.
Williams, T. and Kelley, C.: Gnuplot 5.2: an interactive plotting program, available at: http://gnuplot.sourceforge.net/docs_5.2/Gnuplot_5.2.pdf (last access: 21 January 2021), 2019.
Zaehle S.: Terrestrial nitrogen–carbon cycle interactions at the global scale, Philos. T. Roy. Soc. B, 368, 20130125, https://doi.org/10.1098/rstb.2013.0125, 2013.
Ziehmer, B.: Laboruntersuchungen zur Denitrifikation in der Ackerkrume einer Löss-Parabraunerde unter Temperatur- und Feuchtebedingungen des Winterhalbjahres, Bachelorarbeit, Georg-August Universität Göttingen, Fakultät für Agrarwissenschaften, 2006.