the Creative Commons Attribution 4.0 License.
the Creative Commons Attribution 4.0 License.
 | 04 Nov 2021
Phosphorus cycling in the upper waters of the Mediterranean Sea (PEACETIME cruise): relative contribution of external and internal sources
Elvira Pulido-Villena
Karine Desboeufs
Kahina Djaoudi
France Van Wambeke
Stéphanie Barrillon
Andrea Doglioli
Anne Petrenko
Vincent Taillandier
Franck Fu
Tiphanie Gaillard
Sophie Guasco
Sandra Nunige
Sylvain Triquet
Cécile Guieu
The study of phosphorus cycling in phosphate-depleted oceanic regions, such as the Mediterranean Sea, has long suffered from methodological limitations, leading to a simplistic view of a homogeneous surface phosphate pool with concentrations below the detection limit of measurement above the phosphacline. During the PEACETIME (Process studies at the air-sea interface after dust deposition in the Mediterranean Sea) cruise, carried out from 10 May to 11 June 2017, we conducted co-located measurements of phosphate pools at the nanomolar level, alkaline phosphatase activities and atmospheric deposition of phosphorus, across a longitudinal gradient from the west to the central Mediterranean Sea. In the phosphate-depleted layer (PDL), between the surface and the phosphacline, nanomolar phosphate was low and showed little variability across the transect spanning from 6 ± 1 nmol L−1 in the Ionian basin to 15 ± 4 nmol L−1 in the westernmost station. The low variability in phosphate concentration contrasted with that of alkaline phosphatase activity, which varied over 1 order of magnitude across the transect. Nanomolar phosphate data revealed gradients of phosphate concentration over density inside the PDL ranging between 10.6 ± 2.2 µmol kg−1 in the westernmost station to values close to zero towards the east. Using the density gradients, we estimated diapycnal fluxes of phosphate to the PDL and compared them to atmospheric deposition, another external source of phosphate to the PDL. Phosphate supply to the PDL from dry deposition and diapycnal fluxes was comparable in the western part of the transect. This result contrasts with the longtime idea that, under stratification conditions, the upper waters of the Mediterranean Sea receive new P almost exclusively from the atmosphere. The contribution of atmospheric deposition to external P supply increased under the occurrence of rain and Saharan dust. Although this finding must be taken cautiously given the uncertainties in the estimation of diapycnal fluxes, it opens exciting questions on the biogeochemical response of the Mediterranean Sea, and more generally of marine oligotrophic regions, to expected changes in atmospheric inputs and stratification regimes. Taken together, external sources of phosphate to the PDL contributed little to total phosphate requirements which were mainly sustained by in situ hydrolysis of dissolved organic phosphorus. The results obtained in this study show a highly dynamic phosphorus pool in the upper layer of the euphotic zone, above the phosphacline, and highlight the convenience of combining highly sensitive measurements and high-resolution sampling to precisely depict the shape of phosphate profiles in the euphotic zone with still unexplored consequences on P fluxes supplying this crucial layer for biogeochemical cycles.
- Article
(1151 KB) - Full-text XML
-
Supplement
(417 KB) - BibTeX
- EndNote


In the oligotrophic ocean, which covers > 60 % of the global ocean, biological activity and carbon export are constrained by nutrient availability. By controlling the efficiency of the biological pump, N and P determine the strength of the oceanic carbon uptake (Falkowski et al., 1998; Moore et al., 2013). Concentration of dissolved nutrients are kept low by microorganisms within the euphotic zone, and their replenishment is partly driven by the physical structure of the water column, which constrains vertical nutrient transport (Lewis et al., 1986). Vertical diapycnal fluxes supply nutrients from the ventilated nutrient-rich deep layers to the base of the euphotic layer sustaining production in subsurface waters, generally just below the pycnocline. However, the upper euphotic zone, above the pycnocline, has been traditionally seen as isolated from this nutrient supply from below. Consequently, vertical profiles of nutrients typically exhibit two layers: a so-called nutrient-depleted layer in which nutrient concentration approaches zero, spanning between the surface and the top of the nutricline; and a nutrient-repleted layer, across the nutricline to the bottom. Under the effects of global warming, stratification regimes may be globally modified mainly through enhanced density gradients at the base of the mixed layer depth. An increase in upper ocean stratification has recently been reported for the last half-century (Li et al., 2020), and although most models predict further increases at the global scale (Capotondi et al., 2012), regional differences may arise (Macias et al., 2015; Somavilla et al., 2017). In this context, it is crucial to accurately understand nutrient cycling in the surface oligotrophic ocean and to accurately quantify nutrient sources sustaining biological productivity and their evolution.
Phosphate plays a central role in the biogeochemical function of the ocean (Karl, 2014), and there is a growing awareness of its deficiency in certain oligotrophic regions in the North Atlantic Ocean and the North Pacific Ocean (Ammerman et al., 2003; Letelier et al., 2019; Martiny et al., 2019). In oceanic regions not limited by iron, P is commonly regarded as either the ultimate limiting nutrient, as any N deficit may be offset by N2 fixation (e.g., Moutin et al., 2008, 2018), or as a proximate limiting nutrient in regions such as the North Atlantic subtropical gyre (Wu et al., 2000) and the Mediterranean Sea (Mermex Group, 2011). The study of phosphate cycling in P-depleted oceanic regions has long suffered from methodological limitations, leading to a common view of a homogeneous surface phosphate pool with concentrations below the detection limit above the phosphacline. With the advent of sensitive techniques of analysis, this black box is being opened, revealing high spatial variability of surface phosphate concentration at nanomolar levels at both the regional scale (Wu et al., 2000; Djaoudi et al., 2018a) and global scale (Martiny et al., 2019). The increasing analytical accuracy has also allowed, for instance, the revelation of changes in phosphate concentration in response to external forcing such as dust deposition (e.g., Pulido-Villena et al., 2010; Mahaffey et al., 2014) or the characterization of the role of phosphate as a driver of ecosystem functioning (Martiny et al., 2019).
In P-deficient regions, dissolved organic phosphorus (DOP) constitutes an alternative source of phosphate for microorganisms (Karl, 2014). Most microorganisms synthesize one or more phosphohydrolytic enzymes in order to degrade selected DOP compounds for which the most commonly studied is alkaline phosphatase (AP). High AP activities have been typically reported in subtropical gyres of the North Atlantic (Mather et al., 2008; Lomas et al., 2010) and the North Pacific (Duhamel et al., 2011; Sato et al., 2013) as well as in the Mediterranean Sea (Sala et al., 2001; Van Wambeke et al., 2002), suggesting an active utilization of DOP by microorganisms when phosphate is scarce. However, the methodological limitations mentioned above have translated into insufficient concomitant measurements of AP activity and phosphate pools in the upper ocean (Hashihama et al., 2020), precluding an empirical assessment on the interplay between phosphate concentration and microbial P cycling.
The Mediterranean Sea shows a long summer stratification period, leading to relatively low nutrient concentrations and an overall phosphorus (P) deficit compared to nitrogen (N) evidenced by higher N : P than Redfield ratios of inorganic nutrients in deep layers (Krom et al., 2010; Pujo-Pay et al., 2011). These patterns are accentuated towards the east, translating into a marked longitudinal gradient of oligotrophy (Mermex Group, 2011). Mainly based on N excess relative to the Redfield ratio, the Mediterranean Sea has been generally considered a P-limited oceanic region (Krom et al., 2005, 2010). Actually, phytoplankton experiences N and P (co-)limitation (Tanaka et al., 2011), and heterotrophic prokaryotes are usually P-limited or co-limited by P and labile C (Van Wambeke et al., 2002). Recently, the use of highly sensitive phosphate measurements has revealed surface phosphate concentrations as low as 1 nM (Pulido-Villena et al., 2010; Djaoudi et al., 2018a), and high AP activity rates suggest an active microbial cycling of P (Van Wambeke et al., 2002).
The Mediterranean Sea continuously receives anthropogenic aerosols originating from industrial and domestic activities from all around the basin and other parts of Europe as well as a noticeable flux of dust from the Sahara (Mermex Group, 2011). Both anthropogenic and natural atmospheric deposition constitute a key external source of dissolved macronutrients such as P (Ridame and Guieu, 2002; Pulido-Villena et al., 2010) and N (Markaki et al., 2003) to Mediterranean surface waters. Climate change effects are predicted to play a prominent role in modifying the biogeochemical functioning of the Mediterranean Sea (Richon et al., 2019). Modifications in atmospheric deposition fluxes (Kanakidou et al., 2020) and in stratification regimes (Macias et al., 2015) will likely impact the phosphate supply to the mixed layer, with presumed consequences on microbial P cycling and productivity.
Here we present the first cross-basin simultaneous measurements of phosphate concentration at nanomolar level and alkaline phosphatase activities in the P-depleted upper waters of the Mediterranean Sea during the season characterized by strong stratification. We first explore the longitudinal trends of surface phosphorus cycling. We then estimate the contribution of vertical diffusion to the total supply of new P to the mixed layer, and we compare this source from below with phosphate fluxes from the atmosphere and from enzymatic hydrolysis of DOP.
2.1 Cruise overview and seawater sampling
This study was conducted as part of the PEACETIME cruise (https://doi.org/10.17600/17000300, French Oceanographic Cruises, 2017) on board the R/V Pourquoi Pas? in the Mediterranean Sea, from 10 May to 11 June 2017. A total of 13 stations were visited along a transect extending from the western basin to the center of the Ionian Sea (25∘ S, 115 E–15∘ S, 149∘ W; Fig. 1). For details on the cruise strategy, see Guieu et al. (2020b). For this study, 10 stations located across a longitudinal gradient were selected: ST4, ST9, ST10 and FAST were located in the Algerian basin; ST5, TYR and ST6 in the Tyrrhenian basin; and ST7, ST8 and ION in the Ionian basin (Fig. 1). All stations were sampled with both classical CTD rosette and TMC rosette (trace metal clean conditions). Stations FAST, TYR and ION were long-duration stations and were sampled several times during at least 4 d, with alternating CTD and TMC casts. For samples collected at these three long stations, only the first deployed CTD- and TMC-rosette casts were considered for this study. The long stations were sampled at high vertical resolution in the upper 200 m of the water column.
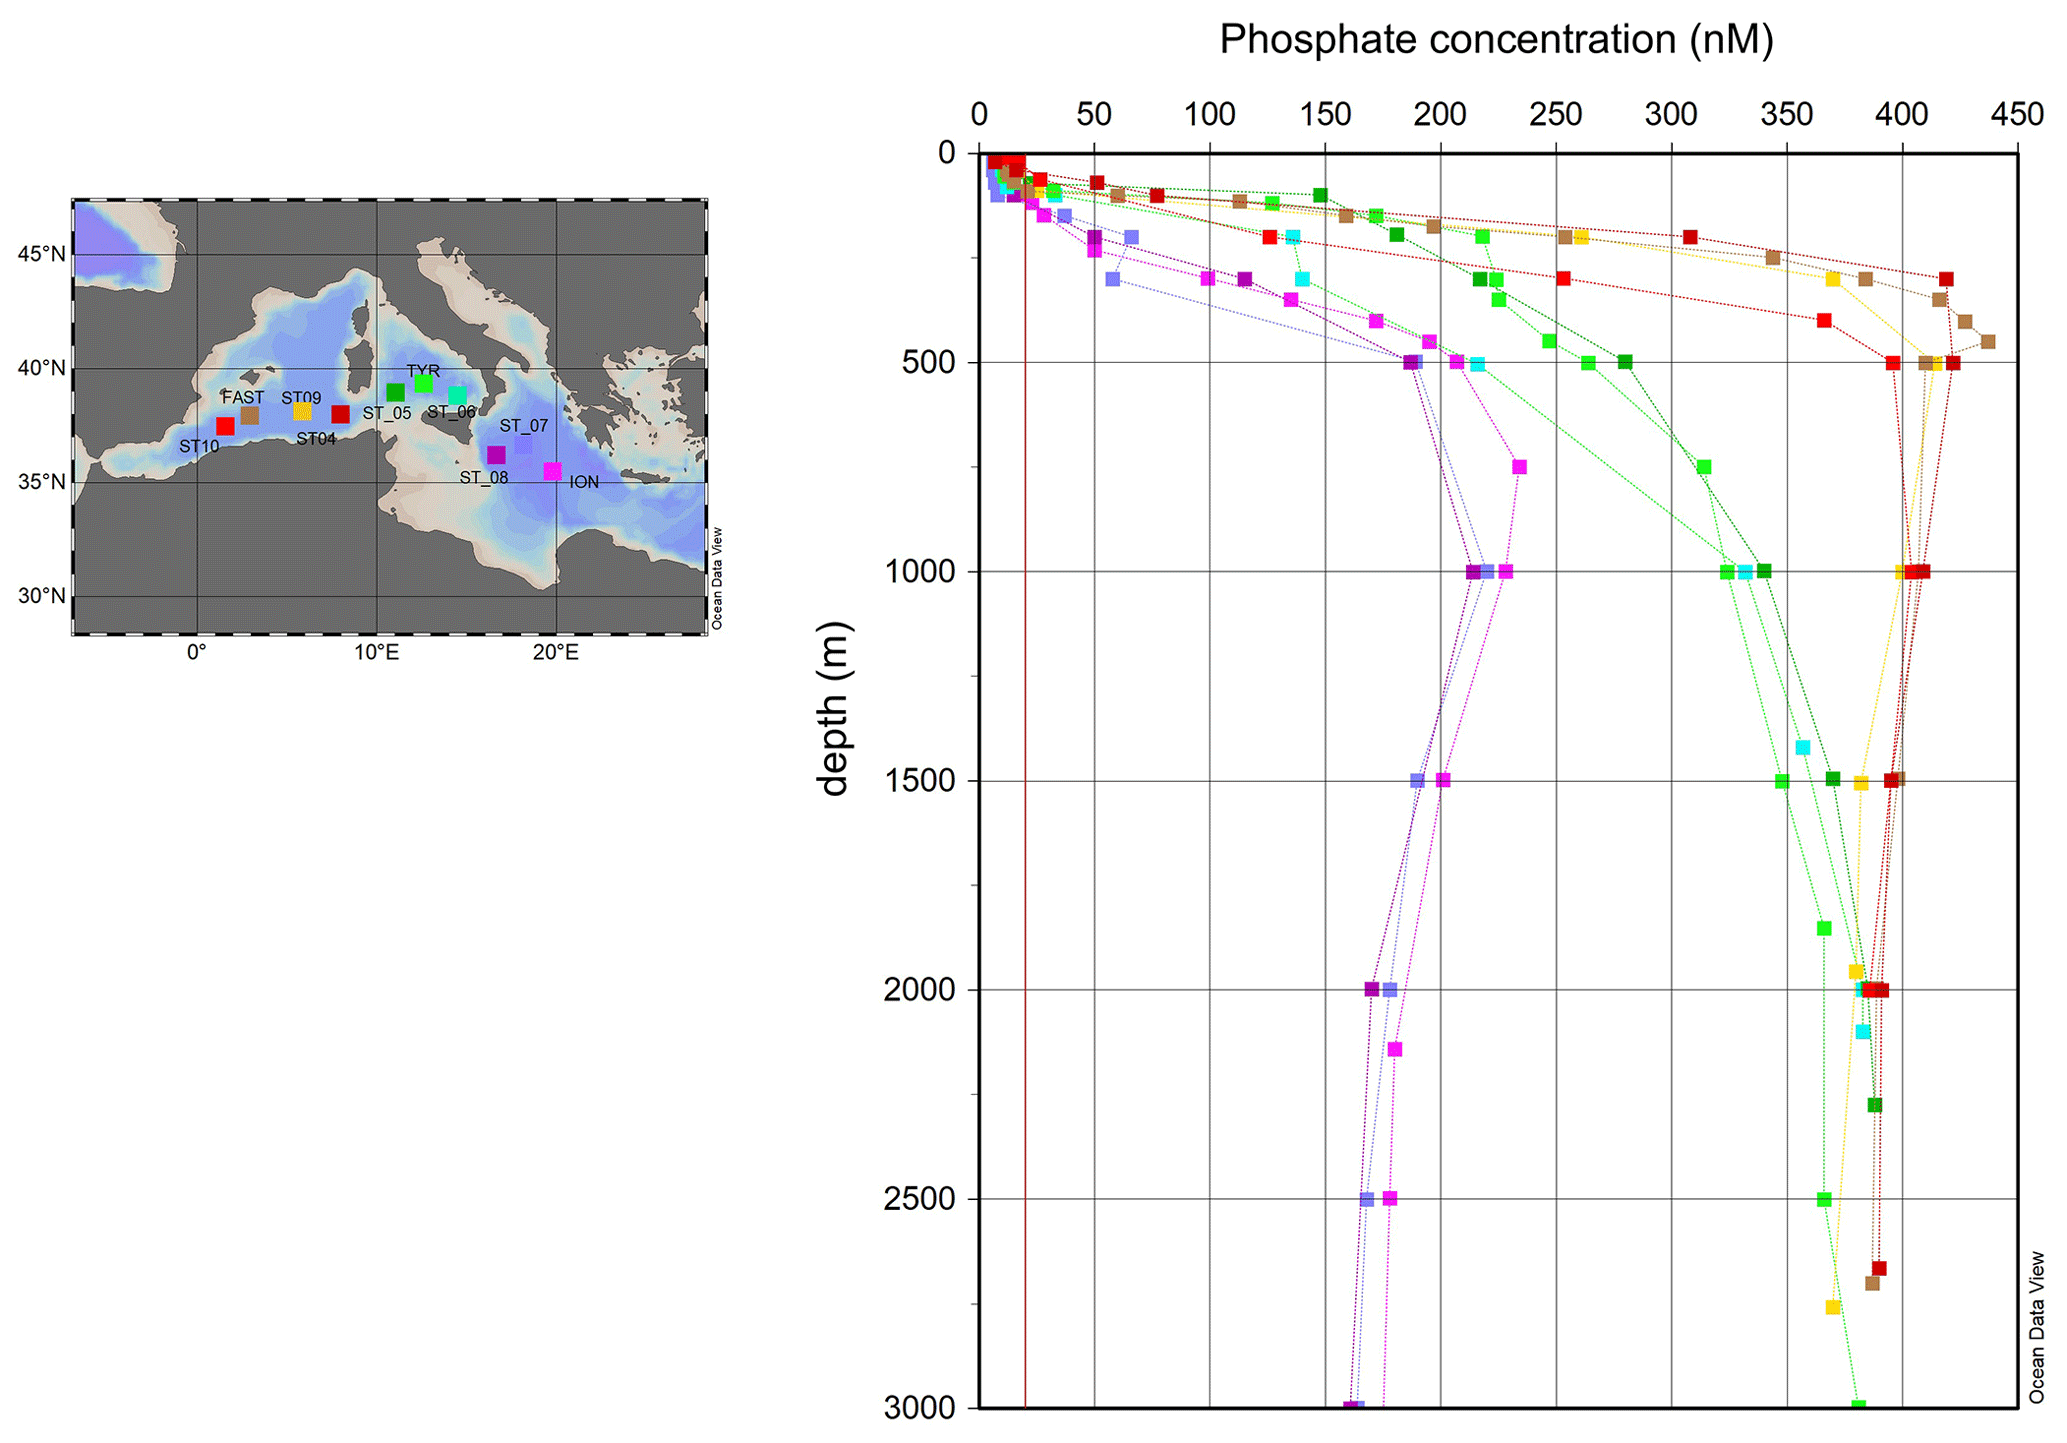
Figure 1Station location map and depth profiles of phosphate concentration (nM) between the surface and the bottom in the stations located in the Algerian basin (between 0 and 9∘ E), in the Tyrrhenian basin (between 10 and 15∘ E) and in the Ionian basin (beyond 15∘ E) (Schlitzer, R., Ocean Data View, https://odv.awi.de/, last access: 6 September 2021, 2021). As described in Sect. 2 (Material and methods), phosphate vertical profiles were built up from two datasets: one with phosphate concentration obtained through standard technique, with a limit of quantification of 0.02 µM (red line), and another one with phosphate concentration below 0.02 µM, obtained through the nanomolar LWCC technique.
Seawater samples for dissolved phosphorus analyses were collected from the TMC rosette between the surface and the bottom and filtered online through 0.2 µm (Sartorius Sartobran P®) into 60 mL high-density polyethylene (HDPE) bottles previously cleaned with hydrochloric acid (HCL) and ultrapure water. Seawater samples for alkaline phosphatase activity and particulate organic phosphorus (POP) were collected from the conventional CTD rosette at 5 m depth.
2.2 Dissolved and particulate phosphorus analysis
Dissolved inorganic phosphate (hereafter “phosphate”) was analyzed on board immediately after sampling using a segmented flow analyzer (AAIII HR Seal Analytical) according to Aminot and Kérouel (2007) with a limit of quantification (LoQ) of 0.02 µmol L−1. Samples with concentration below the LoQ were analyzed using the liquid waveguide capillary cell method (LWCC) according to Pulido-Villena et al. (2010). The LWCC was 2.5 m long, and the limit of detection was 1 nmol L−1. The analytical precision, estimated through repeated measurements of a surface seawater sample with a phosphate concentration of 11 nmol L−1, was 4.5 % (n=10).
Samples for dissolved organic phosphorus (DOP) were stored frozen until analysis back in the laboratory. After the cruise, samples for DOP were thawed at ambient temperature in the laboratory. Total dissolved phosphorus (TDP) was analyzed using the LWCC technique after UV digestion (Armstrong et al., 1966) during 3 h using a Metrohm® 705 UV digester. DOP was obtained by the difference between TDP and nanomolar phosphate. The efficiency of digestion was assessed using two 100 nmol L−1 solutions of glycerol phosphate and glucose phosphate and was 99 ± 1 % (n=6) and 100 ± 3 % (n=3), respectively. The efficiency of digestion on organic P compounds other than phosphoesters was not assessed in this study, although UV digestion has also proven to return complete hydrolysis of phosphonate compounds (Armstrong et al., 1966). However, it is true that UV digestion generally returns lower recoveries than chemistry-based oxidation methods (Karl and Björkman, 2015, and references therein), and, therefore, DOP measured in this study through UV digestion should be considered as a lower limit of ambient DOP concentration. Samples for particulate organic phosphorus (POP, 1.2 L) were filtered on board on pre-combusted (4 h, 450 ∘C) glass fiber filters (Whatman GF/F 47 mm). The filters were stored in cryotubes at −20 ∘C until analysis after the cruise. POP was converted to phosphate using the wet oxidation method based on a persulfate digestion at 120 ∘C (Raimbault et al., 1999) and analyzed using the segmented flow analyzer. The limit of detection, determined by analyzing 10 blank filters, was 1 nmol L−1.
2.3 Alkaline phosphatase activity measurements
Alkaline phosphatase (AP) activity was measured fluorometrically, using 4-methylumbelliferyl phosphate (MUF-P) as a fluorogenic model substrate (Hoppe, 1983). Stock solutions (5 mM) were prepared in methylcellosolve and stored at − 20 ∘C. The release of the product of hydrolysis, MUF, was followed by measuring the increase in fluorescence (excitation emission nm, wavelength width 5 nm) in a Varioskan LUX microplate reader. The instrument was calibrated with standards of MUF solution diluted in <0.2 µm filtered seawater. For measurements, 2 mL of unfiltered seawater samples were spiked with 100 µL of MUF-P solution diluted so that different concentrations (0.025–1 µM) were dispatched into a black 24-well polystyrene plate in duplicate. Incubations were run in the dark in thermostated incubators reproducing in situ temperature and lasted up to 24 h with a measurement of fluorescence every 1–3 h depending on expected activities. The rate was calculated from the linear part of the fluorescence versus time relationship.
The Michaelis–Menten parameters Vmax and Km were determined by fitting the data using a nonlinear regression on the equation
where V is the hydrolysis rate and S the concentration of MUF-P added.
The turnover time of the added substrate, MUF-P, was estimated by the Km:Vmax ratio.
2.4 Aerosol and rain sampling and analysis
Details on atmospheric sampling and analyses are given in three companion papers of this special issue (Van Wambeke et al., 2020, Desboeufs et al., 2021; Fu et al., 2021). A brief description is given hereafter.
The PEGASUS container was installed on board the R/V Pourquoi Pas? (Guieu et al., 2020b). Atmospheric aerosol sampling was performed using isokinetic and wind-oriented aerosol multi-samplers, enabling a sampling of particles with aerodynamic diameter inferior to 40 µm (Rajot et al., 2008). Aerosol particles were collected on 47 mm polycarbonate membranes of 0.4 µm pore size (Whatman Nuclepore TM) for nutrient measurements. The volume flow rate was set at 20 L min−1. All the filters were previously cleaned by immersion in ultrapure HCl (2 %) during 2 h and rinsing with ultrapure waters. A sampling strategy was specifically set up to avoid contamination from the ship's funnel. In total, 36 filters were collected: 17 filters during the stations and 19 underway. Five filter blanks were also prepared. Moreover, two wet deposition events were sampled on board during the cruise, one at ION and one at FAST. The rain sampling was conducted with an online filtration collector (0.2 µm), enabling the discrimination of the dissolved and particulate fractions of phosphorus.
Soluble-P concentration in aerosols was estimated after leaching the filters in ultrapure water. The leachate was then analyzed by high-resolution inductively coupled plasma mass spectrometry (HR-ICP-MS; Neptune Plus, Thermo Scientific ™) for total soluble-P concentrations. Dissolved inorganic phosphate concentration in the dissolved fraction of the two rain samples was measured by ion chromatography (Metrohm, model 850 Professional IC with Metrosep A Supp 7 column for anion measurements). Total dissolved phosphorus (TDP) concentration in rain was obtained by HR-ICP-MS. The atmospheric dissolved organic phosphorus (DOP) was estimated from the difference between TDP and dissolved inorganic phosphate.
2.5 Data analysis and calculations
2.5.1 Phosphacline and mixed layer depths
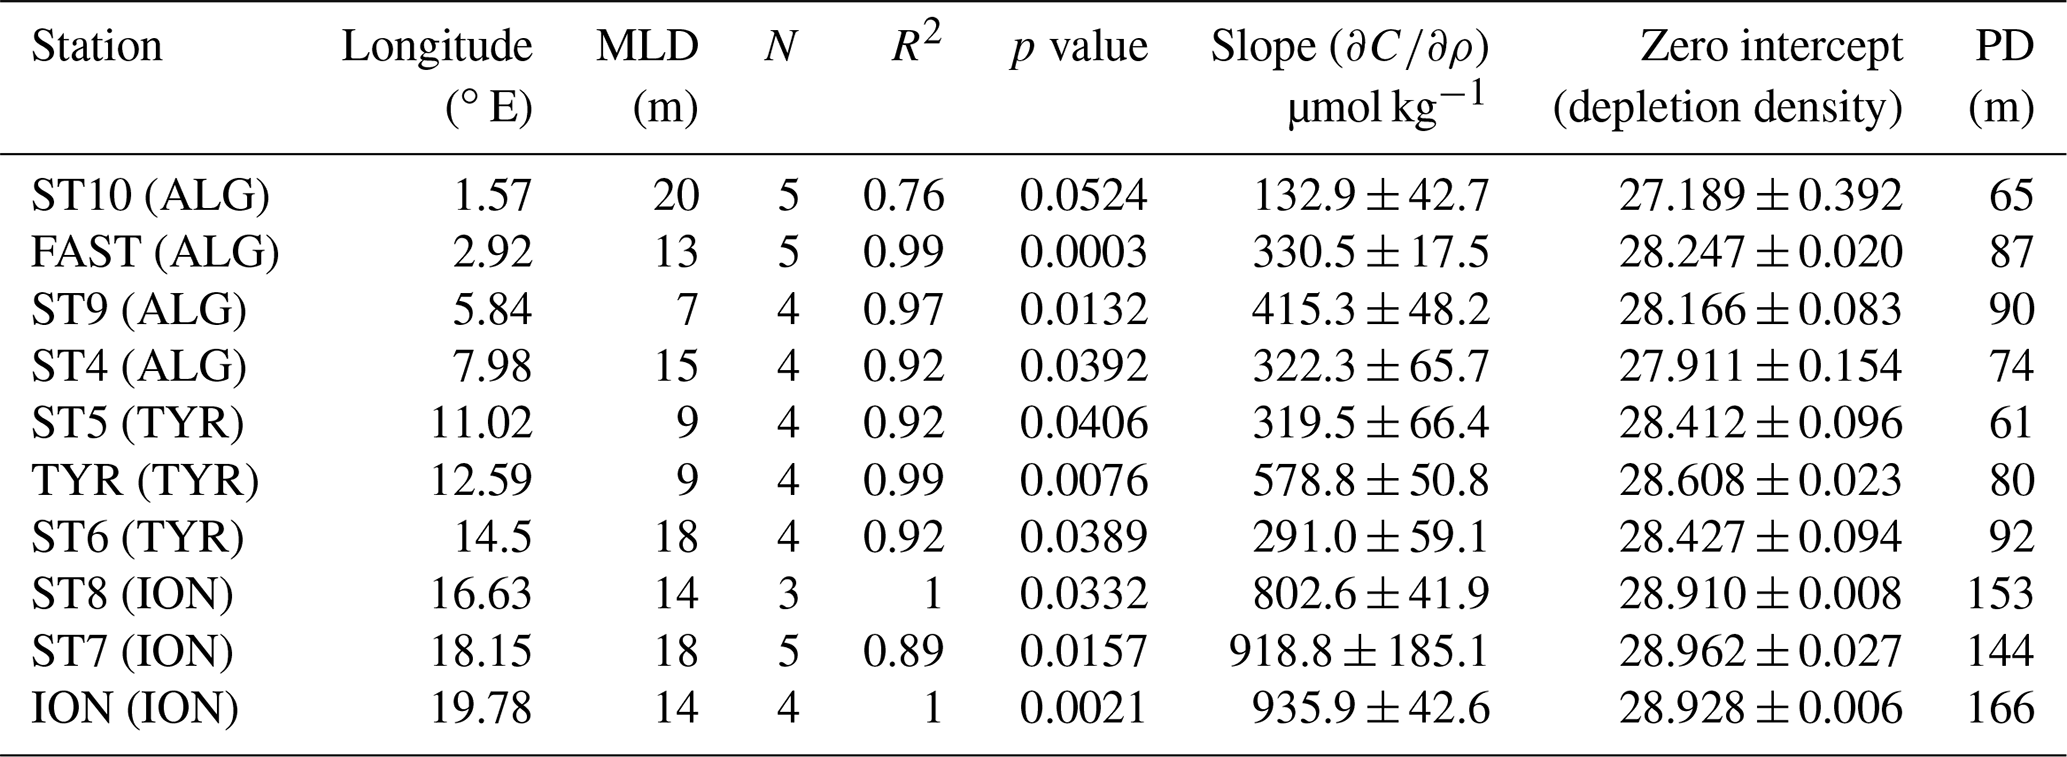
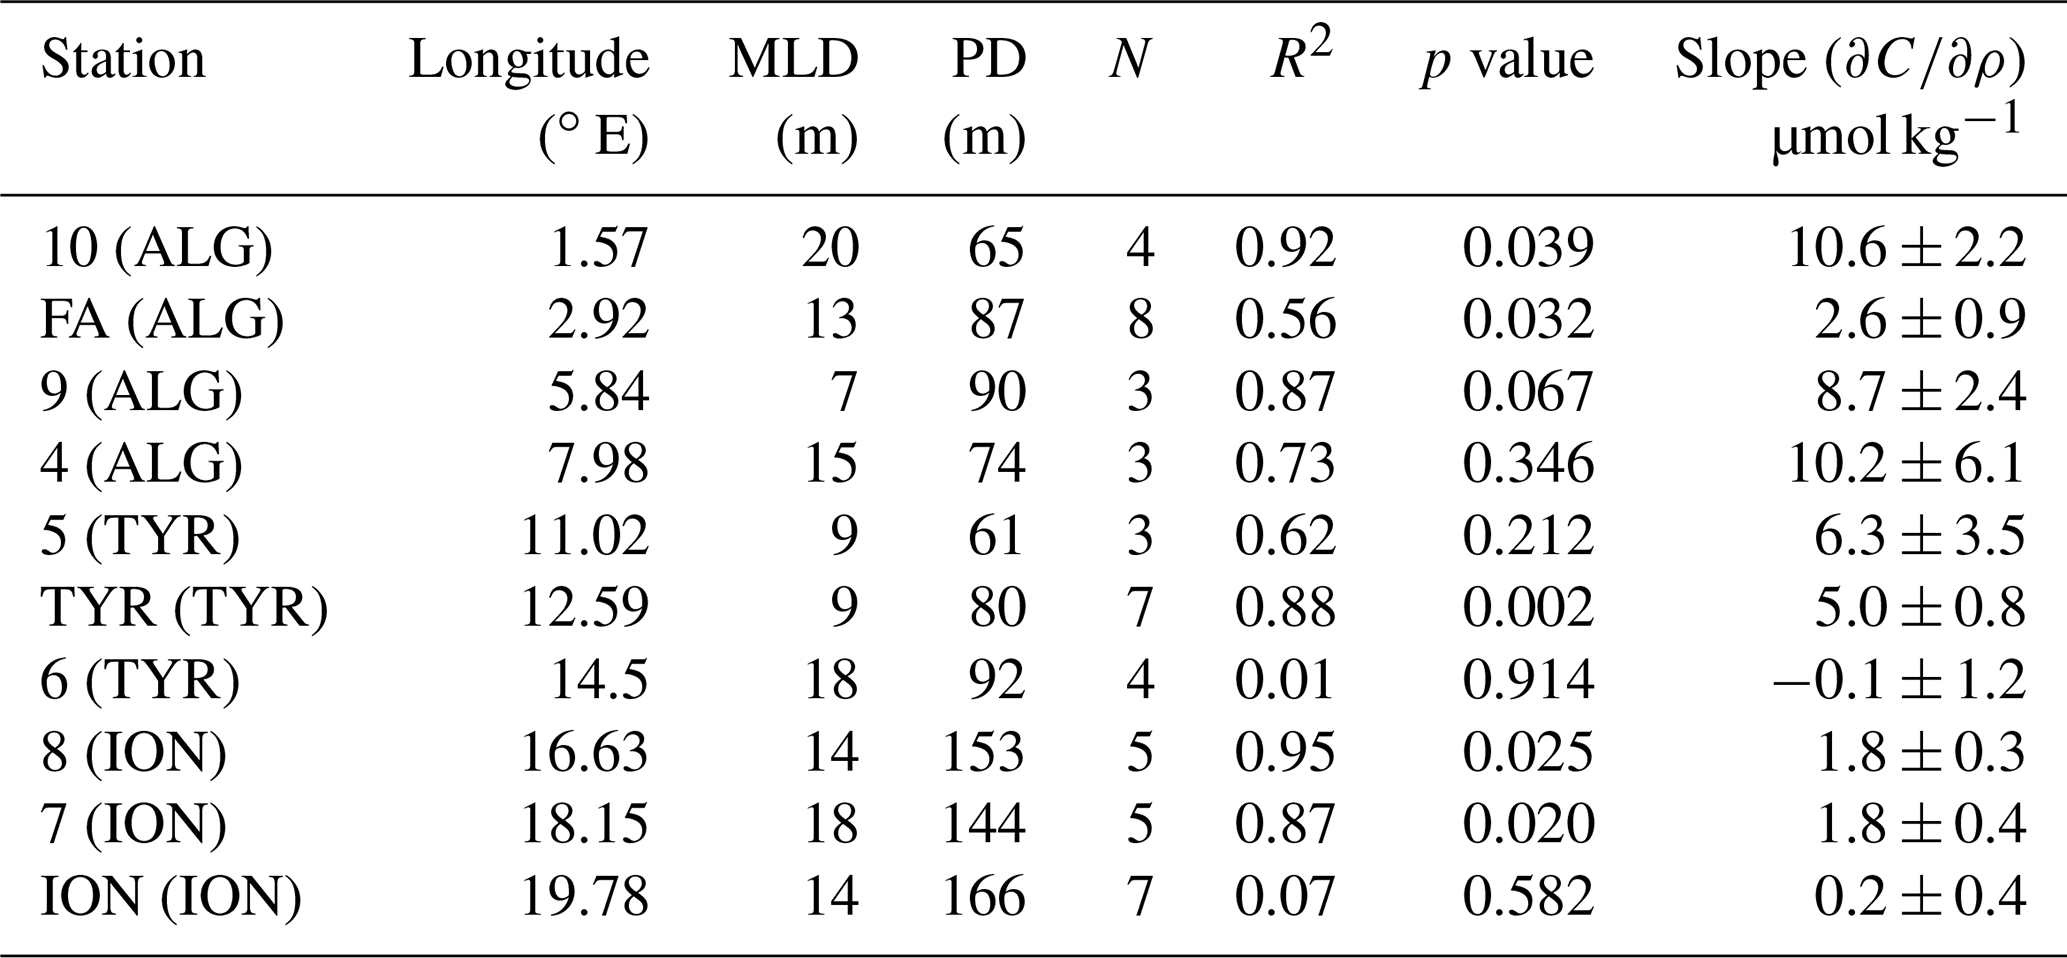
The phosphacline was defined for each station as the layer with maximum gradient of phosphate concentration versus density, computed as the highest significant slope of the linear fitting of DIP concentration as a function of density. The intercept of the regression line, the phosphate depletion density, which is the deepest isopycnal at which phosphate concentration is zero (Kamykowski and Zentara, 1986; Omand and Mahadevan, 2015), was used to estimate the phosphacline depth (Table 1).
Table 1Results of the linear fitting computed for each station between phosphate concentration and density at the layer showing the maximum gradient, indicative of the phosphacline. The phosphacline depth (PD) corresponds to the depletion density depth. Note that for ST10 the linear fitting was not significant (p>0.05), and obtained parameters (slope and zero intercept) must be taken with caution.
The mixed layer depth (MLD) was determined at every CTD cast as the depth where the residual mass content (i.e., the vertical integral of the density anomaly relative to surface) was equal to 1 kg m−2 (Prieur et al., 2020), with an error of estimation of 0.5 m relative to the vertical resolution of the profile (1 m).
2.5.2 Vertical fluxes of phosphate
The vertical fluxes of phosphate were estimated following Taillandier et al. (2020). In summary, vertical fluxes are parameterized as diapycnal diffusive fluxes, written as the product of the eddy vertical diffusivity (Kturb) and the vertical gradient in phosphate concentration (C):
The eddy vertical diffusivity was calculated using the Osborn's (1980) relationship with a constant mixing efficiency of 0.2:
where ε is the turbulent kinetic energy dissipation rate and N is the buoyancy frequency expressed as
where g is the gravitational constant and ρo the reference density of seawater.
Substituting Eq. (4) in Eq. (3) and then in Eq. (2), the vertical flux of phosphate is expressed as the product of ε and the gradient of phosphate concentration across isopycnals, obtained by linearly fitting phosphate concentrations versus density:
This formulation is considered to have a stronger temporal consistency in the density–nutrient relationship than in the depth–nutrient relationship (Omand and Mahadevan, 2015). During the PEACETIME cruise, there were no direct measurements of turbulent kinetic energy dissipation rates (ε). Therefore, to estimate the vertical fluxes of phosphate we relied on measurements reported by Cuypers et al. (2012) in the same area (6–10 10−9 W kg−1 for the 20–100 m layer). The uncertainties associated with such calculation will be further discussed.
2.5.3 Atmospheric deposition fluxes
Onboard aerosol characterization showed the predominance of background and anthropogenic aerosol along the cruise, except at FAST where a Saharan dust plume was sampled (Fu et al., 2021). Atmospheric dry deposition of soluble inorganic P was estimated using the soluble-P aerosol concentration multiplied by a dry settling velocity of 1 cm s−1, typical of anthropogenic aerosol particles and, exceptionally, of 3 cm s−1 at the FAST as this value is more adapted for Saharan events (Izquierdo et al., 2012). At each short-duration station (ST4, ST5, ST6, ST7, ST8, ST9 and ST10), soluble-P flux was determined from the filter sampled during the period of the occupation of the short station, ranging between 0.28 and 1.15 d. At the three long stations (FAST, TYR and ION), we used the aerosol filters collected during the periods comprising the CTD casts from which the P concentrations in the water column were measured.
The wet deposition P fluxes were estimated from the measured dissolved concentrations in the rain samples multiplied by the total precipitation accumulated during the period of the rain over the R/V location (Desboeufs et al., 2021). The total precipitation during the rain events was estimated from the hourly total precipitation accumulated on the grid point encompassing the R/V position from ERA5 data reanalysis. The accumulated rate was 3.5±1.2 mm at ION and 5.7±1.4 mm at FAST.
2.5.4 In situ AP hydrolysis rates
In situ hydrolysis rates for alkaline phosphatase (AP) were computed using an estimated in situ concentration of DOP hydrolyzable by AP (AP-DOP) as substrate concentration (S) in the Michaelis–Menten kinetic equation as follows:
AP-DOP concentration is usually measured as the increase in phosphate concentration after incubation of a seawater sample with a purified alkaline phosphatase (Hashihama et al., 2013). Therefore, it is used as an estimate of phosphate monoesters (Yamaguchi et al., 2019). In the absence of AP-DOP measurements in this study, we assumed a contribution of AP-DOP to total DOP of 31±18 % (n=36), an average value previously measured in the study region (Djaoudi et al., 2018b, and unpublished data) following the Hashihama et al. (2013) method.
3.1 Biogeochemical features of the phosphorus pool
Figure 1 shows phosphate vertical profiles from the surface to the bottom at the 10 visited stations across a longitudinal gradient from 1.6∘ E (ST10) to 19.8∘ E (ION). Phosphate vertical profiles exhibited two characteristic layers in all sampled stations: a phosphate-depleted layer (hereafter PDL), from the surface to the upper boundary of the phosphacline, and a phosphate-repleted layer (hereafter PRL), below the phosphacline (Fig. 1).
Phosphate concentration in the PRL, measured through the standard technique, ranged from 0.40 ± 0.02 µmol L−1 in the Algerian basin (ST10, FAST, ST9 and ST4) to 0.35 ± 0.04 µmol L−1 in the Tyrrhenian basin (ST5, TYR and ST6) and 0.18 ± 0.03 µmol L−1 in the Ionian basin (ST8, ST7 and ION) (Fig. 1). The maximum gradient of phosphate concentration versus density, indicative of the phosphacline, ranged from 356 ± 51 µmol kg−1 in the Algerian basin and 396 ± 159 µmol kg−1 in the Tyrrhenian basin to 886 ± 73 µmol kg−1 in the Ionian basin (Table 1). The phosphacline depth showed similar values in the Algerian and Tyrrhenian basins (between 61 m at ST5 and 90 m in ST9) and was higher than 120 m in the Ionian basin (Table 1, Fig. 2a).
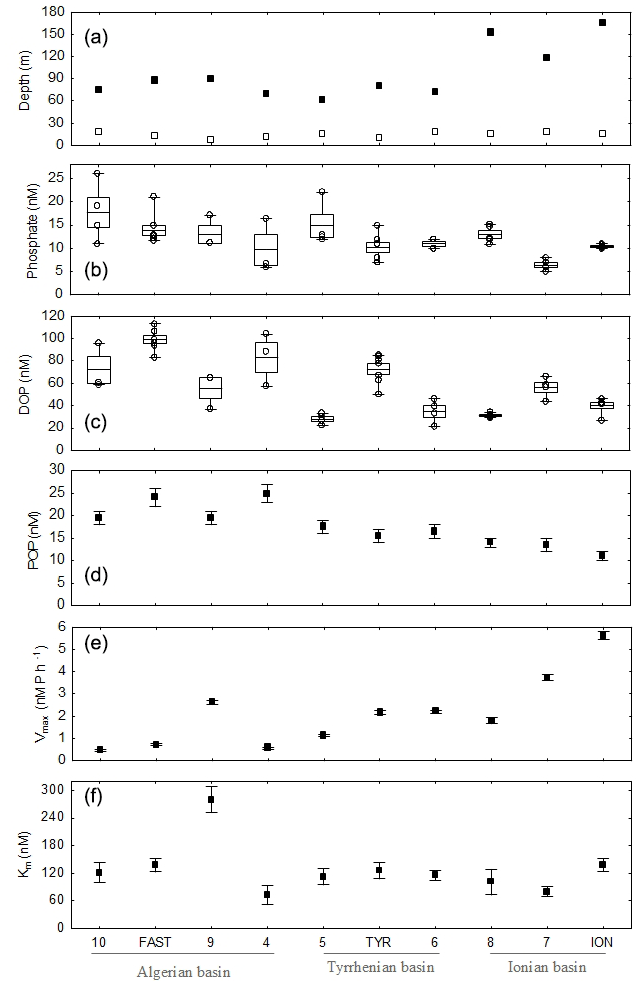
Figure 2Depth of the mixed layer (empty symbols) and the phosphacline (filled symbols; see Sect. 2.5 for details on the calculations) across the transect (a). Longitudinal variability inside the phosphate-depleted layer of phosphate concentration (b), DOP concentration (c), particulate organic phosphorus (d), and AP Michaelis–Menten parameters Vmax and Km (e,f). Phosphate and DOP data are represented as box plots (average, standard error and min–max values inside the PDL) as well as raw data (empty symbols). For POP, Vmax and Km, data shown were measured at 5 m depth, and error bars correspond to measurement precision (POP) and fitting model standard errors (Vmax and Km).
At all sampled stations, phosphate concentration in the PDL fell below the limit of detection of the standard technique, ranging from 6 ± 1 nmol L−1 in ST7 in the Ionian basin to 15 ± 4 nmol L−1 in the westernmost station, ST10 (Fig. 2b, Table 2). Dissolved organic phosphorus (DOP) in the PDL showed minimum values at ST5, ST8 and ION, in the central and eastern part of the transect (30 ± 3 nmol L−1, 31 ± 2 nmol L−1 and 36 ± 10 nmol L−1, respectively, Fig. 2c), and the highest DOP concentration was observed at FAST (100 nM, Fig. 2c, Table 2). DOP represented between 70 % and 89 % of the total dissolved phosphorus pool with no particular trend across the transect. Particulate organic phosphorus (POP) in the PDL, measured at 5 m depth, decreased towards the east and ranged between 25 ± 2 nM at ST5 and 11 ± 1 nM at ION (Fig. 2e, Table 2). POP and, to a lesser extent, phosphate and DOP concentration showed a decreasing trend towards the east (Table 3).
Table 2Summary of biogeochemical features of the phosphorus pool inside the phosphate-depleted layer at each investigated station. See Table 1 and text (Sect. 2.5) for details on the calculation of the phosphacline depth (PD).
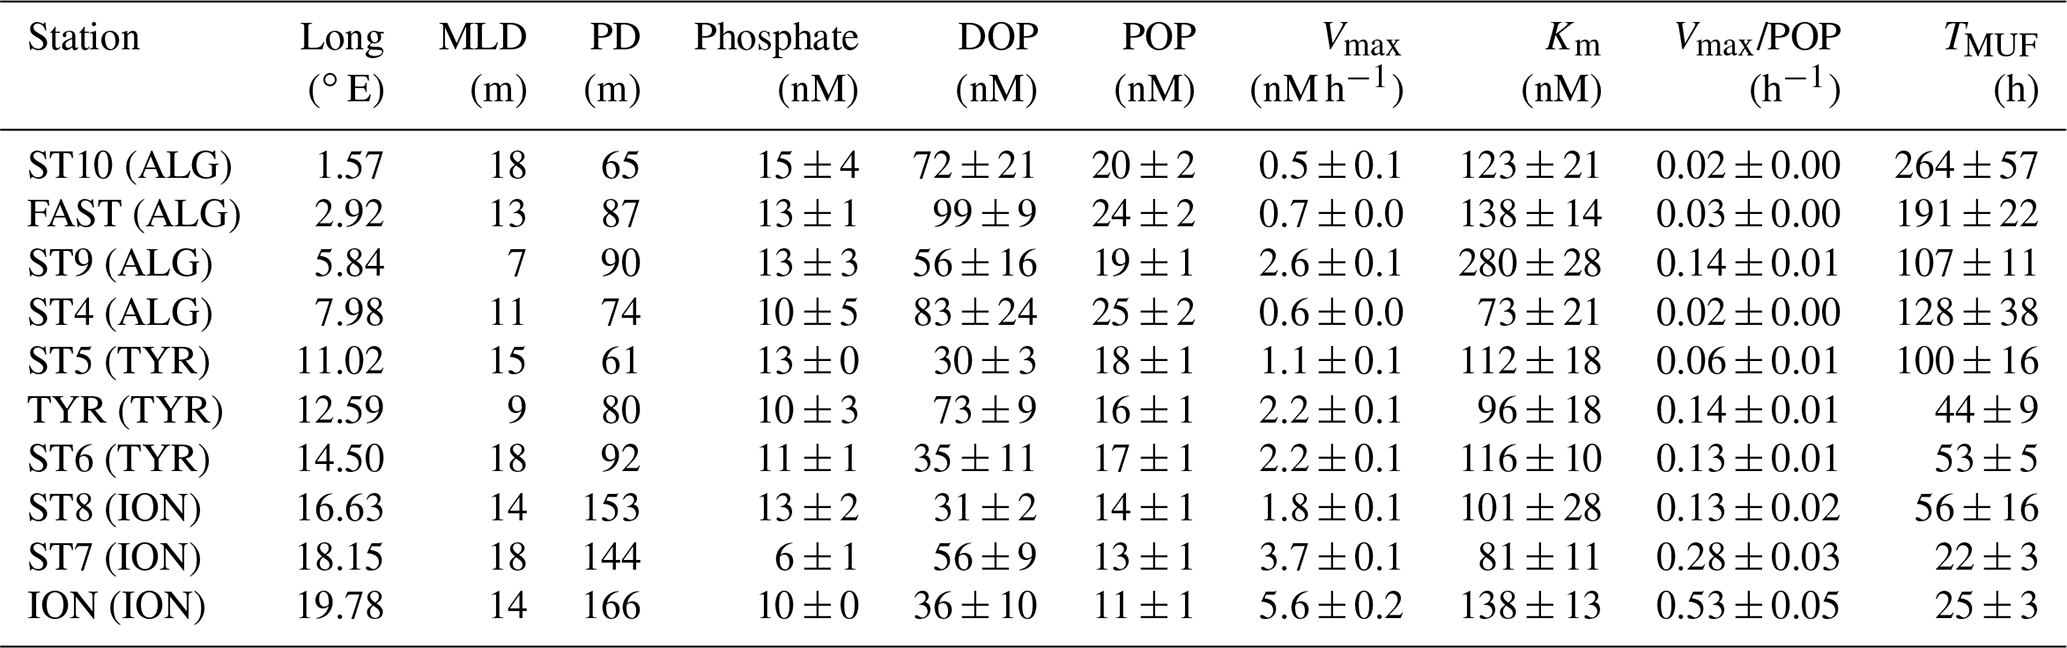
Table 3Results of the linear fitting computed for each station between phosphate concentration and density at the phosphate-depleted layer (between the surface and the phosphacline). The slope of the regression line corresponds to the gradient in phosphate concentration over density inside the PDL.
A full description of alkaline phosphatase (AP) rates and corresponding Michaelis–Menten kinetics is detailed in Van Wambeke et al. (2021). Across the longitudinal gradient (Fig. 1), AP maximum hydrolysis rates (Vmax) at 5 m depth increased steadily toward the east (from 0.5 ± 0.1 nmol P L−1 h−1 to 5.6 ± 0.2 nmol P L−1 h−1 (Fig. 2e, Table 2) with a mean value of 2.1 ± 1.6 nmol P L−1 h−1. The AP half-saturation constant (Km) showed no longitudinal trend ranging from 73 ± 21 nM (ST4) to 280 ± 28 nM (ST9) (Fig. 2f, Table 2). Turnover time of spiked DOP substrate, MUF-P (TMUF), ranged between 22 (ST7) and 246 h (ST10). AP Vmax normalized by POP (AP-POP) ranged between 0.02 h−1 in the Algerian basin (ST4) and 0.51 h−1 in the Ionian basin (ION) (Table 2). Both AP-POP and TMUF exhibited a significant longitudinal trend but with no correlation with phosphate or DOP concentration (Table 4).
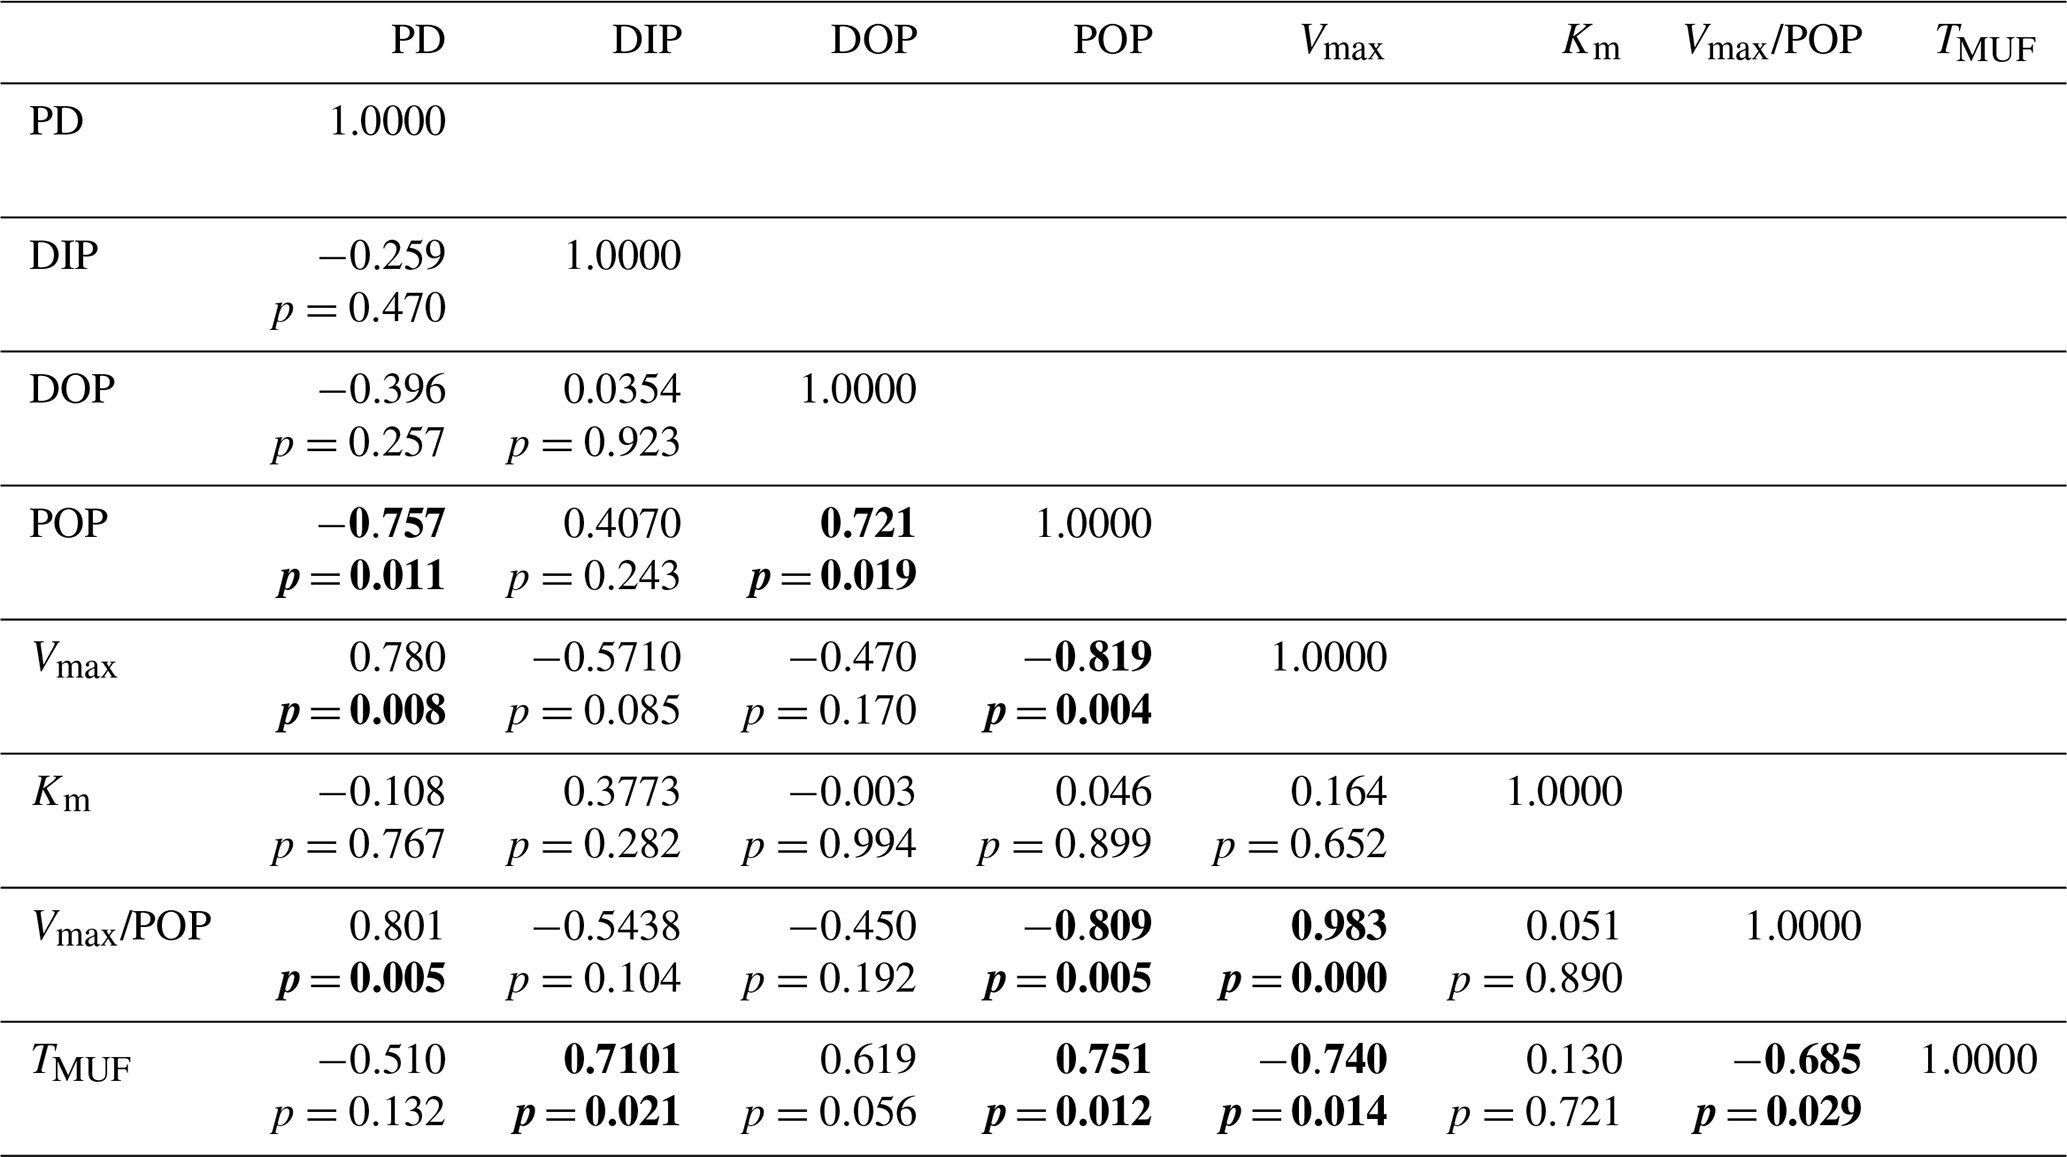
Table 4Pearson correlation coefficients among biogeochemical variables related to the phosphorus pool inside the phosphate-depleted layer (n=10). PD: phosphacline depth. DIP: dissolved inorganic phosphate concentration. DOP: dissolved organic phosphorus. POP: particulate organic phosphorus. Vmax: AP maximum hydrolysis velocity. Km: AP Michaelis–Menten half-saturation constant. Vmax/POP: AP maximum hydrolysis velocity normalized to POP. TMUF: turnover time of the spiked DOP substrate, MUF-P. Significant correlations at p<0.05 are highlighted in bold.
3.2 Vertical distribution and gradient of phosphate concentration versus density in the phosphate-depleted layer
Nanomolar phosphate data revealed differences among stations in the vertical distribution of phosphate concentration in the PDL (Fig. 2b). In the Ionian basin, phosphate concentration was rather constant between the surface and the phosphacline (average CV 14 %) and more variable in the Tyrrhenian (24 %) and Algerian (32 %) basins. Vertical profiles showed increasing phosphate concentrations with depth from the surface to the upper bound of the phosphacline (Fig. 1 in the Supplement). Indeed, phosphate concentration in the PDL showed a linear relationship with density in most sampled stations of the transect (Fig. 3, Table 3, Fig. S1). The exceptions to this linear relationship were (1) ST6 and ION, where the slope of the regression line (i.e., gradient of phosphate concentration over density, ) was not significantly different from zero, and (2) ST4 and ST5, where an increase in phosphate with density was observed although it was not linear (Fig. S1). The case of the easternmost station, ION, deserves further attention. In this station, the PDL was divided in two sub-layers: a first layer between the surface and 66 m depth, where phosphate concentration was low and homogeneous and no was observed; and a second layer, between 66 m and the top of the phosphacline (166 m), where DIP concentrations were still low (below 30 nM) but with a of 143 ± 26 µmol kg−1 above the maximum gradient indicative of the phosphacline (936 ± 43 µmol kg−1) (Fig. 3c, Table 1; Table 3).
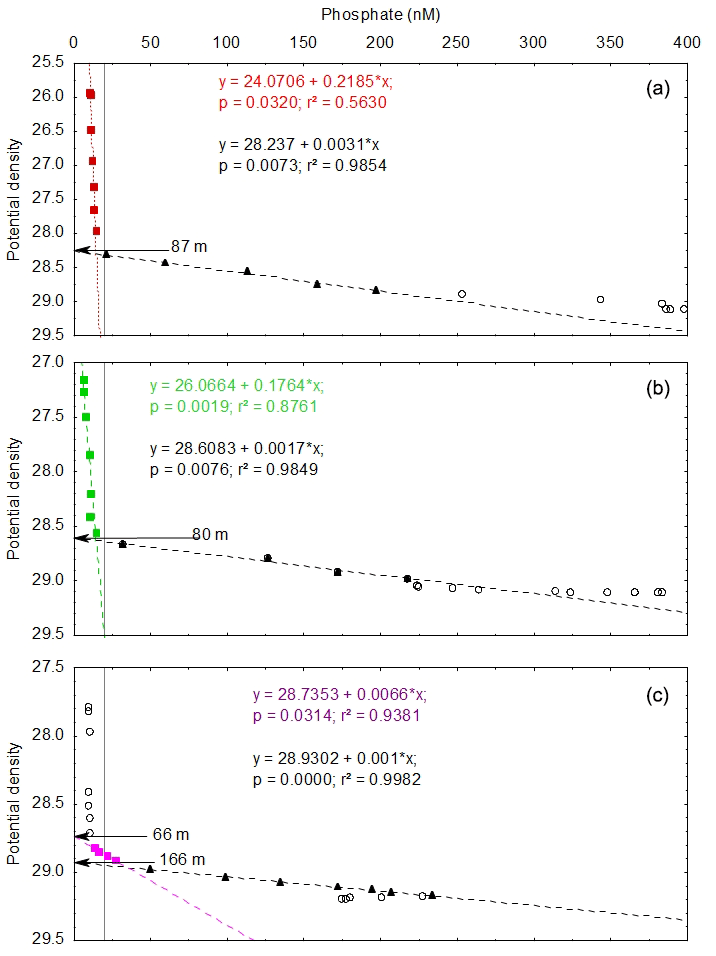
Figure 3Diagrams of phosphate concentration versus density at FAST (a), TYR (b) and ION (c) from the surface to the bottom and linear regressions between phosphate concentration and density through the phosphacline (black symbols) and inside the PDL (colored symbols). Results of the regression analyses can be found in Table 2, and plots from short stations can be found in Fig. S1. Vertical gray lines mark the threshold between the nanomolar and micromolar phosphate dataset (phosphate concentration =20 nM).
The gradient of phosphate concentration over density () inside the PDL ranged from 10.6 ± 2.2 µmol kg−1 in ST10 (Algerian basin) to undetectable values in ST6 and ION (Table 3). inside the PDL decreased significantly with longitude (, p<0.05, n=10) and was negatively correlated with the phosphacline depth (, p<0.05, n=10). inside the PDL was 2 orders of magnitude lower than across the phosphacline (Table 1).
3.3 Phosphate fluxes to the phosphate-depleted layer
Data obtained during the cruise allowed the estimation of three phosphate fluxes supplying the PDL: two external, diapycnal and atmospheric fluxes, and one internal through the enzymatic hydrolysis of DOP.
Using the measured gradients of phosphate concentration over density inside the PDL (Table 1) and reported values of turbulent kinetic energy dissipation rate (ε) for the Mediterranean Sea (see Sect. 2.5), we estimated diapycnal fluxes of phosphate (F) to the PDL. They ranged between 0 in ST6 and ION (where phosphate concentration inside the PDL was homogeneous and no gradient was observed) and 0.16 ± 0.09 µmol P m−2 d−1 at ST4 in the Algerian basin (Fig. 4). Fluxes across the phosphacline, also computed as described in Sect. 2.5, ranged between 4.5 and 14.4 µmol m−2 d−1.

Figure 4Phosphate fluxes (µmol m−2 d−1, logarithmic scale) supplying the mixed layer across the study stations arranged longitudinally: diapycnal fluxes inside the PDL, total (dry plus wet) atmospheric deposition and DOP in situ hydrolysis. Estimated total phosphate requirements (TPRs) are depicted for comparison (see text and Tables S1 and S2 for details).
Soluble-phosphate fluxes derived from dry atmospheric deposition at each station (see Sect. 2.2) were highly variable across the transect with values ranging between 0.027 ± 0.012 µmol m−2 d−1 (ST10) and 0.995 ± 0.050 µmol m−2 d−1 (FAST) during a Saharan dust event (Fu et al., 2021) (Table S1, Fig. 4). In addition, the two rain events sampled at ION and FAST contributed an additional dissolved phosphate wet deposition of 0.663 ± 0.227 and 1.146 ± 0.290 µmol P m−2 d−1, respectively (Desboeufs et al., 2021).
In situ DOP hydrolysis fluxes by alkaline phosphatase computed using Michaelis–Menten kinetics as defined in Sect. 2.5, integrated over the mixed layer, increased eastwards across the transect from minimum values of 17 µmol m−2 d−1 at ST9 to maxima of 295 µmol m−2 d−1 at ST7 (Fig. 4).
4.1 Regional patterns of P cycling
The advent of highly sensitive nanomolar techniques for determining oceanic phosphate has improved our view of phosphate stocks and fluxes in the surface waters of the oligotrophic ocean (Wu et al., 2000; Mather et al., 2008; Letelier et al., 2019). Indeed, traditionally seen as an invariant pool, surface phosphate has recently revealed crucial spatial and temporal patterns with still poorly known impacts on ocean biogeochemistry (Pulido-Villena et al., 2010; Djaoudi et al., 2018a; Martiny et al., 2019). In this study, surface nanomolar phosphate data provided new insights on the phosphorus cycle in upper P-depleted waters of the Mediterranean Sea.
The increasing oligotrophy toward the east is a seminal feature of the Mediterranean biogeochemistry (D'ortenzio and d'Alcala, 2009; Mermex Group, 2011) alongside the deepening of the phosphacline with longitude (Moutin and Raimbault, 2002; Pujo-Pay et al., 2011; Pasqueron de Fommervault et al., 2015). However, except for a few studies (Moutin et al., 2002; Thingstad et al., 2005; Pulido-Villena et al., 2010; Djaoudi et al., 2018a), phosphate concentrations measured above the phosphacline (i.e., inside the phosphate-depleted layer) were below the detection limit of standard methods used, precluding the assessment of vertical and regional variability of this key phosphate pool. Surface nanomolar phosphate data obtained in this study fall within the same order of magnitude as previously reported values for the open Mediterranean Sea during the stratification period by Van Wambeke et al. (2002), Krom et al. (2005), Pulido-Villena et al. (2010) and Djaoudi et al. (2018a). From west to east, the three sub-basins visited in this study exhibited surface phosphate concentrations indicating moderate to severe P deficiency with values in the Ionian basin (6 nM average) as low as other P-deficient regions such as the North Atlantic subtropical gyre (9 nM, Mather et al., 2008).
One striking feature of the longitudinal pattern in P cycling observed in this study is the difference in the degree of variability among the studied parameters. Indeed, little variability was observed in phosphate concentrations, with average values ranging from 15 nM in the Algerian basin to 6 nM in the Ionian basin. In contrast, alkaline phosphatase (AP) activities varied over 1 order of magnitude across the longitudinal transect. AP is mostly considered an inducible enzyme, and, therefore, AP activity has been used as an index of P limitation (Hoppe, 2003). This has been particularly examined in the Mediterranean Sea (Sala et al., 2001; Van Wambeke et al., 2002; Thingstad and Mantoura, 2005; Zaccone et al., 2012). In the present study, POP-normalized AP activity (AP-POP) exhibited the highest rates in the easternmost station (0.5 h−1), with values similar to other P-limited regions (e.g., Sargasso Sea 0.3 h−1, Cotner et al., 1997), indicating an enhanced P limitation towards the east. This enhanced AP activity was further reflected in an effective drawdown of DOP, indicating that microorganisms residing in surface waters actually utilize DOP as an alternative source of P. Indeed, the turnover time of spiked MUF-P was tightly linked with longitude. Interestingly, none of these P-limitation indexes correlated with phosphate concentration. This implies that the apparent phosphate concentration may not be the definitive criterion for evaluating P limitation, as previously suggested (Tanaka et al., 2006). Concentrations of biologically available orthophosphate, based on phosphate turnover time from 33P-phosphate uptake experiments conducted in the Mediterranean Sea during the stratification period, varied by 1 order of magnitude between 3 nM near the strait of Gibraltar to 0.2 nM in the Ionian Sea (Moutin et al., 2002). Not only the variability was higher than in our study but also reported phosphate concentrations were lower. This may be a seasonal effect since the PEACETIME cruise took place in late spring, while the above-cited study was conducted at the end of summer, under even more stratified conditions. Nevertheless, it is possible that phosphate concentration, measured through the widely used colorimetric method, does not necessarily reflect the concentration of bioavailable phosphate. Indeed, the substantial differences in AP activity rates (10-fold) and turnover times of spiked DOP substrate observed across the transect indicate that microbial P cycling was highly dynamic despite the low variability in phosphate concentration, similar to that reported in other P-deficient regions such as the North Pacific subtropical gyre (Suzumura et al., 2012).
4.2 Vertical variability of phosphate inside the phosphate-depleted layer
In addition to the above-described longitudinal patterns, the data presented in this study allowed assessing the vertical variability of phosphate concentration inside the phosphate-depleted layer (PDL). As said before, the PDL, between the surface and the top of the phosphacline, has been traditionally seen as a homogeneous layer with undetectable phosphate concentration. Yet, our nanomolar phosphate data revealed the presence of phosphate vertical gradients inside the PDL (except at stations 6 and ION) ranging between 1.8 and 10.6 µmol kg−1 and decreasing from west to east. In a recent study in the western Mediterranean Sea, Djaoudi et al. (2018a) reported phosphate gradients over depth above the phosphacline between 0.04 and 3.2 nM m−1, which is higher than observed in this study (0.01–0.3 nM m−1 if expressed as a gradient of phosphate concentration as a function of depth). These are, to our knowledge, the first reports on such a vertical variability in phosphate concentration in a P-depleted oceanic region.
Including nanomolar data in phosphate–density diagrams showed two gradients, one inside the PDL and the other across the phosphacline, with significantly different values (Fig. 3). This is, to our knowledge, the first report of such a pattern in phosphate profiles, revealed thanks to both highly sensitive measurements and high-resolution sampling. In the easternmost station, ION, a different pattern could be depicted from the phosphate–density diagrams (Fig. 3c): no detectable gradient in the upper 60 m of the water column, followed by a weak gradient between 66 and 166 m depth and a strong gradient from 166 m depth until the lower bound of the phosphacline at 400 m depth. In this study, the phosphacline was defined as the layer showing a maximum and constant gradient of phosphate concentration over density. Therefore, by definition, the PDL at ION expands from the surface down to 166 m depth, and, thus, the PDL would consist of two sub-layers: one upper layer with constant phosphate concentration and the layer underneath showing a first gradient of phosphate over density. An alternative interpretation of this three-layer system would consider the 0–66 m as the PDL (low and homogeneous phosphate concentration) and a phosphacline layer showing a nonlinear profile where the phosphate gradient varies locally with density as proposed by Omand and Mahadevan (2015). The pattern observed at ION highlights the potential of the combination of highly sensitive phosphate measurements at high vertical resolution to characterize the shape of oceanic phosphacline in the upper layers of P-depleted oceanic regions.
Nanomolar phosphate data reported in this study modify the picture of a homogeneous pool of phosphate between the surface and the phosphacline. Under that traditional view, during the stratification period, the upper waters of the euphotic zone would not be supplied with any phosphate from below, since fluxes associated with the phosphacline would only reach the base of the euphotic zone. This study reveals an alternative scenario in which diapycnal fluxes of phosphate potentially reach the upper layer of the euphotic zone. In the absence of turbulence measurements during the PEACETIME cruise, measured phosphate gradients were scaled to flux units by applying a constant value of turbulent kinetic energy dissipation rate (ε). The uncertainties due to the sensitivity of computed diapycnal fluxes to the ε term in the equation cannot be robustly estimated. Future concomitant measurements of turbulent dissipation rates or modeled Kz profiles (Costa et al., 2017) will allow quantifying with better accuracy the vertical flux of new P from deeper layers reaching the upper waters of the euphotic zone.
Despite the above-described uncertainties of our calculations, our estimates are in the lower range, but in the same order of magnitude, of the only reported diapycnal P fluxes to the upper euphotic zone based on simultaneous turbulence microstructure and high-resolution chemical measurements in the oligotrophic South China Sea (Du et al., 2017) and in the subtropical North Pacific (Hashihama et al., 2021). Thus, despite hydrological differences among these oceanic regions, we assume our estimates to be valid for the purpose of the following section of this work, i.e., to assess the relative contribution of external and internal sources of phosphate to the mixed layer.
4.3 External sources of P to the upper waters of the Mediterranean Sea
Together with diapycnal fluxes, the surface mixed layer can receive new P through atmospheric deposition (Pulido-Villena et al., 2010; Richon et al., 2019) and through lateral transport (Letscher et al., 2016). In this study, there was little variability in surface phosphate concentration among the stations excluding the presence of strong horizontal gradients across the longitudinal transect. Moreover, surface phosphate concentration at three stations located further north (between 42 and 39∘ N along a north–south gradient) was homogeneous and similar to the study transect (11 ± 6 nM in ST01, 10 ± 3 nM in ST02 and 11 ± 6 nM in ST03, data not shown) excluding also the presence of strong horizontal gradients across a north–south gradient. We thus assume that phosphate supply through lateral transport was not significant during the cruise and consider atmospheric deposition and diapycnal fluxes from below as the two main external sources of phosphate to the phosphate-depleted layer.
Dry deposition of soluble-phosphorus values across the transect, around 0.237 ± 0.140 µmol m−2 d−1 (average value for all stations except FAST), were in the lower range of previously reported measurements in coastal areas (Markaki et al., 2003). One Saharan dust event, recorded at FAST (Guieu et al., 2020b), was responsible for the highest dry deposition flux, 0.995 µmol m−2 d−1. The contribution of dry deposition fluxes to total external fluxes, relative to diapycnal fluxes, increased eastwards, mainly driven by the decrease in diapycnal fluxes (Fig. 4, Table S1). In the western part of the transect, from ST10 to ST4, both fluxes were of the same order of magnitude, except for FAST where atmospheric deposition was dominant. This contrasts with the paradigm that, under stratification conditions, the upper waters of the Mediterranean Sea receive new P exclusively from the atmosphere. Conversely, from ST5 to the easternmost part of the transect, diapycnal fluxes of phosphate were negligible compared to atmospheric deposition (Fig. 4, Table S1). Although these findings must be taken with caution given the uncertainties in the estimation of diapycnal fluxes, it opens new questions on the biogeochemical response of the Mediterranean Sea, and more generally of marine oligotrophic regions, to expected changes in atmospheric inputs and stratification regimes (Powley et al., 2017). It should be noted that dry deposition data were derived from measurements of total soluble phosphorus including inorganic and organic fractions. Given the potential high contribution of the organic fraction to total soluble phosphorus in atmospheric deposition (e.g., Djaoudi et al., 2018b), phosphate fluxes from dry deposition were likely overestimated. The occurrence of rain events significantly enhanced the contribution of atmospheric deposition to new P supply to the surface layer. This was particularly the case at FAST due to the occurrence of a Saharan dust event (Guieu et al., 2020b) with an estimated dust flux between 38 and 55 mg m−2, mainly through wet deposition (Bressac et al., 2021; Desboeufs et al., 2021).
Diapycnal fluxes and atmospheric deposition represent an external supply of new phosphate to the surface layer between 0.11 and 2.19 µmol m−2 d−1 (Table S1). Assuming a C:P molar ratio of 130 in phytoplankton (mean value of sorted phytoplanktonic cells in P-depleted conditions, Martiny et al., 2013), these sources would support a range of new production between 14 and 285 µmol C m−2 d−1. Based on primary production (PP) rates reported for the PEACETIME cruise (Marañón et al., 2021) integrated over the mixed layer (between 817 and 3611 µmol C m−2 d−1), and using an average f-ratio of 0.1 previously reported for the Mediterranean Sea (Powley et al., 2017, and references therein), the external supply of phosphate to the surface layer would support, on average, about 30 % of the new production, except at FAST where the contribution would reach 90 % (Table S1). A number of explanations can be proposed for this apparent imbalance related to either overestimation of sinks (new production) or underestimation of sources. In the first case, applying higher C:P ratios would contribute to reducing the imbalance. Due to a great cellular plasticity to local phosphate availability (Moore et al., 2013), particulate C:P ratios have been shown to be dependent on ambient phosphate concentration with values as high as 200 at phosphate concentrations reaching zero (Galbraith and Martiny, 2015). Applying this ratio to our estimations reduces the imbalance, and the contribution of external P sources to new production reaches values higher than 80 % at stations FAST, ST5, TYR and ION, where new P supply is dominated by atmospheric fluxes (Table S1).
Underestimation of the atmospheric flux may have also contributed to the mismatch between external supply of phosphate and net productivity across the transect in the Mediterranean Sea. Indeed, only the soluble/dissolved fraction in dry deposition and wet deposition, respectively, has been considered. However, along the transect, the percentage of soluble P was highly variable, roughly ranging between 10 and 70 % of total P (Fu et al., 2021). Thus, surface waters might have been further enriched in phosphate after dissolution of aerosols in seawater (Pulido-Villena et al., 2010).
The imbalance between estimated external sources of P and new production was particularly marked at ST10, the westernmost station of the transect, where external P supply could contribute up to 10 % of new production. This contrasts with the other stations in the Algerian basin where external P contributed between 30 % and 90 % to new production. As mentioned previously, it was hypothesized that, at the basin scale, lateral transport was not a dominant P source mainly based on the homogeneity of surface phosphate concentration. However, ST10 might be an exception: using satellite-derived currents, we observed the presence of a mesoscale eddy and ST10 was located on the edge of this eddy (Guieu et al., 2020b). This could have led to a mesoscale transport of nutrients from Atlantic water containing significant levels of phosphate (Huertas et al., 2012). We, therefore, cannot exclude that at ST10 lateral transport contributed significantly to phosphate external supply to upper waters.
4.4 Contribution of regenerated phosphate to total P requirements
Dissolved organic phosphorus represents an alternative source of P in P-depleted oceanic regions (Hoppe, 2003, Mather et al., 2008). In this study, the combination of nanomolar phosphate data and alkaline phosphatase (AP) activity showed an enhanced utilization of DOP, particularly at the more oligotrophic stations located towards the east of the transect. It should be noted here that DOP hydrolysis in this study was assessed solely through alkaline phosphatase activity and was, therefore, restricted to phosphate monoesters. Other organic P compounds such as phosphate diesters or phosphonates are known to provide alternative sources of P (Dyhrman et al., 2006; Whitney and Lomas, 2019; Thomson et al., 2020).
A variable fraction of DOP is actually available for hydrolysis by alkaline phosphatase (hereafter AP-DOP). In the North Pacific subtropical gyre, AP-DOP represents 31 %–48 % of total DOP at 20–30 m depth in oligotrophic offshore stations (Suzumura et al., 2012). Previous research in the Mediterranean Sea has reported comparable values (31 ± 18 %, Djaoudi et al., 2018b, and unpublished data). Applying the later value to surface DOP concentration measured in this study yields AP-DOP concentrations between 3 and 25 nM. These estimations fall well below the 0.025–1 µM MUF-P range used to compute AP kinetics. We estimated the amount of phosphate released through enzymatic degradation of DOP by computing in situ DOP hydrolysis fluxes for alkaline phosphatase (APin situ). APin situ was largely below (about 10 times lower than) Vm, ranging from 0.07 nmol L−1 h−1 in ST10 to 0.66 nmol L−1 h−1 in ST7, in the Ionian basin. These values are slightly higher than (although comparable to) those reported for the North Pacific subtropical gyre (0.01–0.07 nmol L−1 h−1, Suzumura et al. 2012, and 0.01–0.20 nmol L−1 h−1, Duhamel et al. 2011). In contrast, noticeably lower APin situ has been reported for the North Atlantic subtropical gyre (0.0002 nmol L−1 h−1, Mather et al. 2008). In the present study, we estimated Michaelis–Menten parameters based on a multiple-concentration method in which MUF-P was added over a range of concentrations from 25 to 1000 nM. This range is consistent with those used in Suzumura et al. (2012) and Duhamel et al. (2011) studies but markedly lower than in Mather et al. (2008) (1–750 µM). Using MUF-P concentrations much higher than DOP concentration leads to overestimations of Km, which, in turn, results in APin situ rates that are too low. Generally, enzymatic multiple kinetics are common, and using high fluorogenic substrate concentrations will lead to underestimating in situ hydrolysis rates (Van Wambeke et al., 2021, and references therein).
To scale the estimated APin situ within the P cycle, we computed the daily fraction of phosphate potentially released by AP activity and the contribution of APin situ to total P requirements by both phytoplankton and heterotrophic prokaryotes in the surface mixed layer. Phosphate potentially released by AP activity was calculated as the ratio of APin situ to phosphate concentration, expressed as a percentage of the ambient phosphate concentration (APphosphate, % d−1). We found highly variable proportions from 11 % d−1 to 100 % d−1 except for ST07 where the proportion was anomalously higher than 100 % d−1. Except for this station, these values are in the upper range although comparable to those reported by Duhamel et al. (2011) (0.1–63.2 % d−1) and much higher than in Suzumura et al. (2012) (1.9–3.3 % d−1). This confirms that DOP hydrolysis by alkaline phosphatase activity is a major process supplying phosphate in the surface waters of the Mediterranean Sea. The contribution of APin situ to P requirements was estimated by comparing APin situ integrated over the mixed layer with total P requirements (TPRs) estimated from primary production and heterotrophic prokaryotic production data reported in Marañon et al. (2021) and Van Wambeke et al. (2021), assuming varying C:P ratios for both phytoplankton and heterotrophic prokaryotes (Table S2, Fig. 4). APin situ integrated over the mixed layer increased eastwards across the transect with minimum values of 16 µmol m−2 d−1 at ST10 to maxima of 165 and 225 µmol m−2 d−1 at stations ION and ST7, respectively (Fig. 4, Table S2). The highest TPRs were found at stations ST10, FAST and ST6, averaging 42 µmol m−2 d−1. The minimum TPR was found at stations ST5, TYR and ION, averaging 14 µmol m−2 d−1 (Table S2). Note that these estimates can vary by almost 100 % depending on the C:P ratio assumed for phytoplankton and heterotrophic prokaryotes (see Table S2 for details). The lowest contributions of APin situ to TPRs were found in the western part of the transect (stations ST10 and ST9). In the eastern part of the transect, from stations TYR to ION, the contribution of APin situ to TPRs largely exceeded 100 %. Despite the generally high degree of uncertainty, these comparisons confirm the dominance of internal sources in total phosphate supply to the surface waters of the Mediterranean Sea under stratified conditions, with little variation of this contribution across the longitudinal transect (Fig. 4).
Although preferential remineralization of P relative to C is a common feature in oceanic regions (e.g., Clark et al. 1998; Letscher and Moore, 2015), in this study DOP appears to be over-hydrolyzed compared to P requirements. Indeed, if P from DOP hydrolysis were fully assimilated by phytoplankton and heterotrophic prokaryotes, C:P ratios would be lower than 40 and 20, respectively, at all stations of the Tyrrhenian and Ionian basins, which seems unrealistic. Similar comparisons between APin situ rates and P requirements have been previously conducted to estimate the degree of dependence of biological activity on the DOP pool in P-depleted oceanic regions. In the North Atlantic subtropical gyre, 20 % (12 %–30 %) of the production was estimated to be supported by the DOP pool (Mather et al., 2008). However, unsuitable ranges of MUF-P concentration used to compute kinetic parameters, noticeably higher than DOP concentration, can lead to underestimation of APin situ, likely explaining such a low contribution of the DOP pool. Therefore, the higher contributions of APin situ to TPRs found in this study may be partially explained by the more suitable range of substrate used for hydrolysis measurements.
Nevertheless, the observed over-hydrolysis compared to TPRs is still intriguing. A number of methodological issues may have caused a potential overestimation of computed APin situ in this study related to (i) AP-DOP concentrations, (ii) the conditions of incubation and (iii) the fluorogenic artificial substrate used. (i) The proportion of AP-DOP to DOP has been reported to be extremely variable among oceanic regions (Yamaguchi et al., 2021). In this study, we applied a ratio of 30 % to estimate AP-DOP concentration based on data reported by Djaoudi et al. (2018a) for the Mediterranean Sea. However, considering a AP-DOP DOP ratio as low as 10 % would reduce the APin situ by one-third. Accurate determinations of AP-DOP concentration are thus necessary to evaluate the role of the DOP pool in P-deficient oceanic regions. (ii) AP activity is usually measured in dark conditions, including in this study, thus excluding the potential effect of UV radiation which might be particularly significant in the Mediterranean Sea where the depth of 1 % light penetration reaches up to 11 m for UV-A and 26 m for UV-B (Bertoni et al., 2011). AP activity has been found to be negatively affected by UV radiation (Tank et al., 2005), particularly in the dissolved fraction (Garde et al., 1999; Tank et al., 2005). AP occurs noticeably in the dissolved fraction (Baltar, 2018), including in the study region where the contribution of the < 0.2 µm fraction to the bulk AP activity was on average 60 ± 34 % (Van Wambeke et al., 2021). An overestimation of measured AP activity in this study cannot thus be excluded. Finally, (iii) MUF-P is the preferred artificial substrate for marine studies, but natural AP-DOP is a mixture of compounds with different affinities (Arnosti et al., 2011). Moreover, if MUF-P is immediately accessible to the alkaline phosphatase, access to natural phosphomonoester binding molecules embedded in large matrixes of polymeric material might require preliminary hydrolysis by other ectoenzymes (e.g., lipase for membrane debris for instance), some of them with lower activities than AP. Overall, a better representation of in situ conditions would lead to more accurate AP measurements in P-depleted oceanic regions.
Despite the above-described potential overestimations of AP activity and APin situ, the obtained numbers are high enough to confirm the domination of internal sources in the total phosphate supply to the surface waters of the Mediterranean Sea under stratified conditions, with little variation across the longitudinal transect. This study would thus suggest that external sources of P atmospheric deposition and nanomolar vertical phosphate supply are rapidly recycled within the euphotic zone, sustaining the recycled production in the Mediterranean Sea in late spring, particularly in the eastern basin.
This study presents the first cross-basin dataset in the Mediterranean Sea based on collocated measurements of phosphate pools at the nanomolar level (phosphate, DOP, POP), alkaline phosphatase activities and atmospheric deposition of soluble/dissolved P. Microbial phosphorus cycling in the surface layer showed a marked longitudinal gradient despite little variability in phosphate concentration. Nanomolar phosphate measured at high vertical resolution inside the phosphate-depleted layer revealed vertical gradients between the surface and the phosphacline, challenging the traditional view of a homogeneous phosphate deplete layer with phosphate concentration below the detection limit of measurement. Gradients of phosphate concentration versus density inside the PDL allowed estimating diapycnal fluxes of phosphate to the mixed layer and comparing them with another external source, atmospheric fluxes. Under background conditions of dry atmospheric deposition, inputs of phosphate to the surface layer from above and from below are roughly equal in the western Mediterranean Sea. The contribution of atmospheric deposition increases eastwards mainly due to a decrease in diapycnal fluxes. On top of this background scenario, pulsed wet deposition events, particularly associated with Saharan dust events, markedly increase the contribution of atmospheric deposition, making it the dominant external source of phosphate to the well-stratified surface waters of the Mediterranean Sea. These results open exciting questions on the relative contribution of external P sources from below and above to the surface waters of the Mediterranean Sea under changing conditions of atmospheric deposition and stratification regimes. Phosphate supply to the PDL was clearly dominated by internal sources (i.e., recycling), estimated through in situ enzymatic hydrolysis of the DOP pool by alkaline phosphatase. Internal fluxes of phosphate within the PDL exceeded total phosphate requirements at most sampled stations, particularly in the eastern part of the transect, suggesting a potential overestimation of in situ DOP hydrolysis. Taken together, the results obtained in this study show a highly dynamic phosphorus pool in the upper layer of the euphotic zone, above the phosphacline. This study also highlights the convenience of combining highly sensitive measurements and high-resolution sampling to precisely depict the shape of phosphate profiles in the euphotic zone with still unexplored consequences on P fluxes supplying this crucial layer for biogeochemical cycles.
Underlying research data are being used by researcher participants of the PEACETIME campaign to prepare other papers, and therefore data are not publicly accessible at the time of publication. “Biogeochemical dataset collected during the PEACETIME cruise” (Guieu et al., 2020a) will be accessible at https://www.seanoe.org/data/00645/75747/.
The supplement related to this article is available online at: https://doi.org/10.5194/bg-18-5871-2021-supplement.
CG and KDe designed the cruise strategy. KDe was responsible for the collection and analysis of atmospheric deposition assisted by FF and ST. KDj measured nanomolar phosphate on board. FVW measured alkaline phosphatase activity assisted by SG. VT managed CTD operations on board. SB, AD, AP and VT contributed to the calculation of diapycnal fluxes. SN managed phosphate sampling and analysis through standard techniques. TG analyzed DOP concentration. EPV supervised the nanomolar phosphate data and managed the analysis of the dataset. EPV wrote the manuscript with contributions from CG, KDe, KDj, FVW, SB, AD, AP and VT.
The contact author has declared that neither they nor their co-authors have any competing interests.
Publisher's note: Copernicus Publications remains neutral with regard to jurisdictional claims in published maps and institutional affiliations.
This article is part of the special issue “Atmospheric deposition in the low-nutrient–low-chlorophyll (LNLC) ocean: effects on marine life today and in the future (ACP/BG inter-journal SI)”. It is not associated with a conference.
This study is a contribution of the PEACETIME project (http://peacetime-project.org, last access: 7 April 2021), a joint initiative of the MERMEX and ChArMEx components. PEACETIME was endorsed as a process study by GEOTRACES and is also a contribution to the IMBER and SOLAS international programs. We thank the captain and crew of the RV Pourquoi Pas? for their help during the work at sea. We also warmly thank Fabrizio D'Ortenzio for his insightful comments on the first version of the manuscript. The constructive comments during the review process of Maurizio Ribera d'Alcalà, an anonymous referee, Silvia Becaglis and Christine Klass are much appreciated.
The project leading to this publication received funding from CNRS-INSU, IFREMER, CEA and Météo-France as part of the program MISTRALS coordinated by INSU and from the European FEDER fund (grant no. 1166-39417).
This paper was edited by Christine Klaas and reviewed by Maurizio Ribera d'Alcalà and one anonymous referee.
Aminot, A. and Kérouel, R.: Dosage automatique des nutriments dans les eaux marines, Méthodes en flux continu, Editions Quae, Versailles, France, 188 pp., ISBN 978-2-7592-0023-8, 2007.
Ammerman, J. W., Hood, R. R., Case, D. A., and Cotner, J. B.: Phosphorus deficiency in the Atlantic: An emerging paradigm in oceanography, EOS, 84, 165–170, https://doi.org/10.1029/2003eo180001, 2003.
Armstrong, F. A., Williams, P. M., and Strickland, J. D. H.: Photo-oxidation of organic matter in seawater byultraviolet radiation, analytical and other applications, Nature, 211, 481–483, https://doi.org/10.1038/211481a0, 1966.
Arnosti, C.: Microbial Extracellular enzymes and the marine carbon cycle, Ann. Rev. Mar. Sci., 3, 401–425, https://doi.org/10.1146/annurev-marine-120709-142731, 2011.
Baltar, F.: Watch Out for the “Living Dead”: Cell-Free Enzymes and Their Fate, Front. Microbiol., 8, 2438, https://doi.org/10.3389/fmicb.2017.02438, 2018.
Bertoni, R., Jeffrey, W. H., Pujo-Pay, M., Oriol, L., Conan, P., and Joux, F.: Influence of water mixing on the inhibitory effect of UV radiation on primary and bacterial production in Mediterranean coastal water, Aquat. Sci., 73, 377–387, https://doi.org/10.1007/s00027-011-0185-8, 2011.
Bressac, M., Wagener, T., Leblond, N., Tovar-Sánchez, A., Ridame, C., Albani, S., Guasco, S., Dufour, A., Jacquet, S., Dulac, F., Desboeufs, K., and Guieu, C.: Subsurface iron accumulation and rapid aluminium removal in the Mediterranean following African dust deposition, Biogeosciences Discuss. [preprint], https://doi.org/10.5194/bg-2021-87, in review, 2021.
Capotondi, A., Alexander, M. A., Bond, N. A., Curchitser, E. N., and Scott, J. D.: Enhanced upper ocean stratification with climate change in the CMIP3 models, J. Geophys. Res.-Oceans, 117, C04031, https://doi.org/10.1029/2011jc007409, 2012.
Clark, L., Ingall, E., and Benner, R.: Marine phosphorus is selectively remineralized, Nature, 393, 426 pp., https://doi.org/10.1038/30881, (1998).
Costa, A., Doglioli, A. M., Marsaleix, P., and Petrenko, A.: Comparison of in situ microstructure measurements to different turbulence closure schemes in a 3-D numerical ocean circulation model, Ocean Model., 120, 1–17, https://doi.org/10.1016/j.ocemod.2017.10.002, 2017.
Cotner, J. B., Ammerman, J. W., Peele, E. R., and Bentzen, E.: Phosphorus-limited bacterioplankton growth in the Sargasso Sea, Aquat. Microb. Ecol., 13, 141–149, 1997.
Cuypers, Y., Bouruet-Aubertot, P., Marec, C., and Fuda, J.-L.: Characterization of turbulence from a fine-scale parameterization and microstructure measurements in the Mediterranean Sea during the BOUM experiment, Biogeosciences, 9, 3131–3149, https://doi.org/10.5194/bg-9-3131-2012, 2012.
Desboeufs, K., Fu, F., Bressac, M., Tovar-Sánchez, A., Triquet, S., Doussin, J.-F., Giorio, C., Chazette, P., Disnaquet, J., Feron, A., Formenti, P., Maisonneuve, F., Rodriìguez-Romero, A., Zapf, P., Dulac, F., and Guieu, C.: Wet deposition in the remote western and central Mediterranean as a source of trace metals to surface seawater, Atmos. Chem. Phys. Discuss. [preprint], https://doi.org/10.5194/acp-2021-624, in review, 2021.
Djaoudi, K., Van Wambeke, F., Coppola, L., D'ortenzio, F., Helias-Nunige, S., Raimbault, P., Taillandier, V., Testor, P., Wagener, T., and Pulido-Villena, E.: Sensitive determination of the dissolved phosphate pool for an improved resolution of its vertical variability in the surface layer: New views in the P-depleted Mediterranean Sea, Frontiers in Marine Science, 5, 234, https://doi.org/10.3389/fmars.2018.00234, 2018a.
Djaoudi, K., Van Wambeke, F., Barani, A., Hélias-Nunige, S., Sempéré, R., and Pulido-Villena, E.: Atmospheric fluxes of soluble organic C, N, and P to the Mediterranean Sea: potential biogeochemical implications in the surface layer, Prog. Oceanogr., 163, 59–69, https://doi.org/10.1016/j.pocean.2017.07.008, 2018b.
D'Ortenzio, F. and Ribera d'Alcalà, M.: On the trophic regimes of the Mediterranean Sea: a satellite analysis, Biogeosciences, 6, 139–148, https://doi.org/10.5194/bg-6-139-2009, 2009.
Du, C., Liu, Z., Kao, S.-J., and Dai, M.: Diapycnal Fluxes of Nutrients in an Oligotrophic Oceanic Regime: The South China Sea, 44, 11510–11518, https://doi.org/10.1002/2017gl074921, 2017.
Duhamel, S., Bjorkman, K. M., Van Wambeke, F., Moutin, T., and Karl, D. M.: Characterization of alkaline phosphatase activity in the North and South Pacific Subtropical Gyres: Implications for phosphorus cycling, Limnol. Oceanogr., 56, 1244–1254, https://doi.org/10.4319/lo.2011.56.4.1244, 2011.
Dyhrman, S. T., Chappell, P. D., Haley, S. T., Moffett, J. W., Orchard, E. D., Waterbury, J. B., and Webb, E. A.: Phosphonate utilization by the globally important marine diazotroph Trichodesmium, Nature, 439, 68–71, https://doi.org/10.1038/nature04203, 2006.
Falkowski, P. G., Barber, R. T., and Smetacek, V.: Biogeochemical Controls and Feedbacks on Ocean Primary Production, Science, 281, 200–206, https://doi.org/10.1126/science.281.5374.200, 1998.
French Oceanographic Cruises: PEACETIME, Institut de la Mer de Villefranche, https://doi.org/10.17600/17000300, 2017.
Fu, F., Desboeufs, K., Triquet, S., Doussin, J.-F., Giorio, C., Dulac, F., and Guieu, C.: Solubility and sources of trace metals and nutrients associated with aerosols collected during cruise PEACETIME in the Mediterranean Sea, Atmos. Chem. Phys. Discuss., in preparation, 2021.
Galbraith, E. D. and Martiny, A. C.: A simple nutrient-dependence mechanism for predicting the stoichiometry of marine ecosystems, P. Nat. Acad. Sci., 112, 8199–8204, https://doi.org/10.1073/pnas.1423917112, 2015.
Garde, K. and Gustavson, K.: The impact of UV-B radiation on alkaline phosphatase activity in phosphorus-depleted marine ecosystems, J. Exp. Mar. Biol. Ecol., 238, 93–105, 1999.
Guieu, C. and Ridame, C.: Impact of atmospheric deposition on marine chemistry and biogeochemistry, in: Atmospheric Chemistry in the Mediterranean Region: Comprehensive Diagnosis and Impacts, edited by: Dulac, F., Sauvage, S., and Hamonou E., Springer, Cham, Switzerland, 2020.
Guieu, C., Desboeufs, K., Albani, S., Alliouane, S., Aumont, O., Barbieux, M., Barrillon, S., Baudoux, A.-C., Berline, L., Bhairy, N., Bigeard, E., Bloss, M., Bressac, M., Brito, J., Carlotti, F., de Liege, G., Dinasquet, J., Djaoudi, K., Doglioli, A., D'Ortenzio, F., Doussin, J.-F., Duforet, L., Dulac, F., Dutay, J.-C., Engel, A., Feliu-Brito, G., Ferre, H., Formenti, P., Fu, F., Garcia, D., Garel, M., Gazeau, F., Giorio, C., Gregori, G., Grisoni, J.-M., Guasco, S., Guittonneau, J., Haëntjens, N., Heimburger, L.-E., Helias, S., Jacquet, S., Laurent, B., Leblond, N., Lefevre, D., Mallet, M., Marañ̃ón, E., Nabat, P., Nicosia, A., Obernosterer, I., Pérez-Lorenzo, M., Petrenko, A., Pulido-Villena, E., Raimbault, P., Ridame, C., Riffault, V., Rougier, G., Rousselet, L., Roy-Barman, M., Saiz-Lopez, A., Schmechtig, C., Sellegri, K., Siour, G., Taillandier, V., Tamburini, C., Thyssen, M., Tovar-Sanchez, A., Triquet, S., Uitz, J., Van Wambeke, F., Wagener, T., and Zaencker, B.: BIOGEOCHEMICAL dataset collected during the PEACETIME cruise, SEANOE [data set], available at: https://www.seanoe.org/data/00645/75747/ (last access: 29 October 2021), 2020a.
Guieu, C., D'Ortenzio, F., Dulac, F., Taillandier, V., Doglioli, A., Petrenko, A., Barrillon, S., Mallet, M., Nabat, P., and Desboeufs, K.: Introduction: Process studies at the air–sea interface after atmospheric deposition in the Mediterranean Sea – objectives and strategy of the PEACETIME oceanographic campaign (May–June 2017), Biogeosciences, 17, 5563–5585, https://doi.org/10.5194/bg-17-5563-2020, 2020b.
Hashihama, F., Kinouchi, S., Suwa, S., Suzumura, M., and Kanda, J.: Sensitive determination of enzymatically labile dissolved organic phosphorus and its vertical profiles in the oligotrophic western North Pacific and East China Sea, J. Oceanogr., 69, 357–367, https://doi.org/10.1007/s10872-013-0178-4, 2013.
Hashihama, F., Saito, H., Shiozaki, T., Ehama, M., Suwa, S., Sugiyama, T., Kato, H., Kanda, J., Sato, M., Kodama, T., Yamaguchi, T., Horii, S., Tanita, I., Takino, S., Takahashi, K., Ogawa, H., Boyd, P. W., and Furuya, K.: Biogeochemical Controls of Particulate Phosphorus Distribution Across the Oligotrophic Subtropical Pacific Ocean, Global Biogeochem. Cy., 34, e2020GB006669, https://doi.org/10.1029/2020GB006669, 2020.
Hashihama, F., Yasuda, I., Kumabe, A., Sato, M., Sasaoka, H., Iida, Y., Shiozaki, T., Saito, H., Kanda, J., Furuya, K., Boyd, P. W., and Ishii, M.: Nanomolar phosphate supply and its recycling drive net community production in the subtropical North Pacific, Nat. Commun., 12, 3462, https://doi.org/10.1038/s41467-021-23837-y, 2021.
Hoppe, H.-G.: Significance of exoenzymatic activities in the ecology of brackish water: measurements by means of methylumbelliferyl-substrates, Mar. Ecol. Prog. Ser., 11, 299–308, https://doi.org/10.3354/meps011299, 1983.
Hoppe, H.-G.: Phosphatase activity in the sea, Hydrobiologia, 493, 187–200, https://doi.org/10.1023/A:1025453918247, 2003.
Huertas, I. E., Ríos, A. F., García-Lafuente, J., Navarro, G., Makaoui, A., Sánchez-Román, A., Rodriguez-Galvez, S., Orbi, A., Ruíz, J., and Pérez, F. F.: Atlantic forcing of the Mediterranean oligotrophy, Global Biogeochem. Cy., 26, GB2022, https://doi.org/10.1029/2011GB004167, 2012.
Izquierdo, R., Benítez-Nelson, C. R., Masqué, P., Castillo, S., Alastuey, A., and Àvila, A.: Atmospheric phosphorus deposition in a near-coastal rural site in the NE Iberian Peninsula and its role in marine productivity, Atmos. Environ., 49, 361–370, https://doi.org/10.1016/j.atmosenv.2011.11.007, 2012.
Kamykowski, D. and Zentara, S. J.: Predicting plant nutrient concentrations from temperature and sigma-t in the upper kilometer of the world ocean, Deep-Sea Res., 33, 89–105, https://doi.org/10.1016/0198-0149(86)90109-3, 1986.
Kanakidou, M., Myriokefalitakis, S., and Tsagkaraki, M.: Atmospheric inputs of nutrients to the Mediterranean Sea, Deep-Sea Res. Pt. II, 171, 104606, https://doi.org/10.1016/j.dsr2.2019.06.014, 2020.
Karl, D. M.: Microbially mediated transformations of phosphorus in the sea: New views of an old cycle, Ann. Rev. Mar. Sci., 6, 279–337, https://doi.org/10.1146/annurev-marine-010213-135046, 2014.
Karl, D. M. and Björkman, K. M.: Dynamics of dissolved organic phosphorus, in: Biogeochemistry of Marine Dissolved Organic Matter, edited by: Hansell, D. A. and Carlson, C. A., Academic Press, Burlington, 233–334, 2015.
Krom, M., Woodward, E., Herut, B., Kress, N., Carbo, P., Mantoura, R., Spyres, G., Thingstad, T., Wassmann, P., Wexels-Riser, C., Kitidish, V., Lawi, C. S., and Zodiatisj, G.,: Nutrient cycling in the south east Levantine basin of the eastern Mediterranean: Results from a phosphorus starved system, Deep-Sea Res. Pt. II, 52, 2879–2896, https://doi.org/10.1016/j.dsr2.2005.08.009, 2005.
Krom, M. D., Emeis, K.-C., and Cappellen, P. V.: Why is the Eastern Mediterranean phosphorus limited?, Prog. Oceanogr., 85, 236–244, https://doi.org/10.1016/j.pocean.2010.03.003, 2010.
Letelier, R. M., Björkman, K., Church, M. J., Hamilton, D. S., Mahowald, N. M., Scanza, R. A., Schneider, N., White, A. E., and Karl, D. M.: Climate-driven oscillation of phosphorus and iron limitation in the North Pacific Subtropical Gyre, P. Nat. Acad. Sci., 116, 12720–12728, doi/10.1073/pnas.1900789116, 2019.
Letscher, R. T. and Moore, J. K.: Preferential remineralization of dissolved organic phosphorus and non-Redfield DOM dynamics in the global ocean: Impacts onmarine productivity, nitrogen fixation, and carbon export, Global Biogeochem. Cy., 29, 325–340, https://doi.org/10.1002/2014GB004904, 2015.
Letscher, R. T., Primeau, F., and Moore, J. K.: Nutrient budgets in the subtropical ocean gyres dominated by lateral transport, Nat. Geosci., 9, 815–819, https://doi.org/10.1038/ngeo2812, 2016.
Lewis M. R., Hebert, D., Harrison, W. G., Platt, T., and Oakey, N. S.: Vertical Nitrate Fluxes in the Oligotrophic Ocean, Science, 234, 870–873, https://doi.org/10.1126/science.234.4778.870, 1986.
Li, G., Cheng, L., Zhu, J., Trenberth, K. E., Mann, M. E., and Abraham, J. P.: Increasing ocean stratification over the past half-century, Nat. Clim. Change., 10, 1116–1123, doi.org/10.1038/s41558-020-00918-2, 2020.
Lomas, M. W., Burke, A. L., Lomas, D. A., Bell, D. W., Shen, C., Dyhrman, S. T., and Ammerman, J. W.: Sargasso Sea phosphorus biogeochemistry: an important role for dissolved organic phosphorus (DOP), Biogeosciences, 7, 695–710, https://doi.org/10.5194/bg-7-695-2010, 2010.
Macias, D. M., Garcia-Gorriz, E., and Stips, A.: Productivity changes in the Mediterranean Sea for the twenty-first century in response to changes in the regional atmospheric forcing, Frontiers in Marine Science, 2, 79, https://doi.org/10.3389/fmars.2015.00079, 2015.
Mahaffey, C., Reynolds, S., Davis, C. E., and Lohan, M. C.: Alkaline phosphatase activity in the subtropical ocean: insights from nutrient, dust and trace metal addition experiments, Frontiers in Marine Science, 1, 73, https://doi.org/10.3389/fmars.2014.00073, 2014.
Marañón, E., Van Wambeke, F., Uitz, J., Boss, E. S., Dimier, C., Dinasquet, J., Engel, A., Haëntjens, N., Pérez-Lorenzo, M., Taillandier, V., and Zäncker, B.: Deep maxima of phytoplankton biomass, primary production and bacterial production in the Mediterranean Sea, Biogeosciences, 18, 1749–1767, https://doi.org/10.5194/bg-18-1749-2021, 2021.
Markaki, Z., Oikonomou, K., Kocak, M., Kouvarakis, G., Chaniotaki, A., Kubilay, N., and Mihalopoulos, N.: Atmospheric deposition of inorganic phosphorus in the Levantine Basin, eastern Mediterranean: Spatial and temporal variability and its role in seawater productivity, Limnol. Oceanogr., 48, 1557–1568, https://doi.org/10.4319/lo.2003.48.4.1557, 2003.
Martiny, A. C., Pham, C. T. A., Primeau, F. W., Vrugt, J. A., Moore, J. K., Levin, S. A., and Lomas, M. W.: Strong latitudinal patterns in the elemental ratios of marine plankton and organic matter, Nat. Geosci., 6, 279–283, https://doi.org/10.1038/ngeo1757, 2013.
Martiny, A. C., Lomas, M. W., Fu, W., Boyd, P. W., Chen, Y.-l. L., Cutter, G. A., Ellwood, M. J., Furuya, K., Hashihama, F., Kanda, J., Karl, D. M., Kodama, T., Li, Q. P., Ma, J., Moutin, T., Woodward, E. M. S., and Moore, J. K.: Biogeochemical controls of surface ocean phosphate, Science Advances, 5, eaax0341, https://doi.org/10.1126/sciadv.aax0341, 2019.
Mather, R. L., Reynols, S. E., Wolff, G. A., Williams, R. G., Torres-Valdes, S., Woodward, M. S., Landolfi, A., Pan, X., Sanders, R., and Achrterberg, E. P.: Phosphorus cycling in the North and South Atlantic Ocean subtropical gyres, Nat. Geosci., 1, 439-443, https://doi.org/10.1038/ngeo232, 2008.
Mermex Group: Marine ecosystems' responses to climatic and anthropogenic forcings in the Mediterranean, Prog. Oceanogr., 91, 97–166, https://doi.org/10.1016/j.pocean.2011.02.003, 2011.
Moore, C. M., Mills, M. M., Arrigo, K. R., Berman-Frank, I., Bopp, L., Boyd, P. W., Galbraith, E. D., Geider, R. J., Guieu, C., Jaccard, S. L., Jickells, T. D., Roche, J. L., Lenton, T. M., Mahowald, N. M., Marañón, E., Marinov, I., Moore, J. K., Nakatsuka, T., Oschlies, A., Saito, M. A., Thingstad, T. F., Tsuda, A., and Ulloa, O.: Processes and patterns of oceanic nutrient limitation, Nature Geoscience, 6, 701–710, https://doi.org/10.1038/ngeo1765, 2013.
Moutin, T. and Raimbault, P.: Primary production, carbon export and nutrients availability in western and eastern Mediterranean Sea in early summer 1996 (MINOS cruise), J. Marine Syst., 33–34, 273–288, https://doi.org/10.1016/s0924-7963(02)00062-3, 2002.
Moutin, T., Thingstad, F., Van Wambeke, F., Marie, D., Slawyk, G., Raimbault, P., and Claustre, H.: Does competition for nano-molar phosphate supply explain the predominance of the cyanobacterium Synechococcus?, Limnol. Oceanogr., 47, 1562–1567, https://doi.org/10.4319/lo.2002.47.5.1562, 2002.
Moutin, T., Karl, D. M., Duhamel, S., Rimmelin, P., Raimbault, P., Van Mooy, B. A. S., and Claustre, H.: Phosphate availability and the ultimate control of new nitrogen input by nitrogen fixation in the tropical Pacific Ocean, Biogeosciences, 5, 95–109, https://doi.org/10.5194/bg-5-95-2008, 2008.
Moutin, T., Wagener, T., Caffin, M., Fumenia, A., Gimenez, A., Baklouti, M., Bouruet-Aubertot, P., Pujo-Pay, M., Leblanc, K., Lefevre, D., Helias Nunige, S., Leblond, N., Grosso, O., and de Verneil, A.: Nutrient availability and the ultimate control of the biological carbon pump in the western tropical South Pacific Ocean, Biogeosciences, 15, 2961–2989, https://doi.org/10.5194/bg-15-2961-2018, 2018.
Omand, M. M. and Mahadevan, A.: The shape of the oceanic nitracline, Biogeosciences, 12, 3273–3287, https://doi.org/10.5194/bg-12-3273-2015, 2015.
Osborn, T. R.: Estimates of local rate of vertical diffusion from dissipation measurements, J. Phys. Oceanogr., 10, 83–89, https://doi.org/10.1175/1520-0485(1980)010<0083:eotlro>2.0.co;2, 1980.
Pasqueron de Fommervault, O., d'Ortenzio, F., Mangin, A., Serra, R., Migon, M., Claustre, H., Lavigne, H., Ribera d'Alcalà, M., Prieur, L., Taillandier, V., Schmechtig, C., Poteau, A., Leymarie, E., Dufour, A., Besson, F., and Obolensk, G.: Seasonal variability of nutrient concentrations in the Mediterranean Sea: Contribution of Bio-Argo floats, J. Geophys. Res.-Oceans, 120, 8528–8550, https://doi.org/10.1002/2015JC011103, 2015.
Powley, H. R., Krom, M. D., and Van Cappellen, P.: Understanding the unique biogeochemistry of the Mediterranean Sea: Insights from a coupled phosphorus and nitrogen model, Global Biogeochem. Cy., 31, 1010–1031, https://doi.org/10.1002/2017GB005648, 2017.
Prieur, L., D'Ortenzio, F., Taillandier, V., and Testor, P.: Physical oceanography of the Ligurian sea, in: the Mediterranean Sea in the era of global change, Vol. 1, Evidence from 30 years of multidisciplinary study of the Ligurian sea, edited by: Migon, C., Sciandra, A., and Nival, P., ISTE Sci. Publ. LTD, 49–78, https://doi.org/10.1002/9781119706960.ch3, 2020.
Pujo-Pay, M., Conan, P., Oriol, L., Cornet-Barthaux, V., Falco, C., Ghiglione, J.-F., Goyet, C., Moutin, T., and Prieur, L.: Integrated survey of elemental stoichiometry (C, N, P) from the western to eastern Mediterranean Sea, Biogeosciences, 8, 883–899, https://doi.org/10.5194/bg-8-883-2011, 2011.
Pulido-Villena, E., Rerolle, V., and Guieu, C.: Transient fertilizing effect of dust in P-deficient LNLC surface ocean, Geophys. Res. Lett., 37, L01603, https://doi.org/10.1029/2009GL041415, 2010.
Raimbault, P., Diaz, F., Pouvesle, W., and Boudjellal, B.: Simultaneous determination of particulate organic carbon, nitrogen and phosphorus collected on filters, using a semi-automatic wet-oxidation method, Mar. Ecol. Prog. Ser., 180, 289–295, https://doi.org/10.3354/meps180289, 1999.
Rajot, J. L., Formenti, P., Alfaro, S., Desboeufs, K., Chevaillier, S., Chatenet, B., Gaudichet, A., Journet, E., Marticorena, B., Triquet, S., Maman, A., Mouget, N., and Zakou, A.: AMMA dust experiment: An overview of measurements performed during the dry season special observation period (SOP0) at the Banizoumbou (Niger) supersite, J. Geophys. Res.-Atmos., 113, D00C14, https://doi.org/10.1029/2008JD009906, 2008.
Ridame, C. and Guieu, C.: Saharan input of phosphate to the oligotrophic water of the open western Mediterranean Sea, Limnol. Oceanogr., 47, 856–869, https://doi.org/10.4319/lo.2002.47.3.0856, 2002.
Richon, C., Dutay, J.-C., Bopp, L., Le Vu, B., Orr, J. C., Somot, S., and Dulac, F.: Biogeochemical response of the Mediterranean Sea to the transient SRES-A2 climate change scenario, Biogeosciences, 16, 135–165, https://doi.org/10.5194/bg-16-135-2019, 2019.
Sala, M. M., Karner, M., Arin, L., and Marrassé, C.: Measurement of ectoenzyme activities as an indication of inorganic nutrient imbalance in microbial communities, Aquat. Microb. Ecol., 23, 301–311, https://doi.org/10.3354/ame023301, 2001.
Sato, M., Sakuraba, R., and Hashihama, F.: Phosphate monoesterase and diesterase activities in the North and South Pacific Ocean, Biogeosciences, 10, 7677–7688, https://doi.org/10.5194/bg-10-7677-2013, 2013.
Schlitzer, R., Ocean Data View, [data set], https://odv.awi.de/, last access: 6 September 2021, 2021.
Somavilla, R., González-Pola, C., and Fernández-Diaz, J.: The warmer the ocean surface, the shallower the mixed layer. How much of this is true?, J. Geophys. Res.-Oceans, 122, 7698–7716, https://doi.org/10.1002/2017jc013125, 2017.
Suzumura, M., Hashihama, F., Yamada, N., and Kinouchi, S.: Dissolved Phosphorus Pools and Alkaline Phosphatase Activity in the Euphotic Zone of the Western North Pacific Ocean, Front. Microb. Sci, 3, 99, https://doi.org/10.3389/fmicb.2012.00099, 2012.
Taillandier, V., Prieur, L., D'Ortenzio, F., Ribera d'Alcalà, M., and Pulido-Villena, E.: Profiling float observation of thermohaline staircases in the western Mediterranean Sea and impact on nutrient fluxes, Biogeosciences, 17, 3343–3366, https://doi.org/10.5194/bg-17-3343-2020, 2020.
Tanaka, T., Henriksen, P., Lignell, R., Olli, K., Seppälä, J., Tamminen, T., and Thingstad, T. F.: Specific affinity for phosphate uptake and specific alkaline phosphatase activity as diagnostic tools for detecting phosphorus-limited phytoplankton and bacteria, Estuar. Coast., 29, 1226–1241, https://doi.org/10.1007/bf02781823, 2006.
Tanaka, T., Thingstad, T. F., Christaki, U., Colombet, J., Cornet-Barthaux, V., Courties, C., Grattepanche, J.-D., Lagaria, A., Nedoma, J., Oriol, L., Psarra, S., Pujo-Pay, M., and Van Wambeke, F.: Lack of P-limitation of phytoplankton and heterotrophic prokaryotes in surface waters of three anticyclonic eddies in the stratified Mediterranean Sea, Biogeosciences, 8, 525–538, https://doi.org/10.5194/bg-8-525-2011, 2011.
Tank, S. E., Xenopoulos, M. A., and Hendzel, L. L.: Effect of ultraviolet radiation on alkaline phosphatase activity and planktonic phosphorus acquisition in Canadian boreal shield lakes, Limnol. Oceanogr., 50, 1345–1351, https://doi.org/10.4319/lo.2005.50.5.1345, 2005.
Thingstad, T. F. and Mantoura, R. F. C.: Titrating excess nitrogen content of phosphorous-deficient eastern Mediterranean surface water using alkaline phosphatase activity as a bio-indicator, Limnol. Oceanogr.-Meth., 3, 94–100, https://doi.org/10.4319/lom.2005.3.94, 2005.
Thingstad, T., Krom, M. D., Mantoura, F., Flaten, G., Groom, S., Herut, B., Kress, N., Law, C. S., Pasternak, A., Pitta, P., Psarra, S., Rassoulzadegan, F., Tanaka, T., Tselepides, A., Wassmann, P., Woodward, M., Riser, C., Zodiatis, G., and Zohary, T.: Nature of phosphorus limitation in the ultraoligotrophic eastern mediterranean, Science, 309, 1068–1071, https://doi.org/10.1126/science.1112632, 2005.
Thomson, B., Wenley, J., Lockwood, S., Twigg, I., Currie, K., Herndl, G. J., Hepburn, C. D., and Baltar, F.: Relative Importance of Phosphodiesterase vs. Phosphomonoesterase (Alkaline Phosphatase) Activities for Dissolved Organic Phosphorus Hydrolysis in Epi- and Mesopelagic Waters, Front. Earth Sci., 8, https://doi.org/10.3389/feart.2020.560893, 2020.
Van Wambeke, F., Christaki, U., Giannakourou, A., Moutin, T., and Souvemerzoglou, K.: Longitudinal and vertical trends of bacterial limitation by phosphorus and carbon in the Mediterranean Sea., Microb. Ecol., 43, 119–133, https://doi.org/10.1007/s00248-001-0038-4, 2002.
Van Wambeke, F., Taillandier, V., Deboeufs, K., Pulido-Villena, E., Dinasquet, J., Engel, A., Marañón, E., Ridame, C., and Guieu, C.: Influence of atmospheric deposition on biogeochemical cycles in an oligotrophic ocean system, Biogeosciences Discuss. [preprint], https://doi.org/10.5194/bg-2020-411, in review, 2020.
Van Wambeke, F., Pulido, E., Catala, P., Dinasquet, J., Djaoudi, K., Engel, A., Garel, M., Guasco, S., Marie, B., Nunige, S., Taillandier, V., Zäncker, B., and Tamburini, C.: Spatial patterns of ectoenzymatic kinetics in relation to biogeochemical properties in the Mediterranean Sea and the concentration of the fluorogenic substrate used, Biogeosciences, 18, 2301–2323, https://doi.org/10.5194/bg-18-2301-2021, 2021.
Whitney, L. P. and Lomas, M. W.: Phosphonate utilization by eukaryotic phytoplankton, Limnol. Oceanogr. Lett., 4, 18–24, https://doi.org/10.1002/lol2.10100, 2018.
Wu, J., Sunda, W., Boyle, E. A., and Karl, D. M.: Phosphate Depletion in the Western North Atlantic Ocean, Science, 289, 759–762, https://doi.org/10.1126/science.289.5480.759, 2000.
Yamaguchi, T., Sato, M., Hashihama, F., Ehama, M., Shiozaki, T., Takahashi, K., and Furuya, K.: Basin‐scale variations in labile dissolved phosphoric monoesters and diesters in the central North Pacific Ocean, J. Geophys. Res.-Oceans, 124, 3058–3072, https://doi.org/10.1029/2018JC014763, 2019.
Yamaguchi, T., Sato, M., Hashihama, F., Kato, H., Sugiyama, T., Ogawa, H., Takahashi, K., and Furuya, K.: Longitudinal and Vertical Variations of Dissolved Labile Phosphoric Monoesters and Diesters in the Subtropical North Pacific, Front. Microbiol., 11, 570081, https://doi.org/10.3389/fmicb.2020.570081, 2021.
Zaccone, R., Boldrin, A., Caruso, G., La Ferla, R., Maimone, G., Santinelli, C., and Turchetto, M.: Enzymatic Activities and Prokaryotic Abundance in Relation to Organic Matter along a West–East Mediterranean Transect (TRANSMED Cruise), Microb. Ecol., 64, 54–66, https://doi.org/10.1007/s00248-012-0011-4, 2012.