the Creative Commons Attribution 4.0 License.
the Creative Commons Attribution 4.0 License.
 | 24 Nov 2021
Summertime productivity and carbon export potential in the Weddell Sea, with a focus on the waters adjacent to Larsen C Ice Shelf
Thomas G. Bornman
Jessica M. Burger
Shantelle Smith
Kurt A. M. Spence
Sarah E. Fawcett
The Weddell Sea represents a point of origin in the Southern Ocean where globally important water masses form. Biological activities in Weddell Sea surface waters thus affect large-scale ocean biogeochemistry. During January–February 2019, we measured net primary production (NPP), nitrogen (nitrate, ammonium, urea) uptake, and nitrification in the western Weddell Sea at the Antarctic Peninsula (AP) and Larsen C Ice Shelf (LCIS), in the southwestern Weddell Gyre (WG), and at Fimbul Ice Shelf (FIS) in the south-eastern Weddell Sea. The highest average rates of NPP and greatest nutrient drawdown occurred at LCIS. Here, the phytoplankton community was dominated by colonial Phaeocystis antarctica, with diatoms increasing in abundance later in the season as sea ice melted. At the other stations, NPP was variable, and diatoms known to enhance carbon export (e.g. Thalassiosira spp.) were dominant. Euphotic zone nitrification was always below detection, such that nitrate uptake could be used as a proxy for carbon export potential, which was highest in absolute terms at LCIS and the AP. Surprisingly, the highest f ratios occurred near FIS rather than LCIS (average of 0.73±0.09 versus 0.47±0.08). We attribute this unexpected result to partial ammonium inhibition of nitrate uptake at LCIS (where ammonium concentrations were 0.6±0.4 µM, versus 0.05±0.1 µM at FIS), with elevated ammonium resulting from increased heterotrophy following the accumulation of nitrate-fuelled phytoplankton biomass in early summer. Across the Weddell Sea, carbon export appears to be controlled by a combination of physical, chemical, and biological factors, with the highest potential export flux occurring at the ice shelves and lowest in the central WG.
- Article
(7014 KB) - Full-text XML
-
Supplement
(829 KB) - BibTeX
- EndNote


The Southern Ocean is an important driver of Earth's climate as it transports large quantities of heat and dissolved gases and supplies 65 %–85 % of the global ocean's nutrients (Keffer and Holloway, 1988; Sarmiento et al., 2004; Frölicher et al., 2015; Keller et al., 2016; Fripiat et al., 2021). Despite the Southern Ocean's central role in atmospheric CO2 removal (DeVries, 2014; Frölicher et al., 2015; Gruber et al., 2019), the incomplete drawdown of surface-water nutrients (i.e. nitrate, phosphate, and silicic acid) due to iron and light limitation of phytoplankton (Martin et al., 1991; Sunda and Huntsman, 1997) represents a missed opportunity for CO2 removal (Sarmiento and Toggweiler, 1984). The Weddell Sea constitutes a point of origin in the Southern Ocean where water masses form and communicate with the atmosphere before subducting (Muench and Gordon, 1995; Talley et al., 2011), thereby setting the initial physical and chemical conditions of the deep global ocean. Biogeochemical cycling in the surface Weddell Sea thus has implications for carbon transfer to and storage in the ocean interior (Hoppema et al., 2004; Kerr et al., 2018). The southern and western Weddell Sea are bounded by ice shelves, which promote high rates of summertime phytoplankton productivity, nutrient drawdown, and carbon export (El-Sayed and Taguchi, 1981; Hoppema and Goeyens, 1999; Hoppema et al., 2000), largely because the surface ecosystem is less iron- and light-limited in the ice-shelf-adjacent waters than in the open Weddell Sea (Klunder et al., 2014).
The Weddell Sea is separated from the Antarctic Circumpolar Current (ACC) and open Southern Ocean by the Weddell Sea fronts (Orsi et al., 1995). The general large-scale circulation takes the form of the cyclonic, wind-driven, and topographically steered Weddell Gyre (WG) (Fahrbach et al., 1994, 1995; Orsi et al., 1995). The production of bottom water is thought to occur at two sites in the Weddell Sea: at Filchner–Ronne Ice Shelf (FRIS) and Larsen C Ice Shelf (LCIS) (Gordon et al., 1993; Schröder et al., 2002; Schodlok et al., 2002). Here, Modified Warm Deep Water (MWDW) intrudes onto the continental shelf and mixes with Antarctic Surface Water (ASW), which alters its physical and chemical properties, ultimately resulting in the formation of dense bottom waters. Upon reaching the Antarctic Peninsula (AP), the transformed bottom waters either spill out over the shelf and re-enter the ACC or are entrained into the eastward-flowing limb of the WG (Orsi et al., 1993; Locarnini et al., 1993).
The surface waters of the open Weddell Sea are warm and saline, while those over the continental shelf are relatively cool and fresh (Nicholls et al., 2004). These different waters are separated by the Antarctic Slope Front (ASF; Jacobs, 1986, 1991), a fast-flowing jet situated between the 500 and 1000 m isobath that separates the Open Ocean Zone (OOZ) from the Coastal and Continental Shelf Zone (CCSZ; Jacobs, 1986, 1991; Muench and Gordon, 1995). The Antarctic CCSZ has been observed to host high rates of productivity in the summer (e.g. Smith and Nelson, 1990; Arrigo et al., 2008) as melting sea ice supplies dissolved iron and increases water-column stratification, yielding favourable conditions for phytoplankton growth (Lannuzel et al., 2008). Inputs of dissolved iron from continental shelf sediments and coastal runoff further elevate the ambient iron concentrations, such that the CCSZ seldom experiences iron depletion (Klunder et al., 2014; Dinniman et al., 2020). As a result, the large phytoplankton blooms of the CCSZ can at times almost completely deplete the surface nitrate concentrations (Jennings et al., 1984; Hoppema et al., 2000; Henley et al., 2017), supporting high rates of carbon export that fuel the benthic community on the underlying continental shelf (Isla et al., 2006, 2011; Pineda-Metz et al., 2019) and/or eventually lead to long-term storage of atmospheric CO2 in newly formed Antarctic Bottom Water (Arrigo et al., 2008). In contrast, the OOZ is far less productive due to persistent iron-deplete conditions, along with incidences of light limitation associated with high sea-ice concentrations (particularly in the central WG) and/or deep mixed layers (Klunder et al., 2011; De Jong et al., 2012). Here, the co-limitation of productivity by iron and light typically yields low rates of biological carbon export (Boyd et al., 2008; Boyd and Ellwood, 2010; Klunder et al., 2011; De Jong et al., 2012).
On an annual basis, phytoplankton growth in the euphotic zone that is fuelled by nitrate supplied from below (i.e. “new production”) must be balanced by the export of sinking organic matter into the ocean interior (i.e. “export production”), thus driving CO2 removal (Dugdale and Goering, 1967; Eppley and Peterson, 1979). By contrast, phytoplankton growth supported by nitrogen (N) sources that are recycled within the euphotic zone, such as ammonium and urea (i.e. “regenerated production”), results in no net removal of CO2 to the deep ocean. The biologically driven flux of carbon from surface waters, termed the “biological carbon pump”, transfers CO2 to the isolated waters of the deep ocean, regulating the atmospheric concentration of this greenhouse gas (Volk and Hoffert, 1985). The high-nutrient–low-chlorophyll state of much of the Southern Ocean represents a “leak” in the ocean's biological carbon pump since by consuming mixed-layer nutrients more completely, phytoplankton could theoretically lower atmospheric CO2 (Sarmiento and Toggweiler, 1984). Indeed, one hypothesis for the decrease in atmospheric CO2 that characterized the ice ages is more complete consumption of surface nutrients (i.e. a more efficient biological carbon pump) in the open Southern Ocean (Sigman and Boyle, 2000; Sigman et al., 2010; Martínez-García et al., 2014).
Since phytoplankton in the CCSZ of the Weddell Sea consume much of the nitrate supplied to the surface (Jennings et al., 1984; Hoppema et al., 2000), they should, by mass balance, drive the export of a significant amount of atmospheric CO2 (“fixed” as biomass) to depth, a significant portion of which will be subducted in newly formed bottom waters to be sequestered for >1000 years (Ito et al., 2010). Understanding the controls on biological nutrient utilization in the Weddell Sea, particularly in the CCSZ, is thus central to our understanding of its contribution to the Southern Ocean's role in setting atmospheric CO2. In general, phytoplankton growth in the Weddell Sea is regulated by the seasonal cycle of sea ice, with the associated availability of light and iron imposing the main constraints (El-Sayed and Taguchi, 1981). In winter, sea-ice formation and wind-driven mixing supply high concentrations of nutrients to ASW (Hoppema et al., 2007, 2015) that remain largely unconsumed due to the deep mixed layers and short days (Cota et al., 1992; Scharek et al., 1994; Spiridonov et al., 1996). Relief from light limitation in spring and early summer following increased water-column stratification due to sea-ice melt combined with enhanced solar radiation leads to the development of phytoplankton blooms. The size and duration of these blooms are ultimately dependent on macronutrient (e.g. nitrate and silicate) and micronutrient (e.g. iron) availability (Martin et al., 1991; Boyd, 2004; Boyd and Ellwood, 2010; Llort et al., 2015), as well as zooplankton grazing (Smetacek et al., 2004, and references therein; Arteaga et al., 2020).
Observations suggest that Weddell Sea phytoplankton blooms are initially dominated by smaller species (e.g. Phaeocystis antarctica, 2–6 µm) that are well adapted to the low-light conditions associated with deep springtime mixed layers (Moisan and Mitchell, 1999; Arrigo et al., 1999). As the season progresses, intensifying upper-water-column stratification provides suitable growth conditions for larger phytoplankton such as diatoms (Goffart et al., 2000; Nissen and Vogt, 2021). Diatoms tend to rely heavily on nitrate as their dominant N source under high-light and high-nutrient conditions and are generally outcompeted by smaller phytoplankton for ammonium (Probyn and Painting, 1985; Koike et al., 1986; Lomas and Glibert, 1999; Karsh et al., 2003). Diatoms are also a major vector for carbon export due to their rapid sinking rates facilitated by their generally larger size and biogenic silica ballasting (Tréguer et al., 2017). The seasonal shift in the Weddell Sea community from small, non-silicified phytoplankton to larger, more heavily silicified species is thus associated with a significant increase in carbon export (Assmy et al., 2013). Concomitantly, sea-ice melt supplies high concentrations of dissolved iron to surface waters (up to 7 nM in the western Weddell Sea; Lannuzel et al., 2008; Klunder et al., 2014), which helps to support nitrate drawdown (Klunder et al., 2011, 2014). Eventually, as surface iron (and, occasionally, nitrate; Hoppema, et al., 2000) concentrations again become limiting, phytoplankton rely proportionally more on ammonium and other regenerated N sources that have become increasingly available due to heterotrophic processing of the accumulated (i.e. bloom) biomass (Goeyens et al., 1995; Semeneh et al., 1998). The phytoplankton community consequently shifts once more towards smaller species that are better adapted to low-iron conditions and specialize in the consumption of regenerated N, ultimately leading to a decrease in carbon export (Goeyens et al., 1995).
The Weddell Sea is particularly understudied near LCIS where thick-sea-ice conditions persist all year round. To our knowledge, the only biogeochemical study conducted in the vicinity of LCIS was undertaken in the austral summer of 1992/93. Using measurements of nutrient depletion, Hoppema et al. (2000) estimated primary production in the vicinity of LCIS to be 47.5–95 , while in the central Weddell Sea it was substantially lower at 8.3 . However, because the study did not characterize the phytoplankton community, the extent to which phytoplankton diversity may have influenced primary production and nutrient drawdown cannot be surmised. To evaluate the summertime fertility of the Weddell Sea and the potential importance of different phytoplankton groups for carbon production and export, we directly measured the rates of total, new, and regenerated production in the western Weddell Sea (predominantly at LCIS), as well as at Fimbul Ice Shelf (FIS) in the south-eastern Weddell Sea. Rates of nitrification were also quantified to account for any nitrate regenerated within the euphotic zone at the time of sampling as this N flux supports regenerated rather than new production (e.g. Yool et al., 2007; Mdutyana et al., 2020). We interpret our uptake rates in the context of coincident measurements of regional hydrography, macronutrient concentrations and ratios, and phytoplankton community composition.
2.1 Field collections
Sampling was conducted in January–February 2019 during the Weddell Sea Expedition on board the R/V SA Agulhas II (Dowdeswell et al., 2019). A total of 19 stations were sampled across the Weddell Sea and are categorized based on their geographic position as Antarctic Peninsula (AP), Larsen C Ice Shelf (LCIS), Weddell Gyre (WG), or Fimbul Ice Shelf (FIS) stations (Table 1, Fig. 1). Hydrographic data were collected using a Sea-Bird conductivity–temperature–depth (CTD) profiler equipped with a photosynthetically active radiation (PAR) sensor. Density (sigma theta, σθ) was derived from CTD measurements of temperature, salinity, and pressure and was used to identify the water mass distributions. The mixed-layer depth (MLD) was determined as the depth at which the Brunt–Väisälä frequency squared (N2, a function of σθ) reached a maximum (Schofield et al., 2015).
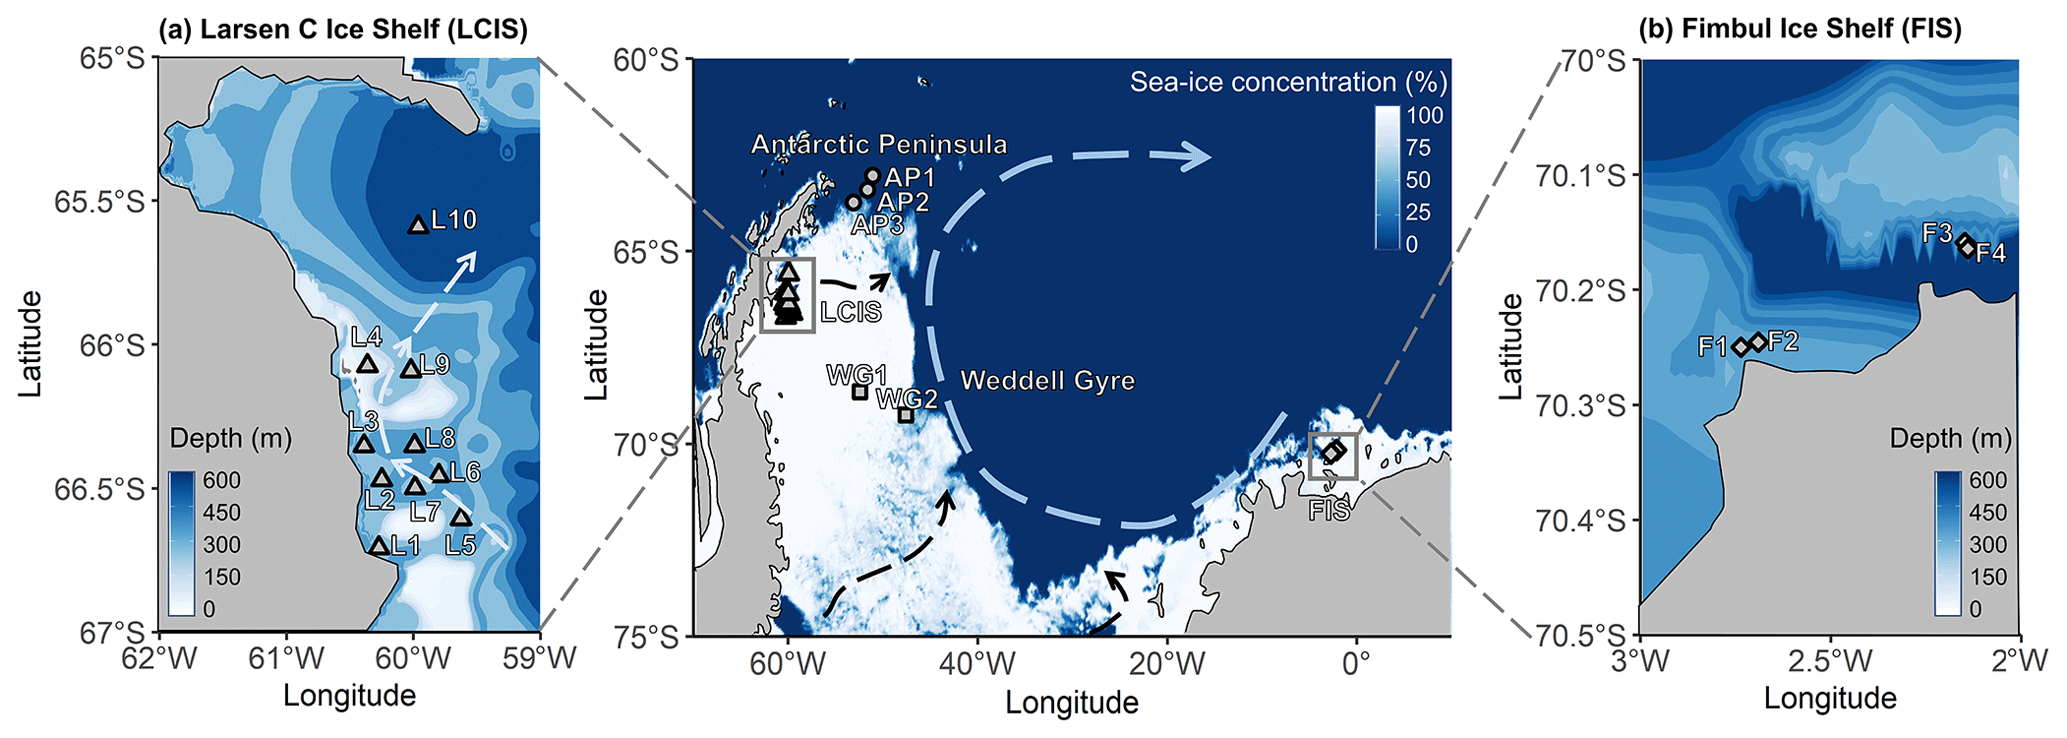
Figure 1Maps of the Weddell Sea, Larsen C Ice Shelf (LCIS; insert a), and Fimbul Ice Shelf (FIS; insert b) showing the position of the stations where rate experiments were conducted during the Weddell Sea Expedition in January–February 2019. The symbols represent the different regions of the Weddell Sea sampled during the expedition (circle – Antarctic Peninsula (AP); diamond – FIS; triangle – LCIS; square – Weddell Gyre (WG)). The general cyclonic circulation of the Weddell Gyre (dashed blue arrow) is illustrated on the central map, with the dashed black arrows indicating the input of modified water masses from Filchner–Ronne Ice Shelf (FRIS) and LCIS (Gordon et al., 1993; Schröder et al., 2002; Schodlok et al., 2002). The hypothesized circulation at LCIS (Nicholls et al., 2004; Hutchinson et al., 2020) is shown by the dashed light-blue arrow in insert (a). The 3.125 km sea-ice concentration data from 31 January 2020 shown in the central panel were taken from ftp://ftp-projects.cen.uni-hamburg.de/seaice/AMSR2/3.125km (last access: 29 September 2021), and the bathymetry data (inserts a and b) were taken from ETOPO1 (NOAA National Geophysical Data Center, 2009).
Seawater was collected from discrete depths using a rosette of twenty-four 12 L Niskin bottles. At each station, seawater samples for nutrient analysis were collected throughout the water column (typically at 15 discrete depths), while samples for phytoplankton taxonomy and rate experiments were taken from three to six depths (see below) that were selected based on profiles of temperature, chlorophyll a fluorescence, and PAR measured during the CTD down casts.
Simulated in situ experiments were conducted to determine the rates of net primary production (NPP), N uptake (as nitrate (), ammonium (), and urea-N), and nitrite () oxidation (a measure of nitrification). For NPP and N uptake, seawater was collected from three depths coinciding with the 55 %, 10 %, and 1 % PAR levels, then pre-screened through 200 µm mesh to remove large grazers, and transferred to six 1 L and six 2 L polycarbonate bottles per depth. 15N-labelled , , or urea-N was added to 4 of the 12 bottles (i.e. two 1 L and two 2 L bottles per N species), and NaH13CO3 was added to the bottles amended with 15N-. The tracers were added at ∼5 %–10 % of the assumed ambient concentrations, yielding final concentrations in each bottle of approximately 100 µM NaH13CO3, 1 µM 15N-, 0.05 µM 15N-, and 0.1 µM 15N-urea-N. Bottles were incubated on the deck for 4–6 h in a custom-built incubator that was cooled with running surface (∼7 m) seawater and equipped with neutral density filters to simulate the relevant light levels. Experiments were terminated via filtration onto 0.3 µm combusted (450 ∘C for 8 h) glass fibre filters (Sterlitech GF-75) that were stored frozen in combusted (500 ∘C for 5 h) foil envelopes at pending analysis.
Seawater samples for the oxidation experiments were collected from the 55 %, 10 %, and 1 % light levels; just below the MLD; and at 200 and 500 m. From each depth, seawater was transferred into duplicate 250 mL opaque high-density polyethylene (HDPE) bottles to which 15N- was added to achieve a final tracer concentration of 0.1 µM. An initial 50 mL subsample (Tinitial) was collected from each HDPE bottle immediately following tracer addition and frozen at −20 ∘C until analysis ashore. The 55 %, 10 %, 1 %, and MLD sample bottles were incubated in the on-deck incubator for 20–30 h while the 200 and 500 m samples were incubated in a ∼2 ∘C cold room. The experiments were terminated by the collection and freezing of 50 mL Tfinal subsamples.
2.2 Nutrients
2.2.1 Nutrient concentration analysis
and silicic acid (Si(OH)4) concentrations were measured using a Lachat QuickChem flow injection analysis platform following published autoanalysis protocols (Diamond, 1994; Grasshoff, 1976) in a configuration with a detection limit of 0.5 µM. Duplicate samples were measured for and Si(OH)4 on different days, and the standard deviation for duplicates was ≤0.5 µM, with a lower standard deviation for lower-concentration samples. concentrations were determined by subtraction of from . Concentrations of phosphate () and were measured shipboard by standard benchtop colourimetric methods (Strickland and Parsons, 1968; Bendschneider et al., 2020; Parsons et al., 1984) using a Thermo Scientific Genesys 30 Visible spectrophotometer. The detection limit was 0.05 µM, and the standard deviation for duplicate samples was ≤0.05 µM. Aliquots of a certified reference material (JAMSTEC, Lot CG) were analysed during autoanalyser and manual runs to ensure measurement accuracy.
concentrations were measured shipboard following the fluorometric method of Holmes et al. (1999) using a Turner Designs Trilogy fluorometer equipped with a UV module. The detection limit was <0.05 µM, and the standard deviation for duplicate samples was ≤0.05 µM. The matrix effect (ME) that results from the calibration of seawater samples with Milli-Q water standards was calculated using the standard addition method (Saxberg and Kowalski, 1979). All samples were corrected for the ME (Taylor et al., 2007), which was always <10 % and typically ≤5 %. Urea-N concentrations were measured via the colourimetric method of Revilla et al. (2005) using a Thermo Scientific Genesys 30 Visible spectrophotometer equipped with either a 1 cm or a 5 cm pathlength cell. The detection limit was 0.05 µM, and the standard deviation for duplicate samples was ≤0.05 µM. Hereafter, we use “urea” when referring to urea-N.
2.2.2 Estimating nutrient depletion
The net decrease in euphotic zone nutrient concentrations following nutrient recharge in winter (i.e. the extent of nutrient depletion due to consumption by phytoplankton), between the start of the growing season until the time of our sampling, can be estimated for each station as
where [X]source is the average [], [Si(OH)4], or [] in winter water (WW, a shallow temperature minimum layer underlying ASW that is the remnant of the winter mixed layer and considered representative of pre-bloom surface conditions) and [X]measured is the measured summertime nutrient concentration (Le Corre and Minas, 1983; Jennings et al., 1984; Goeyens et al., 1995; Hoppema et al., 2007).
Seasonal melting of sea ice in the Weddell Sea introduces low-salinity, low-nutrient waters that dilute the biogeochemistry of the mixed layer (Eicken, 1993), potentially leading to an overestimation of phytoplankton-driven nutrient depletion. We correct for the depletion in the surface [], [Si(OH)4], or [] due to sea-ice melt (i.e. the dilution effect) as
where X depletion(meltwater) is the decrease in surface [], [Si(OH)4], or [] due to sea-ice melt, calculated as
Here, the nutrient concentrations in summertime sea ice ([X]sea ice) are assumed to be []sea ice=1 µM, [Si(OH)4]sea ice=5 µM, and []sea ice=0.3 µM (Fripiat et al., 2014, 2017), and:
with salinitysea ice taken to be 5 based on sea-ice salinity measurements made during the cruise (Dowdeswell et al., 2019) and salinitysource set to 34.2 at FIS and 34.4 at the other stations (the salinity of WW, Fig. 2g). On average, correcting for sea-ice melt changed the estimates of X depletion by 0.4 %±0.9 %. Hereafter, all references to nutrient depletion are to the computed values of X depletion(corrected). The approach above for calculating X depletion(corrected) assumes, following correction for sea-ice melt, that nutrient drawdown is due to phytoplankton assimilation only, a reasonable assumption in the Weddell Sea in summer.
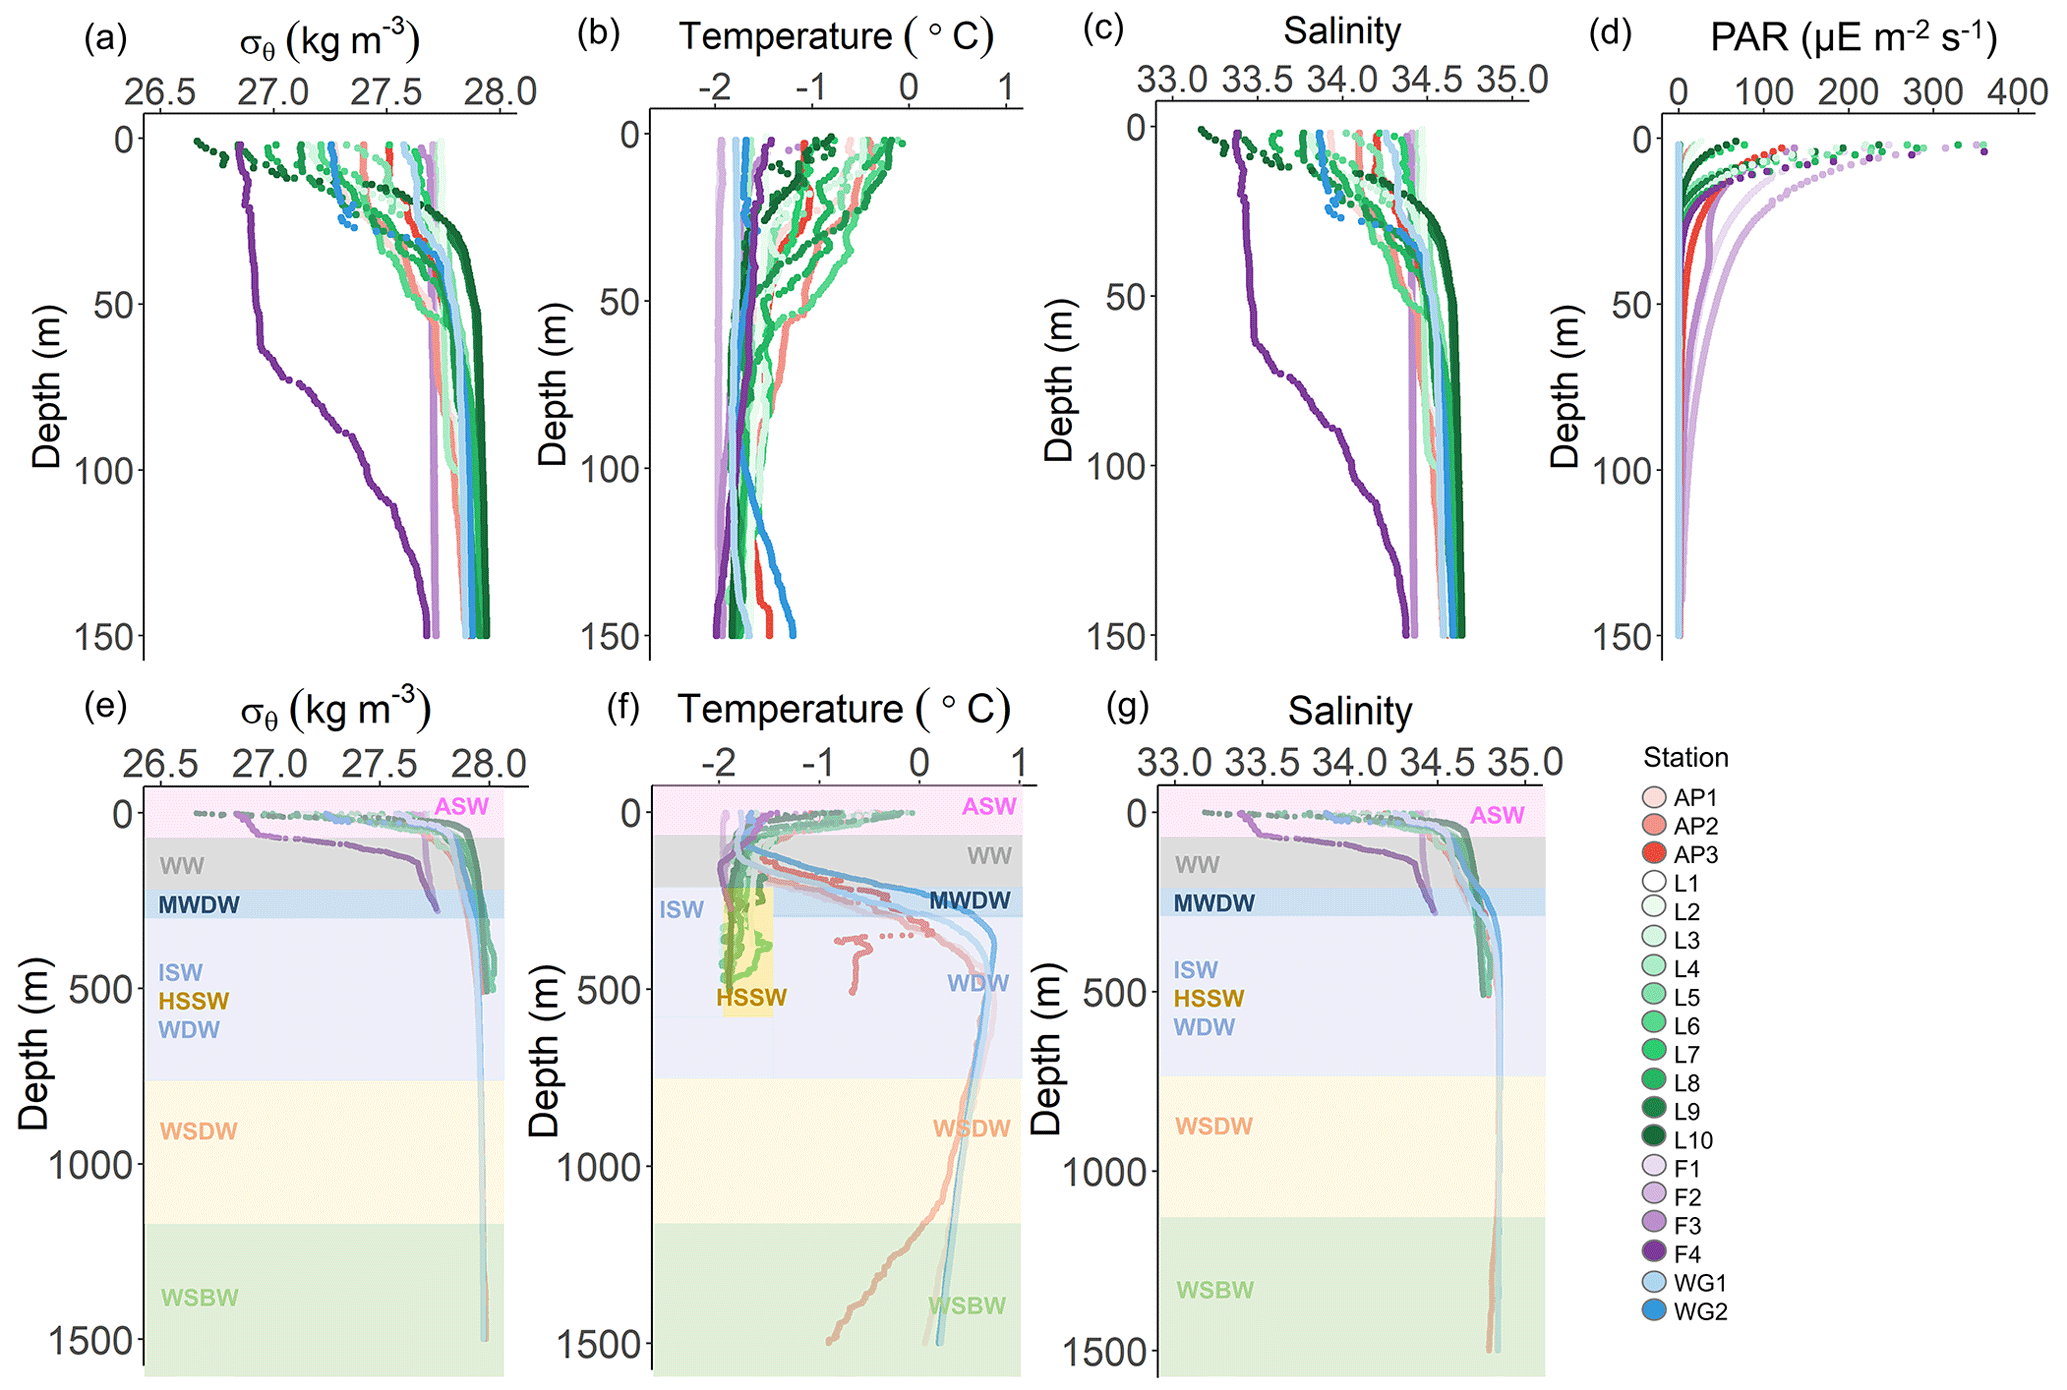
Figure 2Depth profiles of (a) potential density (σθ), (b) potential temperature, (c) absolute salinity, and (d) photosynthetically active radiation (PAR) in the upper 150 m and (e) σθ, (f) potential temperature, and (g) absolute salinity in the upper 1500 m at all stations. The water masses present at each station, identified by their temperature and salinity characteristics, are denoted in panels (e–g) as follows: WSBW – Weddell Sea Bottom Water, WSDW – Weddell Sea Deep Water, WDW – Warm Deep Water, MWDW – Modified Warm Deep Water, ISW – Ice Shelf Water, HSSW – High Salinity Shelf Water, WW – Winter Water, and ASW – Antarctic Surface Water. In panel (f), the dark yellow rectangle indicates HSSW. The general station locations are indicated by the different marker colours: red shades – Antarctic Peninsula, green shades – Larsen C Ice Shelf, blue shades –Weddell Gyre, light purple shades – early-summer Fimbul Ice Shelf, and dark purple – late-summer Fimbul Ice Shelf.
2.3 Uptake rates
Incubation filters were oven-dried for 24 h at 40 ∘C and then folded into tin cups. Samples were analysed using a Flash Elemental Analyzer 1112 Series coupled to a Delta V Plus isotope ratio mass spectrometer (IRMS) in a configuration with a detection limit of 2 µg C and 1 µg N. Blanks (combusted unused filters + tin cups) and laboratory running standards, calibrated to certified IAEA reference materials, were run after every five samples.
The specific rates of carbon fixation (VC) and , , and urea uptake (, , Vurea; d−1) were calculated according to Eq. (2) in Dugdale and Wilkerson (1986). NPP and the absolute rates of , , and urea uptake (ρ, ρ, and ρurea; µM d−1) were then determined by multiplying VC by the concentration of particulate organic carbon ([POC]) and , , and Vurea by the concentration of particulate organic nitrogen ([PON]) (Dugdale and Wilkerson, 1986; Eq. 3).
2.4 oxidation rates
The Tinitial and Tfinal samples from the oxidation incubations were measured for the δ15N of (δ15N, where ) using the denitrifier method (Sigman et al., 2001; McIlvin and Casciotti, 2011). Prior to isotopic analysis, all samples were treated with sulfamic acid to remove as the denitrifier method converts both and to N2O gas (Granger and Sigman, 2009); the difference in δ15N between the Tfinal and Tinitial samples was then taken as the enrichment due to oxidation (Peng et al., 2015). Results were referenced to atmospheric N2 using certified reference materials (IAEA-NO-3, USGS34, and USGS32; Gonfiantini, 1984; Böhlke and Coplen, 1995; Böhlke et al., 2003). The rate of oxidation (; nM d−1) was calculated following Peng et al. (2015) as
where is the difference in the concentration of between the end and the start of the experiment (i.e. Tfinal−Tinitial) due to oxidation, is the fraction of at the start of the incubation, and t is the length of the incubation (days). The detection limit for ranged from 0.06–0.46 nM d−1 (calculated following Santoro et al., 2013). We take as a measure of the nitrification rate given that oxidation is the step in the nitrification pathway that produces .
To determine the relative carbon export potential at each station, we calculated the f ratio (a measure of new production relative to total (i.e. new + regenerated) production) using the absolute N uptake and oxidation rates and a modified version of the Eppley and Peterson (1979) equation:
Equations (4a) and (4b) account for euphotic zone nitrification (Mdutyana et al., 2020), which yields regenerated rather than new that is then available for phytoplankton to consume. Not accounting for could result in the f ratio being overestimated (Yool et al., 2007). Equation (4b) accounts for urea uptake, which was either measured (at the LCIS stations and WG1) or calculated (at the AP, FIS, and WG2) (see Sect. 3.3.4 below).
2.5 Phytoplankton taxonomy and carbon biomass
At all stations, microphytoplankton samples were collected between the surface and 30 m using a HYDRO-BIOS conical plankton net (r=12.5 cm; h=50 cm) with a mesh size of 55 µm. Samples were transferred to 50 mL centrifuge tubes, fixed with 10 µL of 25 % glutaraldehyde, and stored at room temperature in the dark until later analysis via light and scanning electron microscopy. Additionally, samples for flow cytometry were collected in 50 mL centrifuge tubes from Niskin bottles fired at the 55 %, 10 %, and 1 % PAR depths. These samples were fixed with 10 µL of 25 % glutaraldehyde and stored in the dark at 4 ∘C until analysis.
Onshore, each preserved net sample was homogenized, and one drop (40 µL) was wet mounted on a slide. All the cells on the slide with intact chloroplasts (i.e. alive at the time of sampling) were counted at 400× or 630× magnification using a Zeiss Axioscope A1 light microscope (LM). The number of cells mL−1 was calculated as
where A is the number of cells per drop, mL is the volume of water sampled (1 470 000 mL, computed using the volume of a cylinder, π r2 h, where r is 125 mm and h is 30 000 mm depth), n is the total volume of the concentrated sample, and V is the volume of one drop of the concentrated sample.
An aliquot of 5 mL from each preserved sample was cleaned by removing carbonate particles and organic matter using 10 % hydrochloric acid and 37 % hydrogen peroxide, respectively. After thorough rinsing with distilled water, permanent slides were prepared by pipetting the cleaned material onto acid-washed coverslips, air-drying them overnight, and mounting the cover slips onto glass slides using Naphrax® mountant (refractive index is 1.7). The permanent slides were examined using a Zeiss Axioscope A1 LM equipped with differential interference contrast at 1000× magnification (under oil immersion) for identification of the diatom cells to the lowest taxonomic classification possible. Stubs were also prepared from the cleaned material for scanning electron microscopy (SEM), with a JEOL JSM-7001F field emission SEM instrument used to visualize the morphological features not evident under the LM.
The average size (µm) and carbon content (pg C per cell) of each identified diatom species were taken from Leblanc et al. (2012) for high-latitude locations (50–70∘ S) (Table S1 in the Supplement), and the carbon content of colonial P. antarctica was estimated as 13.6 pg C per cell (Mathot et al., 2000) for single cells within a colony. Since the majority of P. antarctica were in spherical colony form, the total colony carbon biomass (CCOL) was calculated as
where NC is the number of cells counted per litre, CM is the mucus-related carbon calculated as , and VCOL is the volume of the spherical colony calculated as (Mathot et al., 2000).
Flow cytometry samples were analysed using a BD LSR II SORP flow cytometer with blue–red–green laser configuration. The size class to which each cell belonged was defined based on its forward scatter area (FSC-A) relative to the FSC-A of 2.8 and 20 µm beads (Fig. S1a in the Supplement). Once categorized as picoplankton (<2.8 µm), nanoplankton (2.8–20 µm), or microplankton (>20 µm), the cells were grouped into six populations based on their orange fluorescence (indicative of phycoerythrin, PE) relative to their red fluorescence (indicative of chlorophyll a, chl a): two Synechococcus populations (Syn 1 and Syn 2), one picoeukaryote population (PicoEuk), two nanoeukaryote populations (NanoEuk 1 and NanoEuk 2), and one microeukaryote population (MicroEuk; see Sect. S2 in the Supplement for details of population identification). The biovolumes of the eukaryotic populations were estimated based on their FSC-A relative to that of six beads of known size and volume (Fig. S1c, Table S2 in the Supplement). Synechococcus had an unrealistically high measured FSC-A, which is an artefact of the high ratio of photosystem I to photosystem II of the group compared to the other phytoplankton populations. This elevates electron chain activity, leading to an increase in the emission spectrum and low excitation of the Synechococcus populations (Kaprelyants and Kell, 1993; Sunda and Huntsman, 2015). The biovolume of Synechococcus was thus assumed to be 1 µm3 (Kana and Glibert, 1987; Paulsen et al., 2015). Biovolume is used here as a proxy for biomass.
3.1 Water-column hydrography
Throughout the study region, relatively cool and fresh (−2 to 0 ∘C and 33.0 to 34.5) ASW occurred between the surface and 135 m (Fig. 2). Through this layer and down to 200 m, salinity increased with depth while temperature decreased, reaching a local minimum (−1.6 ∘C) at ∼100 m. These hydrographic changes are characteristic of WW, which is considered a summertime record of winter conditions and a reflection of the initial state from which the mixed layer evolves over the spring–summer growing season (Altabet and Francois, 2001). Below WW at the AP and WG stations, salinity remained constant while temperature increased with depth, reaching a local maximum (0.5 ∘C) at 500 and 300 m for the AP and WG, respectively. This feature is characteristic of Warm Deep Water (WDW), a temperature maximum layer that is a modified form of Circumpolar Deep Water (CDW) (Muench and Gordon, 1995; Fahrbach et al., 1995). Below WW at the LCIS and FIS stations, salinity increased, and temperature decreased with depth, reaching a local salinity maximum (34.6 at LCIS and 34.3 at FIS) and temperature minimum ( ∘C). The increase in salinity is characteristic of High Salinity Shelf Water (HSSW) produced by brine rejection during sea-ice formation, while the decrease in temperature is indicative of Ice Shelf Water (ISW) produced by the supercooling of ASW under the ice shelves (Fahrbach et al., 1995; Nicholls et al., 2009; Hutchinson et al., 2020). The densities of WW, WDW, HSSW, and ISW are contiguous, with the mixed product of these waters termed Modified Warm Deep Water (MWDW) (Fahrbach et al., 1995). Below WDW at the AP and WG stations, temperature decreased due to the presence of Weddell Sea Deep Water (WSDW, temperature range of −0.7 to 0 ∘C) and Weddell Sea Bottom Water (WSBW, temperature ∘C) (Fahrbach et al., 1995; Muench and Gordon, 1995).
Variability in the density of ASW was observed among the stations (Fig. 2a). The surface density profiles at the AP, WG, and early-summer FIS stations were very similar, while the late-summer density profile at FIS revealed lower-density waters in the upper 100 m. At LCIS, the surface density profiles were highly variable, and no consistent pattern was observed, although the most northern stations (L9 and L10, Fig. 1) were characterized by the lowest densities. Stations L1 and L3, situated closest to the ice shelf, were characterized by the highest densities, contiguous with the underlying WW layer.
The MLD appeared most strongly controlled by salinity at all stations and was always shallower than the depth of the euphotic zone (Zeu; Table 1, Fig. 2a–d), the latter defined as the depth to which 1 % of surface PAR penetrated (Kirk, 1994). The deepest MLD and Zeu were observed at FIS in early summer (average MLD of 103.0±36.6 m and Zeu of 91.7±14.4 m; n=3), while the shallowest MLD and Zeu were observed at LCIS (average MLD of 13.9±5.9 m and Zeu of 28.5±9.1 m; n=10) (Fig. 2d, Table 1). The rates of NPP, N uptake, and nitrification were therefore trapezoidally integrated to Zeu rather than to the MLD since we assume that phytoplankton were active at least to the depth of 1 % PAR.
3.2 Nutrient concentrations
The concentrations of the regenerated N forms (i.e. and urea) were generally low in the surface and increased with depth to reach a maximum in the shallow subsurface (Fig. 3a and b). A sharp maximum in the concentration was observed near Zeu at all stations, indicative of the depth of maximum net remineralization. Urea concentrations were more variable, likely due to variability in the processes that produce this N form (e.g. bacterial excretion; Berges and Mulholland, 2008). The highest average concentrations of regenerated N in the euphotic zone were observed at LCIS and FIS in late summer (0.62±0.30 µM for and 0.21±0.07 µM for urea), while the lowest concentrations were observed at FIS in early summer (below detection for both and urea). Elevated regenerated N concentrations were also observed at the AP stations (euphotic zone average of 0.8±0.3 µM for and 0.2±0.06 µM for urea), while low concentrations were observed at the WG stations (euphotic zone average of 0.3±0.1 µM for and 0.1±0.0 µM for urea).
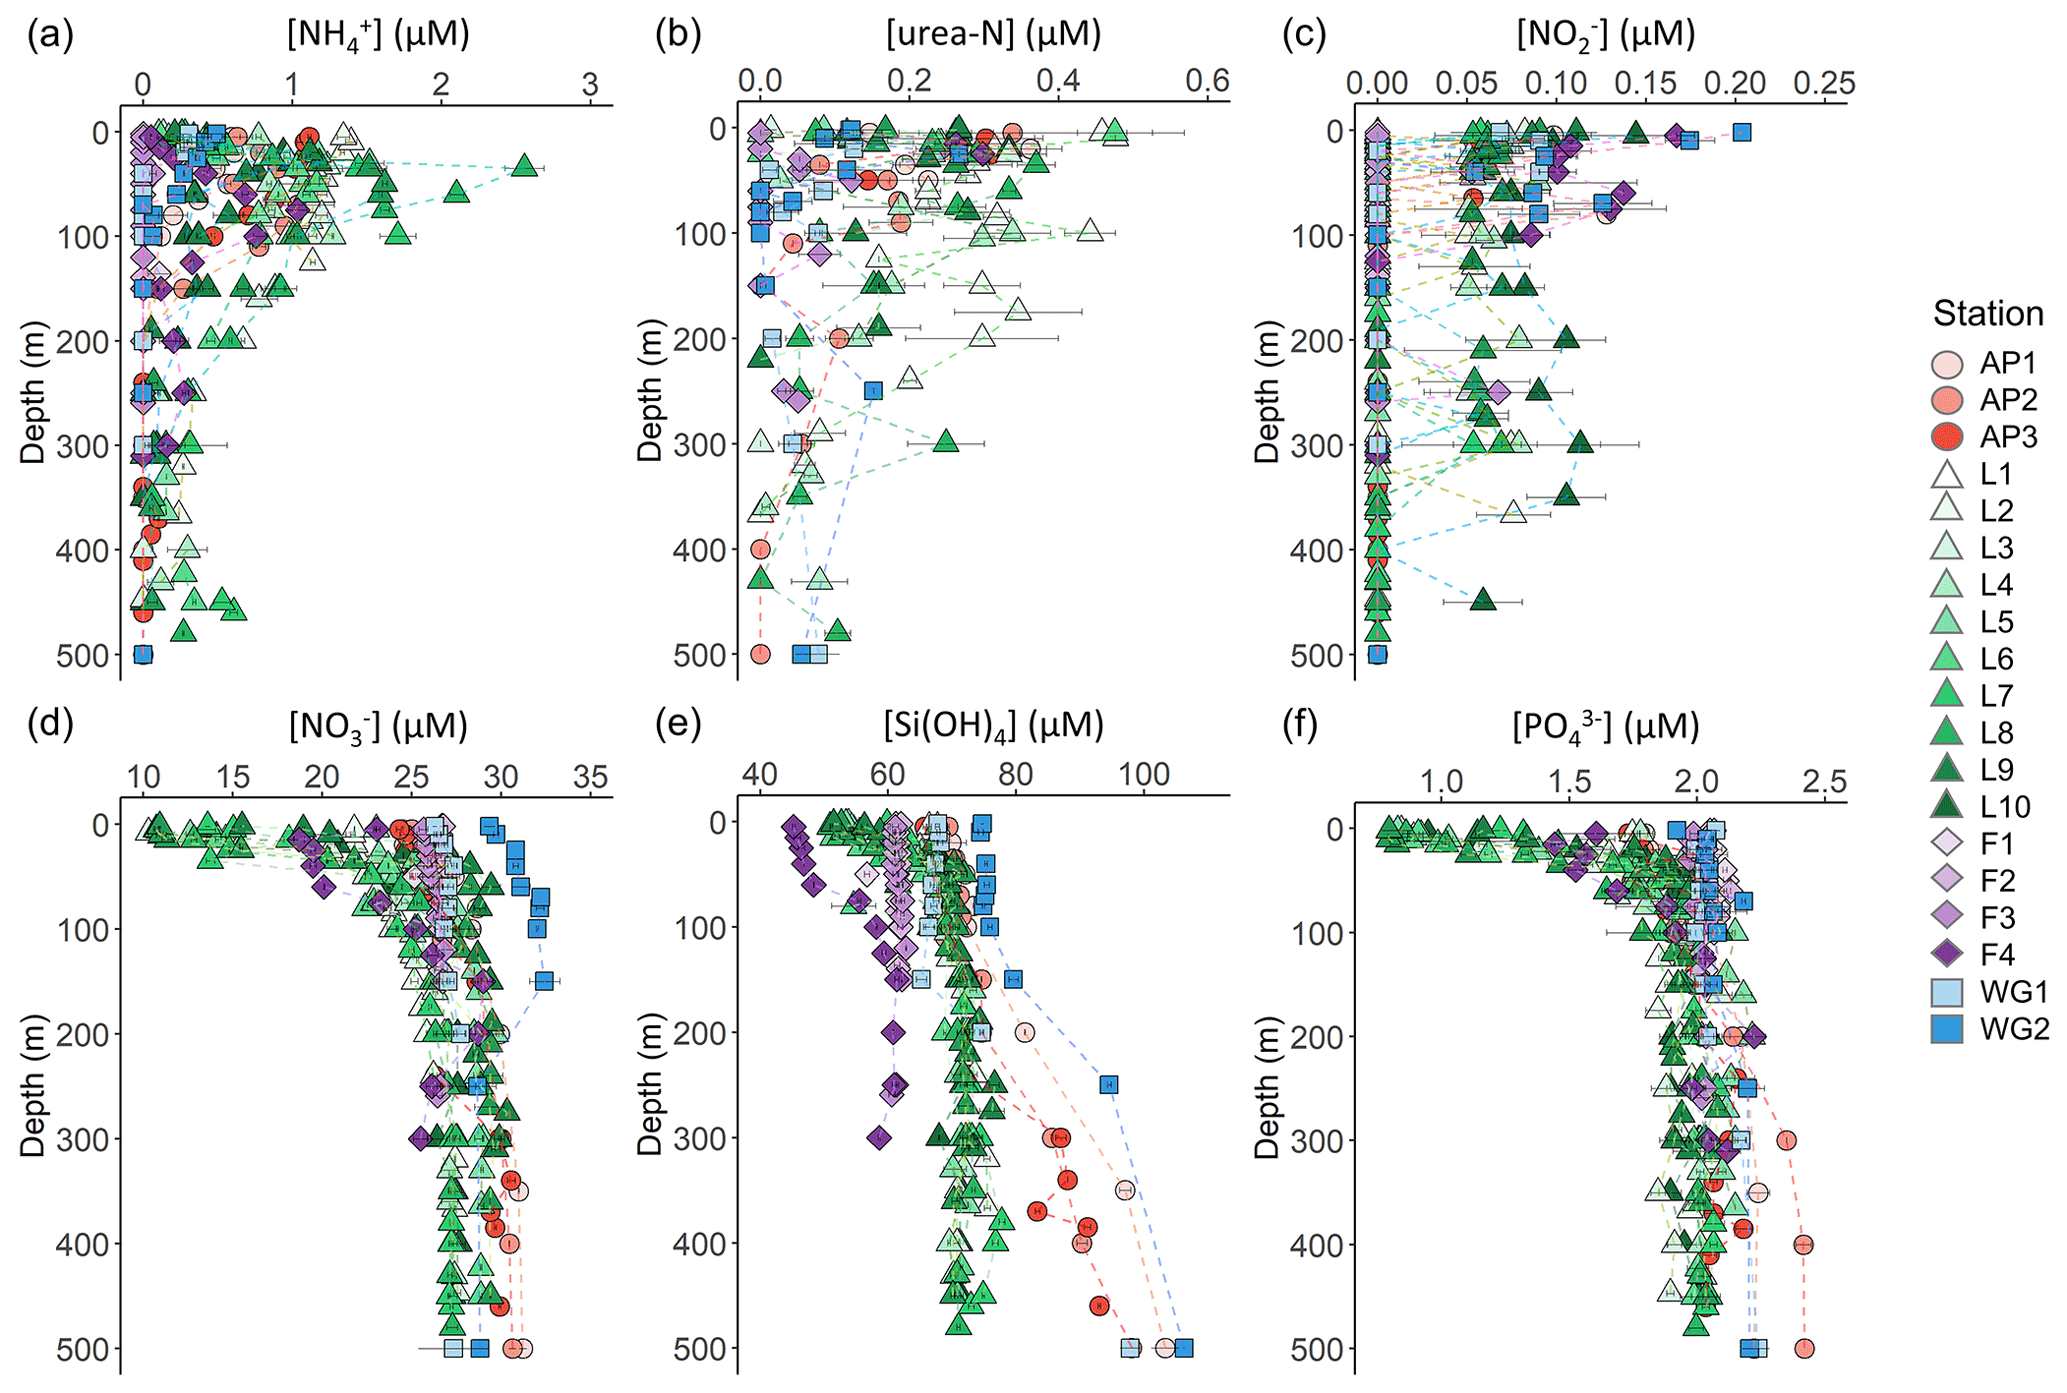
Figure 3Depth profiles (0–500 m) of (a) , (b) urea-N, (c) , (d) , (e) Si(OH)4, and (f) concentrations. For all panels, the error bars represent ±1 SD of replicate samples (). For , which was calculated as , error has been propagated according to standard statistical practices. Note that the x-axis scales in panels (d–f) do not start at zero.
The concentrations of were generally low throughout the euphotic zone and decreased to below detection by 120 m at the FIS, AP, and WG stations (with the exception of a single sample from the early-summer FIS) and by 500 m at LCIS (Fig. 3c). A high degree of variability was observed, with the highest surface-layer concentrations occurring in the WG and at FIS in late summer (average euphotic zone concentrations of 0.08±0.06 µM and 0.12±0.03 µM, respectively).
The euphotic zone concentrations of , Si(OH)4, and decreased towards the surface due to assimilation by phytoplankton (Fig. 3d–f). The lowest surface concentrations of and were observed at LCIS (16.6±3.8 µM and 1.3±0.4 µM, respectively) and of Si(OH)4 at FIS in late summer (46.1±0.8 µM). The highest surface concentrations of , , and Si(OH)4 occurred in the WG (28.8±2.4 µM, 2.0±0.54 µM, and 70.1±3.8 µM, respectively). Elevated Si(OH)4 and concentrations were observed between 200 and 500 m at the AP and WG stations due to the presence of WDW at these stations versus shelf waters (i.e. ISW and HSSW) at LCIS and FIS. The depth of maximum remineralization in the open Weddell Sea is 300–500 m, the depth range occupied by WDW (Vernet et al., 2019, and references therein). The high rates of remineralization, and therefore nutrient accumulation, in WDW account for the elevated nutrient concentrations observed in WDW relative to the shelf water masses (Whitworth and Nowlin, 1987). Estimates of , Si(OH)4, and depletion (i.e. X depletion(corrected), Eq. 2) were highest at LCIS (average depletion of 8.3±3.9 µM, Si(OH)4 depletion of 8.3±4.0 µM, and depletion of 0.6±0.3 µM), while the lowest nutrient depletions occurred in early summer at FIS (average depletion of 0.3±0.3 µM, Si(OH)4 depletion of 0.6±0.6 µM, and depletion of 0.00±0.02 µM) (Fig. 4a–c, Table 1).
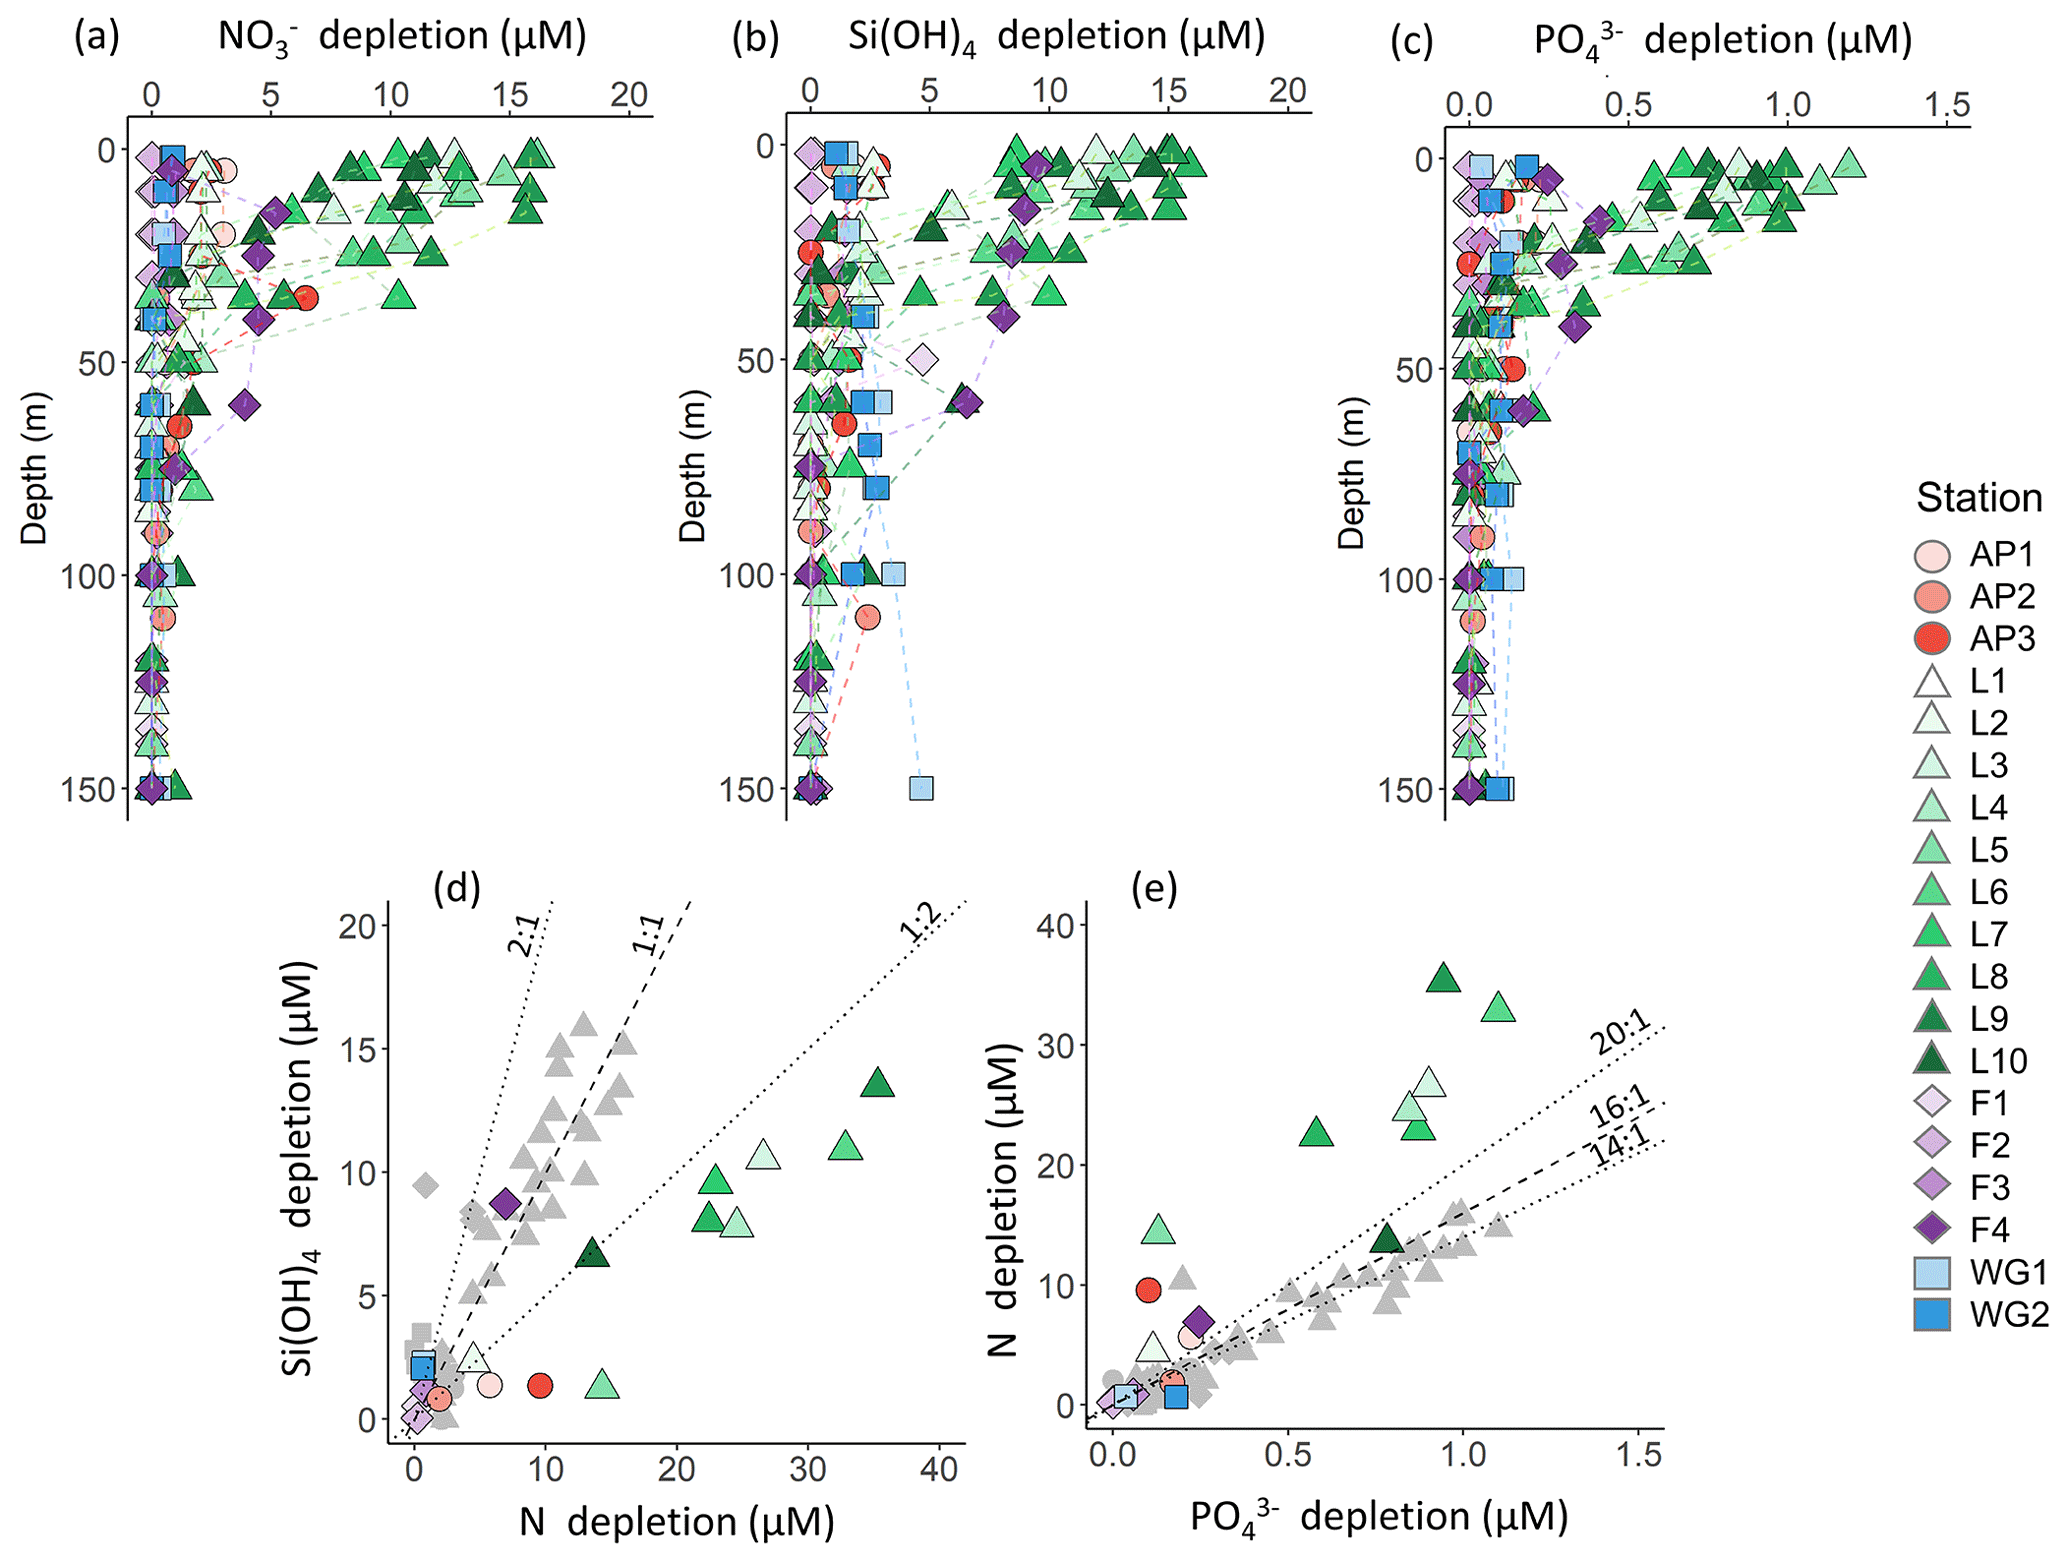
Figure 4Depth profiles (0–150 m) of (a) depletion, (b) Si(OH)4 depletion, and (c) depletion at each station. Also shown are scatterplots of (d) Si(OH)4 depletion versus total N depletion (coloured symbols; see text for details) and Si(OH)4 depletion versus depletion (grey symbols) and (e) depletion versus total N depletion (coloured symbols) and depletion versus depletion (grey symbols) at each station. The dashed line in panel (d) represents the 1:1 Si:N depletion ratio, expected for iron-replete diatoms (Ragueneau et al., 2000; Hutchins and Bruland, 1998; Takeda, 1998; Mosseri et al., 2008), while the dotted lines represent the 2:1 Si:N ratio, expected for iron-limited diatoms (Arrigo et al., 1999; Franck et al., 2000; Brzezinski et al., 2003; Green and Sambrotto, 2006; Mosseri et al., 2008; Weber and Deutsch, 2010; Martiny et al., 2013), and the 1:2 Si:N ratio, indicative of enhanced activity of non-siliceous phytoplankton. The dashed line in panel (e) represents the 16:1 N:P depletion ratio (the Redfield ratio), while the dotted lines represent the 20:1 N:P ratio, expected for P. antarctica, and the 14:1 N:P ratio, expected for iron-replete diatoms (Hutchins and Bruland, 1998; Takeda, 1998; Arrigo et al., 1999; Ragueneau et al., 2000; Mosseri et al., 2008).
Variations in the depletion ratios of and can be used as indicators of the nutrient status of the phytoplankton community, particularly diatoms. Under iron-replete conditions, diatoms have been observed to consume Si(OH)4 and in a ratio of and and in a ratio of (Hutchins and Bruland, 1998; Takeda, 1998; Ragueneau et al., 2000; Mosseri et al., 2008), while under conditions of limitation, the ratio of uptake rises (to ) and that of uptake decreases (to as low as 10:1) (Arrigo et al., 1999; Franck et al., 2000; Brzezinski et al., 2003; Green and Sambrotto, 2006; Mosseri et al., 2008; Weber and Deutsch, 2010; Martiny et al., 2013). Additionally, the dominance of one phytoplankton species over another may cause deviations in the depletion ratio. For example, in regions dominated by P. antarctica, Arrigo et al. (1999) observed a depletion ratio of , while in areas dominated by iron-deplete diatoms, this ratio was . The depletion ratios can thus also yield insights into the dominant phytoplankton species active in the upper water column. In our study, the average euphotic zone depletion ratios ranged from 0.5 to 6.1 (Table 1), with the highest ratios estimated for the WG stations (average of 5.4±5.5) and at FIS in late summer (average of 2.3±0.5). The euphotic zone average depletion ratios were more variable, ranging from 3.7±1.5 to 48.6±11.5, with the lowest ratios computed for the WG stations (average of 4.1±1.5) and the highest for FIS in early summer (average of 33.7±3.6). In the latter case, the degree of Si(OH)4 and depletion was extremely low (Table 1), which likely accounts for the variable and anomalous and depletion ratios computed for stations F1–F3.
3.3 Upper ocean biomass, NPP, and N uptake rates
3.3.1 Particulate organic carbon and nitrogen
The highest concentrations of POC and PON were observed in the surface at all stations (Fig. 5a and b), decreasing towards Zeu (Fig. 5g and h). Averaged over the euphotic zone, the lowest POC and PON concentrations occurred in early summer at FIS (4.6±1.5 and 0.3±0.1 µM, respectively) and the highest at LCIS (17.9±7.3 and 2.5±0.8 µM, Table 2). Across the region, the biomass C:N ratio was fairly uniform throughout the euphotic zone, except at stations F1, F2, WG1, and WG2 (Fig. 5c, f, and i). In general, the FIS and WG stations were characterized by significantly higher C:N ratios than those expected from Redfield stoichiometry (), averaging 16.5±8.8 and 12.3±1.8, respectively. By contrast, at the LCIS stations, the biomass C:N ratios were close to the Redfield ratio (7.4±1.9), while the AP stations were characterized by slightly higher C:N ratios (8.3±2.5).
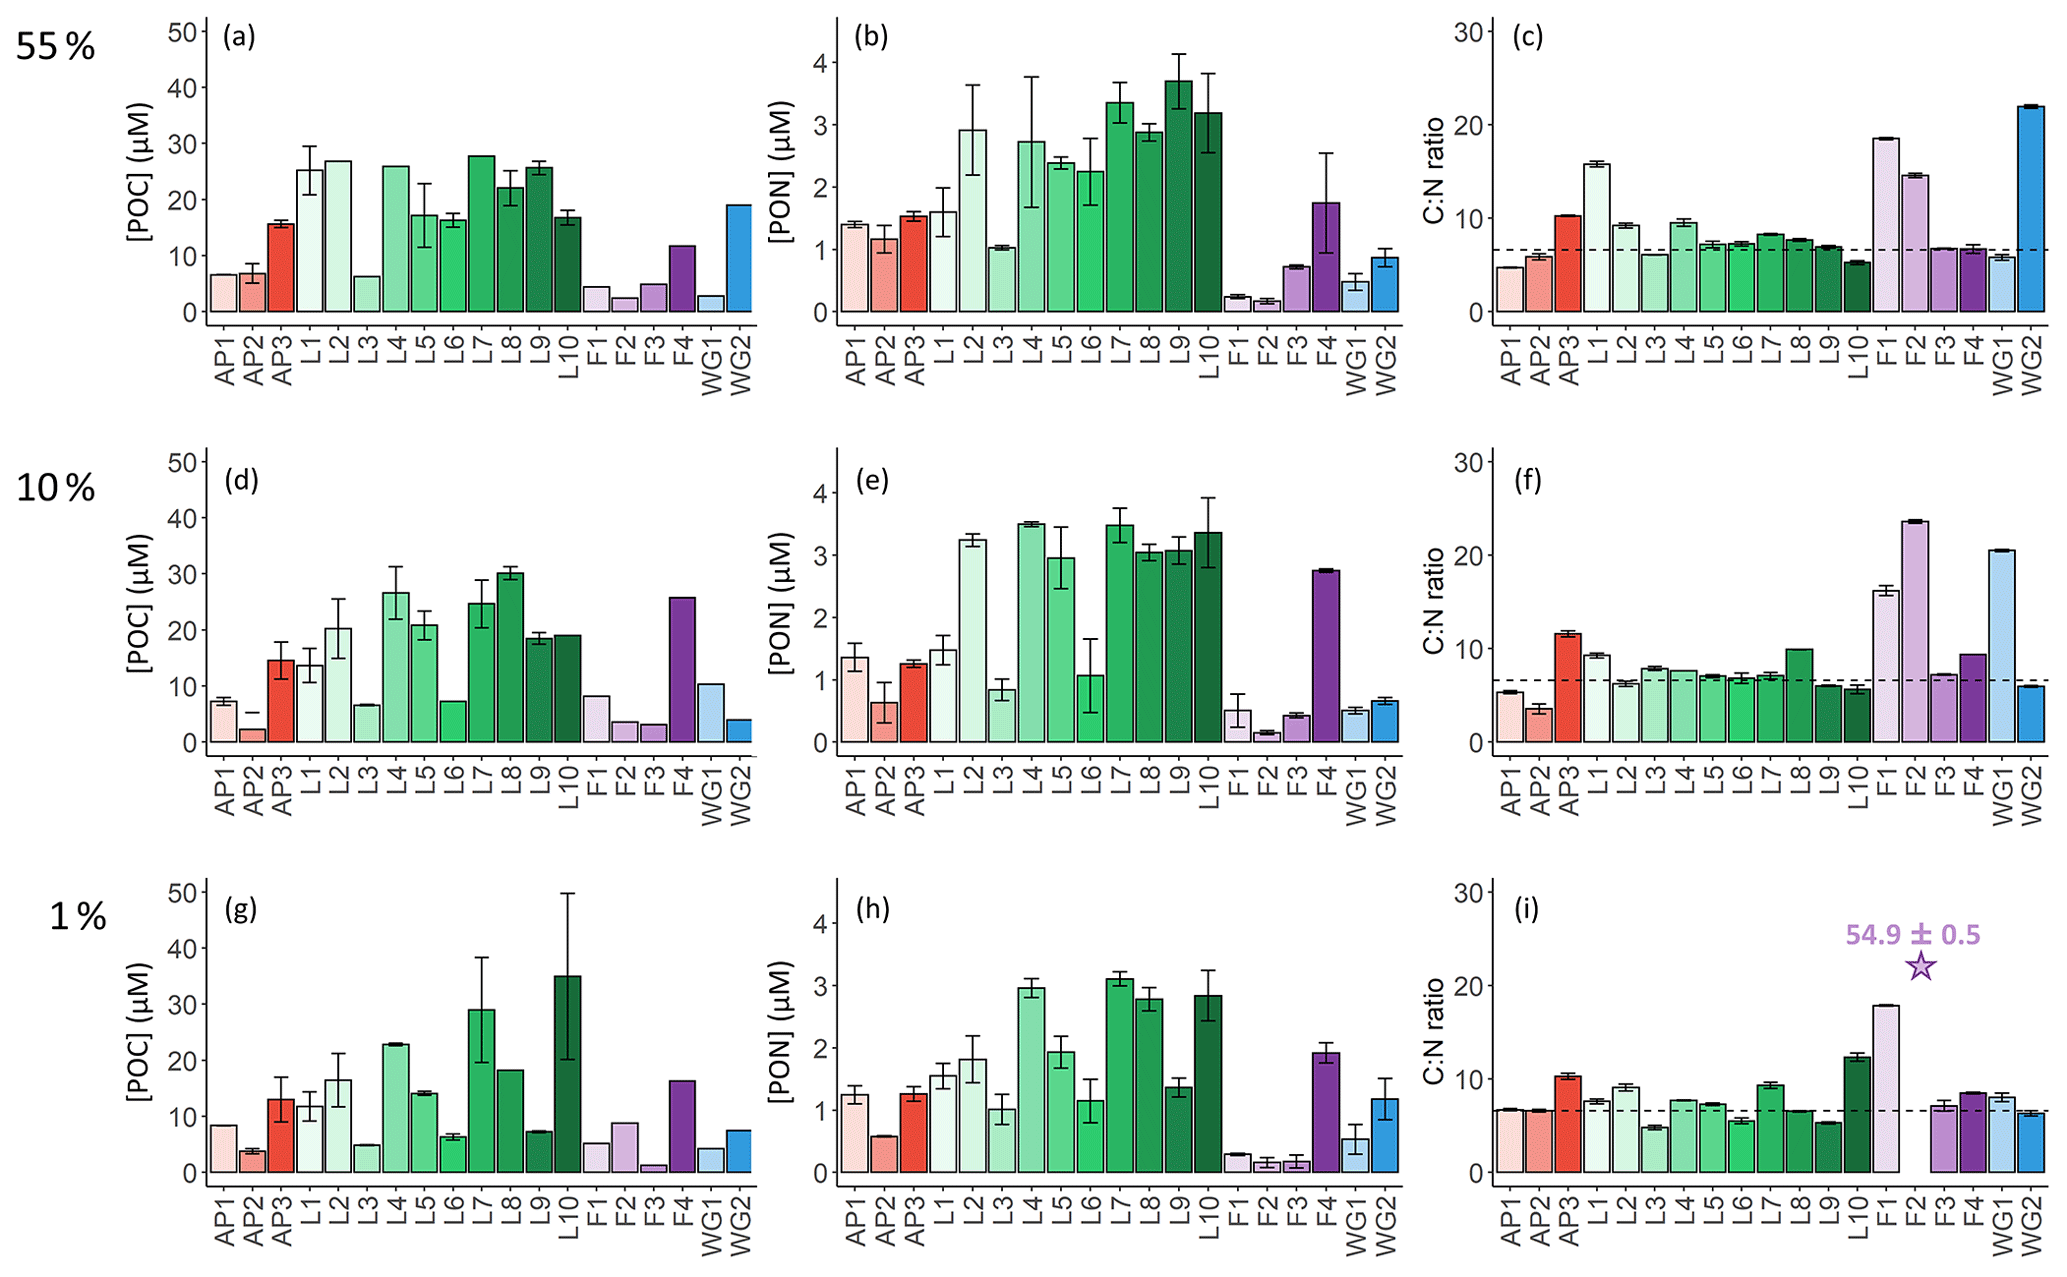
Figure 5Bar plots of (a, d, g) POC concentrations, (b, e, h) PON concentrations, and (c, f, i) biomass C:N ratios measured at the 55 % (a–c), 10 % (d–f), and 1 % light levels (g–i). The stations are labelled on the x axis, and the general station locations are indicated by the different colours: red shades – Antarctic Peninsula, green shades – Larsen C Ice Shelf, blue shades – Weddell Gyre, light purple shades – early-summer Fimbul Ice Shelf, and dark purple – late-summer Fimbul Ice Shelf. The dotted black horizontal line in panels (c), (f), and (i) shows the Redfield C:N ratio of 6.63. The purple star in panel (i) indicates the anomalously high C:N ratio estimated for the 1 % PAR depth at station F2. The error bars represent ±1 SD of replicate samples (). Where applicable, the error has been propagated according to standard statistical practices.
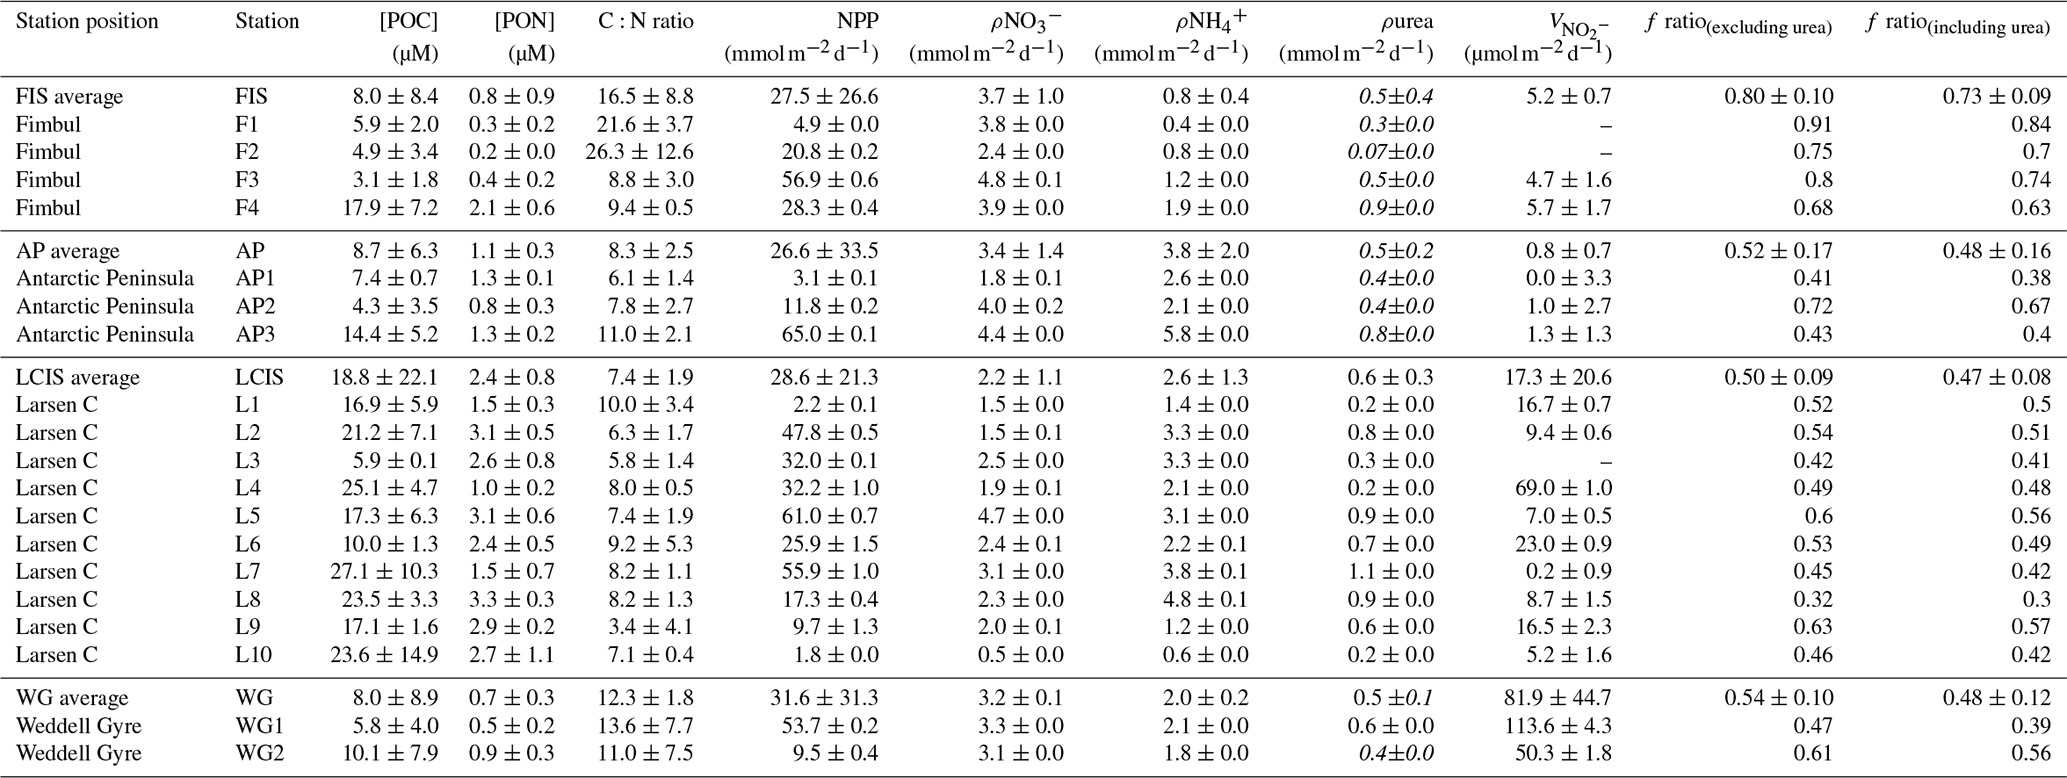
Table 1Euphotic zone-averaged nutrient concentrations, nutrient depletions, and nutrient depletion ratios at each station occupied in the Weddell Sea in January–February 2019. Values shown are averages ±1 SD (n≥2), with error propagated according to standard statistical practices where appropriate. “–” indicates no available data. Dates are given in the format day/month/year.

Table 2Euphotic-zone-integrated and averaged rates at each station occupied in the Weddell Sea in January–February 2019. Values shown are averages ±1 SD (n≥2), with error propagated according to standard statistical practices where appropriate. “–” indicates no available data. The values shown in italics (i.e. ρurea) were estimated rather than measured (see text for details).
3.3.2 Rates of NPP and N uptake
At all stations, NPP was generally highest at the surface (Fig. 6a) and decreased towards Zeu (Fig. 6i). The highest depth-specific (as opposed to integrated) rates were observed at LCIS (except at station L10 where the rates were very low), while the lowest rates occurred in early summer at FIS (with particularly low rates measured at station F1; Fig. 6a, e, and i). At the WG stations and at FIS in late summer, the rates of NPP were comparable to the lower end of the rates observed at LCIS, while NPP along the AP increased shoreward (i.e. the lowest rates were observed at AP1 and the highest at AP3) to values similar to those observed at LCIS. The highest euphotic-zone-integrated rates of NPP were observed at AP3 (65.0±0.1 ) and L5 (61.0±0.7 ), while the lowest occurred at L10 (1.8±0.04 ) (Table 2).
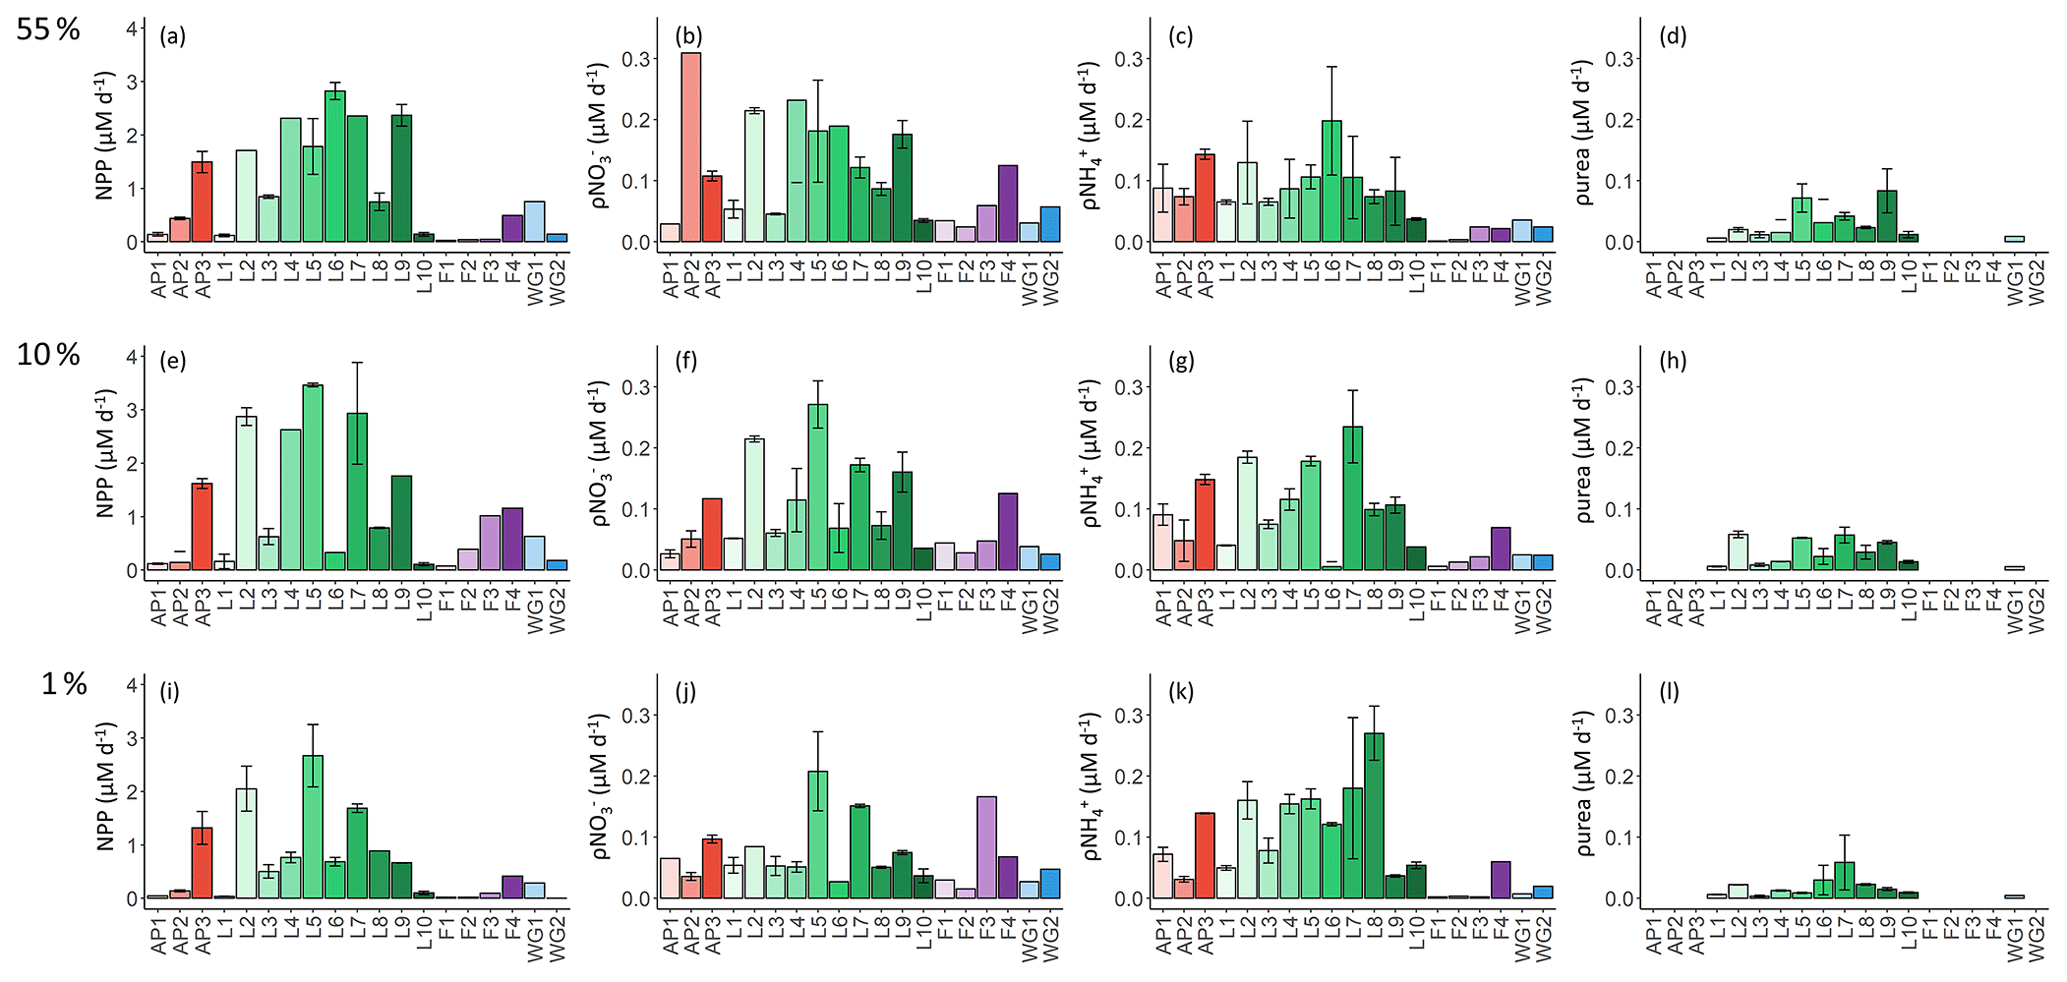
Figure 6Daily rates of (a, e, i) NPP, (b, f, j) ρ, (c, g, k) ρ, and (d, h, l) ρurea for the 55 % (a–d), 10 % (e–h), and 1 % (i–l) light levels. Where there are no bars in panels (d), (h), and (l), no data are available. The stations are labelled on the x axis, and the general station locations are indicated by the different colours: red shades – Antarctic Peninsula, green shades – Larsen C Ice Shelf, blue shades –Weddell Gyre, light purple shades – early-summer Fimbul Ice Shelf, and dark purple – late-summer Fimbul Ice Shelf. The error bars represent ±1 SE of replicate experiments (n=2).
As per NPP, the rates of ρ decreased towards Zeu at all stations (Fig. 6b, f, and j), as did the extent of depletion (Fig. 4a). The depth-specific rates of ρ were highest at LCIS and lowest in early summer at FIS. However, because the euphotic zone was generally shallower at LCIS than at the other stations, the euphotic-zone-integrated rates of ρ were fairly similar across the study region, with the largest variability observed at LCIS (Table 2). In late summer at FIS, integrated ρ was on average higher than at LCIS (3.9±0.03 at F4 versus an average of 2.2±1.1 at LCIS), with depth-specific rates that were double those measured at FIS in early summer. The sea ice at FIS had completely melted by late summer, which likely contributed to the increase in ρ later in the season. The highest euphotic-zone-integrated rates of ρ were observed at stations F3 and L5 (4.8±0.07 and 4.7±0.04 , respectively). At L5, this elevated rate coincided with low euphotic zone concentrations (12.0±1.9 µM, Fig. 3d) and a high degree of depletion (10.9±2.3 µM, Fig. 4a). The lowest euphotic-zone-integrated rates of ρ occurred at station L10 (0.5±0.0 ).
At all stations, rates of ρ increased with depth, reaching a maximum at Zeu (Fig. 6c, g, and k). The highest depth-specific rates of ρ were observed at LCIS and the lowest at FIS in early summer. Euphotic-zone-integrated rates of ρ at the AP stations were comparable to those observed at LCIS (regional average of 3.3±2.2 and 2.5±1.3 , respectively), while the rates at the WG stations and at FIS in late summer were comparable to the lower end of the LCIS rates (average of 2.0±0.2 at WG and 1.9±0.0 at FIS). The early- to late-summer rise in the euphotic-zone-integrated rates of ρ at FIS coincided with an increase in the average euphotic zone concentration from below detection to 0.2±0.1 µM (Fig. 3a). At the AP, LCIS, and WG stations, the rates of ρ were similar to the coincident rates of ρ, while at FIS, ρ was less than half of ρ (Table 2). The highest euphotic-zone-integrated rates of ρ were observed at station AP3 (5.8±0.0 ), coincident with a high average euphotic zone concentration (1.1±0 µM). The lowest integrated ρ occurred at station F1 (0.4±0.0 ), where the concentration of in the euphotic zone was below detection.
Rates of ρurea were only measured at the LCIS stations and WG1 (Fig. 6d, h, and l; Table 2). A high degree of variability in ρurea was observed at LCIS, with euphotic-zone-integrated rates ranging from 0.2 to 1.1 (average of 0.6±0.3 ). This variability appears to be related to the urea concentrations, with the highest rates of ρurea coinciding with the highest ambient urea concentrations (e.g. station L5) and vice versa (e.g. station L4) (Fig. 3b). On average, the rates of ρurea in the WG were half the rates of ρ, and urea concentrations were low (Fig. 3b, Table 2).
3.3.3 Rates of nitrite oxidation
Rates of were low throughout the euphotic zone across the study region (average euphotic-zone-integrated rates of 20.8±31.3 ), equivalent to 0 % to 3.6 % (average of 0.7 %±1.1 %) of ρ, and increased rapidly below Zeu (Fig. 7). The highest euphotic zone rates were observed at WG1 (depth-specific average of 6.3±5.0 nM d−1, integrated average of 113.6±4.3 ), while the lowest rates occurred at the AP (depth-specific average of 0.0±0.04 nM d−1, integrated average of 0.8±0.7 ).
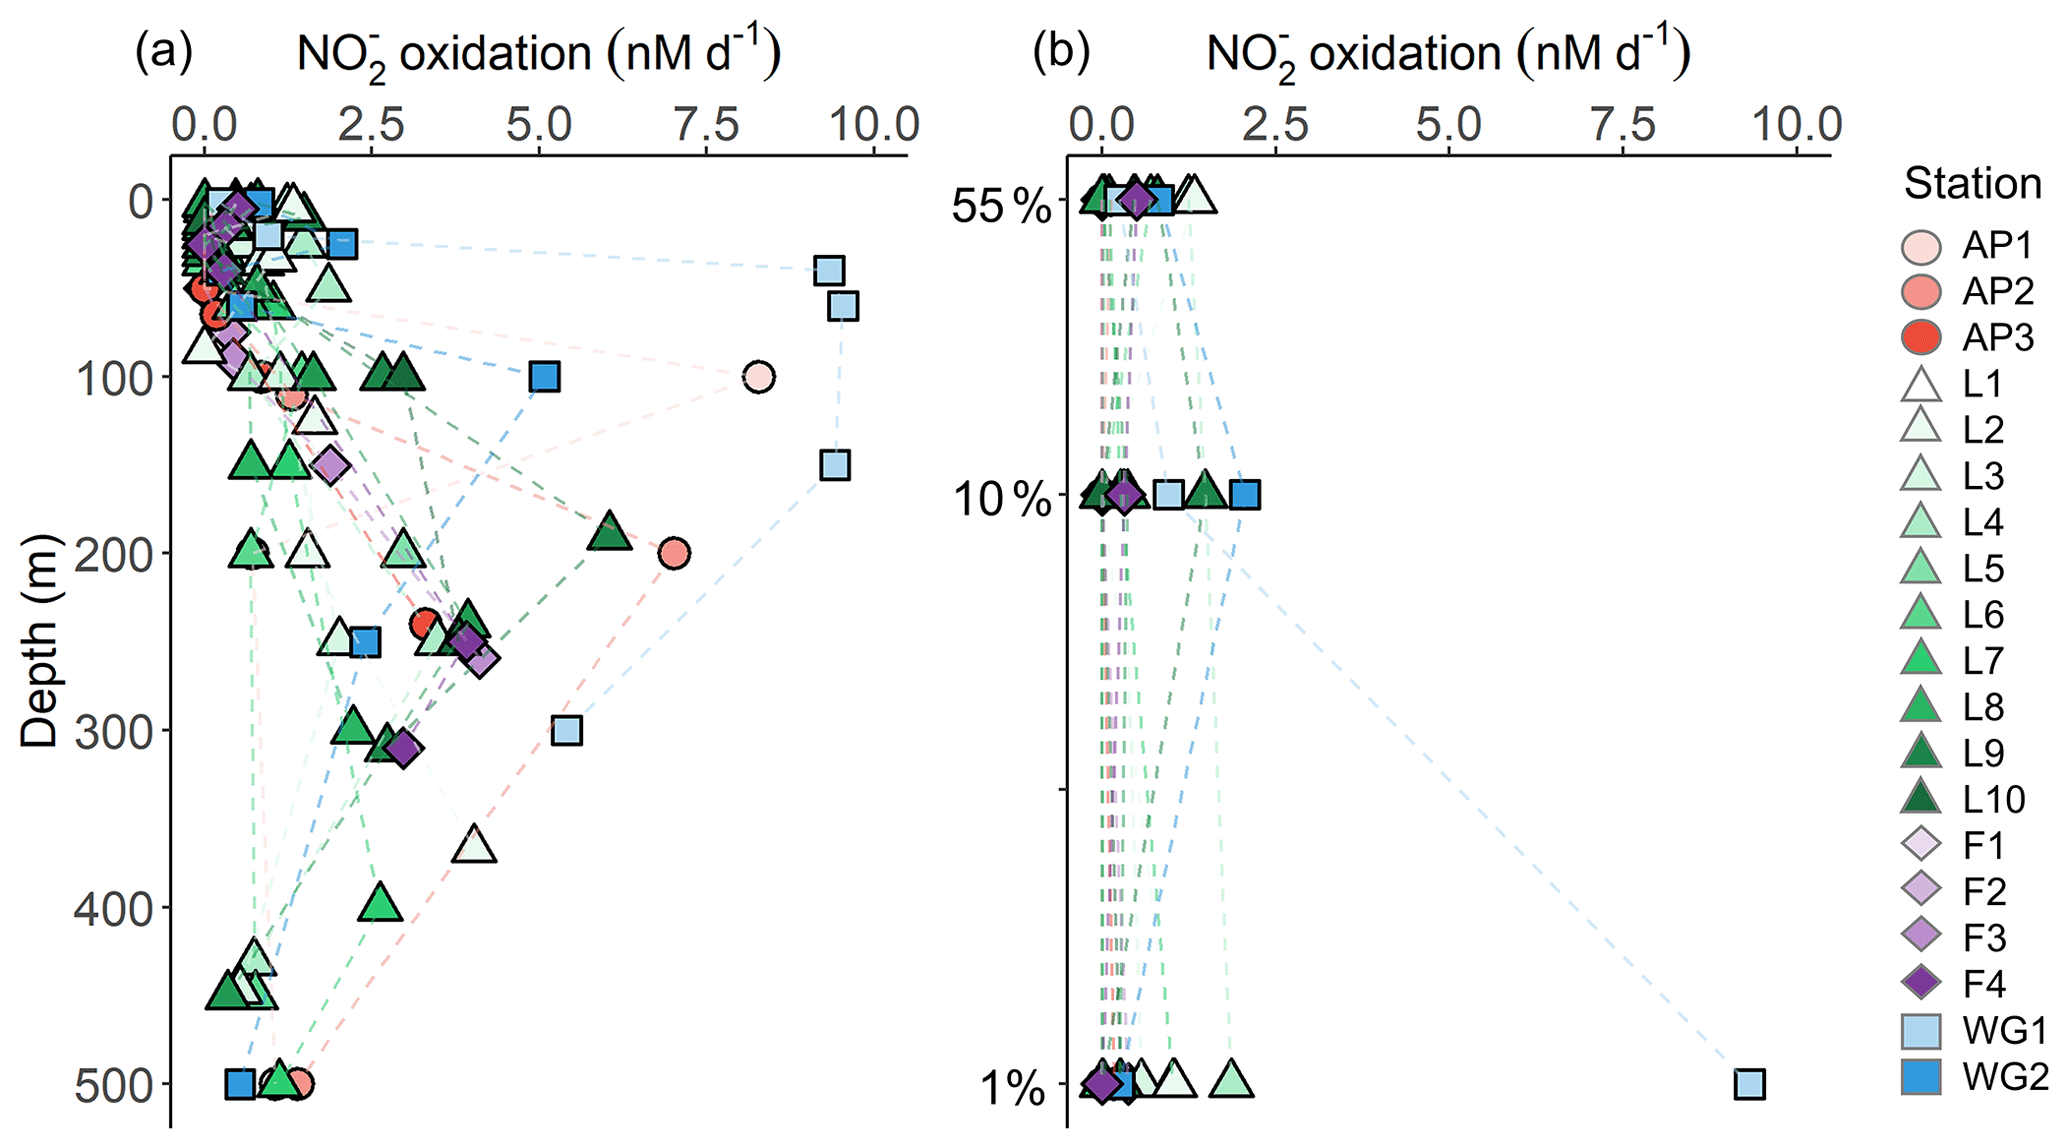
Figure 7Depth profiles of oxidation rates measured at each station (a) between the surface and 500 m and (b) within the euphotic zone.
3.3.4 f-ratio estimates
At the stations where urea uptake was measured (LCIS stations and WG1, 11 out of 19 stations; Fig. 6, Table 2), ρurea accounted for 8 %±6 % of total N uptake (i.e. urea). Excluding urea uptake when calculating the f ratio would therefore overestimate the fraction of potentially exportable carbon by ∼8 %. We thus estimated urea uptake at the stations where it was not measured as
Equation (7) may overestimate urea uptake at some of the stations, particularly where low urea concentrations were measured. Theoretically, ρurea can also be estimated by assuming that total N uptake should equal NPP6.63, such that any difference between and NPP6.63 is due to urea uptake. However, this approach underestimated urea uptake at all the stations where ρurea was directly measured, probably because the use of a C:N ratio of 6.63:1 assumes balanced phytoplankton growth. We therefore chose to use Eq. (7) to estimate urea uptake for the stations lacking ρurea measurements as this approach will yield a more conservative (i.e. lower) estimate of the fraction of potentially exportable carbon (see Sect. S3 in the Supplement for more details). Figure 8 shows how including urea uptake affects the f ratio throughout the sample region, with the white (no urea uptake measured) and hatched bars (urea uptake measured) indicating the amount by which the f ratio decreased when urea uptake was included (i.e. Eq. 4b versus Eq. 4a).

Figure 8Euphotic-zone-integrated f ratios estimated for each station. The black-hatched and white bars show the difference between the f ratio(excluding urea) (higher value, Eq. 4a) and the f ratio(including urea) (lower value, Eq. 4b), with the black-hatched bars indicating the stations where urea uptake was measured and the white bars indicating where it was estimated (see text for details).
The euphotic-zone-integrated f ratios were highest at FIS in early summer (average f ratio(excluding urea) of 0.79±0.1 and f ratio(including urea) of 0.73±0.09) and lowest at LCIS (average f ratio(excluding urea) of 0.50±0.09 and f ratio(including urea) of 0.47±0.08) (Fig. 8, Table 2). The variability in the f ratios among stations appears to be largely related to the availability of . For example, at FIS in early summer there was no detectable available to the phytoplankton and the highest f ratios were observed (average f ratio(excluding urea) of 0.82±0.08 and f ratio(including urea) of 0.76±0.07), while in late summer, concentrations were elevated (0.2±0.1 µM) and the f ratio declined (f ratio(excluding urea) of 0.68±0.16 and f ratio(including urea) of 0.63±0.15).
3.3.5 Phytoplankton community composition
The flow cytometry data show that the phytoplankton community was numerically dominated by picoplankton at all stations, with Synechococcus emerging as the most abundant group (59 %±19 % of the total phytoplankton cells counted), except at stations L5 and L6 where picoeukaryotes were dominant (51 %±1 %, Fig. 9a and b). The microeukaryotes were the least abundant group at all stations (average abundance across the sampling region of 8 %±3 %); however, due to their large biovolume, they contributed most to the biomass (80 %±7 %, Fig. 9c). In the configuration used here, flow cytometry is best suited for enumerating small cells (<15 µm; Dubelaar and Jonker, 2000), such that the larger microplankton present at the time of sampling were likely underestimated via this technique. We thus take the phytoplankton net collections as more representative of the microplankton community and colonial nanoplankton groups.
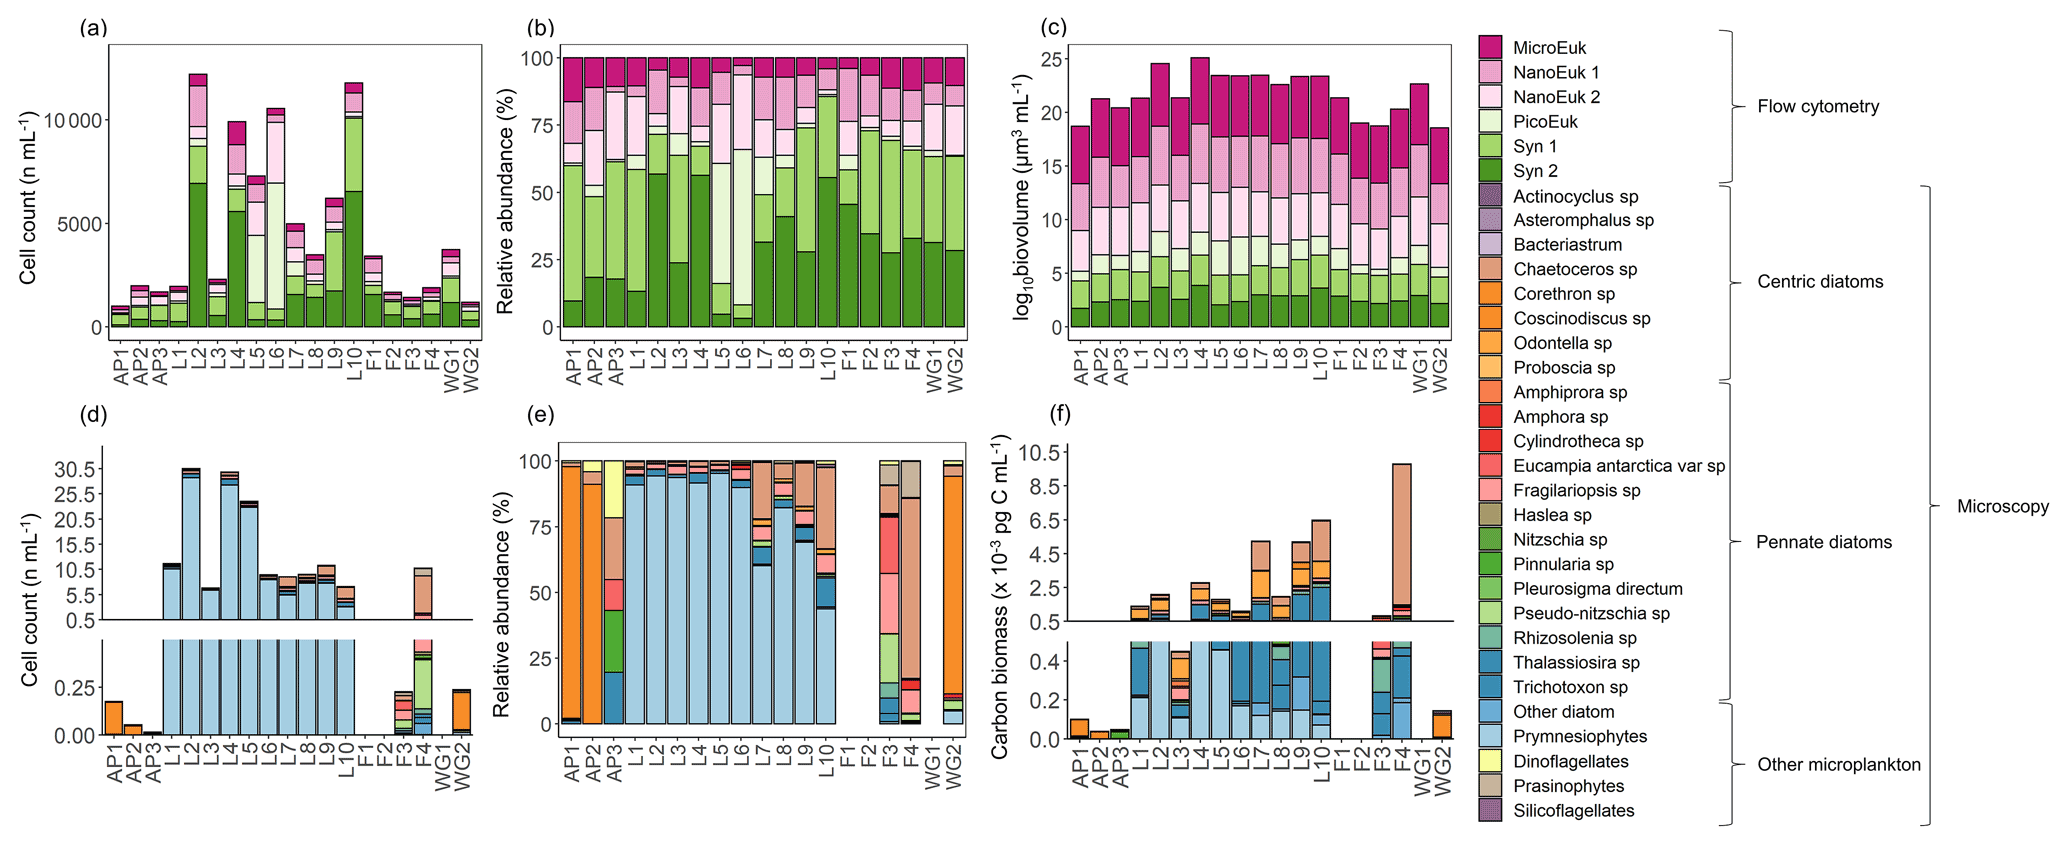
Figure 9The (a, d) cell counts, (b, e) relative cell abundances, (c) log-transformed biovolume, and (f) carbon biomass of all phytoplankton groups identified from (a–c) surface flow cytometry samples and (d–f) plankton net-tow samples. The stations are labelled on the x axis. Where there are no bars in panels (d), (e), and (f), no data are available. Carbon biomass estimates in panel (f) are shown only for the prymnesiophyte, P. antarctica, and the diatom species.
From the samples collected using the phytoplankton net (i.e. single cells or colonies >55 µm), the dominant phytoplankton species at LCIS was the prymnesiophyte, P. antarctica (83 %±17 % of the total phytoplankton cells counted), while the phytoplankton community at the other stations was dominated by diatoms (mainly Corethron pennatum, Chaetoceros spp. (six species), Cylindrotheca closterium, Fragilariopsis ritscheri, Fragilariopsis curta, Fragilariopsis kerguelensis, Fragilariopsis rhombica, Leptocylindrus mediterraneus, Odontella weissflogii, Pseudo-nitzschia atlanta, and several Thalassiosira spp., constituting 92 %±6 % of the phytoplankton cells counted, Fig. 9d and e). At LCIS, the stations sampled earlier in the season tended to be dominated by P. antarctica (e.g. station L3), while those sampled later hosted a more diatom-dominated community (e.g. station L8). In addition, the resident diatoms at LCIS (mainly F. ritscheri, O. weissflogii, and Thalassiosira spp.) were much larger than the numerically dominant P. antarctica. For example, at station L8, the 32 diatom species present (1.6 cells mL−1) contributed pg C mL−1 (Leblanc et al., 2012) compared to pg C mL−1 resulting from the 7.8 cells mL−1 of P. antarctica (Mathot et al., 2000). The LCIS stations with the highest relative abundance of diatoms (e.g. station L8) were characterized by some of the highest rates of ρ and the greatest extent of depletion. More broadly, the LCIS stations with the lowest sea surface temperatures (SSTs) and nutrient uptake rates (i.e. stations L1 and L3) had the lowest phytoplankton counts, while those with the highest SSTs and nutrient uptake rates (i.e. station L5 and L7) had the highest phytoplankton counts (Fig. 9a and d, Table 1).
For the regions of the Weddell Sea that we sampled in summer 2019, the euphotic-zone-integrated rates of NPP and N uptake were generally lower at the OOZ stations than at the CCSZ stations, with the highest depth-specific uptake rates observed in surface waters at LCIS (Fig. 6a–d, Table 2). The few studies that have previously measured summertime rates of NPP and N uptake in the Weddell Sea report similar results, with rates in the marginal ice zone (MIZ) and CCSZ that were up to 5 times higher than in the OOZ (El-Sayed and Taguchi, 1981; Smith and Nelson, 1990; Park et al., 1999). The summertime CCSZ of the Weddell Sea can thus be broadly characterized as a highly productive region with elevated biomass accumulation driven by increased water-column stratification and iron-replete conditions, both the result of sea-ice melt (Semeneh et al., 1998; Lannuzel et al., 2008; Klunder et al., 2011). That said, we observed considerable variability in the biogeochemical rates measured in each region of the Weddell Sea, particularly at LCIS; we examine the possible drivers of and controls on the inter- and intra-regional differences below.
4.1 Drivers of NPP and N uptake in the Weddell Sea
Light and water-column stability. Surface waters throughout the study region were generally well stratified, with MLDs ranging from 7 to 30 m, except at the early-summer FIS stations where the MLD ranged from 63 to 135 m (Table 1). These deep MLDs coincided with elevated sea-ice concentrations, while the shallowest MLDs at LCIS occurred in relatively ice-free waters (Table 1). Average euphotic zone rates of NPP typically increased with increasing SST and POC concentration (Fig. 10a and c), implicating water-column stratification and biomass (which affects light penetration in addition to carbon production rate) as controls on NPP. By contrast, average euphotic zone rates of ρ generally varied with MLD and Zeu – they were highest (lowest) at the stations where Zeu was shallowest (deepest) (Fig. 10b) – implicating light as a control on ρ. At LCIS, the euphotic zone was shallow at all stations (<50 m, with an average Zeu of 28.5±9 m), yet ρ varied by over an order of magnitude (Table 2). Here, we observed a positive relationship between the rates and SST, with ρ increasing at higher SSTs, the latter indicative of increased water-column stratification (Figs. 10a and S4b in the Supplement; see below).
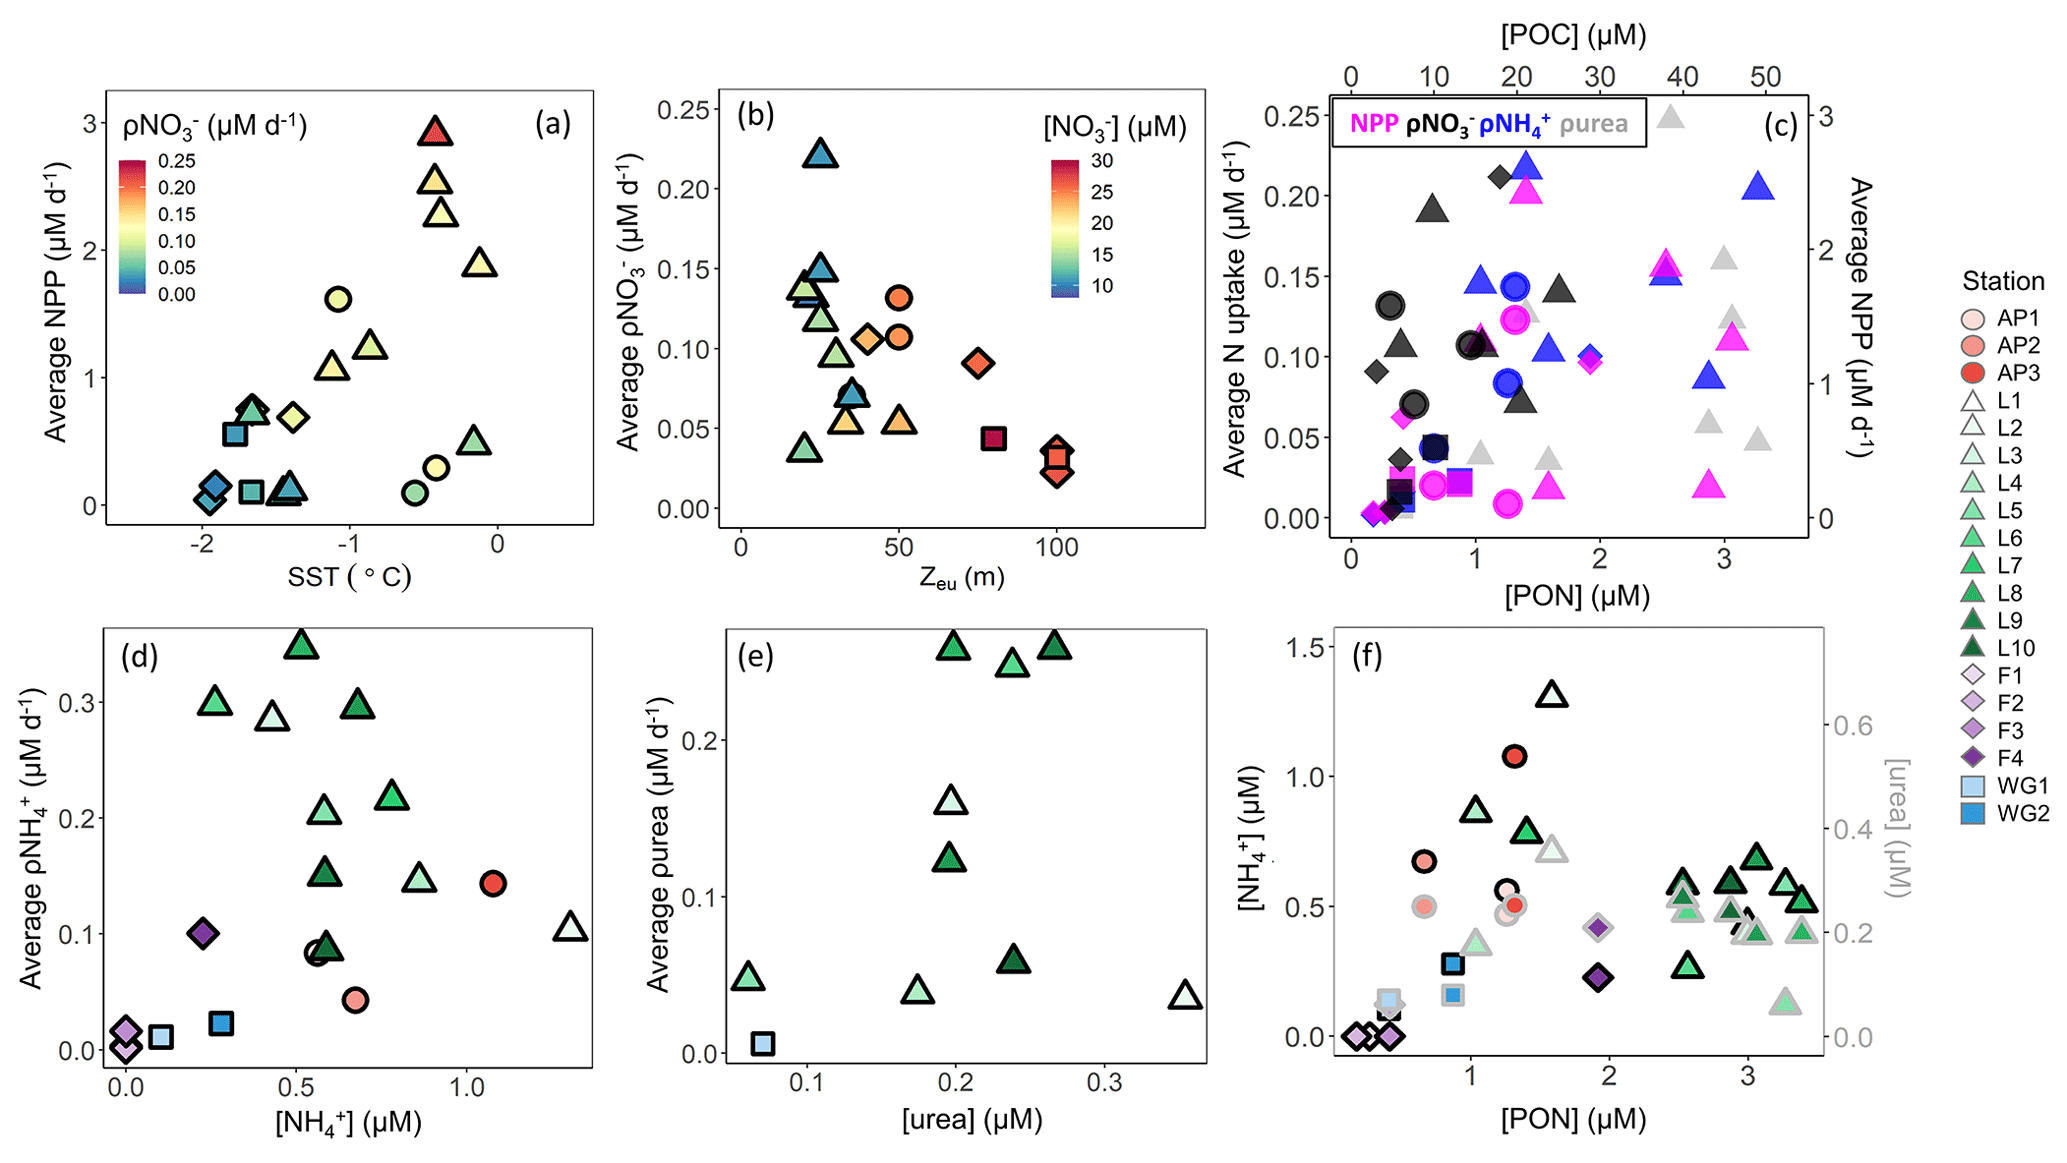
Figure 10Euphotic zone-averaged rates of (a) NPP versus SST, (b) ρ versus euphotic zone depth (Zeu), (c) N uptake (left y axis) versus PON (bottom x axis) and NPP (right y axis) versus POC (top x axis), (d) ρ versus concentration, and (e) ρurea versus urea concentration, as well as (f) the concentrations of (black-outlined symbols, left y axis) and urea (grey-outlined symbols, right y axis) versus PON at each station. The symbols in panel (a) are coloured by ρ, in panel (b) by concentration, and in panel (c) by NPP (pink), ρ (black), ρ (blue), and ρurea (grey).
Throughout the sampling region, the average euphotic zone rates of ρ and ρurea also varied with Zeu which could be taken to indicate that these processes were also light dependent. However, such a finding would be unexpected, as the energy requirement associated with and urea assimilation is low (El-Sayed and Taguchi, 1981; Dortch, 1990; Priddle et al., 1998). The observed relationship is more likely due to the in situ biomass, which (i) attenuates light and (ii) provides a source of organic matter for the production of and dissolved organic N, including urea. Indeed, the stations with the deepest Zeu were characterized by low concentrations of particulate organic matter and regenerated N (Figs. 3a and b and 5), leading us to conclude that ρ and ρurea were predominantly controlled by the availability of regenerated N (Figs. 10d and e and S3b in the Supplement, Sect. S4 in the Supplement). This conclusion is supported by the positive relationship observed between ρ or ρurea and the coincident or urea concentrations (Fig. 10d and e).
The lowest regenerated N concentrations occurred at the stations with the lowest rates of NPP and ρ and the highest concentrations (e.g. station F1). This is probably because and urea tend to accumulate only when biomass (and productivity) is sufficiently high to support elevated rates of heterotrophic activity (Semeneh et al., 1998). At the stations with low POC and PON concentrations, remineralization rates were likely also low, limiting the flux of and urea (Fig. 10f) and driving low rates of ρ and ρurea (Fig. 10d and e). At the stations where and urea concentrations were elevated, rates of ρ and ρurea increased with depth, along with a decrease in NPP and ρ (e.g. station L8). These observations further demonstrate the control of biomass on NPP, light on ρ, and substrate availability on ρ and ρurea. That said, it is unlikely that the variability in NPP and N uptake among the stations was driven by biomass, light, and nutrient availability alone, and we hypothesize that hydrography, iron availability, and phytoplankton community composition also played a role.
At LCIS, the stations closest to the ice shelf were characterized by low SSTs and low rates of NPP and N uptake (stations L1 and L3; Figs. 1 and S4 and S5a in the Supplement, Table 2). The low SSTs can be attributed either to the formation of sea ice or to the upwelling of WW along the ice shelf. Sea-ice formation, in addition to decreasing SST, also increases the salinity of ASW due to brine rejection (Gill, 1973). While the salinity of ASW at the low-SST stations was indeed elevated, the oxygen concentrations were relatively low (≤300 µM, which is below saturation, Fig. S5b–d). In surface waters and sea ice, oxygen is typically saturated as it rapidly equilibrates with the atmosphere (Gleitz et al., 1995) and is produced by photosynthesizing phytoplankton and sea-ice algae. Sea-ice formation should not, therefore, drive a decrease in the oxygen content of ASW. The low oxygen concentrations at stations L1 and L3 were contiguous with those in the underlying WW (Fig. S5d), leading us to conclude that the cool, saline waters along the ice shelf indicate recent upwelling of WW. Such upwelling could temporarily inhibit productivity by decreasing the stability of the water column and mixing phytoplankton below the euphotic zone. This mechanism can explain the low uptake rates and weak nutrient depletions observed at the low-SST stations.
Relatively cold, saline surface waters have previously been observed at the ice edge off Larsen A and B ice shelves and shown to hinder NPP (Cape et al., 2014). In that case, the dense surface waters were surmised to result either from offshore wind stress at the inshore region that induced localized mixing or from the advection of surface waters offshore by coastal upwelling. Both mechanisms would decrease water-column stability and, by extension, productivity. Cape et al. (2014) observed an increase in NPP with distance from the coast at Larsen A and B, a trend that we did not observe, likely because of the proximity of our LCIS stations to the ice shelf (within 75 km for all stations). Instead, our rates of NPP and N uptake were positively coupled with SST at the ice edge (Figs. S4 and S5). We propose that surface SST at LCIS can be used as an indicator of water mass age, with cooler SSTs indicating newly upwelled WW and warmer SSTs designating older surface waters that have had time to absorb heat from the atmosphere. The higher rates of NPP and N uptake in the warmer surface waters occur because phytoplankton experience favourable growing conditions for an extended period, resulting in biomass accumulation. By contrast, persistent localized upwelling along LCIS inhibits productivity in the adjacent surface waters, with implications for the spatial distribution of biomass and the potential for organic carbon export.
Nutrient and inferred iron conditions in Weddell Sea surface waters. Across our sampling region, ASW was depleted in , Si(OH)4, and relative to the underlying WW, with the greatest nutrient depletion occurring at LCIS and at FIS in late summer (Fig. 4a–c). Because diatoms and/or P. antarctica were the dominant phytoplankton at all stations (Fig. 9d–f), we can use the depletion ratios (here used as shorthand for the depletion ratios) to assess the iron conditions and N nutrition of these two phytoplankton groups. Under iron-replete conditions, diatoms consume in an approximate ratio of (Ragueneau et al., 2000; Hutchins and Bruland, 1998; Takeda, 1998; Mosseri et al., 2008), while under iron limitation, they increase their uptake of Si and decrease that of P relative to N, consuming nutrients in a ratio of (Arrigo et al., 1999; Finkel et al., 2006; Green and Sambrotto, 2006; Mosseri et al., 2008; Weber and Deutsch, 2010; Martiny et al., 2013), with Si:N uptake ratios as high as 8:1 observed under conditions of extreme iron depletion (Franck et al., 2000; Brzezinski et al., 2003). At a first approximation, the depletion ratios estimated in our study suggest that the AP and LCIS stations were characterized by iron-replete conditions (ratio of ), while phytoplankton community at the FIS and WG stations experienced iron limitation (ratios of ; Fig. 4d and e, Table 1).
High iron concentrations have previously been measured in surface waters in the CCSZ and northern Weddell Sea (as high as 7 nM; Lannuzel et al., 2008; De Jong et al., 2012). Iron is supplied to the mixed layer in these regions via sea-ice melt, ice shelf melt, continental runoff, vertical and lateral advection, and resuspension of continental shelf sediments (Lannuzel et al., 2008; De Jong et al., 2012; Klunder et al., 2014). In contrast, the central WG is iron-limited as iron is supplied to surface waters mainly by wind-induced vertical mixing (Hoppema et al., 2015). During our sampling, sea-ice concentrations were high at the WG stations, which would have dampened the effect of wind stress on surface waters and thus hindered vertical mixing. At FIS in early summer, iron should have been replete as phytoplankton would not have had sufficient time to exhaust the surface reservoir. Here, the sea-ice concentrations were elevated, and the mixed layers were deep such that light, rather than iron, likely limited phytoplankton growth. Indeed, light-limited diatoms have been observed to consume in a ratio similar to that reported for conditions of iron depletion (Brzezinski, 1985). By late summer at FIS, the sea ice had completely melted, which should have further alleviated iron limitation, yet the Si:N depletion ratios were high (average of 2.3±0.5). These elevated ratios may be the result of only considering uptake and not accounting for regenerated N consumption. At FIS in late summer, supported 32 % of N uptake; accounting for this N source decreases the Si:N depletion ratio to 1.4:1, which is closer to expectations for iron-replete diatoms. Some diatom growth was likely also supported by urea, which would further decrease the Si:N depletion ratio. Additionally, it is plausible that the diatoms at station F4 were beginning to experience iron limitation as sampling occurred late in the season.
Accounting for regenerated N uptake greatly alters the Si:N depletion ratios, particularly at LCIS, and provides insights into the behaviour of the dominant phytoplankton groups that were active in the mixed layer, both prior to and at the time of sampling. At the stations where diatoms dominated, the depletion ratios were elevated and ρ was high (Fig. 11a and c). In contrast, at the stations where P. antarctica was dominant, the depletion ratios were low (generally <1) and regenerated N uptake was high relative to at the other stations (Fig. 11a and d). Under favourable nutrient and light conditions, diatoms will typically consume over as (i) is usually present in substantially higher concentrations than and (ii) the lower surface-area-to-volume ratio of (larger) diatoms makes it harder for them to compete with smaller cells for a less abundant resource (i.e. ) (Probyn and Painting, 1985; Koike et al., 1986; Lomas and Glibert, 1999; Karsh et al., 2003). The average depletion ratio of 1.0±0.2 at LCIS can therefore be attributed almost entirely to diatoms. When total N uptake is considered, the Si:N depletion ratios decrease to 0.3±0.1, indicating the consumption of 3 times more N than Si(OH)4. We attribute this decline to regenerated N uptake by P. antarctica, a phytoplankton group that is known to preferentially consume when it is available due to the lower energy and iron requirements of assimilation (El-Sayed and Taguchi, 1981; Dortch, 1990; Jacques, 1991; Goeyens et al., 1995; Priddle et al., 1998; Stefels and Van Leeuwe, 1998).
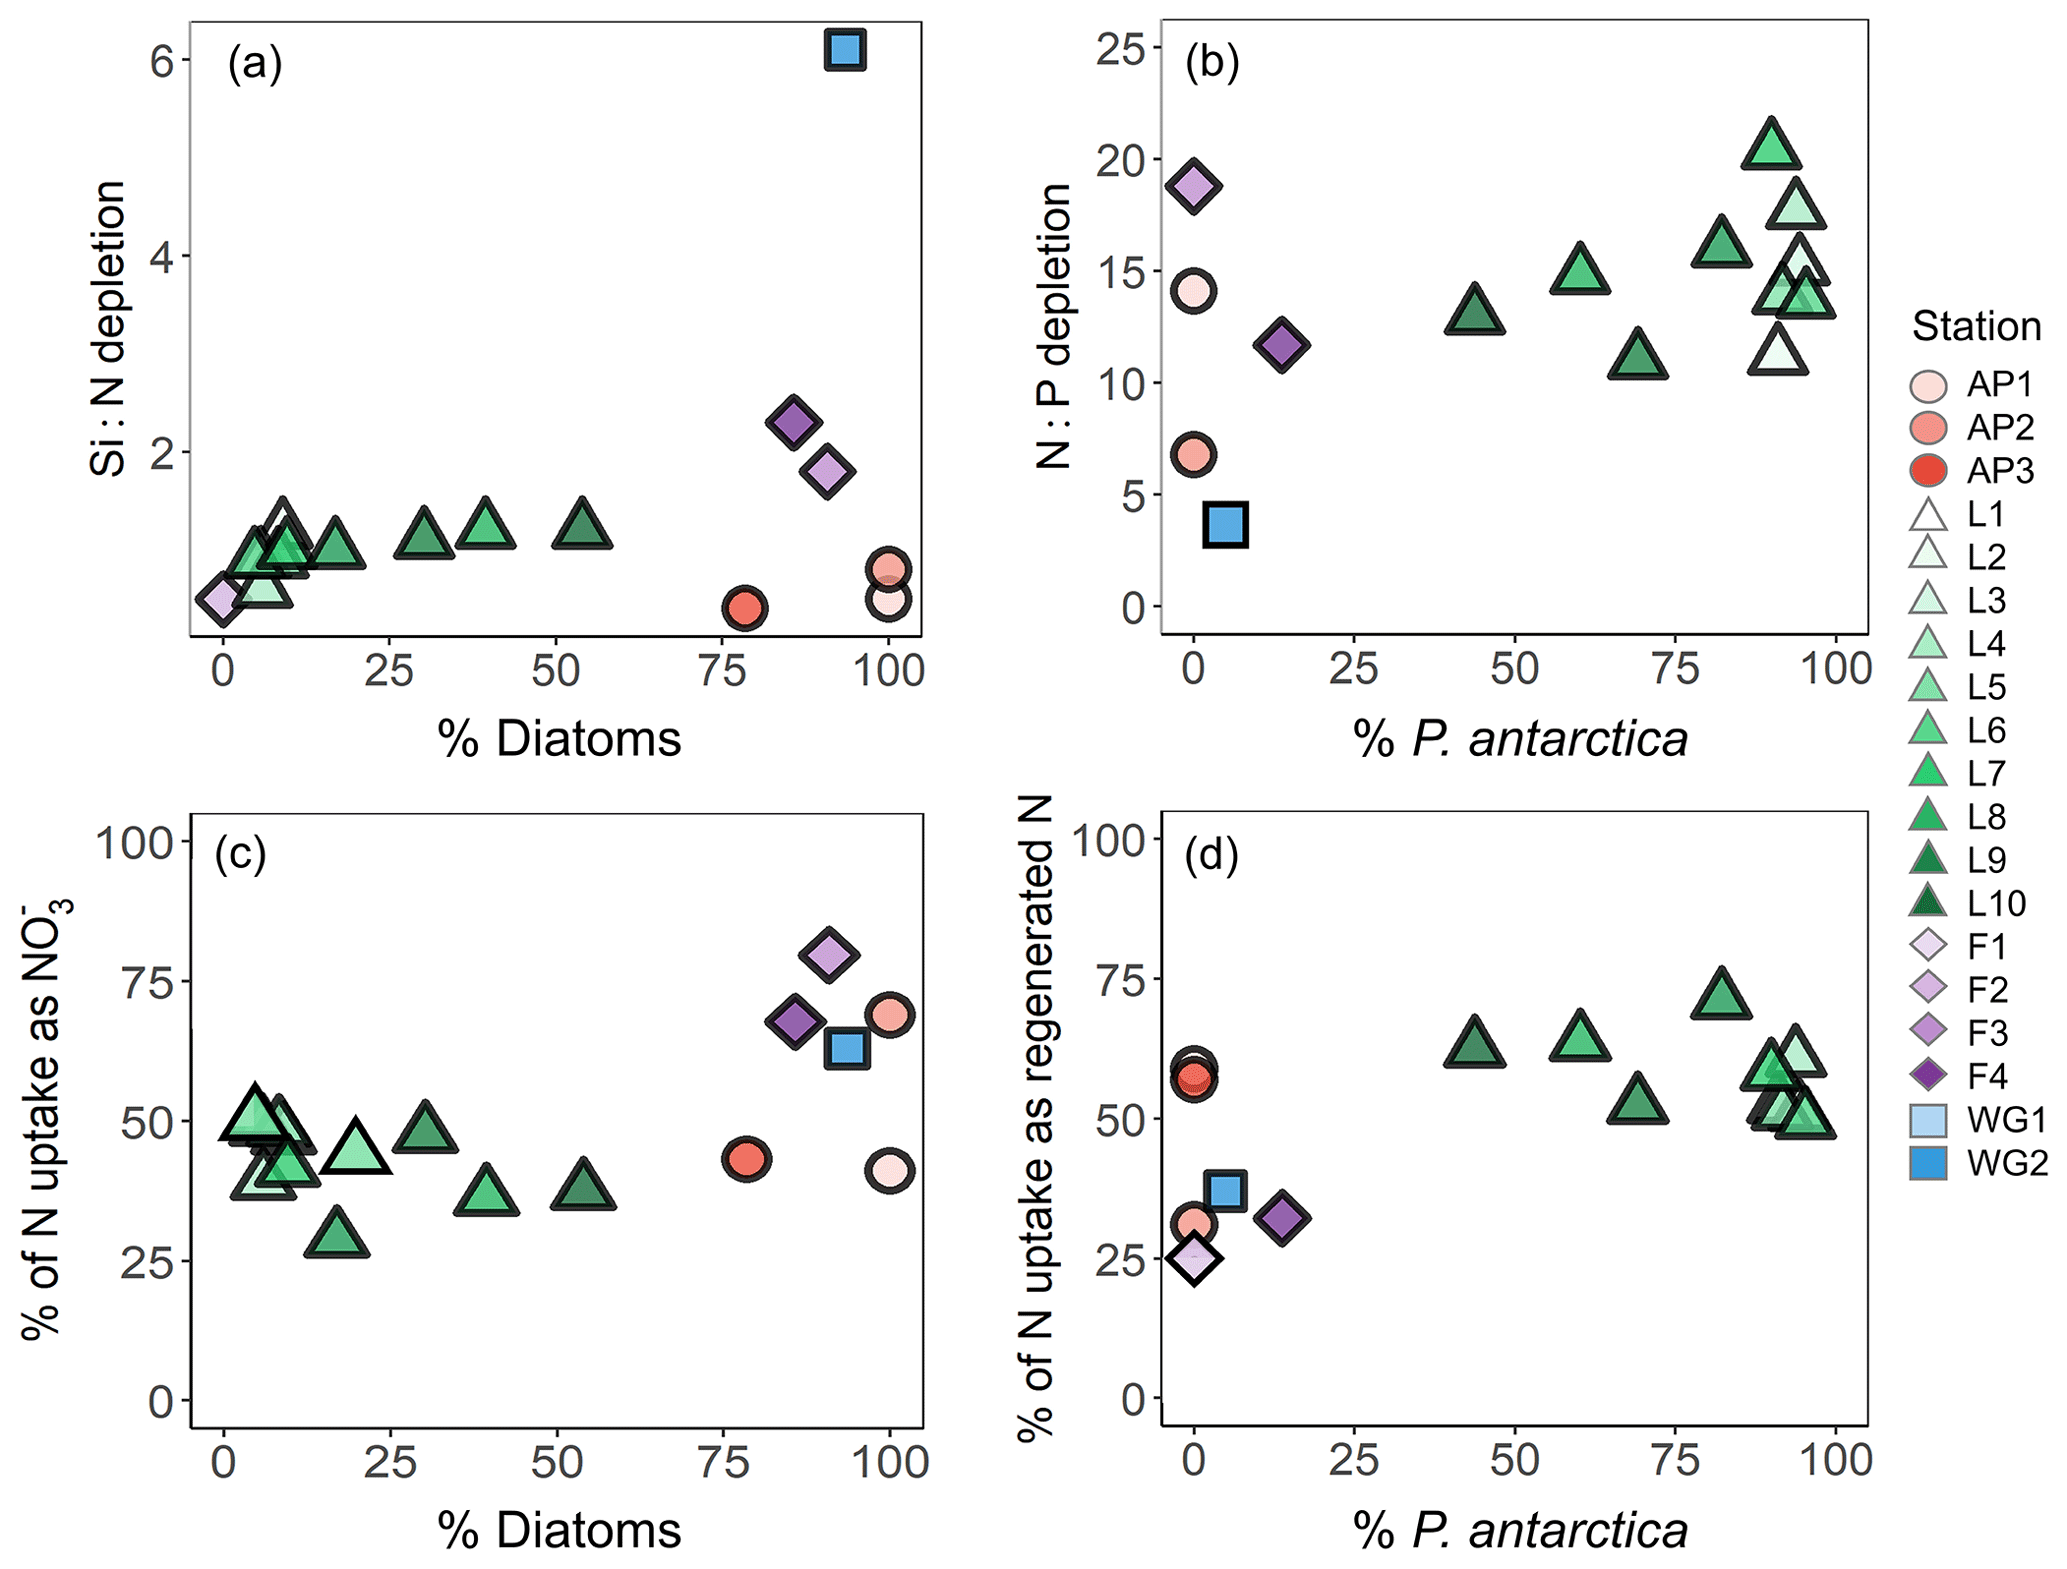
Figure 11Scatterplots of (a) the Si:N depletion ratio (i.e. Si(OH)4 to total N depletion) versus relative diatom abundance, (b) N:P depletion ratio (i.e. total N to depletion) versus relative P. antarctica abundance, (c) the proportion of total N (i.e. ) assimilated as versus relative diatom abundance, and (d) the proportion of total N assimilated as regenerated N (i.e. ) versus relative P. antarctica abundance at each station.
We can also use the depletion ratios to better understand the iron conditions and relative importance of P. antarctica versus diatoms in generating the observed nutrient depletion ratios. P. antarctica are known to consume and in a ratio of , while for iron-replete diatoms, this ratio is (Arrigo et al., 1999; Smith and Asper, 2001; Garcia et al., 2018). At LCIS, the depletion ratio averaged 14.7±2.9, consistent with a dominant role for iron-replete diatoms. However, variability in the depletion ratios was observed among the LCIS stations (with ratios ranging from 11 to 20), which can be explained by local variations in phytoplankton community composition. At stations where large diatoms were dominant (e.g. L10, where diatoms contributed pg C mL−1 to biomass while P. antarctica only contributed pg C mL−1), the depletion ratios were low (13.0±0.6, Fig. 11b). In contrast, at the stations where P. antarctica were numerically dominant (e.g. L6, where P. antarctica constituted 90 % of the microphytoplankton) and contributed more to biomass ( pg C mL−1), elevated depletion ratios were measured (20.4±0.3; Fig. 11b, Table 1). Furthermore, high rates of uptake were measured at LCIS, equivalent to and at times greater than the coincident uptake rates (Fig. 6, Table 2), particularly at the stations with the highest relative abundance of P. antarctica. In general, the relative contribution of diatoms versus P. antarctica therefore appears to control the nutrient depletion ratios on a variety of scales in the Weddell Sea.
Drivers of phytoplankton community composition. Phytoplankton community composition and the variations therein have implications for the biological carbon pump, both directly (diatoms sink more rapidly than smaller and/or non-ballasted phytoplankton; Treguer and Jacques, 1992; De Baar et al., 2005; Boyd et al., 2007) and indirectly ( consumption is quantitatively related to carbon export; Dugdale and Goering, 1967; Eppley and Peterson, 1979). Above, we have discussed the role of phytoplankton community composition in controlling productivity and upper-ocean nutrient cycling. Below, we discuss the processes that may have caused P. antarctica to dominate over diatoms at LCIS and vice versa at the other Weddell Sea stations.
At LCIS, a coastal sensible heat polynya persisted throughout the sampling period. The opening of such polynyas along the eastern AP is linked to the occurrence of warm, föhn winds that originate over the continent and blow over the AP, influencing the coastal north-western Weddell Sea (Cape et al., 2014). Föhn winds drive the offshore movement of sea ice, which initiates the opening of polynyas that persist because the winds are warm, thus hindering the formation of new sea ice (Cape et al., 2014). The development of coastal sensible heat polynyas results in relatively deep mixed layers and a weakly stratified water column. The polynya at LCIS opened in late November, approximately 2 months prior to our sampling. At this time (i.e. the beginning of the growing season), motile P. antarctica cells likely dominated the phytoplankton community as P. antarctica are low-light specialists compared to other Antarctic phytoplankton (Goffart et al., 2000; Alderkamp et al., 2012; Delmont et al., 2014). This notion is supported by the generally low phytoplankton cell counts (for both flow cytometry and net-tow samples) and high relative abundance of P. antarctica compared to diatoms at the stations along the ice shelf where WW had recently upwelled (e.g. L3; Figs. 9a, d, and e and S5). As the mixed layer shoaled into the summer and light limitation was alleviated, a diatom bloom would have been initiated and P. antarctica would have formed colonies (Schoemann et al., 2005) – indeed, the presence of P. antarctica colonies and diatom chains at the time of our sampling in January is evidence that the water column was well stratified (Goffart et al., 2000). As the season progressed, diatoms would have outcompeted P. antarctica and come to dominate the phytoplankton community. At the stations sampled later in the season (e.g. L10, Fig. 9e), the relative abundance of diatoms versus P. antarctica was higher than at the stations occupied 2 weeks earlier (e.g. L5, Fig. 9e). Diatoms have a lower iron and higher light requirement than P. antarctica and thus tend to thrive once the P. antarctica bloom declines, when the water column has stratified and they can access the lower concentrations of residual iron (Strzepek et al., 2011). That said, iron is likely perennially high at LCIS in summer as it is near-continuously supplied to surface waters by sea-ice melt and upwelling of WW along the ice shelf (Klunder et al., 2014). The elevated iron concentrations would allow the diatoms to grow rapidly on the available once the mixed layer had shoaled enough to alleviate light limitation, contributing to their capacity to outcompete other phytoplankton.
At the other (non-LCIS) sampling sites, diatoms dominated the phytoplankton community. We hypothesize that at the beginning of the growing season, melting sea ice alleviated light and, to a lesser extent, iron limitation, providing favourable conditions for diatom growth. At the same time, the generally lower iron concentrations characteristic of open Weddell Sea surface waters may have selected against P. antarctica (Strzepek et al., 2011). Previous studies conducted in the Ross Sea observed large diatom blooms associated with the receding ice edge and concluded that bloom formation was favoured by the rapid stabilization of the water column from meltwater inputs (Goffart et al., 2000; Sedwick et al., 2000). Regions of the Weddell Sea that undergo rapid stratification due to sea-ice melt will likely also experience large diatom blooms. We thus conclude that the dominance of diatoms over P. antarctica at the non-LCIS stations was influenced by local hydrodynamic processes that rapidly induce water-column stability and increase light availability (e.g. in areas of recent sea-ice melt). By contrast, P. antarctica dominate under low light, such as in the deep mixed layers that initially characterize coastal polynyas. Eventually, diatoms will succeed P. antarctica in these polynyas as conditions become favourable for their growth.
4.2 Carbon export potential across the Weddell Sea
Previous f-ratio estimates for the summertime Weddell Sea range from 0.18 to 0.83 (Koike et al., 1986; Rönner et al., 1983; Nelson et al., 1987; Smith and Nelson, 1990; Goeyens, 1991; Goeyens et al., 1995). Using Eqs. (4a) and (4b), we calculate euphotic-zone-integrated f ratios that range from 0.32 to 0.91 (excluding urea uptake) and 0.30 to 0.84 (including urea uptake). The lowest f ratios occurred at LCIS ( and ) and the highest at FIS ( and ) (Fig. 8, Table 2). We note that urea uptake may have been stimulated at the stations where it was measured given the quantity of 15N-urea added (0.1 µM) relative to the ambient urea concentrations (average of 0.2±0.1 µM; Fig. S2, Sect. S3); if so, regenerated production could be overestimated at all stations since we extrapolated the average measured contribution of urea-to-total-N uptake (8 %±6 %) to the stations at which ρurea was not measured (Eq. 7). The f-ratio estimates excluding and including urea uptake thus represent an upper and lower bound, respectively, on the fraction of potentially exportable carbon. That said, accounting for urea uptake decreased the average f ratio by very little, from 0.57±0.15 to 0.52±0.14.
Estimates of the f ratio and carbon export potential can be complicated by euphotic zone nitrification, which supplies regenerated rather than new to phytoplankton. Failing to account for this regenerated N flux can lead to an overestimation of carbon export potential (Yool et al., 2007; Mdutyana et al., 2020). At all stations, the euphotic zone rates of were low (undetectable to 9.5 nM d−1, average of 0.6±1.4 nM d−1; Fig. 7b), and correcting the f ratio for these rates (Eq. 4) had a minimal effect (average decrease of 2 %±6 %). The largest decrease was observed at WG1 where the highest euphotic-zone-integrated rates of were measured (f ratio(excluding urea) decreased from 0.60 to 0.47 and f ratio(including urea) decreased from 0.49 to 0.39, Table 2).
The low rates of euphotic zone nitrification are consistent with the previous (limited) data available for the summertime OOZ and CCSZ of the Southern Ocean. For example, Mdutyana et al. (2020) measured euphotic zone rates of and oxidation in summer at FIS and in the OOZ just north of the WG (56∘ S, 0∘ E) that were below detection. Summertime studies of euphotic zone oxidation in the Ross and Scotia seas also report low rates, of 6–8.9 and 0.4–5.8 nM d−1, respectively (Olson, 1981). We conclude that, as expected, the high-light and generally low- conditions of the summertime Weddell Sea inhibited euphotic zone nitrification and that the slow-growing nitrifiers were probably also outcompeted by phytoplankton for (Ward, 1985, 2005; Smith et al., 2014; Zakem et al., 2018). Classifying uptake as new production and equating it to carbon export potential is thus reasonable for the summertime Weddell Sea.
Although the highest f ratios were estimated for the FIS stations, the highest rates of ρ were observed at LCIS and along the AP (Fig. 8, Table 2). FIS was thus characterized by the highest carbon export potential relative to NPP, while the N-cycle data imply that the absolute potential carbon export flux was highest at LCIS and the AP. The maximum extent of nutrient depletion was also observed at LCIS ( depletion of 57–428 mmol m−2 and depletion of 5.8–18.7 mmol m−2). Assuming Redfield C:N and C:P stoichiometry of 6.63:1 and 106:1, respectively, the seasonal depletion equates to a carbon export flux of 0.4–2.8 mol C m−2 and the depletion to 0.6–2.0 mol C m−2. Alternately, multiplying ρ by the length of time that the coastal polynya had been open (30 November until the date of sampling, Table 1) yields an estimate for net seasonal uptake of 59–428 mmol m−2 and carbon export flux of 0.4–2.8 mol C m−2 at LCIS, remarkably similar to the estimates derived from seasonal depletion. Our estimates of carbon export potential are, however, on the low end of those reported previously for the CCSZ and MIZ of the Weddell Sea (e.g. estimates for January–February range from 2.4–4.9 mol C m−2; Rönner et al., 1983; Hoppema et al., 2000, 2007). Given the high-light and nutrient- and iron-replete conditions encountered at LCIS, one might thus have expected higher f ratios and estimates of carbon export potential (i.e. depletion), raising the question of the possible limitations thereon.
Throughout the Weddell Sea, and urea uptake were coupled with substrate availability, while uptake was not. Instead, uptake appeared to vary with light (see above) and as a function of the ambient concentration (Fig. 12a). At LCIS where was elevated throughout the mixed layer at all stations, uptake and depletion decreased with increasing (Fig. 12), which we attribute to inhibition of uptake (Goeyens et al., 1995). By contrast, at the non-LCIS stations, depletion and ambient concentration showed a positive relationship, consistent with -fuelled phytoplankton growth being followed by intense remineralization and grazing, both of which can yield elevated (Rönner et al., 1983; El-Sayed, 1984; Semeneh et al., 1998).
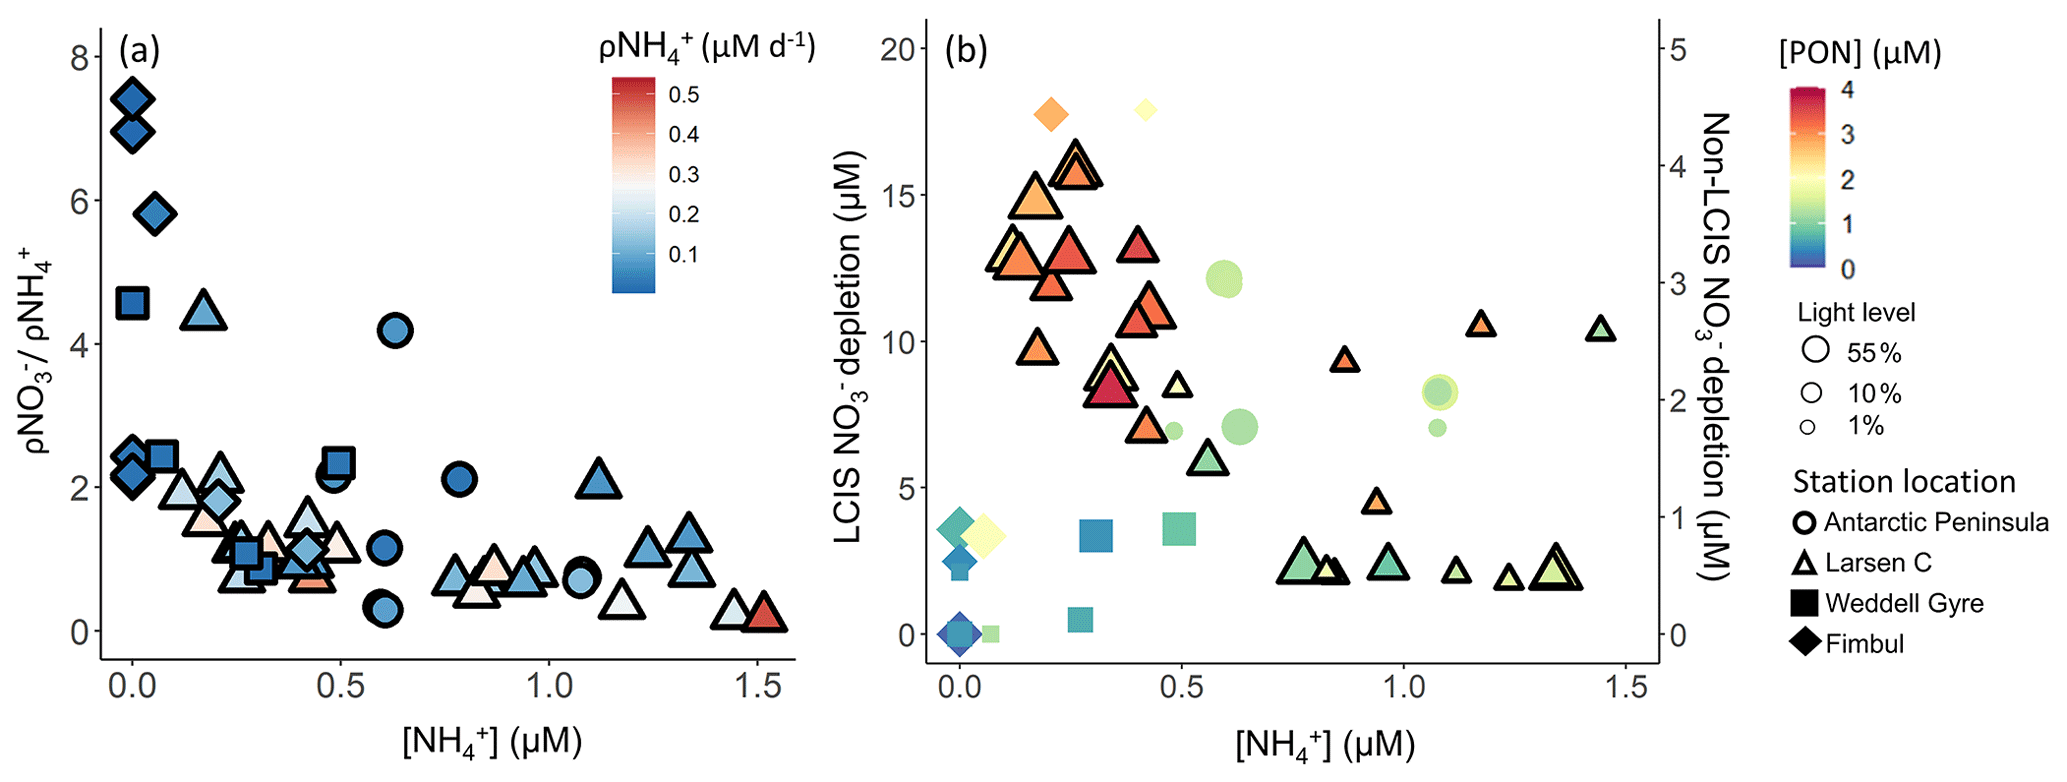
Figure 12(a) uptake normalized to uptake as a function of concentration and (b) depletion versus concentration. The symbols in panel (a) are coloured by the uptake rate (ρ) and in panel (b) by PON concentration. In panel (b), the symbol size indicates the incubation light level, depletion at LCIS corresponds with the left y axis, and depletion at all other (“non-LCIS”) stations corresponds with the right y axis.
Previous studies conducted in the MIZ and CCSZ of the Weddell Sea have shown that concentrations ≥0.5 µM can inhibit uptake, particularly by diatoms, resulting in phytoplankton (including diatoms) preferentially consuming over . For example, Goeyens et al. (1995) observed a Weddell Sea phytoplankton community dominated by diatoms prior to accumulation, but once surface waters became enriched in , diatom dominance ceased. The authors concluded that diatoms were unable to bloom despite the elevated concentrations because of the inhibitory effect of , while non-siliceous, smaller phytoplankton species flourished because their preferred N source is . In our study, although inhibition of ρ apparently occurred at LCIS (Fig. 12), ρ was on average as high as ρ and was never zero (Table 2) – in other words, the elevated ambient concentrations did not prevent uptake even though they appear to have slowed it. We propose that the mixed community of diatoms and P. antarctica present at the time of our sampling meant that diatoms were able to assimilate mainly while P. antarctica consumed the , preventing this reduced N form from accumulating to fully inhibitory concentrations. While the reliance of P. antarctica on over represents a missed opportunity for carbon export given that these phytoplankton are known to fix up to 50 % more carbon than diatoms per mole of consumed (Arrigo et al., 1999), that the diatoms were able to proliferate in the face of elevated may have partly compensated for this. Earlier in the season when concentrations were negligible, it is likely that the f ratios at LCIS were >0.5 and comparable to those estimated for the FIS stations, as observed at Larsen A and B in early summer (Goeyens et al., 1995; Cape et al., 2014). We conclude that elevated may have weakened carbon export potential at LCIS in January–February 2019 through its effect on whole-community uptake. Carbon export may have been further inhibited later in the season as concentrations continued to increase following remineralization of the phytoplankton bloom, coupled with the seasonal decrease in daylight that is expected to shift the phytoplankton community to proportionally higher dependence (Lourey et al., 2003; Philibert et al., 2015; Glibert et al., 2016; Smart et al., 2020).
4.3 Broader biogeochemical implications at LCIS
LCIS is a region of deep-water formation, such that the biogeochemical properties of ASW influence those of MWDW and the bottom waters. Our data indicate significant net depletion of nutrients from ASW over the summer growing season. These nutrients would have been converted to organic matter that was consumed by zooplankton; exported from the euphotic zone to be decomposed by heterotrophic bacteria, in the water column or on the shelf; or consumed by the benthic community. The subsurface remineralization of organic matter acts to increase the CO2 and nutrient reservoir of WW and shelf waters (ISW and HSSW, both precursors of CDW). Some portion of this CO2 is effluxed to the atmosphere when WW upwells along the front of the ice shelf, while the remainder is mixed into MWDW and eventually transferred to the bottom waters where it will be stored for hundreds of years (Ito et al., 2010). Exported organic matter that escapes water-column and on-shelf remineralization settles on the seafloor where a small fraction is buried and thus removed from the ocean–atmosphere system while the bulk of the organic matter is consumed by the benthic community and ultimately converted back to CO2 (Isla et al., 2006, 2011; Pineda-Metz et al., 2019). The CO2 and nutrients recycled by the benthos may be resupplied to the surface during upwelling, whereupon remineralized CO2 can escape to the atmosphere. Biological activity and nutrient drawdown at LCIS, and the limitations thereon, thus affect the CO2 and nutrient content of the bottom waters, as well as the energy supply to the benthos and the extent to which CO2 is removed from the atmosphere on climate-relevant timescales. The ratio at depth at LCIS (average of below 150 m) implicates diatoms as the main biological driver of nutrient conditions in MWDW, and by extension the bottom waters, throughout the Weddell Sea. Although the dominance of P. antarctica in early summer and mid-summer does not appear to affect the nutrient properties of MWDW, it may influence its CO2 content. P. antarctica consume approximately twice as much carbon per mole of as diatoms, and the colonial forms have been observed to rapidly sink out of the water column, thereby transporting large quantities of carbon to depth (Arrigo et al., 2000; Ditullio et al., 2000). The dominance of P. antarctica at LCIS may thus be important for carbon storage in MWDW and the bottom waters, as well as for the transport of organic matter to the benthos.
As SSTs rise and sea ice melts, a shift from P. antarctica- to diatom-dominated phytoplankton blooms is expected because diatoms flourish in areas of recent sea-ice melt (Boyd and Doney, 2002; Arrigo and van Dijken, 2003; Petrou et al., 2016; Ferreira et al., 2020). Our results are consistent with this floristic-shift hypothesis. For example, at L10 where recent sea-ice melt (Fig. 2a and c) had increased water-column stratification, a different phytoplankton community was observed compared to at the other LCIS stations, with diatoms dominating over P. antarctica (Fig. 9). By contrast, at other LCIS stations, P. antarctica dominated the biomass due to the low-light conditions caused by the deep MLDs that initially characterize coastal polynyas. Given the anomalously high carbon-to-nutrient content of P. antarctica, a shift to diatom-dominated phytoplankton blooms may negatively affect the export and storage of carbon in MWDW and the bottom waters. However, rising SSTs will also lead to increased glacial and ice shelf melt, further stratifying the adjacent water column and increasing the iron supply (Petrou et al., 2016). It is projected that these conditions will favour blooms of heavily silicified diatom species that are known to sink rapidly out of the mixed layer, or, if consumed, their frustules are expected to survive the gut passages of copepods, potentially resulting in increased carbon export (Assmy et al., 2013). However, this increase is unlikely to be 2-fold that presently contributed by P. antarctica. Additionally, the sinking shells of heavily silicified diatoms have at times been observed to be devoid of organic carbon (Smetacek, 2000; Assmy et al., 2013), which would further decrease the carbon export potential of diatoms compared to colonial P. antarctica. In net, the expected floristic shift may lead to decreased carbon export at the ice shelves, subsequently decreasing the carbon content of MWDW formed at LCIS and/or the food supply to the benthos. Further investigation of the drivers of phytoplankton community composition is required to validate these hypotheses, particularly with regards to the response of Antarctic phytoplankton to warming, as well as to how changes in the surface ecosystem are transferred to and reflected in the biogeochemistry of bottom waters and benthic ecosystem functioning.
We investigated the summertime productivity of understudied regions of the Weddell Sea, including LCIS, along with the potential importance of different phytoplankton groups for biomass production, nutrient consumption, and carbon export potential. Our data show that mixed-layer nutrient depletion ratios are determined by the dominant phytoplankton group. The lowest Si:N and highest N:P depletion ratios were observed at LCIS where P. antarctica were dominant, while the highest Si:N and lowest N:P depletion ratios occurred at FIS and in the WG where diatoms dominated. The variability in phytoplankton community composition appears to have been largely driven by mechanisms controlling water-column stratification. P. antarctica are low-light specialists and proliferated at LCIS due to the deep mixed layers that occurred early in the season, while diatoms succeeded at stations where the mixed layer was shallow, induced by sea-ice melt. Not only does the observed relationship between phytoplankton community composition and the nutrient depletion ratios have implications for the stoichiometry of the deep-water nutrient reservoir, but it likely also has consequences for carbon export and storage (Brzezinski et al., 2003; Weber and Deutsch, 2010).
Although the waters adjacent to LCIS were characterized by the highest uptake rates, they also yielded the lowest f ratios. We attribute these f ratios to a degree of inhibition of uptake, which translates to a missed opportunity for carbon export (Cochlan and Bronk, 2003) and, potentially, decreased long-term storage in bottom waters, particularly since neither nor iron appeared to be limiting at the time of our sampling. Additional investigation is required to ascertain the persistence of inhibition in the Antarctic CCSZ, particularly in regions of deep-water formation (e.g. at FRIS). Furthermore, given the prediction that the Weddell Sea's upper water column will become more stratified with climate change (Pörtner et al., 2014; Sallée et al., 2013; Stammerjohn et al., 2012), it is essential that we improve our understanding of the physical and chemical drivers of phytoplankton community composition and function if we are to better predict changes to ocean carbon cycling and drawdown via the biological carbon pump.
The data discussed in this paper are available in the Zenodo database and can be found at https://doi.org/10.5281/zenodo.5567017 (Flynn et al., 2021).
The supplement related to this article is available online at: https://doi.org/10.5194/bg-18-6031-2021-supplement.
RFF led the study and writing of the manuscript. SEF contributed substantially to writing the manuscript and designed the experiments with RF and TB. RF and JMB carried out the experiments. JMB, TGB, SEF, KAMS, and SS assisted with sampling and data generation and contributed to writing the manuscript.
The contact author has declared that neither they nor their co-authors have any competing interests.
Publisher's note: Copernicus Publications remains neutral with regard to jurisdictional claims in published maps and institutional affiliations.
This article is part of the special issue “The Weddell Sea and the ocean off Dronning Maud Land: unique oceanographic conditions shape circumpolar and global processes – a multi-disciplinary study (OS/BG/TC inter-journal SI)”. It is not associated with a conference.
We thank Captain Knowledge Bengu, Captain Freddie Ligthelm, and the exceptional crew of the R/V SA Agulhas II, as well as the Weddell Sea Expedition 2019. We also thank Riesna Audh, Tahlia Henry, Katherine Hutchinson, and Hermann Luyt for assistance at sea; Raymond Roman for help with nutrient analyses; the University of Cape Town (UCT) Marine Biogeochemistry Lab; the High Resolution Transmission Electron Microscopy unit of the Nelson Mandela University; Ian Newton and Julie Luyt at the UCT Stable Light Isotope Laboratory; Katherine Pecsok Ewert at the UC Davis Stable Isotope Facility; and Tim Reid and Lumi Haraguchi for assistance with flow cytometry analyses. We are grateful to Sebastien Moreau and the two anonymous reviewers for their insightful comments that improved this paper.
This research was supported by the Flotilla Foundation through a grant to Sarah E. Fawcett and Thomas G. Bornman; the South African National Antarctic Programme through grants 105539, 117035, and 129232 to Sarah E. Fawcett; the South African National Research Foundation through postgraduate fellowships to Raquel F. Flynn, Jessica M. Burger, Shantelle Smith and Kurt A. M. Spence; and the African Academy of Sciences and Royal Society through a FLAIR Fellowship to Sarah E. Fawcett. Additionally it was supported by UCT through a Science Faculty Fellowship to Raquel F. Flynn; Vice-Chancellor Doctoral Research scholarships and Postgraduate Merit awards to Raquel F. Flynn, Jessica M. Burger, and Shantelle Smith; and a Vice-Chancellor Future Leaders 2030 award to Sarah E. Fawcett. The authors were also financed by the South African Department of Science and Innovation's Biogeochemistry Research Infrastructure Platform (BIOGRIP) and Shallow Marine and Coastal Research Infrastructure (SMCRI).
This paper was edited by Christian Haas and reviewed by Sebastien Moreau and two anonymous referees.
Alderkamp, A.-C., Kulk, G., Buma, A. G. J., Visser, R. J. W., Dijken, G. L. Van, Mills, M. M., and Arrigo, K. R.: The effect of iron limitation on the photophysiology of Phaeocystis Antarctica (Prymnesiophyceae) and Fragilariopsis Cylindrus (Bacillariophyceae) under dynamic irradiance, J. Phycol., 48, 45–59, https://doi.org/10.1111/J.1529-8817.2011.01098.X, 2012.
Altabet, M. A. and Francois, R.: Nitrogen isotope biogeochemistry of the Antarctic polar frontal zone at 170∘ W, Deep-Sea Res. Pt. II, 48, 4247–4273, https://doi.org/10.1016/S0967-0645(01)00088-1, 2001.
Arrigo, K. R., Robinson, D. H., Worthen, D. L., Dunbar, R. B., DiTullio, G. R., VanWoert, M., and Lizotte, M. P.: Phytoplankton community structure and the drawdown of nutrients and CO2 in the Southern Ocean, Science, 283, 365–367, https://doi.org/10.1126/science.283.5400.365, 1999.
Arrigo, K. R. and van Dijken, G. L.: Phytoplankton dynamics within 37 Antarctic coastal polynya systems, J. Geophys. Res.-Oceans, 108, https://doi.org/10.1029/2002jc001739, 2003.
Arrigo, K. R., DiTullio, G. R., Dunbar, R. B., Robinson, D. H., VanWoert, M., Worthen, D. L., and Lizotte, M. P.: Phytoplankton taxonomic variability in nutrient utilization and primary production in the Ross Sea, J. Geophys. Res.-Oceans, 105, 8827–8846, https://doi.org/10.1029/1998jc000289, 2000.
Arrigo, K. R., van Dijken, G., and Long, M.: Coastal Southern Ocean: A strong anthropogenic CO2 sink, Geophys. Res. Lett., 35, 1–6, https://doi.org/10.1029/2008GL035624, 2008.
Arteaga, L. A., Boss, E., Behrenfeld, M. J., Westberry, T. K., and Sarmiento, J. L.: Seasonal modulation of phytoplankton biomass in the Southern Ocean, Nat. Commun., 2020 111, 11, 1–10, https://doi.org/10.1038/s41467-020-19157-2, 2020.
Assmy, P., Smetacek, V., Montresor, M., Klaas, C., Henjes, J., Strass, V. H., Arrieta, J. M., Bathmann, U., Berg, G. M., Breitbarth, E., Cisewski, B., Friedrichs, L., Fuchs, N., Herndl, G. J., Jansen, S., Krägefsky, S., Latasa, M., Peeken, I., Röttgers, R., Scharek, R., Schüller, S. E., Steigenberger, S., Webb, A., and Wolf-Gladrow, D.: Thick-shelled, grazer-protected diatoms decouple ocean carbon and silicon cycles in the iron-limited Antarctic Circumpolar Current, P. Natl. Acad. Sci. USA, 110, 20633–20638, https://doi.org/10.1073/pnas.1309345110, 2013.
Bendschneider, K., Robinson, R. J., Margeson, J. H., Suggs, J. C., Midgett, M. R., Method, C. R., Dussin, R., Curchitser, E. N., Stock, C. A., Van Oostende, N., Galán, A., Zirbel, M. J., Saldías, G. S., Chan, F., Letelier, R., Najjar, G., Sarmiento, J. L., Xi, S., Scientific, T., Berelson, W. M., McManus, J., Coale, K. H., Johnson, K. S., Kilgore, T., Burdige, D., Pilskaln, C., Flohr, A., Van Der Plas, A. K., Emeis, K. C., Mohrholz, V., and Rixen, T.: A New Spectrophotometric Method for the Determination of Nitrite in Sea Water, J. Mar. Res., 11, 0–1, https://doi.org/10.1357/0022240963213673, 2020.
Berges, J. A. and Mulholland, M. R.: Chapter 32 – Enzymes and Nitrogen Cycling, edited by: Capone, D. G., Bronk, D. A., Mulholland, M. R., and Carpenter, E. J., Nitrogen in the Marine Environment, 2nd Edn., Academic Press, 1385–1444, ISBN 9780123725226, https://doi.org/10.1016/B978-0-12-372522-6.00032-3, 2008.
Böhlke, J. and Coplen, T. B.: Interlaboratory Comparison of Reference Materials for Nitrogen-Isotope-Ratio Measurements, Proceedings of a consultants meeting held in Vienna, 1–3 December 1993, 1995.
Böhlke, J. K., Mroczkowski, S. J., and Coplen, T. B.: Oxygen isotopes in nitrate: New reference materials for 18O: 17O: 16O measurements and observations on nitrate-water equilibration, Rapid Commun. Mass Sp., 17, 1835–1846, 2003.
Boyd, P. W.: Ironing out algal issues in the Southern Ocean, Nature, 304, 396–397, 2004.
Boyd, P. W. and Doney, S. C.: Modelling regional responses by marine pelagic ecosystems to global climate change, Geophys. Res. Lett., 29, 53-1–53-4, https://doi.org/10.1029/2001gl014130, 2002.
Boyd, P. W. and Ellwood, M. J.: The biogeochemical cycle of iron in the ocean, Nat. Geosci., 3, 675–682, https://doi.org/10.1038/ngeo964, 2010.
Boyd, P. W., Jickells, T., Law, C. S., Blain, S., Boyle, E. A., Buesseler, K. O., Coale, K. H., Cullen, J. J., De Baar, H. J. W., Follows, M., Harvey, M., Lancelot, C., Levasseur, M., Owens, N. P. J., Pollard, R., Rivkin, R. B., Sarmiento, J., Schoemann, V., Smetacek, V., Takeda, S., Tsuda, A., Turner, S., and Watson, A. J.: Mesoscale iron enrichment experiments 1993–2005: Synthesis and future directions, Science, 315, 612–617, https://doi.org/10.1126/science.1131669, 2007.
Boyd, P. W., Doney, S. C., Strzepek, R., Dusenberry, J., Lindsay, K., and Fung, I.: Climate-mediated changes to mixed-layer properties in the Southern Ocean: assessing the phytoplankton response, Biogeosciences, 5, 847–864, https://doi.org/10.5194/bg-5-847-2008, 2008.
Brzezinski, M. A.: The Si : C : N ratio of marine diatoms: interspecific variability and the effect of some environmental variables, J. Phycol., 21, 347–357, https://doi.org/10.1111/j.0022-3646.1985.00347.x, 1985.
Brzezinski, M. A., Dickson, M. L., Nelson, D. M., and Sambrotto, R.: Ratios of Si, C and N uptake by microplankton in the Southern Ocean, Deep-Sea Res. Pt. II, 50, 619–633, https://doi.org/10.1016/S0967-0645(02)00587-8, 2003.
Cape, M. R., Vernet, M., Kahru, M., and Spreen, G.: Polynya dynamics drive primary production in the Larsen A and B embayments following ice shelf collapse, J. Geophys. Res.-Oceans, 119, 572–594, https://doi.org/10.1002/2013JC009441, 2014.
Cochlan, W. P. and Bronk, D. A.: Effects of ammonium on nitrate utilization in the Ross Sea, Antarctica: Implications for f-ratio estimates, Biogeochemistry of the Ross Sea, 78, 159–178, https://doi.org/10.1029/078ars10, 2003.
Cota, G. F., Smith, W. O., Nelson, D. M., Muench, R. D., and Gordon, L. I.: Nutrient and biogenic particulate distributions, primary productivity and nitrogen uptake in the Weddell-Scotia Sea marginal ice zone during winter, J. Mar. Res., 50, 155–181, https://doi.org/10.1357/002224092784797764, 1992.
De Baar, H. J. W., Boyd, P. W., Coale, K. H., Landry, M. R., Tsuda, A., Assmy, P., Bakker, D. C. E., Bozec, Y., Barber, R. T., Brzezinski, M. A., Buesseler, K. O., Boyé, M., Croot, P. L., Gervais, F., Gorbunov, M. Y., Harrison, P. J., Hiscock, W. T., Laan, P., Lancelot, C., Law, C. S., Levasseur, M., Marchetti, A., Millero, F. J., Nishioka, J., Nojiri, Y., Van Oijen, T., Riebesell, U., Rijkenberg, M. J. A., Saito, H., Takeda, S., Timmermans, K. R., Veldhuis, M. J. W., Waite, A. M., and Wong, C.-S.: Synthesis of iron fertilization experiments: From the Iron Age in the Age of Enlightenment, J. Geophys. Res., 110, 9–16, https://doi.org/10.1029/2004JC002601, 2005.
De Jong, J., Schoemann, V., Lannuzel, D., Croot, P., De Baar, H., and Tison, J. L.: Natural iron fertilization of the Atlantic sector of the Southern Ocean by continental shelf sources of the Antarctic Peninsula, J. Geophys. Res.-Biogeo., 117, https://doi.org/10.1029/2011JG001679, 2012.
Delmont, T. O., Hammar, K. M., Ducklow, H. W., Yager, P. L., and Post, A. F.: Phaeocystis antarctica blooms strongly influence bacterial community structures in the Amundsen Sea polynya, Front. Microbiol., 5, 1–13, https://doi.org/10.3389/fmicb.2014.00646, 2014.
DeVries, T.: The Oceanic Anthropogenic CO2 Sink: Storage, Air-Sea Fluxes, and Transports over the Industrial Era, Global Biogeochem. Cy., 28, 631–647, 2014.
Diamond, D.: QuikChem Method 10-114-21-1-B: Silicate by flow injection analysis, Lachat Instruments, 1994.
Dinniman, M. S., St-Laurent, P., Arrigo, K. R., Hofmann, E. E., and van Dijken, G. L.: Analysis of Iron Sources in Antarctic Continental Shelf Waters, J. Geophys. Res.-Oceans, 125, e2019JC015736, https://doi.org/10.1029/2019JC015736, 2020.
Ditullio, G. R., Grebmeier, J. M., Arrigo, K. R., and Lizotte, M. P.: Rapid and early export of Phaeocystis antarctica blooms in the Ross Sea, Antarctica, Nature, 404, 1996–1999, 2000.
Dortch, Q.: The interaction between ammonium and nitrate uptake in phytoplankton, Mar. Ecol. Prog. Ser., 61, 183–201, https://doi.org/10.3354/meps061183, 1990.
Dowdeswell, J., Shears, J., Batchelor, C., Christie, F., Rack, W., Montelli, A., Evans, J., Dowdeswell, E., Ottesen, D., Fawcett, S., Bornman, T., Hutchinson, K., Audh, R., Burger, J., Flynn, R., Henry, T., Luyt, H., Smith, S., Spence, K., Woodall, L., Taylor, M., Frinault, B., Bekker, A., Zu, L., van Zilj, C., Matthee, J., and Makgabutlane, M.: The Weddell Sea Expedition 2019: Cruise Scientific Report, University of Cambridge, https://doi.org/10.17863/CAM.58103, 2019.
Dubelaar, G. B. J. and Jonker, R. R.: Flow cytometry as a tool for the study of phytoplankton, Sci. Mar., 64, 135–156, https://doi.org/10.3989/scimar.2000.64n2135, 2000.
Dugdale, R. C. and Goering, J. J.: Uptake of New and Regenerated Forms of Nitrogen in Primary Productivity, Limnol. Oceanogr., 12, 196–206, https://doi.org/10.4319/lo.1967.12.2.0196, 1967.
Dugdale, R. C. and Wilkerson, F. P.: The use of 15N to measure nitrogen uptake in eutrophic oceans; experimental considertations, Limnol. Oceanogr., 61, 673–689, https://doi.org/10.4319/lo.1986.31.4.0673, 1986.
Eicken, H.: The role of sea ice in structuring Antarctic ecosystems, Polar Biol., 12, 3–13, https://doi.org/10.1007/BF00239960, 1992.
El-Sayed, S.: Productivity of the Antarctic Waters – A Reappraisal, in: Marine Phytoplankton and Productivity. Lecture Notes on Coastal and Estuarine Studies, edited by: Holm-Hansen, O., Bolis, L., and Gilles, R., Springer, Berlin, Heidelberg, 19–34, 1984.
El-Sayed, S. Z. and Taguchi, S.: Primary production and standing crop of phytoplankton along the ice-edge in the Weddell Sea, Deep-Sea Res. Pt. I, 28, 1017–1032, https://doi.org/10.1016/0198-0149(81)90015-7, 1981.
Eppley, R. W. and Peterson, B.: Particulate organic matter flux and planktonic new production in the deep ocean, Nature, 282, 677–680, 1979.
Fahrbach, E., Rohardt, G., Schröder, M., and Strass, V.: Transport and structure of the weddell gyre, Ann. Geophys., 12, 840–855, https://doi.org/10.1007/s00585-994-0840-7, 1994.
Fahrbach, E., Rohardt, G., Scheele, N., Schroder, M., Strass, V., and Wisotzki, A.: Formation and discharge of deep and bottom water in the northwestern Weddell Sea, J. Mar. Res., 53, 515–538, https://doi.org/10.1357/0022240953213089, 1995.
Ferreira, A., Costa, R. R., Dotto, T. S., Kerr, R., Tavano, V. M., Brito, A. C., Brotas, V., Secchi, E. R., and Mendes, C. R. B.: Changes in Phytoplankton Communities Along the Northern Antarctic Peninsula: Causes, Impacts and Research Priorities, Front. Mar. Sci., 7, 576254, https://doi.org/10.3389/fmars.2020.576254, 2020.
Finkel, Z. V., Quigg, A., Raven, J. A., Reinfelder, J. R., Schofield, O. E., and Falkowski, P. G.: Irradiance and the elemental stoichiometry of marine phytoplankton, Limnol. Oceanogr., 51, 2690–2701, https://doi.org/10.4319/LO.2006.51.6.2690, 2006.
Flynn, R. F., Bornman, T. G., Burger, J. M., Smith, S., Spence, K., and Fawcett, S. E.: Summertime productivity and carbon export potential in the Weddell Sea, with a focus on the waters adjacent to Larsen C Ice Shelf, Zenodo [data set], https://doi.org/10.5281/zenodo.5567017, 2021.
Franck, V. M., Brzezinski, M. A., Coale, K. H., and Nelson, D. M.: Iron and silicic acid concentrations regulate Si uptake north and south of the Polar Frontal Zone in the Pacific Sector of the Southern Ocean, Deep-Sea Res. Pt. II, 47, 3315–3338, https://doi.org/10.1016/S0967-0645(00)00070-9, 2000.
Fripiat, F., Sigman, D. M., Fawcett, S. E., Rafter, P. A., Weigand, M. A., and Tison, J.-L.: New insights into sea ice nitrogen biogeochemical dynamics from the nitrogen isotopes, Global Biogeochem. Cy., 28, 115–130, https://doi.org/10.1002/2013GB004729, 2014.
Fripiat, F., Meiners, K. M., Vancoppenolle, M., Papadimitriou, S., Thomas, D. N., Ackley, S. F., Arrigo, K. R., Carnat, G., Cozzi, S., Delille, B., Dieckmann, G. S., Dunbar, R. B., Fransson, A., Kattner, G., Kennedy, H., Lannuzel, D., Munro, D. R., Nomura, D., Rintala, J. M., Schoemann, V., Stefels, J., Steiner, N., and Tison, J. L.: Macro-nutrient concentrations in Antarctic pack ice: Overall patterns and overlooked processes, Elementa, 5, 13, https://doi.org/10.1525/elementa.217, 2017.
Fripiat, F., Martínez-García, A., Marconi, D., Fawcett, S., Kopf, S., Luu, V., Rafter, P., Zhang, R., Sigman, D., and Haug, G.: Nitrogen isotopic contraints on nutrient transport to the upper ocean, Nat. Geosci., 14, 855–861, https://doi.org/10.1038/s41561-021-00836-8, 2021.
Frölicher, T. L., Sarmiento, J. L., Paynter, D. J., Dunne, J. P., Krasting, J. P., and Winton, M.: Dominance of the Southern Ocean in anthropogenic carbon and heat uptake in CMIP5 models, J. Climate, 28, 862–886, 2015.
Garcia, N. S., Sexton, J., Riggins, T., Brown, J., Lomas, M. W., and Martiny, A. C.: High variability in cellular stoichiometry of carbon, nitrogen, and phosphorus within classes of marine eukaryotic phytoplankton under sufficient nutrient conditions, Front. Microbiol., 9, 1–10, https://doi.org/10.3389/fmicb.2018.00543, 2018.
Gill, A. E.: Circulation and bottom water production in the Weddell Sea, Deep Sea Res. Oceanogr. Abstr., 20, 111–140, https://doi.org/10.1016/0011-7471(73)90048-X, 1973.
Gleitz, M., Michiel, M. R., Thomas, D. N., Dieckmann, G. S., and Millero, F. J.: Comparison of summer and winter inorganic carbon, oxygen and nutrient concentrations in Antarctic sea ice brine, Mar. Chem., 51, 81–91, https://doi.org/10.1016/0304-4203(95)00053-T, 1995.
Glibert, P. M., Wilkerson, F. P., Dugdale, R. C., Raven, J. A., Dupont, C. L., Leavitt, P. R., Parker, A. E., Burkholder, J. M., and Kana, T. M.: Pluses and minuses of ammonium and nitrate uptake and assimilation by phytoplankton and implications for productivity and community composition, with emphasis on nitrogen-enriched conditions, Limnol. Oceanogr., 61, 165–197, https://doi.org/10.1002/lno.10203, 2016.
Goeyens, L.: Ammonium regeneration in the Scotia-Weddell Confluence area during spring 1988, Mar. Ecol. Prog. Ser., 78, 241–252, https://doi.org/10.3354/meps078241, 1991.
Goeyens, L., Tréguer, P., Baumann, M. E. M., Baeyens, W., and Dehairs, F.: The leading role of ammonium in the nitrogen uptake regime of Southern Ocean marginal ice zones, J. Marine Syst., 6, 345–361, https://doi.org/10.1016/0924-7963(94)00033-8, 1995.
Goffart, A., Catalano, G., and Hecq, J. H.: Factors controlling the distribution of diatoms and Phaeocystis in the Ross Sea, J. Marine Syst., 27, 161–175, https://doi.org/10.1016/S0924-7963(00)00065-8, 2000.
Gonfiantini, R.: Stable isotope reference samples for geochemical and hydrological investigations, Rep. Advis. Group, Vienna, 1984.
Gordon, A. L., Huber, B. A., Hellmer, H. H., and Ffield, A.: Deep and bottom water of the Weddell Sea's western rim, Science, 265, 95–97, 1993.
Granger, J. and Sigman, D. M.: Removal of nitrite with sulfamic acid for nitrate N and O isotope analysis with the denitrifier method, Rapid Commun. Mass Sp., 23, 3753–3762, https://doi.org/10.1002/rcm.4307, 2009.
Grasshoff, K.: Methods of seawater analysis, Verlag Chemie, Weinheim, New York, 1976.
Green, S. E. and Sambrotto, R. N.: Plankton community structure and export of C, N, P and Si in the Antarctic Circumpolar Current, Deep-Sea Res. Pt. II, 53, 620–643, https://doi.org/10.1016/j.dsr2.2006.01.022, 2006.
Gruber, N., Clement, D., Carter, B. R., Feely, R. A., Van Heuven, S., and Hoppema, M.: The oceanic sink for anthropogenic CO2 from 1994 to 2007, Science, 363, 1193–1199, 2019.
Henley, S. F., Tuerena, R. E., Annett, A. L., Fallick, A. E., Meredith, M. P., Venables, H. J., Clarke, A., and Ganeshram, R. S.: Macronutrient supply, uptake and recycling in the coastal ocean of the west Antarctic Peninsula, Deep-Sea Res. Pt. II, 139, 58–76, https://doi.org/10.1016/j.dsr2.2016.10.003, 2017.
Holmes, R. M., Aminot, A., Kerouel, R., Hooker, B. A., and Peterson, B. J.: A simple and precise method for measuring ammonium in marine and freshwater ecosystems, Can. J. Fish. Aquat. Sci., 56, 10, 1801–1808, https://doi.org/10.1139/f99-128, 1999.
Hoppema, M. and Goeyens, L.: Redfield behavior of carbon, nitrogen, and phosphorus depletions in Antarctic surface water, Limnol. Oceanogr., 44, 220–224, https://doi.org/10.4319/lo.1999.44.1.0220, 1999.
Hoppema, M., Goeyens, L., and Fahrbach, E.: Intense nutrient removal in the remote area off Larsen Ice Shelf (Weddell Sea), Polar Biol., 23, 85–94, https://doi.org/10.1007/s003000050012, 2000.
Hoppema, M.: Weddell Sea is a globally significant contributor to deep-sea sequestration of natural carbon dioxide, Deep-Sea Re. Pt. I, 51, 169-1177, https://doi.org/10.1016/j.dsr.2004.02.011, 2004.
Hoppema, M., Middag, R., de Baar, H., Fahrbach, E., van Weerlee, E., and Thomas, H.: Whole season net community production in the Weddell Sea, Polar Biol., 31, 101–111, 2007.
Hoppema, M., Bakker, K., MAC van Heuven, S., van Ooijen, J. C., and de Baar, H. J.: Distributions, trends and inter-annual variability of nutrients along a repeat section through the Weddell Sea (1996–2011), Mar. Chem., 177, 545–553, https://doi.org/10.1016/j.marchem.2015.08.007, 2015.
Hutchins, D. A. and Bruland, K. W.: Iron-limited growth and Si:N ratios in a costal upwelling regime, Nature, 393, 561–564, 1998.
Hutchinson, K., Deshayes, J., Sallee, J. B., Dowdeswell, J. A., de Lavergne, C., Ansorge, I., Luyt, H., Henry, T., and Fawcett, S. E.: Water Mass Characteristics and Distribution Adjacent to Larsen C Ice Shelf, Antarctica, J. Geophys. Res.-Oceans, 125, 0–2, https://doi.org/10.1029/2019JC015855, 2020.
Isla, E., Rossi, S., Palanques, A., Gili, J. M., Gerdes, D., and Arntz, W.: Biochemical composition of marine sediment from the eastern Weddell Sea (Antarctica): High nutritive value in a high benthic-biomass environment, J. Mar. Syst., 60, 255–267, https://doi.org/10.1016/J.JMARSYS.2006.01.006, 2006.
Isla, E., Gerdes, D., Rossi, S., Fiorillo, I., Sañé, E., Gili, J.-M., and Arntz, W. E.: Biochemical characteristics of surface sediments on the eastern Weddell Sea continental shelf, Antarctica: is there any evidence of seasonal patterns?, Polar Biol., 348, 34, 1125–1133, https://doi.org/10.1007/S00300-011-0973-6, 2011.
Ito, T., Woloszyn, M., and Mazloff, M.: Anthropogenic carbon dioxide transport in the Southern Ocean driven by Ekman flow, Nature, 463, 80–83, https://doi.org/10.1038/nature08687, 2010.
Jacobs, S. S.: The Antarctic slope front, Antarct. J. US, 21, 123–124, 1986.
Jacobs, S. S.: On the nature and significance of the Antarctic Slope Front, Mar. Chem., 35, 9–24, https://doi.org/10.1016/S0304-4203(09)90005-6, 1991.
Jacques, G.: Is the concept of new production – regenerated production valid for the Southern Ocean?, Mar. Chem., 35, 273–286, https://doi.org/10.1016/S0304-4203(09)90022-6, 1991.
Jennings, J. C., Gordon, L. I., and Nelson, D. M.: Nutrient depletion indicates high primary productivity in the Weddell Sea, Nature, 309, 51–54, https://doi.org/10.1038/309051a0, 1984.
Kana, T. M. and Glibert, P. M.: Effect of irradiances up to 2000 on marine Synechococcus WH7803-I. Growth, pigmentation, and cell composition, Deep-Sea Res. Pt. I, 34, 479–495, https://doi.org/10.1016/0198-0149(87)90001-X, 1987.
Kaprelyants, A. S. and Kell, D. B.: Dormancy in stationary-phase cultures of Micrococcus luteus: flow cytometric analysis of starvation and resuscitation, Appl. Environ. Microb., 59, 3187–3196, 1993.
Karsh, K. L., Trull, T. W., Lourey, M. J., and Sigman, D. M.: Relationship of nitrogen isotope fractionation to phytoplankton size and iron availability during the Southern Ocean Iron RElease Experiment (SOIREE), Limnol. Oceanogr., 48, 1058–1068, https://doi.org/10.4319/lo.2003.48.3.1058, 2003.
Keffer, T. and Holloway, G.: Estimating Southern Ocean eddy flux of heat and salt from satellite altimetry, Nature, 332, 624–626, https://doi.org/10.1038/332624a0, 1988.
Keller, D. P., Kriest, L., Koeve, W., and Oschlies, A.: Southern Ocean biological impacts on global ocean oxygen, Geophys. Res. Lett., 43, 6469–6477, 2016.
Kerr, R., Mata, M. M., Mendes, C. R. B., and Secchi, E. R.: Northern Antarctic Peninsula: a marine climate hotspot of rapid changes on ecosystems and ocean dynamics, Deep-Sea Res. Pt. II, 149, 4–9, https://doi.org/10.1016/j.dsr2.2018.05.006, 2018.
Kirk, J.: Light and Photosynthesis in Aquatic Ecosystems, 2nd Edn., Cambridge, Cambridge University Press, https://doi.org/10.1017/CBO9780511623370, 1994.
Klunder, M. B., Laan, P., Middag, R., De Baar, H. J. W., and van Ooijen, J. C.: Dissolved iron in the Southern Ocean (Atlantic sector), Deep-Sea Res. Pt. II, 58, 2678–2694, https://doi.org/10.1016/j.dsr2.2010.10.042, 2011.
Klunder, M. B., Laan, P., De Baar, H. J. W., Middag, R., Neven, I., and Van Ooijen, J.: Dissolved Fe across the Weddell Sea and Drake Passage: impact of DFe on nutrient uptake, Biogeosciences, 11, 651–669, https://doi.org/10.5194/bg-11-651-2014, 2014.
Koike, I., Holm-Hansen, O., and Biggs, D.: Inorganic nitrogen metabolism by Antarctic phytoplankton with special reference to ammonium cycling, Mar. Ecol. Prog. Ser., 30, 105–116, https://doi.org/10.3354/meps030105, 1986.
Lannuzel, D., Schoemann, V., de Jong, J., Chou, L., Delille, B., Becquevort, S., and Tison, J. L.: Iron study during a time series in the western Weddell pack ice, Mar. Chem., 108, 85–95, https://doi.org/10.1016/j.marchem.2007.10.006, 2008.
Le Corre, P. and Minas, H.: Distributions et évolution des éléments nutritifs dans le secteur indien de l'Océan Antarctique en Wn de période estivale, Oceanol. Acta, 6, 365–381, 1983.
Leblanc, K., Arístegui, J., Armand, L., Assmy, P., Beker, B., Bode, A., Breton, E., Cornet, V., Gibson, J., Gosselin, M.-P., Kopczynska, E., Marshall, H., Peloquin, J., Piontkovski, S., Poulton, A. J., Quéguiner, B., Schiebel, R., Shipe, R., Stefels, J., van Leeuwe, M. A., Varela, M., Widdicombe, C., and Yallop, M.: A global diatom database – abundance, biovolume and biomass in the world ocean, Earth Syst. Sci. Data, 4, 149–165, https://doi.org/10.5194/essd-4-149-2012, 2012.
Llort, J., Lévy, M., Sallée, J., and Tagliabue, A.: Onset, intensification, and decline of phytoplankton blooms in the Southern Ocean, ICES J. Mar. Sci., 72, 1971–1984, https://doi.org/10.1093/icesjms/fsv053, 2015.
Locarnini, R. A., Whitworth, T., and Nowlin, W. D.: The importance of the Scotia Sea on the outflow of Weddell Sea Deep Water, J. Mar. Res., 51, 135–153, https://doi.org/10.1357/0022240933223846, 1993.
Lomas, M. W. and Glibert, P. M.: Interactions between NH4/+ and NO3/- uptake and assimilation: Comparison of diatoms and dinoflagellates at several growth temperatures, Mar. Biol., 133, 541–551, https://doi.org/10.1007/s002270050494, 1999.
Lourey, M. J., Trull, T. W., and Sigman, D. M.: Sensitivity of δ15N of nitrate, surface suspended and deep sinking particulate nitrogen to seasonal nitrate depletion in the Southern Ocean, Global Biogeochem. Cy., 17, 1–18, https://doi.org/10.1029/2002gb001973, 2003.
Martin, J. H., Gordon, R. M., and Fitzwater, S. E.: Iron Limitation, Limnol. Oceanogr., 36, 1793–1802, 1991.
Martínez-García, A., Sigman, D. M., Ren, H., Anderson, R. F., Straub, M., Hodell, D. A., Jaccard, S. L., Eglinton, T. I., and Haug, G. H.: Iron Fertilization of the Subantarctic Ocean During the Last Ice Age, Science, 343, 1347–1350, https://doi.org/10.1126/science.1246848, 2014.
Martiny, A. C., Pham, C. T. A., Primeau, F. W., Vrugt, J. A., Moore, J. K., Levin, S. A., and Lomas, M. W.: Strong latitudinal patterns in the elemental ratios of marine plankton and organic matter, Nat. Geosci., 6, 279–283, https://doi.org/10.1038/NGEO1757, 2013.
Mathot, S., Smith, W. O., Carlson, C. A., Garrison, D. L., Gowing, M. M., and Vickers, C. L.: Carbon partitioning within phaeocystis antarctica (prymnesiophyceae) colonies in the ross sea, antarctica, J. Phycol., 36, 1049–1056, https://doi.org/10.1046/j.1529-8817.2000.99078.x, 2000.
McIlvin, M. R. and Casciotti, K. L.: Technical updates to the bacterial method for nitrate isotopic analyses, Anal. Chem., 83, 1850–1856, https://doi.org/10.1021/ac1028984, 2011.
Mdutyana, M., Thomalla, S. J., Philibert, R., Ward, B. B., and Fawcett, S. E.: The Seasonal Cycle of Nitrogen Uptake and Nitrification in the Atlantic Sector of the Southern Ocean, Global Biogeochem. Cy., 34, 1–29, https://doi.org/10.1029/2019GB006363, 2020.
Moisan, T. A. and Mitchell, B. G.: Photophysiological acclimation of Phaeocystis antarctica Karsten under light limitation, Limnol. Oceanogr., 44, 247–258, https://doi.org/10.4319/LO.1999.44.2.0247, 1999.
Mosseri, J., Quéguiner, B., Armand, L., and Cornet-Barthaux, V.: Impact of iron on silicon utilization by diatoms in the Southern Ocean: A case study of cycle decoupling in a naturally iron-enriched area, Deep-Sea Res. Pt. II, 55, 801–819, https://doi.org/10.1016/j.dsr2.2007.12.003, 2008.
Muench, R. D. and Gordon, A. L.: Circulation and transport of water along the western Weddell Sea margin, J. Geophys. Res., 100, 18503–18515, https://doi.org/10.1029/95jc00965, 1995.
Nelson, M., Smith, O., Gordon, I., and Huber, A.: Spring distributions of density, nutrients, and phytoplankton biomass in the ice edge zone of the Weddell- Scotia Sea, J. Geophys. Res., 92, 7181–7190, 1987.
Nicholls, K. W., Pudsey, C. J., and Morris, P.: Summertime water masses off the northern Larsen C Ice Shelf, Antarctica, Geophys. Res. Lett., 31, 2–5, https://doi.org/10.1029/2004GL019924, 2004.
Nicholls, K. W., Østerhus, S., Makinson, K., Gammelsrød, T., and Fahrbach, E.: Ice-ocean processes over the continental shelf of the Southern Weddell Sea, Antarctica: A review, Rev. Geophys., 47, 1–23, https://doi.org/10.1029/2007RG000250, 2009.
Nissen, C. and Vogt, M.: Factors controlling the competition between Phaeocystis and diatoms in the Southern Ocean and implications for carbon export fluxes, Biogeosciences, 18, 251–283, https://doi.org/10.5194/bg-18-251-2021, 2021.
Olson, R. J.: Differential photoinhibition of marine nitrifying bacteria: a possible mechanism for the formation of the primary nitrite maximum, J. Mar. Res., 39, 227–238, 1981.
Orsi, A. H., Nowlin, W. D., and Whitworth, T.: On the circulation and stratification of the Weddell Gyre, Deep-Sea Res. Pt. I, 40, 169–203, https://doi.org/10.1016/0967-0637(93)90060-G, 1993.
Orsi, A. H., Whitworth, T., and Nowlin, W. D.: On the meridional extent and fronts of the Antarctic Circumpolar Current, Deep-Sea Res. Pt. I, 42, 641–673, https://doi.org/10.1016/0967-0637(95)00021-W, 1995.
Park, M. G., Yang, S. R., Kang, S.-H., Chung, K. H., and Shim, J. H.: Phytoplankton biomass and primary production in the marginal ice zone of the northwestern Weddell Sea during austral summer, Polar Biol., 21, 251–261, https://doi.org/10.1007/S003000050360, 1999.
Parsons, T. R., Maita, Y., and Lalli, C. M.: A Manual of Chemical and Biological Methods for Seawater Analysis Pergamon, Pergamon Press, Oxford, 173 pp., 1984.
Paulsen, M. L., Riisgaard, K., Thingstad, T. F., John, M. S., and Nielsen, T. G.: Winter-spring transition in the subarctic Atlantic: Microbial response to deep mixing and pre-bloom production, Aquat. Microb. Ecol., 76, 49–49, 2015.
Peng, X., Fuchsman, C. A., Jayakumar, A., Oleynik, S., Martens-Habbena, W., Devol, A. H., and Ward, B. B.: Ammonia and nitrite oxidation in the eastern tropical North Pacific, Global Biogeochem. Cy., 29, 2034–2049, 2015.
Petrou, K., Kranz, S. A., Trimborn, S., Hassler, C. S., Ameijeiras, S. B., Sackett, O., Ralph, P. J., and Davidson, A. T.: Southern Ocean phytoplankton physiology in a changing climate, J. Plant Physiol., 203, 135–150, https://doi.org/10.1016/j.jplph.2016.05.004, 2016.
Philibert, R., Waldron, H., and Clark, D.: A geographical and seasonal comparison of nitrogen uptake by phytoplankton in the Southern Ocean, Ocean Sci., 11, 251–267, https://doi.org/10.5194/os-11-251-2015, 2015.
Pineda-Metz, S. E. A., Isla, E., and Gerdes, D.: Benthic communities of the Filchner Region (Weddell Sea, Antarctica), Mar. Ecol. Prog. Ser., 628, 37–54, https://doi.org/10.3354/MEPS13093, 2019.
Pörtner, H. O., Karl, D. M., Boyd, P. W., Cheung, W. W., Lluch-Cota, S. E., Nojiri, Y., and Et, A.: Ocean systems, in: Impacts, Adaptation, and Vulnerability. Part A: Global and Sectoral Aspects. Contribution of Working Group II to the Fifth Assessment Report of the Intergovernmental Panel on Climate Change, edited by: Field, C. B. and Et, A., Cambridge University Press, Cambridge, 411–484, 2014.
Priddle, J., Boyd, I. L., Whitehouse, M. J., Murphy, E. J., and Croxall, J. P.: Estimates of Southern Ocean primary production – Constraints from predator carbon demand and nutrient drawdown, J. Marine Syst., 17, 275–288, https://doi.org/10.1016/S0924-7963(98)00043-8, 1998.
Probyn, T. A. and Painting, S. J.: Nitrogen uptake by size-fractionated phytoplankton populations in Antarctic surface waters, Limnol. Oceanogr., 30, 1327–1332, https://doi.org/10.4319/LO.1985.30.6.1327, 1985.
Ragueneau, O., Tréguer, P., Leynaert, A., Anderson, R. F., Brzezinski, M. A., DeMaster, D. J., Dugdale, R. C., Dymond, J., Fischer, G., François, R., Heinze, C., Maier-Reimer, E., Martin-Jézéquel, V., Nelson, D. M., and Quéguiner, B.: A review of the Si cycle in the modern ocean: Recent progress and missing gaps in the application of biogenic opal as a paleoproductivity proxy, Global Planet. Change, 26, 317–365, https://doi.org/10.1016/S0921-8181(00)00052-7, 2000.
Revilla, M., Alexander, J., and Glibert, P. M.: Urea analysis in coastal waters: Comparison of enzymatic and direct methods, Limnol. Oceanogr.-Meth., 3, 290–299, https://doi.org/10.4319/lom.2005.3.290, 2005.
Rönner, U., Sörensson, F., and Holm-Hansen, O.: Nitrogen assimilation by phytoplankton in the Scotia Sea, Polar Biol., 2, 137–147, https://doi.org/10.1007/BF00448963, 1983.
Rubin, S. I., Takahashi, T., Chipman, D. W., and Goddard, J.: Primary productivity and nutrient utilization ratios in the Pacific sector of the Southern Ocean based on seasonal changes in seawater chemistry, Deep-Sea Res. Pt. I, 45, 1211–1234, 1998.
Sallée, J. B., Shuckburgh, E., Bruneau, N., Meijers, A. J., Bracegirdle, T. J., and Wang, Z.: Assessment of Southern Ocean mixed-layer depths in CMIP5 models: Historical bias and forcing response, J. Geophys. Res.-Oceans, 118, 1845–1862, 2013.
Santoro, A. E., Sakamoto, C. M., Smith, J. M., Plant, J. N., Gehman, A. L., Worden, A. Z., Johnson, K. S., Francis, C. A., and Casciotti, K. L.: Measurements of nitrite production in and around the primary nitrite maximum in the central California Current, Biogeosciences, 10, 7395–7410, https://doi.org/10.5194/bg-10-7395-2013, 2013.
Sarmiento, J. and Toggweiler, J.: A new model for the role of the oceans in determining atmospheric , Nature, 308, 621–624, https://doi.org/10.1038/308621a0, 1984.
Sarmiento, J. L., Gruber, N., Brzezinski, M. A., and Dunne, J. P.: High-latitude controls of thermocline nutrients and low latitude biological productivity, Nature, 427, 56–60, https://doi.org/10.1038/nature10605, 2004.
Saxberg, B. E. H. and Kowalski, B. R.: Generalized Standard Addition Method, Anal. Chem., 51, 1031–1038, https://doi.org/10.1021/ac50043a059, 1979.
Scharek, R., Smetacek, V., Fahrbach, E., Gordon, L. I., Rohardt, G., and Moore, S.: The transition from winter to early spring in the eastern Weddell Sea, Antarctica: Plankton biomass and composition in relation to hydrography and nutrients, Deep-Sea Res. Pt. I, 41, 1231–1250, https://doi.org/10.1016/0967-0637(94)90042-6, 1994.
Schodlok, M. P., Hellmer, H. H., and Beckmann, A.: On the transport, variability and origin of densewatermasses crossing the South Scotia Ridge, Deep-Sea Res. Pt. II, 49, 4807–4825, 2002.
Schoemann, V., Becquevort, S., Stefels, J., Rousseau, V., and Lancelot, C.: Phaeocystis blooms in the global ocean and their controlling mechanisms: A review, J. Sea Res., 53, 43–66, https://doi.org/10.1016/j.seares.2004.01.008, 2005.
Schofield, O., Miles, T., Alderkamp, A. C., Lee, S. H., Haskins, C., Rogalsky, E., Sipler, R., Sherrell, R. M., and Yager, P. L.: In situ phytoplankton distributions in the Amundsen Sea Polynya measured by autonomous gliders, Elementa, 3, 1–17, https://doi.org/10.12952/journal.elementa.000073, 2015.
Schröder, M., Hellmer, H. H., and Absy, J. M.: On the near-bottom variability in the northwestern Weddell Sea, Deep-Sea Res. Pt. II, 49, 4767–4790, https://doi.org/10.1016/S0967-0645(02)00158-3, 2002.
Sedwick, P. N., Di Tullio, G. R., and Mackey, D. J.: Iron and manganese in the Ross Sea, Seasonal iron limitation in Antarctic, J. Geophys. Res.-Oceans, 105, 11321–11336, https://doi.org/10.1029/2000JC000256, 2000.
Semeneh, M., Dehairs, F., Elskens, M., Baumann, M. E. M., Kopczynska, E. E., Lancelot, C., and Goeyens, L.: Nitrogen uptake regime and phytoplankton community structure in the Atlantic and Indian sectors of the Southern Ocean, J. Marine Syst., 17, 159–177, https://doi.org/10.1016/S0924-7963(98)00036-0, 1998.
Sigman, D. M. and Boyle, E. A.: Glacial/interglacial variations in atmospheric carbon dioxide, Nature, 407, 859–869, https://doi.org/10.1038/35038000, 2000.
Sigman, D. M., Casciotti, K. L., Andreani, M., Barford, C., Galanter, M., and Böhlke, J. K.: A bacterial method for the nitrogen isotopic analysis of nitrate in seawater and freshwater, Anal. Chem., 73, 4145–4153, https://doi.org/10.1021/ac010088e, 2001.
Sigman, D. M., Hain, M. P., and Haug, G. H.: The polar ocean and glacial cycles in atmospheric CO2 concentration, Nature, 466, 47–55, https://doi.org/10.1038/nature09149, 2010.
Smart, S. M., Fawcett, S. E., Ren, H., Schiebel, R., Tompkins, E. M., Martínez-García, A., Stirnimann, L., Roychoudhury, A., Haug, G. H., and Sigman, D. M.: The Nitrogen Isotopic Composition of Tissue and Shell-Bound Organic Matter of Planktic Foraminifera in Southern Ocean Surface Waters, Geochem. Geophy. Geosy., 21, 1–29, https://doi.org/10.1029/2019GC008440, 2020.
Smetacek, V.: The giant diatom dump, Nature, 406, 574–575, https://doi.org/10.1038/35020665, 2000.
Smetacek, V., Assmy, P., and Henjes, J.: The role of grazing in structuring Southern Ocean pelagic ecosystems and biogeochemical cycles, Antarct. Sci., 16, 541–558, https://doi.org/10.1017/S0954102004002317, 2004.
Smith, J. M., Chavez, F. P., and Francis, C. A.: Ammonium Uptake by Phytoplankton Regulates Nitrification in the Sunlit Ocean, PLoS One, 9, 108173, https://doi.org/10.1371/journal.pone.0108173, 2014.
Smith, W. O. and Asper, V. L.: The influence of phytoplankton assemblage composition on biogeochemical characteristics and cycles in the southern Ross Sea, Antarctica, Deep-Sea Res. Pt. I, 48, 137–161, https://doi.org/10.1016/S0967-0637(00)00045-5, 2001.
Smith, W. O. and Nelson, D. M.: Phytoplankton growth and new production in the Weddell Sea marginal ice zone in the austral spring and autumn, Limnol. Oceanogr., 35, 809–821, https://doi.org/10.4319/lo.1990.35.4.0809, 1990.
Spiridonov, V. A., Nöthig, E. M., Schröder, M., and Wisotzki, A.: The onset of biological winter in the eastern Weddell Gyre (Antarctica) planktonic community, J. Marine Syst., 9, 211–230, https://doi.org/10.1016/S0924-7963(95)00049-6, 1996.
Stammerjohn, S., Massom, R., Rind, D., and Martinson, D.: Regions of rapid sea ice change: An inter-hemispheric seasonal comparison, Geophys. Res. Lett., 39, L06501, 2012.
Stefels, J. and Van Leeuwe, M. A.: Effects of iron and light stress on the biochemical composition of antarctic Phaeocystis sp. (Prymnesiophyceae). I. Intracellular DMSP concentrations, J. Phycol., 34, 486–495, https://doi.org/10.1046/j.1529-8817.1998.340486.x, 1998.
Strickland, J. D. H. and Parsons, T. R.: A practical handbook of seawater analysis, B. Fish. Res. Board Can., 167, 81–86, 1968.
Strzepek, R. F., Maldonado, M. T., Hunter, K. A., Frew, R. D., and Boyd, P. W.: Adaptive strategies by Southern Ocean phytoplankton to lessen iron limitation: Uptake of organically complexed iron and reduced cellular iron requirements, Limnol. Oceanogr., 56, 1983–2002, https://doi.org/10.4319/lo.2011.56.6.1983, 2011.
Sunda, W. G. and Huntsman, S. A.: Interrelated influence of iron, light and cell size on marine phytoplankton growth, Nature, 390, 389–392, https://doi.org/10.1038/37093, 1997.
Sunda, W. G. and Huntsman, S. A.: High iron requirement for growth, photosynthesis, and low-light acclimation in the coastal cyanobacterium Synechococcus bacillaris, Front. Microbiol., 6, 561, 2015.
Takeda, S.: Influence of iron availability on nutrient consumption ratio, Nature, 393, 774–777, 1998.
Talley, L. D., Pickard, G. L., Emery, W. J., and Swift, J. H.: Chapter 13 – Southern Ocean, edited by: Talley, L. D., Pickard, G. L., Emery, W. J., and Swift, J. H., Descriptive Physical Oceanography (Sixth Edition), Academic Press, 437–471, ISBN 9780750645522, https://doi.org/10.1016/B978-0-7506-4552-2.10013-7, 2011.
Taylor, B. W., Keep, C. F., Hall, R. O., Koch, B. J., Tronstad, L. M., Flecker, A. S., and Ulseth, A. J.: Improving the fluorometric ammonium method: matrix effects, background fluorescence, and standard additions, J. N. Am. Benthol. Soc., 26, 167–177, https://doi.org/10.1899/0887-3593(2007)26[167:ITFAMM]2.0.CO;2, 2007.
Tréguer, P. and Jacques, G.: Dynamics of nutrients and phytoplankton, and fluxes of carbon, nitrogen and silicon in the Antarctic Ocean, Polar Biol., 12, 149–162, https://doi.org/10.1007/BF00238255, 1992.
Tréguer, P., Bowler, C., Moriceau, B., Dutkiewicz, S., Gehlen, M., Aumont, O., Bittner, L., Dugdale, R., Finkel, Z., Iudicone, D., Jahn, O., Guidi, L., Lasbleiz, M., Leblanc, K., Levy, M., and Pondaven, P.: Influence of diatom diversity on the ocean biological carbon pump, Nat. Geosci., 11, 27–37, https://doi.org/10.1038/s41561-017-0028-x, 2017.
Vernet, M., Geibert, W., Hoppema, M., Brown, P. J., Haas, C., Hellmer, H. H., Jokat, W., Jullion, L., Mazloff, M., Bakker, D. C. E., Brearley, J. A., Croot, P., Hattermann, T., Hauck, J., Hillenbrand, C. D., Hoppe, C. J. M., Huhn, O., Koch, B. P., Lechtenfeld, O. J., Meredith, M. P., Naveira Garabato, A. C., Nöthig, E. M., Peeken, I., Rutgers van der Loeff, M. M., Schmidtko, S., Schröder, M., Strass, V. H., Torres-Valdés, S., and Verdy, A.: The Weddell Gyre, Southern Ocean: Present Knowledge and Future Challenges, Rev. Geophys., 57, 623–708, https://doi.org/10.1029/2018RG000604, 2019.
Volk, T. and Hoffert, M. I.: Ocean Carbon Pumps: Analysis of Relative Strengths and Efficiencies in Ocean-Driven Atmospheric CO2 Changes, in: Geophysical Monograph Series, edited by: Sundquist, E. T. and Broecker, W. S., AGU, Washington, 1985.
Ward, B. B.: Light and substrate concentration relationships with marine ammonium assimilation and oxidation rates, Mar. Chem., 16, 301–316, https://doi.org/10.1016/0304-4203(85)90052-0, 1985.
Ward, B. B.: Temporal variability in nitrification rates and related biogeochemical factors in Monterey Bay, California, USA, Mar. Ecol. Prog. Ser., 292, 97–109, https://doi.org/10.3354/meps292097, 2005.
Weber, T. and Deutsch, C.: Ocean nutrient ratios governed by plankton biogeography, Nature, 467, 550–554, https://doi.org/10.1038/nature09403, 2010.
Whitworth, T. and Nowlin, W. D.: Water Masses and Currents of the Southern Ocean at the Greenwich Meridian, J. Geophys. Res., 92, 6462–6476, https://doi.org/10.1029/JC092iC06p06462, 1987.
Yool, A., Martin, A., Fernández, C., and Clark, D. R.: The significance of nitrification for oceanic new production, Nature, 447, 999–1002, https://doi.org/10.1038/nature05885, 2007.
Zakem, E. J., Al-Haj, A., Church, M. J., Van Dijken, G. L., Dutkiewicz, S., Foster, S. Q., Fulweiler, R. W., Mills, M. M., and Follows, M. J.: Ecological control of nitrite in the upper ocean, Nat. Commun., 9, 1206, https://doi.org/10.1038/s41467-018-03553-w, 2018.