the Creative Commons Attribution 4.0 License.
the Creative Commons Attribution 4.0 License.
 | 01 Dec 2021
Modeling cyanobacteria life cycle dynamics and historical nitrogen fixation in the Baltic Proper
Jenny Hieronymus
Kari Eilola
Malin Olofsson
Inga Hense
H. E. Markus Meier
Elin Almroth-Rosell
Dense blooms of filamentous diazotrophic cyanobacteria are formed every summer in the Baltic Sea. These autotrophic organisms may bypass nitrogen limitation by performing nitrogen fixation, which also governs surrounding organisms by increasing bioavailable nitrogen. The magnitude of the nitrogen fixation is important to estimate from a management perspective since this might counteract eutrophication reduction measures. Here, a cyanobacteria life cycle model has been implemented for the first time in a high-resolution 3D coupled physical and biogeochemical model of the Baltic Sea, spanning the years 1850–2008. The explicit consideration of life cycle dynamics and transitions significantly improves the representation of the cyanobacterial phenological patterns compared to earlier 3D modeling efforts. Now, the rapid increase and decrease in cyanobacteria in the Baltic Sea are well captured, and the seasonal timing is in concert with observations. The current improvement also had a large effect on the nitrogen fixation load and is now in agreement with estimates based on in situ measurements. By performing four phosphorus sensitivity runs, we demonstrate the importance of both organic and inorganic phosphorus availability for historical cyanobacterial biomass estimates. The model combination can be used to continuously predict internal nitrogen loads via nitrogen fixation in Baltic Sea ecosystem management, which is of extra importance in a future ocean with changed conditions for the filamentous cyanobacteria.
- Article
(2022 KB) - Full-text XML
-
Supplement
(205 KB) - BibTeX
- EndNote


Bioavailable nitrogen is globally limiting primary production in the ocean (Moore et al., 2013). Diazotrophic cyanobacteria can bypass this limitation by performing nitrogen fixation. In addition, they may release up to 50 % of their newly fixed nitrogen, which stimulates surrounding organisms (Wannicke et al., 2009; Ploug et al., 2010, 2011). Anthropogenic pressures and climate change synergistically affect the Earth's ecosystems (Steffen et al., 2015). As nitrogen-fixing cyanobacteria are suggested to be enhanced by elevated temperatures (Paerl and Huisman, 2008; Wannicke et al., 2018), there is an increasing need to further understand their bloom dynamics and ecosystem impact.
The Baltic Sea is a semi-enclosed brackish water body exposed to significant impacts from eutrophication because of the combination of a large increase in nutrient supplies since World War II (Gustafsson et al., 2012), permanent stratification (e.g., Leppäranta and Myrberg, 2009), and long water residence times (Meier, 2007), which reduce the deep water ventilation and enhance the widespread oxygen deficiency. Therefore, nations around the Baltic Sea have decided on a Baltic Sea Action Plan to reduce external loads of nutrients to the area (HELCOM, 2007). The early history of multi-stressors and long-term data series in the Baltic Sea provides an opportunity to study consequences and possible mitigation strategies for future management of aquatic systems (Reusch et al., 2018).
Dense blooms of diazotrophic filamentous cyanobacteria, dominated by the taxa Nodularia spumigena, Aphanizomenon sp., and Dolichospermum spp. (Klawonn et al., 2016), are formed every summer in the Baltic Sea (Kahru and Elmgren, 2014; Olofsson et al., 2020, 2021). Despite reduced nutrient inputs (Gustafsson et al., 2012), there has been an increase in their abundance during recent decades (Finni et al., 2001; Kahru and Elmgren, 2014; Reusch et al., 2018), which in turn contributes to the eutrophication problem. Furthermore, future scenarios predict an earlier initiation of the phytoplankton spring bloom, and thus, a potentially prolonged growth period for filamentous cyanobacteria (Sommer et al., 2012; Kahru et al., 2016). Results from 4 decades of monitoring in the Baltic Sea suggest basin-specific changes of the cyanobacteria abundance and species composition due to decreased salinities and elevated temperatures (Olofsson et al., 2020).
The processes involved in the bloom formation of filamentous cyanobacteria are not yet fully understood (e.g., Conley et al., 2009; Nausch et al., 2012; Wasmund, 2017), but recent model studies (Hense and Beckmann, 2010; Hense and Burchard, 2010) and observations (Suikkanen et al., 2010) indicate that the life cycle of cyanobacteria plays an important role in determining the timing, duration, and magnitude of the blooms. The Cyanobacteria Life Cycle (CLC) model was introduced by Hense and Beckmann (2006) and includes, in its original design, four life cycle stages representing a vegetative non-nitrogen-fixing stage, a vegetative nitrogen-fixing stage, a resting stage (akinetes), and a non-growing recruiting stage. The rapid increase (or decrease) in the summer concentrations is, in the CLC model, a result of transfer between life cycle stages, in turn, dependent on light, temperature, and dissolved inorganic nitrogen (DIN, ammonium and nitrate). Phosphorus limitation is, however, not considered in the model formulation and still needs to be determined.
Since introduced, the CLC model has been further developed and studied (e.g., Hense and Beckmann, 2010; Hense and Burchard, 2010; Hense et al., 2013). In Hense and Burchard (2010) and Hense et al. (2013), the CLC model is implemented in a one-dimensional water column model representing the Eastern Gotland Basin, and the results show a clear improvement in the timing and duration of blooms compared to conventional one compartment models. While the aforementioned studies compared the model results to the seasonal cycle of cyanobacteria biomass, no comparison was made to observations of nitrogen fixation. Furthermore, the effect of the CLC model on the nutrient composition of ambient water was not made, and it has not yet been tested for the entire Baltic Proper where blooms of filamentous cyanobacteria are dominating the summer phytoplankton blooms.
While phosphorus limitation has not previously been considered in the CLC model, studies show that the growth of filamentous cyanobacteria is sensitive to the availability of phosphate (Moisander et al., 2007; Olofsson et al., 2016) with some cyanobacterial taxa being able to utilize both phosphate and organic phosphorus (Schoffelen et al., 2018). Understanding the dependence of phosphorus by cyanobacteria is of great importance in order to adequately model the phosphorus dynamics in the water column and the effect on other phytoplankton functional types. Furthermore, the cyanobacterial phosphorus dependence has implications for management, as changes in phosphorus loads ultimately affect the input of nitrogen through nitrogen fixation. Phosphorus loads are therefore of extra importance to decrease to allowable levels suggested by the Baltic Marine Environment Protection Commission HELCOM (2018).
The aims of the current study were to gain an understanding of phosphorus dynamics in the Baltic Proper as well as demonstrate the workings and boundaries of the CLC model in order to use it for continuous monitoring and estimates of nitrogen fixation for management purposes. This was done by (I) running sensitivity experiments addressing phosphorus limitation to determine the optimum settings for the Baltic Proper in relation to cyanobacteria blooms; (II) including the CLC model in a high-resolution 3D coupled physical and biogeochemical model of the Baltic Sea; and (III) comparing the new CLC model setup to the original model that excludes the CLC and validating it to observations of cyanobacteria carbon biomass and estimated nitrogen fixation measurements based on previous in situ measurements.
The Baltic Sea is a semi-enclosed estuary that has limited water exchange with the adjacent North Sea (Fig. 1). In order to study bloom formations of filamentous cyanobacteria, we included a modified version of the cyanobacteria life cycle (CLC) model in a high-resolution three-dimensional (3D) coupled physical–biogeochemical model of the Baltic Sea (Meier et al., 2003; Eilola et al., 2009; Almroth-Rosell et al., 2011) spanning 1850–2008. The CLC model is described in detail below, together with modifications of the biogeochemical model setup (schematically shown in Fig. 2, Table 1).
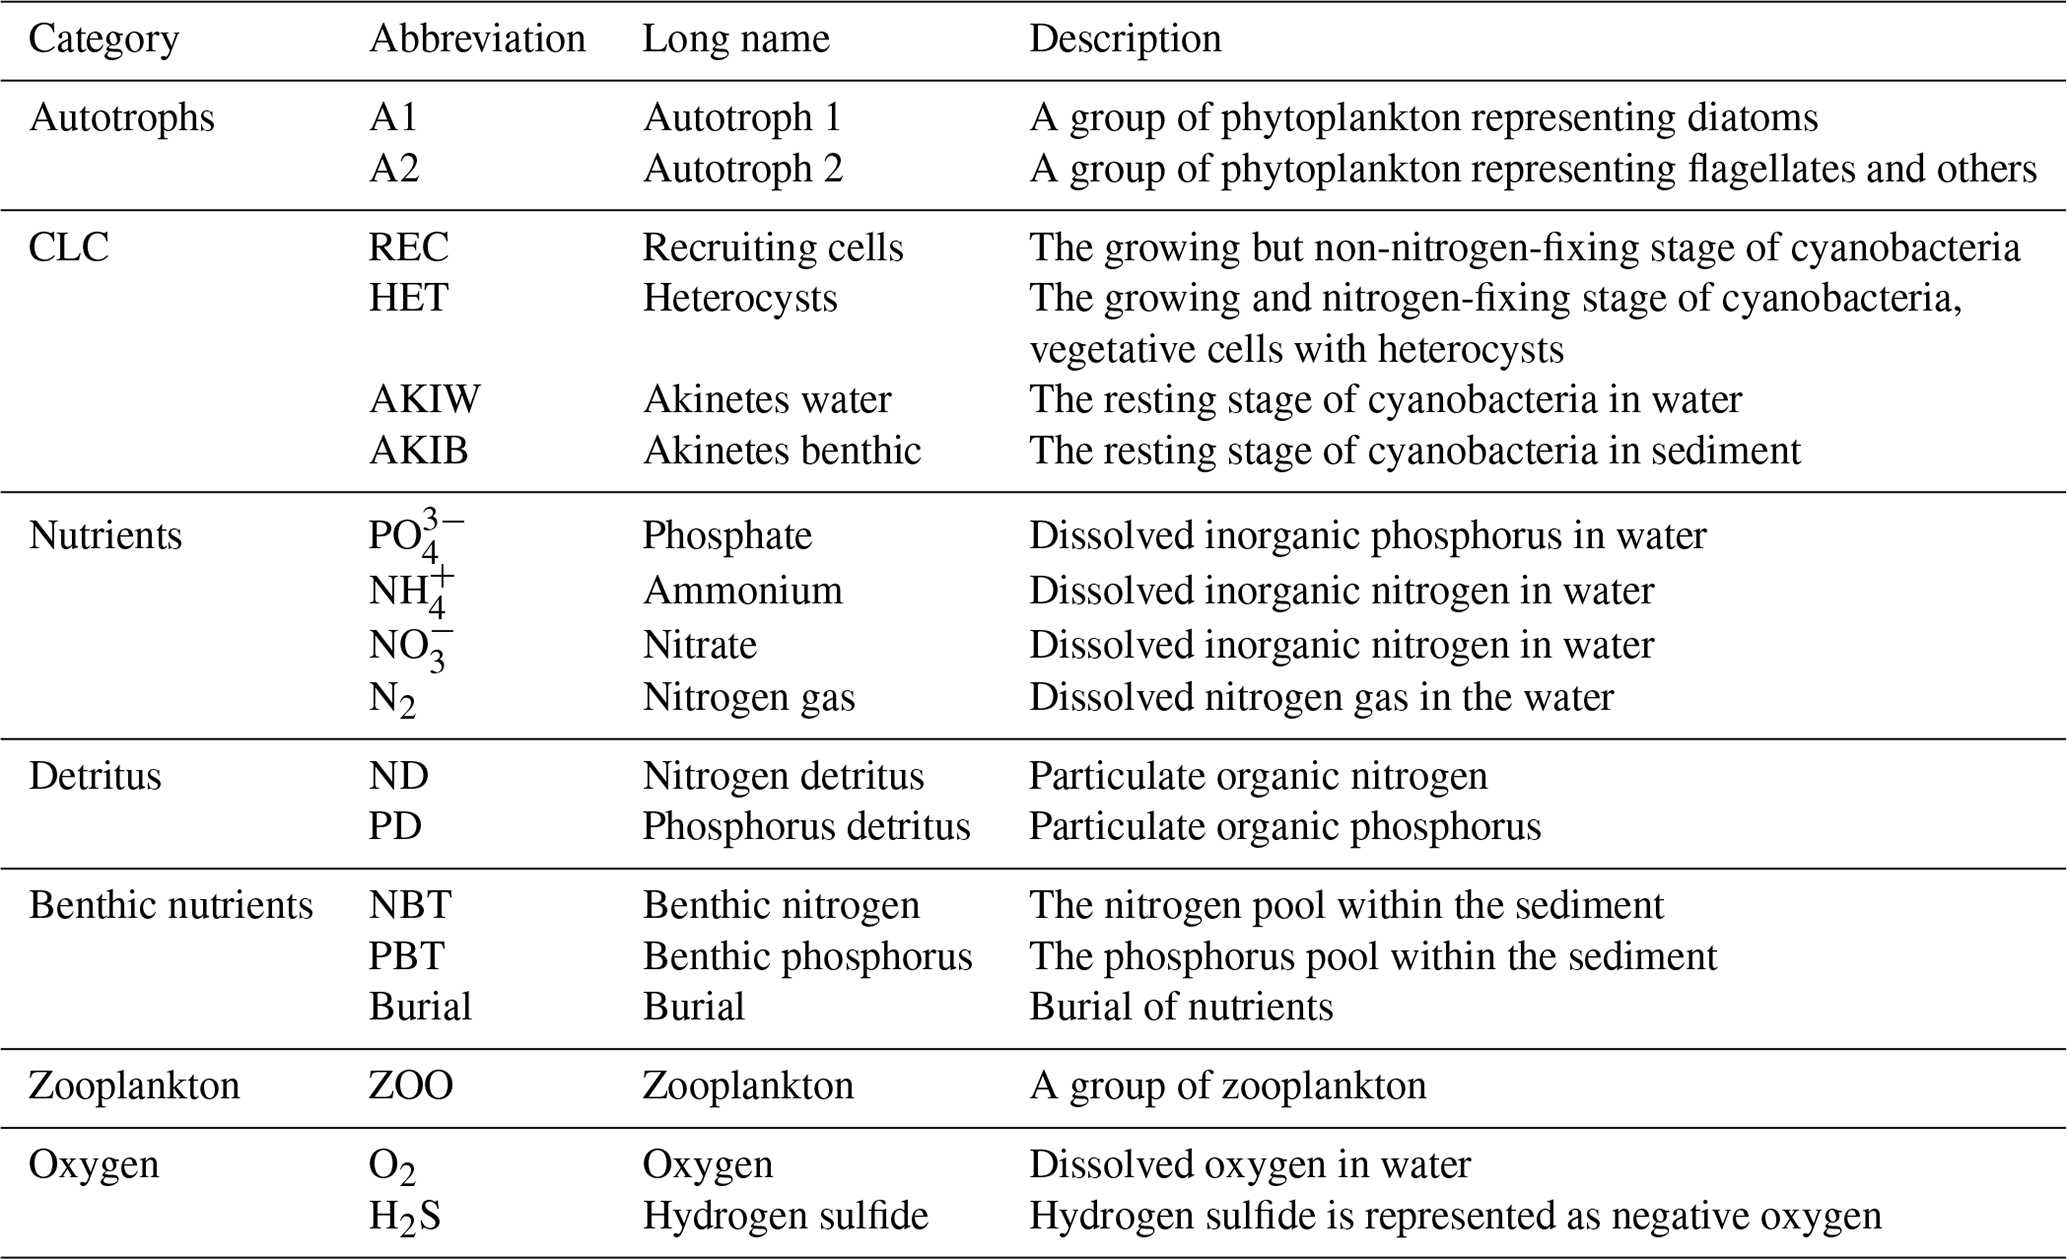

Figure 1Map of the Baltic Sea. Baltic Proper stations used in the study include BY31, BY15, BY5, and BY2.
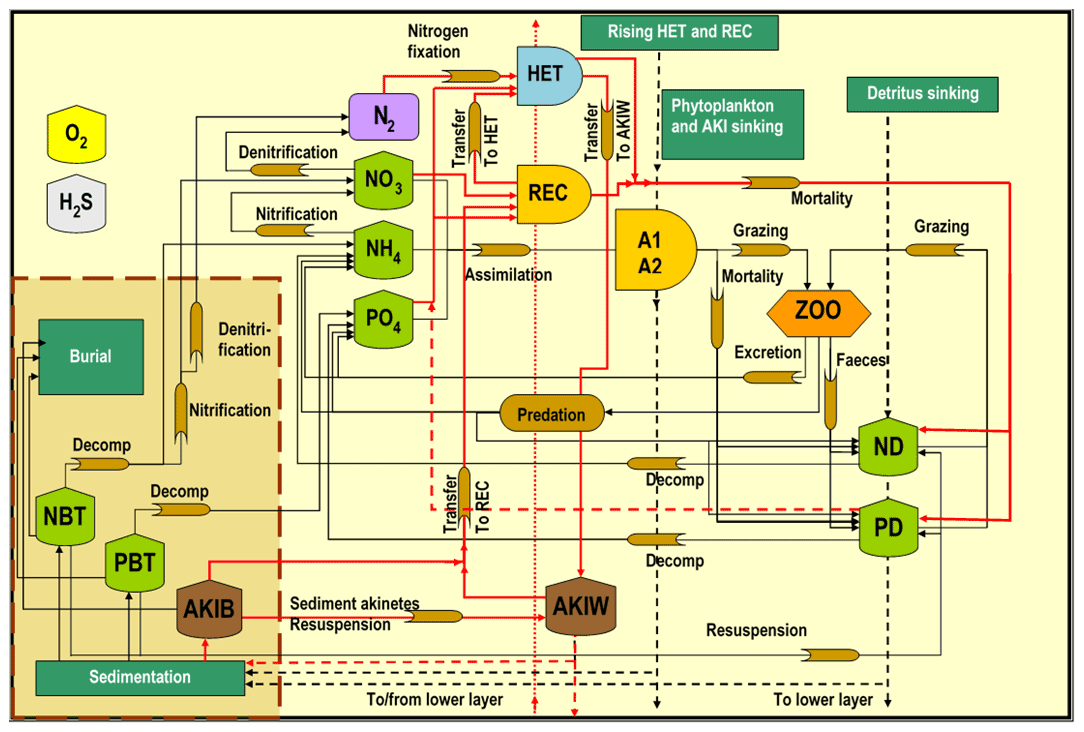
Figure 2The SCOBI model (modified from Eilola et al., 2009) including the cyanobacteria life cycle model components indicated by red lines, vegetative cells with heterocysts (HET), akinetes in water (AKIW) and in sediment (AKIB), and recruiting cells (REC). The inorganic nutrients nitrate, ammonia, and phosphate are represented by NO, NH, and PO, respectively. The phytoplankton groups A1 and A2 represent characteristics of diatoms and flagellates and others. The bulk zooplankton (ZOO) grazes on phytoplankton A1 and A2 while the parameterized predation closes the system of equations. Nitrogen and phosphorus detritus are described by ND and PD, respectively. Oxygen dynamics are included, and hydrogen sulfide concentrations are represented by negative oxygen equivalents (1 mL H2S L−1 = −2 mL O2 L−1). The process descriptions of oxygen and hydrogen sulfide are simplified for clarity. All abbreviations are described in Table 1.
2.1 Ocean circulation model
The RCO (Rossby Centre Ocean) model is a Bryan–Cox–Semtner primitive equation circulation model with a free surface (Killworth et al., 1991). Its open boundary conditions are implemented in northern Kattegat, based on prescribed sea level elevation at the lateral boundary (Stevens, 1990). An Orlanski radiation condition (Orlanski, 1976) is used to address the case of outflow, and the temperature and salinity variables are nudged toward climatologically annual mean profiles to deal with inflows (Meier et al., 2003). A Hibler-type dynamic–thermodynamic sea ice model (Hibler, 1979) with elastic–viscous–plastic rheology (Hunke and Dukowicz, 1997) and a two-equation turbulence closure scheme of the k–ε type with flux boundary conditions (Meier, 2001) are embedded into RCO. The deep-water mixing is assumed inversely proportional to the Brunt–Väisälä frequency, with the proportionality factor based on dissipation measurements in the Eastern Gotland Basin (Lass et al., 2003). RCO was used with a horizontal resolution of 2 nmi (3.7 km) and 83 vertical levels, with a layer thickness of 3 m. RCO allows direct communication between bottom boxes of the step-like topography (Beckmann and Döscher, 1997). A flux-corrected, monotonicity-preserving transport (FCT) scheme is applied in RCO (Gerdes et al., 1991). RCO has no explicit horizontal diffusion. For further details of the model setup, the reader is referred to Meier et al. (2003) and Meier (2007).
The model performance of temperature and salinity was evaluated in Meier et al. (2018) and conformed well to observations but showed a higher position of the halocline and slightly lower bottom water salinity, and some deviations with higher temperatures were found in the upper part of the halocline.
2.2 Biogeochemical model
The biogeochemical model SCOBI (Swedish Coastal and Ocean Biogeochemical model) has been developed to study the nutrient cycling in the Baltic Sea (Marmefelt et al., 1999; Eilola et al., 2009; Almroth-Rosell et al., 2011, 2015). SCOBI handles biological and ecological processes in the sea as well as sediment nutrient dynamics and is coupled to RCO in this study (e.g., Eilola et al., 2012, 2013, 2014). Resuspension of organic matter is calculated, with the help of a simplified wave model, from the wave and current-induced shear stresses (Almroth-Rosell et al., 2011). The model includes three different functional types representing diatoms, flagellates and other microalgae, and cyanobacteria as well as one zooplankton. SCOBI has a constant carbon-to-chlorophyll a ratio, 50 mg C (mg chl)−1, and the production of phytoplankton assimilates carbon, nitrogen, and phosphorus according to the Redfield molar ratio (106 : 16 : 1, respectively) (Eilola et al., 2009). The molar ratio of complete oxidation of the remineralized nutrients is O2 : carbon = 138. Nitrogen fixation is a function of temperature, light availability, nitrogen-to-phosphorus ratio, and phosphorus concentration in the ambient water (Eilola et al., 2009). Dead organic material, represented by separate variables for nitrogen and phosphorus, accumulates in detritus in the water column and in the sediments. For further details of the “standard” SCOBI model, the reader is referred to Eilola et al. (2009, 2011) and Almroth-Rosell et al. (2011).
2.3 Cyanobacteria life cycle model
In the original SCOBI model, cyanobacteria are represented by one state variable, and the population is upheld by a minimum biomass. The growth is dependent on light, temperature, and nutrients (nitrogen and phosphorus), and nitrogen fixation occurs when the DIN concentration is low after the spring bloom.
The CLC model is seasonal, with only one full life cycle each year (Fig. 3), and simulates four state variables instead of one in the original SCOBI model. It is modified from the detailed life cycle model by Hense and Beckmann (2006) that includes internal nitrogen and energy quotas and the simplified version by Hense and Beckmann (2010). Similar to Hense and Beckmann (2010), growth and life cycle transitions in our CLC model depend only on external factors, but we kept the sinking and rising stages separated, generating an additional life cycle variable. The CLC model equations as well as variables and parameters can be found in Tables S1–S4 in the Supplement.
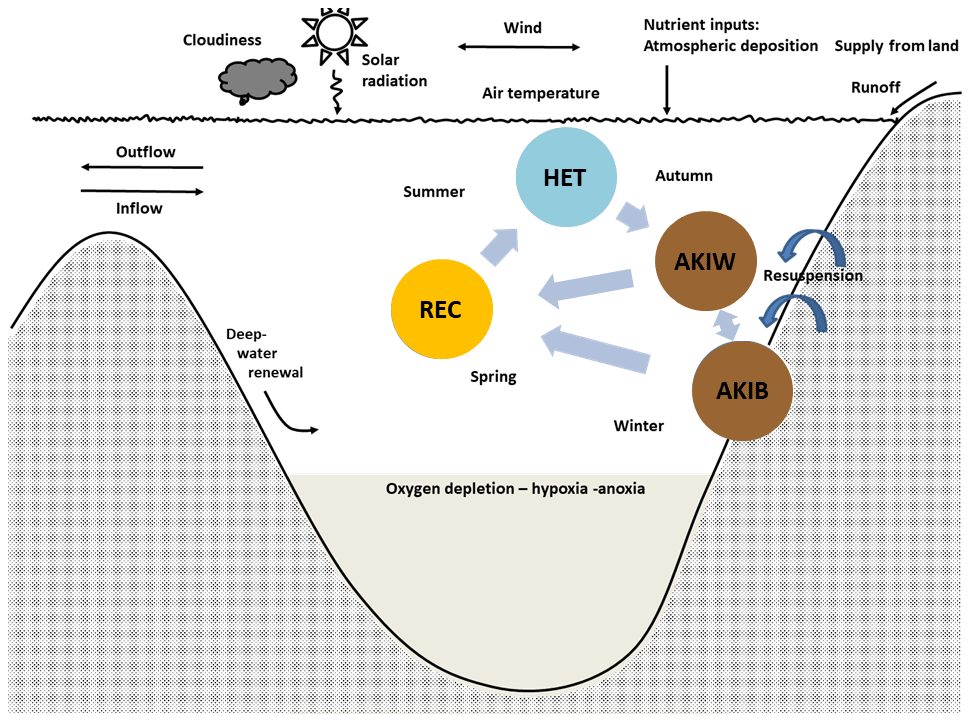
Figure 3The simplified cyanobacteria life cycle used in the present model (modified after Hense and Beckmann, 2006, 2010) represents nitrogen-fixing filamentous akinetes producing cyanobacteria with stage-dependent upward and downward velocity. The model includes three compartments, the nitrogen-fixing stage (HET), the resting stage of akinetes (AKI), and the recruiting stage (REC). Occasions with resuspension may transfer akinetes from the sediment (AKIB) to the water (AKIW). Modified from Schneider et al. (2015) and Meier et al. (2019).
We distinguish between three life cycle stages (Fig. 3): the growing and nitrogen-fixing stage (vegetative cells with heterocysts, HET), the resting stage (akinetes, AKI), and a stage (REC) where we combine the recruiting (cells with gas vesicles) and the growing non-nitrogen-fixing stage (vegetative cells without heterocysts). REC and HET are assumed to acquire carbon, nitrogen and phosphorus and produce detritus, according to Redfield molar ratios. HETs are positively buoyant, AKIs in the water (AKIW) are sinking and may end up in the sediment (AKIB), and RECs are rising. Dead HETs and RECs end up in the pool of dead organic matter (Fig. 2). Occasions with resuspension may transfer akinetes from the sediment (AKIB) to the water (AKIW).
Life cycle transitions were treated in a relatively simple way: following Hense and Beckmann (2010), we used the in situ growth rate for the transition between the life cycle stages HET and AKI. In autumn, when the growth rate, which is dependent on temperature and light, was below a critical threshold, a transfer into the AKI compartment took place (Eq. 11, Table S3).
For the transition between AKI (AKIB and AKIW) and REC, we prescribed a fixed germination window instead of using a dynamic germination window as proposed by Hense and Beckmann (2010). Between 20 April and the end of April, germination occurred at a constant rate times the AKI concentration (see Eq. 30 in Table S3). This is because the computational costs of a dynamic window in a 3D framework are too high. However, shifting the germination window has only a small impact on the timing of maximum cyanobacteria abundance in summer and the magnitude of nitrogen fixation. A sensitivity test showed that the decadal mean nitrogen fixation was lower when germination was earlier by about 4 %–7 %, while the maximum annual difference found for the entire period (1850–2008) was 14 % lower.
The transition from the recruiting and vegetative state (REC) to the diazotrophic state (HET) takes place when the growth of HET is larger than that of REC (Eq. 10 in Table S3). The maximum growth rate (s−1) of REC is larger than that of HET, but the growth (mmol m−3 s−1) is in the previous state, also dependent on DIN. When DIN is low after the spring bloom, the growth of HET becomes larger than that of REC, and a transition to HET occurs.
The temperature dependence of HET and REC growth is given by the temperature limitation function (Supplement, Table S3, Eqs. S8 and S26). Between approximately 6 and 28 ∘C an increase in temperature positively affects the growth rate of HET and REC while an increase above 28 ∘C instead generates a decline in growth rate. The model equation was designed to represent the observational data presented in Lehtimäki et al. (1997). The original formulation in Hense and Beckmann (2006), based on the same data, was found to be numerically unstable in the 3D model framework and was therefore redesigned. The resulting model formulation closely resembles that of Hense and Beckmann (2006) but gives slightly higher growth rates at low temperatures.
For potential growth of REC and HET and potential transition of AKI to REC, we assumed a salinity span between 3 and 10 PSU, which is in fair agreement with the optimum growth of N. spumigena (5–10 PSU), Aphanizomenon sp. (0–7 PSU) (Rakko and Seppälä, 2014), and Dolichospermum spp. (0–6 PSU) (Teikari et al., 2019). This constrains the cyanobacteria to areas within the Baltic Sea that lie within the given salinity span. The AKIB is assumed to be rapidly immobilized in the sediment, simulated as a very large burial, under salinity outside of the defined range.
Similar to Hense and Beckmann (2006, 2010), we pooled the three main important nitrogen-fixing taxa N. spumigena, Aphanizomenon sp., and Dolichospermum spp. into one functional cyanobacteria group. We are well aware that there are differences among the species (e.g., with respect to salinity and/or temperature dependence), and thus we may not expect to be able to reproduce specific local patterns, for example in a low-salinity region outside of the range where some of the taxa can still thrive. Nevertheless, as we will show, our model was able to reproduce the main seasonal and spatial patterns of biomass and nitrogen fixation.
We herein refer to the 3D coupled RCO–SCOBI that includes the new CLC as SCOBI-CLC while the old model version without CLC will be referred to as SCOBI.
2.4 Model forcing
The historical simulation uses reconstructed atmospheric, hydrological, and nutrient load forcing and daily sea levels at the lateral boundary for the period 1850–2008 as described in detail in Meier et al. (2018) and Gustafsson et al. (2012) and references therein. The used high-resolution atmospheric forcing fields for the period 1850–2008 were reconstructed using atmospheric model data for 1958–2007 together with historical station data of daily sea-level pressure and monthly air temperature observations. For the calculation of monthly mean river flows, five different historical datasets were merged. The basin-integrated reconstructed nutrient loads from land and atmosphere to the present model are the same as used and described by Gustafsson et al. (2012). Nutrient loads contain both organic and inorganic phosphorus and nitrogen. In the present SCOBI version, the nitrogen and phosphorus detritus was separated and thus used both organic phosphorus and nitrogen from the forcing. This is the only difference in forcing from the present SCOBI model compared to the model used by Meier et al. (2018), where detritus consisted of one pool limited by the Redfield ratio. Daily mean sea level elevations at the boundary in the northern Kattegat were calculated from the reconstructed, meridional sea level pressure gradient across the North Sea. In case of inflow, temperature, salinity, nutrients, and detritus values were nudged towards observed climatological seasonal mean profiles for 1980–2005 at the monitoring station Å17 in the southern Skagerrak. Nutrient concentrations before 1900 were assumed to be only 85 % of present-day concentrations. A linear decrease in nutrient concentrations from 1950 and back in time to 1900 was assumed.
2.5 Observations
The Swedish National Marine Monitoring Program includes monthly tube sampling of phytoplankton abundance (including filamentous cyanobacteria) and water collection for chemical and physical parameters (e.g., inorganic nutrients, oxygen, salinity, temperature). These data are hosted by the Swedish National Oceanographic Data Centre at the Swedish Hydrological and Meteorological Institute and are freely accessible at https://www.smhi.se (last access: March 2019). For this work, we also used data of oxygen and nutrients from the Baltic Environmental Database (BED), which include post-processed monitoring station data from a number of institutes around the Baltic Sea. The data are freely available at http://nest.su.se/bed (last access: January 2017). The cyanobacteria biovolume (mm3 L−1) was calculated based on cell numbers and size of filaments (Olenina et al., 2006) and further to carbon concentrations (referred to as cyanobacteria biomass) based on Menden-Deuer and Lessard (2000). Concentrations of inorganic nutrients and oxygen were extracted from the database for station BY15 in the Eastern Gotland Basin and cyanobacteria biomass for four stations in the Baltic Proper for 1999–2008 (Fig. 1).
The cyanobacteria biovolume was used to estimate nitrogen fixation rates (mmol N m−2 d−1) based on empirical biovolume-specific measurements (Klawonn et al., 2016) according to calculations in Olofsson et al. (2021). Shortly, the observed biovolumes (mm3 L−1) were multiplied with biovolume-specific measurements (µmol N mm−3 d−1) and further integrated over 0–10 m to obtain area-specific nitrogen fixation rates (mmol N m−2 d−1). These rates were summarized, first monthly and then for the whole year, and multiplied with the size of the Baltic Proper (200 000 km2) to provide annual nitrogen loads via nitrogen fixation by filamentous cyanobacteria (kt N yr−1) in 1999–2008.
2.6 Phosphorus dependence
In the original model by Hense and Beckmann (2006) that includes the internal energy and nitrogen, the seasonal changes in cyanobacteria biomass are adequately modeled without taking phosphate into account. The rapid decrease in HET in autumn is then a result of an internal energy crisis caused by the high energy demand of nitrogen fixation together with decreasing temperatures and light. This is also true for the simplified model of Hense and Beckmann (2010) where the growth rate of HET is strongly limited by temperature. However, in the Baltic Sea, the phosphorus concentrations may limit the cyanobacteria biomass (Klawonn et al., 2016; Degerholm et al., 2006; Olofsson et al., 2016). We have therefore performed four sensitivity runs, listed below, to evaluate the role of phosphorus uptake. We distinguish between uptake of inorganic and organic phosphorus, since both types are utilized by cyanobacteria (Schoffelen et al., 2018). The preferential uptake of dissolved inorganic phosphorus is, however, assumed in the model.
-
noP – Phosphorus is excluded from cyanobacteria in line with Hense and Beckmann (2010). In this case, the cyanobacteria can grow completely independently of phosphate availability in ambient water. The cyanobacteria also do not, in this case only, take up or release any phosphate.
-
sPlim – There are strong limitations from both phosphate and organic phosphorus. In this case, the half saturation constants are large, and the cyanobacteria growth depends strongly on the availability of phosphate.
-
wPlim – A very small value (10−6 mmol P m−3) is assigned to the half saturation constants of both the phosphate and the organic phosphorus limitation terms, effectively removing the phosphorus limitation of cyanobacteria. As long as phosphate exists in small amounts in ambient water, the growth is maintained independently of the concentration. However, in the absence of phosphate the growth is terminated.
-
noOP – Limitation by inorganic phosphate is included, but the ability to utilize organic phosphorus in cyanobacteria is removed. As can be deduced from Eq. (S1) in the Supplement, Table S3, the growth, in this case, gets no additional reinforcement from organic phosphorus.
The differences in parameter values between the phosphorus sensitivity runs are found in Table S5.
We start by presenting the results of cyanobacteria biomass and nutrients from the four different phosphorus limitation experiments using SCOBI-CLC. The optimum combination was then used to compare with our old model setup that does not include the CLC (SCOBI), and with in situ observations in Sect. 3.2.
3.1 Phosphorus limitation experiments using SCOBI-CLC
3.1.1 Cyanobacteria biomass
The simulated biomass was generally larger than observations in all four SCOBI-CLC phosphorus limitation experiments (Fig. 4). The experiment that generated the largest biomass was by far noP, which completely excludes the impact of phosphorus in ambient water, and where no uptake or release of phosphorus occurs. Since the cyanobacteria, in this case, are not dependent on phosphate, they grew extensively even in the first part of the 20th century (Fig. 5) when observations indicate that cyanobacteria blooms seldom occurred (Finni et al., 2001). Through nitrogen fixation, the cyanobacteria also stimulate the surrounding phytoplankton, generating higher biomass of these as well (Fig. 5, lower panel). Figure 5 further displays a decline in cyanobacteria biomass from the mid-20th century to the 1980s for the experiment noP in the central Baltic Proper (BY15). The reason for this decline is most likely the sharp increase in nutrient loads (Gustafsson et al., 2012), generating a competitive advantage of faster-growing diatoms and flagellates and leaving less DIN for the non-nitrogen-fixing RECs. This is also indicated by the increase in diatoms and other phytoplankton biomass accompanying the cyanobacteria decline (Fig. 5, lower panel).
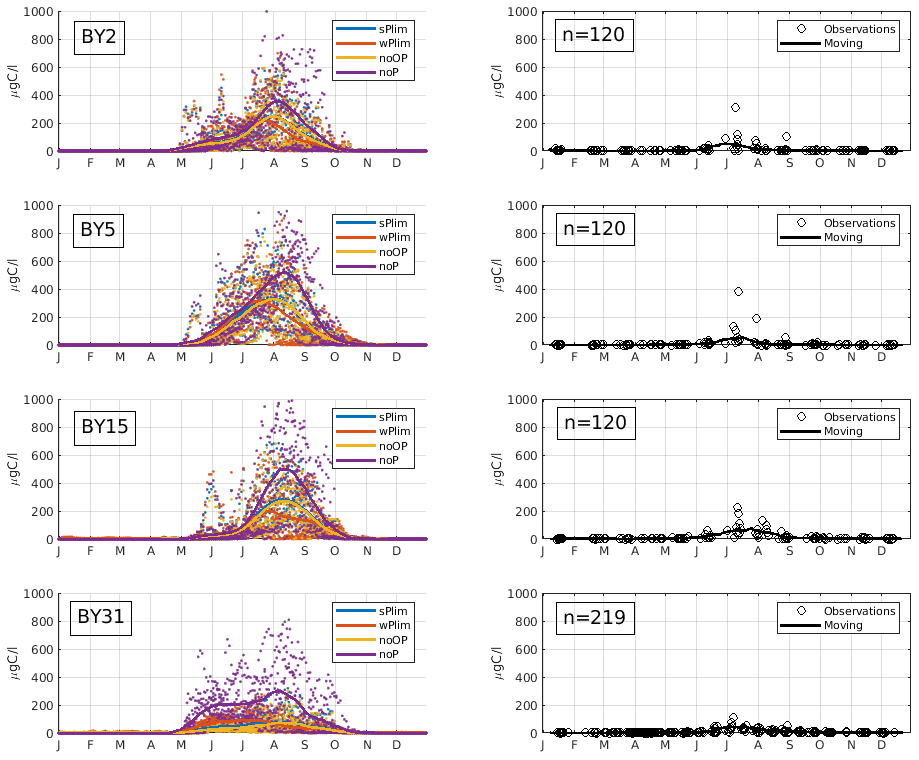
Figure 4Mean seasonal cycle of cyanobacteria biomass (REC + HET) for four different stations in the Baltic Proper (1999–2008). Left panels show SCOBI-CLC results and the right panels observations. The number of observations is indicated by “n” in the right-hand panels. Dots show model output for every 2 d, and solid lines represent the 1-month moving average.
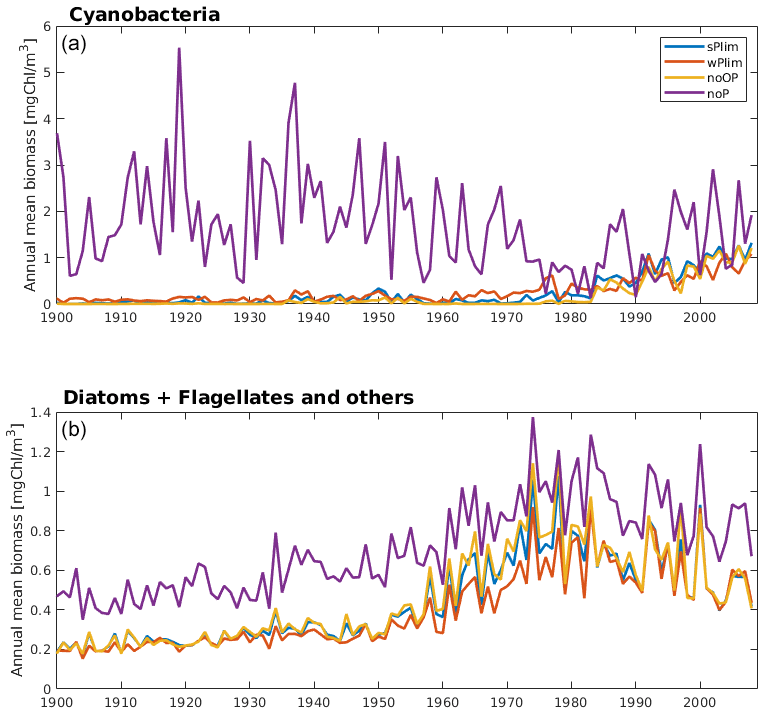
Figure 5Simulated annual mean cyanobacteria biomass (REC + HET, upper) and the sum of annual mean biomass of functional types diatoms and flagellates and other autotrophic organisms (lower) at station BY15 for the four different phosphorus sensitivity experiments using SCOBI-CLC.
Up until about 1980, the noOP experiment (no additional contribution from organic phosphorus) generally generated the lowest annual mean biomass and wPlim the highest after noP (Fig. 5). This is to be expected as the growth rate, given the same amount of organic and inorganic phosphorus, in the wPlim case is largest (see Eqs. S1 and S4 in Table S3). The experiments sPlim, wPlim, and noOP generated results closer to observations compared to noP for the period 1999–2008 (Fig. 4). The lowest biomass was, for this period, generated through wPlim for all stations except BY31, despite generating the highest biomass in the central Baltic Proper up until 1980 (Fig. 5). It is notable that wPlim also generated the best bloom timing compared to observations. This experiment allows cyanobacteria to grow quickly even at low phosphate concentrations as long as there is enough light, and the temperature is above approximately 6 ∘C (see Eq. 8 in Table S3). Thereby, light and temperature set the threshold of when the bloom will be initiated, and the phosphate dependence decides the end of it. The noP run generated a start of bloom that is close to wPlim but a later termination.
The observations show an increase in filamentous cyanobacteria biomass in May–June and with a maximum abundance in July–August (Fig. 4), which is a typical seasonal cycle of cyanobacteria in the Baltic Proper (Olofsson et al., 2021). The experiment that showed a seasonal timing that best corresponds to observations is wPlim, displaying a slightly earlier summer maximum than the other sensitivity experiments.
3.1.2 Nutrients and oxygen
Diazotrophic cyanobacteria increase bioavailable nitrogen in the water through their release of ammonium from its newly fixed nitrogen (Ploug et al., 2010, 2011). They also impact surrounding organisms by competing for phosphate. The influence of the cyanobacteria on the nutrient concentrations can therefore be seen in the different sensitivity experiments.
In order to understand the difference in biomass in the earlier and later parts of the model run between the experiments noOP, wPlim, and sPlim, we demonstrate the simulated mean seasonal cycle of phosphate and nitrate for the periods 1999–2008 and 1960–1980 for the central Baltic Proper, BY15 (Fig. 6). In the earlier period, wPlim consistently generated the highest biomass, apart from noP, and noOP the lowest as expected from the lower growth rate obtained in this case. However, in the later part of the run, the biomass was lowest in wPlim.
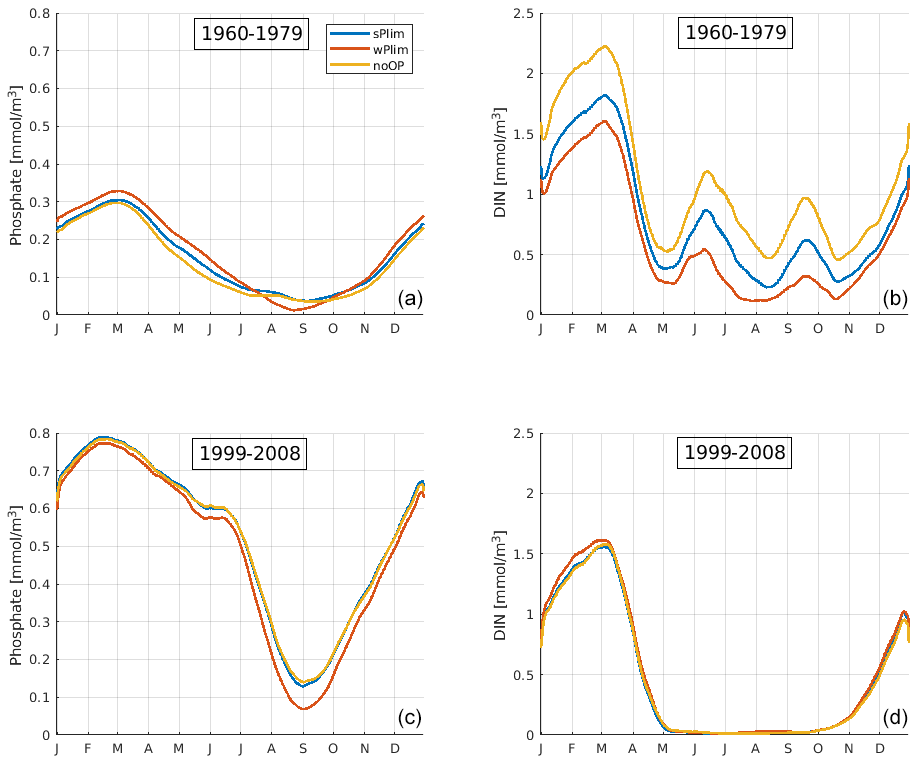
Figure 6SCOBI-CLC results of the mean seasonal cycles of surface phosphate (a, c) and dissolved inorganic nitrogen (DIN) (b, d) at station BY15 for the periods 1960–1979 (a, b) and 1999–2008 (c, d). The data points have been smoothed using a 1-month moving average.
In the early period, the mean seasonal cycles of nutrients in the central Baltic Proper, BY15 (Fig. 6), show that the phosphate concentrations were higher and DIN concentrations lower in wPlim compared to sPlim and noOP which generated higher cyanobacteria biomass. However, in the later period, the phosphate concentrations were lowest in wPlim, generating a smaller biomass compared to the sPlim and noOP. Furthermore, during the later period (1999–2008), DIN was completely depleted after the spring bloom, providing little opportunity for other phytoplankton than cyanobacteria to grow. During the earlier part of the run, DIN was available even during summer, allowing for higher biomass of the surrounding diatoms and other phytoplankton (Fig. 4).
The surface winter concentrations of phosphate and DIN as well as oxygen at 200 m depth at monitoring station BY15 were compared for the different runs together and observation data (Fig. 7). All experiments, with the notable exception of noP, conformed well to observed winter surface phosphate. With no phosphorus in cyanobacteria, the winter phosphate concentration becomes too high, reflecting the extensive primary production that leads to deep water oxygen depletion and generates sedimentary phosphate release in this experiment. The 200 m oxygen concentration was well captured in all other experiments.
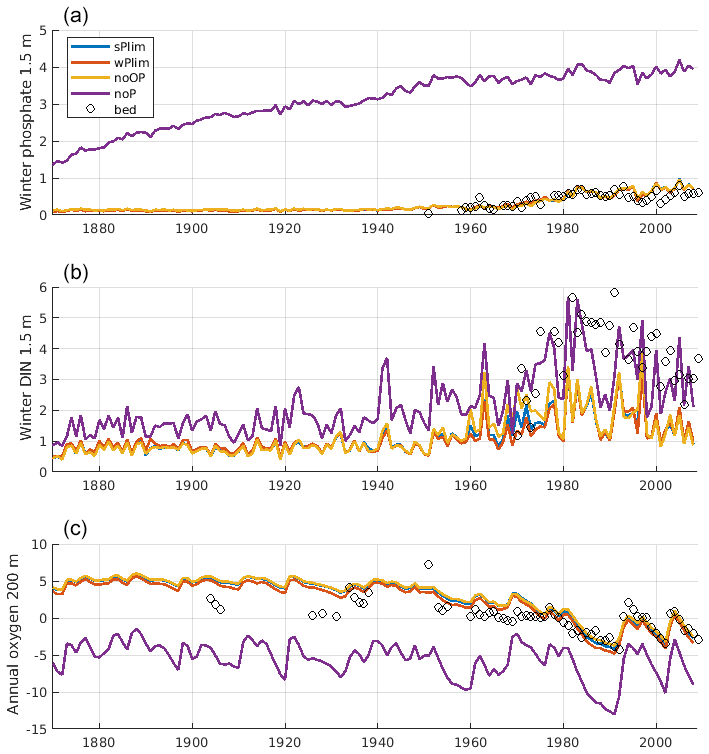
Figure 7Evolution of winter (January–February) surface concentrations of phosphate (a), dissolved inorganic nitrogen (DIN; b), and annual mean oxygen at 200 m depth (c) at BY15. The solid lines show SCOBI-CLC results from the different phosphorus limitation experiments, and the circles show observations from the Baltic Environmental Database (BED).
3.2 Nitrogen fixation and cyanobacteria biomass in SCOBI-CLC, SCOBI, and observations
To estimate cyanobacteria biomass and nitrogen fixation rates and compare with observations for the Baltic Proper, we used the phosphorus limitation setting wPlim based on the limitation experiments that best captured the size of biomass and the seasonal timing (Fig. 4). Compared to the SCOBI, SCOBI-CLC displays significant improvements in seasonal timing (Fig. 8). In line with observations, SCOBI-CLC generates a peak biomass in July, while the SCOBI results reach peak biomass in September. This is an important improvement attained by using the CLC model compared to previous results (Hieronymus et al., 2018) as the seasonal timing of biomass affects also the timing and size of nitrogen fixation. By obtaining a bloom more constrained to the summer months, a larger nitrogen fixation due to higher temperatures was observed using SCOBI-CLC. The updated nitrogen fixation rates were also in the same range as estimates based on measurements for the same stations during the years 1999–2008, both in magnitude and timing (Fig. 9).
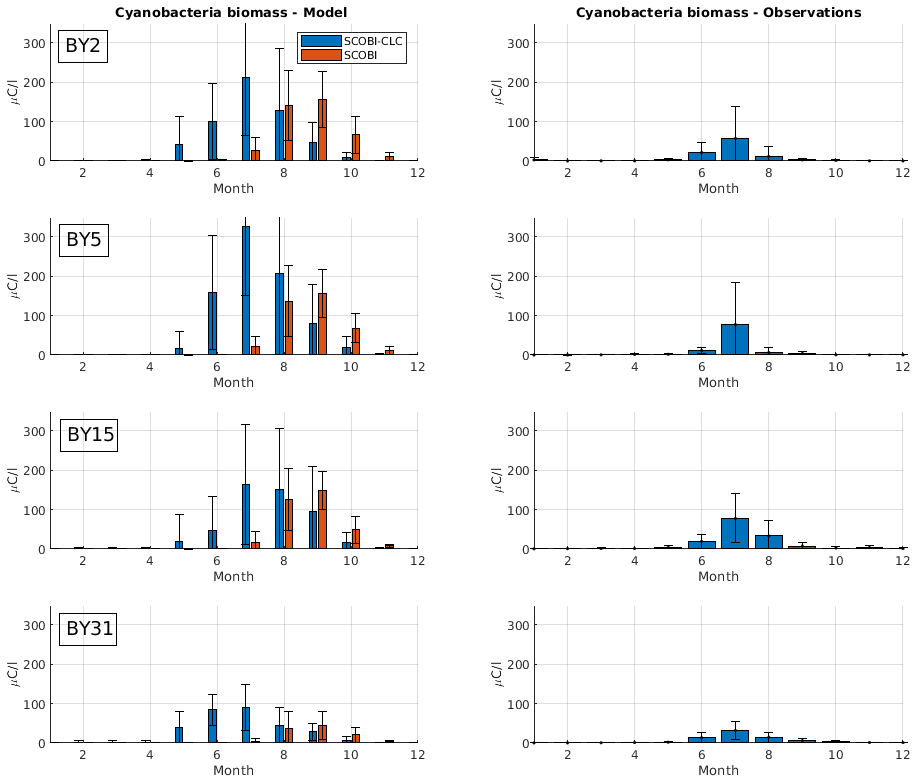
Figure 8Simulated (left) and observed (right) monthly mean cyanobacteria biomass (REC + HET) for four Baltic Proper monitoring stations over the years 1999–2008. Blue bars in the left column show SCOBI-CLC with the wPlim setting, and the orange bars show SCOBI. Black lines show the standard deviation.
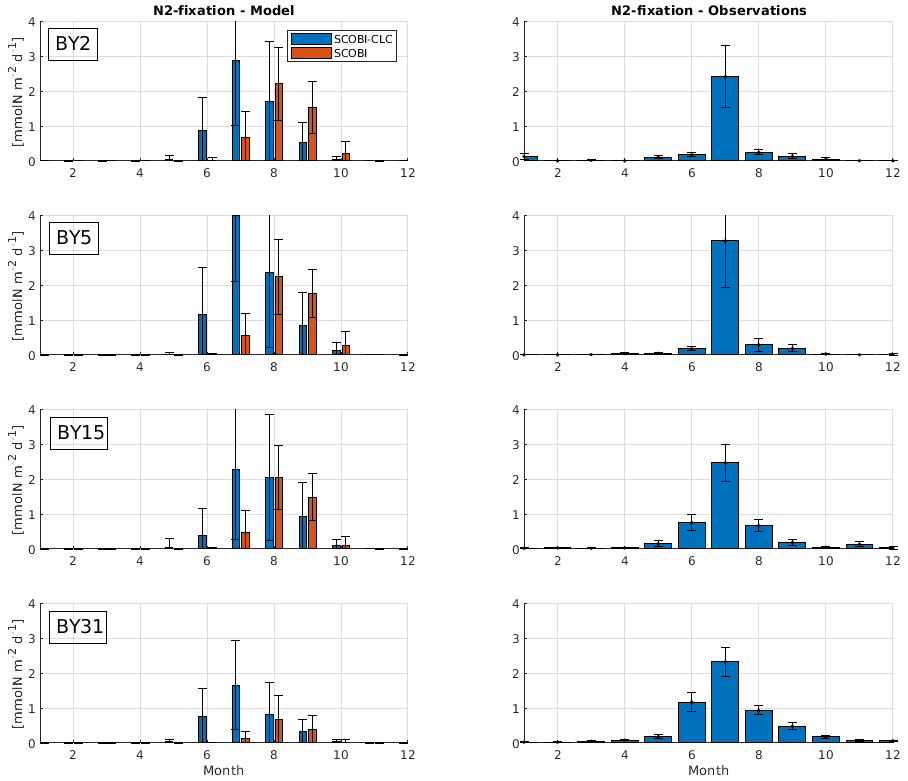
Figure 9Model results (left) and observations (right) of monthly mean nitrogen fixation rates over the years 1999–2008 at different stations. Blue bars in the left column show SCOBI-CLC with the wPlim setting, and the orange bars show SCOBI. Black lines show the standard deviation.
For nitrogen fixation, there was a slight difference where SCOBI-CLC displayed a prolonged peak period in July–August while the observations showed a peak more constrained to July. The strong coherence between modeled and observed nitrogen fixation is somewhat surprising given the larger cyanobacteria biomass in SCOBI-CLC compared to observations (Fig. 8). There may be several reasons for this discrepancy. The frequency of observations is bimonthly at most, which occasionally means missed peak values. Furthermore, the cyanobacteria biovolume from observations was used with different presumptions to estimate the nitrogen fixation rates and to calculate carbon concentrations. The modeled nitrogen fixation is calculated during the run from the growth of HET in the CLC model while the carbon content of cyanobacteria is calculated by the Redfield ratio between nitrogen and carbon in HET with a minor contribution also from REC. Hence, there are uncertainties in the calculations of carbon biomass from both observations and from model results. It is not easy to change the Redfield C : N : P ratio that is used in the model since the results from the entire biogeochemical cycle including the oxygen consumption in the model are dependent on this ratio. There are other biogeochemical models with variable C : N : P ratios that might be used to analyze the impact from these processes further (e.g., Fransner et al., 2018; Kwiatkowski et al., 2018). Uncertainties in the comparison of models and observations also stem from the fact that observations are done on small water samples from an area that is covered by an average value from a 3.7 km × 3.7 km grid in the model.
Nitrogen fixation in the Baltic Sea is dominated by the three filamentous taxa described herein (Klawonn et al., 2016). However, heterotrophic nitrogen fixation has also been observed in the Baltic Sea (e.g., Farnelid et al., 2013), but since their rates are extremely low in this region, they do not affect the overall input of nitrogen (heterotrophic bacteria: up to 0.44 nmol L−1 d−1 in Farnelid et al., 2013, as compared to 800 nmol L−1 d−1 by the filamentous cyanobacteria in Klawonn et al., 2016).
We estimated the internal nitrogen load via nitrogen fixation to the Baltic Proper based on monitoring and in situ measurements to a mean of 399 kt yr−1 for 1999–2008, but with a large variation among years (SD ± 104). This is slightly below the external load from river runoff and atmospheric deposition of 430 kt yr−1 (±54), provided by HELCOM (2018). For SCOBI-CLC, we got an estimated mean nitrogen load of 409 kt yr−1 for the experiment wPlim over the same years for the Baltic Proper (calculated over an area of 216 600 km2) compared to 271 kt yr−1 for SCOBI. The estimated annual nitrogen load via nitrogen fixation to the Baltic Proper has not changed over recent years (2013–2017 in Olofsson et al., 2021) and is in the range of other studies for the Baltic Proper (310 kt in Rolff et al., 2007; 370 kt in Wasmund et al., 2001; 396 kt in Svedén et al., 2016) but below the estimated load of 613 kt in Wasmund et al. (2005), 514 kt in Gustafsson et al. (2013), and 511 kt in Schneider et al. (2009).

Figure 10Model results with SCOBI (blue), with SCOBI-CLC model (red), and observations (black) of dissolved inorganic nitrogen (DIN), phosphate, and oxygen at BY5 (a–c) and BY15 (d–e) averaged over the years 1976 to 2008. Observational data are from the SHARK database. Shaded areas represent the standard deviation.
The mean vertical profiles of phosphate, DIN, and oxygen at stations BY5 and BY15 showed an overall good representation by both SCOBI-CLC and SCOBI (Fig. 10). Below the mixed layer, the DIN concentrations were high compared to observations for SCOBI-CLC, and the deep water phosphate at BY5 was a bit too low. Surface phosphate is slightly closer to observations for SCOBI-CLC than for SCOBI. The low surface DIN in both model versions is a reflection of low nitrate concentrations compared to observations which were also reported by Meier et al. (2012) and Saraiva et al. (2018). The low surface DIN is also demonstrated in Fig. 7 where the noP experiment gave rise to higher DIN concentrations as nitrogen fixation due to strong cyanobacteria blooms, in this case, adds more DIN to the water column. Despite the shortcomings, the trends for both nutrients and oxygen were well captured by both SCOBI-CLC and SCOBI.
Through a series of sensitivity experiments, we have shown that the inclusion of phosphorus dependence in cyanobacteria is essential for the CLC model in the Baltic Proper, but only a weak limitation is necessary. Excluding phosphorus in cyanobacteria generates too high of biomass values, especially in the first part of the 20th century when cyanobacteria blooms were rarely observed (Finni et al., 2001). The large primary production in this case was also reflected in too high phosphate concentrations as eutrophication induced anoxia, which gave rise to sedimentary phosphate release.
By including the CLC model in a 3D model for the Baltic Proper, we demonstrate a clear improvement in the seasonality of cyanobacteria blooms compared to the old model, which generates a peak biomass 2 months later and a nitrogen fixation peak 1 month later than observations. The next step in the development of the CLC model would be to include three individual types of cyanobacteria, to be able to more closely capture the differences between the dominating taxa (Klawonn et al., 2016). Aphanizomenon sp. for example can perform high nitrogen fixation rates already at 10 ∘C during early summer (Svedén et al., 2015) and is responsible for the highest total nitrogen fixation in the region due to its long growth season (Klawonn et al., 2016). Aphanizomenon sp. may also use different sources of phosphorus, which may further separate the growth niches by the filamentous cyanobacterial species (Schoffelen et al., 2018). Phosphorus cycling is a complex topic, which also needs further studies in natural ecosystems, as high turnover rates of phosphorus of only about 2 h are hard to trace (Nausch et al., 2018). To include more species in the model might be of extra importance as climate change scenarios can change the community composition in the future (Wulff et al., 2018; Olofsson et al., 2020).
In this work, we have used a CLC model that includes benthic and pelagic akinetes from which the summer blooms originate. Research has shown that the life cycles of the different major bloom-forming taxa are complex, and there is no single answer on how they start growing after winter (Munkes et al., 2021). Experiments have suggested that all taxa form akinetes to some extent, but the summer bloom of N. spumigena and Aphanizomenon sp. originates mainly from small, overwintering water column populations while Dolichospermum spp. seem to originate from both akinetes and pelagic filaments (Wasmund, 2017; Suikkanen et al., 2010). The large improvement in seasonality when the life cycle of cyanobacteria is modeled, as opposed to earlier modeling attempts that include only small winter populations, does however indicate that the separation into different life cycle stages is of key importance for capturing the start and end of bloom.
Capturing the seasonality of cyanobacteria blooms is of great importance due to their impact on water quality as well as for obtaining better estimates of nitrogen fixation that contributes to eutrophication. This work constitutes a step forward for the modeling of cyanobacteria blooms in the Baltic Sea. The inclusion of CLC can with some further development be used to merge observations and modeling for obtaining better prognostic estimates of cyanobacteria blooms, which can be used for management purposes.
The model code of the ocean model used for the simulations is publicly available from the Swedish Meteorological and Hydrological Institute, Norrköping, Sweden (https://www.smhi.se, last access: 24 November 2021). It can be made available upon request to ocean.data@smhi.se.
Model datasets displayed in the figures are publicly available: https://doi.org/10.5281/zenodo.5543392 (Hieronymus et al., 2021).
The supplement related to this article is available online at: https://doi.org/10.5194/bg-18-6213-2021-supplement.
KE developed the RCO–SCOBI-CLC code and designed the experiments with the help of IH. KE also performed the model runs. MO provided the observational data on cyanobacterial biomass and calculated the estimates of nitrogen fixation based on previous in situ measurements. HEMM and EAR contributed to the design of the research. JH made the analysis and prepared the manuscript with input from all co-authors.
The contact author has declared that neither they nor their co-authors have any competing interests.
Publisher’s note: Copernicus Publications remains neutral with regard to jurisdictional claims in published maps and institutional affiliations.
The research presented in this study is part of the Baltic Earth program (Earth System Science for the Baltic Sea region; see http://www.baltic.earth, last access: August 2021) and was funded by the Swedish Research Council for Environment, Agricultural Sciences and Spatial Planning (FORMAS) within the project “Cyanobacteria life cycles and nitrogen fixation in historical reconstructions and future climate scenarios (1850–2100) of the Baltic Sea” (grant no. 214-2013-1449). Funding was also provided by the Swedish Research Council (VR) within the project “Reconstruction and projecting Baltic Sea climate variability 1850–2100” (grant no. 2012-2117). The authors thank Ya-Wei Luo and the two anonymous reviewers as well as the associate editor Yuan Shen for comments and suggestions that greatly improved the paper.
This research has been supported by the Svenska Forskningsrådet Formas (grant no. 214-2013-1449) and the Vetenskapsrådet (grant no. 2012-2117).
This paper was edited by Yuan Shen and reviewed by Ya-Wei Luo and two anonymous referees.
Almroth-Rosell, E., Eilola, K., Hordoir, R., Meier, H. E. M., and Hall, P. O. J.: Transport of fresh and resuspended particulate organic material in the Baltic Sea – a model study, J. Marine Syst., 87, 1–12, https://doi.org/10.1016/j.jmarsys.2011.02.005, 2011.
Almroth-Rosell, E., Eilola, K., Kuznetsov, I., Hall, P. O., and Meier, H. E. M.: A new approach to model oxygen dependent benthic phosphate fluxes in the Baltic Sea, J. Marine Syst., 144, 127–141, https://doi.org/10.1016/j.jmarsys.2014.11.007, 2015.
Beckmann, A. and Döscher, R.: A method for improved representation of dense water spreading over topography in geopotential-coordinate models, J. Phys. Oceanogr., 27, 581–591, https://doi.org/10.1175/1520-0485(1997)027<0581:AMFIRO>2.0.CO;2, 1997.
Conley, D. J., Björck, S., Bonsdorff, E., Carstensten, J., Destouni, G., Gustavsson, B. G., Hietanen, S., Kortekaas, M., Kuosa, H., Meier, H. E. M., Müller-Karluis, B., Nordbeerg, K., Norkko, A., Nürnberg, G., Pitkänen, H., Rabalais, N. N., Rosenberg, R., Savchuk, O. P., Slomp, C. P., Voss, M., Wulff, F., and Zillén, L.: Hypoxia-related processes in the Baltic Sea, Environ. Sci. Technol., 43, 3412–3420, https://doi.org/10.1021/es802762a, 2009.
Degerholm, J., Gundersen, K., Bergman, B., and Söderbäck, E.: Phosphorus-limited growth dynamics in two Baltic Sea cyanobacteria, Nodularia sp. and Aphanizomenon sp., FEMS Microb. Ecol., 58, 323–332, https://doi.org/10.1111/j.1574-6941.2006.00180.x, 2006.
Eilola, K., Meier, H. E. M., and Almroth, E.: On the dynamics of oxygen, phosphorus and cyanobacteria in the Baltic Sea; a model study, J. Marine Syst., 75, 163–184, https://doi.org/10.1016/j.jmarsys.2008.08.009, 2009.
Eilola, K., Gustafsson, B., Kuznetsov, I., Meier, H. E. M., Neumann, T., and Savchuk, O.: Evaluation of biogeochemical cycles in an ensemble of three state-of-the-art numerical models of the Baltic Sea, J. Marine Syst., 88, 267–284, https://doi.org/10.1016/j.jmarsys.2011.05.004, 2011.
Eilola, K., Rosell, E. A., Dieterich, C., Fransner, F., Höglund, A., and Meier, H. E. M.: Modeling nutrient transports and exchanges of nutrients between shallow regions and the open baltic sea in present and future climate, Ambio, 416, 586–599, https://doi.org/10.1007/s13280-012-0322-1, 2012.
Eilola, K., Mårtensson, S., and Meier, H. E. M.: Modeling the impact of reduced sea ice cover in future climate on the Baltic Sea biogeochemistry, Geophys. Res. Lett., 40, 149–154, https://doi.org/10.1029/2012GL054375, 2013.
Eilola, K., Almroth-Rosell, E., and Meier, H. E. M.: Impact of saltwater inflows on phosphorus cycling and eutrophication in the Baltic Sea: a 3D model study, Tellus A, 66, 23985, https://doi.org/10.3402/tellusa.v66.23985, 2014.
Farnelid, H., Bentzon-Tilia, M., Andersson, A.F., Bertilsson, S., Jost, G., Labrenz, M., Jürgens, K., and Riemann, L.: Active nitrogen-fixation heterotrophic bacteria at and below the chemocline of the central Baltic Sea, 7, 1413–1423, https://doi.org/10.1038/ismej.2013.26, 2013
Finni, T., Kononen, K., Olsonen, R., and Wallström, K.: The History of Cyanobacterial Blooms in the Baltic Sea, Ambio, 30, 172–178, https://doi.org/10.1579/0044-7447-30.4.172, 2001.
Fransner, F., Gustafsson, E., Tedesco, L., Vichi, M., Hordoir, R., Roquet, F., Spilling, K., Kuznetsov, I., Eilola, K., Mörth, C.-M., Humborg, C., Nycander, J.: Non-Redfieldian Dynamics Explain Seasonal pCO2 Drawdown in the Gulf of Bothnia, J. Geophys. Res.-Oceans, 123, 166–188, https://doi.org/10.1002/2017JC013019, 2018.
Gerdes, R., Köberle, C., and Willebrand, J.: The influence of numerical advection schemes on the results of ocean general circulation models, Clim. Dynam., 5, 211–226, https://doi.org/10.1007/BF00210006, 1991.
Gustafsson, B. G., Schenk, F., Blenckner, T., Eilola, K., Meier, H. E. M., Müller-Karulis, B., Neumann, T., Ruoho-Airola, T., Savchuk, O. P., and Zorita, E.: Reconstructing the development of baltic sea eutrophication 1850–2006, Ambio, 41, 534–548, https://doi.org/10.1007/s13280-012-0318-x, 2012.
Gustafsson, Ö., Gelting, J., Andersson, P. S., Larsson, U., and Roos, P.: An assessment of upper ocean carbon and nitrogen export flux on the boreal continental shelf: A 3-year study in the open Baltic Sea comparing sediment traps, 234Th proxy, nutrient, and oxygen budgets, Limnol. Oceanogr. Meth., 11, 495–510, https://doi.org/10.4319/lom.2013.11.495, 2013.
HELCOM: HELCOM Baltic Sea Action Plan. HELCOM Ministerial Meeting, available at: https://www.helcom.fi/wp-content/uploads/2019/08/BSAP_Final.pdf (last access: May 2021), 2007.
HELCOM: Inputs of nutrients to the subbasins, HELCOM core indicator report, available at: http://www.helcom.fi/baltic-sea-action-plan/nutrient-reduction-scheme/progress-towards-maximumallowable-inputs/, last access: January 2018.
Hense, I. and Beckmann, A.: Towards a model of cyanobacteria life cycle – effects of growing and resting stages on bloom formation of N2-fixing species, Ecol. Model., 195, 205–218, https://doi.org/10.1016/j.ecolmodel.2005.11.018, 2006.
Hense, I. and Beckmann, A.: The representation of cyanobacteria life cycle processes in aquatic ecosystem models, Ecol. Model., 221, 2330–2338, https://doi.org/10.1016/j.ecolmodel.2010.06.014, 2010.
Hense, I. and Burchard, H.: Modelling cyanobacteria in shallow coastal seas, Ecol. Model., 221, 238–244, https://doi.org/10.1016/j.ecolmodel.2009.09.006, 2010.
Hense, I., Meier, H. E. M., and Sonntag, S.: Projected climate change impact on Baltic Sea cyanobacteria: Climate change impact on cyanobacteria, Climatic Change, 119, 391–406, https://doi.org/10.1007/s10584-013-0702-y, 2013.
Hibler, W. D.: A Dynamic Thermodynamic Sea Ice Model, J. Phys. Oceanogr., 9, 815–846, https://doi.org/10.1175/1520-0485(1979)009<0815:ADTSIM>2.0.CO;2, 1979.
Hieronymus, J., Eilola, K., Hieronymus, M., Meier, H. E. M., Saraiva, S., and Karlson, B.: Causes of simulated long-term changes in phytoplankton biomass in the Baltic proper: a wavelet analysis, Biogeosciences, 15, 5113–5129, https://doi.org/10.5194/bg-15-5113-2018, 2018.
Hieronymus, J., Eilola, K., Olofsson, M., Hense, I., Meier, H. E. M., and Almroth-Rosell, E.: Modeling cyanobacteria life cycle dynamics and historical nitrogen fixation in the Baltic Sea – Datasets, Zenodo [data set], https://doi.org/10.5281/zenodo.5543392, 2021.
Hunke, E. C. and Dukowicz, J. K.: An Elastic–Viscous–Plastic Model for Sea Ice Dynamics, J. Phys. Oceanogr., 27, 1849–1867, https://doi.org/10.1175/1520-0485(1997)027<1849:AEVPMF>2.0.CO;2, 1997.
Kahru, M. and Elmgren, R.: Multidecadal time series of satellite-detected accumulations of cyanobacteria in the Baltic Sea, Biogeosciences, 11, 3619–3633, https://doi.org/10.5194/bg-11-3619-2014, 2014.
Kahru, M., Elmgren, R., and Savchuk, O. P.: Changing seasonality of the Baltic Sea, Biogeosciences, 13, 1009–1018, https://doi.org/10.5194/bg-13-1009-2016, 2016.
Killworth, P. D., Webb, D. J., Stainforth, D., and Paterson, S. M.: The Development of a Free-Surface Bryan–Cox–Semtner Ocean Model, J. Phys. Oceanogr., 21, 1333–1348, https://doi.org/10.1175/1520-0485(1991)021<1333:TDOAFS>2.0.CO;2, 1991.
Klawonn, I., Nahar, N., Walve, J., Andersson, B., Olofsson, M., Svedén, J. B., Littmann, S., Whitehouse, M. J., Kuypers, M. M. M., and Ploug, H.: Cell-specific nitrogen- and carbon-fixation of cyanobacteria in a temperate marine system (Baltic Sea), Environ. Microbiol., 18, 4596–4609, https://doi.org/10.1111/1462-2920.13557, 2016.
Kwiatkowski, L., Aumont, O., Bopp, L., and Ciais, P.: The impact of variable phytoplankton stoichiometry on projections of primary production, food quality, and carbon uptake in the global ocean, Global Biogeochem. Cy., 32, 516–528, https://doi.org/10.1002/2017GB005799, 2018.
Lass, H. U., Prandke, H., and Liljebladh, B.: Dissipation in the baltic proper during winter stratification, J. Geophys. Res.-Oceans, 108, 3187, https://doi.org/10.1029/2002JC001401, 2003.
Lehtimäki, J., Moisander, P., Sivonen, K., and Kononen, K.: Growth, nitrogen fixation, and nodularin production by two baltic sea cyanobacteria, Appl. Environ. Microb., 63, 1647–1656, https://doi.org/10.1128/aem.63.5.1647-1656.1997, 1997.
Leppäranta, M. and Myrberg, K.: Physical Oceanography of the Baltic Sea, Springer, Berlin, Heidelberg, 2009.
Marmefelt, E., Arheimer, B., and Langner, J.: An integrated biogeochemical model system for the Baltic Sea. Hydrobiologia, 393, 45–56, https://doi.org/10.1023/A:1003541816177, 1999.
Meier, H. E. M.: On the parameterization of mixing in three-dimensional Baltic Sea models, J. Geophys. Res.-Oceans, 106, 30997–31016, https://doi.org/10.1029/2000JC000631, 2001.
Meier, H. E. M.: Modeling the pathways and ages of inflowing salt- and freshwater in the Baltic Sea, Estuar. Coast. Shelf S., 7, 610–627, https://doi.org/10.1016/j.ecss.2007.05.019, 2007.
Meier, H. E. M., Döscher, R., and Faxén, T.: A multiprocessor coupled ice-ocean model for the Baltic Sea: application to the salt inflow, J. Geophys. Res., 108, 3273, https://doi.org/10.1029/2000JC000521, 2003.
Meier, H. E. M., Andersson, H. C., Arheimer, B., Blenckner, T., Chubarenko, B., Donnelly, C., Eilola, K., Gustafsson, B. G., Hansson, A., Havenhand, J., Höglund, A., Kuznetsov, I., MacKenzie, B. R., Müller-Karulis, B., Neumann, T., Niiranen, S., Piwowarczyk, J., Raudsepp, U., Reckermann, M., Ruoho-Airola, T., Savchuk, O. P., Schenk, F., Schimanke, S., Väli, G., Weslawski, J.-M., and Zorita, E.: Comparing reconstructed past variations and future projections of the Baltic Sea ecosystem—first results from multi-model ensemble simulations, Environ. Res. Lett., 7, 034005, https://doi.org/10.1088/1748-9326/7/3/034005, 2012.
Meier, H. E. M., Eilola, K., Almroth-Rosell, E., Schimanke, S., Kniebusch, M., Höglund, A., Pemberton, P., Liu, Y., Väli, G., and Saraiva, S.: Disentangling the impact of nutrient load and climate changes on Baltic Sea hypoxia and eutrophication since 1850, Clim. Dynam., https://doi.org/10.1007/s00382-018-4296-y, 2018.
Meier, H. E. M., Eilola, K., Almroth-Rosell, E., Schimanke, S., Kniebusch, M., Höglund, A., Pemberton, P., Liu, Y., Väli, G., and Saraiva, S.: Disentangling the impact of nutrient load and climate changes on Baltic Sea hypoxia and eutrophication since 1850, Clim. Dynam., 53, 1145–1166, https://doi.org/10.1007/s00382-018-4296-y, 2019.
Menden-Deuer, S. and Lessard, E. J.: Carbon to volume relationship for dinoflagellates, diatoms and other protest plankton, Limnol. Oceanogr., 45, 569–579, 2000.
Moisander, P. H., Paerl, H. W., Dyble, J., and Sivonen, K.: Phosphorus limitation and diel control of nitrogen-fixing cyanobacteria in the Baltic Sea, Mar. Ecol.-Prog. Ser., 345, 41–50, https://doi.org/10.3354/meps06964, 2007.
Moore, C. M., Mills, M. M., Arrigo, K. R., Berman-Frank, I., Bopp, L., Boyd, P. W., Galbraith, E. D., Geider, R. J., Guieu, C., Jaccard, S. L., Jickells, T. D., La Roche, J., Lenton, T. M., Mahowald, N. M., Marann, E., Marinov, I., Moore, J. K., Nakatsuka, T., Oschlies, A., Saito, M. A., Thingstad, T. F., Tsuda, A., and Ulloa, O.: Processes and patterns of oceanic nutrient limitation, Nat. Geosci., 6, 701–710, 2013.
Munkes, B., Löptien, U., and Dietze, H.: Cyanobacteria blooms in the Baltic Sea: a review of models and facts, Biogeosciences, 18, 2347–2378, https://doi.org/10.5194/bg-18-2347-2021, 2021.
Nausch, M., Nausch, G., Mohrholz, V., Siegel, H., and Wasmund, N.: Is growth of filamentous cyanobacteria supported by phosphate uptake below the thermocline?, Estuar. Coast. Shelf S., 99, 50–60, https://doi.org/10.1016/j.ecss.2011.12.011, 2012.
Nausch, M., Achterberg, E. P., Bach, L. T., Brussaard, C. P. D., Crawfurd, K. J., Fabian, J., Riebsell, U., Stuhr, A., Unger, J., and Wannicke, N.: Concentrations and uptake of dissolved organic phosphorus compounds in the Baltic Sea, Front. Mar. Sci., 5, 386, https://doi.org/10.3389/fmars.2018.00386, 2018.
Olenina, I., Hajdu, S., Edler, L., Andersson, A., Wasmund, N., Busch, S., Göbel, J., Gromisz, S., Huseby, S., Huttunen, M., Jaanus, A., Kokkonen, P., Ledaine, I., and Niemkiewicz, E.: Biovolumes and size-classes of phytoplankton in the Baltic Sea, HELCOM Baltic Sea Environmental Proceedings, No. 106, 144 pp., 2006.
Olofsson, M., Egardt, J., Singh, A., and Ploug, H.: Inorganic phosphorus enrichments in Baltic Sea water have large effects on growth, carbon fixation, and N2 fixation by Nodularia spumigena, Aquat. Microb. Ecol., 77, 111–123, https://doi.org/10.3354/ame01795, 2016.
Olofsson, M., Suikkanen, S., Kobos, J., Wasmund, N., and Karlson, B.: Basin-specific changes in filamentous cyanobacteria community composition across four decades in the Baltic Sea, Harm. Alg., 91, 101685, https://doi.org/10.1016/j.hal.2019.101685, 2020.
Olofsson, M., Klawonn, I., and Karlson, B.: Nitrogen fixation estimates for the Baltic Sea indicate high rates for the previously overlooked Bothnian Sea, AMBIO, 50, 203–214, https://doi.org/10.1007/s13280-020-01331-x, 2021.
Orlanski, I.: A simple boundary condition for unbounded hyperbolic flows, J. Comp. Phys., https://doi.org/10.1016/0021-9991(76)90023-1, 1976.
Paerl, H. W. and Huisman, J.: Blooms like it hot, Science, 320, 57–58, https://doi.org/10.1126/science.1155398, 2008.
Ploug, H., Musat, N., Adam, B., Moraru, C. L., Lavik, G., Vagner, T., Bergman, B., and Kuypers, M. M. M.: Carbon and nitrogen fluxes associated with the cyanobacterium Aphanizomenon sp. in the Baltic Sea, ISME J, 4, 1215–1223, https://doi.org/10.1038/ismej.2010.53, 2010.
Ploug, H., Adam, B., Musat, N., Kalvelage, T., Lavik, G., Wolf-Gladrow, D., and Kuypers, M. M. M.: Carbon, nitrogen and O2 fluxes associated with the cyanobacterium Nodularia spumigena in the Baltic Sea, ISME J., 5, 1549–1558, https://doi.org/10.1038/ismej.2011.20, 2011.
Rakko, A. and Seppälä, J.: Effect of salinity on the growth rate and nutrient stoichiometry of two Baltic Sea filamentous cyanobacterial species, Estonian Journal of Ecology, 63, 55–70, https://doi.org/10.3176/eco.2014.2.01, 2014.
Reusch, T. B. H., Dierking, J., Andersson, H. C., Bonsdorff, E. Carstensen, J., Casini M., Czajkowski, M, Hasler, B., Hinsby, K., Hyytiäinen, K., Johannesson, K., Jomaa, S., Jormalainen, V., Kuosa, H., Kurland, S., Laikre, L., MacKenzie, B. R., Margonski, P., Melzner, F., Oesterwind, D., Ojaveer, H., Refsgaard, J. C., Sandström, A., Schwarz, G., Tonderski, K., Winder, M., and Zandersen, M.: The Baltic Sea as a time machine for the future coastal ocean, Sci. Adv., 4, eaar8195, https://doi.org/10.1126/sciadv.aar8195, 2018.
Rolff, C., Almesjö, L., and Elmgren, R.: Nitrogen fixation and abundance of the diazotrophic cyanobacterium Aphanizomenon sp. in the Baltic Proper, Mar. Ecol.-Prog. Ser., 332, 107–118, https://doi.org/10.3354/meps332107, 2007.
Saraiva, S., Meier, H. E. M., Andersson, H., Höglund, A., Dieterich, C., Gröger, M., Hordoir, R., and Eilola, K.: Baltic Sea ecosystem response to various nutrient load scenarios in present and future climates, Clim. Dynam., 52, 3369–3387, https://doi.org/10.1007/s00382-018-4330-0, 2018.
Schneider, B., Kaitala, S., Raateoja, M., and Sadkowiak, B.: Nitrogen fixation estimate for the Baltic Sea based on continuous pCO2 measurements on a cargo ship and total nitrogen data, Cont. Shelf Res., 29, 1535–1540, https://doi.org/10.1016/j.csr.2009.04.001, 2009.
Schneider, B., Eilola, K., Lukkari, K., Muller-Karulis, B., and Neumann, T.: Environmental Impacts—Marine Biogeochemistry, in: Second Assessment of Climate Change for the Baltic Sea Basin, edited by: The BACC II Author Team, Regional Climate Studies, Springer, Cham., https://doi.org/10.1007/978-3-319-16006-1_18, 2015.
Schoffelen, N. J., Mohr, W., Ferdelman, T. G., Littmann, S., Duerschlag, J., Zubkov, M. V., Ploug, H., and Kuypers, M. M. M.: Single-cell imaging of phosphorus uptake shows that key harmful algae rely on different phosphorus sources for growth, Sci. Rep.-UK, 8, 1–13, https://doi.org/10.1038/s41598-018-35310-w, 2018.
Sommer, U., Aberle, N., Langfellner, K., and Lewandowska, A.: The Baltic Sea spring phytoplankton bloom in a changing climate: an experimental approach, Mar. Biol., 159, 2479–2490, https://doi.org/10.1007/s00227-012-1897-6, 2012.
Steffen, W., Richardson, K., Rockström, J., Cornell, S. E., Fetzer, I., Bennett, E. M., Biggs, R., Carpenter, S. R., de Vries, W., de Wit, C., fole, C., Gerten, D., Heinkee, J., Mace, G. M., Persson, L. M., Ramanathan, V., Reyers, B., and Sörlin, S.: Planetary boundaries: Guiding human development on a changing planet, Science, 347, 1259855, https://doi.org/10.1126/science.1259855, 2015.
Stevens, D. P.: On open boundary conditions for three dimensional primitive equation ocean circulation models, Geophys. Astro. Fluid, 51, 103–133, https://doi.org/10.1080/03091929008219853, 1990.
Suikkanen, S., Kaartokallio, H., Hällfors, S., Huttunen, M., and Laamanen, M.: Life cycle strategies of bloom-forming, filamentous cyanobacteria in the Baltic Sea, Deep-Sea Res. Pt. II, 57, 199–209, https://doi.org/10.1016/j.dsr2.2009.09.014, 2010.
Svedén, J. B., Adam, B., Walve, J., Nahar, N., Musat, N., Lavik, G., Whitehouse, M. J., Kuypers, M. M. M., and Ploug, H.: High cell-specific rates of nitrogen and carbon fixation by the cyanobacterium sp. at low temperatures in the Baltic Sea, FEMS Microb. Ecol., 91, fiv131, https://doi.org/10.1093/femsec/fiv131, 2015.
Svedén, J. B., Walve, J., Larsson, U., and Elmgren, R.: The bloom of nitrogen-fixing cyanobacteria in the northern Baltic Proper stimulates summer production, J. Marine Syst., 163, 102–112, https://doi.org/10.1016/j.jmarsys.2016.07.003, 2016.
Teikari, J. E., Popin, R. V., Hou, S., Wahlsten, M., Hess, E. R., and Sivonen, K.: Insight into the genome and brackish water adaptation strategies of toxic and bloom-forming Baltic Sea Dolichospermum sp. UHCC 0315, Sci. Rep.-UK, 9, 4888, https://doi.org/10.1038/s41598-019-40883-1, 2019.
Wannicke, N., Koch, B. P., and Voss, M.: Release of fixed N2 and C as dissolved compounds by Trichodemsium erythreum and Nodularia spumigena under the influence of high light and high nutrient (P), Aquat. Microb. Ecol., 57, 175–189, https://doi.org/10.3354/ame01343, 2009.
Wannicke, N., Frey, C., Law, C. S., and Voss, M.: The response of the marine nitrogen cycle to ocean acidification, Glob. Change Biol., 24, 5031–5043, https://doi.org/10.1111/gcb.14424, 2018.
Wasmund, N.: Recruitment of bloom-forming cyanobacteria from winter/spring populations in the Baltic Sea verified by a mesocosm approach, Boreal Environ. Res., 22, 445–455, 2017.
Wasmund, N., Voss, M., and Lochte, K.: Evidence of nitrogen fixation by non-heterocystous cyanobacteria in the Baltic Sea and re-calculation of a budget of nitrogen fixation, Mar. Ecol.-Prog. Ser., 214, 1–14, https://doi.org/10.3354/meps214001, 2001.
Wasmund, N., Nausch, G., Schneider, B., Nagel, K., and Voss, M.: Comparison of nitrogen fixation rates determined with different methods: A study in the Baltic proper, Mar. Ecol.-Prog. Ser., 297, 23–31, https://doi.org/10.3354/meps297023, 2005.
Wulff, A., Karlberg, M., Olofsson, M., Torstensson, A., Riemann, L., Steinhoff, S. F., Mohlin, M., Ekstrand, N., and Chierici, M.: Ocean acidification and desalination: climate-driven change in a Baltic Sea summer microplanktonic community, Mar. Biol., 165, 63, https://doi.org/10.1007/s00227-018-3321-3, 2018.