the Creative Commons Attribution 4.0 License.
the Creative Commons Attribution 4.0 License.
 | 14 Dec 2021
Long-distance particle transport to the central Ionian Sea
Léo Berline
Andrea Michelangelo Doglioli
Anne Petrenko
Stéphanie Barrillon
Boris Espinasse
Frederic A. C. Le Moigne
François Simon-Bot
Melilotus Thyssen
François Carlotti
Together with T–S properties, particle abundance in situ measurements are useful to discriminate water masses and derive circulation patterns. In the upper layers of the Ionian Sea, the fresher Atlantic Waters (AW) recently crossing the Sicily Channel meet the resident and saltier AW, which circulated cyclonically in the eastern basin and modified after evaporation and eventually cooling. In May 2017, during the PEACETIME cruise, fluorescence and particle abundance sampled at high resolution revealed unexpected heterogeneity in the central Ionian Sea. Surface salinity measurements, together with altimetry-derived and hull-mounted acoustic Doppler current profiler (ADCP) currents, describe a zonal pathway of AW entering the Ionian Sea, consistent with the so-called cyclonic mode in the North Ionian Gyre. The ION-Tr transect, located between 19–20∘ E at approximately 36∘ N, turned out to be at the crossroads of three water masses, mostly coming from the west, north and an isolated anticyclonic eddy northeast of ION-Tr. Using Lagrangian numerical simulations, we suggest that the contrast in particle loads along ION-Tr originates from particles transported from these three different water masses. Waters from the west, identified as AW carried by a strong southwestward jet, were moderate in particle load, probably originating from the Sicily Channel. The water mass from the north, carrying abundant particles, probably originated in the northern Ionian Sea, or further away from the south Adriatic Sea. Waters from the eddy, depleted in particles and chl a, may originate from south of the Peloponnese, where the Pelops eddy forms.
The central Ionian Sea hence appears as a mosaic area, where waters of contrasted biological history meet. This contrast is particularly clear in spring, when blooming and non-blooming areas co-occur. Interpreting the complex dynamics of physical–biogeochemical coupling from discrete measurements made at isolated stations at sea is a challenge. The combination of multiparametric in situ measurements at high resolution with remote sensing and Lagrangian modeling appears as one adequate way to address this challenge.
- Article
(3874 KB) - Full-text XML
-
Supplement
(112 KB) - BibTeX
- EndNote


The study of particle abundance, size structure, and dynamics is a key to understand the marine ecosystem, from primary and secondary production to export and remineralization all the way through food-web dynamics (McDonnell et al., 2015; Giering et al., 2020). In the semi-enclosed Mediterranean Sea, the main particle sources are the biological production in the open ocean and over continental shelves, river discharge, atmospheric deposition, and sediment resuspension. From west to east and north to south, the Mediterranean Sea harbors areas of very distinct productivity, going from eutrophic (e.g., in the Alboran Sea) to ultra-oligotrophic (e.g., in the Levantine basin; Moutin et al., 2017). This heterogeneity is further enhanced by the complex general and mesoscale circulation that favors exchanges between these contrasted areas, leading to a fine-scale spatial heterogeneity in the distribution of biogeochemical properties and particles (Karageorgis et al., 2008; Durrieu de Madron et al., 1992; Rousselet et al., 2019).
Located in the center of the Mediterranean Sea, the Ionian Sea is a crossroad where three different surface water masses meet: (i) recent Atlantic water (AW) flowing from the Sicily Channel, (ii) older AW flowing from the east after its cyclonic circulation in the Levantine basin and (iii) fresher (Po-influenced) water coming from the Adriatic Sea (Malanotte-Rizzoli et al., 1997). Circulation in the north Ionian Sea is strongly variable, as is the path of AW. The most stable branch of the Atlantic Ionian Stream entering the Ionian Sea follows a rather direct pathway to the southeast, connecting the Sicily Channel with the Cretan Passage (Mid-Ionian Jet, MIJ; Menna et al., 2019). South of the MIJ, the circulation pattern is stable and anticyclonic, known also as the Syrte Gyre (Pinardi et al., 2015). North of the MIJ, two alternate circulation states have been proposed, the anticyclonic and cyclonic mode of the so-called North Ionian Gyre (NIG, Gačić et al., 2010). In addition, semi-permanent mesoscale gyres are observed in the western part (Maltese Channel Crest, Medina Gyre, Messina Rise Vortex) as well as in the eastern part (Pelops gyre), some of them triggered by wind. Although the AW circulation has been documented according to seasons and NIG modes (Malanotte-Rizzoli et al., 1997; Gačić et al., 2011; Menna et al., 2019), the fine-scale pathways of AW crossing the Ionian Sea have only seldom been sampled. The mode of the NIG has a strong influence on the dispersal of water masses and properties in the Ionian basin, also impacting its productivity (Lavigne et al., 2018).
The Ionian Sea is generally considered oligotrophic (Boldrin et al., 2002), with a north–south gradient of chl a (D'Ortenzio and Ribera d'Alcala, 2009). However, it is not homogeneous, as distinct phytoplankton communities associated with the main water masses have been described (Casotti et al., 2003). Three main phytoplankton communities were associated with water coming from the Adriatic Sea in the northwest, water from the eastern Mediterranean in the northeast and AW from the Sicily Channel to the south. The zooplankton community was also contrasted between the northwestern and eastern Ionian Sea (Mazzocchi et al., 2003).
Particle distribution patterns in the Ionian Sea have been seldom described. The particle concentration in the water column can be measured with several instruments. Discrete sampling is carried out using bottles or pumps followed by filtration, allowing bulk mass measurements (McDonnell et al., 2015). Continuous sampling can be carried out using optical measurements that give either bulk measurements (transmissometer, backscatter; Briggs et al., 2013) or size-resolved measurements: laser in situ scattering and transmissometry – LISST (Karageorgis et al., 2012), underwater vision profiler – UVP (Picheral et al., 2010), and laser optical particle counter – LOPC (Herman et al., 2004). For the most common instruments, see Giering et al. (2020) for a comprehensive review. In the Ionian Sea, few data are available on the horizontal distribution of particles. These data have a coarse horizontal resolution and are mostly from transmissometry and water filtration (Rabitti et al., 1994; Boldrin et al., 2002; Karageorgis et al., 2008, 2012) while few data are from optical devices (Karageorgis et al., 2012; Ramondenc et al., 2016). Here we used the LOPC, providing size-resolved abundances over the size range 100–2500 µm. This instrument was mounted on a free-fall MVP fish, allowing high-resolution horizontal and vertical sampling of particles and water mass properties along the ship track.
The objective of this paper is to document particle distribution in the central Ionian Sea, based on a high-resolution multi-parametric transect. In particular we analyze particle distribution with regard to water mass properties and transport, to propose scenarios of histories of these water masses and discuss implications for the functioning of the Ionian Sea ecosystem.
Table 1Sampling in the Ionian Sea (see Fig. 1). Note that ST8 and ST8-Tr are considered to be one single station in the study.
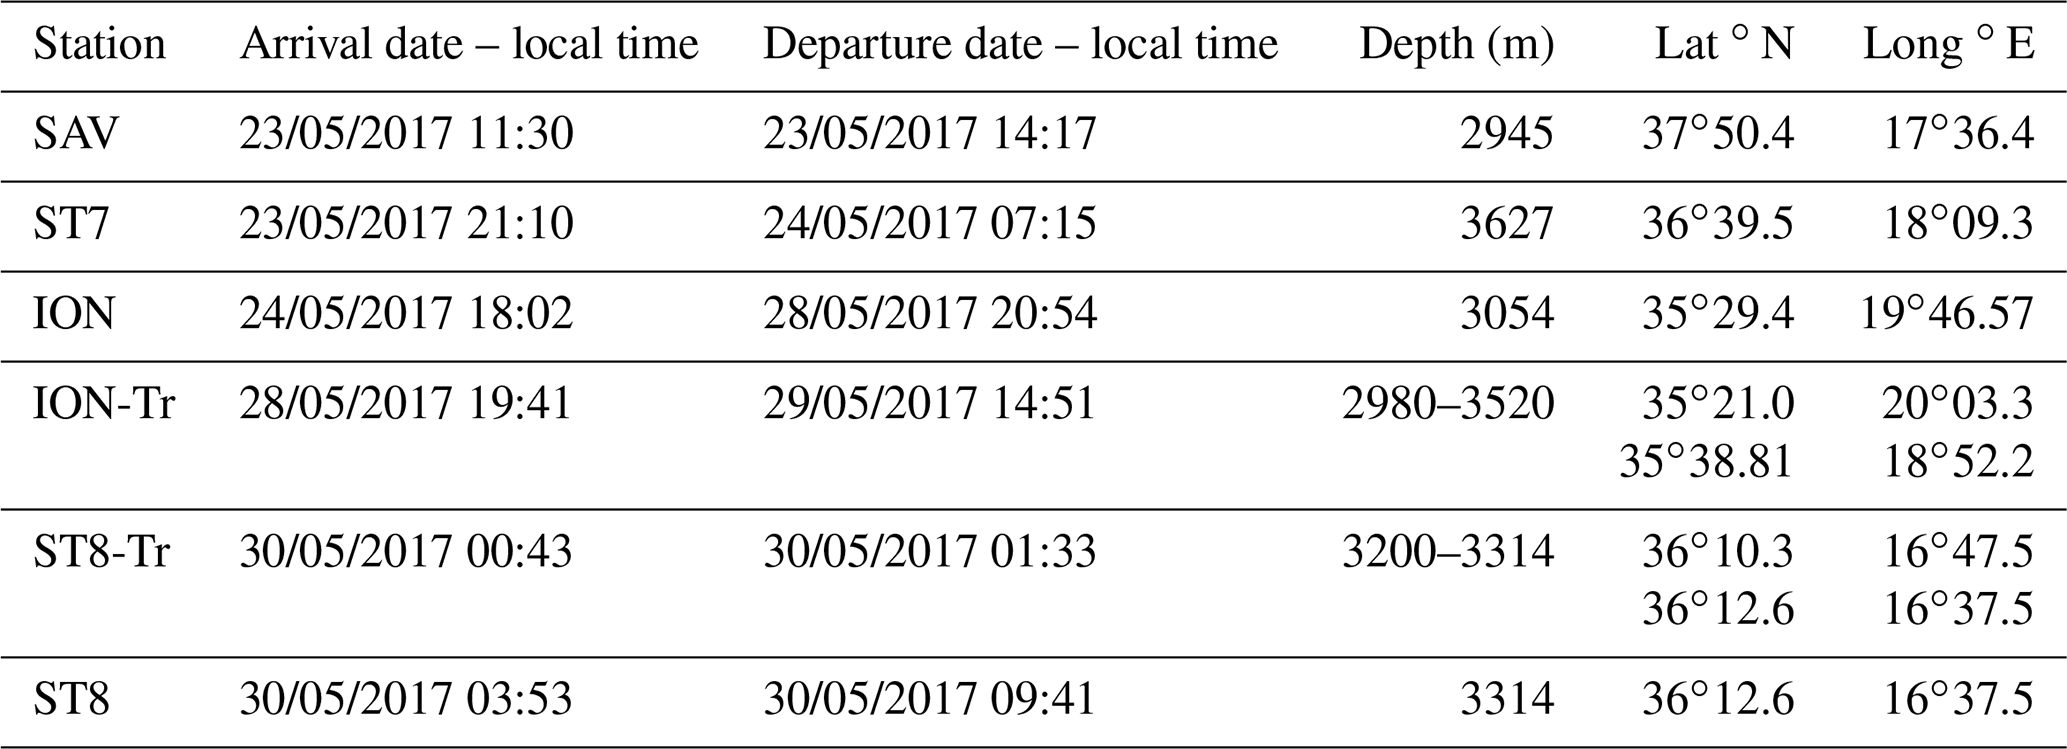
The PEACETIME cruise (http://peacetime-project.org/, last access: 10 September 2021, Guieu et al., 2020a) was conducted during late spring conditions from 10 May to 11 June 2017 on board the R/V Pourquoi Pas?. The overall aim of PEACETIME was to investigate the role of atmospheric dust deposition on biogeochemical fluxes and pelagic ecosystem functioning. Along the 4300 km transect covering the western and eastern Mediterranean basin, 10 short stations (with an average duration of 8 h) and 3 long stations (duration of 4–5 d) were carried out. The ship entered the Ionian Sea on 22 May, and the last station (ST8) in the region was occupied on 30 May as detailed in Table 1. An additional station, the SAV station at a distance from the main track was chosen for a float deployment.
At stations, rosette casts were carried out (0–500 and 0–bottom). The system was equipped with sensors for pressure, temperature, conductivity (Sea-Bird SBE9), dissolved oxygen concentration (SBE43), photosynthetically active radiation (LI-COR Biospherical PAR), light transmission at 650 nm (Sea-Bird C-Star; Karageorgis et al., 2008) and chlorophyll-a fluorescence (Chelsea Acquatracka). Fluorescence was calibrated to report chl a in mg m−3. This instrumental package included 24 12 L Niskin bottles. Water samples collected with the classical rosette were used to quantify oxygen, nutrients, dissolved organic carbon, particulate organic carbon and nitrogen, and pigments using high-performance liquid chromatography (HPLC) (see Guieu et al., 2020a, and Marañón et al., 2021, for details on HPLC).
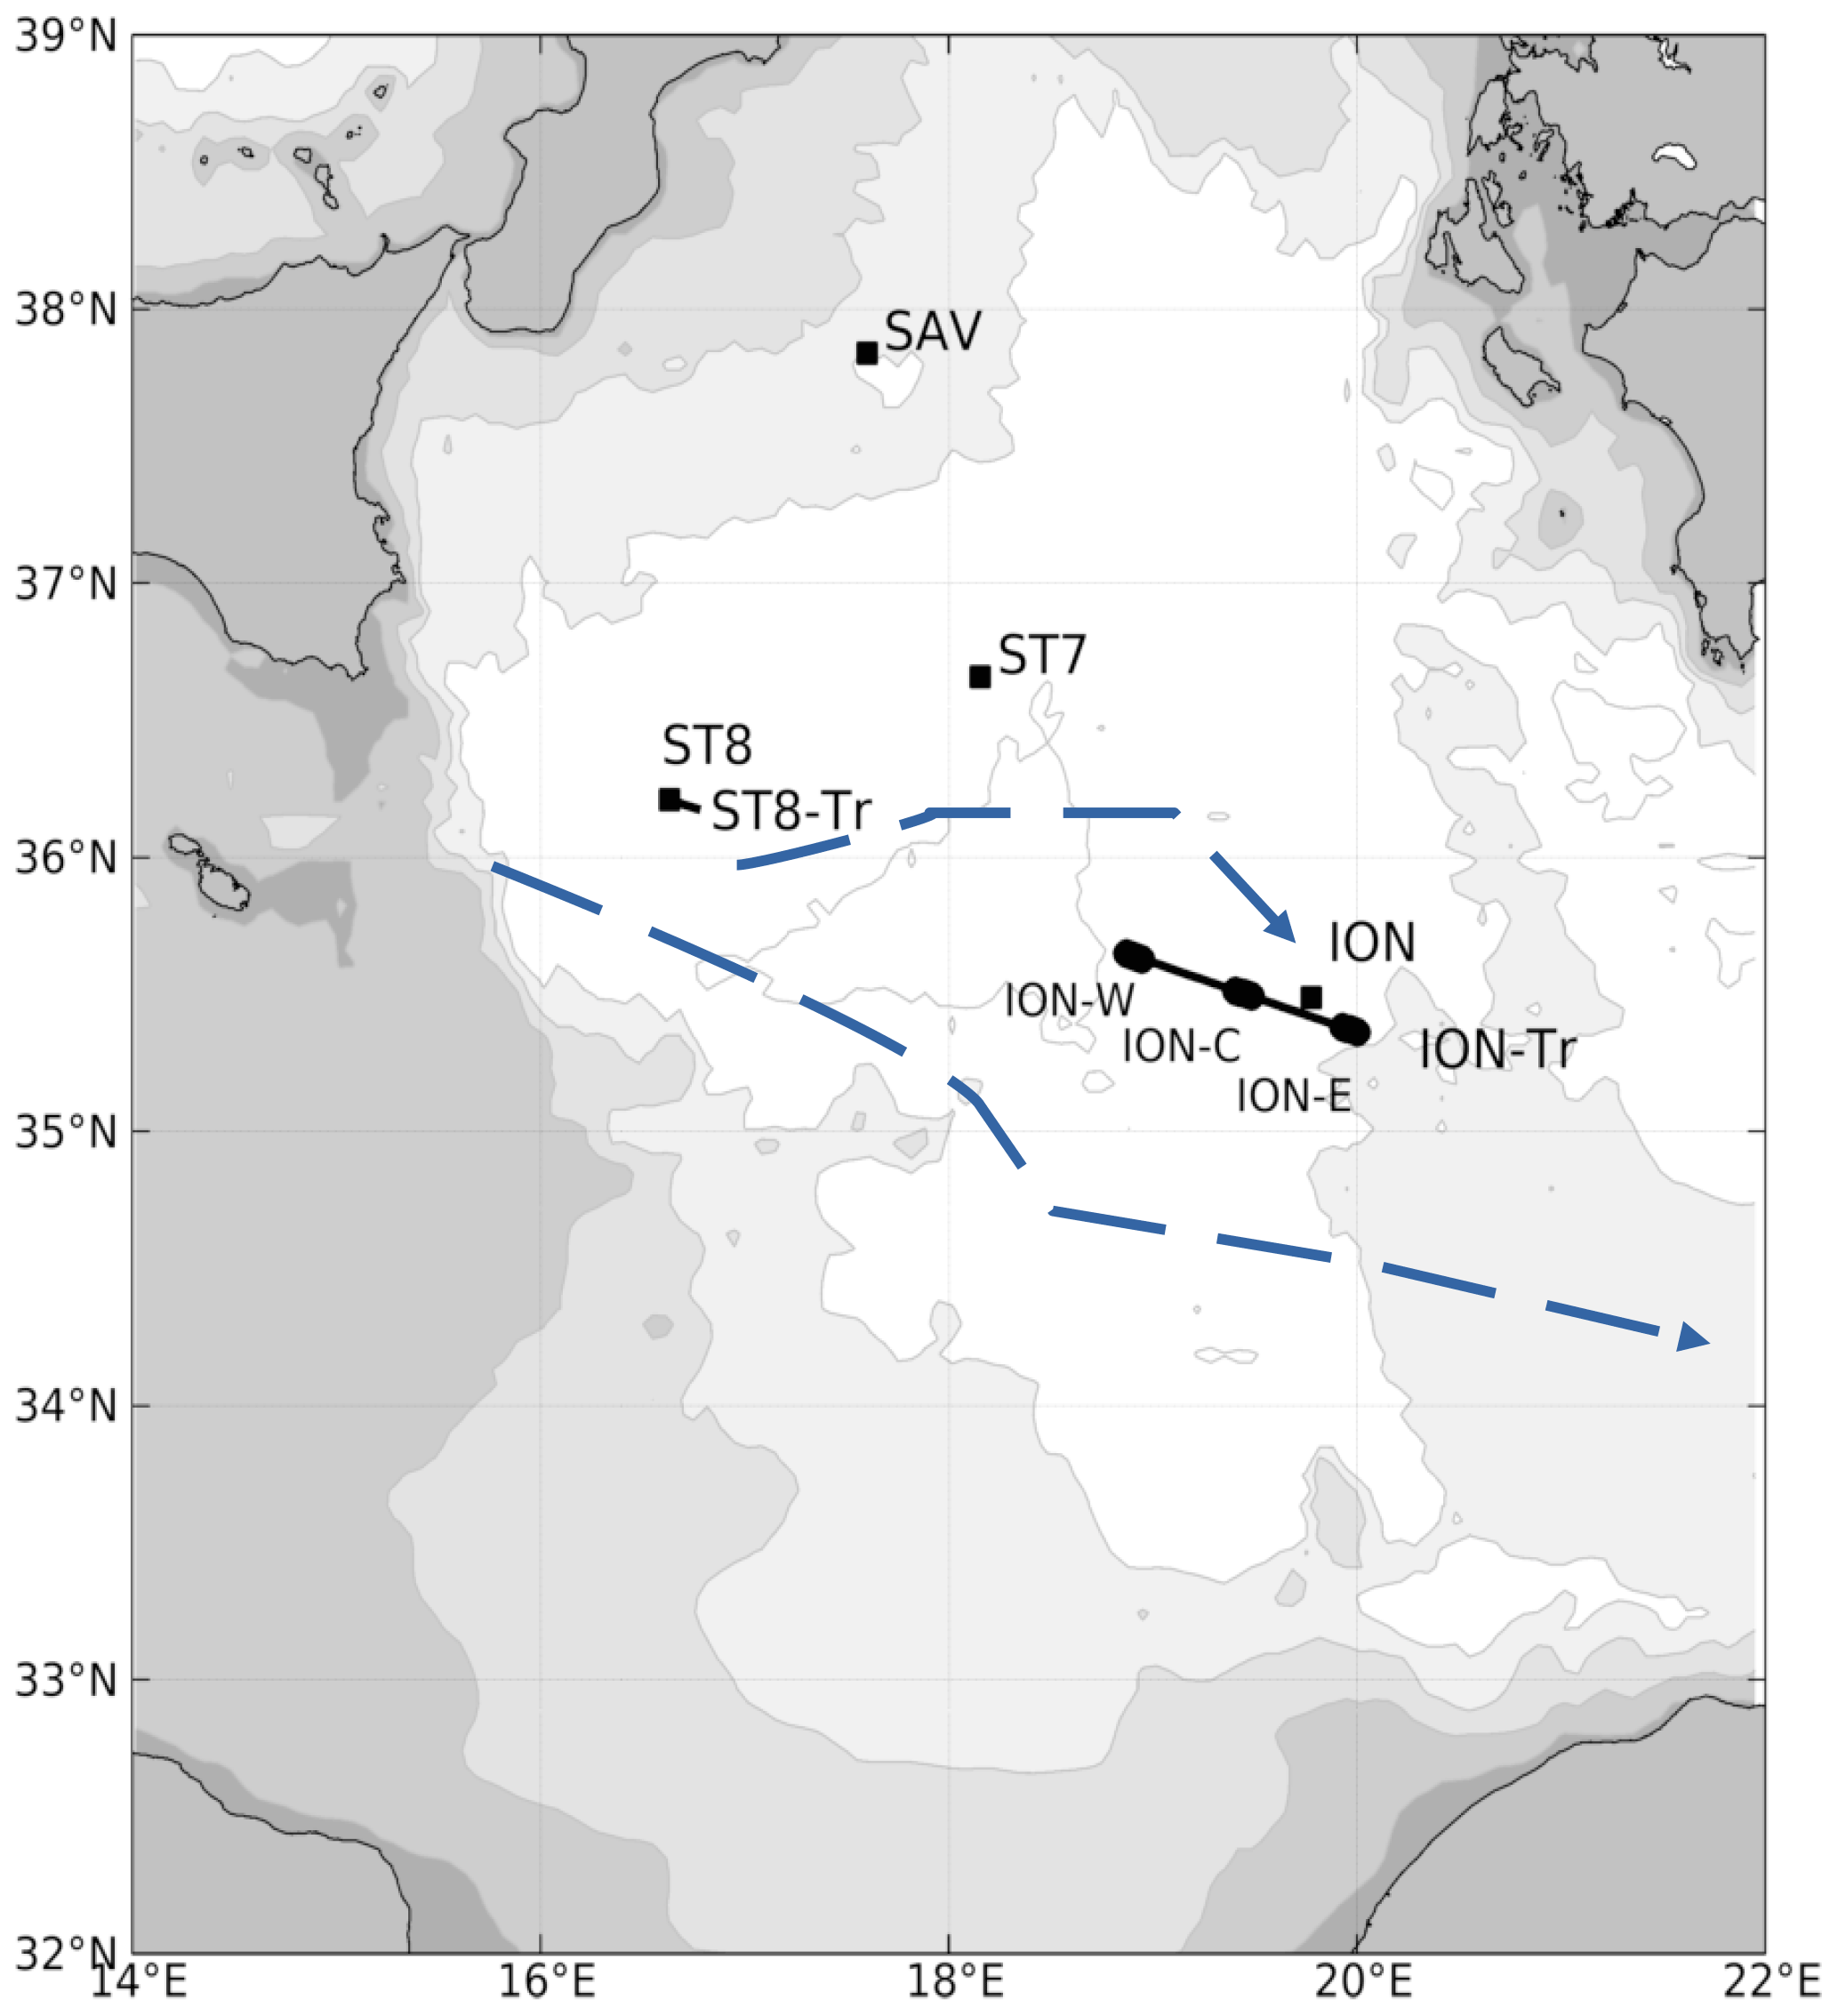
Figure 1Bathymetry of the Ionian Sea (isobaths 100, 1000, 2000, 3000, 4000 m) with the locations of stations (black squares), transects and transect parts (black lines and dots). Schematic circulation (blue lines with arrows) for cyclonic conditions of the North Ionian Gyre redrawn from Menna et al. (2019). The blue dashed line indicates the average AW path.
2.1 High-resolution vertical sampling
Between stations, measurements with a moving vessel profiler (MVP) were carried out. Two transects, ION-Tr and a very short ST8-Tr, were carried out (Fig. 1). MVP200 ODIM Brooke Ocean performed vertical profiles from the surface to ∼ 300 m, at a spatial resolution of ∼ 1 nm, with the nearly vertical free falls of the multi-sensor free-fall fish type I equipped with a AML microCTD, a WetLabs ECO fluorimeter, and a ODIM Brooke Ocean laser optical plankton counter (LOPC). The T and S of the microCTD were calibrated with the rosette conductivity–temperature–depth (CTD). The LOPC recorded particle size and abundance distributions: the instrument records the cross-sectional area of each particle passing through its laser beam (Herman et al., 2004; Herman and Harvey, 2006) for a size range between 100 µm and a few centimeters. If a particle is recorded by at least three diode elements, it will be recorded as a multi-element plankton (MEP), in contrast to single-element plankton (SEP). LOPC also provides information about the MEPs, allowing the computation of an attenuance index (AI), which is essentially a normalized opacity index (an AI of 1 means a fully opaque object), although the MEP shape also has an impact (Espinasse et al., 2018). The living fraction of particles can be estimated, using a calibration based on comparison with plankton net tows (Espinasse et al., 2018), as this fraction is linked to the percent contribution of MEP with respect to the total particle count (% MEP). The sampling volume was estimated using the LOPC sampling tunnel surface multiplied by the depth increment estimated with the pressure sensor. Given the fish free-fall velocity of ∼ 4 m s−1 and the LOPC acquisition frequency (2 Hz), we binned the LOPC data in 5 m vertical bins. As the surface docking depth of the MVP fish was not constant, the first bin (0–7.5 m) was discarded from the analysis. The LOPC abundances were redistributed into log-scale size bins for easier analysis. Total particle abundance (e.g., abundance over the full LOPC size range) and parameters of the size distribution were computed (slope and intercept of the normalized biomass size spectra (NBSS); e.g., Espinasse et al., 2018). We thus have access to vertical profiles of total abundance of particles (particles per cubic meter) at almost each kilometer during the MVP transects.
2.2 Underway measurements
A ThermoSalinoGraph (TSG), equipped with a Sea-Bird SBE21, was connected to a continuous surface water flow-through system that pumped seawater at 2 m depth. Output data were sea surface temperature and salinity every minute all along the cruise route. Horizontal velocity was measured with a hull-mounted ADCP: RDI Ocean Surveyor 150 kHz. Data treatment was carried out using the CASCADE software version 7.1 (Le Bot et al., 2011) and LaTeXtools toolbox (Petrenko et al., 2017; Doglioli et al., 2013, https://people.mio.osupytheas.fr/~doglioli/latextools.htm, last access: 10 September 2021).
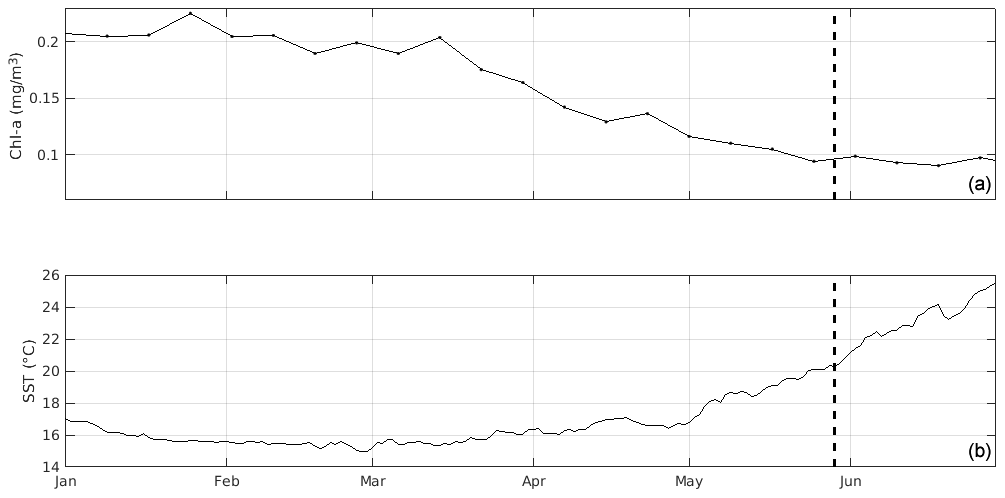
Figure 2Time series of (a) 8 d satellite chl a and (b) daily sea surface temperature (SST) prior to sampling, averaged over the northern Ionian Sea (34 to 40∘ N, 16 to 22∘ E). Sampling at ION-Tr is marked by the dashed vertical line.
2.3 Automated cytometry
The surface phytoplankton community was analyzed using an automated flow cytometer (CytoSense benchtop flow cytometer from CytoBuoy b.v) installed on a dedicated continuous sampling system set up to pump surface water (at 5 m depth). The CytoSense automated flow cytometer was equipped with a 120 mW, 488 nm laser beam. The volume analyzed was controlled by a calibrated peristaltic pump, and each particle passed in front of the laser beam at a speed of 2 m s−1. The particle-resolved size range varied from <1up to 800 µm in width and several hundreds of micrometers in length for chain-forming cells. The trigger to record a signal was based on pigment fluorescence. Stability of the optical unit was controlled before and after the cruise using fluorescing 2 µm Polyscience beads and a set of silica beads of 1.0, 2.0, 3.0, 5.0 and 7.0 µm diameter. Cell sizes were estimated from the forward scatter (FWS signature) of the silica beads and enabled to separate pico-, nano- and microphytoplankton size classes. The instrument allowed for the quantification of pico- and nanophytoplankton populations, up to microphytoplankton when abundant enough in the 5 mL analyzed. Further, seven groups were resolved: one group of picoeukaryotes (mean size 2.81 ± 0.19 µm), three groups of nanoeukaryotes (nanoeukaryotes 1, 2 and 3, mean sizes of 4.76 ± 0.13, 7.16 ± 0.35 and 10.64 ± 2.18 µm, respectively), a Synechococcus-like group (1.04 ± 0.12 µm), a cryptophyte-like group (6.00 ± 0.93 µm) and a coccolithophore-like group (5.37 ± 0.14 µm). Each phytoplankton group was manually clustered using the CytoClus® (http://www.cytobuoy.com/product/software/, last access: 10 November 2020) dedicated software.
2.4 Satellite data
Several remote sensing datasets were exploited using SPASSO (Software Package for an Adaptive Satellite-based Sampling for Ocean campaigns, https://spasso.mio.osupytheas.fr/, last access: 2 October 2020). Altimetry data were obtained from the AVISO regional Mediterranean product. Delayed-time L3 maps of SST sat (Mediterranean Sea – ultra-high-resolution L3 SST reprocessed; Nardelli et al., 2013; Pisano et al., 2016) and chl sat a (Mediterranean Sea reprocessed surface chlorophyll concentration from multi-satellite observations) were retrieved for the period of the cruise, on regular grids of 0.01×0.01 resolution for SST sat and of 1×1 km resolution for chl sat a from CMEMS – Copernicus Marine Environment Monitoring Service (http://marine.copernicus.eu/, last access: 10 November 2020). SPASSO provided several Lagrangian diagnostics of the altimetry-derived current field, such as the finite-size Lyapunov exponent (FSLE) computed using the algorithm of d'Ovidio et al. (2004), in order to help in positioning the sampling transect and stations taking into account the ocean dynamics. This approach was successfully adopted during previous cruises such as LATEX (Petrenko et al., 2017), KEOPS2 (d'Ovidio et al., 2015) and OUTPACE (Moutin et al., 2017).
2.5 Lagrangian numerical simulations
In order to estimate the origins of the sampled surface water along transect ION-Tr, the ARIANE package (Blanke and Raynaud, 1997) was used to predict surface trajectories of water particles, using surface geostrophic velocities derived from altimetry and winds from the WRF model (Barrillon et al., 2019). The daily gridded surface geostrophic velocity fields from Copernicus Monitoring Environment Marine Service (CMEMS) were used, with a resolution of , using the near-real-time data, validated by an accurate comparison with both the hull-mounted ADCP data and the Surface Velocity Program (SVP) drifters deployed during the cruise (Barrillon et al., 2019). Given the daily time series of the surface velocity field, the ARIANE package computes numerical particle trajectories through a backward or forward integration time. The so-called “qualitative” mode is chosen: each particle trajectory can be followed step by step through the integration time. Only surface trajectories were considered. The simulated particle positions were initialized in a polygon around the ship's track on 29 May (longitude from 18 to 20.1∘ E, latitude from 35.4 to 35.9∘ N with an extension of 0.2∘ N and S of the track). This polygon surrounds the actual track, to take into account a potential offset between in situ velocity and satellite-derived geostrophic velocity. A total of 10 000 particles (sufficient for a comprehensive sampling of the polygon area) randomly seeded inside the launch area were advected backward for 1 month. This duration was chosen as a trade-off between particle source identification, error accumulation along the trajectories and residence time in the Ionian Sea (39 d according to Celentano et al., 2020). The particle trajectories and final positions were analyzed to determine the main source areas (http://www.obs-vlfr.fr/proof/php/PEACETIME/peacetime.php, last access: 10 September 2021). Once the special issue is completed, the PEACETIME biogeochemical dataset will be available in SEANOE at https://www.seanoe.org/data/00645/75747/ (last access: 10 September 2021).
3.1 Oceanographic context
Considering the surface circulation over the northern Ionian Sea (Fig. 1), averages of satellite chl a and surface temperature of the region 34 to 40∘ N, 16 to 22∘ E were computed for the period before our sampling. Time series of satellite chl a showed that surface phytoplankton concentration decreased starting in mid-March (Fig. 2). Maximum chl a concentration was 0.24 mg m−3 in January. Starting at the end of April, the Ionian Sea was steadily warming while chl a concentration remained low (0.09 mg m−3), indicating the absence of significant surface production. On average over April–May, maximum chl a concentrations were observed in the area south of the Strait of Messina and in the Gulf of Taranto (not shown).
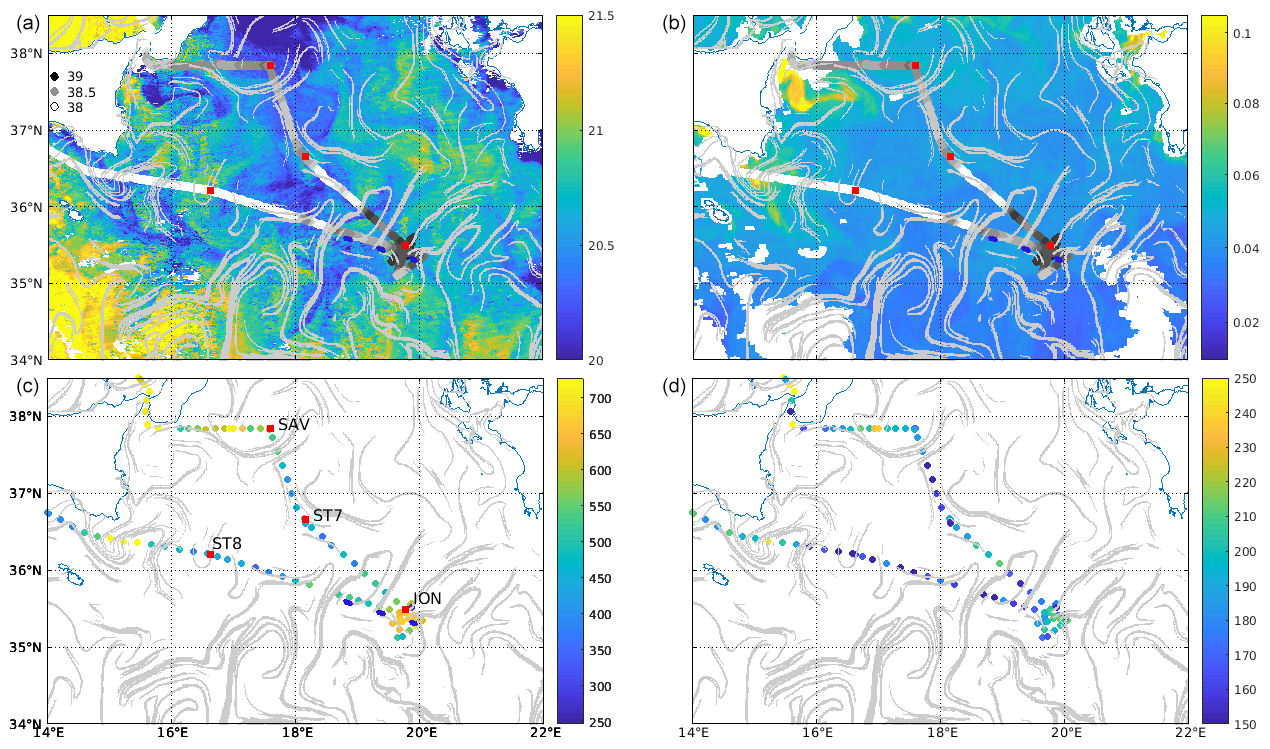
Figure 3(a) Satellite SST (29–30 May, night, ∘C). (b) Chl a (30 May, mg/m3). In (a) and (b), underway surface salinity from the TSG is overlaid as dots, with darker colors for saltier water. (c) Underway surface abundance (cells cm−3) of the nanoeukaryote 1 group from cytometry. (d) Underway surface abundance (cells cm−3) of the coccolithophore-like group from cytometry. In all panels, FSLE ridges are overimposed in light grey (> 0.15 d−1). Stations positions are marked as red squares and ION-Tr W, C and E as blue dots as in Fig. 1.
At the end of May in the Ionian basin, satellite imagery (Fig. 3a and b) shows slight meridional gradients of SST and chl a, with warmer and low-chlorophyll water to the south and colder water with higher chlorophyll to the north. In addition, a strong mesoscale variability was observed with cold and chlorophyll-rich filaments south of the Strait of Messina and south of Sicily, extending toward the center of the basin. Several cyclonic (located at 38∘ N, 17.5∘ E and 34.5∘ N, 21.3∘ E) and anti-cyclonic (located at 35.7∘ N, 19∘ E; 34.7∘ N, 17.5∘ E) structures were visible in the center of the basin.
The underway salinity showed a general increase toward the east and the north. On the northern part of the route (SAV-ST7-ION), there was a transition from medium salinity to the north to low (<38.2) then high (>38.8) salinity at the easternmost end of the route close to the long-duration station ION. On the southern part of the route (ION to ST8), there was an alternation of low- and high-salinity waters, sampled during the ION-Tr transect. West of 18∘ E, salinity was stable and lower than 38.2 up to the Sicily Channel. Therefore SAV and ST7 were in medium-salinity waters, ION was in high and ST8 was in low-salinity waters, while ION-Tr crossed waters with variable salinities.
The two phytoplankton groups abundant enough for the counts to be accurate are shown (Fig. 3c and d). In the Ionian Sea, nanoeukaryotes 1 and coccolithophore-like cells showed a distribution consistent with salinity, with higher values in saltier water except southeast of Sicily. The patterns observed were mostly consistent with satellite chl a, with high abundances southeast of Sicily and south of the Strait of Messina. However, along ION-Tr, abundance was variable while satellite chl a was fairly constant.
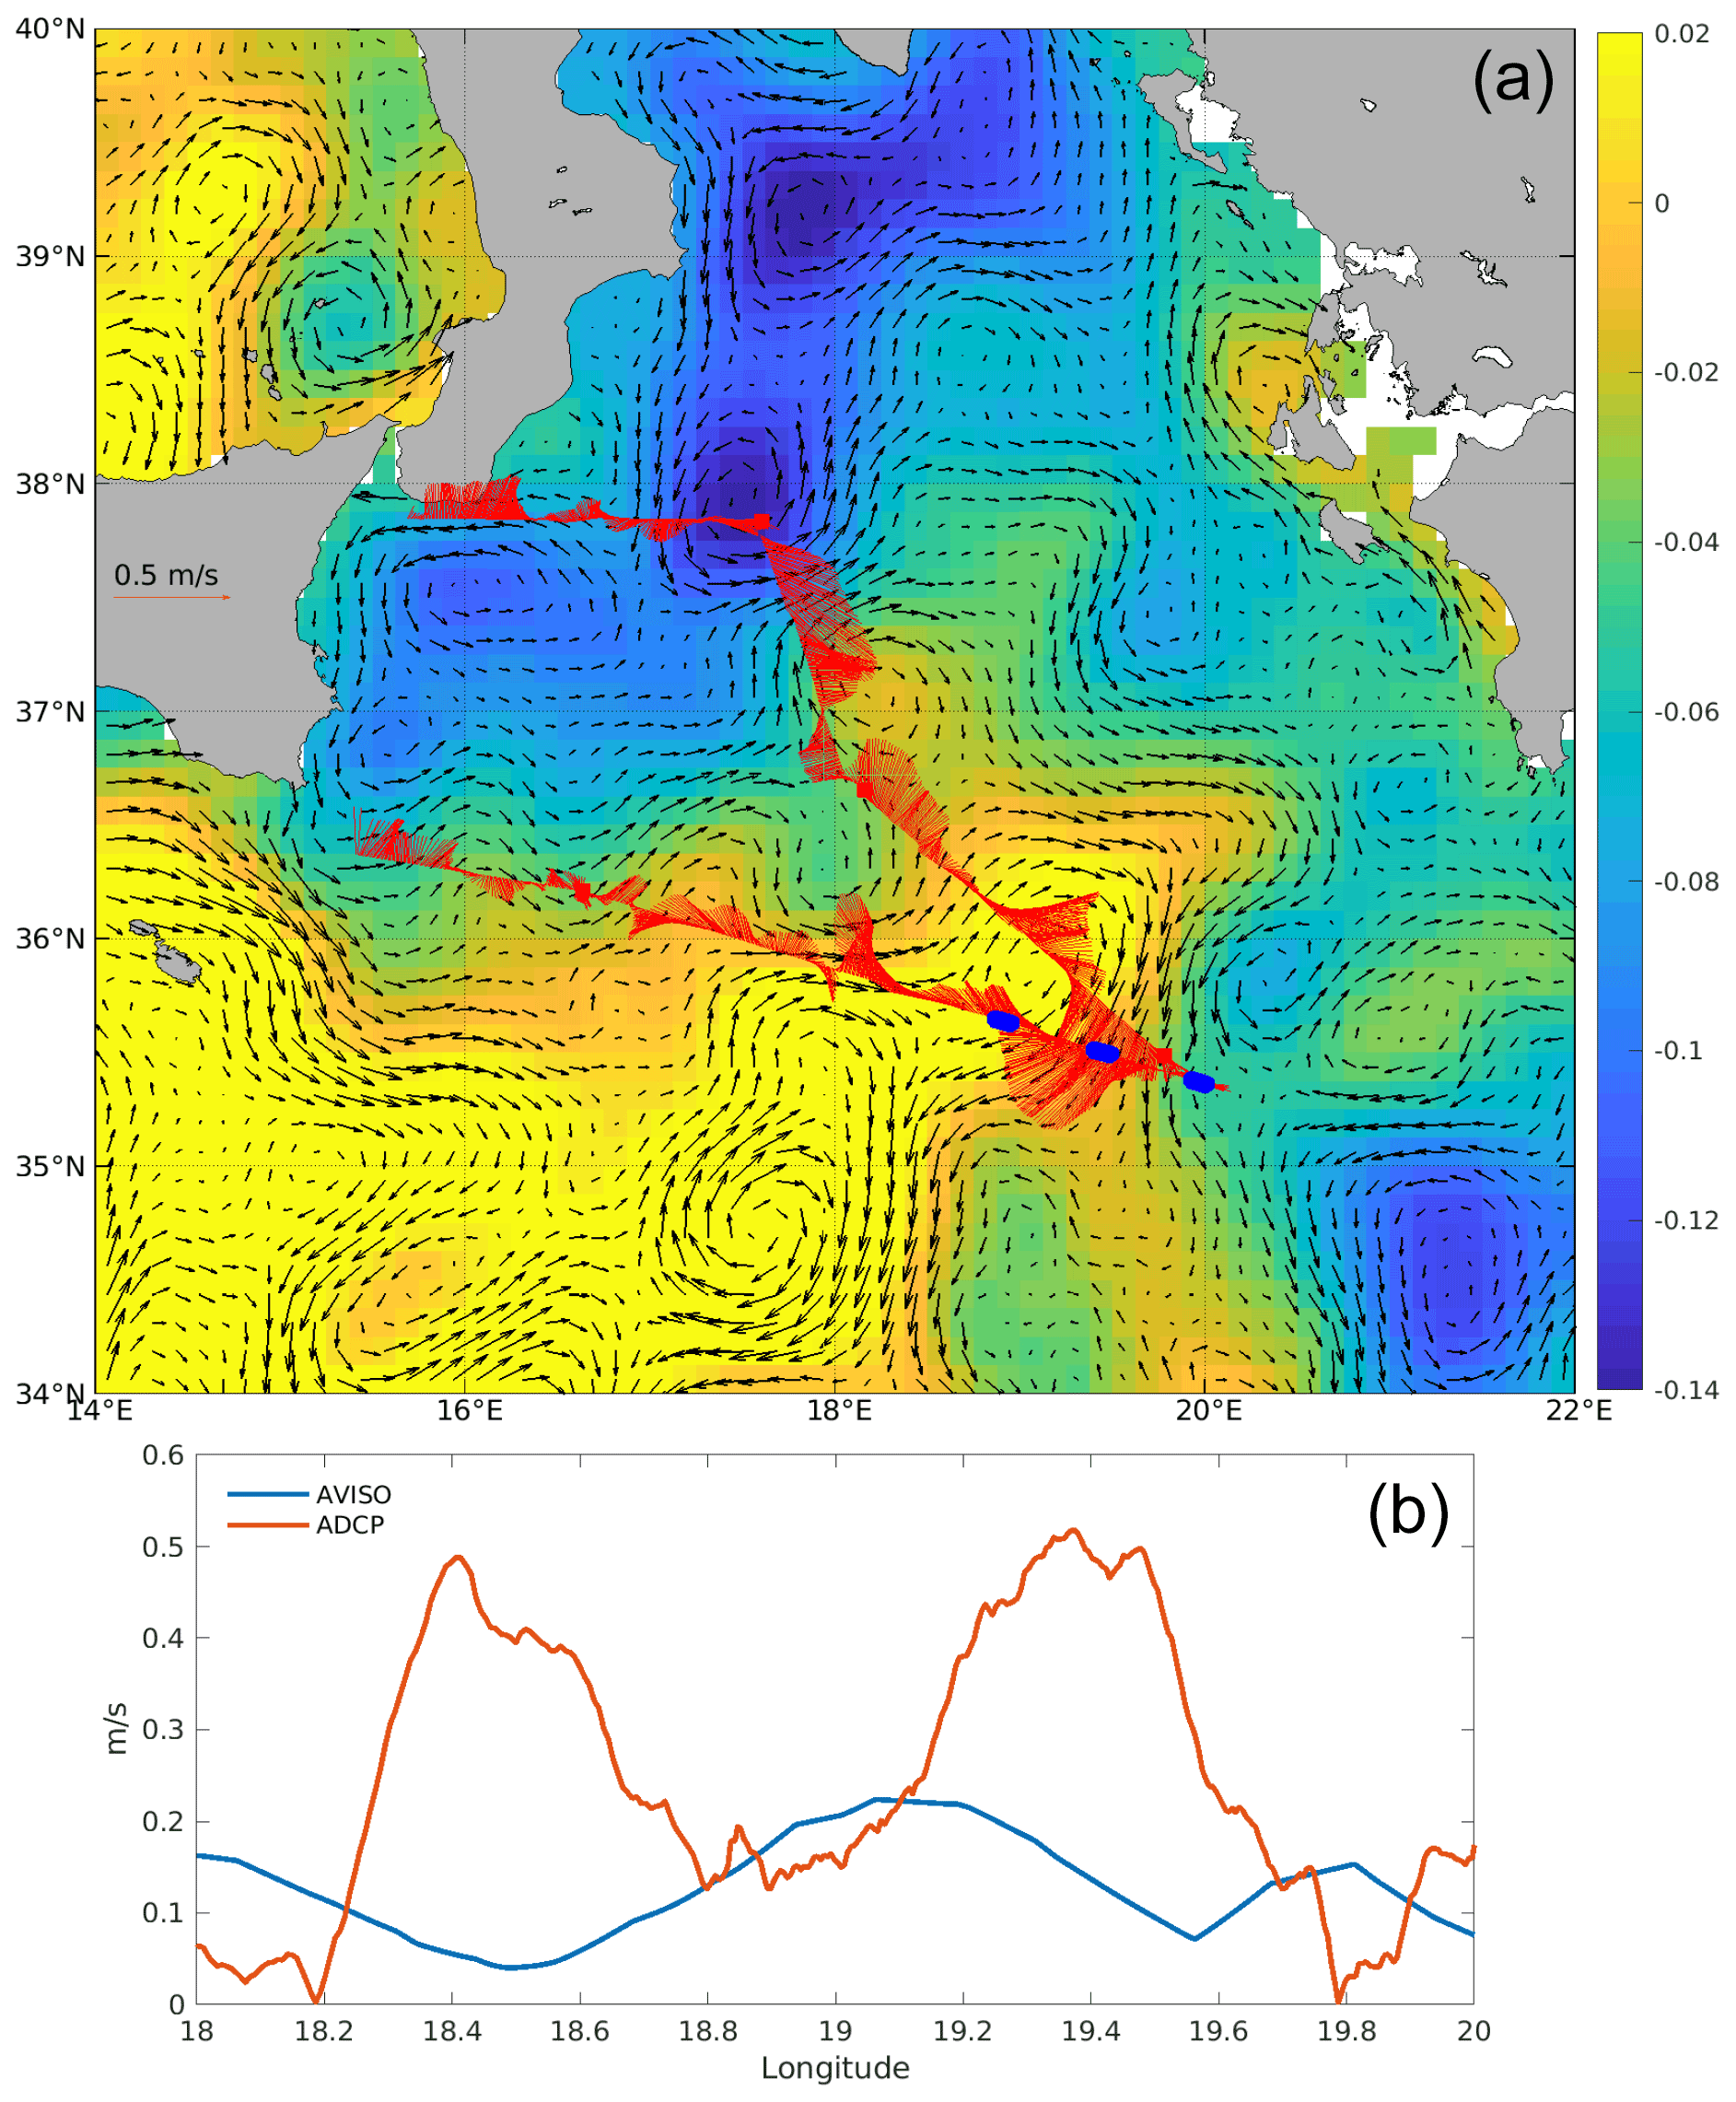
Figure 4(a) Absolute dynamic topography (ADT, color) and surface geostrophic circulation from altimetry averaged over the period 22–30 May (black arrows). Underway ADCP currents are overlaid (red arrows). ION-Tr W, C and E are marked as blue dots as in Fig. 1. (b) Velocity along the ION-Tr transect derived from altimetry for 29 May and measured with ADCP.
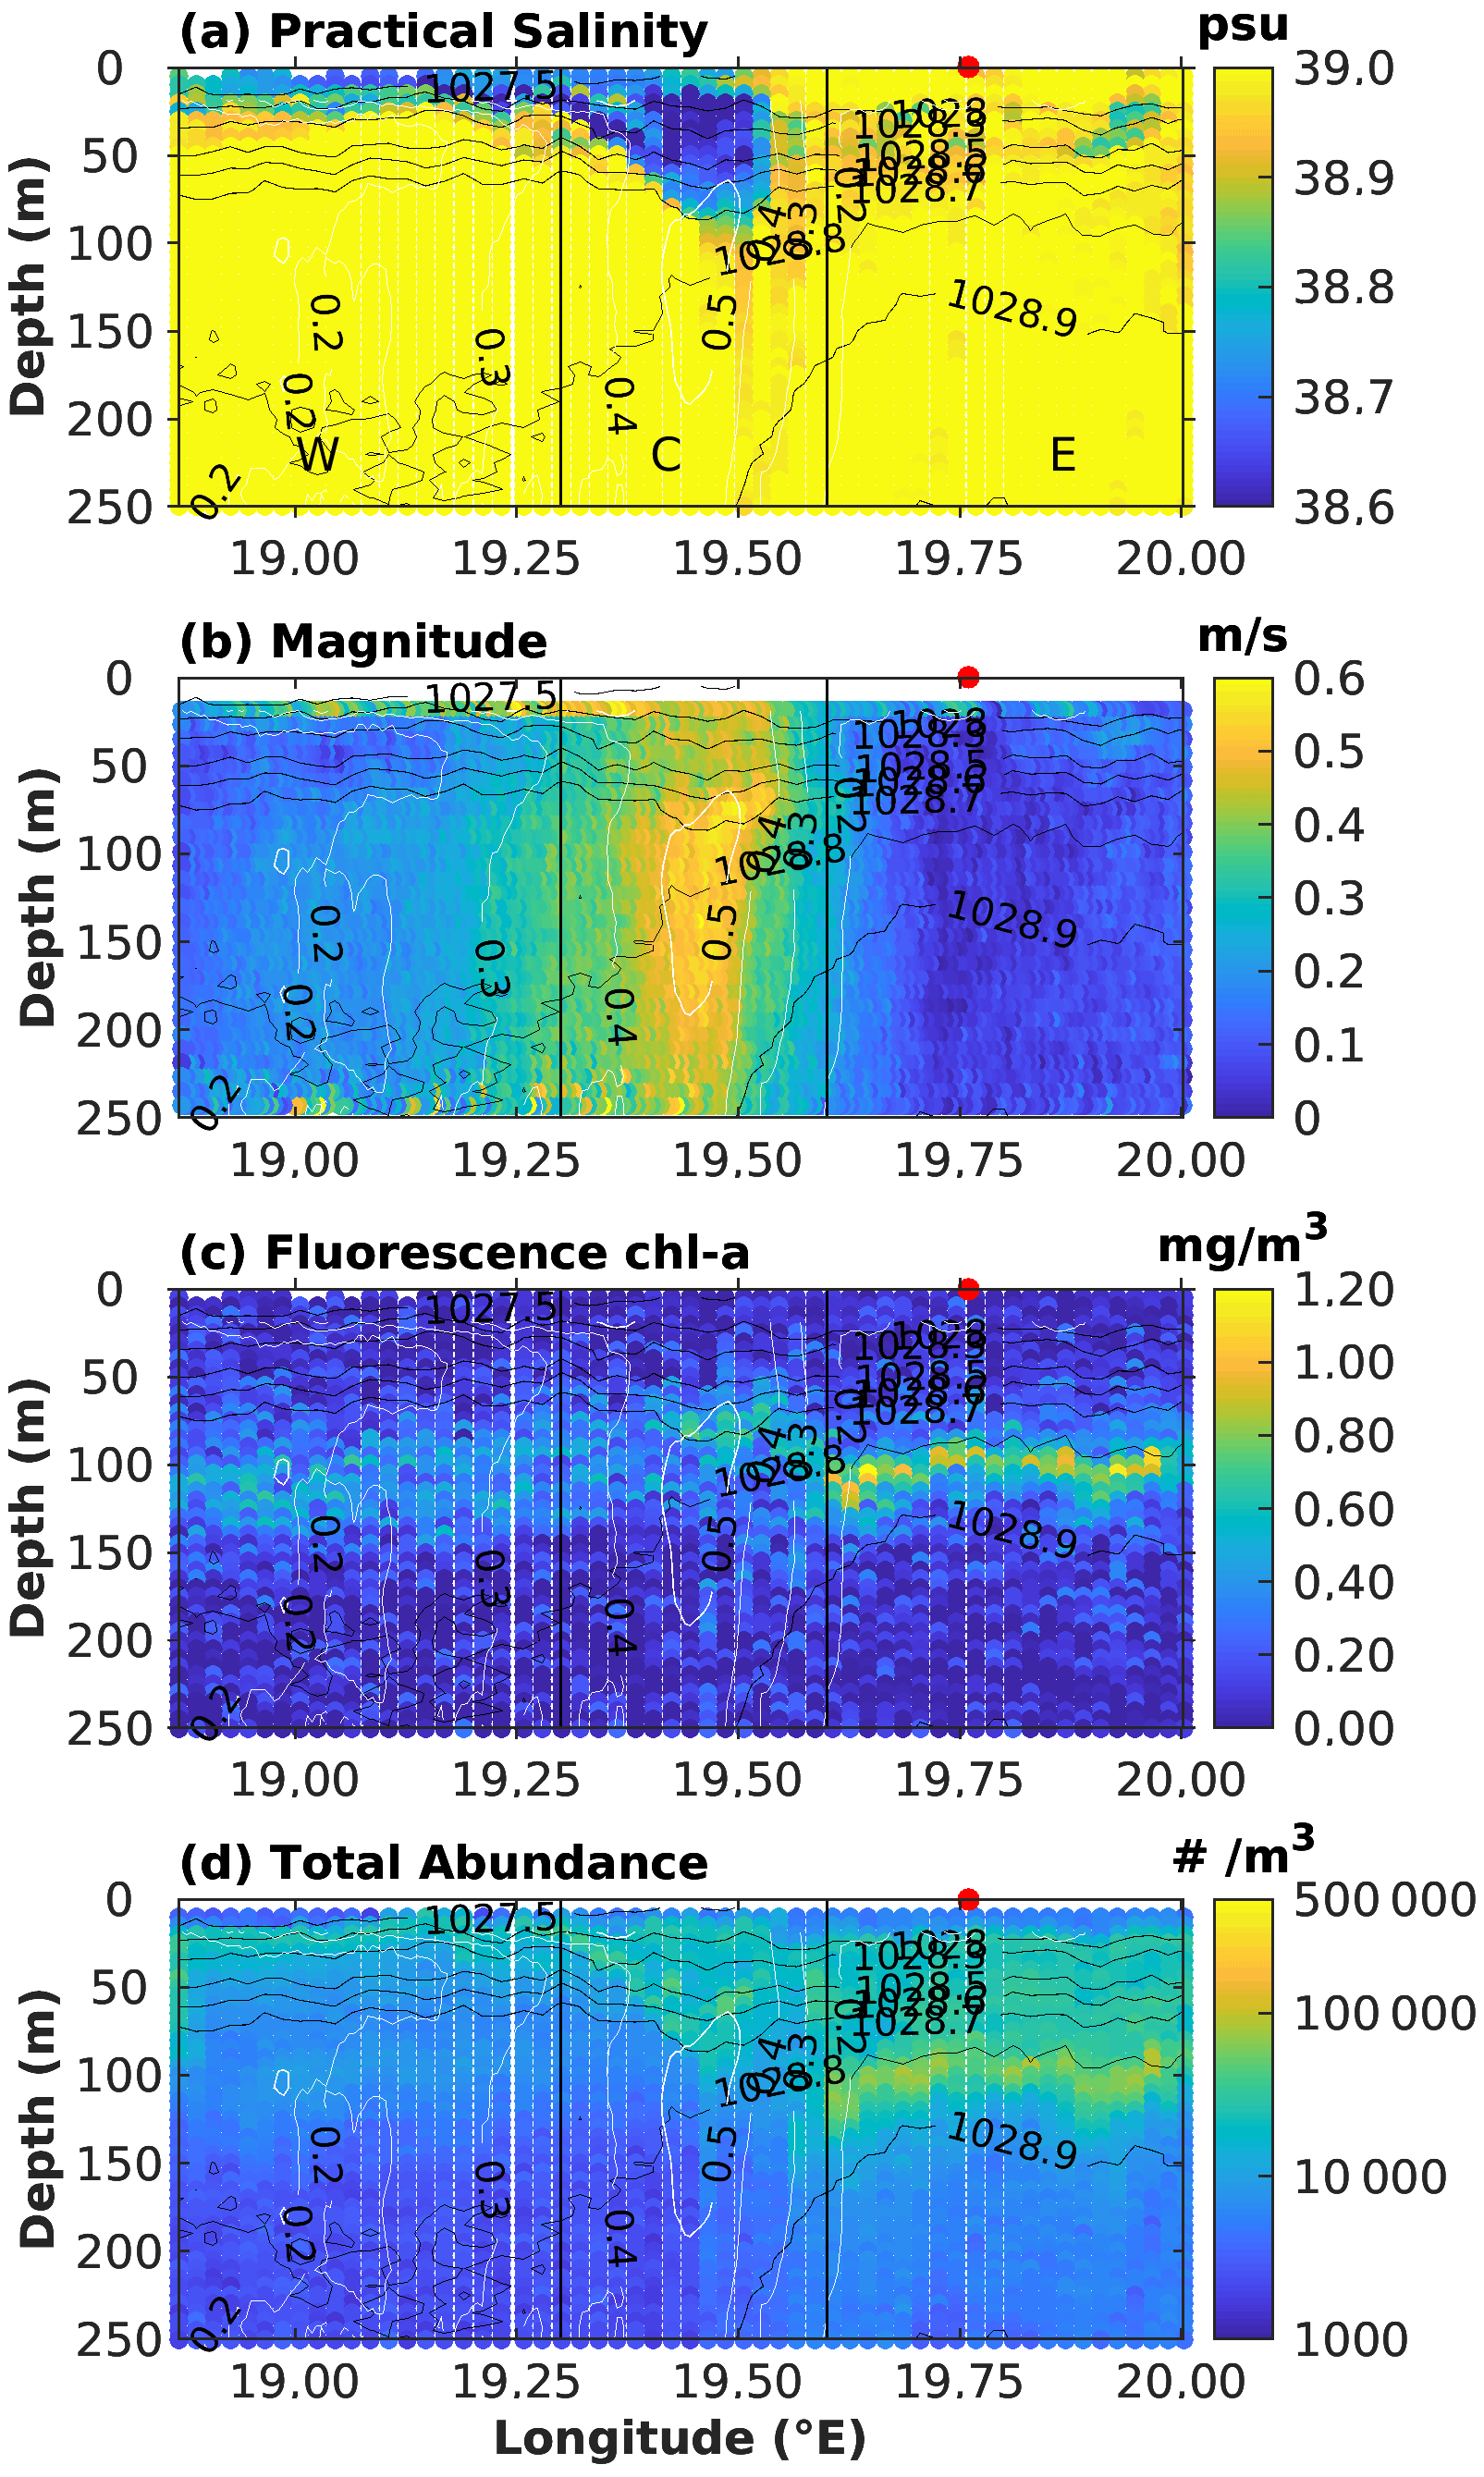
Figure 5Variables sampled along the ION-Tr transect from MVP, plotted as depth vs. longitude. (a) Salinity, (b) ADCP current speed, (c) fluorescence and (d) total particle abundance. Density and current speed are overlaid respectively as black and white contours on all panels. The three parts of the transect from left to right where respectively ION-W, ION-C and ION-E pseudo-stations are located are delimited by black vertical lines. ION station position is marked as the red dot at the top of each panel.
Altimetry-derived surface geostrophic currents showed a general circulation with an anticyclonic flow in the southwestern part of the basin (Fig. 4a). South of Sicily, water entered the Ionian Sea around 36∘ N along a southeastward path, progressed eastward along 35.5∘ N and then veered southwestward close to 19.5∘ E. East of 18∘ E, the currents show a pattern consistent with the intense (∼ 0.5 m s−1) currents measured by the hull-mounted ADCP along the ship route, depicting an anti-cyclonic meander, more intense on its eastern flank. There is a small spatial offset between altimetry and ADCP (∼ 0.4∘ longitude, Fig. 4b), and current magnitude estimated from AVISO was about half the value of ADCP-derived current magnitude. The southwestward branch of this meander was located approximately in the center of the ION-Tr transect, while the ION station was located on the eastern border of the meander. The altimetry-derived FSLE field (Fig. 3), as well as the time series of ADT (annex A), showed that this anticyclonic meander east of 18∘ E was stable during May. The southwestward jet sampled during ION-Tr coincided with a slightly cooler filament than surrounding waters, as shown in Fig. 3a, b.
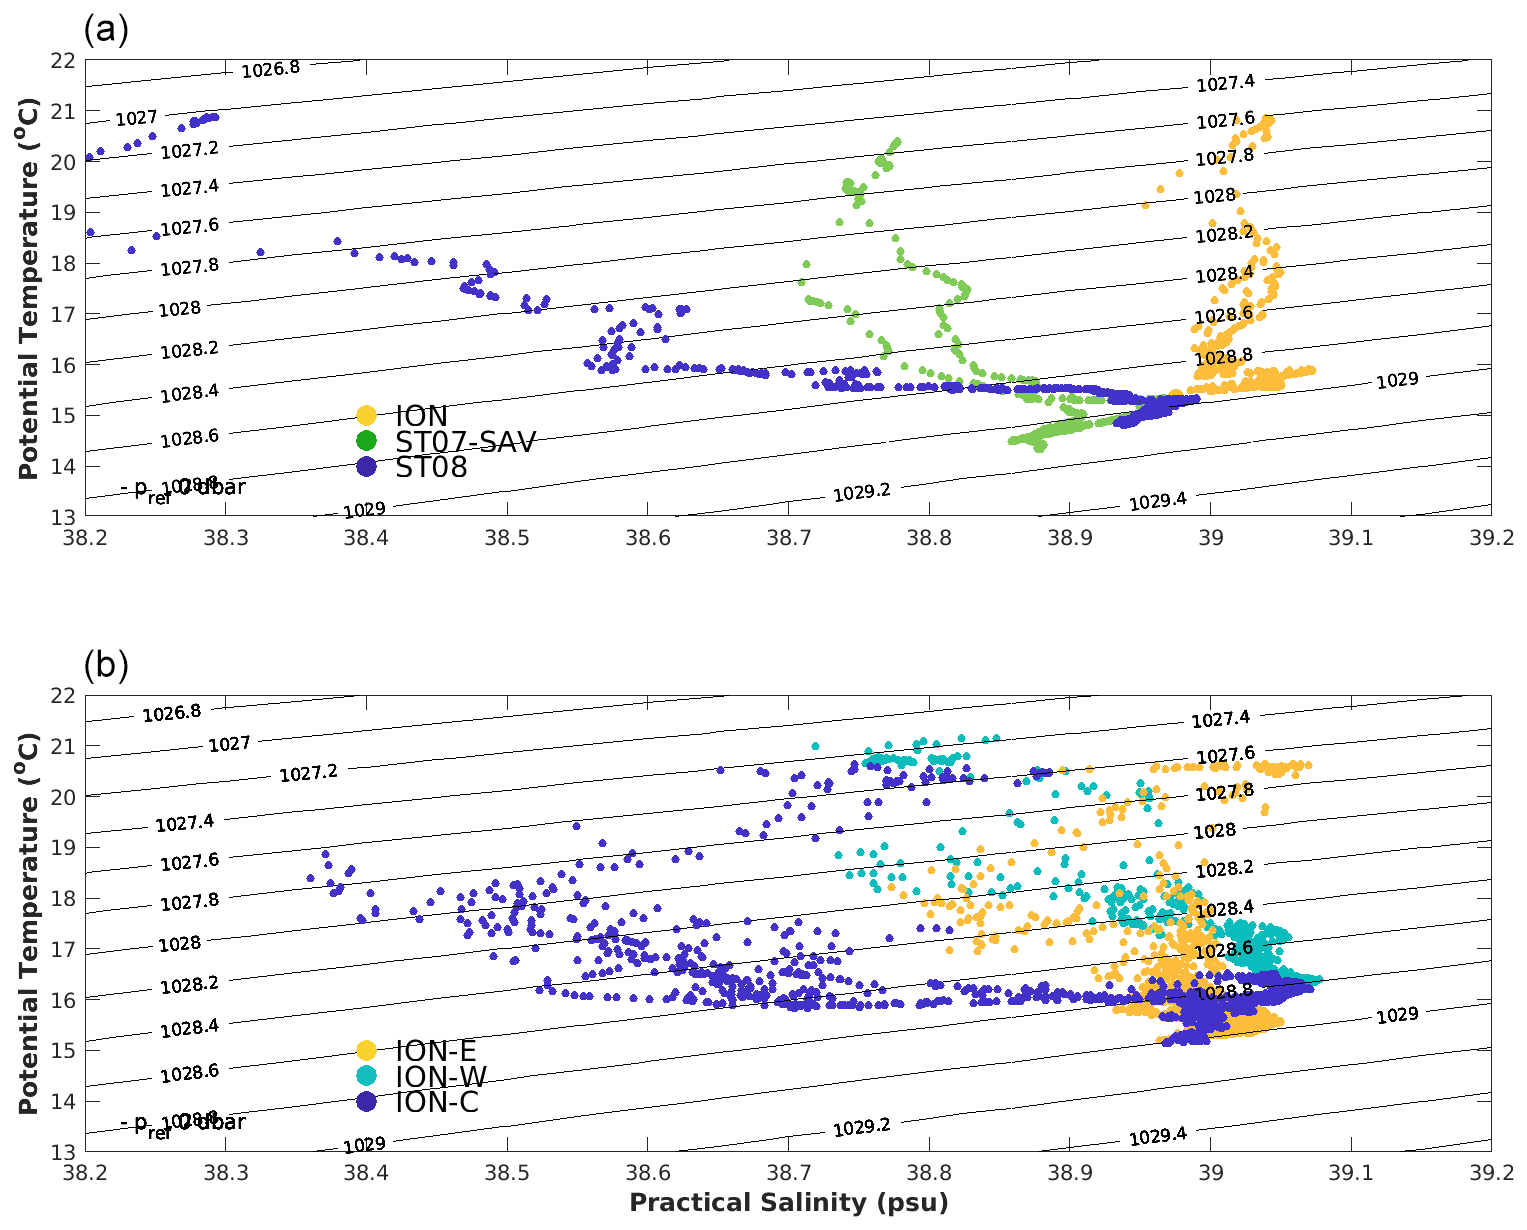
Figure 6T–S diagram for stations ION, SAV, ST7 and ST8 restricted to 0–300 m (a) and for ION-Tr parts (b) ION-W, ION-C and ION-E.
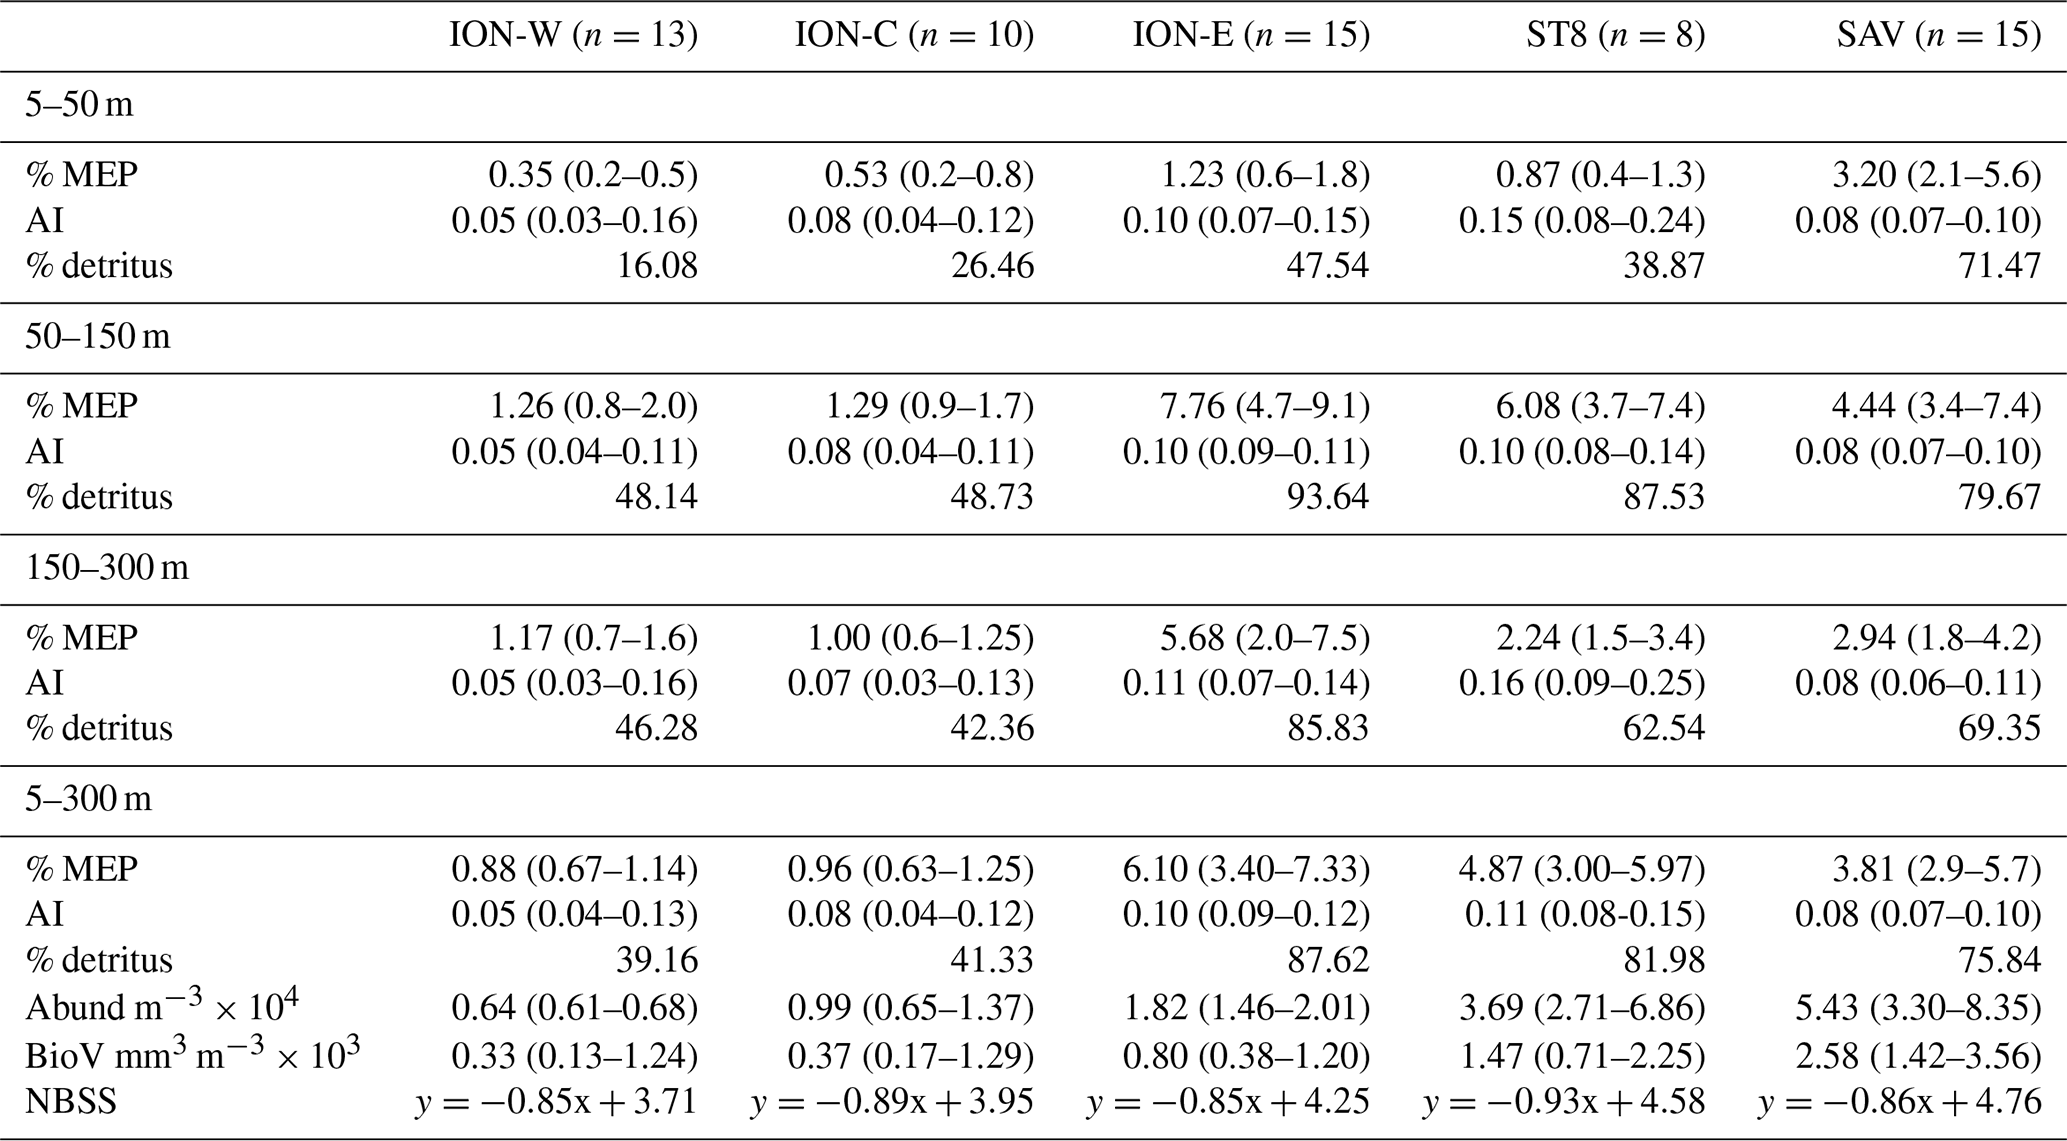
Table 2LOPC particle-derived parameters for ION-Tr, ST8 and SAV, for three depth layers. Abund is total abundance, and BioV is total biovolume.
3.2 Distribution of water masses and biological properties along transect ION-Tr
Based on the salinity–depth distribution (Fig. 5), ION-Tr can be divided into three parts: from west to east, a western part (noted W) with a fresher surface layer extending 0–30 m covering a deeper layer with salinity >39, a center part (noted C) with a fresher vein (<38.7) extending from the surface down to 70 m deep and an eastern part (noted E) with quasi-homogeneous salinity on the vertical, slightly lower than in W (39). Hereafter we define three pseudo-stations along ION-Tr, named ION-W, ION-C and ION-E. Note that the ION long-duration station was located very close to the eastern part of ION-Tr (Fig. 1); thus ION-E and ION can be considered similar.
This salinity coincided with current pattern from the ADCP, with ION-W and ION-E being in quiescent water (current <0.2 m s−1), while ION-C corresponds to a strong (>0.3 m s−1) southwestward jet extending from the surface to 300 m depth. The total abundance of particles, as well as chl-a fluorescence, clearly contrasted between ION-W and ION-E (Fig. 5). In ION-W, particle abundance was low ( m−3), essentially concentrated within the 200–30 m layer. Fluorescence was rather homogeneous, with a broad maxima around 110 m. In the ION-E part, abundance was much higher ( m−3), with a deep maximum at 100 m depth (values around 1×10⁵ m−3) close to the depth of the deep chlorophyll maximum (DCM) and also high particle abundance between 20 and 90 m (∼ 3×10⁴ m−3). ION-C was distinct from ION-E and ION-W in terms of vertical distribution and abundance of particles as well as fluorescence, with the low-salinity vein coinciding with higher particle abundances and the maximum fluorescence being located at ca. 70 m, at the interface between low-salinity and underlying waters.
The T–S distribution of ION-Tr (Fig. 6) mirrored the distributions of stations ST8 and ION. Water at ION-C is similar to ST8 for potential densities greater than 1028 kg m−3 (i.e., deeper than 25 m). ION-E is similar to ION with more scatter. ION-W does not match the other stations. Northern stations ST7 and SAV had similar water mass properties, distinct from ST8, ION and the ION-Tr profiles.
At the surface, phytoplankton groups also showed contrasting abundances along ION-Tr (Fig. 3c, d). Horizontal sampling resolution did not allow us to distinguish the ION-C region. But nanoeukaryotes1 increased from low values (as mean ± SD, 487±52 cells cm−3, n=27, 18–19.5∘ E) to higher values (659 ± 50 cells cm−3, n=117, >19∘ E) along ION-Tr (from west to east). Similarly, the coccolithophore-like group also increased (176 ± 18 cells cm−3 against 192.47 ± 13 cells cm−3). Conversely, picoeukaryote abundances decreased eastward (653 ± 94 cells cm−3 vs. 462.8 ± 76 cells cm−3; not shown). The other groups did not show large changes in abundances.
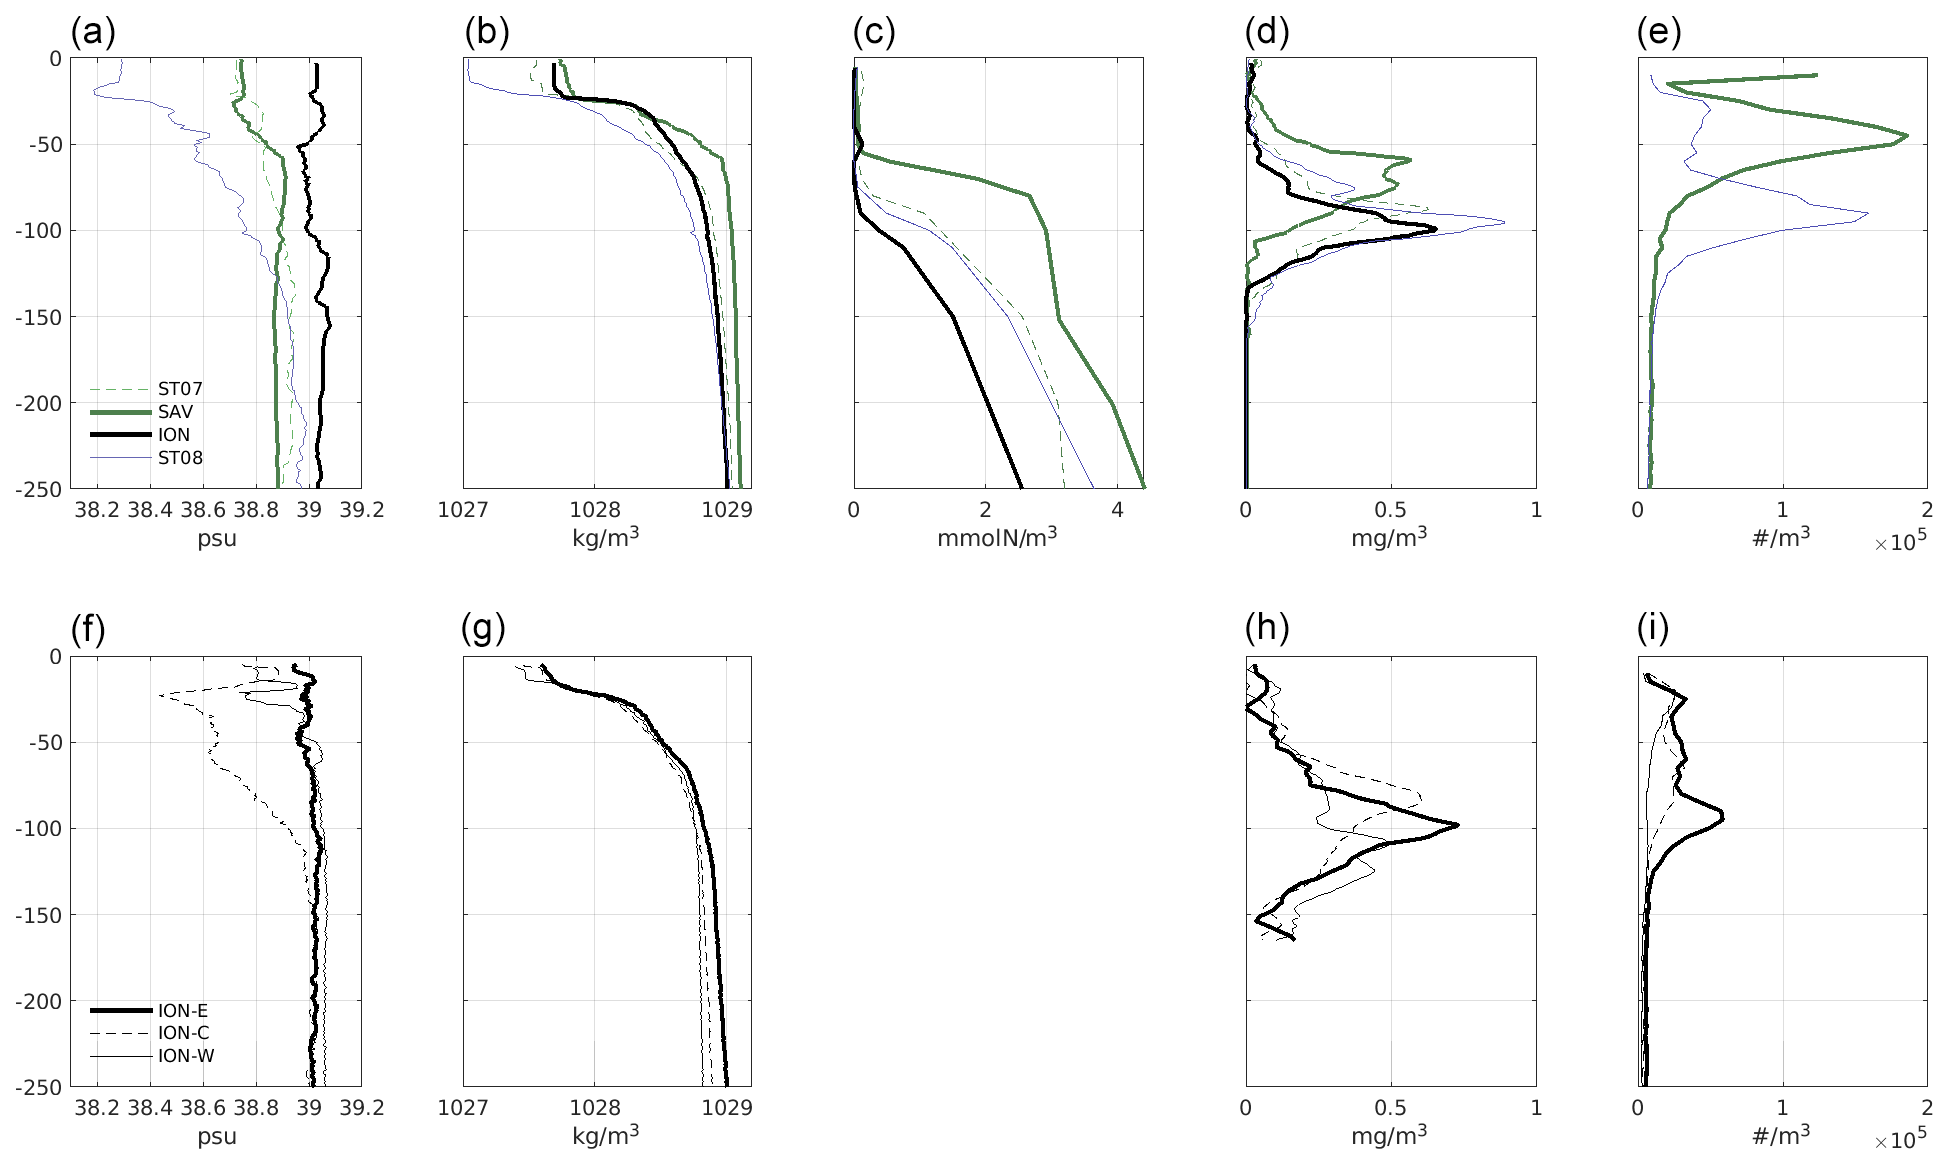
Figure 7Vertical profiles of variables at ION, SAV, ST7 and ST8 (a–e) and for ION-W, ION-C and ION-E (f–i). (a, f) Salinity, (b, g) density, (c) nitrate, (d, h) chl a and (e, i) total particle abundance. Note that particles were not quantified at ST7. For chl a and particles, an average over three profiles was computed.
3.3 Comparison of vertical distribution across stations
CTD and bottle measurements performed at the SAV, ST7 and ST8 stations together with the one from the ION transect are shown in Fig. 7. These vertical profiles allow a finer analysis of the contrast between stations and among parts of ION-Tr. Consistent with Fig. 6, salinity increased from ST8 to ION-E (Fig. 7, panels a, f). Excluding the upper 25 m of the water column corresponding to the mixed layer (ML), pairs of stations were similar: ION-C and ST8, ION-E and ION-W, and ST7 and SAV. A narrow (<10 m thick) lower-salinity layer was present at 30 m on every profile except ION-E. The surface pycnocline was located between 10 and 25 m depth, followed by a steep thermocline down to 60–80 m. Surface nitrate (Fig. 7, panel c) was depleted everywhere. Nitracline depths increased from 60 m at SAV up to 90 m at ION, together with nitrate concentrations below the euphotic zone.
A DCM was always present (Fig. 7, panels d, h), but its intensity was highest at ST8 and lowest at ION-W and ION-C, with fluorescence expanded over a large depth range. The depth of DCM corresponded to the top of the nitracline and to the bottom of the euphotic zone (∼ 90 m at ION).
Profiles of particle abundance were highly variable (Fig. 7, panels e, i). The integrated particle abundance was highest at SAV and lowest at ION-W. Some profiles had several maxima. At ST8 and ION-E, the main peak was just above the DCM depth, and a secondary peak was present above DCM at ∼ 20 m depth, also present at ION-W. The SAV profile was different with a large peak at 50 m, above DCM, and a surface peak at 10 m.
The NBSS slopes (Table 2) were similar for stations SAV, ION-W and ION-E (0.85); higher for ST8 (0.93); and intermediate for ION-C (0.89), indicating more abundant smaller particles at ST8. On average, using the calibration given in Espinasse et al. (2018), % MEP indicated that at ION-C and ION-W, zooplankton constituted ∼ 60 % of particles, while at ION-E, ST8 and SAV particles were mainly detritus (∼ 75 %–90 %), i.e., non-living particles such as aggregates produced after intense primary production. AI was similar in different depth layers but higher at ST8 and ION-E (0.11–0.10), while MEP was always more abundant in the 50–150 m layer, where the particle maxima were observed.
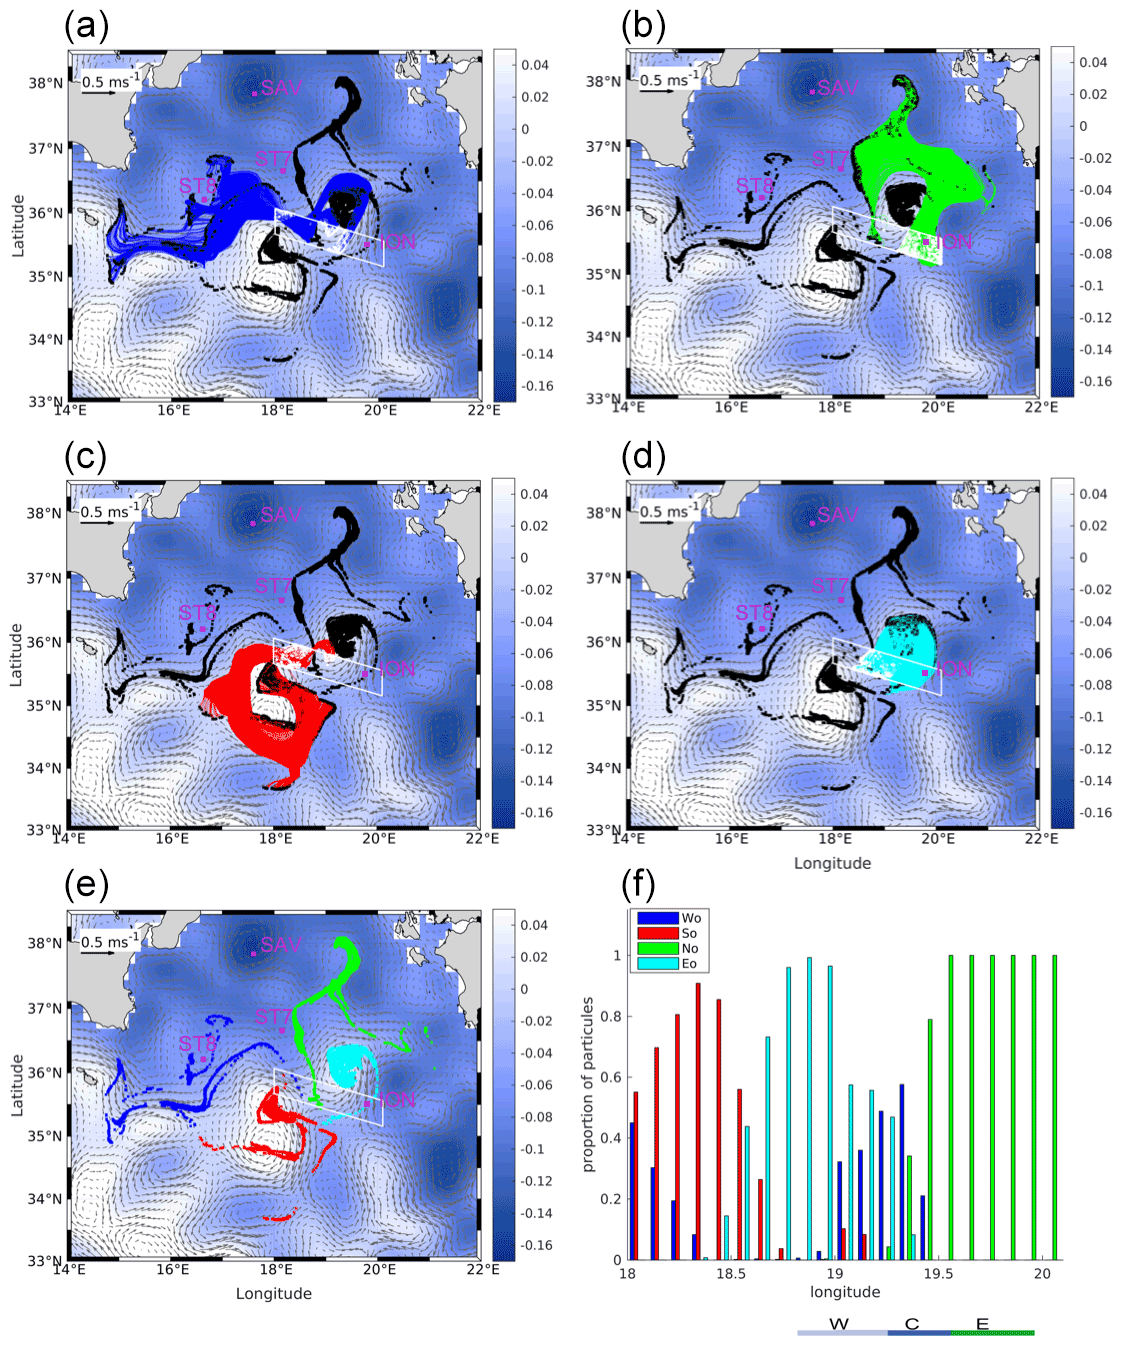
Figure 8Backward Lagrangian trajectories for particles launched along ION-Tr and tracked for 1 month, overlaid on average ADT (colors) and surface currents (black vectors) averaged for the period 1–30 May. The particle launch area is indicated by the white polygon. (a–d) Trajectories separated according to the four major origins. (a) Wo, (b) No, (c) So and (d) Eo. Black dots are the particle positions at the end of the backward advection, i.e., 1 month before our sampling. (e) Final positions of particles for each origin. The pink dots are the station positions. (f) Proportion of each origin along ION-Tr computed for each 0.1∘ of longitude. The three zones of ION-Tr shown in Fig. 5 are indicated at the bottom.
3.4 Lagrangian origin of particles
The focus here is on the particles produced before sampling and transported to the region of sampling. Figure 8 shows the full trajectories of particles originating along the ION transect, split in four panels according to the main path followed by particles and therefore their origin. Each color identifies a distinct path. Panel e shows the particle positions 1 month before our sampling, colored according to the origin. Note that as the altimetry-derived velocity was shifted westward by 0.4∘ in longitude west with respect to in situ velocity from ADCP (Fig. 4b), the initial positions of numerical particles were extended westward to 18∘ E. These simulations showed that the water parcels observed along ION-Tr originate from four regions, so-called source regions (south origin, So; west origin, Wo; north origin, No; eddy origin, Eo), with Wo, No and Eo being dominant (Fig. 4f). Along ION-Tr, the contribution of each region showed a rather clear pattern, with some overlap in the center (Fig. 8f). ION-W was in waters mainly originating from Eo. ION-C was mainly originating from Wo but also from Eo and to a lesser extent from So. ION-E was only originating from No. Finally, west of 18.6∘ E, beyond the limit of the actual transect, So was the main contributor.
4.1 Surface circulation and distribution of water masses in the Ionian Sea
Surface circulation, together with the along-track surface salinity distribution, describes one pathway of AW penetrating into the Ionian Sea (Figs. 3 and 4). Here, this pathway is approximately zonal along latitude 36∘ N from the Sicily Strait up to 19∘ E and then veers southwestward. This pathway is supported by the similarity of water mass properties sampled at ST8 and ION-C (Figs. 6 and 7) and illustrated by backtracked trajectories (Fig. 8, western origin), indicating a ca. 1 month travel time between 15 and 19.5∘ E. It is also supported by the absence of transport barriers east of ST8 shown by FSLE (Fig. 3). North of 36∘ N, the similarity of ST7 and SAV water mass properties (Fig. 6) also supports a single origin of water masses in the northern Ionian Sea.
This distribution of AW in the Ionian Sea is consistent with a cyclonic mode of the so-called North Ionian Gyre (NIG, Gačić et al., 2010) that characterizes the circulation in the Ionian Sea north of ca. 35.5∘ N. In the cyclonic mode of the NIG, AW follows a rather direct east-southeast path, while saline water from the Levantine basin enters the northern Ionian Sea from the east, and current flows southwestward along Calabria (Menna et al., 2019). As observed by altimetry, the NIG was cyclonic since 2011 (Menna et al., 2019) but reversed to anticyclonic in the second half of 2017 (von Schuckmann et al., 2019), after our sampling.
It is interesting to note that the southwestward jet sampled along ION-Tr is a persistent feature of the Ionian Sea circulation, generally located at ca. 36∘ N, 20∘ E and directed southward (see Fig. 2 in Menna et al., 2019; Celentano et al., 2020; Berline et al., 2014). It is present during cyclonic and anticyclonic modes of the NIG. It pertains to the northern branch of the Mid-Ionian Jet (MIJ).
Cyclonic circulation of the NIG implies a downwelling of the nutricline at the northern border of the NIG and an upwelling of nutricline in the central NIG (Civitarese et al., 2010; Lavigne et al., 2018). Our observations of shallow nutricline depth (isoline 1 µM at ∼ 55 m for SAV and ∼ 95 m for ST8, both located in the central NIG) are consistent with the nutriclines shown by Lavigne et al. (2018) during the cyclonic mode. The cyclonic mode also favors higher chl a in the center NIG and a late winter bloom (Lavigne et al., 2018). However the chl-a evolution during 2017 only shows a weak bloom in the northern Ionian Sea (Fig. 2). This may result from a weak winter buoyancy loss, independent of the NIG circulation, as pointed out by Lavigne et al. (2018). The increase in chl a occurred in the last week of April 2017, and then chl a decreased, reaching its minimum value around the end of May, during our sampling.
4.2 Origin of water masses sampled along ION-Tr
In the center of ION-Tr, a strong current is associated with a low-salinity vein (down to 38.4, Fig. 6) that dynamically separates the two parts of the transect. This separation is stable as supported by the FSLE ridge (Fig. 3). While the density stratification is similar along the transect, particle and chl a distributions show a striking difference from E to W. At ION-E, particle abundance and biovolume is 2, 4 and 2.8 times higher than at ION-W (Table 2), essentially due to particles with an equivalent spherical diameter (ESD) smaller than 500 µm. At ION-E particles were distributed over the pycnocline from 1028 to 1028.7 kg m−3 (potential density, Fig. 5d), with a maximum associated with a narrow DCM at 100 m, while at ION-W particles are only present in the density layer 1028–1028.2 kg m−3, and the DCM is broad and less marked, with no significant particle peak.
The distinct chl-a and particle distributions along ION-Tr suggest that waters sampled at ION-E and ION-W have distinct histories of biological production. One hypothesis is that these water masses originate from distinct locations. To explore this hypothesis, backtracking of particle trajectories was carried out and led to three main origins of water sampled along ION-Tr (Wo, No and Eo, as So only marginally contributes to the transect), influencing different parts of the transect (Fig. 8). When two origins overlap, we only consider the dominant origin. Water found at ION-C would be transported from the west (Wo), i.e., the Sicily Channel, while water found at ION-E (ION-W) would be transported mostly from the northern Ionian Sea (No) and from an eddy located north (Eo) respectively. Referring back to the general circulation in the Ionian Sea, the ION-Tr appears to be at the crossroad between waters from the north Ionian Sea, waters from the MIJ coming from the west and waters trapped in an anticyclonic eddy.
4.3 Biological history of water masses sampled along ION-Tr
LOPC detects particles of ESD > 100 µm (median ESD was 130–145 µm along ION-Tr). Typically, such large aggregates form as a result of intense primary production (Briggs et al., 2020; Martin et al., 2011). In addition, the presence of transparent exopolymer particles (so-called TEPs) represents an important upper-ocean process by which dissolved organic matter is converted into particles. Besides, these compounds act as glue, enhancing small particle aggregation and leading to the formation of marine snow aggregates (Engel et al., 2004) of the size we observe here. Once produced, aggregates can fragment or coagulate, be grazed, be degraded by bacteria attached to them, and sink out of the surface layer (Le Moigne, 2019; Stemmann et al., 2004). Therefore the particle abundance in the euphotic layer generally peaks shortly after enhanced primary production and then decreases in a time span depending on several factors.
Although the age of particles cannot be determined from their size distribution, we can make some hypotheses. At the time of sampling, the whole Ionian Sea was stratified with shallow mixed layers (∼ 25 m), and nitrate was fully depleted in the euphotic zone except at SAV, indicating stable, post-bloom conditions. As surface chl a continuously decreased from the end of April (Fig. 2), this suggests that the last surface primary production event around ION station occurred about a month before our sampling. This is longer than the time lag observed between primary production and subsequent export in large mesocosm experiments (Stange et al., 2017). Therefore, freshly formed particles are not likely.
The sinking speed of particles depends on their mineral composition (Le Moigne, 2013), their shape (Laurenceau et al., 2019) and the phytoplankton community (Riley et al., 2012; Guidi et al., 2009). Consistent with our cell counts, the pigment composition available at ST7, ST8 and ION shows a community dominated by nanophytoplankton (>60 % of total chl a) in the upper 80 m, while diatoms were abundant at the DCM depth (41 %–51 % of total chl a; see Marañón et al., 2021). The dominance of nanophytoplankton and coccolithophores was also found by Boldrin et al. (2002) in the northern Ionian Sea (38.5∘ N). Thus, in the upper 80 m small cells (typically <5 µm in diameter) do not favor the production of large aggregates and direct export (Richardson and Jackson 2007).
Further, aggregates are slowed down by density gradients, because of the equilibration time of their interstitial water (MacIntyre et al., 1995, Prairie et al., 2015). Therefore pronounced stratification can locally increase their abundance, as reported in numerous settings (Espinasse et al., 2014; Marcolin et al., 2013; Ohman et al., 2012). This explains that all profiles have a particle peak, just below the mixed-layer depth (Fig. 7). However, this mechanism does not explain deeper peaks observed at 60 and 90 m.
Finally, zooplankton can also contribute to the particle production through fecal pellet and transformation (sloppy feeding); unfortunately we are lacking zooplankton abundance data for ION-C and ION-W.
We now review the potential processes that led to the observed particle and chl-a distributions along ION-Tr, from west to east.
4.3.1 Western part
At ION-W, below the weak particle peak (Fig. 7, 2×10⁴ m−3) associated with the density gradient at the bottom of the mixed layer, abundances steeply decrease and reach minimum values at 80 m (1×10⁴ m−3). Such a low particle abundance in the top 100 m was not observed anywhere else across all PEACETIME LOPC profiles (∼ 800 casts; Guieu et al., 2020a). The chl-a concentration is also lower and very patchy compared to ION-E. As nitracline depth was shown to be highly correlated with the depth of the 1028.9 kg m−3 isopycnal in the Ionian Sea (Lavigne et al., 2018), the steep deepening of this isopycnal from ION-E to ION-W suggests a much deeper nutricline at ION-W than at ION-E (Fig. 5). Together, these observations emphasize the very oligotrophic character of station ION-W. Considering the backward trajectories (Fig. 8), this low abundance may result from two origins: (i) waters trapped in an anticyclonic eddy (Eo) or (ii) waters from the southern Ionian Sea (So), which is more oligotrophic and where phytoplankton concentration peaks earlier in the year (D'Ortenzio and Ribera d'Alcala 2009). For hypothesis (i), analysis of the evolution of altimetry (annex A) revealed that the eddy stayed coherent during the first 6 months of 2017 while slowly moving from the eastern Ionian Sea. This eddy may have trapped waters from the more oligotrophic eastern Ionian Sea (Casotti et al., 2003), and the vertical velocities in the center of the anticyclonic eddy may have accelerated the export of particles, as observed in the eastern Mediterranean (Waite et al., 2016). For hypothesis (ii), it was not supported by particle profiles obtained with an underwater vision profiler (UVP) in the southern Ionian Sea in July 2008 (Picheral et al., 2010) (https://ecotaxa.obs-vlfr.fr/, last access: 10 November 2020, Kiko et al., 2020), as they did not show such low abundances.
4.3.2 Center part
At ION-C, the backtracked trajectories indicate two overlapping origins (Eo and Wo mainly). However the low-salinity vein extending down to 7 m is a clear footprint of AW observed at ST8. Given the distribution of surface salinity from the thermosalinograph (Fig. 3a and b), this gives more support to a Wo. ST8 and ION-C also share higher NBSS slopes (0.93 and 0.89). As with ION-E, significant particle abundance above the DCM suggests that particles were produced upstream, near ST8 or further west, possibly in the enriched area south of Sicily, and then advected to central Ionian Sea.
4.3.3 Eastern part (ION station)
At ION-E DCM, microphytoplankton were dominant (Marañón et al., 2021) and associated with a particle peak in the DCM. This high ratio of particles to phytoplankton was also noted using other optical instruments (Barbieux et al., 2021). The DCM was associated with the bottom of the euphotic zone (∼ 90 m at ION), but not to a density gradient. Therefore the particle peak associated with the DCM probably resulted from aggregates produced locally, from diatom decay and fecal pellet production by zooplankton. The association of DCM and the particle peak was not observed in similar settings (see station A in Espinasse et al., 2018), which suggests that the plankton community at the ION-E DCM enhances aggregate production, perhaps through mucous production, as mucous was reported in sediment traps in the northern Ionian Sea (Boldrin et al., 2002).
Above the DCM, significant particle abundance (2–3×10⁴ m−3) was observed together with phytoplankton dominated by nanophytoplankton (Marañón et al., 2021). This significant particle abundance above the DCM is also observed at SAV and ST8, with a much higher peak concentration at SAV than at ST8 (1.5×10⁵ and 3–4×10⁴ m−3, respectively). When particles are suspended or sink slowly compared to the horizontal velocity, particle abundance act as tracer for horizontal advection (e.g., Karageorgis et al., 2012; Chronis et al., 2000). We argue that at stations SAV, ST8 as well as at ION-E, the abundance of particles above the DCM is a remainder of past surface production events that has not been exported out of the surface layer yet. In the northern Ionian Sea, a particulate organic matter (POM) maximum above the DCM (0–50 m) was also reported by Rabitti et al. (1994) and attributed to previous (relict) bloom. As above-DCM waters are depleted in nutrients, above-DCM particles at ION-E could be transported from an area where phytoplankton production was more intense and shallower, such as SAV, according to the backward trajectories and the vertical profiles. This continuity is supported by the similar slope of the particle size spectra at SAV and ION-E (0.86 and 0.85, Table 2). It is also supported by the higher surface abundance of nanoeukaryotes and coccolithophores at SAV, along Calabria and at ION-E (Fig. 3c, d). During transport from SAV to ION-E, particle abundance above the DCM may have decreased because of the processes mentioned earlier.
In the upper 0–90 m layer, nutrients were depleted and nanophytoplankton were dominant. Nanoeukaryote abundances were stable during the 5 d of occupation of the ION station (data not shown). This implies an active nutrient recycling, probably linked to the particle-associated microbial community, also supported by the high bacterial production in the upper 100 m of the water column reported by Marañón et al. (2021) at ION.
ION-E particle characteristics are closest to the “continental shelf” habitat type as defined by Espinasse et al. (2014), in the Gulf of Lion in early May with half the integrated particle abundance (18.2×10³ m−2 vs. 38×103 m−2), half the average AI (0.1 vs. 0.2), higher % MEP (6.1 vs. 1.8) and similar but steeper NBSS slope (0.85 vs. 0.79). Zooplankton abundance was slightly higher (300×103 ind m−2 vs. 206×103 ind m−2; see Feliu et al., 2020, but this value may be somewhat higher due to the combination of two mesh sizes (100 and 200 µm) instead of one (120 µm in Espinasse et al., 2018). Thus ION-E was characterized by porous aggregates, with a rather high contribution of large aggregates (% MEP).
Taking into account chl a, nanophytoplankton abundances, significant particle load above the DCM and high bacterial production, the ION station was not characteristically oligotrophic, under the influence of particles possibly transported from the north Ionian Sea.
High-resolution sampling of water masses, including fluorescence and particle contents, revealed unexpected heterogeneity in the central Ionian Sea. Surface salinity measurements, together with altimetry and ADCP-derived currents, describe a zonal pathway of AW entering into the Ionian Sea, consistent with the cyclonic mode of the North Ionian Gyre. The ION-Tr appears precisely located at the crossroad of three water masses, coming from the west, north and an isolated anticyclonic eddy. Water mass originating from the north carried abundant particles, probably originating from the north Ionian Sea, or further from the Adriatic Sea. Waters from the eddy were depleted in particles, and probably nutrients, and may originate from the Pelops eddy area, south of the Peloponnese. Waters from the west, carried by a strong jet, were intermediate in particle load, probably originating from the Sicily Channel, carried by AW.
A particle property signature for different water masses can be drawn (Fig. 7 and Table 2). Comparing the three water masses observed at ST7-SAV, ST8 and ION showed three distinct particle signatures in terms of vertical profile, abundance, % MEP and AI, especially for the upper (5–50 m depth) layer, which has the most contrasted particle loads. Comparing water mass salinity and temperature along ION-Tr, only two distinct water masses emerge, with ION-C different from the other two regions. In this case, particle signatures allow us to distinguish ION-E and ION-W, with distinct vertical profiles, % MEP and AI. Thus particle properties are complementary to water mass properties as they provide information on their biological history.
Even away from the coasts, the central Ionian Sea appears as a mosaic area, where waters of contrasted biological history meet. ION station is influenced by particles potentially transported from the north Ionian Sea. This contrast is probably amplified in spring, when blooming and non-blooming areas co-occur. Long-distance particle transport appears as a significant contribution to particulate matter load, together with atmospheric input.
The small-scale heterogeneity of particle abundance revealed here emphasizes the spatial decoupling between particle production and particle distribution. Such decoupling added to the time lag between production and export of particles (Stange et al., 2017) may have a large impact on assessing the efficiency of carbon export from the surface ocean (Henson et al., 2011). This also implies that neutrally buoyant particles can sustain production away from their source. Interpreting the complex dynamics of physical–biogeochemical coupling from discrete measurements made at isolated stations at sea is a challenge. The combination of multiparametric in situ measurements at high resolution with remote sensing and Lagrangian modeling appears to be one proper way to address this challenge.
Software is available on demand.
Cruise data are available at https://www.seanoe.org/data/00645/75747 (last access: 10 September 2021, Guieu et al., 2020b).
The supplement related to this article is available online at: https://doi.org/10.5194/bg-18-6377-2021-supplement.
LB carried out the conceptualization, writing and original draft preparation, and formal analysis. FSB developed software and participated in formal analysis. AD, AP, SB, BE, FLM, FC and MT all participated in formal analysis, writing, review and editing.
The contact author has declared that neither they nor their co-authors have any competing interests.
Publisher’s note: Copernicus Publications remains neutral with regard to jurisdictional claims in published maps and institutional affiliations.
This article is part of the special issue “Atmospheric deposition in the low-nutrient–low-chlorophyll (LNLC) ocean: effects on marine life today and in the future (ACP/BG inter-journal SI)”. It is not associated with a conference.
This study is a contribution to the PEACETIME project (http://peacetime-project.org; last access: 10 September 2021), a joint initiative of the MERMEX and ChArMEx components supported by CNRS-INSU, IFREMER, CEA and Météo-France as part of the decadal program MISTRALS coordinated by INSU. PEACETIME was endorsed as a process study by GEOTRACES and is also a contribution to the international IMBER and SOLAS programs. (PEACETIME cruise, https://doi.org/10.17600/17000300). Chief scientists and crew are thanked. Jean-Luc Fuda is thanked for his help on CTD calibration. We thank Dominique Lefèvre, Olivier Grosso and Gérald Grégori (MIO) for the setup and handling (DL) of the automated and continuous sea water surface sampling system. We also thank Dominique Lefèvre and Thibault Wagener for regular checks on the CytoSense flow cytometer during the cruise. Gerald Gregori contributed to the installation and uninstallation of the cytometer.
The project leading to this publication received funding from CNRS-INSU, IFREMER, CEA, and Météo-France as part of the MISTRALS program coordinated by INSU.
This paper was edited by Christine Klaas and reviewed by two anonymous referees.
Barrillon, S., Rousselet, L., Petrenko, A. A., and Doglioli, A.: Lagrangian study of the water masses dynamics at the stations of the PEACETIME cruise in the Mediterranean Sea, 7th LAPCOD Meeting, Venice, Italy, 17-21 June 2019.
Barbieux, M., Uitz, J., Mignot, A., Roesler, C., Claustre, H., Gentili, B., Taillandier, V., D'Ortenzio, F., Loisel, H., Poteau, A., Leymarie, E., Penkerc'h, C., Schmechtig, C., and Bricaud, A.: Biological production in two contrasted regions of the Mediterranean Sea during the oligotrophic period: An estimate based on the diel cycle of optical properties measured by BGC-Argo profiling floats, Biogeosciences Discuss. [preprint], https://doi.org/10.5194/bg-2021-123, in review, 2021.
Berline, L., Rammou, A.-M., Doglioli, A., Molcard, A., and Petrenko, A.: A Connectivity-Based Eco-Regionalization Method of the Mediterranean Sea, PLoS ONE, 9, e111978, https://doi.org/10.1371/journal.pone.0111978, 2014.
Blanke, B. and Raynaud, S.: Kinematics of the Pacific equatorial undercurrent: An Eulerian and Lagrangian approach from GCM results, J. Phys. Oceanogr., 27, 1038–1053, 1997.
Boldrin, A., Miserocchi, S., Rabitti, S., Turchetto, M. M., Balboni, V., and Socal, G.: Particulate matter in the southern Adriatic and Ionian Sea: characterisation and downward fluxes, J. Mar. Syst., 33, 389–410, 2002.
Briggs, N. T., Slade, W. H., Boss, E., and Perry, M. J.: Method for estimating mean particle size from high-frequency fluctuations in beam attenuation or scattering measurements, Appl. Opt., 52, 6710, https://doi.org/10.1364/AO.52.006710, 2013.
Briggs, N., Dall'Olmo, G., and Claustre, H.: Major role of particle fragmentation in regulating biological sequestration of CO2 by the oceans, Science, 367, 791–793, https://doi.org/10.1126/science.aay1790, 2020.
Casotti, R., Landolfi, A., Brunet, C., D'Ortenzio, F., Mangoni, O., d'Alcalà, M. R., and Denis, M.: Composition and dynamics of the phytoplankton of the Ionian Sea (eastern Mediterranean), J. Geophys. Res.-Oceans, 108, C9, https://doi.org/10.1029/2002JC001541, 2003.
Celentano, P., Falco, P., and Zambianchi, E.: Surface connection between the Ionian Sea and different areas of the Mediterranean derived from drifter data, Deep-Sea Res. Pt. I, 166, 103431, https://doi.org/10.1016/j.dsr.2020.103431, 2020.
Chronis, G., Lykousis, V., Georgopoulos, D., Zervakis, V., Stavrakakis, S., and Poulos, S.: Suspended particulate matter and nepheloid layers over the southern margin of the Cretan Sea (NE Mediterranean): seasonal distribution and dynamics, Prog. Oceanogr., 46, 163–185, https://doi.org/10.1016/S0079-6611(00)00017-3, 2000.
Civitarese, G., Gačić, M., Lipizer, M., and Eusebi Borzelli, G. L.: On the impact of the Bimodal Oscillating System (BiOS) on the biogeochemistry and biology of the Adriatic and Ionian Seas (Eastern Mediterranean), Biogeosciences, 7, 3987–3997, https://doi.org/10.5194/bg-7-3987-2010, 2010.
Feliú, G., Pagano, M., Hidalgo, P., and Carlotti, F.: Structure and function of epipelagic mesozooplankton and their response to dust deposition events during the spring PEACETIME cruise in the Mediterranean Sea, Biogeosciences, 17, 5417–5441, https://doi.org/10.5194/bg-17-5417-2020, 2020.
Doglioli, A. M., Nencioli, F., Petrenko, A. A., Fuda, J.-L., Rougier, G., and Grima, N.: A software package and hardware tools for in situ experiments in a Lagrangian reference frame, J. Atmos. Ocean. Tech., https://doi.org/10.1175/JTECH-D-12-00183.1, 2013.
D'Ortenzio, F. and Ribera d'Alcalà, M.: On the trophic regimes of the Mediterranean Sea: a satellite analysis, Biogeosciences, 6, 139–148, https://doi.org/10.5194/bg-6-139-2009, 2009.
d'Ovidio, F., Fernández, V., Hernández-García, E., and López, C.: Mixing structures in the Mediterranean Sea from finite-size Lyapunov exponents, Geophys. Res. Lett., 31, L17203, https://doi.org/10.1029/2004GL020328, 2004.
d'Ovidio, F., Della Penna, A., Trull, T. W., Nencioli, F., Pujol, M.-I., Rio, M.-H., Park, Y.-H., Cotté, C., Zhou, M., and Blain, S.: The biogeochemical structuring role of horizontal stirring: Lagrangian perspectives on iron delivery downstream of the Kerguelen Plateau, Biogeosciences, 12, 5567–5581, https://doi.org/10.5194/bg-12-5567-2015, 2015.
Engel, A.: Distribution of transparent exopolymer particles (TEP) in the northeast Atlantic Ocean and their potential significance for aggregation processes, Deep Sea Res. Pt. I, 51, 83–92, 2004.
Espinasse, B., Carlotti, F., Zhou, M., and Devenon, J. L.: Defining zooplankton habitats in the Gulf of Lion (NW Mediterranean Sea) using size structure and environmental conditions, Mar. Ecol. Prog. Ser., 506, 31–46, 2014.
Espinasse, B., Basedow, S., Schultes, S., Zhou, M., Berline, L., and Carlotti, F.: Conditions for assessing zooplankton abundance with LOPC in coastal waters, Prog. Oceanogr., 163, 260–270, 2018.
Gačić, M., Borzelli, G. E., Civitarese, G., Cardin, V., and Yari, S.: Can internal processes sustain reversals of the ocean upper circulation? The Ionian Sea example, Geophys. Res. Lett., 37, 2010.
Gačić, M., Civitarese, G., Eusebi Borzelli, G. L., Kovačević, V., Poulain, P.-M., Theocharis, A., Menna, M., Catucci, A., and Zarokanellos, N.: On the relationship between the decadal oscillations of the northern Ionian Sea and the salinity distributions in the eastern Mediterranean, J. Geophys. Res., 116, C12002, https://doi.org/10.1029/2011JC007280, 2011.
Giering, S. L. C., Cavan, E. L., Basedow, S. L., Briggs, N., Burd, A. B., Darroch, L. J., and Waite, A. M.. Sinking organic particles in the ocean – flux estimates from in situ optical devices, Front. Mar. Sci., 6, 834, 2020.
Guidi, L., Stemmann, L., Jackson, G. A., Ibanez, F., Claustre, H., Legendre, L., and Gorsky, G.: Effects of phytoplankton community on production, size, and export of large aggregates: A world-ocean analysis, Limnol. Oceanogr., 54, 1951–1963, 2009.
Guieu, C., D'Ortenzio, F., Dulac, F., Taillandier, V., Doglioli, A., Petrenko, A., Barrillon, S., Mallet, M., Nabat, P., and Desboeufs, K.: Introduction: Process studies at the air–sea interface after atmospheric deposition in the Mediterranean Sea – objectives and strategy of the PEACETIME oceanographic campaign (May–June 2017), Biogeosciences, 17, 5563–5585, https://doi.org/10.5194/bg-17-5563-2020, 2020a.
Guieu, C., Desboeufs, K., Albani, S., Alliouane, S., Aumont, O., Barbieux, M., Barrillon, S., Baudoux, A.-C., Berline, L., Bhairy, N., Bigeard, E., Bloss, M., Bressac, M., et al.: BIOGEOCHEMICAL dataset collected during the PEACETIME cruise, SEANOE [data set], https://doi.org/10.17882/75747, 2020b.
Henson, S. A., Sanders, R., Madsen, E., Morris, P. J., Le Moigne, F., and Quartly, G. D.: A reduced estimate of the strength of the ocean's biological carbon pump, Geophys. Res. Lett., 38, https://doi.org/10.1029/2011GL046735, 2011.
Herman, A. W., Beanlands, B., and Phillips, E. F.: The next generation of Optical Plankton Counter: the Laser-OPC, J. Plankton Res., 26, 1135–1145, 2004.
Herman, A. W. and Harvey, M.: Application of normalized biomass size spectra to laser optical plankton counter net intercomparisons of zooplankton distributions, J. Geophys. Res., 111, 1–9, 2006.
Karageorgis, A. P., Gardner, W. D., Georgopoulos, D., Mishonov, A. V., Krasakopoulou, E., and Anagnostou, C.: Particle dynamics in the Eastern Mediterranean Sea: A synthesis based on light transmission, PMC, and POC archives (1991–2001), Deep-Sea Res. Pt. I, 55, 177–202, 2008.
Karageorgis, A. P., Georgopoulos, D., Kanellopoulos, T. D., Mikkelsen, O. A., Pagou, K., Kontoyiannis, H., Kontoyianni, A., and Anagnostou, C.: Spatial and seasonal variability of particulate matter optical and size properties in the eastern mediterranean sea, J. Mar. Syst., 105, 123–134, 2012.
Kiko, R.: Marine particle size distribution dataset obtained with the Underwater Vision Profiler 5 – Part 1 (2008–2010), https://doi.pangaea.de/10.1594/PANGAEA.924374, 2020.
Laurenceau-Cornec, E. C., Le Moigne, F. A. C., Gallinari, M., Moriceau, B., Toullec, J., Iversen, M. H., Engel, A., and De La Rocha, C. L.: New guidelines for the application of Stokes' models to the sinking velocity of marine aggregates, Limnol. Oceanogr., 65, https://doi.org/10.1002/lno.11388, 2019.
Laurenceau-Cornec, E. C., Trull, T. W., Davies, D. M., Bray, S. G., Doran, J., Planchon, F., Carlotti, F., Jouandet, M.-P., Cavagna, A.-J., Waite, A. M., and Blain, S.: The relative importance of phytoplankton aggregates and zooplankton fecal pellets to carbon export: insights from free-drifting sediment trap deployments in naturally iron-fertilised waters near the Kerguelen Plateau, Biogeosciences, 12, 1007–1027, https://doi.org/10.5194/bg-12-1007-2015, 2015.
Lavigne, H., Civitarese, G., Gačić, M., and D'Ortenzio, F.: Impact of decadal reversals of the north Ionian circulation on phytoplankton phenology, Biogeosciences, 15, 4431–4445, https://doi.org/10.5194/bg-15-4431-2018, 2018.
Le Bot, P., Kermabon, C., Lherminier, P., and Gaillard, F.: Rapport technique OPS/LPO 11-01. Ifremer, Centre de Brest, France, https://www.umr-lops.fr/en/Technology/Software/CASCADE-7.2 (last access: 10 June 2020), 2011.
Le Moigne, F. A. C.: Pathways of organic carbon downward transport by the oceanic biological carbon pump, Front. Mar. Sci., 6, 634, https://doi.org/10.3389/fmars.2019.00634, 2019.
Le Moigne, F. A. C., Gallinari, M., Laurenceau, E., and De La Rocha, C. L.: Enhanced rates of particulate organic matter remineralization by microzooplankton are diminished by added ballast minerals, Biogeosciences, 10, 5755–5765, https://doi.org/10.5194/bg-10-5755-2013, 2013.
MacIntyre, S., Alldredge, A. L., and Gotschalk, C. C.: Accumulation of Marine Snow at Density Discontinuities in the Water Column, Limnol. Oceanogr., 40, 449–468, 1995.
Malanotte-Rizzoli, P., Manca, B. B., d'Alcalà, M. R., Theocharis, A., Bergamasco, A., Bregant, D., and Sansone, E.: A synthesis of the Ionian Sea hydrography, circulation and water mass pathways during POEM-Phase I, Prog. Oceanogr., 39, 153–204, 1997.
Marañón, E., Van Wambeke, F., Uitz, J., Boss, E. S., Dimier, C., Dinasquet, J., Engel, A., Haëntjens, N., Pérez-Lorenzo, M., Taillandier, V., and Zäncker, B.: Deep maxima of phytoplankton biomass, primary production and bacterial production in the Mediterranean Sea, Biogeosciences, 18, 1749–1767, https://doi.org/10.5194/bg-18-1749-2021, 2021.
Martin, P., Lampitt, R., Perry, M. J., Sanders, R., Lee, C., and D'asaro, E.: Export and mesopelagic particle flux during a North Atlantic spring diatom bloom, Deep-Sea Res. Pt. I, 58, 338–349, 2011.
Mazzocchi, M. G., Nervegna, D., D'elia, G., Di Capua, I., Aguzzi, L., and Boldrin, A.: Spring mesozooplankton communities in the epipelagic Ionian Sea in relation to the Eastern Mediterranean Transient, J. Geophys. Res.-Oceans, 108, https://doi.org/10.1029/2002JC001640, 2003.
McDonnell, A. M., Lam, P. J., Lamborg, C. H., Buesseler, K. O., Sanders, R., Riley, J. S., and Bishop, J. K.: The oceanographic toolbox for the collection of sinking and suspended marine particles, Prog. Oceanogr., 133, 17–31, 2015.
Menna, M., Suarez, N. R., Civitarese, G., Gačić, M., Rubino, A., and Poulain, P. M.: Decadal variations of circulation in the Central Mediterranean and its interactions with mesoscale gyres, Deep-Sea Res. Pt. II, 164, 14–24, 2019.
Moutin, T., Doglioli, A. M., de Verneil, A., and Bonnet, S.: Preface: The Oligotrophy to the UlTra-oligotrophy PACific Experiment (OUTPACE cruise, 18 February to 3 April 2015), Biogeosciences, 14, 3207–3220, https://doi.org/10.5194/bg-14-3207-2017, 2017.
Nardelli, B. B., Tronconi, C., Pisano, A., and Santoleri, R.: High and Ultra-High resolution processing of satellite Sea Surface Temperature data over Southern European Seas in the framework of MyOcean project, Remote Sens. Environ., 129, 1–16, 2013.
Ohman, M. D., Powell, J. R., Picheral, M., and Jensen, D. W.. Mesozooplankton and particulate matter responses to a deep-water frontal system in the southern California Current System, J. Plankton Res., 34, 815–827, 2012.
Petrenko, A., Doglioli, A. M., Nencioli, F., Kersalé, M., Hu, Z., d'Ovidio, F.: A review of the LATEX project: mesoscale to submesoscale processes in a coastal environment, Ocean Dynam., 67, 513–533, https://doi.org/10.1007/s10236-017-1040-9, 2017.
Picheral, M., Guidi, L., Stemmann, L., Karl, D. M., Iddaoud, G., and Gorsky, G.: The Underwater Vision Profiler 5: An advanced instrument for high spatial resolution studies of particle size spectra and zooplankton, Limnol. Oceanogr.-Meth., 8, 462–473, 2010.
Pinardi, N., Zavatarelli, M., Adani, M., Coppini, G., Fratianni, C., Oddo, P., and Bonaduce, A.: Mediterranean Sea large-scale low-frequency ocean variability and water mass formation rates from 1987 to 2007: A retrospective analysis, Prog. Oceanogr., 132, 318–332, 2015.
Pisano, A., Nardelli, B. B., Tronconi, C., and Santoleri, R.: The new Mediterranean optimally interpolated pathfinder AVHRR SST Dataset (1982–2012), Remote Sens. Environ., 176, 107–116, 2016.
Prairie, J. C., Ziervogel, K., Camassa, R., McLaughlin, R. M., White, B. L., Dewald, C., and Arnosti, C.: Delayed settling of marine snow: Effects of density gradient and particle properties and implications for carbon cycling, Mar. Chem., 175, 28–38, 2015.
Rabitti, S., Bianchi, F., Boldrin, A., Daros, L., Socal, G., and Totti, C. Particulate matter and phytoplankton in the Ionian Sea, Oceanol. Ac., 17, 297–307, 1994.
Ramondenc, S., Madeleine, G., Lombard, F., Santinelli, C., Stemmann, L., Gorsky, G., and Guidi, L.: An initial carbon export assessment in the Mediterranean Sea based on drifting sediment traps and the Underwater Vision Profiler data sets, Deep-Sea Res. Pt. I, 117, 107–119, 2016.
Richardson, T. L. and Jackson, G. A.: Small phytoplankton and carbon export from the surface ocean, Science, 315, 838–840, https://doi.org/10.1126/science.1133471, 2007.
Riley, J., Sanders, R., Marsay, C., Le Moigne, F. A. C., Achterberg, E., and Poulton, A.: The relative contribution of fast and slow sinking particles to ocean carbon export, Global Biogeochem. Cy., 26, https://doi.org/10.1029/2011GB004085, 2012.
Rousselet, L., Doglioli, A. M., de Verneil, A., Pietri, A., Della Penna, A., Berline, L., and Petrenko, A.: Vertical motions and their effects on a biogeochemical tracer in a cyclonic structure finely observed in the Ligurian Sea, J. Geophys. Res.-Oceans, 124, 3561–3574, 2019.
Stange, P., Bach, L., Le Moigne, F. A. C., Taucher, J., Boxhammer, T., and Riebesell, U.: Quantifying the time lag between organic matter production and export in the surface ocean: Implications for estimates of export efficiency, Geophys. Res. Lett., 44, 268–276, https://doi.org/10.1002/2016GL070875, 2017.
Stemmann, L., Jackson, G., and Gorsky, G.: A vertical model of particle size distributions and fluxes in the midwater column that includes biological and physical processes, II. Application to a three year survey in the NW Mediterranean Sea, Deep-Sea Res. Pt. I, 51, 865–884, 2004.
Von Schuckmann, K., Le Traon, P. Y., Smith, N., Pascual, A., Djavidnia, S., Gattuso, J. P., and Álvarez Fanjul, E.. Copernicus Marine Service Ocean State Report, Issue 3, J. Operat. Oceanogr., 12, 1–123, 2019.
Waite, A. M., Stemmann, L., Guidi, L., Calil, P. H., Hogg, A. M. C., Feng, M., and Gorsky, G. The wineglass effect shapes particle export to the deep ocean in mesoscale eddies, Geophys. Res. Lett., 43, 9791–9800, 2016.