the Creative Commons Attribution 4.0 License.
the Creative Commons Attribution 4.0 License.
 | 14 Dec 2021
Evaluating the dendroclimatological potential of blue intensity on multiple conifer species from Tasmania and New Zealand
Kathy Allen
Patrick Baker
Gretel Boswijk
Brendan Buckley
Edward Cook
Rosanne D'Arrigo
Dan Druckenbrod
Anthony Fowler
Margaux Grandjean
Paul Krusic
Jonathan Palmer
We evaluate a range of blue intensity (BI) tree-ring parameters in eight conifer species (12 sites) from Tasmania and New Zealand for their dendroclimatic potential, and as surrogate wood anatomical proxies. Using a dataset of ca. 10–15 trees per site, we measured earlywood maximum blue intensity (EWB), latewood minimum blue intensity (LWB), and the associated delta blue intensity (DB) parameter for dendrochronological analysis. No resin extraction was performed, impacting low-frequency trends. Therefore, we focused only on the high-frequency signal by detrending all tree-ring and climate data using a 20-year cubic smoothing spline. All BI parameters express low relative variance and weak signal strength compared to ring width. Correlation analysis and principal component regression experiments identified a weak and variable climate response for most ring-width chronologies. However, for most sites, the EWB data, despite weak signal strength, expressed strong coherence with summer temperatures. Significant correlations for LWB were also noted, but the sign of the relationship for most species is opposite to that reported for all conifer species in the Northern Hemisphere. DB results were mixed but performed better for the Tasmanian sites when combined through principal component regression methods than for New Zealand. Using the full multi-species/parameter network, excellent summer temperature calibration was identified for both Tasmania and New Zealand ranging from 52 % to 78 % explained variance for split periods (1901–1950/1951–1995), with equally robust independent validation (coefficient of efficiency = 0.41 to 0.77). Comparison of the Tasmanian BI reconstruction with a quantitative wood anatomical (QWA) reconstruction shows that these parameters record essentially the same strong high-frequency summer temperature signal. Despite these excellent results, a substantial challenge exists with the capture of potential secular-scale climate trends. Although DB, band-pass, and other signal processing methods may help with this issue, substantially more experimentation is needed in conjunction with comparative analysis with ring density and QWA measurements.
- Article
(15726 KB) - Full-text XML
- BibTeX
- EndNote


The range of variables that are now routinely measured from the rings of trees, including width, stable isotopes, multiple wood anatomical properties, and density, has increased substantially in recent years (McCarroll et al., 2002; McCarroll and Loader, 2004; Drew et al., 2012; von Arx et al., 2016; Björklund et al., 2020). However, our knowledge of the climatic, environmental, and physiological processes that modulate the year-to-year variability of these different tree-ring parameters is still far from comprehensive.
Since the early seminal work of Fritts et al. (1965), a well-known rule of thumb for dendroclimatology based on ring width (RW) is that trees sampled near their high-elevation or latitude treelines will be predominantly temperature limited, while at lower elevations or latitudes, moisture limitation becomes the primary driver of growth (Fritts, 1976; Kienast et al., 1987; Buckley et al., 1997; Wilson and Hopfmüller 2001; Briffa et al., 2002; Babst et al., 2013; St. George, 2014). Such targeted sampling is strategically vital in “traditional” dendroclimatology, and robust reconstructions can be derived so long as tree-line sites are sampled where a single dominant climate parameter controls growth (Bradley, 1999). However, the climatic influence on RW can be complex, and there are many published studies where the relationship between RW and climate is shown to be temporally unstable and/or non-linear (Wilmking et al., 2020).
Ring density parameters, especially maximum latewood density (MXD), have been shown to provide substantially more robust estimates of past summer temperature compared to RW (Briffa et al., 2002; Wilson and Luckman, 2003; Esper et al., 2012; Büntgen et al., 2017; Ljungqvist et al., 2019). Density data may also retain a strong temperature signal at elevations below the upper treeline, minimizing the non-linear influence of a changing tree-line elevation through time (Kienast et al., 1987). The use of ring-density variables from lower elevation or latitude sites to reconstruct past hydroclimate is rare (Camarero et al., 2014, 2017; Cleaveland, 1986; Seftigen et al., 2020) and is clearly an area demanding further attention.
The reconstructive value of tree ring stable isotopes (carbon and oxygen) appears to be less constrained for sites where climate does not limit growth and substantial potential exists from mid-latitude regions where traditional dendroclimatological approaches are less reliable (McCarroll and Loader, 2004; Loader et al., 2008, 2020; Young et al., 2015; Büntgen et al., 2021). However, within the mechanistic framework of stable isotopes, there is still much to explore regarding the complex associations between fractionation and climate for different species and across different ecotones.
The use of quantitative wood anatomical (QWA) parameters for dendroclimatology has gained traction in recent years due to improvements in measurement methodologies allowing for the development of well-replicated chronologies for multiple different anatomical variables (Drew et al., 2012; von Arx et al., 2016; Prendin et al., 2017; Björklund et al., 2020). The strength of relationships between climate parameters and wood anatomical properties such as latewood cell wall thickness, tracheid radial diameter, and microfibril angle is comparable to and can be stronger than maximum latewood density (Yasue et al., 2000; Wang et al., 2002; Panyushkina et al., 2003; Fonti et al., 2013; Allen et al., 2018).
Despite the strong climate signal often noted in such non-RW tree-ring parameters, their procurement is expensive, often requires specialized equipment and experience, and is time consuming. Consequently, there are substantially less published data available for inspection and assessment. In recent years, blue intensity (BI) has been championed by many groups as a cheaper surrogate for maximum latewood density (Björklund et al., 2014a, b; Rydval et al., 2014; Wilson et al., 2014; Kaczka and Wilson, 2021). In its common usage, BI measures the intensity of the reflectance of blue light from the latewood of scanned conifer samples so that a dense (dark) latewood would result in low-intensity values. MXD and BI essentially measure similar wood properties. Most studies that have directly compared MXD and latewood BI show no significant difference in the climate response of the two parameters (Wilson et al., 2014; Björklund et al., 2019; Ljungqvist et al., 2019; Reid and Wilson 2020). Though the acceptance of BI in dendrochronology was initially slow after the publication of the original concept paper (McCarroll et al., 2002), over the past decade many BI-based studies have been published (Kaczka and Wilson 2021). These studies have examined the use of BI as an ecological and climatological indicator in a variety of conifer species from several locations around the Northern Hemisphere (Campbell et al., 2007, 2011; Helama et al., 2013; Rydval et al., 2014, 2017, 2018; Björklund et al., 2014a, b; Wilson et al., 2014, 2017a, 2017b, 2019; Babst et al., 2016; Dolgova, 2016; Arbellay et al., 2018; Buras et al., 2018; Fuentes et al., 2017; Kaczka et al., 2018; Wiles et al., 2019; Harley et al., 2021; Heeter et al., 2020; Reid and Wilson 2020; Davi et al., 2021).
Only three studies that utilize BI data south of 30∘ N have been published. Buckley et al. (2018) explored the potential of reflectance parameters from the tropical conifer Fujian cypress (Fokienia hodginsii) from central Vietnam and found a significant positive relationship between earlywood maximum BI and December–April maximum temperature. Although a spring–early summer temperature signal is extant in Northern Hemisphere conifer minimum density data from temperature limited sites (Björklund et al., 2017), correlations are generally not as strong as the earlywood results detailed by Buckley et al. (2018). In the Southern Hemisphere, Brookhouse and Graham (2016) measured latewood BI from Errinundra plum-pine (Podocarpus lawrencei) samples taken from the Australian Alps and identified a strong inverse () relationship with August–April maximum temperatures, suggesting substantial potential for this species if long-lived specimens could be found. Finally, Blake et al. (2020) explored the climate signal in BI parameters measured from silver pine (Manoao colensoi) samples growing on New Zealand's South Island and found strong significant relationships between both earlywood and latewood BI parameters and summer temperatures. Although the sign (positive) of the earlywood BI relationship with temperature agreed with results detailed in other studies (Björklund et al., 2017; Buckley et al., 2018), the latewood relationship was inverse to that detailed for Northern Hemisphere conifers (Briffa et al., 2002) and observed by Brookhouse and Graham (2016). This difference in latewood response begs the intriguing question as to whether some Southern Hemisphere conifers may have evolved differently from their Northern Hemisphere counterparts, resulting in a different anatomical and physiological response to climate.
Here we expand upon the pilot studies of Brookhouse and Graham (2016) and Blake et al. (2020) and explore the climate signal of BI parameters from several key conifer species from Tasmania and New Zealand. To minimize nomenclature confusion, we refer to the different BI parameters as earlywood blue intensity (EWB) and latewood blue intensity (LWB). Based on ecophysiological theory (Buckley et al., 2018) we posit that EWB, derived from maximum intensity values of the whole-ring reflectance spectrum, essentially provides a surrogate for mean lumen size of the earlywood cells, while LWB, derived from minimum reflectance values, reflects the relative density (i.e. the proportion of cell wall to lumen area) of the darker latewood cell walls. We further suggest that these reflectance measures are useful surrogate measures of mean tracheid diameter and cell wall thickness, which are proven to be excellent proxies of past climate (Allen et al., 2018; Björklund et al., 2019) but are laborious and expensive to measure directly. As well as undertaking a dendroclimatic assessment of multiple BI parameters from different Australasian conifers, our analysis will also identify which species would be a good focus for further BI and QWA measurement in the future. Improving terrestrially based estimates of past temperature in the land-limited Southern Hemisphere (Neukom et al., 2014) will only be achieved by enhancing the strength of the calibrated signal that until recently has been characterized solely by ring-width data which generally express a weak temperature signal.
Table 1Chronology information for the seven Tasmanian and five New Zealand sites used in the study (see Fig. 1).
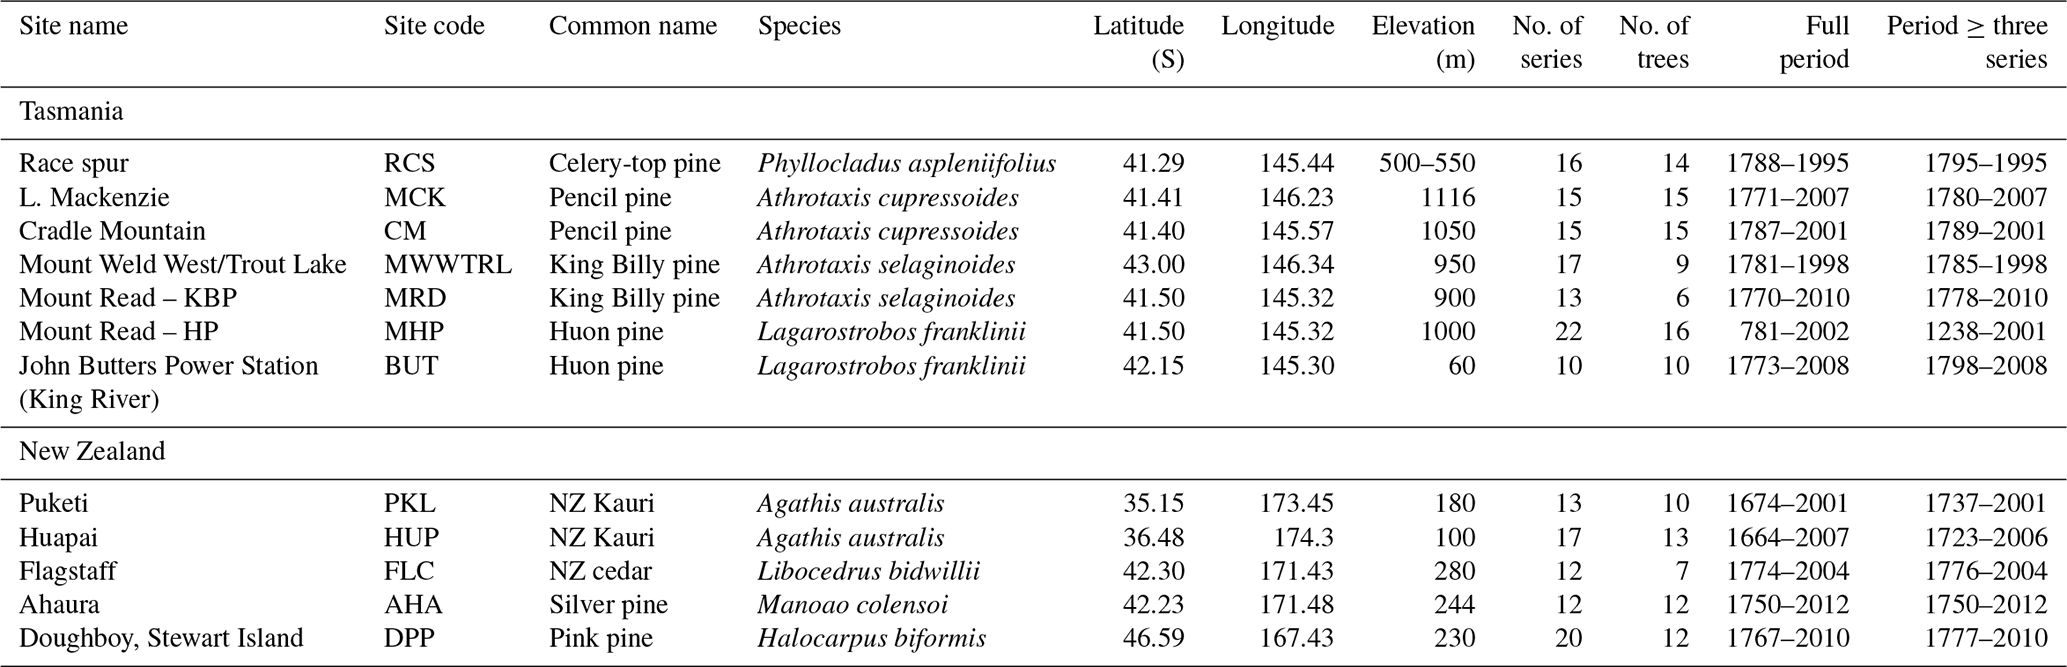
Four tree species from Tasmania and four from New Zealand were targeted for analysis (Fig. 1, Table 1) representing conifer species that not only have been the focus of previous dendrochronological studies, but each also has the potential to produce climate proxy records substantially greater than 1000 years in length. Until recently, RW data were used for most Australasian dendroclimatological studies, with calibration results never exceeding 40 %–45 % explained variance. In Tasmania, the strongest calibration results for summer temperatures had been obtained using high-elevation Huon pine (Lagarostrobos franklinii – Buckley et al., 1997; Cook et al., 2006), although some coherence was also found for pencil pine (Athrotaxis cupressoides) and King Billy pine (Athrotaxis selaginoides – Allen et al., 2011, 2017). The study sites (Table 1) for pencil pine (MCK and CM) and King Billy pine (MWWTRL and MRD) are located close to the upper timberline limit of these species, and growth is expected to be controlled mostly by summer temperatures. Likewise, the high-elevation Huon pine (MHP) site is also close to the upper treeline where summer temperature is the dominant response (Buckley et al., 1997). However, BUT is located at the lower end of the Huon pine elevational range within a riparian environment, so temperature limitation is unlikely in a traditional sense. However, Drew et al. (2012) identified strong summer temperature signals in latewood QWA data for this site. Celery-top (Phyllocladus aspleniifolius) RW data, however, express a complex non-linear relationship with climate along its species' elevational range and have not been used for dendroclimatic reconstruction (Allen et al., 2001). By contrast, summer temperature calibration experiments performed on measurement series of several wood anatomical properties (e.g. tracheid radial diameter, cell wall thickness, and microfibril angle), as well as RW and ring density, from these same species, have shown substantial improvement over RW alone (Allen et al., 2018), although these QWA data have been more useful for hydroclimate reconstructions (Allen et al., 2015a, b). In New Zealand, RW-based summer temperature reconstructions have been developed from NZ cedar (Libocedrus bidwillii – Palmer and Xiong, 2004), silver pine (Manoao colensoi – Cook et al., 2002, 2006), and pink pine (Halocarpus biformis – D'Arrigo et al., 1996, Duncan et al., 2010), although ring density (Xiong et al., 1998 – pink pine) and BI (Blake et al., 2020 – silver pine) measured from the earlywood have produced stronger results. For this study, we specifically measured BI from samples used in previous, mostly RW-based dendroclimatic, studies where summer temperature was found to be the dominant climate signal – at least for NZ cedar, silver pine, and pink pine. The sites for these three New Zealand species are close to their southern (latitudinal) limits (especially the Stewart Island pink pine site), which is thought to compensate, to some degree, for their modest elevational range (Table 1). Kauri (Agathis australis) is the longest-lived tree species in Australasia (Boswijk et al., 2014), but only a few sites of reasonably mature trees exist. Previous analyses have identified a complex mixed response to both temperature and precipitation through the growing season (Buckley et al., 2000; Fowler et al., 2000). However, it is notable that Kauri RW data express a strong stable relationship with indices of the El Niño–Southern Oscillation (Cook et al., 2006; Fowler et al., 2012).
In this study, we utilized tree cores sampled over the past 3 decades that have been prepared for RW measurement. Considering the focus of this study is to assess the potential of BI parameters for enhancing dendroclimatic reconstruction, and the fact that the samples were already mounted, no resin extraction was performed except for the silver pine AHA site (see Blake et al., 2020, for details). As many of the species are resinous by nature, this immediately imposes a potential problem for measuring BI data, because any inhomogeneous resin-related discolouration will impact intensity values (Rydval et al., 2014; Björklund et al., 2014a, b; Wilson et al., 2017b; Reid and Wilson 2020). Consequently, as the high-frequency signal will only be minimally affected by discolouration (Wilson et al., 2017a), all analyses for this proof-of-concept study will utilize only the high-pass fraction of the chronologies.
The mounted samples were re-sanded using fine grade (> 600 grit) sandpaper to remove decadal markings. Samples were scanned at multiple institutions using different scanners and a range of resolutions from 1200 to 3200 DPI. RW and BI data were generated using CooRecorder (Maxwell and Larson, 2021) except for AHA (WinDENDRO – see Blake et al., 2020). Regardless of image resolution, the CooRecorder BI generation “window” was set to roughly equate to two-thirds width of the sample while the window depth encompassed either the latewood or earlywood for each ring. The BI data were extracted following the method detailed in Buckley et al. (2018). For LWB, mean reflectance values were taken from the lowest 15 % of the darkest pixels, while for EWB the mean of the brightest 85 % of the pixels was used. Despite many of the samples being substantially older, most samples were measured only back into the 17th or 18th centuries (with site MHP (Table 1) being an exception), providing enough data to ensure robust calibration and validation over the instrumental period and to allow comparison with a temperature reconstruction from Tasmania based on QWA data (Allen et al., 2018). Parameters generated for analysis were RW, EWB, and LWB. As the study focuses only on the high-frequency signal extant in the tree-ring data, the LWB data were not inverted as is the norm in Northern Hemisphere studies using data generated in CooRecorder (Rydval et al., 2014).
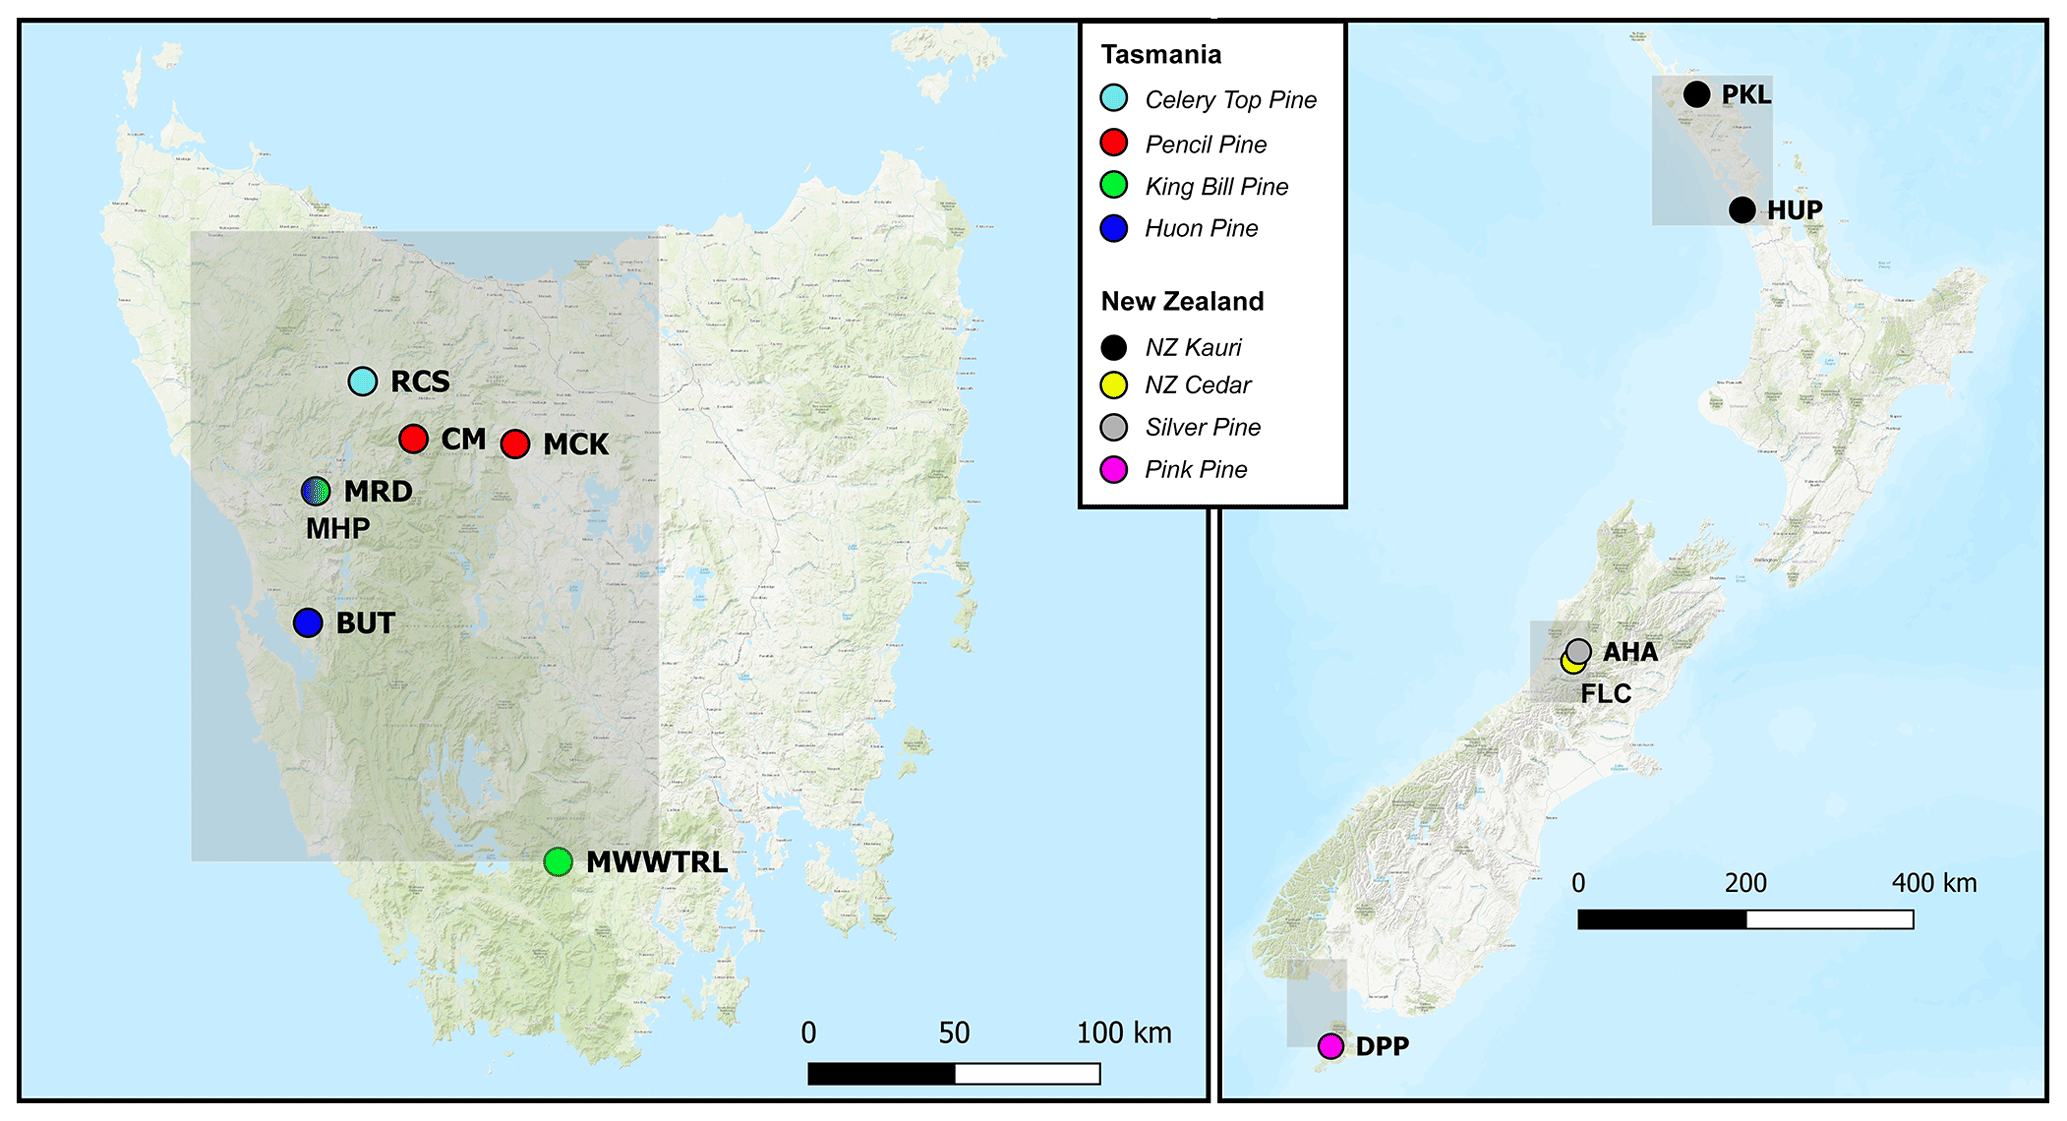
Figure 1Location map (basemap ESRI 2021) of the tree-ring sites used in this study (see Table 1). Also indicated (grey boxes) are the regional domains of the gridded CRUTS 4.03 temperature and precipitation data (Harris et al., 2014) used for analyses. Tasmania: 41–43∘ S, 145–147∘ E; New Zealand: north: 35–37∘ S, 173–175∘ E; central: 42–43∘ S, 171–172∘ E; south: 46–47∘ S, 167–168∘ E.
Perhaps the greatest limitation for BI data parameters is that any colour changes that do not represent year-to-year changes in wood anatomical features such as lumen size and cell wall thickness will impose a colour-related bias in the intensity measurements. Examples of non-anatomically related colour changes are those associated with the heartwood–sapwood transition, sections of highly resinous wood, or decay-associated discoloration. Björklund et al. (2014) proposed a statistical procedure that could correct for such colour changes. This procedure subtracts the LWB reflectance value from the EWB data, producing a delta parameter (hereafter referred to as delta BI – DB). Theoretically, DB should correct for common colour change biases between heartwood and sapwood and even resinous zones within the wood. To date, DB has been utilized successfully in only a few studies (Björklund et al., 2014a, b; Wilson et al., 2017b; Fuentes et al., 2017; Blake et al., 2020; Reid and Wilson, 2020). As no resin extraction was performed (except site AHA, Table 1) and all the species used for this study express a colour change from heartwood to sapwood, DB data will also be examined to explore its high-frequency dendroclimatic potential.
For some of the studied species, the heartwood–sapwood transition colour change is very sharp and pronounced in reflectance values (Fig. A1), and inflexible detrending options could impose a systematic bias in the resultant detrended indices. As an extreme example, the heartwood–sapwood transition of the EWB raw mean non-detrended chronology for the CM pencil pine site (Fig. A2) cannot be tracked well with cubic smoothing splines (Cook and Peters, 1981) of 200, 100, or even 50 years respectively. This is not surprising given that the smoothing spline, operating as a symmetric digital filter, is not well suited for dealing with abrupt changes in time series such as that observed in the CMewb chronology. In fact, the bias of low (pre-transition) and high (post- transition) index values is only minimized when a flexible 20-year spline is used because it better adapts to the observed discontinuity. However, this adaptability comes at the cost of losing potentially valuable > 20-year variability in the time series. This is clearly undesirable, and better ways of modelling and removing such discontinuities without the unwanted loss of lower-frequency variability are needed (see later discussion). Although less flexible splines could be used for other species with a gradual or minimal colour change from heartwood to sapwood (Fig. A1), a consistent approach to detrending was deemed prudent, and therefore a 20-year spline was used for all datasets.
The mean inter-series correlation statistic (RBAR) is utilized to assess how many series are needed to attain an expressed population signal value of 0.85 (Wigley et al., 1984; Wilson and Elling, 2004). Previous research has shown that the common signal expressed by BI data can be rather weak (Wilson et al., 2014, 2017a, b, 2019; Kaczka et al., 2018; Wiles et al., 2019). We explore this phenomenon further with this multi-parameter–species network by using the coefficient of variation to help understand relative internal variance and covariance of the parameter chronologies.
The climate signal expressed in the individual chronologies was initially explored using simple correlation analysis against monthly gridded (see Fig. 1 for locations) CRUTS 4.03 temperature and precipitation data (Harris et al., 2014) for the periods 1902–1995, 1902–1950, and 1951–1995. Although the CRUTS data start in 1901, 1902 was the initial start year as correlations were performed over 20 months including the previous growing season while 1995 reflects the final common year for all tree-ring datasets (Table 1). The climate data were similarly detrended as the tree-ring data to ensure consistency. Unsurprisingly, as most of the study sites are located in temperature-limited upper tree-line locations, correlations with monthly precipitation were weak, variable, and temporally unstable for all species–parameter chronologies. The results are presented in the Appendix but are not discussed further (see Table A4a–d).
Principal component analysis (PCA) was used on varying subsets of chronologies for each region (i.e. all chronologies of the same parameter, or all parameters from a single species) to reduce the data to a few modes of common variance. Principal components that had both an eigenvalue > 1.0 and correlated significantly (95 % C.L.) with the target instrumental data were entered into a stepwise multiple regression and calibrated against a range of seasonal temperatures. For New Zealand, the three CRUTS 4.03 grid boxes (Fig. 1) were averaged to create a countrywide mean series. This was justified as the three inter-grid boxes mean correlation value between all tested seasons was 0.93 (SD = 0.01), suggesting there is a strong common temperature signal between North Island and southern South Island. PCA was also utilized to ascertain the optimal season for dendroclimatic calibration using the full chronology network for each country as well as exploring seasonal differences between parameters and species. Analyses were performed over the common period of all tree-ring and climate data (1901–1995) as well as early (1901–1950) and late (1951–1995) period calibration and verification. The coefficient of efficiency (CE – Cook et al., 1994) was used to validate the regression-based climate estimates.
3.1 Chronology variability and signal strength
Wilson et al. (2014), using upper tree-line temperature-sensitive spruce samples from British Columbia, noted lower mean coefficient of variation (CV) values for LWB (0.05) compared to RW (0.28) and MXD (0.19). Common signal strength was strongest for the MXD data (RBAR = 0.42) while RW and LWB expressed similar but lower values (0.30). For the Australasian detrended data, overall, RW data express higher relative variance (mean CV = 0.13) followed by DB (0.07), LWB (0.03), and EWB (0.02 – Fig. 2a). The range in values for RW (0.09–0.17) and DB (0.04–0.13) is greater than LWB (0.02–0.06), although there is overlap in the range of DB and LWB. The EWB data express a significantly narrower range (0.01–0.02). RBAR values for the four different parameter groups generally return a stronger common signal for RW (mean = 0.33) compared with EWB (0.14), LWB (0.16), and DB (0.15 – Fig. 2b). Therefore, following traditional methodologies to assess signal strength, more BI series are needed than RW to attain a robust chronology. On average across all sites, to attain an EPS value of at least 0.85 (Wigley et al., 1984), 14 series would be needed for RW, while 44, 47, and 58 series would be needed for EWB, LWB, and DB respectively. This weaker common signal of the BI parameters has been noted before (Wilson et al., 2014, 2017a, b, 2019; Kaczka et al., 2018; Wiles et al., 2019; Blake et al., 2020) and is also noted in QWA data from Tasmania (Allen et al., in preparation). The common signal is particularly weak for Celery-top and Kauri (EWB) and pink pine and Kauri (LWB and DB – see Table A1 for detailed values).
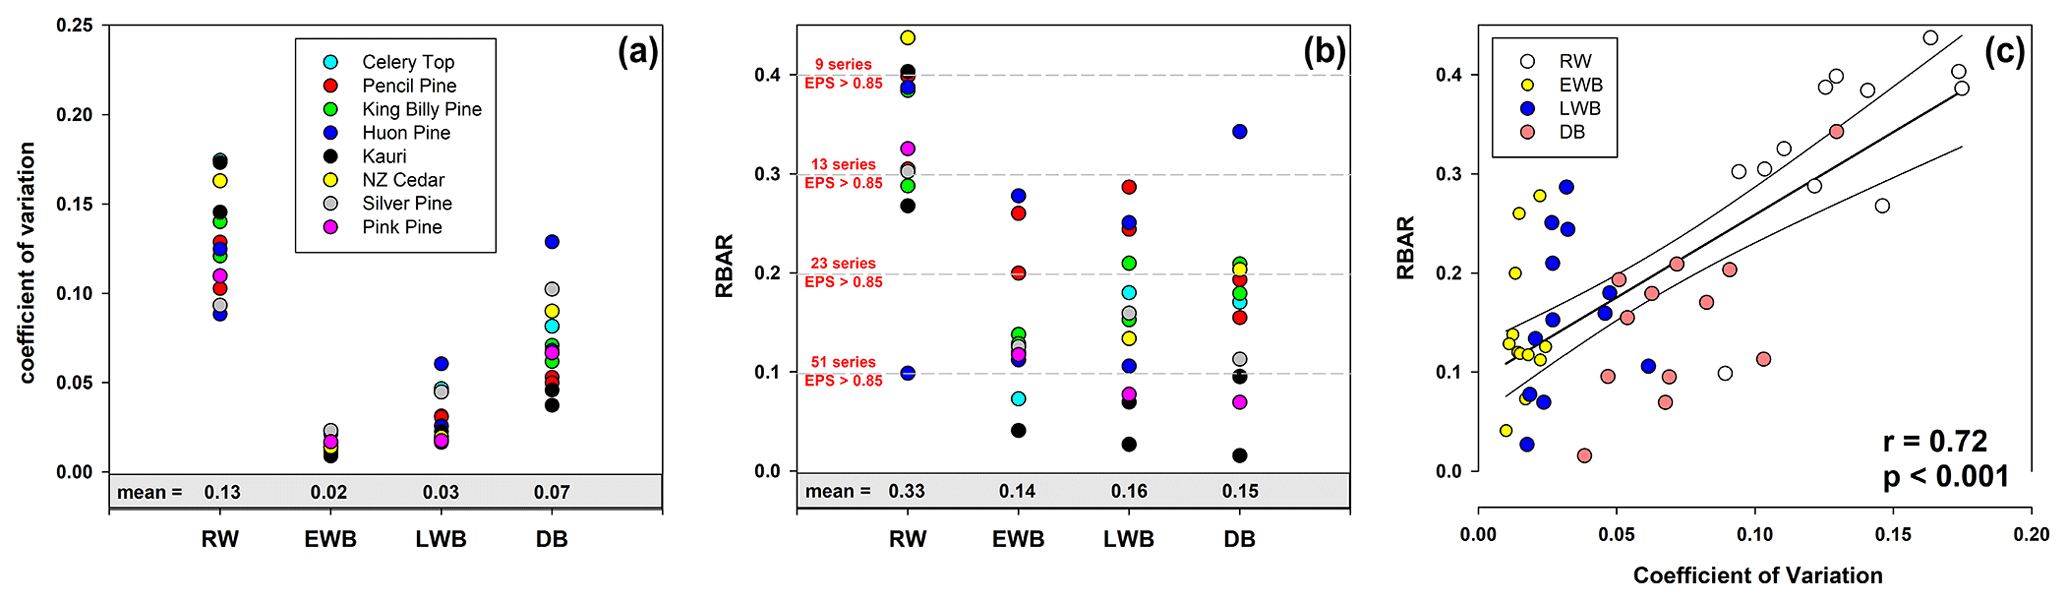
Figure 2(a) Coefficient of variation (CV) of the 20-year spline detrended chronologies; (b) mean inter-series correlation (RBAR) of the 20-year spline detrended series. Horizontal dashed lines denote the number of series needed for that particular RBAR value to attain an EPS of 0.85; (c) scatter plot of CV versus RBAR with linear regression.
A scatter plot of the CV and RBAR data (Fig. 2c) suggests that the common signal expressed by these chronologies is partly a function of the relative variance of the time series (r=0.72, p<0.001). Although the range in RBAR values for the EWB and LWB data suggests some uncertainty in this observation (see also Table A1), these results imply that the relatively low variation in values around the mean for the BI parameters suggests that any anomalous colour staining on the wood that does not reflect the true wood properties being measured could have a substantial impact on the common chronology signal. However, it should be emphasized that a weak common signal and low EPS value does not necessarily result in a weak climate signal (Buras, 2017).
3.2 Climate response
The strength of correlations between the RW chronologies and mean monthly temperatures vary in sign and strength across species. Over the full 1902–1995 period (Table 2), the Tasmanian MWWTRL (King Billy pine) and MHP (high-elevation Huon pine) sites express significant positive correlations with September–February and January–February respectively, which are broadly time stable (Table A3a). RCS (celery-top pine), MCK (pencil pine), and MRD (King Billy pine) show inverse correlations with late summer temperatures of the previous year. Of the New Zealand sites, PKL (Kauri) has negative correlations for many months from winter through to the summer, while AHA (silver pine) and DPP (pink pine) correlate positively with December–April and September–November.
Correlations between the EWB chronologies and mean temperatures are surprisingly consistent for most sites, although correlations for RCS (celery-top pine) and BUT (low-elevation Huon pine) are weak. Almost all site chronologies correlate positively with the summer months for the current season – December through to March (Tasmania) and December–February (New Zealand). The King Billy pine and Kauri sites (MMWTRL, MRD, PKL, and HUP) express narrower response windows while DPP (pink pine) is wider (Table 2). Although these relationships appear generally time stable, the Tasmanian sites correlate more strongly with the narrower January–February season for 1902–1950 compared to the later post-1951 period (Table A3b). Significant correlations with winter and prior year temperatures are weaker and less consistent than for current spring–summer. Overall, the consistent and strong correlations of EWB with summer temperatures are extremely encouraging and show great promise for enhancing RW-based temperature reconstruction for both regions.
Significant relationships between LWB and summer and early Autumn temperatures are generally noted, although the results are less consistent than those for EWB. Both RCS (celery-top) and high-elevation Huon pine (MHP) express negative correlations that are in line with the positive MXD–temperature relationships noted in the Northern Hemisphere as the LWB data are not inverted. Excluding MMWTRL (King Billy pine) and HUP (Kauri), which do not have any significant correlations with temperature in the growing season, all the LWB chronologies express positive correlations with summer and early autumn temperatures. This antithetic behaviour is not a new observation and has been noted by Drew et al. (2012), O'Donnell et al. (2016), and Blake et al. (2020) for latewood anatomical parameters and LWB data, but these new results suggest that this physiological phenomenon is not based on a chance occurrence of a single species and is consistent between several Australasian conifer tree species (pencil pine, Huon pine (low elevation), Kauri, NZ cedar, silver pine, and pink pine). Blake et al. (2020) explained the inverse LWB relationship as a reduction in the duration of secondary cell wall thickening in warmer years. Such surprising “emergent” results (Cook and Pederson, 2011) clearly need further research and testing.
Table 2Correlation response function analysis results for the different tree-ring parameter chronologies with CRUTS temperatures. Analysis undertaken over the 1902–1995 period (see Fig. S3 for correlations for split periods 1902–1950, 1951–1995). The upper block is for the Tasmanian sites, while the lower block is New Zealand. See Table 1 for site code names and species. Black dots denote correlation significant at the 95 % confidence limit.
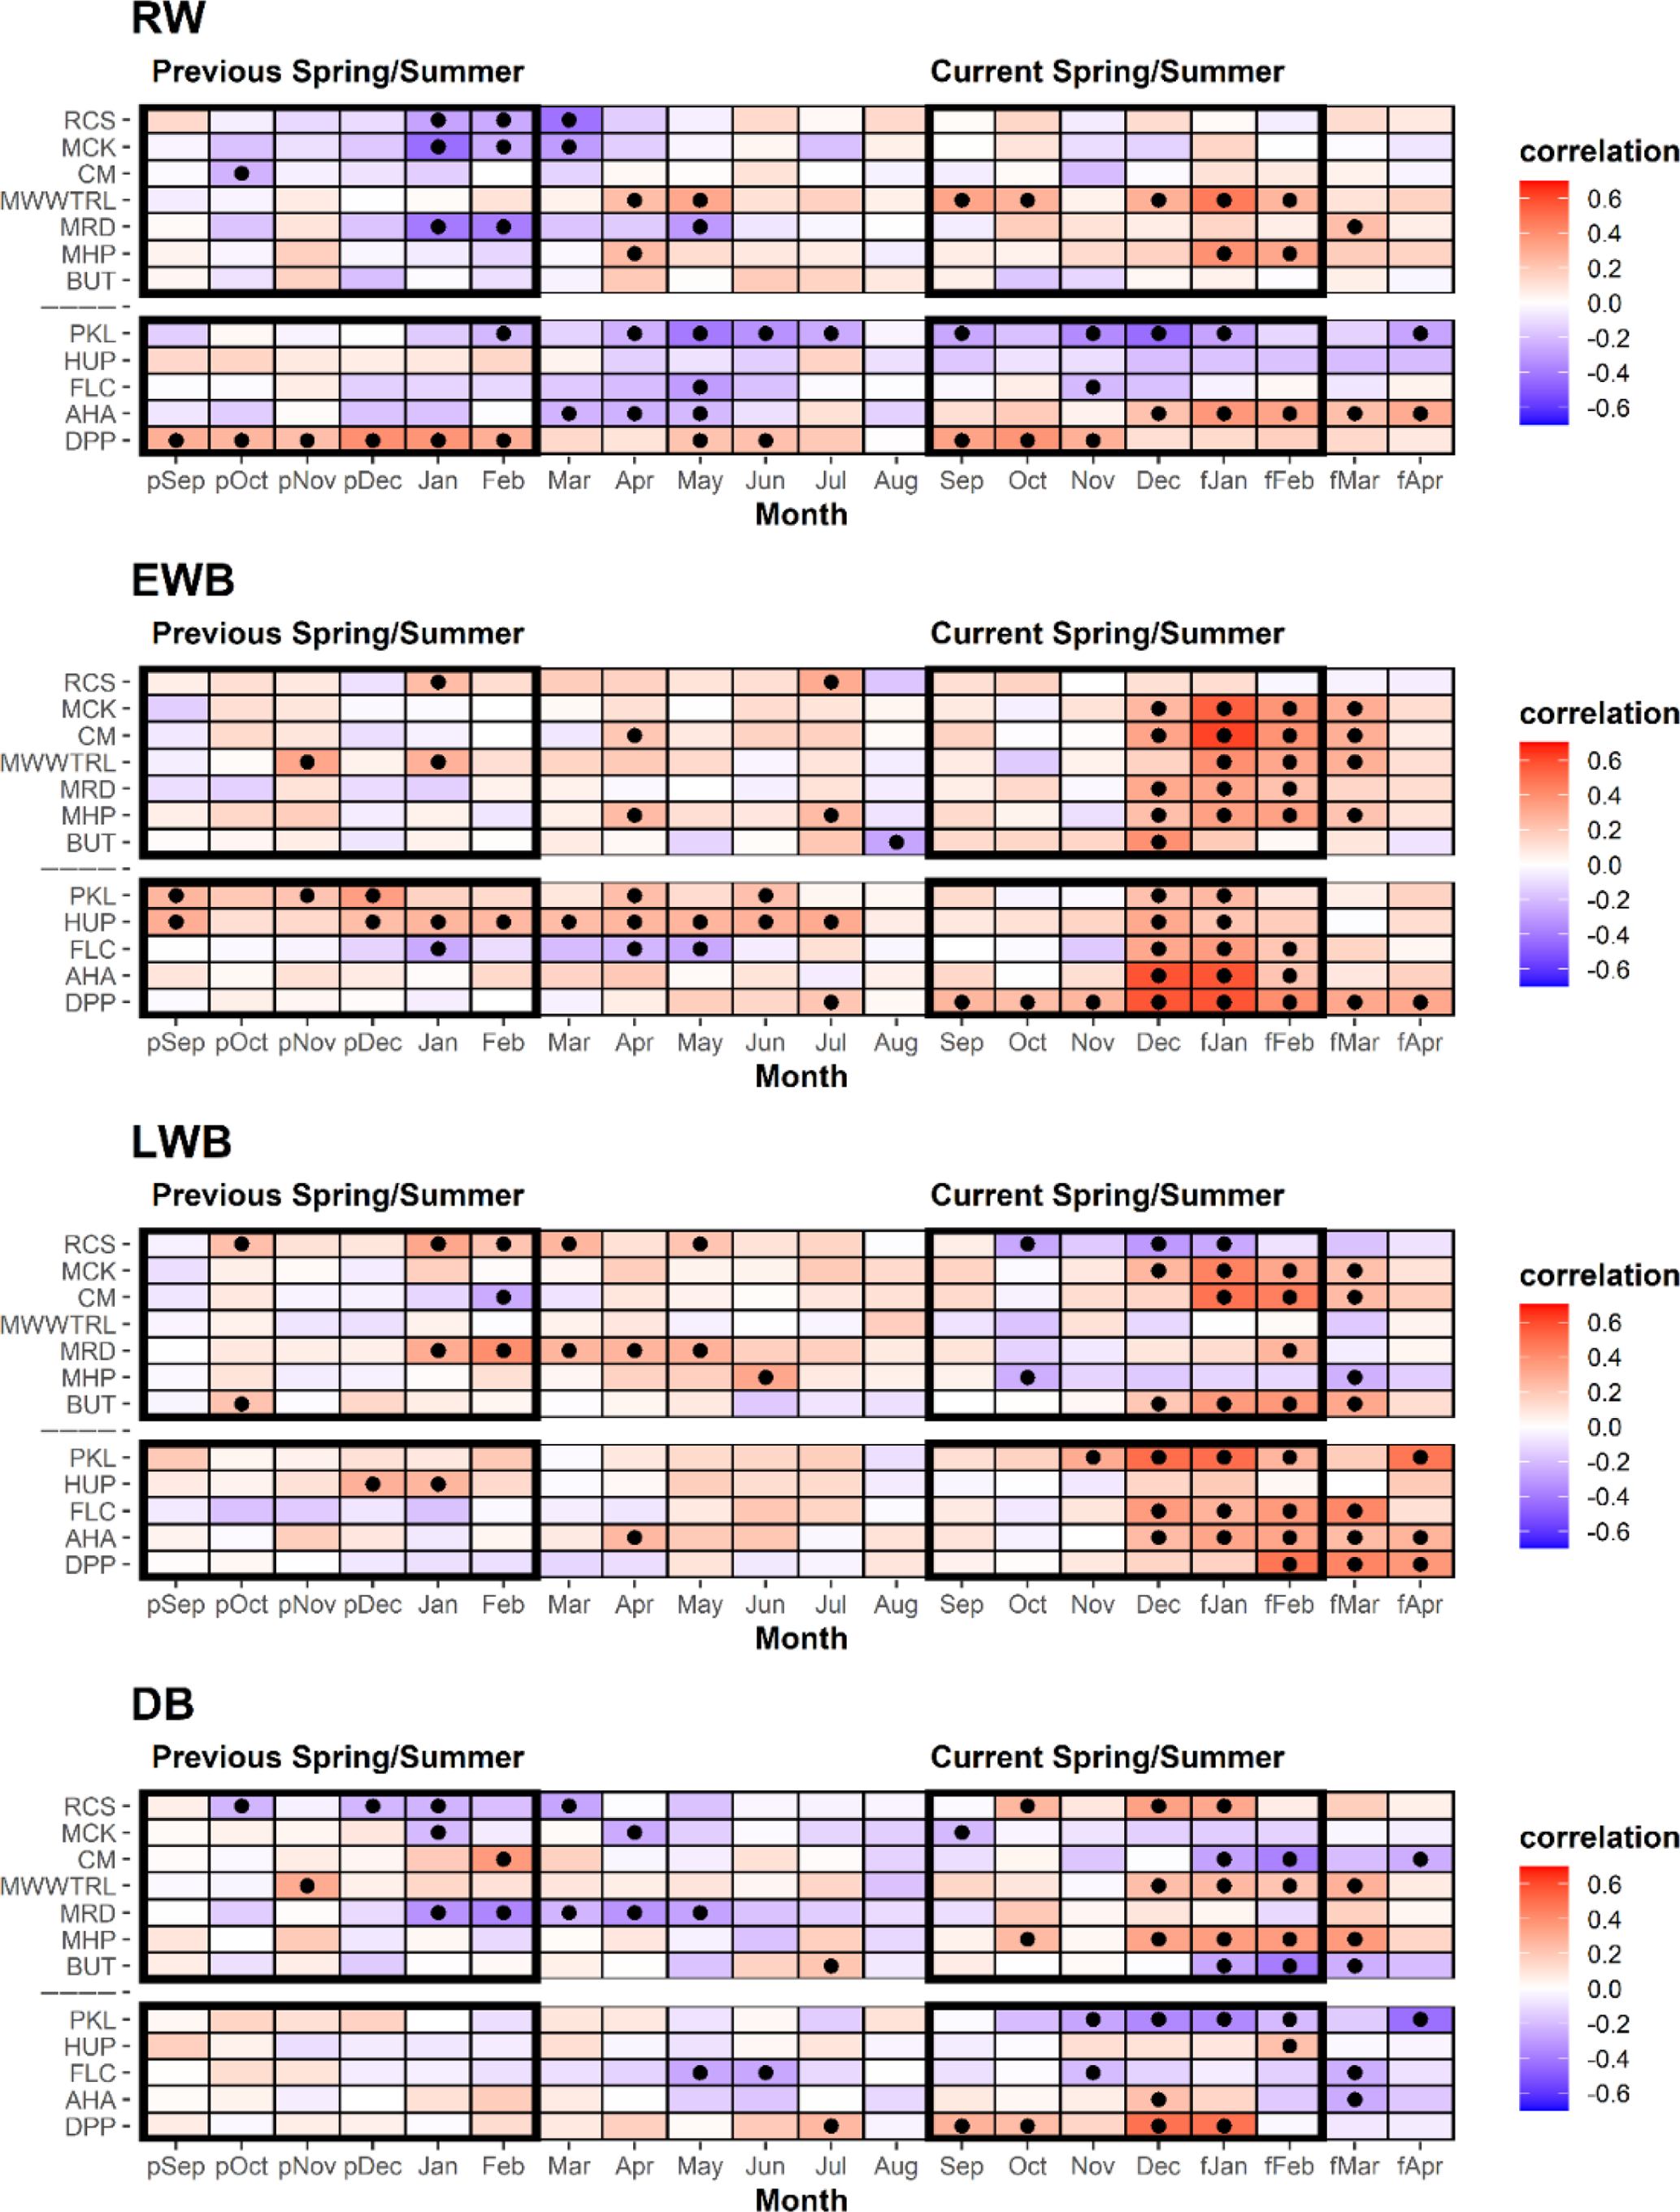
The DB chronologies express a range of responses to temperature that are all generally weaker than for EWB and LWB (Table 2). Significant positive correlations with summer temperatures are found for RCS (celery-top), MMWTRL (King Billy pine), MHP (Huon pine), and DPP (pink pine). HUP (Kauri) and AHA (silver pine) also express some weak positive summer temperature coherence. Negative correlations are noted for CM (pencil pine), BUT (low elevation Huon pine), PKL (Kauri), and FLC (NZ cedar). However, many of these correlations are not temporally stable when compared over the 1902–1950 and 1951–1995 periods (Table A3d). Current theory suggests that DB should perform well when EWB and LWB parameters are weakly correlated and express different earlier and later seasonal climate responses (Björklund et al., 2014). However, the results herein indicate that this simple hypothesis does not consistently apply in this multi-species study. For example, the EWB and LWB data for the pink pine DPP site express different early (September–April) and late (February–April) seasonal responses with temperatures (Table 2), but they still show a reasonably high inter-parameter correlation (0.60, Table A2), although this is partly expected as the response windows overlap. However, the DB data still express a significant and strong response with summer temperatures, although marginally weaker than the EWB response. On the other hand, DB for the pencil pine sites (MCK and CM) behaves more like conifers in the Northern Hemisphere (Björklund et al., 2014; Wilson et al., 2017b), with significant correlations noted for both EWB and LWB with summer temperatures, but, likely due to the high inter-parameter correlation (0.57 and 0.68), the DB data express weak or even inverse correlations with summer temperatures. Overall, the DB results are mixed and disappointing. This parameter theoretically could minimize the colour bias of the darker to lighter colour heartwood–sapwood transition (Fig. A1), but, for the data used herein, as the high-frequency signal often portrays a mixed or weak signal with temperature, it suggests that the DB parameter might not be a valid approach to address the heartwood–sapwood transition bias. These results suggest that alternative approaches to using DB may need to be explored to minimize the impact of the heartwood–sapwood change noted in most of the species used in this study.
3.3 Parameter and species-specific principal component calibration tests
The previous section detailed that temperature is the predominant climate signal expressed across the Tasmanian and New Zealand RW and BI data studied herein (Figs. 3, A3a–d). Only weak coherence with precipitation was found (Table A4a–d). To further explore the climate response, principal component regression calibration (1901–1995) experiments with seasonal temperature were performed to ascertain which combination of BI parameters and species express the strongest climate signal and therefore should be the focus for future research – including refined BI measurement and/or QWA measurement.
For Tasmania, the PCA identifies three (RW), two (EWB), two (LWB), and two (DB) principal components. Each BI parameter PC regression explains > 40 % of the temperature variance while RW is substantially weaker at 21 % (Fig. 3a). Both EWB and LWB explain 43 % of the December–February and January–March variance respectively – these seasons being biologically logical with respect to the earlier seasonal start for EWB and later end for LWB. Despite the site-specific DB data correlating with temperature more weakly than EWB and LWB (Table 2), their multivariate combination calibrates better (48 %) with January–March temperatures. Although this is an encouraging result as DB may theoretically correct for colour-related biases, the mix of positive and negative zero-order correlations with temperature (Table 2) suggests that some caution will be needed if such data are used to capture more secular-scale information.
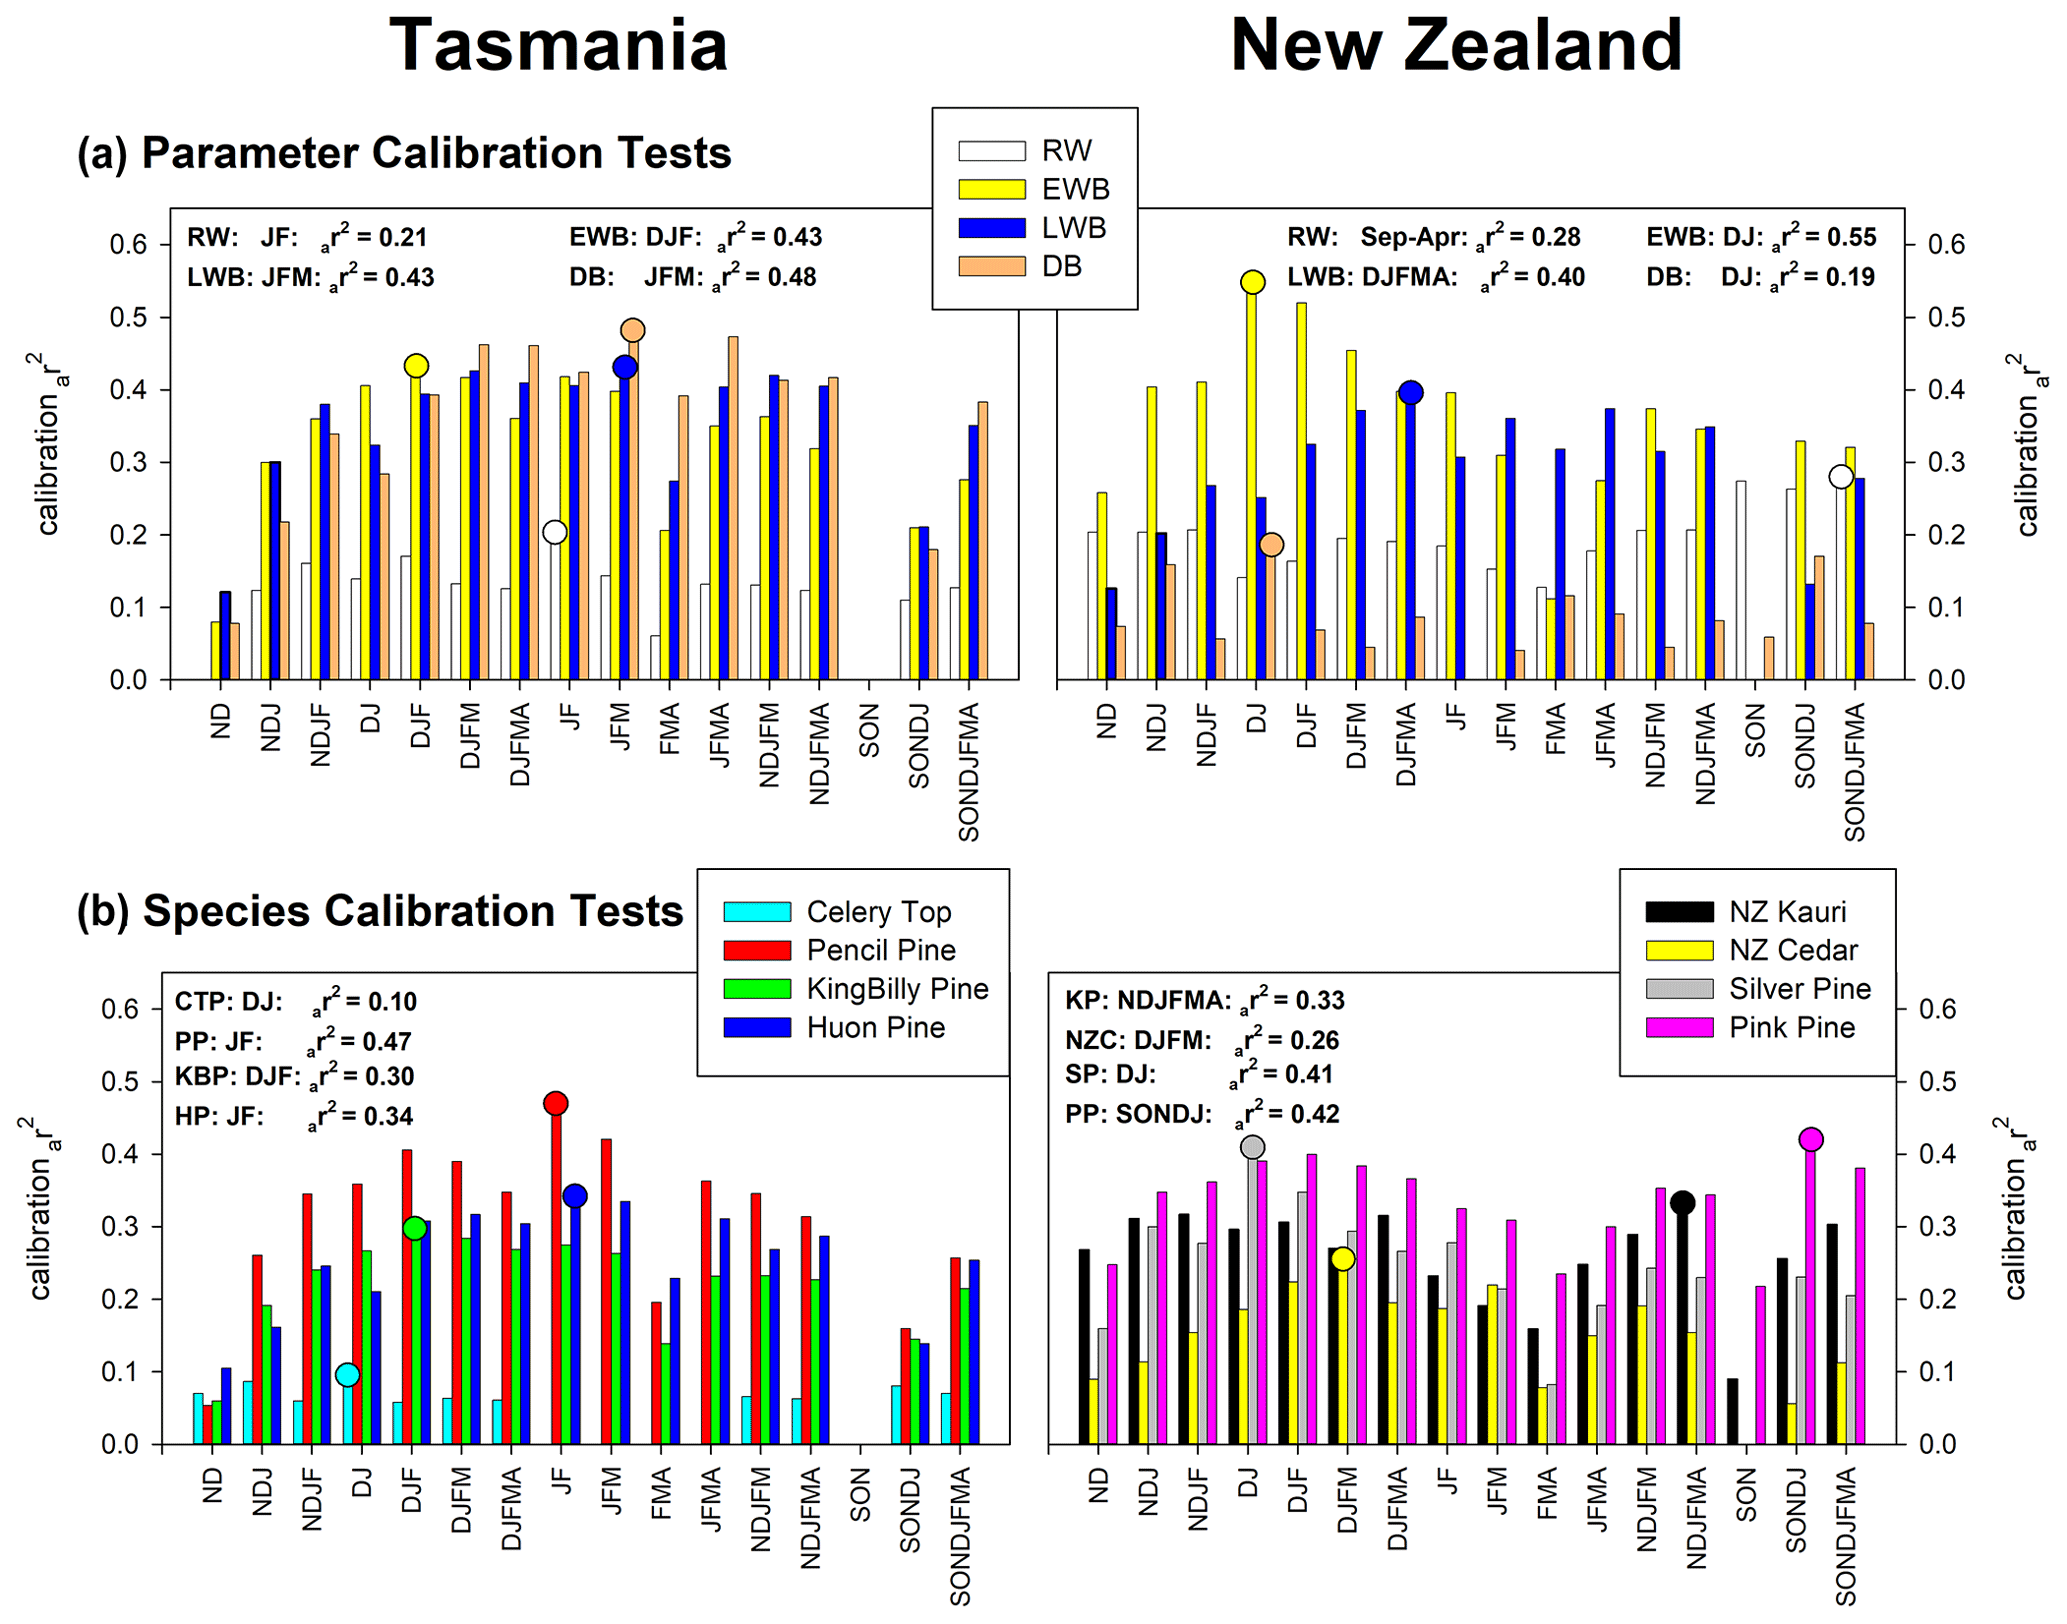
Figure 3PC regression calibration (1901–1995) experiments for parameters (all species) (a) and species (all variables) (b). A range of temperature seasonal targets are used, with the strongest seasonal calibrations highlighted with circles.
For New Zealand, PCA identifies three, two, two, and three significant principal components for RW, EWB, LWB, and DB respectively. EWB calibrates very strongly (55 %) with December–January temperatures while LWB explains 40 % of the broader December–April season (Fig. 3a). Alone, RW explains 28 % of the temperature variance but for a broad September–April season which reflects the variable site-specific responses of PKL, AHA, and DPP (Table 2). The DB data calibrate poorly, explaining only 19 % of the December–January temperature variance.
Of all the species tested, Tasmanian pencil pine returns the strongest calibration (47 %) with January–February temperatures (Fig. 3b), although New Zealand silver pine and pink pine also calibrate reasonably with 41 % (December–January) and 42 % (September–January). It should be noted that two pencil pine sites were used (Table 1) compared to only one each for silver pine and pink pine, which likely will influence these results. King Billy pine, Huon pine, and Kauri explain 30 % (December–February), 34 % (January–February), and 33 % (November–April) respectively of the temperature variance, with New Zealand cedar still showing some reasonable coherence (26 %) for December–March. Celery-top pine is the weakest species, explaining only 10 % of the December–January temperature variance.
3.4 Region-wide calibration and validation
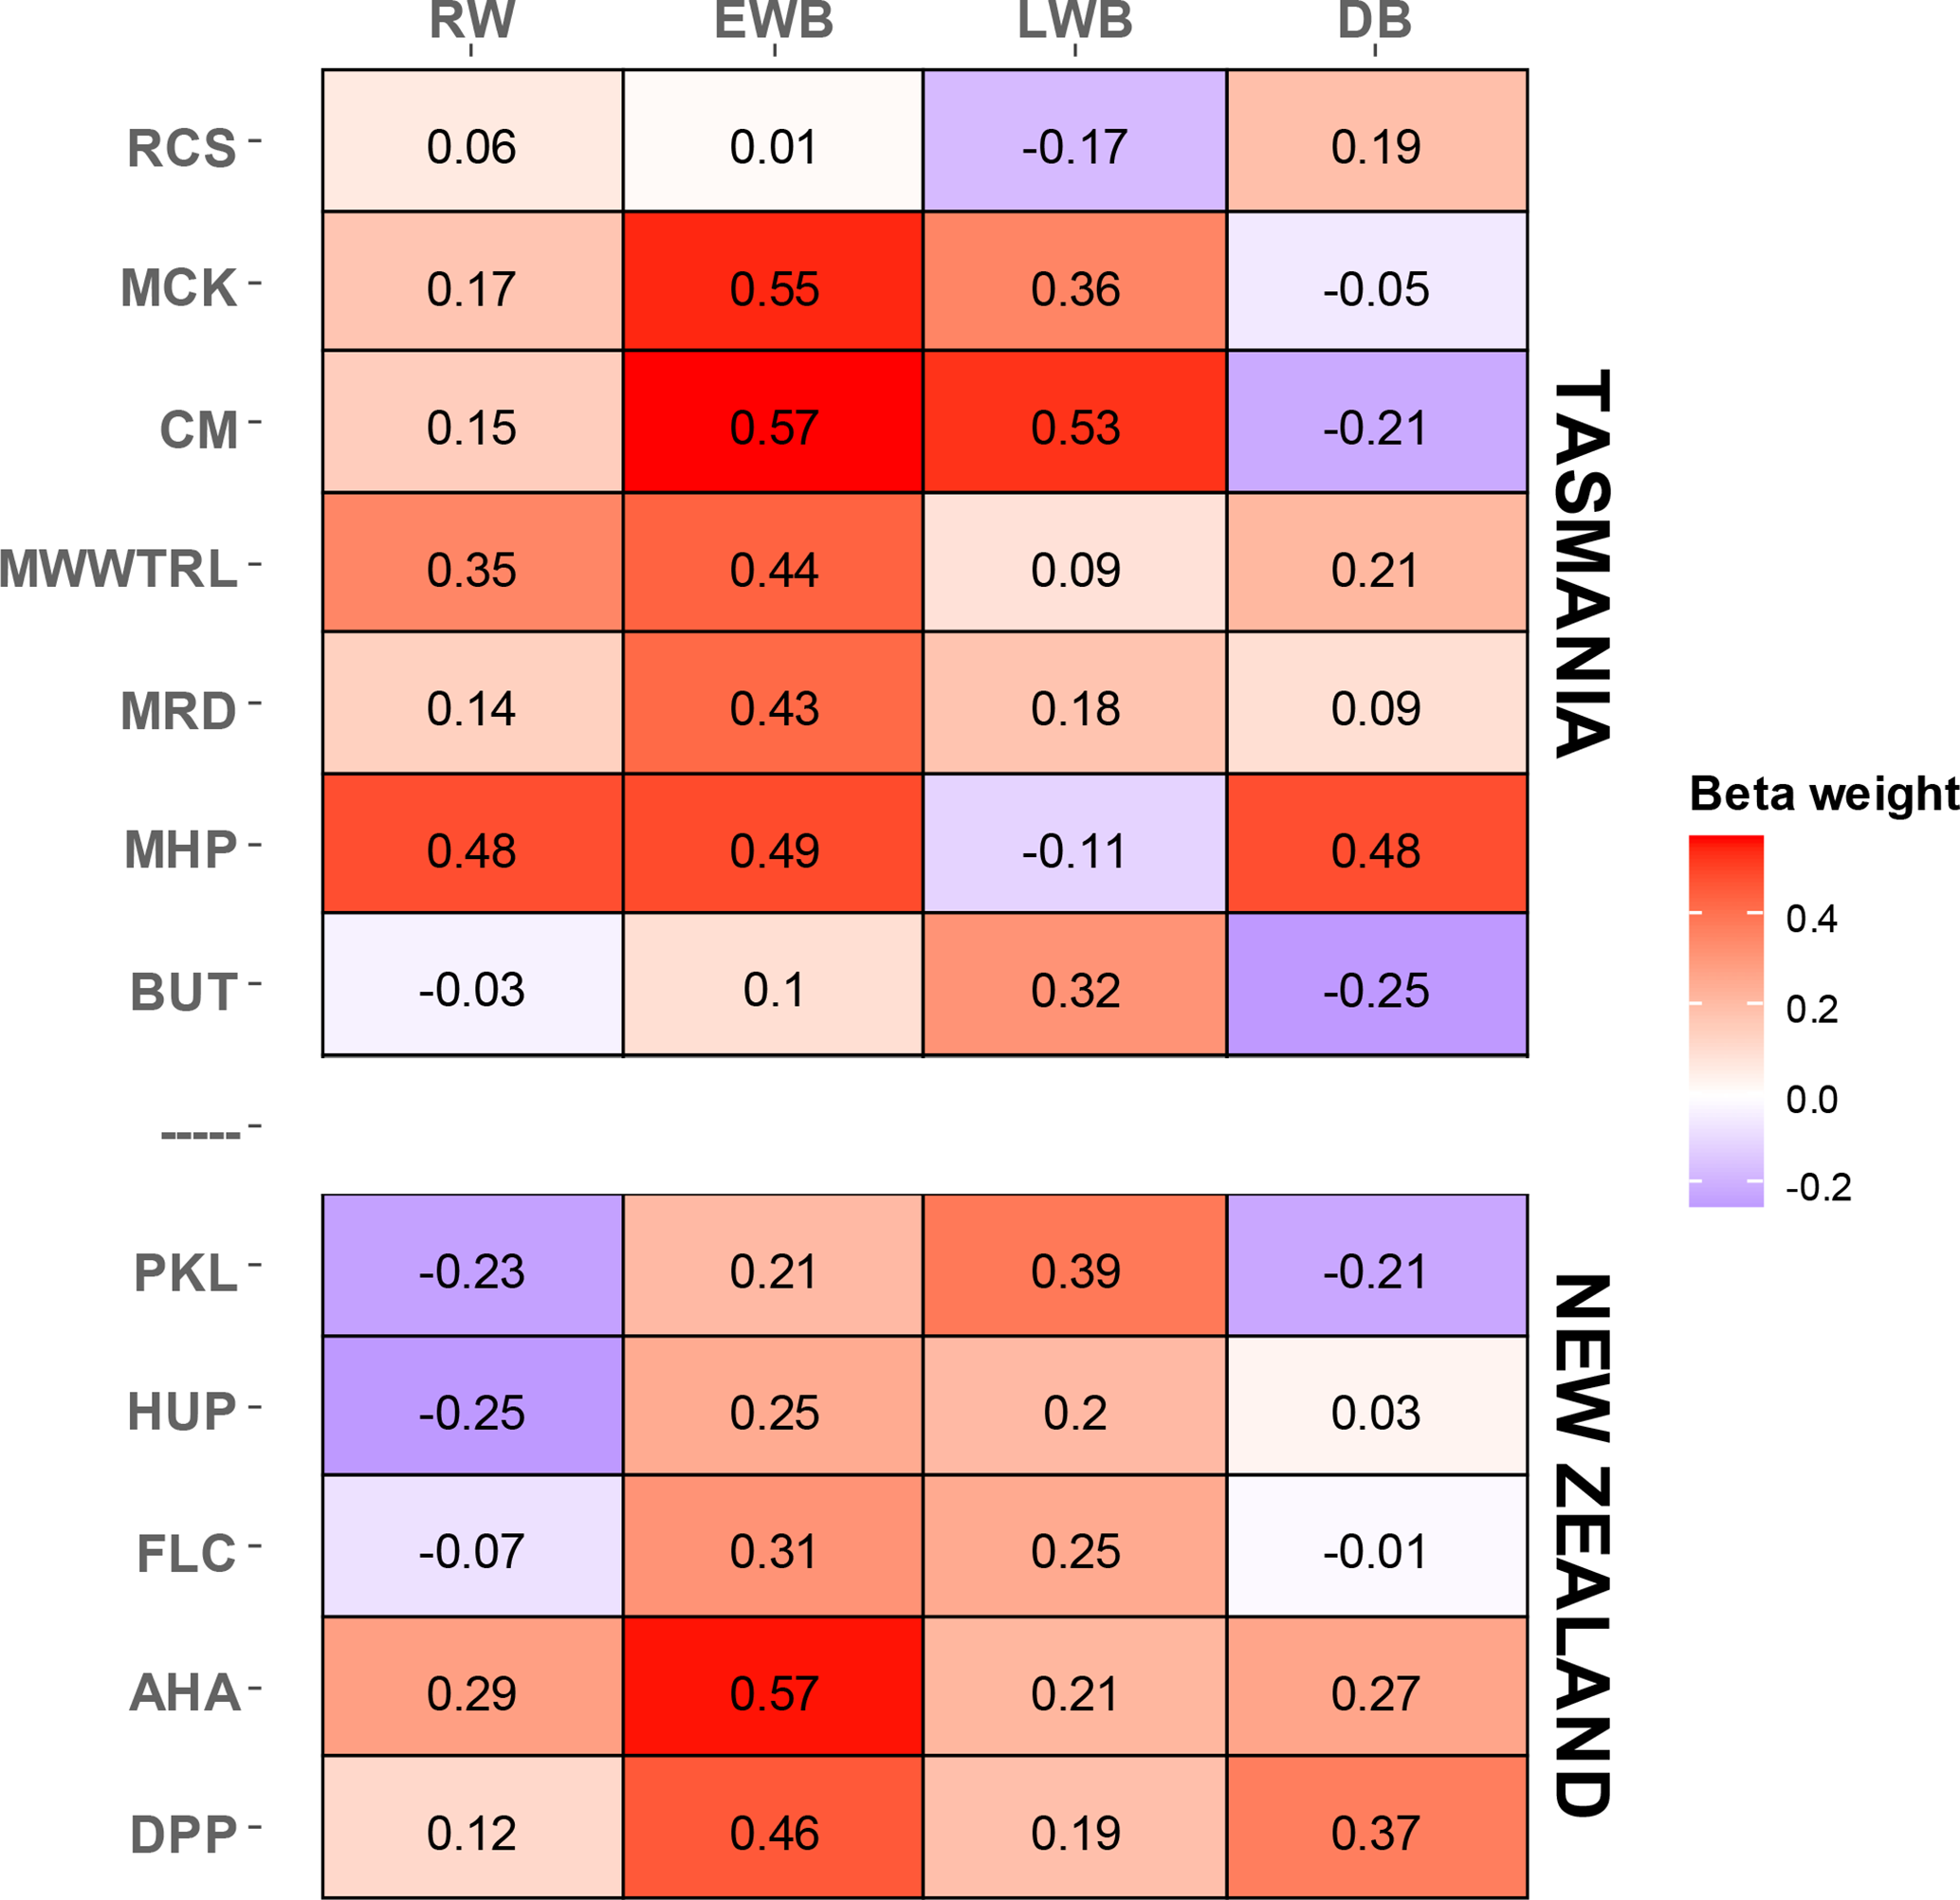
A multi-site, multi-species approach to dendroclimatology can improve overall calibration even if some of the sampled sites and species are not located close to climate-limited treeline ecotones (Alexander et al., 2019). Herein we have an opportunity to pool all the data for each country to create combined multi-species and multi-parameter regional reconstructions. As the optimal season for calibration varies as a function of species and parameter (Fig. 3), initial PC regression experiments, using all chronologies from each of the two regions, were performed. For each of these models, all PCs with an eigenvalue > 1.0 were entered into the regression model. January–February (JF) temperature was identified as the overall optimal season for Tasmania while December–January (DJ) provided the strongest calibration for New Zealand. Forcing all variables into the PC regression model also provides an opportunity to identify the importance of each species parameter towards the development of regional reconstructions. The beta weights (Cook et al., 1994) from the regression modelling (Table 3) clearly show the strong influence of the EWB parameters in the multiple regression model, especially from pencil pine (MCK and CM) and silver pine (AHA), although strong beta weights are also noted for King Billy pine (MDR), Huon pine (MHP), and pink pine (DPP). Other parameters that provide useful information in the modelling are RW (King Billy pine (MWWTRL) and Huon pine (MHP)), LWB (pencil pine (MCK, CM), Huon pine (BUT) and Kauri (PKL)), and DB (Huon pine (MHP) and pink pine DPP)). These results are consistent with the correlation response function analysis (Table 2), but it must be emphasized that the results shown in Table 3 are related to specific seasons (JF for Tasmania and DJ for New Zealand) and may not reflect the optimal season for individual species or parameters (Fig. 3).
Table 3PC regression calibration (1901–1995) beta weights using all parameter and species data. The Tasmanian modelling was performed against January–February temperatures while New Zealand was with December–January.
For the final countrywide calibration and validation experiments, three PC regression approaches were used, each reflecting more stringent screening procedures: (1) as already detailed above – all data entered into PCA and PCs with an eigenvalue > 1.0 that correlated significantly (95 %) with the instrumental target were entered as possible candidates into a stepwise multiple regression; (2) same as (1) but chronologies were initially screened for significant correlation with the full-period instrumental target before PCA; (3) similar to previous variants, but significant consistent correlations between the chronologies and the instrumental target for both the 1901–1950 and 1951–1995 periods were required.
For Tasmania, the initial 28 parameter chronologies were reduced to 17 and 10 via the two more stringent screening procedures while the 20 initial chronologies from New Zealand were reduced to 13 and 7 (Fig. 4). Full-period (1901–1995) calibration is excellent for all versions, with the Tasmanian variants 1 and 2 expressing 63 %–64 % of the JF temperature variance, reducing to 55 % for variant 3. The New Zealand data return similarly good results, with 61 %–64 % of the DJ temperature variance being explained by all variants. Split period calibration and validation are equally good for all variants, with the Tasmanian variants explaining 52 %–65 % of the variance for all early–late period calibration while CE ranges from 0.49–0.61. Similar results are obtained for New Zealand with calibration-adjusted r2 (ar2) and CE values ranging from 0.53–0.78 and 0.43–0.77 respectively. For both countries, calibration and validation are marginally stronger for the later 1951–1995 period, which might suggest some degree of uncertainty in the instrumental period in the early part of the 20th century.
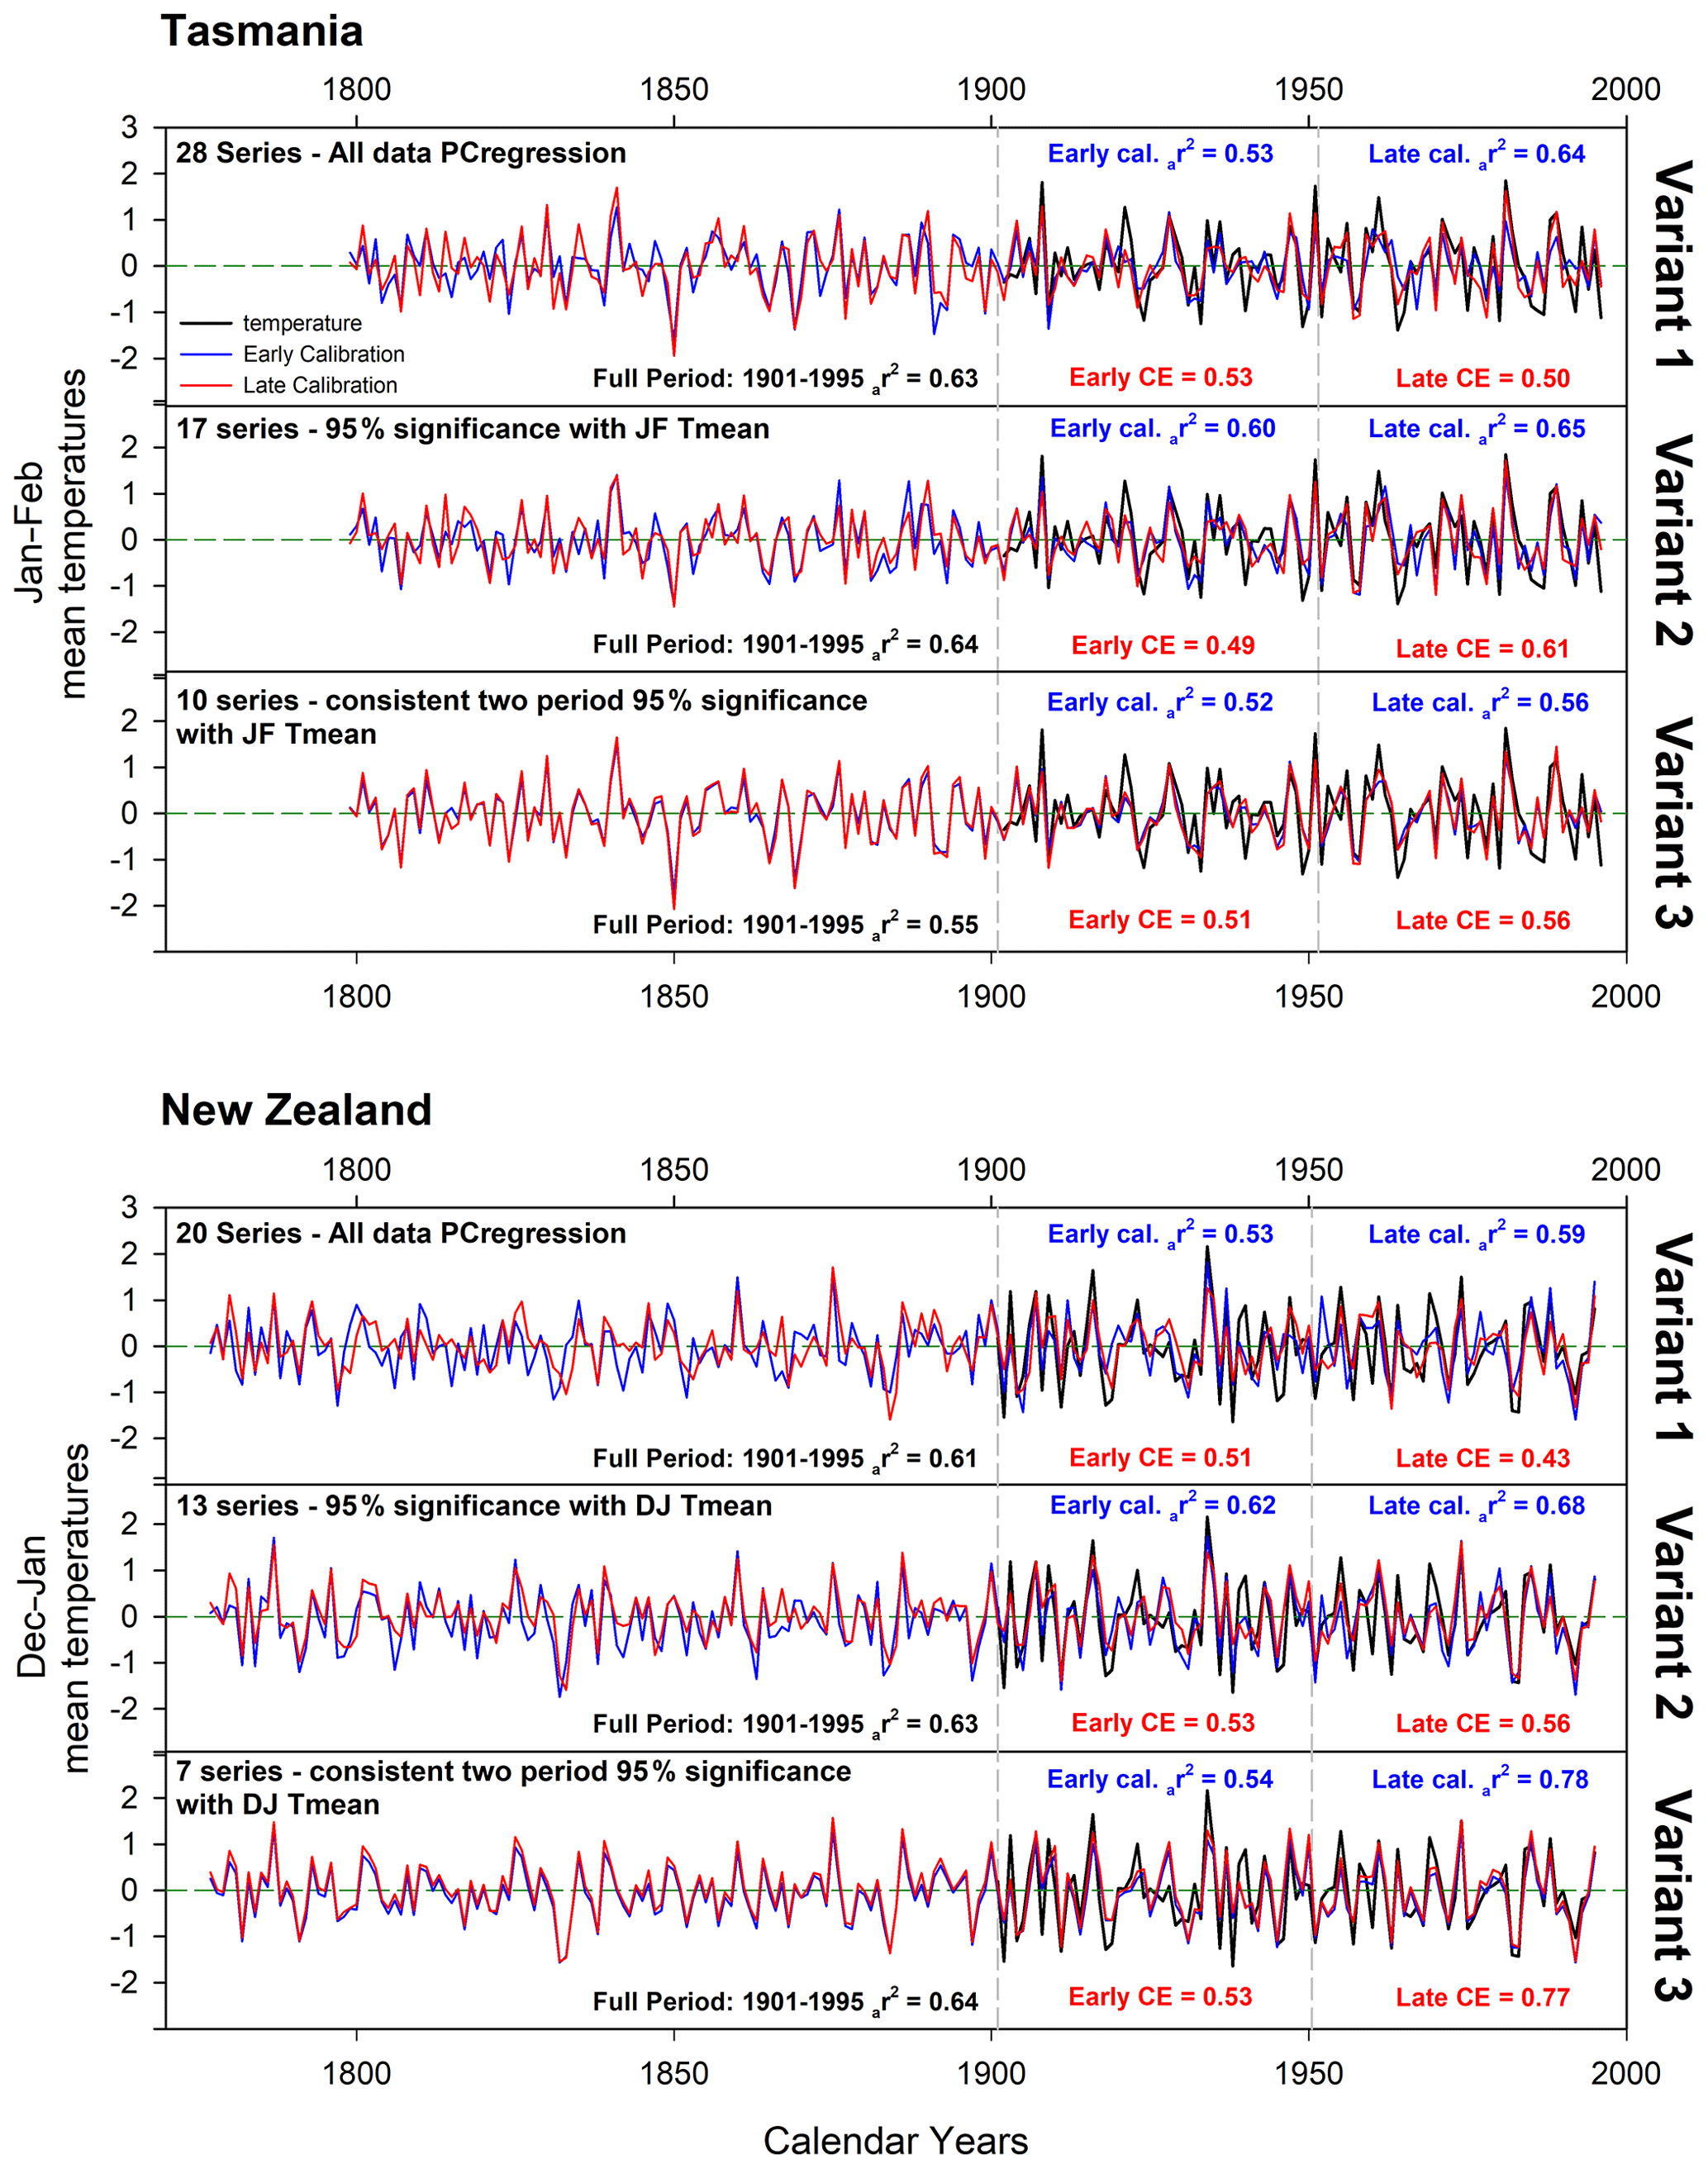
Figure 4Principal component regression results using all data (variant 1), full-period (1901–1995) screened data (variant 2), and two-period screening (variant 3). Split period calibration and validation were performed over 1901–1950 and 1951–1995.
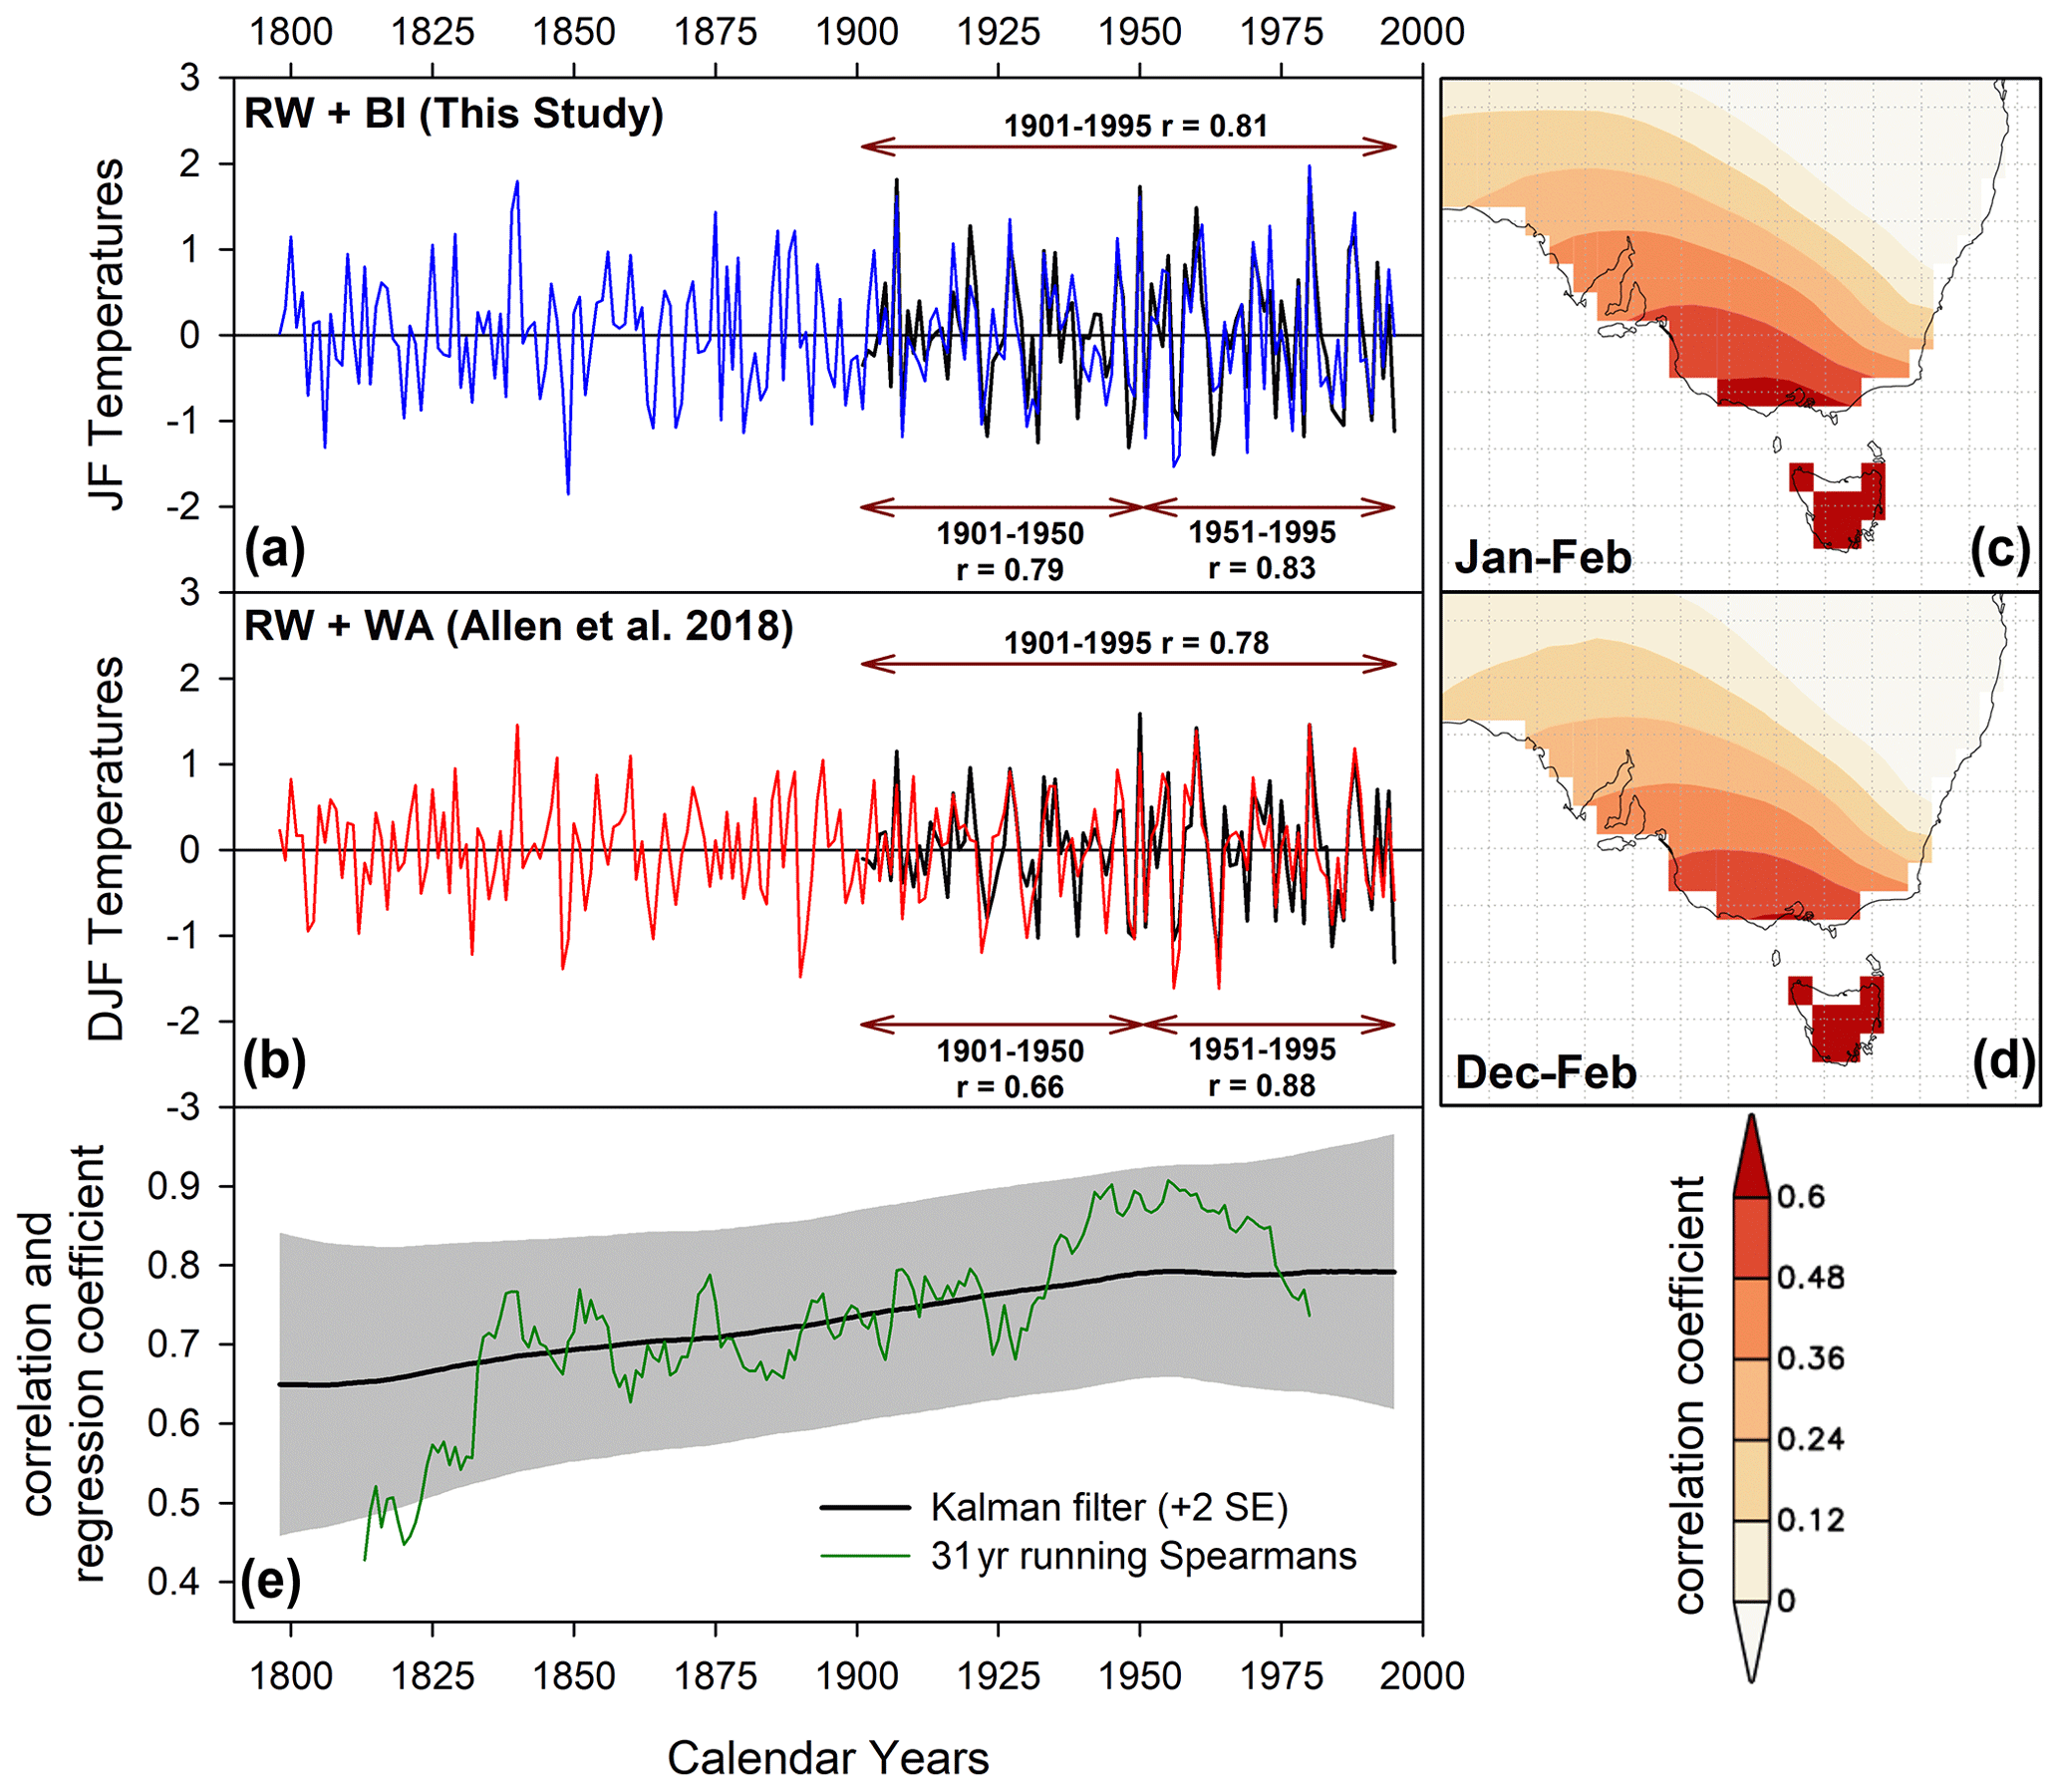
Figure 5(a) Variant 2 (full-period-screened) Tasmanian JF temperature RW + BI parameter-based reconstruction with CRUTS temperature data. Pearson's correlation is shown for the 1901–1995, 1901–1950, and 1951–1995 periods. (b) As A, but for Allen et al. (2018) RW + WA Tasmanian DJF temperature reconstruction. These data have also been high-pass filtered using a 20-year cubic smoothing spline. (c, d) Spatial correlations (1841–1995) between each reconstruction and similarly detrended Berkeley gridded data for the January–February and December–February seasons respectively; E: running 31-year Spearman rank correlation and Kalman filter analysis (Visser and Molenaar, 1988).
Overall, the temperature reconstruction experiments for both Tasmania and New Zealand (Fig. 4) return excellent results with overall calibration ar2 values well above 0.60. Although no QWA data exist yet for New Zealand, Allen et al. (2018) recently produced a range of PC-regression-based Tasmanian summer temperature reconstructions from a network of 58 chronologies using RW and QWA (mean tracheid radial diameter, mean cell wall thickness, mean density, and microfibril angle). These variables were measured using the SilviScan system (Evans, 1994) from the same four Tasmanian tree species used herein using samples from the same region, but from more sites. Strong calibration results explaining 50 %–60 % of the temperature variance and robust validation were also noted in their analyses. We compare our full-period screened temperature reconstruction (variant 2, Fig. 4 – representing the most used data screening approach in dendroclimatology) with a high-pass-filtered (20-year spline) version of the Allen et al. (2018) “Berkeley all-data” reconstruction variant (Fig. 5). Both reconstructions correlate similarly with the CRUTS temperature data (1901–1995: RW/BI r=0.81 (JF) and RW/WA r=0.78 (DJF) – Fig. 5a, b), although the BI-based reconstruction expresses a slightly more stable response with temperatures over the 1901–1950 and 1951–1995 periods (r=0.79 and 0.83 vs. 0.66 vs. 0.88). However, as the BI-based reconstruction was calibrated against these CRUTS data, this slight difference may simply reflect the optimized PC regression fit to one instrumental dataset over another. Equivalent split period correlations using the Berkeley temperature data (Rohde et al., 2013), as used by Allen et al. (2018), are 0.82/0.86 (RW/BI) and 0.77–0.90 (RW/WA).
Correlation with the Berkeley data over the 1841–1900 period shows that coherence is weaker but similar between the study of Allen et al. (2018) and this study (0.54 and 0.66). The spatial representation of the reconstructed temperature signal in both datasets is almost identical when using linearly detrended Berkeley gridded temperature data (Rohde et al., 2013) even when including data back to 1841 (Fig. 5c, d). Both reconstructions are strongly correlated with each other (Pearson's r=0.75, 1798–1995) although this coherence weakens back in time as evidenced by both a running 31-year Spearman rank correlation and Kalman filter (Visser and Molenaar, 1988), showing a peak coherence in the 20th century that decreases back towards the early part of the 19th century (Fig. 5e). This likely represents the decrease in sample replication through time in some BI-based datasets (MWWTRL and BUT) used in this study (Fig. A1). Overall, the BI data, at least for Tasmania, basically express the same high-frequency signal as the WA data used in Allen et al. (2018), and the results herein suggest that BI parameters could provide excellent proxies of past growing season temperatures. However, for their potential to be truly realized, the heartwood–sapwood colour change and other discolouration issues need to be overcome.
In this study, we measured a range of blue intensity parameters from eight conifer species from Tasmania and New Zealand to ascertain whether the use of EWB, LWB, and/or DB can improve upon previous dendroclimatic reconstructions based only on RW that explain about 40 %–45 % of the temperature variance. No attempt to remove resins was made for this proof-of-concept study. Therefore, due to the impact on intensity-based parameters of resins and heartwood–sapwood colour changes on the wood, we detrended the chronologies and climate data using a very flexible spline (20 years) to focus only on the high-frequency signal. Metrics denoting signal strength (RBAR and EPS) indicated a very weak common signal in the BI parameters (mean RBAR range 0.14–0.16, Fig. 2b) compared to the RW data (mean RBAR = 0.33), which appeared to be partly related to the relative variance in these datasets. The EWB data in particular exhibit very low variability, which may mean that any colour variation in the wood that does not reflect true year-to-year wood anatomical variance may have a large impact on such data, thus weakening the common signal.
Despite the weak common signal expressed by the BI parameters, the climate signal extant in these data is very strong, especially EWB. When all parameters are combined using PC regression, depending on the period used, 52 %–78 % of the summer temperature variance can be explained (Fig. 4). This is generally greater than the norm for Northern Hemisphere-based MXD/BI-related temperature reconstructions (Wilson et al., 2016), although admittedly, the results in this study are focused only on the high-frequency fraction of the data. These strong calibration results are driven mainly by EWB data from pencil pine, high-elevation Huon pine, and King Billy pine (Tasmania) and silver pine, pink pine, and cedar (New Zealand), although useful information was also identified in LWB (pencil pine, low-elevation Huon pine, Kauri, and cedar), DB (high-elevation Huon pine and pink pine), and RW (high-elevation Huon pine – Table 3). However, the relationship of LWB for most species with summer temperatures is opposite to that observed in the Northern Hemisphere, and further study is needed to assess the physiological processes leading to this inverse relationship in these particular Southern Hemisphere conifers.
The similarity of the Tasmanian multi-TR-proxy (TR, tree ring) reconstruction with a reconstruction heavily dependent on QWA data (Allen et al., 2018 – Fig. 5) clearly highlights that the BI and WA data express similar wood properties. This is a highly encouraging result for the utilization of BI as it is quicker and cheaper to produce than QWA data. However, the “elephant in the room” is whether robust low-frequency information can be extracted from BI-based parameters, or whether it is an analytical methodology that will ultimately only be relevant for decadal and higher frequencies. It is unlikely that the heartwood–sapwood colour change (both sharp and gradual – Fig. A1), expressed by most of the tree species used in this study, can be fully removed by resin extraction alone. Some success at overcoming heartwood–sapwood colour bias using DB has been shown for some Northern Hemisphere conifer species (Björklund et al., 2014a, b; Wilson et al., 2017b; Fuentes et al., 2017; Reid and Wilson 2020), but the DB results detailed herein (Table 3, Figs. 2–4) suggest that DB may not always provide a robust solution to the issue.
Other statistical approaches have been used to overcome the colour bias using either contrast adjustments (Björklund et al., 2014b; Fuentes et al., 2017) or band-pass approaches where the low-frequency signal is derived from the RW data and the high frequency is driven by the BI data (Rydval et al., 2017), but further experimentation is needed. We hypothesize that relatively sharp changes in colour intensity measures related to the heartwood–sapwood transition can be viewed conceptually in a similar way to how endogenous disturbances affect ring-width parameters over time (Cook, 1987). Similar to the progress in developing growth release detection methods to reconstruct canopy disturbance histories of forests (Altman, 2020, Trotsiuk et al., 2018), radial growth averaging (Lorimer and Frelich, 1989) or time series methods (Druckenbrod et al., 2013; Rydval et al., 2015) could be used to identify and remove the colour bias signature resulting from the change in physiology from heartwood to sapwood. However, to facilitate such signal processing methods, more studies are needed to directly compare both MXD and QWA data with BI parameters to understand the secular trend biases in these light intensity parameters. At the very least, the results detailed herein, based on a limited number of sites per species, show that BI parameters can be used to identify those species that should be targeted for more costly and time-consuming analytical methods such as QWA measurement.
Table A1Mean RW, EWB, LWB, and DB values for the raw chronologies. Coefficient of variation (CV) and mean inter-series correlation (RBAR) are calculated from the 20-year spline detrended chronologies. n-EPS reflects the number of series needed to attain an EPS value of 0.85 related to the RBAR value (Wilson and Elling, 2004).
Table A2Correlation matrices for each site between the four detrended TR parameter chronologies (1798–1995). Grey shading denotes a significant correlation (95 %).
Table A3(a) Correlation response function analysis for ring width with CRUTS temperatures. Analysis was undertaken over the 1902–1950, 1951–1995, and 1902–1995 periods. Black dots denote correlations significant at the 95 % confidence limit. (b) As 3a but for EWB. (c) As 3a but for LWB. (d) As 3a but for DB.

Table A4(a) Correlation response function analysis for ring width with CRUTS precipitation. Analysis was undertaken over the 1902–1950, 1951–1995, and 1902–1995 periods. Black dots denoted correlations significant at the 95 % confidence limit. (b) As 4a but for EWB. (c) As 4a but for LWB. (d) As 4a but for DB.
Figure A1Plots of raw mean chronologies of EWB (yellow), LWB (blue), DB (orange), and TR series replication (grey shading). The left axis is for EWB and LWB, the first right axis is DB, and the second right axis is series replication.
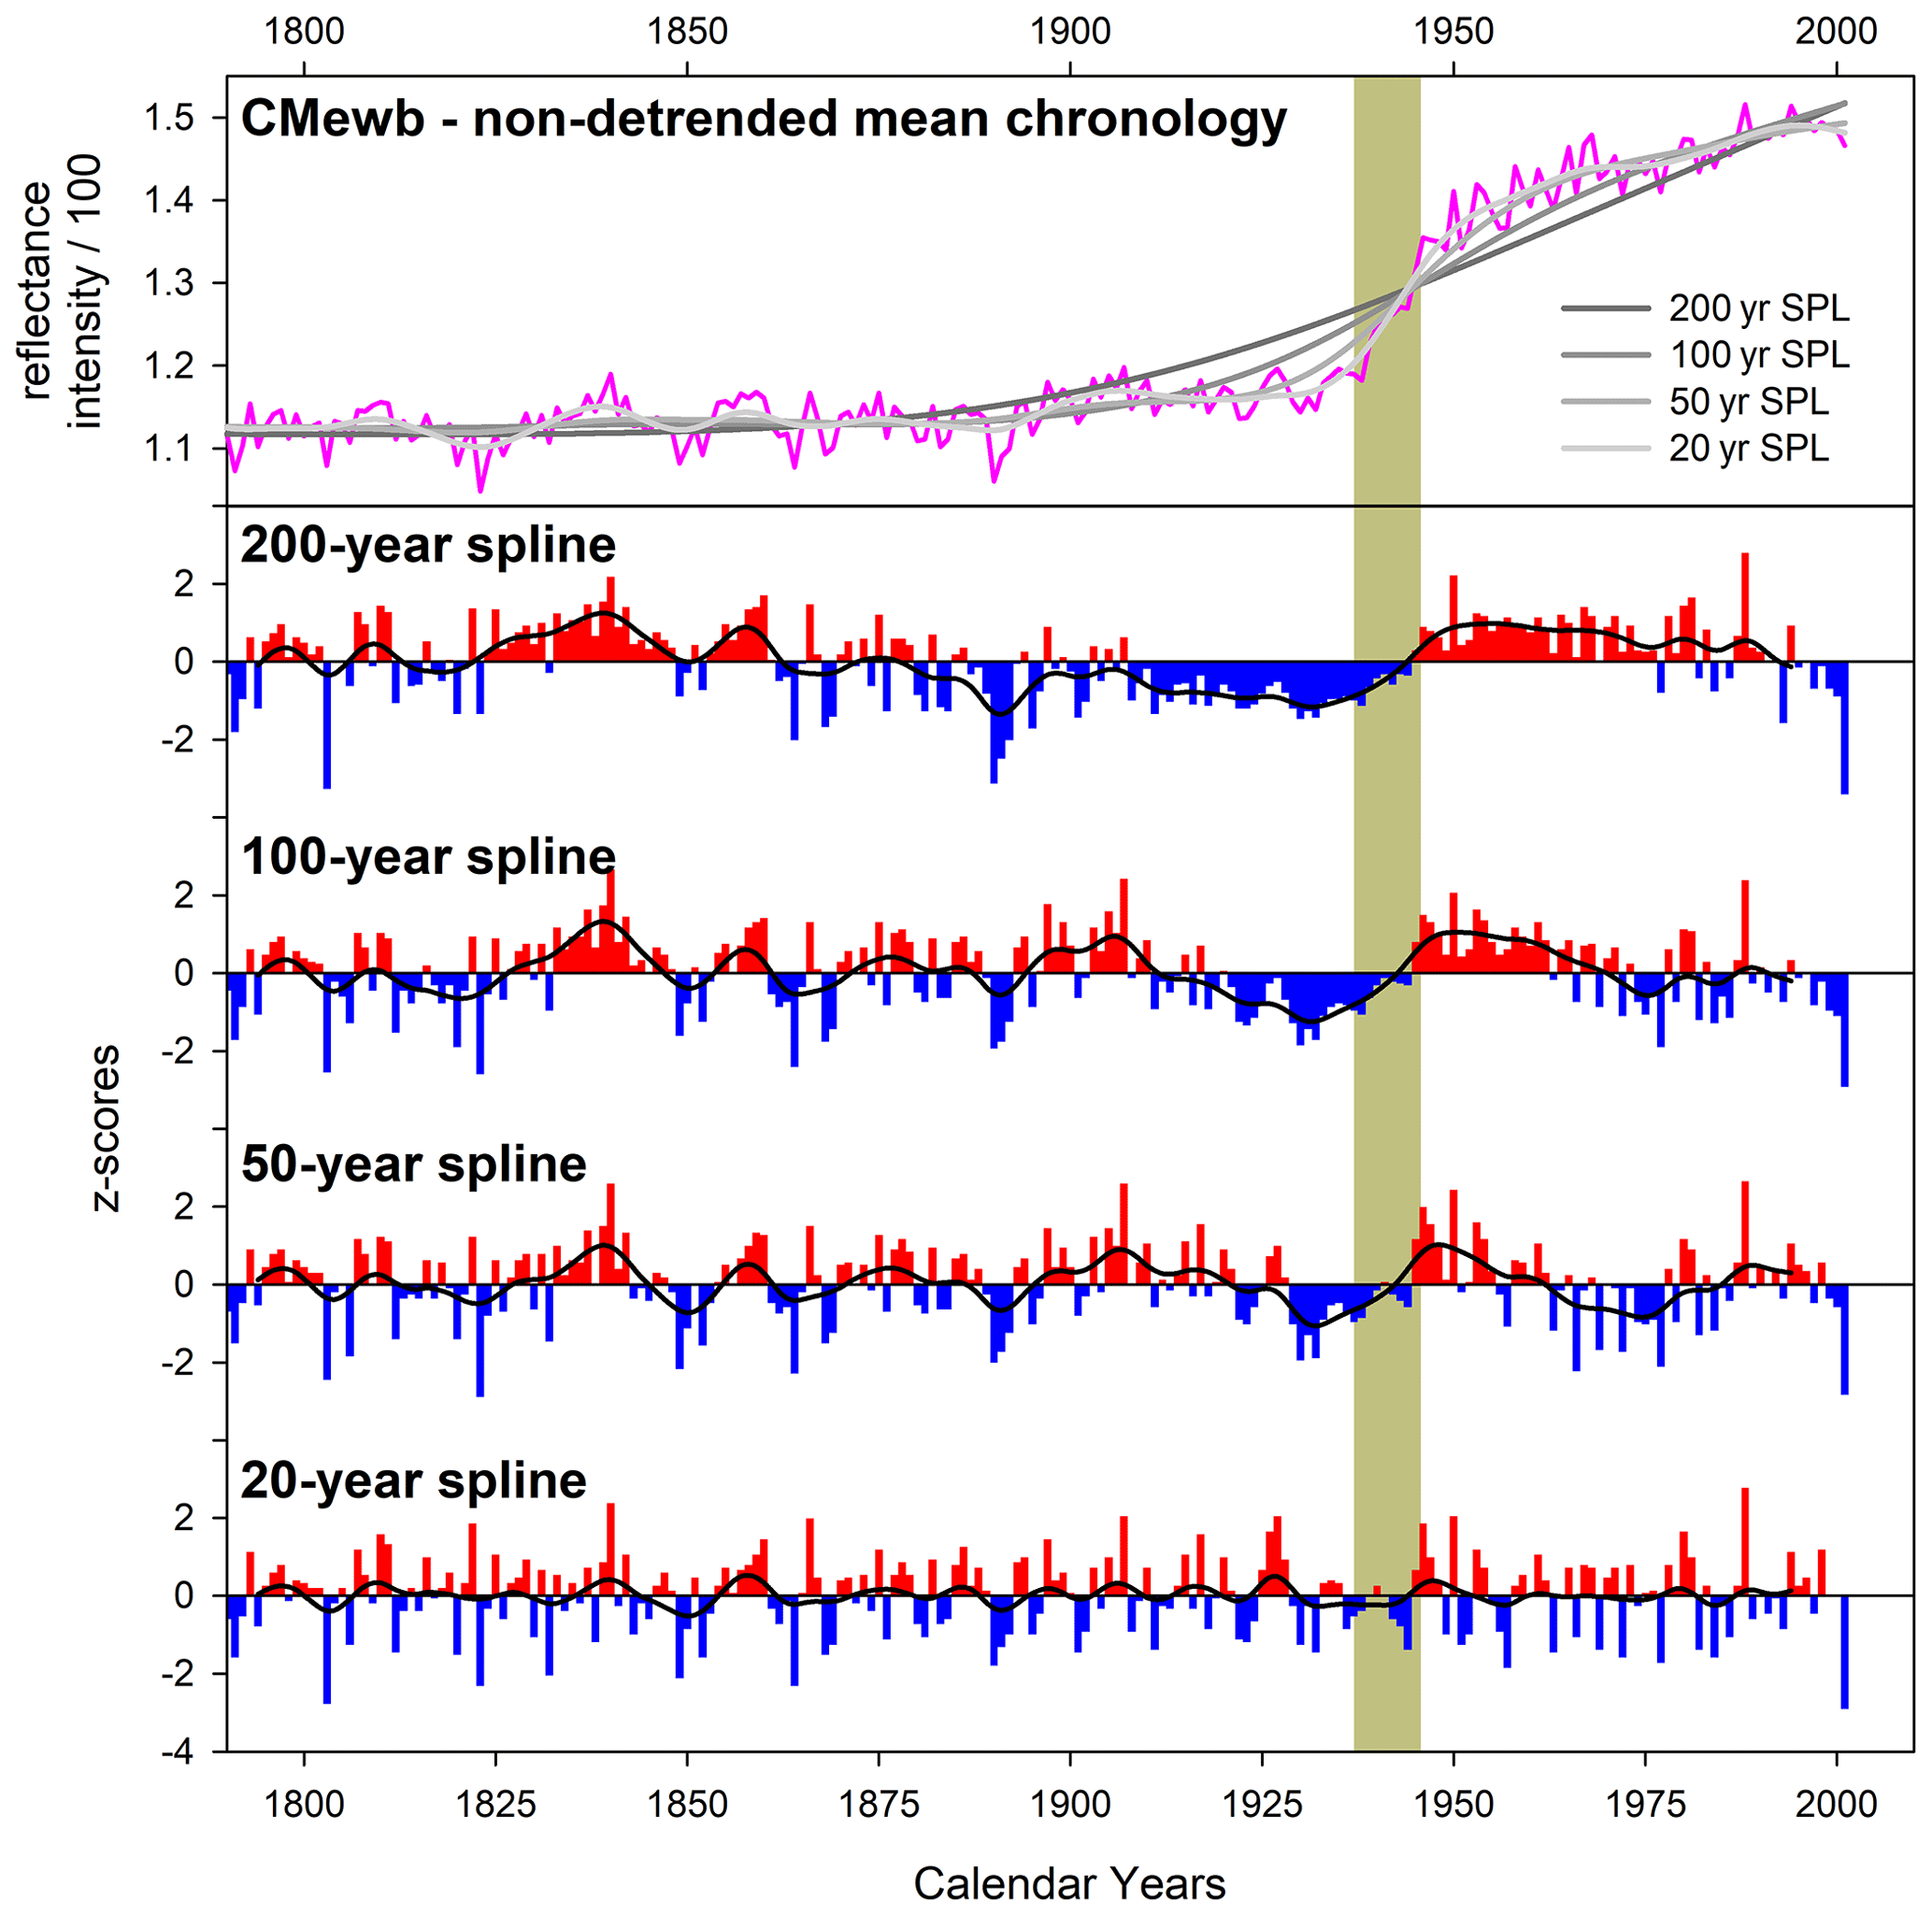
Figure A2Upper panel: raw mean non-detrended EWB chronology for the CM pencil pine site. The lower panel shows progressively more flexible spline detrending options. The vertical grey bar denotes the heartwood–sapwood transition period.
All data are available from the corresponding author by request.
The project was conceived of by RW. Sample collection and image acquisition were performed by RW, KA, PB, GB, BB, EC, RD, AF, PK, and JP. Data were generated by RW, KA, and MG. All authors helped with paper writing, final methodological design, commenting, and editing.
The contact author has declared that neither they nor their co-authors have any competing interests.
Publisher’s note: Copernicus Publications remains neutral with regard to jurisdictional claims in published maps and institutional affiliations.
Rob Wilson was funded through the University of Melbourne Dyason Fellowship in 2014 to undertake preliminary measurement and analyses for this study. We also acknowledge NSF-NERC funding (NE/W007223/1). Kathy Allen was supported by the Australian Research Council grants DP1201040320 and LP12020811 to Patrick Baker. Permission to obtain samples from New Zealand and Tasmanian sites was provided over multiple years by the New Zealand Department of Conservation and Parks and Wildlife Tasmania.
Aspects of this research has been funded through the Melbourne Dyason Fellowship scheme, NSF-NERC (NE/W007223/1) and Australian Research Council grants DP1201040320 and LP12020811.
This paper was edited by Petr Kuneš and reviewed by Milos Rydval and one anonymous referee.
Allen, K. J., Cook, E. R., Francey, R. J., and Michael, K.: The climatic response of Phyllocladus aspleniifolius (Labill.) Hook. f in Tasmania, J. Biogeogr., 28, 305–316, https://doi.org/10.1046/j.1365-2699.2001.00546.x, 2002.
Allen, K. J., Ogden, J., Buckley, B. M., Cook, E. R., and Baker, P. J.: The potential to reconstruct broadscale climate indices associated with southeast Australian droughts from Athrotaxis species, Tasmania, Clim. Dynam., 37, 1799–1821, https://doi.org/10.1007/s00382-011-1011-7, 2011.
Allen, K. J., Lee, G., Ling, F., Allie, S., Willis, M., and Baker, P. J.: Palaeohydrology in climatological context: developing the case for use of remote predictors in Australian streamflow reconstructions, Appl. Geogr., 64, 132–152, https://doi.org/10.1016/j.apgeog.2015.09.007, 2015a.
Allen, K. J., Nichols, S. C., Evans, R., Cook, E. R., Allie, S., Carson, G., Ling, F., and Baker, P. J.: Preliminary December–January inflow and streamflow reconstructions from tree rings for western Tasmania, southeastern Australia, Water Resour. Res., 51, 5487–5503, https://doi.org/10.1002/2015WR017062, 2015b.
Allen, K. J., Fenwick, P., Palmer, J. G., Nichols, S. C., Cook, E. R., Buckley, B. M., and Baker, P. J.: A 1700-year Athrotaxis selaginoides tree-ring width chronology from southeastern Australia, Dendrochronologia, 45, 90–100, https://doi.org/10.1016/j.dendro.2017.07.004, 2017.
Allen, K. J., Cook, E. R., Evans, R., Francey, R., Buckley, B. M., Palmer, J. G., Peterson, M. J., and Baker, P. J.: Lack of cool, not warm, extremes distinguishes late 20th Century climate in 979-year Tasmanian summer temperature reconstruction, Environ. Res. Lett., 13, 034041, https://doi.org/10.1088/1748-9326/aaafd7, 2018.
Alexander, M. R., Pearl, J. K., Bishop, D. A., Cook, E. R., Anchukaitis, K. J., and Pederson, N.: The potential to strengthen temperature reconstructions in ecoregions with limited tree line using a multispecies approach, Quat. Res., 92, 583–597, https://doi.org/10.1017/qua.2019.33, 2019.
Altman, J.: Tree-ring-based disturbance reconstruction in interdisciplinary research: Current state and future directions. Dendrochronologia, 125733, https://doi.org/10.1016/j.dendro.2020.125733, 2020.
Arbellay, E., Jarvis, I., Chavardès, R. D., Daniels, L. D., and Stoffel, M.: Tree-ring proxies of larch bud moth defoliation: latewood width and blue intensity are more precise than tree-ring width, Tree Physiol., 38, 1237–1245, https://doi.org/10.1093/treephys/tpy057, 2018.
Babst, F., Poulter, B., Trouet, V., Tan, K., Neuwirth, B., Wilson, R., Carrer, M., Grabner, M., Tegel, W., Levanic, T., and Panayotov, M.: Site-and species-specific responses of forest growth to climate across the European continent, Global Ecol. Biogeogr., 22, 706–717, https://doi.org/10.1111/geb.12023, 2013.
Babst, F., Wright, W. E., Szejner, P., Wells, L., Belmecheri, S., and Monson, R. K.: Blue intensity parameters derived from Ponderosa pine tree rings characterize intra-annual density fluctuations and reveal seasonally divergent water limitations, Trees, 30, 1403–1415, https://doi.org/10.1007/s00468-016-1377-6, 2016.
Björklund, J. A., Gunnarson, B. E., Seftigen, K., Esper, J., and Linderholm, H. W.: Blue intensity and density from northern Fennoscandian tree rings, exploring the potential to improve summer temperature reconstructions with earlywood information, Clim. Past, 10, 877–885, https://doi.org/10.5194/cp-10-877-2014, 2014a.
Björklund, J., Gunnarson, B.E., Seftigen, K., Zhang, P., and Linderholm, H. W.: Using adjusted blue intensity data to attain high-quality summer temperature information: a case study from Central Scandinavia, The Holocene, 25, 547–556, https://doi.org/10.1177/0959683614562434, 2014b.
Björklund, J., Seftigen, K., Schweingruber, F., Fonti, P., von Arx, G., Bryukhanova, M. V., Cuny, H. E., Carrer, M., Castagneri, D., and Frank, D. C.: Cell size and wall dimensions drive distinct variability of earlywood and latewood density in Northern Hemisphere conifers, New Phytologist, 216, 728–740, https://doi.org/10.1111/nph.14639, 2017.
Björklund, J., von Arx, G., Nievergelt, D., Wilson, R., Van den Bulcke, J., Günther, B., Loader, N. J., Rydval, M., Fonti, P., Scharnweber, T., Andreu-Hayles, L., Büntgen, U., D'Arrigo, R., Davi, N., De Mil, T., Esper, J., Gärtner, H., Geary, J., Gunnarson, B. E., Hartl, C., Hevia, A., Song, H., Janecka, K., Kaczka, R. J., Kirdyanov, A. V., Kochbeck, M., Liu, Y., Meko, M., Mundo, I., Nicolussi, K., Oelkers, R., Pichler, T., Sánchez-Salguero, R., Schneider, L., Schweingruber, F., Timonen, M., Trouet, V., Van Acker, J., Verstege, A., Villalba, R., Wilmking, M., and Frank, D.: Scientific Merits and Analytical Challenges of Tree-Ring Densitometry, Rev. Geophys., 57, 1224–1264, https://doi.org/10.1029/2019RG000642, 2019.
Björklund, J., Seftigen, K., Fonti, P., Nievergelt, D., von Arx, G.: Dendroclimatic potential of dendroanatomy in temperature-sensitive Pinus sylvestris, Dendrochronologia, 60, 125673, https://doi.org/10.1016/j.dendro.2020.125673, 2020.
Blake, S. A., Palmer, J. G., Björklund, J., Harper, J. B., and Turney, C. S.: Palaeoclimate potential of New Zealand Manoao colensoi (silver pine) tree rings using Blue-Intensity (BI), Dendrochronologia, 60, 125664, https://doi.org/10.1016/j.dendro.2020.125664, 2020.
Boswijk, G., Fowler, A. M., Palmer, J. G., Fenwick, P., Hogg, A., Lorrey, A. and Wunder, J.: The late Holocene kauri chronology: assessing the potential of a 4500-year record for palaeoclimate reconstruction, Quat. Sci. Rev., 90, 128–142, https://doi.org/10.1016/j.quascirev.2014.02.022, 2014.
Bradley, R. S.: Paleoclimatology: reconstructing climates of the Quaternary, Elsevier, 595 pp., 1999.
Briffa, K. R., Osborn, T. J., Schweingruber, F. H., Jones, P. D., Shiyatov, S. G., and Vaganov, E. A.: Tree-ring width and density data around the Northern Hemisphere: Part 1, local and regional climate signals, The Holocene, 12, 737–757, https://doi.org/10.1191/0959683602hl587rp, 2002.
Brookhouse, M. and Graham, R.: Application of the minimum blue-intensity technique to a southern-hemisphere conifer, Tree-Ring Res., 72, 103–107, https://doi.org/10.3959/1536-1098-72.02.103, 2016.
Buckley, B. M., Cook, E. R., Peterson, M. J., and Barbetti, M.: A changing temperature response with elevation for Lagarostrobos franklinii in Tasmania, Australia, In Climatic Change at High Elevation Sites, Springer, Dordrecht. https://doi.org/10.1023/A:1005322332230, 245–266, 1997.
Buckley, B., Ogden, J., Palmer, J., Fowler, A., and Salinger, J.: Dendroclimatic interpretation of tree-rings in Agathis australis (kauri), 1. Climate correlation functions and master chronology. Journal of the Royal Society of New Zealand, 30, 263–276, https://doi.org/10.1080/10412905.2002.9699839, 2000.
Buckley, B. M., Hansen, K. G., Griffin, K.L., Schmiege, S., Oelkers, R., D'Arrigo, R. D., Stahle, D. K., Davi, N., Nguyen, T. Q. T., Le, C. N., and Wilson, R. J.: Blue intensity from a tropical conifer's annual rings for climate reconstruction: An ecophysiological perspective, Dendrochronologia, 50, 10–22, https://doi.org/10.1016/j.dendro.2018.04.003, 2018.
Büntgen, U., Krusic, P. J., Verstege, A., Sangüesa-Barreda, G., Wagner, S., Camarero, J. J., Ljungqvist, F. C., Zorita, E., Oppenheimer, C., Konter, O., and Tegel, W.: New tree-ring evidence from the Pyrenees reveals Western Mediterranean climate variability since medieval times, J. Climate, 30, 5295–5318, https://doi.org/10.1175/JCLI-D-16-0526.1, 2017.
Büntgen, U., Urban, O., Krusic, P.J., Rybníček, M., Kolář, T., Kyncl, T., Ač, A., Koňasová, E., Čáslavský, J., Esper, J., and Wagner, S.: Recent European drought extremes beyond Common Era background variability, Nat. Geosci., 14, 190–196, https://doi.org/10.1038/s41561-021-00698-0, 2021.
Buras, A.: A comment on the expressed population signal, Dendrochronologia, 44, 130–132, https://doi.org/10.1016/j.dendro.2017.03.005, 2017
Buras, A., Spyt, B., Janecka, K., and Kaczka, R.: Divergent growth of Norway spruce on Babia Góra Mountain in the western Carpathians, Dendrochronologia, 50, 33–43, https://doi.org/10.1016/j.dendro.2018.04.005, 2018.
Camarero, J. J., Rozas, V., and Olano, J. M.: Minimum wood density of Juniperus thurifera is a robust proxy of spring water availability in a continental Mediterranean climate, J. Biogeogr., 41, 1105–1114, https://doi.org/10.1111/jbi.12271, 2014.
Camarero, J. J., Fernández-Pérez, L., Kirdyanov, A. V., Shestakova, T. A., Knorre, A. A., Kukarskih, V. V., and Voltas, J.: Minimum wood density of conifers portrays changes in early season precipitation at dry and cold Eurasian regions, Trees, 31, 1423–1437, https://doi.org/10.1007/s00468-017-1559-x, 2017.
Campbell, R., McCarroll, D., Loader, N. J., Grudd, H., Robertson, I., Jalkanen, R.: Blue intensity in Pinus sylvestris tree-rings: developing a new palaeoclimate proxy, The Holocene, 17, 821–828, https://doi.org/10.1177/0959683607080523, 2007.
Campbell, R., McCarroll, D., Robertson, I., Loader, N. J., Grudd, H., and Gunnarson, B.: Blue intensity in Pinus sylvestris tree rings: a manual for a new palaeoclimate proxy, Tree-Ring Res., 67, 127–135, https://doi.org/10.3959/2010-13.1, 2011.
Cleaveland, M. K.: Climatic response of densitometric properties in semiarid site tree rings, Tree-Ring Bull, 46, 13–29, 1986.
Cook, E. R. and Peters, K.: The smoothing spline: a new approach to standardizing forest interior tree-ring width series for dendroclimatic studies, 45–53, 1981.
Cook, E. R.: The Decomposition of Tree-Ring Series for Environmental Studies, Tree-Ring Bull., 47, 37–59, 1987.
Cook, E. R., Briffa, K. R., and Jones, P. D.: Spatial regression methods in dendroclimatology: a review and comparison of two techniques, Int. J. Climatol., 14, 379–402, doi.org/10.1002/joc.3370140404, 1994.
Cook, E. R., Palmer, J. G., Cook, B. I., Hogg, A., and D D'Arrigo, R.: A multi-millennial palaeoclimatic resource from Lagarostrobos colensoi tree-rings at Oroko Swamp, New Zealand, Glob. Planet. Change, 33, 209–220, https://doi.org/10.1016/S0921-8181(02)00078-4, 2002.
Cook, E. R., Buckley, B. M., Palmer, J. G., Fenwick, P., Peterson, M. J., Boswijk, G., and Fowler, A.: Millennia-long tree-ring records from Tasmania and New Zealand: A basis for modelling climate variability and forcing, past, present and future, J. Quat. Sci., 21, 689–699, https://doi.org/10.1002/jqs.1071, 2006.
Cook, E. R. and Pederson, N.: Uncertainty, emergence, and statistics in dendrochronology, in: Dendroclimatology, Springer, Dordrecht, 77–112, https://doi.org/10.1007/978-1-4020-5725-0_4, 2011.
D'Arrigo, R. D., Buckley, B. M., Cook, E. R., and Wagner, W. S.: Temperature-sensitive tree-ring width chronologies of pink pine (Halocarpus biformis) from Stewart Island, New Zealand. Palaeogeography, Palaeoclimatology, Palaeoecology, 119, 293–300, https://doi.org/10.1016/0031-0182(95)00014-3, 1996.
Davi, N. K., Rao, M. P., Wilson, R., Andreu-Hayles, L., Oelkers, R., D'Arrigo, R., Nachin, B., Buckley, B., Pederson, N., Leland, C., and Suran, B.: Accelerated Recent Warming and Temperature Variability over the Past Eight Centuries in the Central Asian Altai from Blue Intensity in Tree Rings, Geophys. Res. Lett., 49, doi.org/10.1029/2021GL092933, 2021.
Dolgova, E.: June–September temperature reconstruction in the Northern Caucasus based on blue intensity data, Dendrochronologia, 39, 17–23, https://doi.org/10.1016/j.dendro.2016.03.002, 2016.
Drew, D. M., Allen, K., Downes, G. M., Evans, R., Battaglia, M., and Baker, P.: Wood properties in a long-lived conifer reveal strong climate signals where ring-width series do not, Tree Physiol., 33, 37–47, https://doi.org/10.1093/treephys/tps111, 2012.
Druckenbrod, D. L., Pederson, N., Rentch, J., and Cook, E.R.: A comparison of times series approaches for dendroecological reconstructions of past canopy disturbance events, Forest Ecol. Manage., 302, 23–33, https://doi.org/10.1016/j.foreco.2013.03.040, 2013.
Duncan, R. P., Fenwick, P., Palmer, J. G., McGlone, M. S., and Turney, C. S.: Non-uniform interhemispheric temperature trends over the past 550 years, Clim. Dynam., 35, 1429–1438, https://doi.org/10.1007/s00382-010-0794-2, 2010.
Esper, J., Frank, D. C., Timonen, M., Zorita, E., Wilson, R. J., Luterbacher, J., Holzkämper, S., Fischer, N., Wagner, S., Nievergelt, D., and Verstege, A.: Orbital forcing of tree-ring data, Nat. Clim. Change, 2, 862–866, https://doi.org/10.1038/NCLIMATE1589, 2012.
Evans R.: Rapid measurement of the transverse dimensions of tracheids in radial wood sections from Pinus radiata, Holzforschung, 48, 168–172, https://doi.org/10.1515/hfsg.1994.48.2.168, 1994.
Fonti, P., Bryukhanova, M. V., Myglan, V. S., Kirdyanov, A. V., Naumova, O. V., and Vaganov, E. A.: Temperature-induced responses of xylem structure of Larix sibirica (Pinaceae) from the Russian Altay, American Journal of Botany, 100, 1332–1343, https://doi.org/10.3732/ajb.1200484, 2013.
Fowler, A., Palmer, J., Salinger, J., and Ogden, J.: Dendroclimatic interpretation of tree-rings in Agathis australis (kauri): 2. Evidence of a significant relationship with ENSO, Journal of the Royal Society of New Zealand, 30, 277–292, https://doi.org/10.1080/03014223.2000.9517622, 2000.
Fowler, A. M., Boswijk, G., Lorrey, A. M., Gergis, J., Pirie, M., McCloskey, S. P., Palmer, J. G., and Wunder, J.: Multi-centennial tree-ring record of ENSO-related activity in New Zealand, Nat. Clim. Change, 2, 172–176, https://doi.org/10.1038/nclimate1374, 2012.
Fritts, H. C., Smith, D. G., Cardis, J. W., and Budelsky, C. A.: Tree-ring characteristics along a vegetation gradient in northern Arizona, Ecology, 46, 393–401, doi.org/10.2307/1934872, 1965.
Fritts, H. C.: Tree Rings and Climate, London, Academic Press Ltd, 553 pp., 1976.
Fuentes, M., Salo, R., Björklund, J., Seftigen, K., Zhang, P., Gunnarson, B., Aravena, J. C., and Linderholm, H. W.: A 970-year-long summer temperature reconstruction from Rogen, west-central Sweden, based on blue intensity from tree rings, The Holocene, 28, 254–266, https://doi.org/10.1177/0959683617721322, 2017.
Harley, G. L., Heeter, K. J., Maxwell, J. T., Rayback, S. A., Maxwell, R. S., Reinemann, T. E., and Taylor, A.: Towards broad-scale temperature reconstructions for Eastern North America using blue light intensity from tree rings, Int. J. Clim., 41, 3142–3159, https://doi.org/10.1002/joc.6910, 2021.
Harris, I. P. D. J., Jones, P. D., Osborn, T. J., and Lister, D.H.: Updated high-resolution grids of monthly climatic observations–the CRU TS3. 10, Dataset, Int. J. Climatol., 34, 623–642, https://doi.org/10.1002/joc.3711, 2014.
Heeter, K. J., Harley, G. L., Maxwell, J. T., McGee, J. H., and Matheus, T. J.: Late summer temperature variability for the Southern Rocky Mountains (USA) since 1735 CE: applying blue light intensity to low-latitude Picea engelmannii Parry ex Engelm, Clim. Change, 162, 965–988, https://doi.org/10.1007/s10584-020-02772-9, 2020.
Helama, S., Arentoft, B. W., Collin-Haubensak, O., Hyslop, M. D., Brandstrup, C. K., Mäkelä, H. M., Tian, Q., and Wilson, R.: Dendroclimatic signals deduced from riparian versus upland forest interior pines in North Karelia, Finland, Ecol. Res., 28, 1019–1028, https://doi.org/10.1007/s11284-013-1084-3, 2013.
Kaczka, R. J., Spyt, B., Janecka, K., Beil, I., Büntgen, U., Scharnweber, T., Nievergelt, D., and Wilmking, M.: Different maximum latewood density and blue intensity measurements techniques reveal similar results, Dendrochronologia, 49, 94–101, https://doi.org/10.1016/j.dendro.2018.03.005, 2018.
Kaczka, R. J. and Wilson, R.: I-BIND: International Blue Intensity Network Development Working Group, Dendrochronologia, 68, 125859, https://doi.org/10.1016/j.dendro.2021.125859, 2021.
Kienast, F., Schweingruber, F. H., Bräker, O. U., and Schär, E., Tree-ring studies on conifers along ecological gradients and the potential of single-year analyses, Canadian Journal of Forest Research, 17, 683–696, https://doi.org/10.1139/x87-111, 1987.
Ljungqvist, F. C., Thejll, P., Björklund, J., Gunnarson, B. E., Piermattei, A., Rydval, M., Seftigen, K., Støve, B., and Büntgen, U.: Assessing non-linearity in European temperature-sensitive tree-ring data, Dendrochronologia, 59, 125652, https://doi.org/10.1016/j.dendro.2019.125652, 2019.
Loader, N. J., Santillo, P. M., Woodman-Ralph, J. P., Rolfe, J. E., Hall, M. A., Gagen, M., Robertson, I., Wilson, R., Froyd, C. A., and McCarroll, D.: Multiple stable isotopes from oak trees in southwestern Scotland and the potential for stable isotope dendroclimatology in maritime climatic regions, Chem. Geol., 252, 62–71, https://doi.org/10.1016/j.chemgeo.2008.01.006, 2008.
Loader, N. J., Young, G. H., McCarroll, D., Davies, D., Miles, D., and Bronk Ramsey, C.: Summer precipitation for the England and Wales region, 1201–2000 CE, from stable oxygen isotopes in oak tree rings, J. Quat. Sci., 35, 731–736, https://doi.org/10.1002/jqs.3226, 2020.
Lorimer, C. G. and Frelich, L. E.: A methodology for estimating canopy disturbance frequency and intensity in dense temperate forests, Canadian Journal of Forest Research, 19, 651–663, https://doi.org/10.1139/x89-102, 1989.
McCarroll, D., Pettigrew, E., Luckman, A., Guibal, F., and Edouard, J. L.: Blue reflectance provides a surrogate for latewood density of high-latitude pine tree rings, Arctic, Antarctic, and Alpine Research, 34, 450–453, https://doi.org/10.2307/1552203, 2002.
McCarroll, D. and Loader, N. J.: Stable isotopes in tree rings, Quat. Sci. Rev., 23, 771–801, https://doi.org/10.1016/j.quascirev.2003.06.017, 2004.
Neukom, R., Gergis, J., Karoly, D. J., Wanner, H., Curran, M., Elbert, J., González-Rouco, F., Linsley, B. K., Moy, A. D., Mundo, I., and Raible, C. C.: Inter-hemispheric temperature variability over the past millennium, Nat. Clim. Change, 4, 362–367, https://doi.org/10.1038/nclimate2174, 2014.
O'Donnell, A. J., Allen, K. J., Evans, R. M., Cook, E. R., Trouet, V., and Baker, P. J.: Wood density provides new opportunities for reconstructing past temperature variability from southeastern Australian trees, Global Planet. Change, 141, 1–11, https://doi.org/10.1016/j.gloplacha.2016.03.010, 2016.
Palmer, J. G. and Xiong, L.: New Zealand climate over the last 500 years reconstructed from Libocedrus bidwillii Hook. f. tree-ring chronologies, The Holocene, 14, 282–289, https://doi.org/10.1191/0959683604hl679rr, 2004.
Panyushkina, I. P., Hughes, M. K., Vaganov, E. A., and Munro, M. A.: Summer temperature in northeastern Siberia since 1642 reconstructed from tracheid dimensions and cell numbers of Larix cajanderi, Canadian Journal of Forest Research, 33, 1905–1914, https://doi.org/10.1139/x03-109, 2003.
Prendin, A. L., Petit, G., Carrer, M., Fonti, P., Björklund, J., and von Arx, G.: New research perspectives from a novel approach to quantify tracheid wall thickness, Tree Physiol., 37, 976–983, https://doi.org/10.1093/treephys/tpx037, 2017.
Reid, E. and Wilson, R.: Delta Blue Intensity vs. Maximum Density: A Case Study using Pinus uncinata in the Pyrenees, Dendrochronologia, 61, 125706, https://doi.org/10.1016/j.dendro.2020.125706, 2020.
Rohde, R., Muller, R. A., Jacobsen, R., Muller, E., Perlmutter, S., Rosenfeld, A., Wurtele J., Groom D., and Wickham C.: A new estimate of the average earth surface land temperature spanning 1753 to 2011, Geoinformatics and Geostatistics, 1:1, available at: https://static.berkeleyearth.org/papers/Results-Paper-Berkeley-Earth.pdf, 2013.
Rydval, M., Larsson, L. Å., McGlynn, L., Gunnarson, B. E., Loader, N. J., Young, G. H., and Wilson, R.: Blue intensity for dendroclimatology: should we have the blues? Experiments from Scotland, Dendrochronologia, 32, 191–204, https://doi.org/10.1016/j.dendro.2014.04.003, 2014.
Rydval, M., Druckenbrod, D., Anchukaitis, K. J., and Wilson, R.: Detection and removal of disturbance trends in tree-ring series for dendroclimatology, Canadian Journal of Forest Research, 46, 387–401, https://doi.org/10.1139/cjfr-2015-0366, 2015.
Rydval, M., Loader, N.J., Gunnarson, B. E., Druckenbrod, D. L., Linderholm, H. W., Moreton, S. G., Wood, C. V., and Wilson, R.: Reconstructing 800 years of summer temperatures in Scotland from tree rings, Clim. Dynam., 49, 2951–2974, https://doi.org/10.1007/s00382-016-3478-8, 2017.
Rydval, M., Druckenbrod, D. L., Svoboda, M., Trotsiuk, V., Janda, P., Mikoláš, M., Čada, V., Bače, R., Teodosiu, M., and Wilson, R.: Influence of sampling and disturbance history on climatic sensitivity of temperature-limited conifers, The Holocene, 28, 1574–1587, https://doi.org/10.1177/0959683618782605, 2018.
Seftigen, K., Fuentes, M., Ljungqvist, F. C., and Björklund, J.: Using Blue Intensity from drought-sensitive Pinus sylvestris in Fennoscandia to improve reconstruction of past hydroclimate variability, Clim. Dynam., 1–16, https://doi.org/10.1007/s00382-020-05287-2, 2020.
St. George, S.: An overview of tree-ring width records across the Northern Hemisphere, Quat. Sci. Rev., 95, 132–150, https://doi.org/10.1016/j.quascirev.2014.04.029, 2014.
Trotsiuk, V., Pederson, N., Druckenbrod, D. L., Orwig, D. A., Bishop, D. A., Barker-Plotkin, A., Fraver, S., and Martin-Benito, D.: Testing the efficacy of tree-ring methods for detecting past disturbances, Forest Ecol. Manage., 425, 59–67, https://doi.org/10.1016/j.foreco.2018.05.045, 2018.
Visser, H. and Molenaar, J.: Kalman filter analysis in dendroclimatology, Biometrics, 44, 929–940, https://doi.org/10.2307/2531724, 1988.
von Arx, G., Crivellaro, A., Prendin, A. L., Čufar, K., and Carrer, M.: Quantitative wood anatomy – practical guidelines, Front. Plant Sci., 7, 781, https://doi.org/10.3389/fpls.2016.00781, 2016.
Wang, L., Payette, S., and Bégin, Y.: Relationships between anatomical and densitometric characteristics of black spruce and summer temperature at tree line in northern Quebec, Canadian Journal of Forest Research, 32, 477–486, https://doi.org/10.1139/x01-208, 2002.
Wigley, T. M., Briffa, K. R., and Jones, P. D.: On the average value of correlated time series, with applications in dendroclimatology and hydrometeorology, J. Appl. Meteorol. Clim., 23, 201–213, https://doi.org/10.1175/1520-0450(1984)023<0201:OTAVOC>2.0.CO;2, 1984.
Wiles, G. C., Charlton, J., Wilson, R. J., D'Arrigo, R. D., Buma, B., Krapek, J., Gaglioti, B. V., Wiesenberg, N., and Oelkers, R.: Yellow-cedar blue intensity tree-ring chronologies as records of climate in Juneau, Alaska, USA, Canadian Journal of Forest Research, 49, 1483–1492, https://doi.org/10.1139/cjfr-2018-0525, 2019.
Wilmking, M., van der Maaten-Theunissen, M., van der Maaten, E., Scharnweber, T., Buras, A., Biermann, C., Gurskaya, M., Hallinger, M., Lange, J., Shetti, R., and Smiljanic, M.: Global assessment of relationships between climate and tree growth, Glob. Change Biol., 26, 3212–3220, https://doi.org/10.1111/gcb.15057, 2020.
Wilson, R. J. and Hopfmueller, M.: Dendrochronological investigations of Norway spruce along an elevational transect in the Bavarian Forest, Germany, Dendrochronologia, 19, 67–79, 2001.
Wilson, R. J. and Luckman, B. H.: Dendroclimatic reconstruction of maximum summer temperatures from upper treeline sites in Interior British Columbia, Canada, The Holocene, 13, 851–861, https://doi.org/10.1191/0959683603hl663rp, 2003.
Wilson, R. and Elling, W.: Temporal instability in tree-growth/climate response in the Lower Bavarian Forest region: implications for dendroclimatic reconstruction, Trees, 18, 19–28, https://doi.org/10.1007/s00468-003-0273-z, 2004.
Wilson, R. J. S, Rao, R., Rydval, M., Wood, C., Larsson, L.-A., and Luckman, B. H.: Blue Intensity for Dendroclimatology: The BC Blues: A Case Study from British Columbia Canada, The Holocene, 24, 1428–1438, https://doi.org/10.1177/0959683614544051, 2014.
Wilson, R., Anchukaitis, K., Briffa, K., Büntgen, U., Cook, E., D’Arrigo, R., Davi, N., Esper, J., Frank, D., Gunnarson, B., Hegerl, G., Helema, S., Klesse, S., Krusic, P., Linderholm, H.W., Myglan, V., Osborn, T., Rydval, M., Schneider, L., Schurer, A., Wiles, G., Zhang, P., and Zorita, E.: Last millennium Northern Hemisphere summer temperatures from tree rings: Part I: the long term context, Quat. Sci. Rev., 134, 1–18, https://doi.org/10.1016/j.quascirev.2015.12.005, 2016.
Wilson, R., Wilson, D., Rydval, M., Crone, A., Büntgen, U., Clark, S., Ehmer, J., Forbes, E., Fuentes, M., Gunnarson, B. E., Linderholm, H., Nicolussi, K., Wood, C., and Mills, C.: Facilitating tree-ring dating of historic conifer timbers using Blue Intensity, J. Archaeol. Sci., 78, 99–111, https://doi.org/10.1016/j.jas.2016.11.011, 2017a.
Wilson, R., D'Arrigo, R., Andreu-Hayles, L., Oelkers, R., Wiles, G., Anchukaitis, K., and Davi, N.: Experiments based on blue intensity for reconstructing North Pacific temperatures along the Gulf of Alaska, Clim. Past, 13, 1007–1022, https://doi.org/10.5194/cp-13-1007-2017, 2017b.
Wilson, R., Anchukaitis, K., Andreu-Hayles, L., Cook, E., D'Arrigo, R., Davi, N., Haberbauer, L., Krusic, P., Luckman, B., Morimoto, D., and Oelkers, R.: Improved dendroclimatic calibration using blue intensity in the southern Yukon, The Holocene, 29, 1817–1830, https://doi.org/10.1177/0959683619862037, 2019.
Xiong, L., Okada, N., Fujiwara, T., Ohta, S., and Palmer, J. G.: Chronology development and climate response analysis of different New Zealand pink pine (Halocarpus biformis) tree-ring parameters, Canadian Journal of Forest Research, 28, 566–573, https://doi.org/10.1139/cjfr-28-4-566, 1998.
Yasue, K., Funada, R., Kobayashi, O., and Ohtani, J.: The effects of tracheid dimensions on variations in maximum density of Picea glehnii and relationships to climatic factors, Trees, 14, 223–229, https://doi.org/10.1007/PL00009766, 2000.
Young, G. H., Loader, N. J., McCarroll, D., Bale, R. J., Demmler, J. C., Miles, D., Nayling, N. T., Rinne, K. T., Robertson, I., Watts, C., and Whitney, M.: Oxygen stable isotope ratios from British oak tree-rings provide a strong and consistent record of past changes in summer rainfall, Clim. Dynam., 45, 3609–3622, https://doi.org/10.1007/s00382-015-2559-4, 2015.