the Creative Commons Attribution 4.0 License.
the Creative Commons Attribution 4.0 License.
 | 17 Dec 2021
Seasonal flux patterns and carbon transport from low-oxygen eddies at the Cape Verde Ocean Observatory: lessons learned from a time series sediment trap study (2009–2016)
Gerhard Fischer
Oscar E. Romero
Johannes Karstensen
Karl-Heinz Baumann
Nasrollah Moradi
Morten Iversen
Götz Ruhland
Marco Klann
Arne Körtzinger
Mesoscale eddies are abundant in the eastern tropical North Atlantic and act as oases for phytoplankton growth due to local enrichment of nutrients in otherwise oligotrophic waters. It is not clear whether these eddies can efficiently transfer organic carbon and other flux components to depth and if they are important for the marine carbon budget. Due to their transient and regionally restricted nature, measurements of eddies' contribution to bathypelagic particle flux are difficult to obtain. Rare observations of export flux associated with low-oxygen eddies have suggested efficient export from the surface to the deep ocean, indicating that organic carbon flux attenuation might be low. Here we report on particle flux dynamics north of the Cabo Verde islands at the oligotrophic Cape Verde Ocean Observatory (CVOO; approx. 17∘35′ N, 24∘15′ W). The CVOO site is located in the preferred pathways of highly productive eddies that ultimately originate from the Mauritanian upwelling region. Between 2009 and 2016, we collected biogenic and lithogenic particle fluxes with sediment traps moored at ca. 1 and 3 km water depths at the CVOO site. From concurrent hydrography and oxygen observations, we confirm earlier findings that highly productive eddies are characterized by colder and less saline waters and a low-oxygen signal as well. Overall, we observed quite consistent seasonal flux patterns during the passage of highly productive eddies in the winters of 2010, 2012 and 2016. We found flux increases at 3 km depth during October–November when the eddies approached CVOO and distinct flux peaks during February–March, clearly exceeding low oligotrophic background fluxes during winter 2011 and showing an enhanced particle flux seasonality. During spring, we observed a stepwise flux decrease leading to summer flux minima. The flux pattern of biogenic silicate (BSi) showed a stronger seasonality compared to organic carbon. Additionally, the deep fluxes of total mass showed an unusually higher seasonality compared to the 1 km traps. We assume that BSi and organic carbon/lithogenic material had different sources within the eddies. BSi-rich particles may originate at the eddy boundaries where large diatom aggregates are formed due to strong shear and turbulence, resulting in gravitational settling and, additionally, in an active local downward transport. Organic carbon associated with lithogenic material is assumed to originate from the interior of eddies or from mixed sources, both constituting smaller, dust-ballasted particles. Our findings suggest that the regularly passing highly productive eddies at CVOO repeatedly release characteristic flux signals to the bathypelagic zone during winter–spring seasons that are far above the oligotrophic background fluxes and sequester higher organic carbon than during oligotrophic settings. However, the reasons for a lower carbon flux attenuation below eddies remain elusive.
- Article
(5260 KB) - Full-text XML
- BibTeX
- EndNote


Highly productive mesoscale eddies, often carrying cold and less saline water masses with low oxygen concentrations, have been suggested to play an important role in the biogeochemistry and carbon cycling in the oligotrophic eastern tropical North Atlantic. The eastern tropical North Atlantic hosts one of the major oxygen minimum zones (OMZs) of the world oceans (Karstensen et al., 2008; Brandt et al., 2015). The specific oxygen consumption and ventilation pattern creates two oxygen minima, the shallow one at about 80 m depth mostly associated with regional processes and the deep one at about 450 m water depth (minimal oxygen about 40 µmol kg−1) associated with the gyre-scale ventilation (e.g., Karstensen et al., 2008; Fiedler et al., 2016; Brandt et al., 2015). The most energetic flow features in the region are the boundary current system (Mittelstaedt, 1991; Brandt et al., 2015) and, at a local scale, westward-propagating mesoscale eddies (e.g., Schütte et al., 2016a; Pietri and Karstensen, 2018). The two features are connected as the mesoscale eddies spin off instabilities of the boundary current and transport water of coastal origin offshore, with elevated nutrients and high organic carbon content. The eddy origin in the Canary Current Eastern Boundary Upwelling Ecosystem (CC-EBUE) can be traced back to certain “hot spots” for eddy formation, one of them at Cap-Vert (Senegal), where anticyclones are formed in summer and propagate westward, reaching the Cape Verde Ocean Observatory (CVOO) about half a year later, in winter (Fig. 1; Schütte et al., 2016a; Karstensen et al., 2015). The eddies start with a high nutrient load from the coastal upwelling, and, en route, dynamical processes support local upwelling and high productivity (Karstensen et al., 2017; Fielder et al., 2016). The combination of high biomass, the high respiration of organic matter and the physical isolation of the eddy core water masses leads to low oxygen concentration in the eddies, where even suboxic conditions (O2 <1 µmol kg−1) have been observed just below the base of the mixed layer (Karstensen et al., 2015; Schütte et al., 2016b).

Figure 1(a) Location of the CVOO site in the eastern tropical North Atlantic with the major current systems of the Canary Current (CC), the North Equatorial Current (NEC) and the Mauritanian Current (MC) (ODV map – Reiner Schlitzer, Ocean Data View, odv.awi.de, 2021, last access: 26 August 2020). Note the corridor of eddy passages from the African coast to CVOO schematically indicated as a light polygon. A white box with the environmental data from Giovanni is shown NE of CVOO. (b) Winter MODIS satellite chlorophyll (DJFM) between the African coast and the Cabo Verde islands (the CVOO site is shown by a white dot) for winters 2010, 2011 and 2012 (2016 is comparable to 2012, not shown), showing the increasing extensions of the high-chlorophyll area (>1 mg m−3) from the coast to the open ocean, approaching CVOO.
The lowest oxygen content in mesoscale eddies in the eastern tropical North Atlantic has been found in anticyclonic mode-water eddies (ACMEs). These eddies can have a very isolated core related to a velocity maximum at about 70 to 100 m depth, and the low oxygen content is found just below the mixed layer (Karstensen et al., 2015, 2017). In parallel, intense upwelling of nutrients into the euphotic zone has been reported and attributed to different concepts such as sub-mesoscale shear instabilities (Karstensen et al., 2017) or eddy–wind interaction and a resulting Ekman transport divergence (McGillicuddy et al., 2007). Dedicated surveys of ACMEs have revealed rather unique ecosystem responses compared with the surrounding oligotrophic region. High phytoplankton and particle concentrations, high carbon degradation, and specific nitrogen cycles have been reported (Fiedler et al., 2016; Löscher et al., 2015; Grundle et al., 2017). Additionally, due to the very low oxygen availability, the diurnal migration cycle of zooplankton is for some species severely limited (e.g., Hauss et al., 2016), while species with high oxygen tolerance, e.g., the polychaete Poeobius, profit from the high particle flux even in the low-oxygen core of the eddies (Christiansen et al., 2018).
It has recently been shown that increasing primary production in the surface waters of different ocean basins did not show a similar increase in export flux to the deep sea (Cael et al., 2021). The authors suggested that this was due to a biological dampening of variability from primary production to deep-sea particulate organic carbon (POC) flux, most likely due to a higher intensity of zooplankton grazing during productive periods. These observations were from the epi- and mesopelagic under normal oxygen conditions where grazing zooplankton plays an important role (e.g., Iversen et al., 2010). However, if oxygen content is strongly reduced to hypoxic and suboxic conditions in the sub-surface and deeper waters, degradation of organic carbon may be reduced due to lower zooplankton grazing (e.g., Hauss et al., 2016). For the OMZ in the eastern tropical Atlantic, it is assumed that organic carbon attenuation of larger particles in the water column is reduced, thereby increasing the efficiency of the biological carbon pump (Rasse and Dall'Olmo, 2019). In the OMZs of the Pacific Ocean and the Arabian Sea, low carbon flux attenuation has been suggested in suboxic waters at depths between 100 and 1000 m (Weber and Bianchi, 2020). However, the role of mesoscale eddies in carbon export and deep-ocean carbon sequestration is still largely unexplored (see review of Benitez-Nelson and McGillicuddy, 2008) and therefore not reliably resolved in global carbon cycling models (e.g., Omand et al., 2015; Shih et al., 2015).
Sediment trap flux studies in the meso- and bathypelagic associated with eddies are rare (e.g., E-Flux and EDDIES projects – see review in Benitez-Nelson and McGillicuddy, 2008; CVOO – Fischer et al., 2016; Romero et al., 2016), and episodic pulses of organic matter sedimentation from eddies may be largely undersampled or even missed. Some studies have shown that carbon export is higher at the eddy edges and organic matter export occurs partly via sedimentation of large diatom frustules and zooplankton fecal pellets (Shih et al., 2015). Other studies of organic carbon export associated with eddies have not revealed higher organic carbon fluxes compared to the surrounding oligotrophic waters (e.g., Buesseler et al., 2008). Biogenic silica (BSi) fluxes that are 2- to 3-fold higher compared to the oligotrophic surroundings have been observed within eddies (e.g., Maiti et al., 2008; Rii et al., 2008; Verdeny et al., 2008). This was for instance shown for the cyclonic eddy named OPAL, which was studied during the E-Flux program (Benitez-Nelson and McGillicuddy, 2008) in the North Pacific. Most of these studies, however, did not differentiate between the types of eddies investigated. Benitez-Nelson and McGillicuddy (2008) pointed out that a higher phytoplankton biomass produced within eddy blooms may not necessarily result in increasing particle export and sedimentation. Instead, micro-zooplankton grazing (e.g., by ciliates and dinoflagellates) may be stimulated, resulting in strong upper-ocean recycling and a release of suspended and dissolved materials at shallow depths within eddies. The surrounding waters of the eddies are close to Redfield stoichiometry (Redfield et al., 1963) and have an apparent oxygen utilization (AOU) to nitrate ratio of (equal to 8.6). However, inside highly productive eddies, oxygen removal by respiration was found to be about twice as high as nitrate increase through remineralization of organic matter (AOU/nitrate ratio of 16; Karstensen et al., 2017). This shift in stoichiometry was explained by different cycling pathways of oxygen and nitrate within the eddy (Karstensen et al., 2017).
The CVOO site is north of São Vicente (Cabo Verde; approx. 17∘35′ N, 24∘15′ W), located within one of the eddy corridors off the west African coast at ca. 15–20∘ N (Schütte et al., 2016a; Fig. 1), is ideal for investigating particle fluxes and deep carbon sequestration in response to the passage of cyclonic and anticyclonic eddies with specific hydrography and oxygen characteristics in the epi- and mesopelagic. Given previous oceanographic studies and surveys at this site (e.g., Karstensen et al., 2015; Löscher et al., 2015; Schütte et al., 2016a; Pietri and Karstensen, 2018) paired with synchronous time series measurements of hydrography and oxygen concentrations in the epi- and mesopelagic, the passages of different types of eddies can be reconstructed from the time series data, particularly for highly productive/low-oxygen eddies. A detailed description of the biogeochemical responses in terms of export flux during winter 2010 in response to an ACME passage with a hypoxic–anoxic core was provided by Fischer et al. (2016). This study discussed the impact of such hypoxic/anoxic eddies on bulk export flux, stable nitrogen isotopes, major planktonic groups (diatoms, coccolithophores, planktonic foraminifera) and biomarkers from traps at ca. 1300 and 3400 m depth. The most striking observation was a 2–3-fold-higher organic carbon flux collected by the 1 km trap compared to the surrounding oligotrophic waters and a high seasonality (Berger and Wefer, 1990). Additionally, we found a massive increase in organic matter flux with increasing depth, which was interpreted by Fischer et al. (2016) as particle flux focusing in the deeper water column.
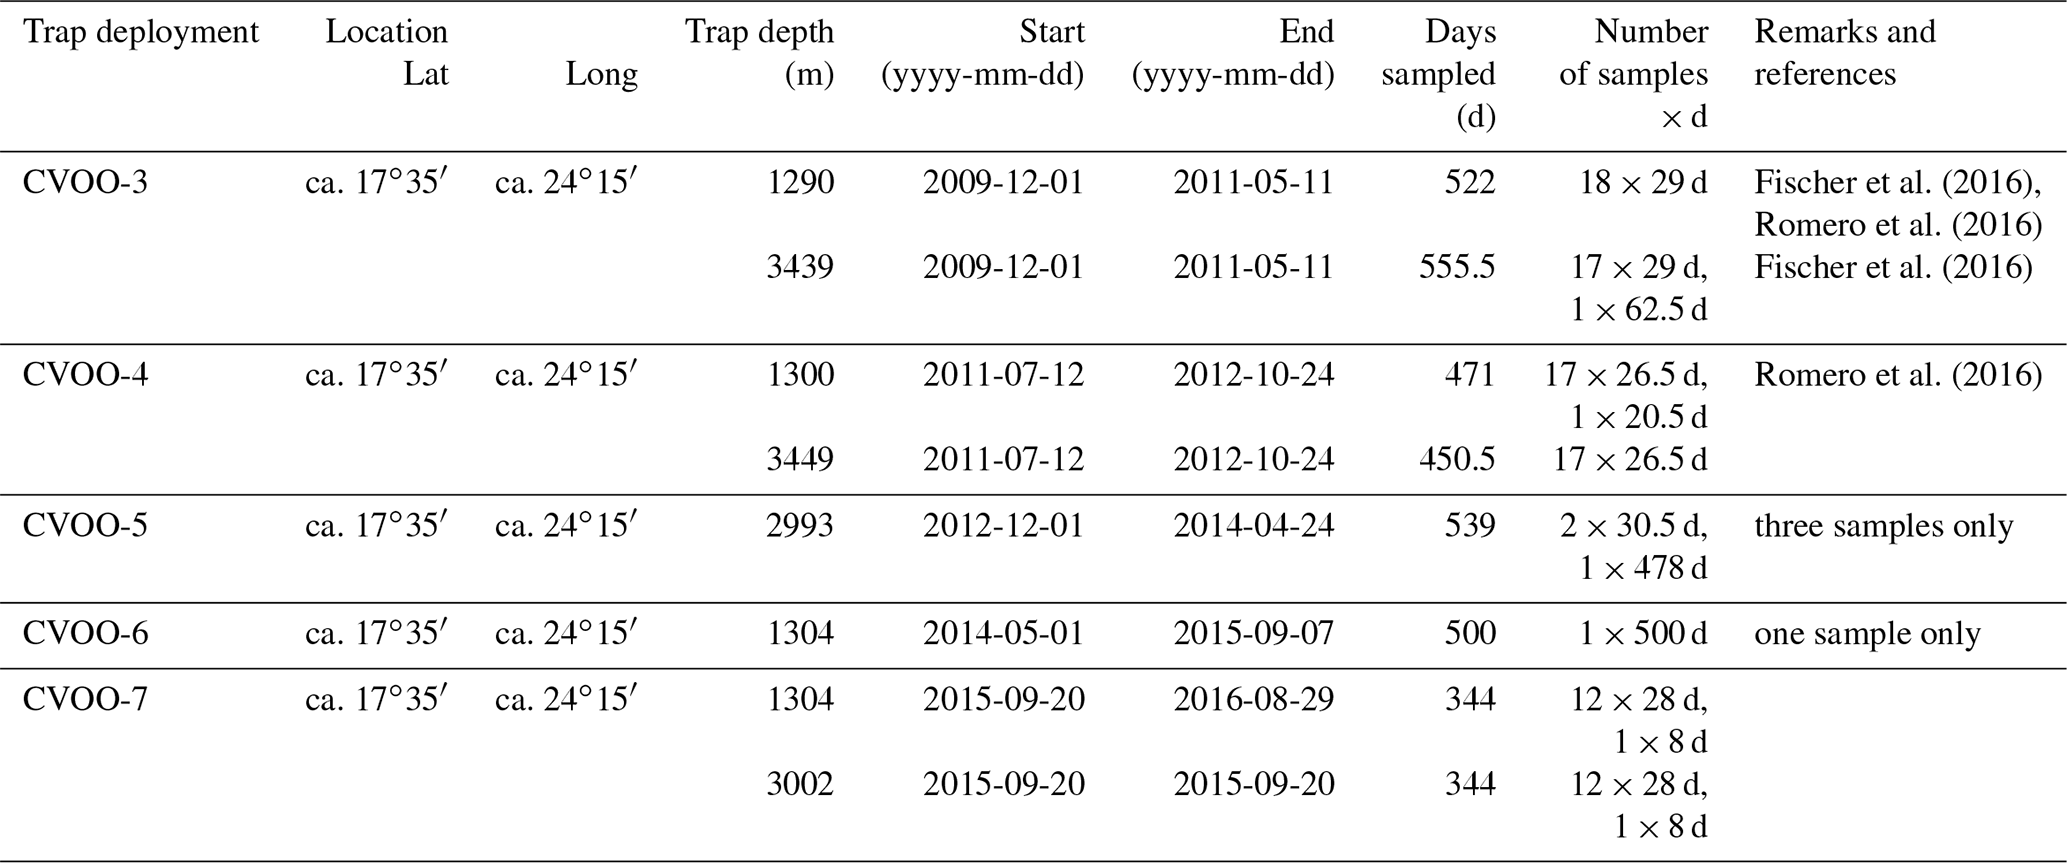
The aim of the present study is to investigate the transfer of biogenic and lithogenic particles (Saharan dust) in association with eddy passages to sequestration depths at about 1 and 3 km water depth and to compare against oligotrophic background conditions. We use a multi-year sediment trap record (2009–2016, with interruptions; Fig. 1; Table 1) of particle fluxes at the CVOO oligotrophic site. Our emphasis is on the fall–winter flux peaks when highly productive/low-oxygen eddies pass through the study site, and we compare these flux maxima to oligotrophic, low-seasonality conditions. Data discussed are partly based on earlier investigations from deployments CVOO-3 and CVOO-4 (2009–2012; Fischer et al., 2016; Romero et al., 2016). Here we also use the deeper trap flux data to unravel organic carbon transfer to the deep CVOO site within passing eddies and extend the flux record to 2016.
2.1 Cape Verde Ocean Observatory (CVOO)
The study site of CVOO in the eastern tropical North Atlantic (approx. 17∘35′ N, 24∘15′ W; Fig. 1) is located about 800 km off the west African coast and about 80 km north of the island of São Vicente, Cabo Verde (Fig. 1a). It consists of a steel wire mooring of approx. 3600 m length, first deployed in 2006 and maintained continuously since then. The mooring is equipped with several temperature and salinity sensors at multiple depths, water current profiler and single-point current meters (also in conjunction with the sediment traps), and Aanderaa AADI optode (Type 3830) oxygen sensors. The optode calibration was refined over the years but followed essentially two strategies – a laboratory calibration with zero and saturated oxygen concentrations and a calibration against reference points acquired by mounting the logger to a CTD rosette and comparing the logger readings with calibrated (Winkler titration) CTD oxygen readings (see, e.g., Hahn et al., 2014). Time series of oxygen and salinity discussed here were acquired in the depth range between 30 and 100 m. The oxygen record stems from one single sensor mounted between a nominal 43-to-55 m water depth. For the deployment period 2015 to 2016, a programming error occurred and the oxygen record is only 2 weeks long. Salinity was recorded with at least three and up to six sensors, depending on the respective deployment period. As found in earlier studies (Karstensen et al., 2015, 2017; Schütte et al., 2016a), highly productive and well-isolated eddies of coastal origin correlate with low-salinity events and eventually may be paired with low oxygen concentrations. We defined occurrences of such eddies at CVOO when minimal salinity (35.0 ‰ to 35.6 ‰) and low-oxygen (<5 to 110 µM) records were encountered and compared these events with the flux observations.
Except for the periods when mesoscale eddies cross the CVOO site, the currents are generally sluggish, as expected for a site in the OMZ. Fischer et al. (2016) reported ca. 2–6 cm s−1 for about 600 m depth and around 2 cm s−1 for the deep water column. As a consequence, the mooring that has its head buoy at about 40 m depth was mostly in an upright position. At CVOO, pressure sensors indicate a maximal deflection angle of ca. 12∘ in the upper ca. 1300 m of the water column, which is in the normal range measured. This might affect trapping efficiency (e.g., Buesseler et al., 2007), but it is difficult to quantify these changes as the mooring line oscillates around the upright position, depending on local current directions and intensities including tidal currents.
2.2 Sediment trap collections
Particle fluxes were collected with cone-shaped and large-aperture sediment traps (0.5 m2, Kiel type; Kremling et al., 1996) in ca. 1300 m (hereafter referred to as 1 km) and in ca. 3000–3500 m (hereafter referred to as 3 km) water depths (Table 1). We used samples collected at roughly monthly intervals (Table 1). The traps were equipped with 20 cups, which were poisoned with HgCl2 before and after deployment by the addition of 1 mL of a saturated HgCl2 solution in distilled water at 20 ∘C per 100 mL. Pure NaCl was used to increase the density of the water added to the cups prior to the deployments (final salinity was 40 ‰). Large swimmers were removed manually and/or by filtering carefully through a 1 mm sieve. All fluxes therefore refer to the major size fraction of <1 mm. Samples were wet split in the home laboratory using a rotating McLane wet splitter and freeze-dried. Additional information on methods is given elsewhere (Fischer and Wefer, 1991).
Deep-ocean sediment traps usually collect material from a rather large catchment area, typically around 100 km in diameter or wider, depending on particle settling rates and ocean currents (Siegel and Deuser, 1997). As ocean currents are generally in a western and southwestern direction, we used a catchment area for environmental data (MODIS chlorophyll, sea surface temperature – SST, surface wind speed and dry dust deposition rate) from Giovanni (https://giovanni.gsfc.nasa.gov/giovanni/#service=TmAvMp&starttime=&endtime=, last access: 6 August 2020) for the surface ocean located to the northeast of CVOO (17∘30′–18∘30′ N and 23–24∘ W; Fig. 1a). We made different tests with the size of the study box (e.g., 1 or 2∘) and the location (above the trap, to the west or northwest), but we did not observe significant changes in the seasonality of the environmental parameters compared to the 1∘ box to the northeast. Calculated mean seasonal and annual fluxes allow a better comparison among seasons and years to identify interannual variability. Seasons are defined using the dates of opening and closure of the sampling cups closest to the start of the astronomical seasons (21 March, 21 June, 23 September, 21 December). To illustrate and quantify the seasonal variability in particle fluxes, we applied the seasonality index (SI) from Berger and Wefer (1990). This seasonality index is defined in terms of the number of months which yields one-half of the total production/flux (equal to the production/flux half-time) over an annual cycle. The seasonality index is then 6 minus the production/flux half-time in months. A seasonality index of zero (equal to 6−6) therefore means no seasonality at all or a constant flux pattern which is typical of oligotrophic settings (Berger and Wefer, 1990). In contrast, a seasonality index of 5 (6−1) indicates a very high seasonality (or a highly peaked flux pattern) with 50 % of the total flux occurring within 1 month only; this is, for instance, observed in high-latitude oceans like the Southern Ocean (Berger and Wefer, 1990).
2.3 Sample analysis of settling particles
Samples were analyzed using freeze-dried and homogenized material of wet splits. The collected material was weighed for total mass and analyzed for organic carbon, total nitrogen, calcium carbonate and biogenic silica. Particulate organic carbon, total nitrogen and calcium carbonate were measured by combustion with a Vario EL III elemental analyzer in the CN mode. Total carbonate was determined by subtracting organic carbon from total carbon, where the latter was measured by combustion without pre-treatment with 2 N HCl. Biogenic opal was determined with a sequential 1 M NaOH leaching technique according to Müller and Schneider (1993). This method does not account for the variable water content of biogenic opal but corrects it for Si derived from clay minerals. Leaching duration depends on the course of the continuous leaching curve, and recordings were terminated when a linear dissolution course was reached, which usually occurs after around 0.5 to 1 h. The precision of the overall method based on replicate analyses is between ± 0.2 % and ± 0.4 %. Lithogenic fluxes were calculated from total mass flux by subtracting the flux of carbonate and biogenic opal and 2 times the flux of organic carbon (Hedges et al., 2002) to approximate organic matter. As there is no river input into the study area, we assume that all non-biogenic (i.e., lithogenic) material was supplied via eolian transport to CVOO.
2.4 Diatom fluxes at CVOO (upper traps)
We used splits of the original samples for quantification of the diatom flux. Samples were rinsed with distilled water and prepared for diatom analysis as previously published (see details in Romero et al., 2016, 2017, 2020). Identification and counts of diatom taxa at the species level were performed at ×1000 magnification using a Zeiss® Axioscope with phase-contrast illumination (MARUM, University of Bremen, Bremen). Counts were carried out on permanent slides of acid-cleaned material (Mountex® mounting medium). Depending on valve abundances in each slide, several traverses were examined. The total number of counted valves per slide ranged between 300 and 600. Two cover slips per sample were scanned in this way. Diatom counts of replicate slides indicate that the analytical error in concentration estimates is 12 %. The counting procedure and definition of counting units for diatoms follow Schrader and Gersonde (1978).
The resulting counts yielded the abundance of individual diatom taxa as well as daily fluxes of valves per square meter per day (DF), calculated according to Sancetta and Calvert (1988), as follows:
where N is the number of valves in an area a, as a fraction of the total area of a petri dish A and the dilution volume V in milliliters. This value is multiplied by the sample split (Split), representing the fraction of total material in the trap, and then divided by the number of days of sample deployment and multiplied by the sediment trap collection area D.
3.1 Seasonal and interannual environmental variability in the CVOO eddy box
Sea surface temperatures (SSTs) in the box northeast of CVOO (Fig. 1) showed a seasonal cycle and varied between about 20.5 and 27.5 ∘C with the lowest values occurring during winter and spring (Fig. 2a). The highest SSTs occurred during late summer and early fall, whereafter SSTs decreased rapidly until the turn of the year. Satellite-derived chlorophyll biomass (Fig. 2b) increased with decreasing SSTs and was highest during winter and spring. Modeled dust dry deposition peaked during winter and occurred ca. 1–2 months prior to the chlorophyll maxima (Fig. 2c). The years 2010 and 2011 showed higher SSTs, lower chlorophyll and reduced dust deposition compared to 2012–2016 (Fig. 2). Chlorophyll content was very low and remained below the mean value during winter 2011 and 2010 (oligotrophic conditions, Fig. 1b). During winter 2010, a high-chlorophyll eddy approached the CVOO trap site (Fig. 1b; Fischer et al., 2016). During the following winter seasons from 2012–2016, chlorophyll was above the mean values (Fig. 1b).
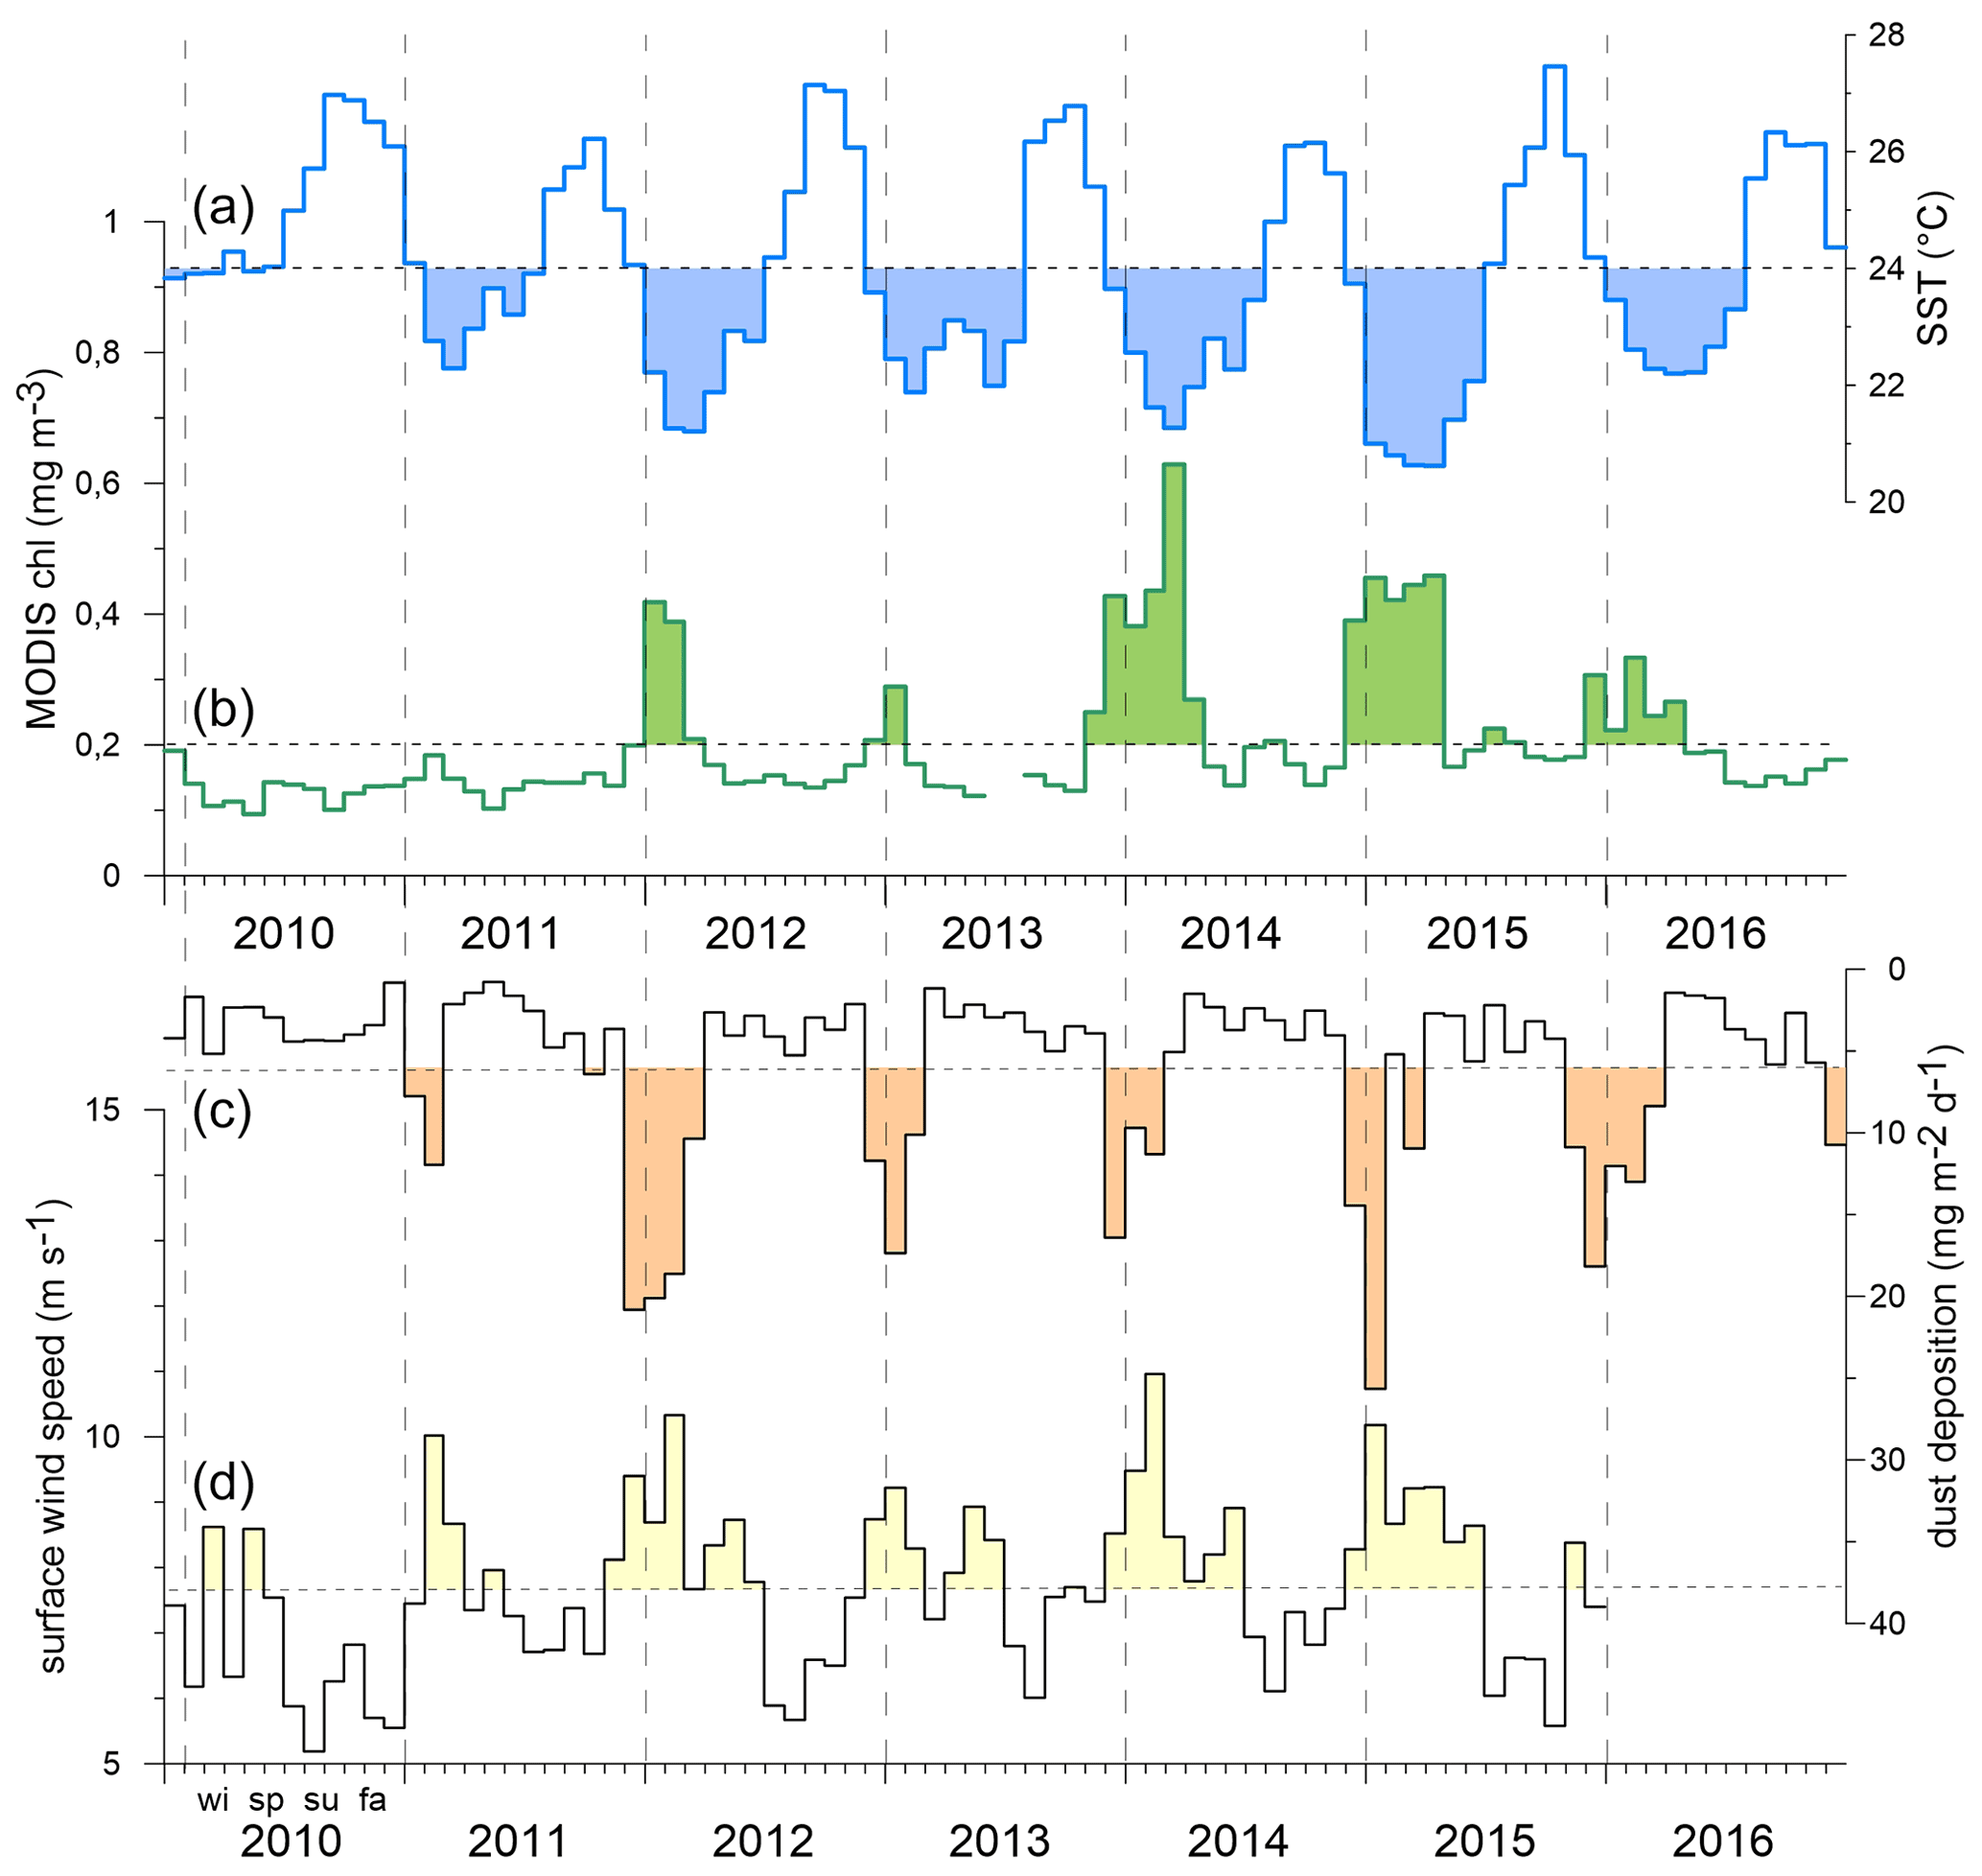
Figure 2Monthly SSTs (a), chlorophyll (b), modeled (MERRA) dry dust deposition (c) and surface wind speed (d) recorded in the study box northeast (17∘30′–18∘30′ N and 23–24∘ W) of CVOO between 2010 and 2016 (satellite-derived, from Giovanni, https://giovanni.gsfc.nasa.gov/giovanni/#service=TmAvMp&starttime=&endtime=, last access: 6 August 2020). Note that during the extreme ACME during winter 2010, chlorophyll, surface wind and dust deposition were all low, combined with relatively high SSTs. Thereafter, surface biomass, winds and dust increased during winter and early spring. Horizontal dashed lines indicate mean values; peaks above or below are marked as filled bars. Vertical dashed lines mark years; wi, sp, su and fa indicate the seasons (winter, spring, summer, fall).
3.2 Oxygen and salinity time series at CVOO
The oxygen (Fig. 3a) and salinity (Fig. 3b) time series from 2010–2016 recorded between 30 and 100 m depth showed different scales of variability. Note that the time series are aligned with the CVOO-3 to CVOO-7 sediment trap particle sampling at ca. 1 and 3 km depth (Fig. 4, Table 1). For both oxygen (one instrument only) and salinity (three to six instruments), a seasonal cycle was observed with the highest oxygen and salinity during summer. The lowest oxygen concentrations were found during February 2010, December 2013 and August 2015 and to some extent in January 2016, all associated with low-salinity signals (Fig. 3b). Low salinities indicate the presence of boundary current waters of South Atlantic Central Water (SACW) origin and were most likely linked to the presence of coherent and isolated eddies from the Mauritanian–Senegalese coast (Schütte et al., 2016a; Fiedler et al., 2016). The most severe and longest oxygen drawdown, with the lowest concentrations reaching almost anoxic conditions, was observed for the entire month of February 2010, largely overlapping with the collection period of one sampling cup of the CVOO-3 sediment traps (cup no. 3; Fischer et al., 2016). However, low-salinity events were also obtained for January 2011, February–April 2012, August–September 2013 and April–June 2015, which indicates the presence of isolated eddies of coastal origin. Note that because of the complexity in underlying drivers, water mass characteristics, and intermittency of eddy occurrences in space and time, we do not expect a robust correlation between low oxygen and low salinity with a flux event at the CVOO site. However, we make use of both low salinities (ca. 35.6 ‰ to 35 ‰) and low oxygen (ca. <5 to 110 µM) as indicators for the potential passage of eddies. To compare to the flux events during winter, we show these eddy events with a duration of at least 1 month as bars in Figs. 4 and 5. Note that the events need to be considered carefully as eddies may only pass the mooring site with their periphery. A single oxygen sensor may miss the main signal of the eddy and, hence, not resolve it properly.
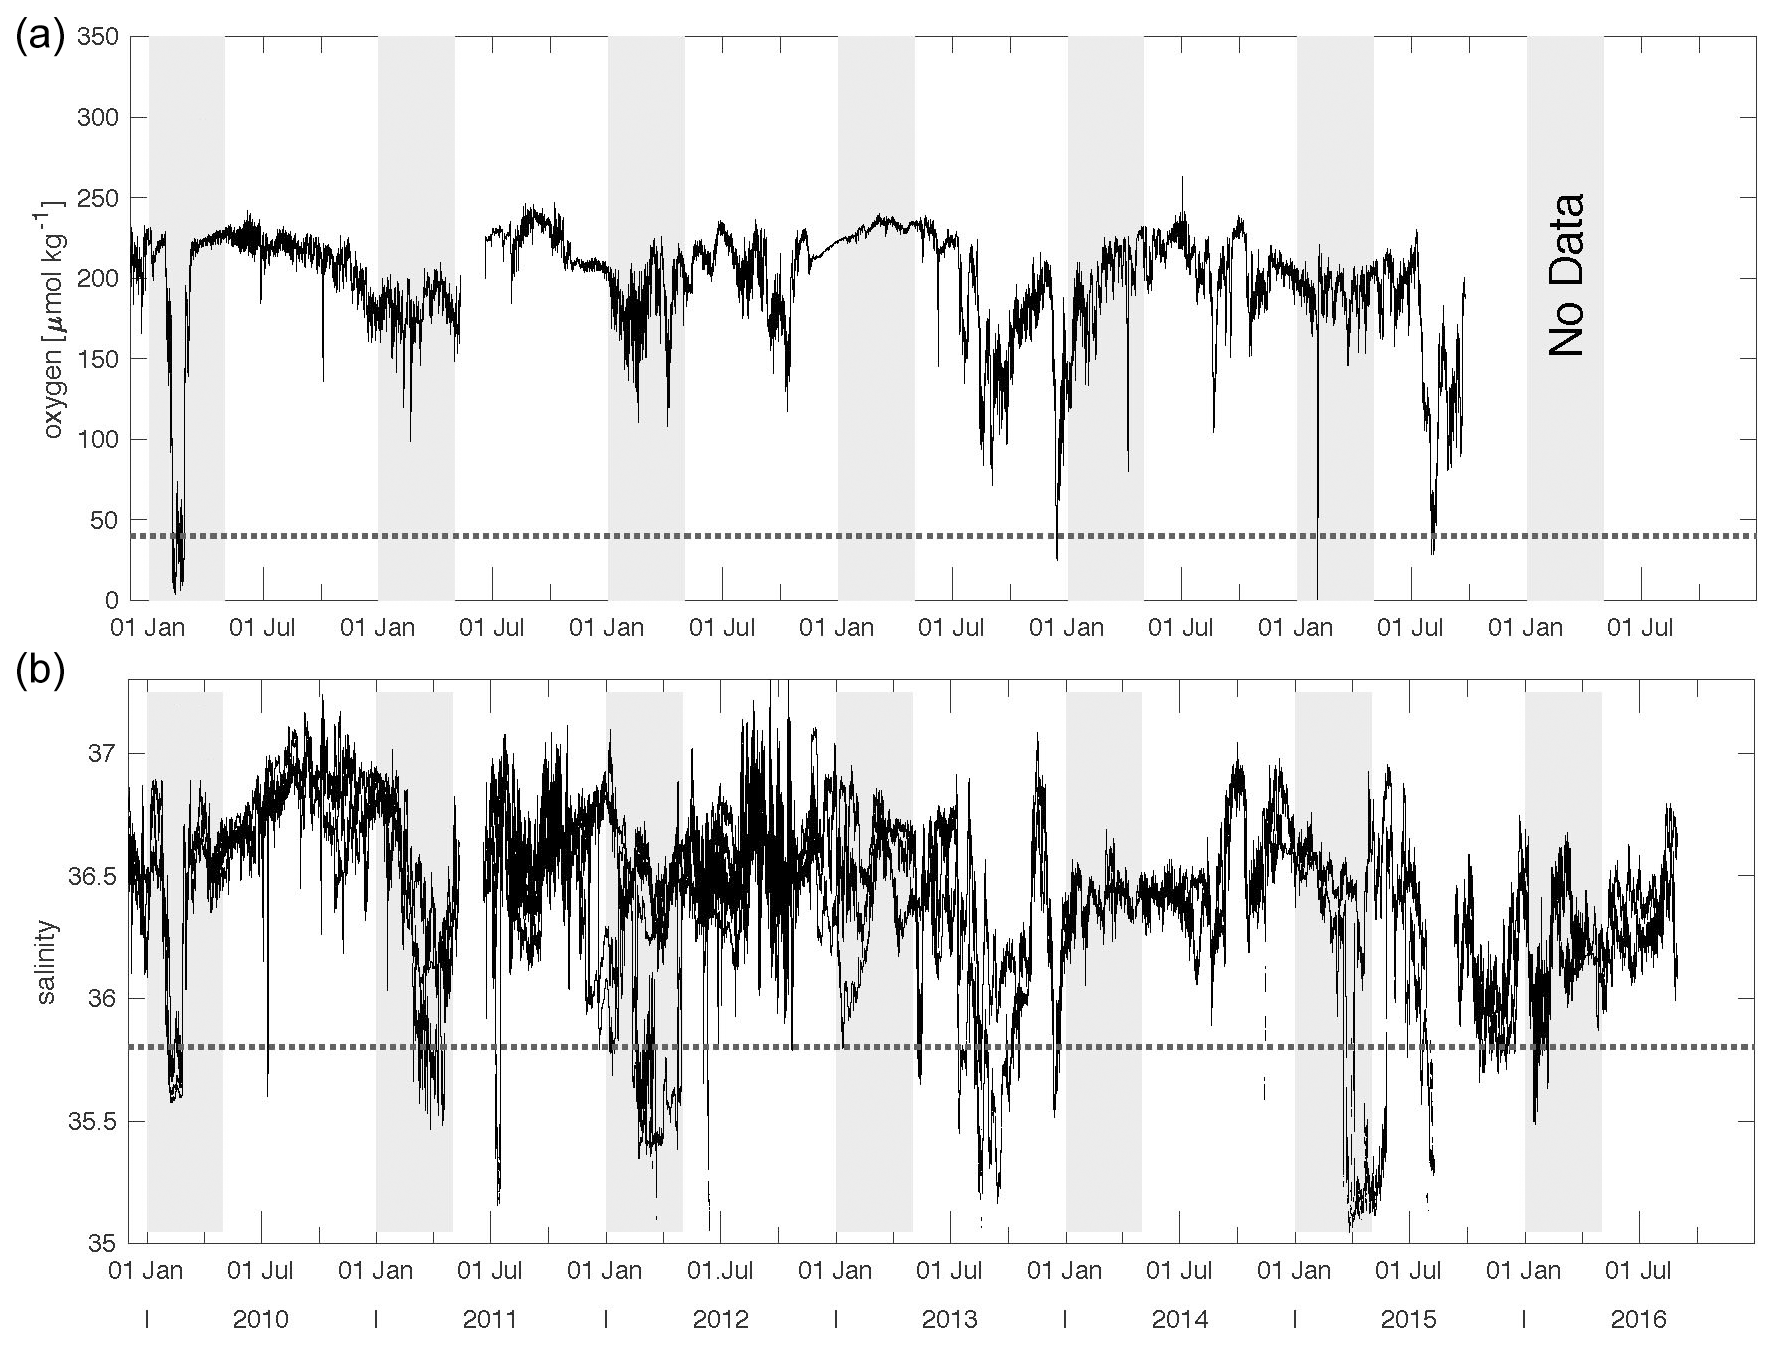
Figure 3CVOO time series of 12 h low-pass oxygen (a, µmol kg−1) and salinity (b, using PSS-78). Dotted lines are considered thresholds that indicate the passage of low-oxygen eddies. Well-isolated eddies of coastal origin are assumed to correlate with low-salinity events and eventually may be paired with low oxygen concentrations. However, a statistically significant relationship between oxygen (based on one sensor) and salinity (based on four to six sensors; see Sects. 2.1 and 3.2) is not found. Grey-shaded areas indicate the periods January to April for reference. For instrument depths see text.
3.3 Time series of sediment trap particle fluxes
The total mass flux was highest during winter at both traps at 1 and 3 km and reached >100 mg m−2 d−1 (Fig. 4). Fluxes started to decrease during spring (except in 2011) and reached a minimum during summer. Mass fluxes increased from late summer until fall, sometimes constituting a maximum during fall (e.g., in 2011, lower traps, Fig. 4b). The only winter–spring flux pattern with values below 50 mg m−2 d−1 was observed during 2011 at both trap depths. Between summer 2010 and spring 2011, total mass fluxes remained below 25 mg m−2 d−1 with low seasonal variability. Mean total mass fluxes for the whole time series were 51 ± 18 and 62 ± 49 mg m−2 d−1 for 1 and 3 km, respectively (Fig. 4). However, this overall increase in flux with increasing depths was mainly due to the exceptionally high mass fluxes to 3 km during 2010 (Fischer et al., 2016). Between 2015 and 2016, total particle fluxes to the upper CVOO-6 trap were above the overall mean of ∼ 51 mg m−2 d−1; however, the trap malfunctioned and the export flux for the complete deployment period was collected in one cup (Fig. 4).
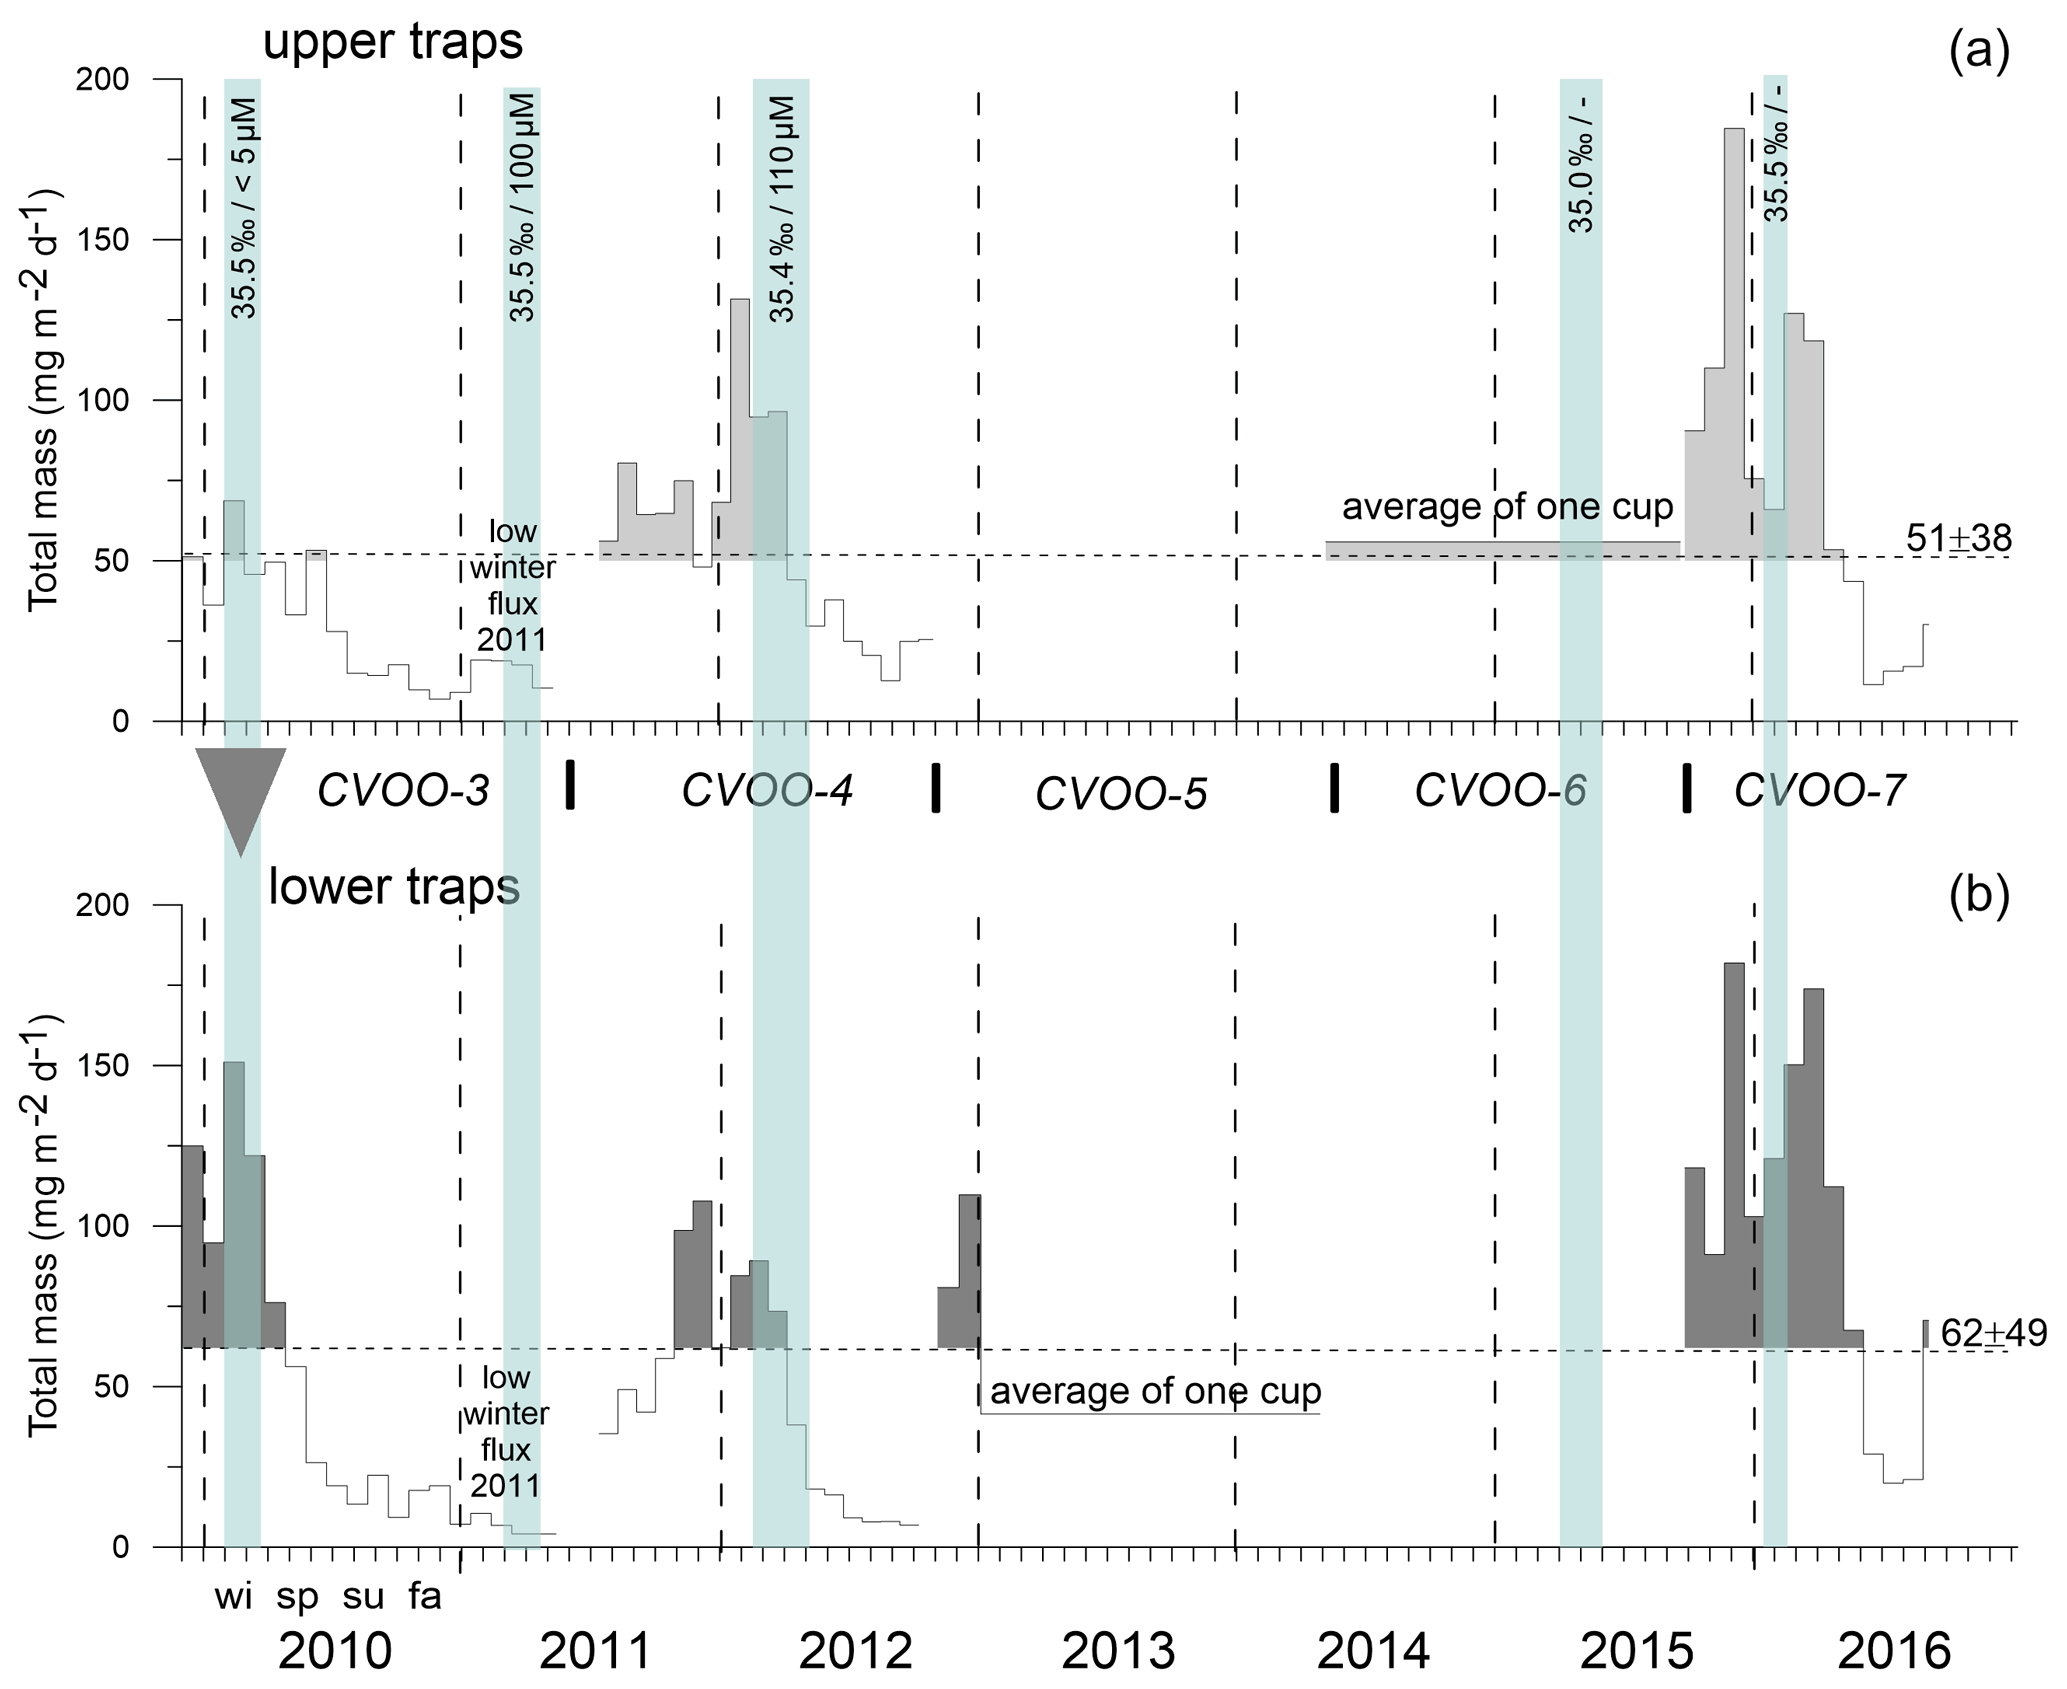
Figure 4Total mass fluxes between 2009 and 2016 for the upper (a) and the lower (b) traps and low-oxygen/low-salinity events during winter of a duration of 1 month and longer (vertical blue bars, with salinity and oxygen concentrations). Means with SD (horizontal dashed lines) were only slightly above typical oligotrophic flux values (ca. 50 mg m−2 d−1; Bory et al., 2001; Fischer et al., 2010; Korte et al., 2017). Peak fluxes (above the means) are shaded grey to indicate maxima during late fall and winter. The grey triangle indicates “flux focusing” during the winter ACME of 2010 (Fischer et al., 2016). Note the low (oligotrophic) fluxes during winter 2011 far below the means. Horizontal dashed lines indicate mean fluxes; vertical lines separate years; wi, sp, su and fa indicate the seasons.
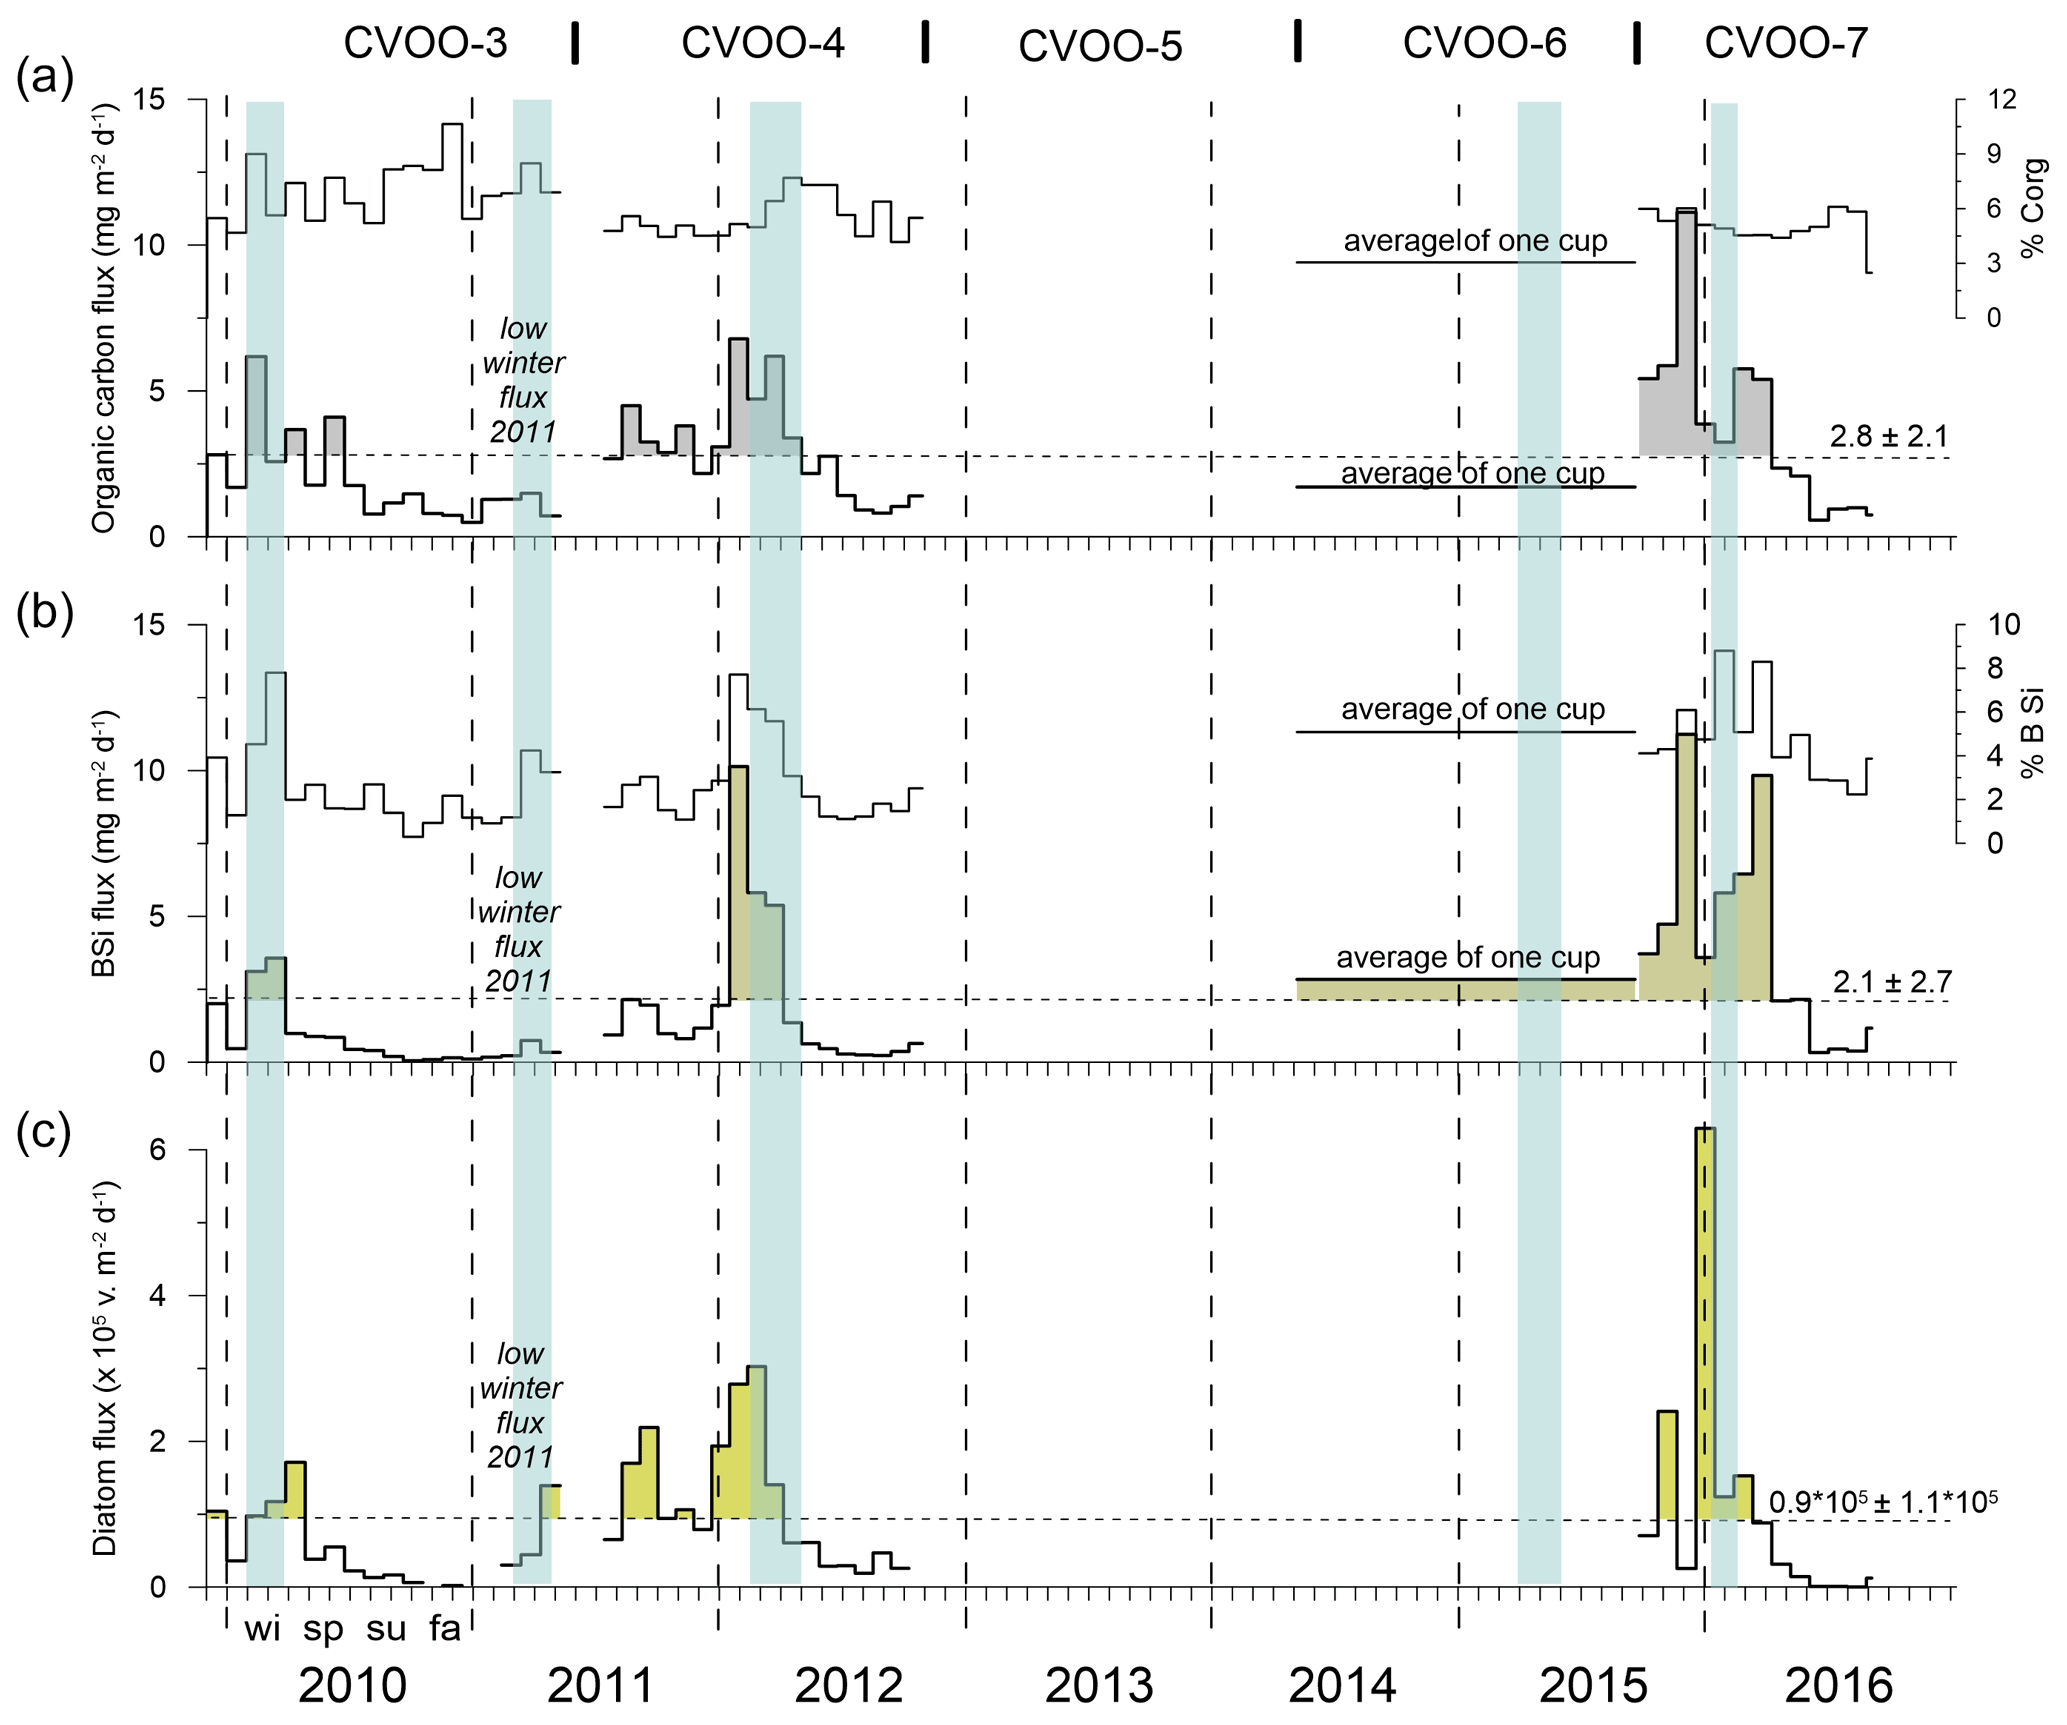
Figure 5Organic carbon (a), BSi (b) and diatom fluxes (c) of the upper traps at CVOO. The relative contribution (%) of organic carbon and BSi to the total flux is given as well. Blue bars indicate the passage of low-oxygen/low-salinity eddies in winter with a duration of 1 month and longer (see text). Flux peaks are highlighted (grey, olive and green) when above the mean values (horizontal dashed lines). Note that the peaks of diatom valves (largely composed of small species) only partly match the BSi fluxes. Vertical dashed lines separate years; wi, sp, su and fa indicate seasons.
Particle fluxes mostly decreased with increasing depth. During the CVOO-3 deployment (2009–2011), peak mass fluxes at both 1 and 3 km were highly correlated (r2 = 0.69; N=16; p value <0.05). The pattern showed no temporal shifts of flux maxima during winter 2010; the flux maxima were collected in the same period despite a vertical distance of 2 km between the two traps. This suggests that the material settled faster than 100 m d−1 (Fischer et al., 2016). During the deployment CVOO-4 (2011–2012), however, the mass flux peak during winter 2012 was delayed by one cup (26.5 d) when comparing the upper and lower traps (Fig. 4), and flux correlations between the two trap depths were weaker, though still statistically significant (r2 = 0.54; N=16; p value <0.05). In 2016 (CVOO-7), particle settling velocities <100 m d−1 were estimated from February to March due to the temporal shift in mass flux maxima by one cup (28 d, Fig. 4). Nevertheless, overall correlations between the upper and lower mass fluxes (CVOO-7) were high (r2 = 0.81; N=13) and statistically significant (p value <0.05).
3.4 Diatom fluxes and community composition
Here we combine new with former diatom data for only the upper traps at CVOO. In an earlier study, Romero et al. (2016) published and discussed diatom fluxes from the mooring deployments CVOO-3 and CVOO-4 (December 2009–October 2012). Here, we add CVOO-7 (September 2015–August 2016, upper traps; Table 1). Marine diatoms delivered most of the BSi flux. Silicoflagellates, radiolarians, the dinoflagellate Actiniscus pentasterias, and land-derived freshwater diatoms and phytoliths were sporadically present. The total diatom flux ranged from 6.2×10⁵ to 2.3×10³ valves m−2 d−1 between December 2009 and August 2016 (average of 9.4×10⁴ valves ± 1.2×10⁵). Diatom maxima (>9.4×10⁴ valves m−2 d−1) mainly occurred during winter and fall (Fig. 5c); minor peaks occurred during the middle of spring 2010 and the middle of spring and late summer 2011. Except for this later maximum, summer generally showed the lowest diatom fluxes.
The marine diatom community was composed of 118 marine species. The average relative contribution of the main diatom species or group of species over the whole trap experiment interval was as follows: Bogorovia cf. spp. (12.11 %), Nitzschia interruptestriata (11.64 %), Nitzschia bicapitata (7.26 %), Nitzschia capuluspalae (5.15 %) and Thalassionema nitzschioides var. parva (5.00 %) (the sum of the average relative contribution of these five species is 41.2 %). Accompanying taxa were resting spores (RSs) of Chaetoceros spp. (3.51 %), Azpeitia tabularis (3.49 %), Fragilariopsis doliolus (3.19 %), Thalassiosira subtilis (2.10 %) and Roperia tesselata (1.90 %).
3.5 Composition of settling particles and flux relationships between upper and lower traps
The overall composition of sinking materials in the upper traps was 2.1 %–5.9 % of BSi, 3.1 %–5.7 % organic carbon, 48 %–68 % of total carbonate and 16 %–36 % of lithogenic material. Lower-trap collections contributed 3.1 %–6.4 % of BSi, 3.2 %–5.7 % of organic carbon, 44 %–58 % of carbonate and 29 %–40 % of lithogenic material to the total mass flux, based on annual means. Excluding the extreme winter 2010 ACME (Fischer et al., 2016), we observe decreasing percentages of BSi and organic carbon with increasing depth and more or less stable contributions of carbonate and lithogenic materials to total flux. Winter C:N ratios were between 8.9 and 10.0 for the upper traps and between 7.1 and 10.4 for the lower traps (excluding the year 2010, Table 3), thus being in the range of partly degraded phytodetritus collected in the deep ocean (Schneider et al., 2003). However, during the 2010 ACME, winter C:N ratios were 13.8 for the upper and 15.5 for the lower traps (Table 3).
Figure 6 shows the changes in total mass fluxes (numbers) and their compositions during winter for the upper traps to reveal the potential flux output of the eddies passing during the winters 2010, 2011, 2012 and 2016 at CVOO. Winter flux compositions varied among years and oceanographic conditions (Fig. 6). Only organic carbon content remained rather constant, despite different total mass and organic carbon fluxes during winter (Fig. 6, Table 3). Under oligotrophic conditions in winter 2011 (Figs. 1b, 2), lithogenic and BSi contributions were low, whereas the percentage of carbonate was high at both trap depths. Particle flux compositions during winters 2010, 2012 and 2016 during low-oxygen ACME passages (Fig. 3) showed comparable values for the upper-trap collections (Fig. 6). Lithogenic content was generally high (around one-third of the total flux), except under oligotrophic conditions during winter 2011 (Fig. 6); during this season, the contribution of lithogenic materials was unusually low (5.4 %) for this region while carbonate amounted to 80 % (Fig. 6). Winters 2012 and 2016 showed similar total fluxes (98 and 96 mg m−2 d−1, respectively) and flux constituents.
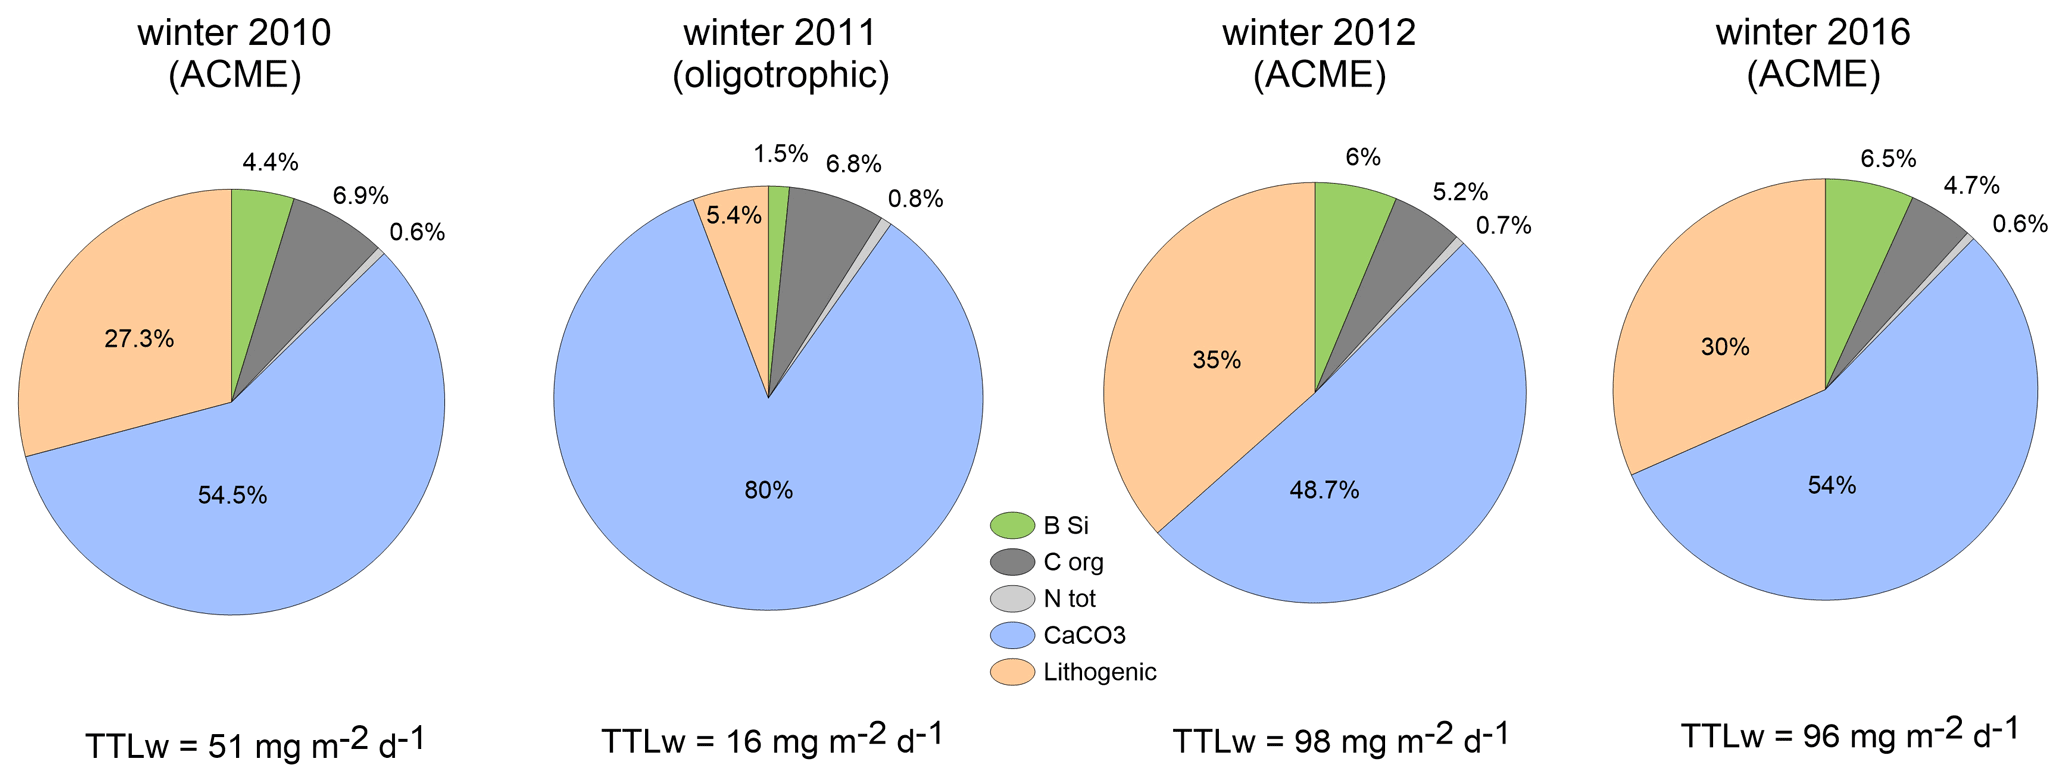
Figure 6Flux compositions during winter (% of total winter mass flux, TTLw) derived from the upper traps during the low-oxygen ACME of 2010 (Fischer et al., 2016), the low-flux (oligotrophic) conditions during winter 2011 (with low lithogenic and high carbonate contents), and the following ACMEs in winter 2012 and winter 2016 (high and almost equal to total fluxes and composition). Lithogenic components constitute approx. one-third of the total flux, except during oligotrophic conditions during winter 2011.
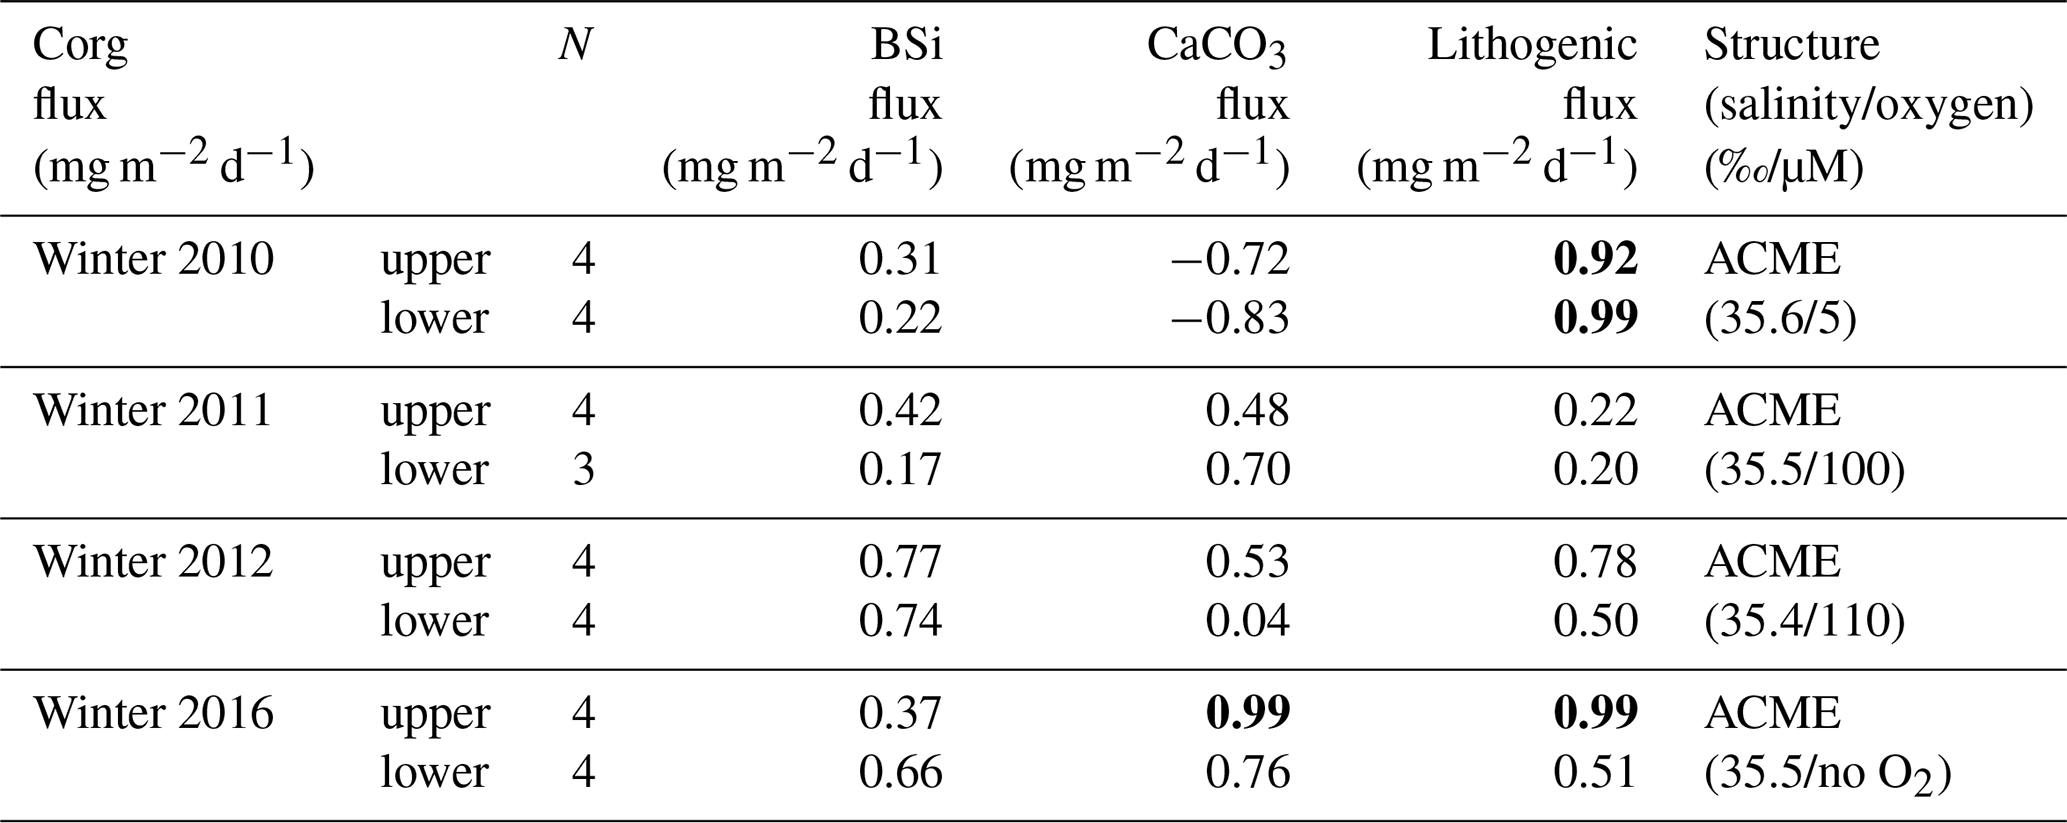
Flux components of both trap depths showed no correlation during winter 2011 under oligotrophic conditions (Table 2). However, winter 2010 showed a high correlation coefficient (above 99 % confidence level) between organic carbon and lithogenic fluxes at both trap depths (Table 2), while none of the other flux components correlated. In contrast, a relatively high r2 between organic carbon and lithogenic fluxes was observed during winter 2012 for the upper trap, indicating differences between both ACMEs in 2010 and 2012. During winter 2012, the correlations between organic carbon and BSi, carbonate and lithogenic fluxes become weaker with increasing depth.
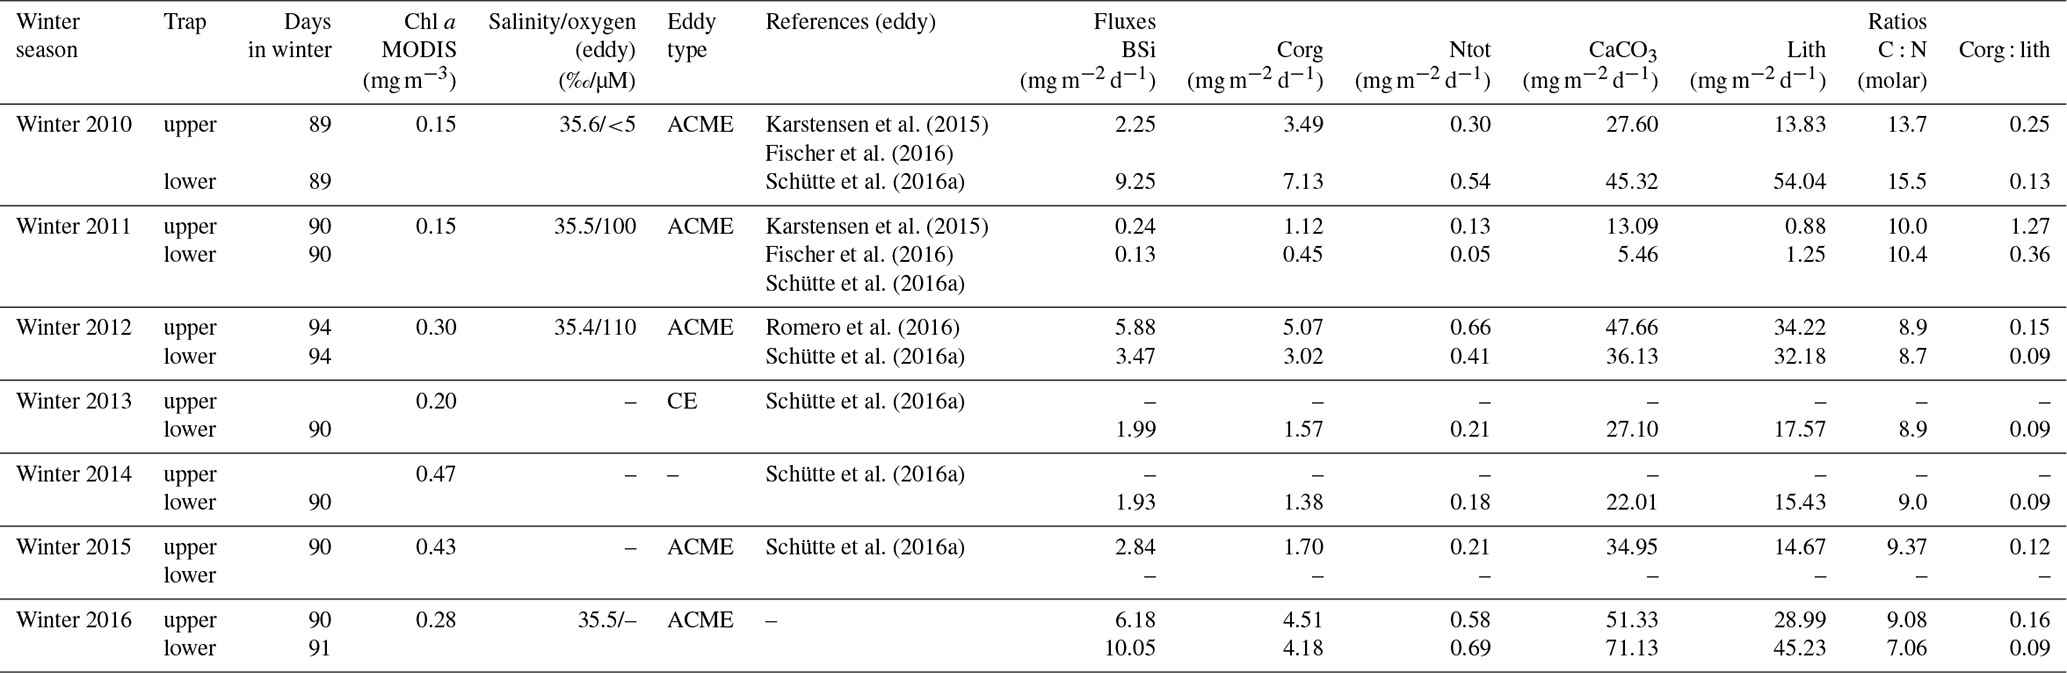
Table 2Flux relationships with correlation coefficients (r2) between organic carbon (Corg) and BSi, CaCO3 and lithogenic material for the winter ACMEs of 2010, 2012 and 2016 and under oligotrophic conditions in 2011. Values at the 99 % confidence level are in bold. The case of the structure is estimated from the salinity (S) and oxygen (O2) upper-water-column recordings from the CVOO site (Fig. 3). The slopes of the flux relationships from the ACMEs of 2012 and 2016 largely match. ACME denotes anticyclonic mode-water eddy.
3.6 Seasonal patterns of biogenic and lithogenic fluxes
The seasonal flux patterns for BSi, organic carbon, total carbonate and the lithogenic components are given in Fig. 7 on a Julian day scale. The flux signals from 2010 showed a high seasonality with discrete peaks from January to February (Fig. 7). The flux peak at 3 km from February to March 2010 was even more pronounced due to flux focusing (Fischer et al., 2016). The year 2012 revealed high fluxes from January to March in the upper trap with a step-like decrease during spring (Fig. 7a). The deeper traps showed higher individual peaks for BSi, organic carbon, total carbonate and the lithogenic fluxes (Fig. 7). When low-oxygen eddies approached, particle fluxes increased stepwise, starting during fall, to values of ca. 100 mg m−2 d−1 (deep traps; Figs. 4, 7), whereafter they declined around the turn of the year, and increased again to form a significant eddy-induced flux peak during late winter to early spring (Fig. 7). Total carbonate flux is a mixture of different primary and secondary producers, i.e., planktonic foraminifera, coccolithophores, pteropods and calcareous dinoflagellates. However, the exact composition of the flux components in different environments is largely unknown and difficult to assess quantitatively (e.g., Guerreiro et al., 2021). This is in part reflected by the different seasonality compared to the other components during the strongest anoxic event observed during February 2010 (Figs. 3, 4), where the total carbonate fluxes (mostly foraminifera; Fischer et al., 2016) showed a minimum (Fig. 7). Furthermore, the carbonate record in the shallow trap during 2010 revealed a completely different seasonality compared to the other flux components with a peak during late spring (June 2010, Fig. 7). During the other years and seasons, carbonate flux patterns are comparable to the other flux components (Fig. 7).
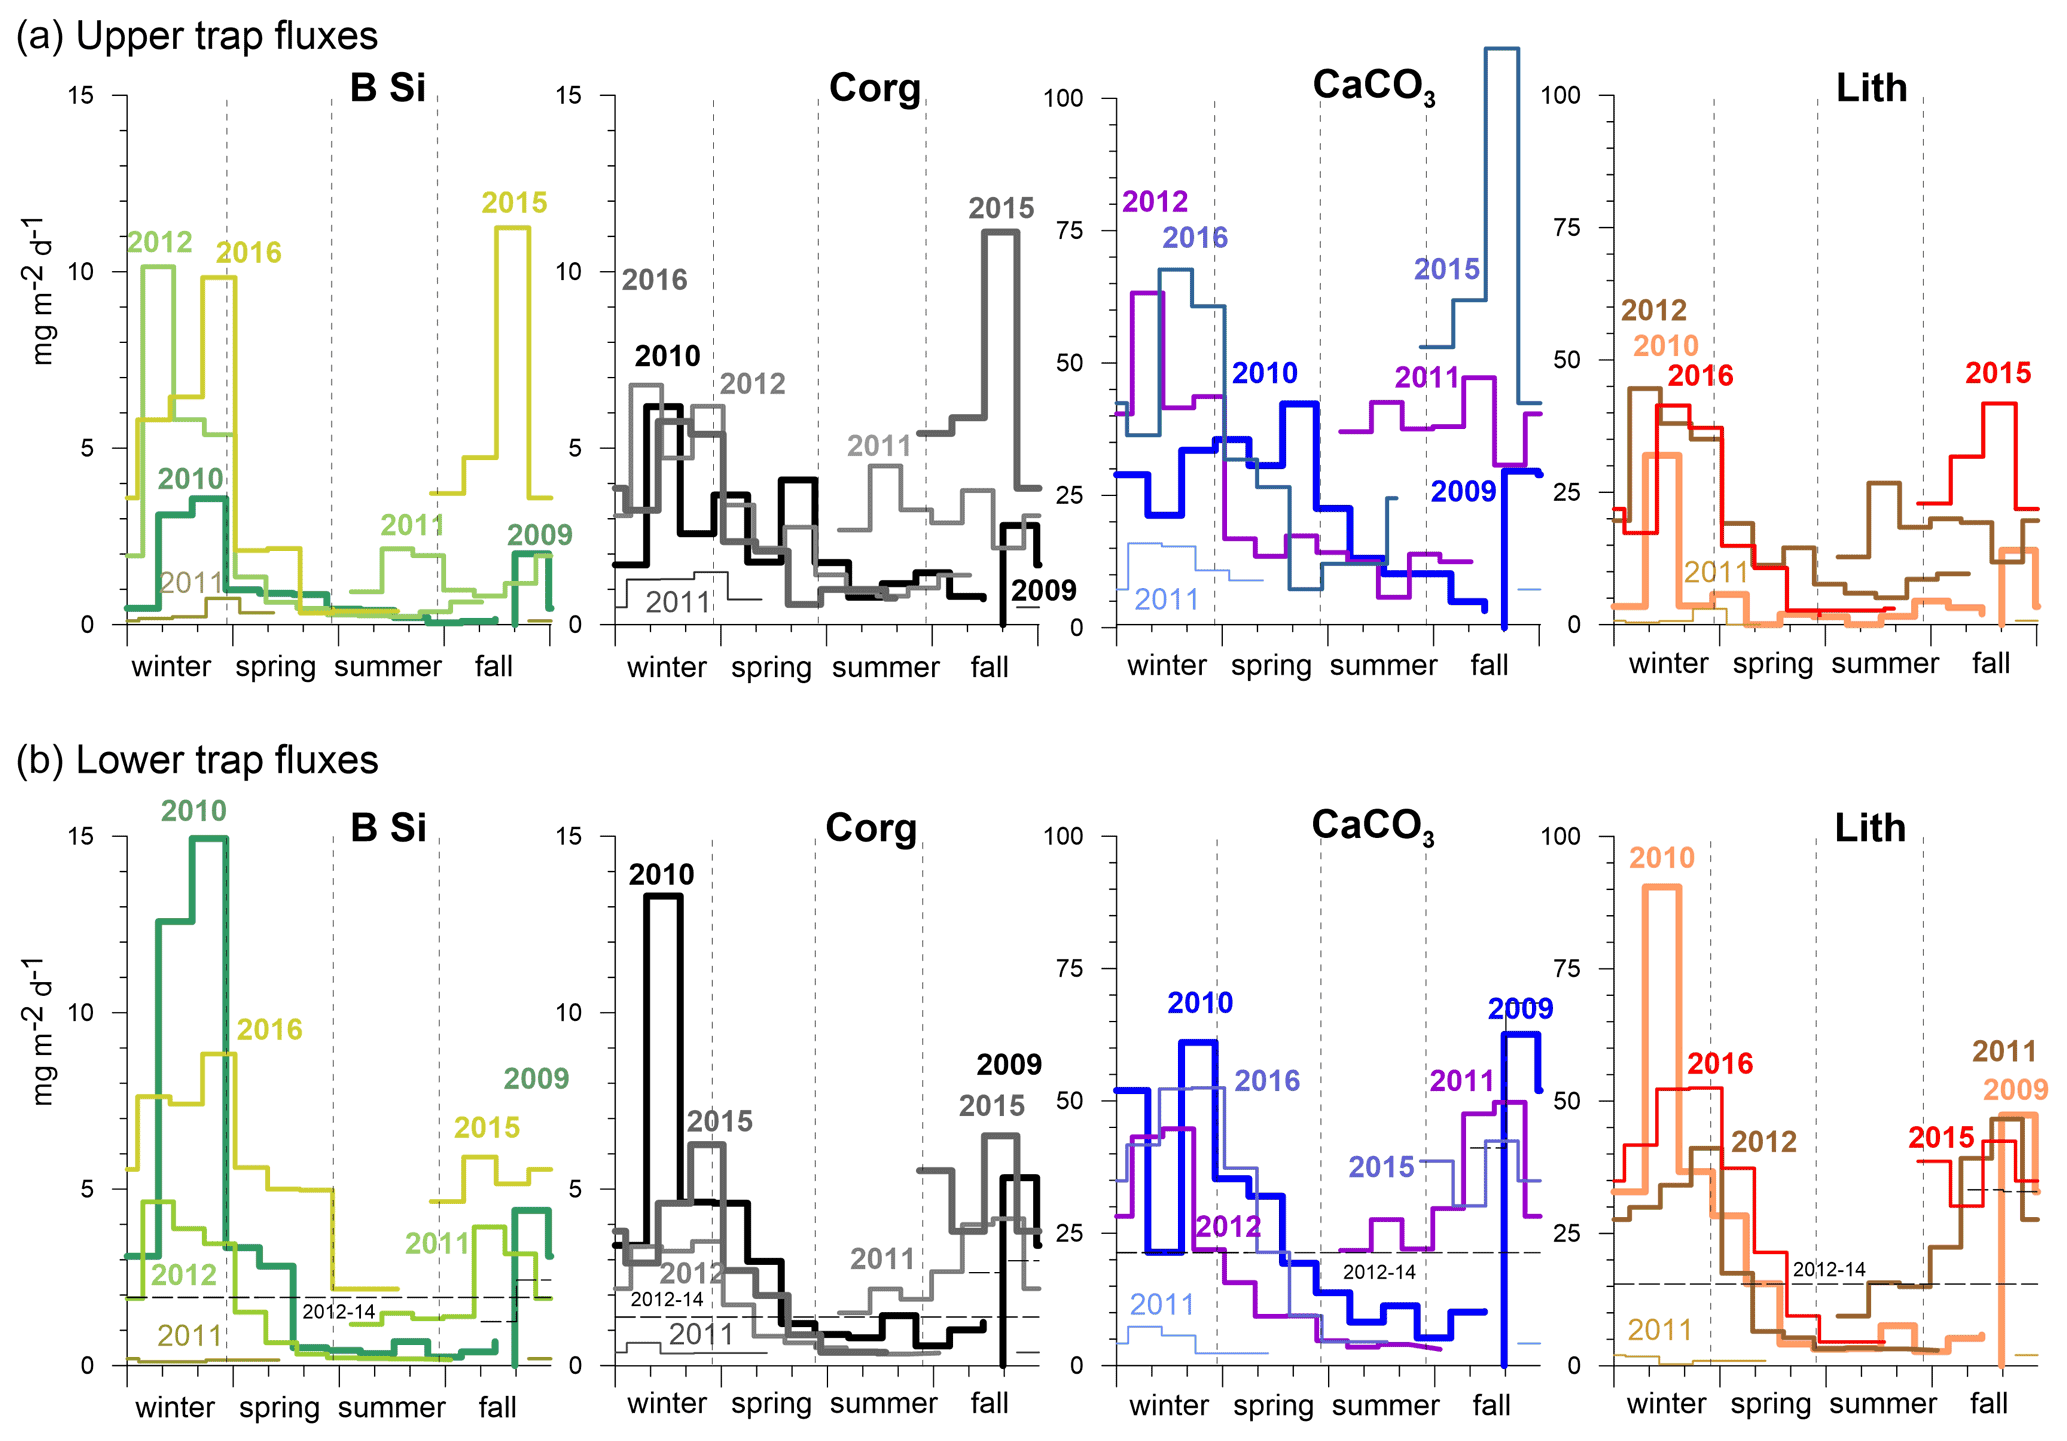
Figure 7Upper (a) and lower (b) trap seasonal flux patterns of BSi, organic carbon, carbonate and lithogenic fluxes on a Julian day scale. In 2013, only one sampling cup was available and collected all the material (Table 1). Note the overall higher seasonality recorded in the lower traps (b) and for BSi at both trap depth levels. During the oligotrophic winter–spring 2011, fluxes remained low compared to the other years, revealing almost no seasonality.
Biogeochemical responses in terms of organic carbon fluxes from different types of eddies in oligotrophic oceans are difficult to quantify (e.g., Fischer et al., 2016). In particular, the transfer mechanisms and processes of organic carbon sequestration associated with eddies are still a matter of controversial debate (e.g., Benitez-Nelson and McGillicuddy, 2008). Here, we focus the discussion on the flux patterns and seasonality of total fluxes and compositions of exported materials associated with the passages of different eddy types north of the Cabo Verde archipelago at CVOO (Fig. 1a), and we further examine organic carbon flux attenuation in the water column between ca. 1 and 3 km water depth in relation to the oxygen availability at epi- and mesopelagic depth.
Table 3Biogeochemical characterization of the different eddies passing CVOO during the winter seasons between 2010 and 2016 with respect to deep-ocean fluxes and compositions. Flux characteristics are also shown for winter 2011 with oligotrophic background conditions. ACME is anticyclonic mode-water eddy; CE is cyclonic eddy. Ntot is total nitrogen.
4.1 Flux patterns and seasonality associated with low-oxygen eddies vs. oligotrophic background sedimentation at CVOO
CVOO is located within a corridor of mesoscale cyclonic eddies (CEs) or anticyclonic eddies (ACEs, including ACME), originating eastward off the west African coast (Fig. 1). Schütte et al. (2016b) found a large variability in oxygen consumption between different types of eddies (CE, ACE, ACME) and surface chlorophyll. They allocated this to (1) differences in the initial conditions in coastal waters where eddies originated and (2) the degree of isolation as well as the external forcing (e.g., wind, dust/iron input) occurring en route to CVOO. As a consequence, one might expect a high variability in the release of particles, seasonality and flux magnitudes derived from different eddies, all of which are also significantly affected by zooplankton communities (e.g., Hauss et al., 2016; Goldthwait and Steinberg, 2008).
The seasonal flux patterns influenced by low-oxygen eddies that reach CVOO during late fall and winter look rather consistent (Fig. 7). Total flux often reached values above 100 mg m−2 d−1 (Figs. 4 and 8a, b) and clearly exceeded the typical fluxes characteristic of oligotrophic settings of ca. 50 mg m−2 d−1 (e.g., Bory et al., 2001; Fischer et al., 2010; Korte et al., 2017 (site M3)) and showed a low to moderate seasonality (Berger and Wefer, 1990). Mean mass fluxes with standard deviations (1 SD) at the oligotrophic site BATS were 31.1 ± 19.0 mg m−2 d−1 to 1500 m and 35.2 ± 16.9 mg m−2 d−1 to 3200 m based on long-term recordings (Conte et al., 2001), substantially lower than the fluxes measured during low-oxygen-eddy passages at CVOO. However, fluxes from BATS are close to the CVOO record during winter 2011 (Figs. 4, 8a) when oligotrophic conditions prevailed at CVOO. Fluxes of BSi and organic carbon at CVOO were very low during winter 2011 (Fig. 7), matching low chlorophyll values (Figs. 1b, 2). The entire flux record (Figs. 4, 8), however, suggests that the oligotrophic conditions during winter 2011 were exceptional and the occurrence of low-oxygen eddies delivering higher particle fluxes mainly during winter is the regular situation at CVOO. This observation supports statements that an existing eddy corridor occurs north of Cabo Verde and that mesoscale eddies seem to be created rather regularly at the coast around summer and reach CVOO during late fall to winter (e.g., Karstensen et al., 2015; Schütte et al., 2016a).
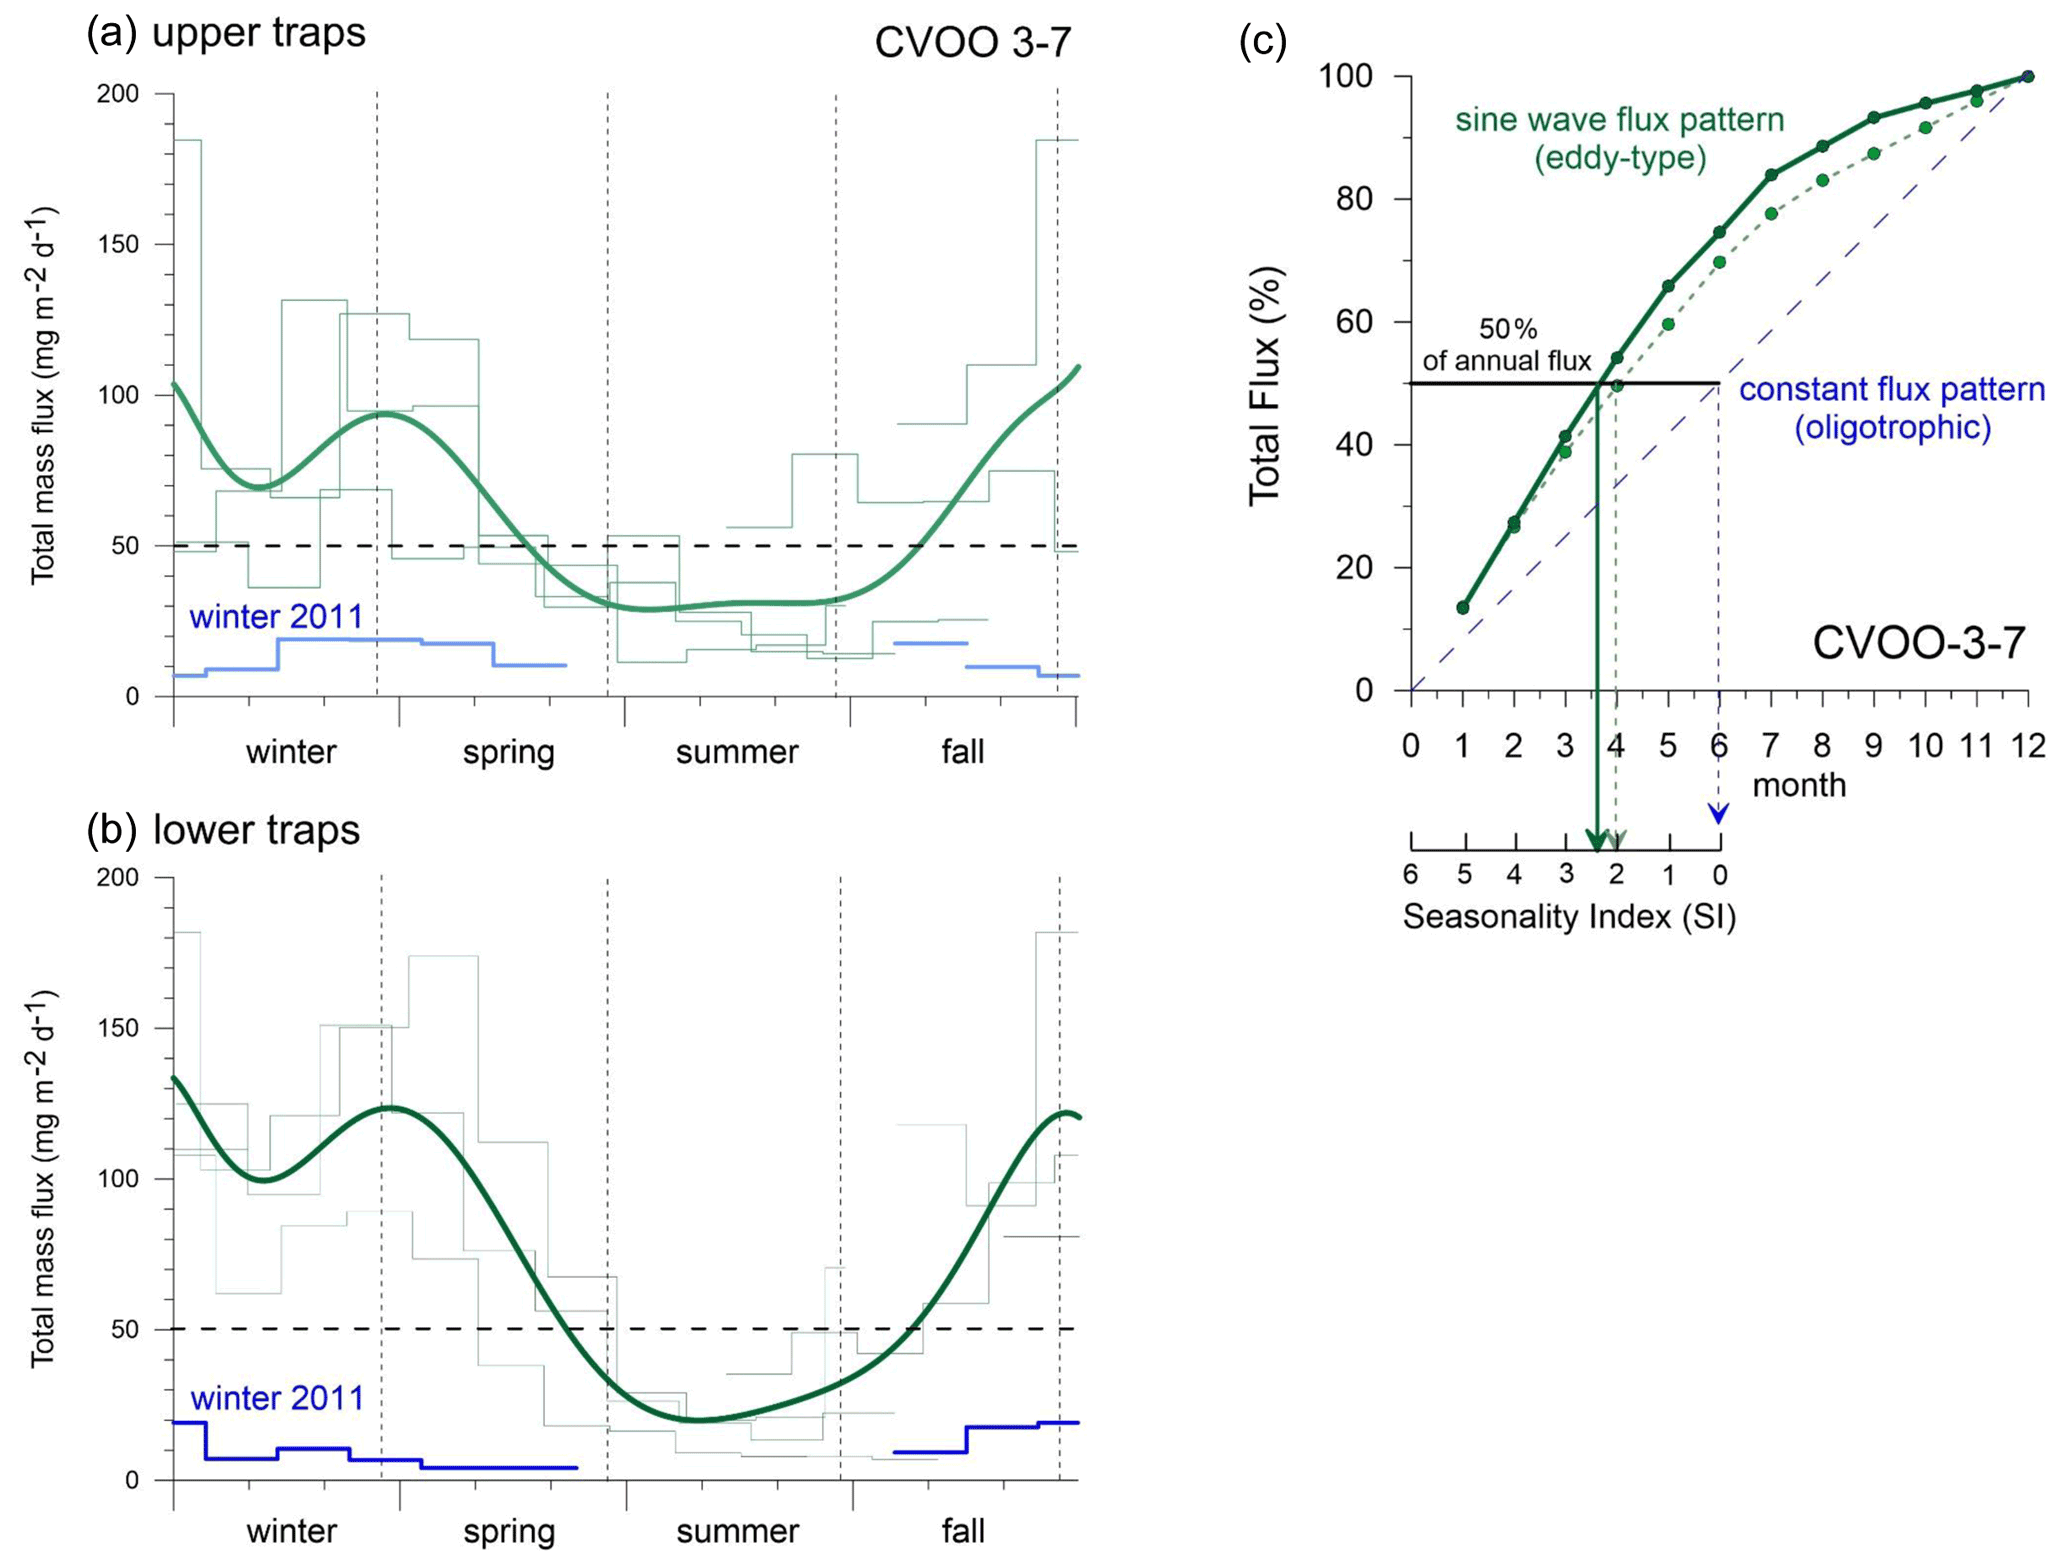
Figure 8Seasonal total flux patterns for the upper (a) and lower (b) traps characteristic of different types of eddies (light and dark green, 9-order polynomial fit) vs. oligotrophic conditions during winter 2011 (blue indicates oligotrophic background with more or less constant flux/productivity pattern and low seasonality, SI index of 0–1 in c) at CVOO. Dashed horizontal line: typical oligotrophic background fluxes (ca. 50 mg m−2 d−1) in the North Atlantic gyre (see text). (c) Sum of total particle fluxes and seasonality index (SI; Berger and Wefer, 1990) for the upper (dashed light green) and lower (dark green) traps taken from the means in (a) and (b). The SI is defined as 6 minus the production half-time in months (Berger and Wefer, 1990). Note the overall higher seasonality (sine wave production) in the lower traps (SI is ca. 2.4 (i.e., 6−3.6)) compared to the upper traps (SI is ca. 2.0 (i.e., 6−4)) during eddy passages (2010, 2012, 2016). For comparison, a constant flux pattern, typical of oligotrophic settings, is shown schematically in (b).
Elevated winter fluxes at CVOO delivered by the different eddies were not generally correlated to particular environmental parameters (Fig. 2). For example, during winter 2010, SSTs remained relatively high while chlorophyll and dust deposition were low (Fig. 2); however, the resulting output of the ACME in terms of fluxes was high (Figs. 4, 7). Comparably high fluxes were recorded for the winter ACMEs in 2012 and 2016 (Figs. 4, 7), although under different environmental conditions (low SSTs, high chlorophyll and dust depositions) (Figs. 1b, 2). Typical oligotrophic fluxes with low seasonality were observed during winter 2011 under environmental forcing similar to that of the extreme winter 2010 ACME. During winter 2011, however, the oxygen drawdown was less severe than during the other winter seasons (Fig. 3), although salinity was low, suggesting the presence of a coastal eddy (ACME) around CVOO (Tables 2, 3). The most severe and longest oxygen drawdown reaching almost anoxia, combined with low salinity, was observed for the entire month of February 2010 (Fig. 3), largely overlapping with the collection period of one sampling cup of the CVOO-3 sediment traps (cup no. 3; Fischer et al., 2016). This resulted in distinct peaks of all fluxes except the total carbonate flux (Fig. 7) and a significant increase in fluxes with depth (Fischer et al., 2016), suggesting that an eddy passed directly over the CVOO mooring site. Overall, only winter organic carbon fluxes to the upper traps tend to increase with satellite chlorophyll (Table 3), but this relationship is statistically not significant (r2 = 0.69; N=4; p value = 0.168). On the other hand, satellite chlorophyll peaks during winter–spring largely followed maxima in the dust deposition rate (Fig. 2), whereby no statistically significant relationship between both satellite-derived environmental parameters is seen. This could indicate that dust may act as some kind of fertilizer (e.g., of nitrogen or phosphate) in the oligotrophic northeastern Atlantic as suggested by Fomba et al. (2014) and Guerreiro et al. (2021).
The interpretation of total carbonate fluxes and its seasonality is complex, largely due to the unknown groups of carbonate-secreting primary and secondary producers contributing to total carbonate. Generally, planktonic foraminifera and coccolithophores constitute the major part in the Atlantic Ocean, while pteropods are less important (e.g., Guerreiro et al., 2021). However, to quantitatively assess coccolithophore carbonate, counts and the size and mass of individual coccoliths of different species (e.g., Guerreiro et al., 2021), performed on very small splits (on the order of or even less), are needed. This method leads to relatively large errors in the calculation of carbonate. In a recent coccolithophore-carbonate flux study conducted in the tropical Atlantic, coccolithophores accounted for ca. 15 % and 23 % of the carbonate mass (minimum values, ca. 1 km traps) in the oligotrophic and mesotrophic settings (Guerreiro et al., 2021). This range of percentages may apply to the CVOO oligotrophic site as well, and it would mean that planktonic foraminifera account for about one-half of the total carbonate flux.
The time-consuming counting of coccolith data was not performed for the complete CVOO-3–CVOO-7 time series, and total carbonate fluxes are therefore not discussed in detail. In the study on the CVOO-3 deployment (2009–2010), however, Fischer et al. (2016) counted coccoliths, planktonic foraminifera and pteropods and estimated carbonate fluxes of these groups. It turned out that pteropods accounted for ca. 4 %–8 % and foraminifera between ca. 32 % and 52 % of the total carbonate fluxes (1290 m trap) during winter 2010 and the passage of the suboxic ACME (Fischer et al., 2016; Karstensen et al., 2015). Unpublished upper-trap carbonate fluxes contributed by coccolithophores ranged between ca. 12 % and 38 % during the ACME passage. The data indicate a sequence of contribution by the carbonate producers at CVOO during winter 2010 from planktonic foraminifera, accounting for roughly about one-half of the carbonate production/flux, followed by slightly lower contributions by coccolithophores and with the lowest contributions by pteropods. The deep-flux pattern of all components showed more distinct peaks and a higher seasonality (SI is ca. 2.4) during the passages of low-oxygen eddies than in the shallower traps (SI is ca. 2.0; Figs. 7, 8). Usually, the upper traps in the open ocean record a higher seasonality (Berger and Wefer, 1990; Conte et al., 2001), which is due to a smaller catchment area and a shorter vertical distance for the settling material between production in surface waters and particle transfer to 1 km compared to the deeper traps. In contrast, seasonality is generally lower in the deep traps (3–4 km; e.g., Conte et al., 2001) due to a larger particle catchment area (Siegel and Deuser, 1997), a longer particle descent time and a higher contribution of particles from lateral advection (McCave, 1984).
The typical pattern of decreasing seasonality with increasing depth was not observed at CVOO (e.g., Fig. 7). This is most likely due to the occurrence of eddies with different particle transports, a potential subduction of particles at frontal systems (e.g., Boyd et al., 2019) and flux focusing during the winter 2010 ACME (Fischer et al., 2016). The latter authors interpreted the 2- to 3-fold increase in winter biogenic and lithogenic flux components between ca. 1 and 3 km water depth (and a perfect match of upper and lower lithogenic fluxes; r2 = 0.97; N=17; p value <0.05) as a concentration mechanism of particles in funnel-like structures (Zhang et al., 2014; Waite et al., 2016), associated with the direct passage of the low-oxygen ACME over the trap location (see also Sect. 4.3). The BSi flux pattern of the upper traps derived from eddies showed a higher seasonality compared to organic carbon and lithogenic fluxes (Fig. 7), the latter two showing a significant correlation (Table 2). This suggests that BSi (mostly from diatoms) and organic carbon together with the non-biogenic components may have had different particle sources within the respective eddies. Diatoms are mostly produced at the eddy edges (Shih et al., 2015) due to vertical nutrient supply (Karstensen et al., 2015), where a strong shear, high turbulence and high particle concentrations could result in the formation of large and fast-settling diatom aggregates (e.g., Kiørboe, 2001). At these frontal zones, a concentration threshold for diatoms to encounter each other and form aggregates may be reached (Jackson and Kiorboe, 2008). Dominant diatoms at CVOO possess small valves (ca. 10–15 µm) but produced high numbers (Fig. 5c) that could not sink individually at high enough rates to form the observed sharp flux peaks (Fig. 7). Larger diatom aggregates may sink passively (biological gravitational pump; Boyd et al., 2019), although their sinking could be accelerated by active subduction at frontal structures (eddy subduction pump; Boyd et al., 2019) to form distinct flux signals to the 1 km traps and below. However, grazing and transfer of biogenic matter via fecal pellets to the bathypelagic may have occurred as well, even under low oxygen concentrations. Preliminary microscopic analysis and fecal pellet counts of cup nos. 1–5 of the deployment CVOO-3 (upper trap) revealed a higher contribution from zooplankton fecal pellets during the period when the low-oxygen eddy (ACME) was passing over the trap position during February 2010 compared to in non-eddy conditions. This was quite surprising but needs further confirmation and studies at CVOO before reliable conclusions can be drawn.
4.2 Diatom sedimentation at CVOO affected by eddies
The predominant occurrence of the highest diatom flux maxima during winter and fall (Fig. 5) temporally matched the passage of ACMEs over CVOO. This seasonal pattern suggests that mesoscale eddies impact diatom productivity through two primary processes, namely (1) pulsed nutrient injections into the sunlit layer and/or (2) horizontal advection of phytoplankton (Gaube et al., 2014). Since ACMEs north of the Cabo Verde archipelago are a hot spot of primary productivity (Hauss et al., 2016) with elevated chlorophyll concentrations (Karstensen et al., 2015; Schütte et al., 2016a), and high content of nitrate, phosphate and silicate in the mixed layer (Fiedler et al., 2016; Karstensen et al., 2017), we favor the scenario of nutrient injection. This promotes diatom productivity under regular, open-ocean oligotrophic conditions and translates into substantially increased productivity in surface waters of the ACME when passing through the CVOO site (Romero et al., 2016).
The seasonal dependence of diatom production on the ACME-associated nutrient delivery resulted in a strong seasonality of the diatom flux occurrence: independent of the year, between ca. 45 % and 65 % of the total yearly diatom fluxes at the CVOO site were captured in intervals shorter than 70 d, leading to strong seasonality. During episodes of nutrient injections, small diatoms may have reproduced fast and valves potentially sank quickly after the formation of large diatom aggregates or the production of fecal pellets, possibly diminishing the chance of being grazed intensively, e.g., by meso-zooplankton (Smetacek, 1985). Earlier observations showed that meso-zooplankton populations were reduced due to suboxia within ACMEs crossing CVOO during winter 2010 (Fischer et al., 2016), and, hence, grazing pressure was likely reduced (Karstensen et al., 2015; Hauss et al., 2016). The decline in diatom maxima by mid-January 2016 was likely due to nutrient depletion (mainly dissolved silica) after the ACME moved further west (Fiedler et al., 2016). The diatom flux returned to values typical of the low-latitude pelagic areas of the oligotrophic northeastern Atlantic Ocean (Mittelstaedt, 1991; Oschlies and Garçon, 1998; Romero et al., 1999) during early spring and summer.
The obvious success of the small-sized diatoms (valve size range of 10–15 µm) during ACME passages possibly lies in their fast growth rates under high-turbulence conditions and the advantage conferred by their small cell size on their efficiency in nutrient uptake (Smetacek, 1985). Although the overall seasonality of total diatom and BSi fluxes broadly matched (winter until mid-spring, Fig. 5), the comparison of major peaks between both parameters showed some leads and lags. This is most evident during winter 2016, when the highest diatom peak occurred between mid-December 2015 and mid-January 2016, while BSi had two peaks: the first between mid-November and mid-December 2015 and the second during March 2016. The temporal difference in the occurrence of peaks of diatoms (microscope counts) and BSi fluxes (chemical analysis) could be related to the temporal contribution of species. The late 2015 to early 2016 diatom peak was dominated by species with valves predominantly smaller than 12 µm in diameter/length, such as T. nitzschioides var. parva, N. bicapitata, N. capuluspalae and RS Chaetoceros, while diatoms with valves larger than 15 µm dominated before and after the main 2016 diatom peak.
The presence of benthic diatom species (Delphineis surirella, Neodelphineis indica and Pseudotriceratium punctatum) in the upper-trap cups (ca. 1 km) was rather low (ca. 5 % of total diatoms) and is attributed to a shallow-water coastal origin. These species are assumed to be transported from the west African coast to CVOO within eddies (Karstensen et al., 2015). The same benthic species have also been found offshore Cap Blanc (Mauritania) at the sediment trap mooring sites CBeu (Romero et al., 2020) and CBmeso (Romero et al., 2021). Their occurrence in the sediment trap samples in the hemipelagic points to lateral transport within the eddy from the inner shelf (<50 m) of the African coast to CVOO. Taking all oceanographic, biogeochemical and biological observations together, an origin of benthic diatom groups of the southward-lying Cabo Verde Plateau to CVOO seems rather unlikely.
4.3 Carbon flux attenuation and transport within eddies and under oligotrophic conditions
Studies from the OMZ in the eastern tropical Atlantic have shown that organic carbon flux attenuation of large particles is reduced, thereby increasing the efficiency of the biological carbon pump (Rasse and Dall'Olmo, 2019). However, small particles seem to react differently and show a normal to higher attenuation inside the OMZ compared to the outside where enough oxygen is available (Rasse and Dall'Olmo, 2019). During the winter 2010 ACME, organic carbon fluxes increased more than 2-fold with increasing depth due to flux focusing (Fischer et al., 2016; Table 2; Figs. 7, 9). In addition, other biogenic flux components such as BSi but also the lithogenic material increased strongly and simultaneously with increasing depth by a factor of ca. 2 to 3. Fischer et al. (2016) interpreted this observation as a concentration mechanism of particles in a funnel-like structure associated with the direct passage of the ACME over the trap location. Waite et al. (2016) named this the “wineglass effect”. Other authors described funnel-like eddy structures from oceanographic observations (e.g., Zhang et al., 2014; Waite et al., 2016). However, the downward transport of larger marine snow particles which may occur in spiral-like trajectories within eddies is unknown from direct observations.
During oligotrophic conditions as observed for winter and spring 2011, however, organic carbon fluxes showed a slope comparable to the Martin curve (open-ocean composite) or the log line (Fig. 9). During winters 2012 and 2016, when ACMEs reached CVOO, the deep-ocean fluxes clearly exceeded the projected values from the Martin curve (Fig. 9). Low oxygen values in the epipelagic during the 2012 ACME (Schütte et al., 2016a) might have reduced organic carbon degradation (Fischer et al., 2016). This decreased degradation in the epipelagic, however, would also have caused higher flux to the upper traps deployed at 1 km. This leads to the question of which potential factors act to reduce organic carbon degradation in the bathypelagic. According to Iversen and Ploug (2010), particle settling rates are critical for carbon flux attenuation and are primarily influenced by ballast content, composition and density of the settling particles (Ploug et al., 2008). A highly ballasted particle stock within eddies, most probably due to high dust dry deposition during winter in this region (Gama et al., 2015), could contribute to lower carbon flux attenuation during eddy passages, also in the deeper water column. On the other hand, an active downward transport of particles at frontal systems, i.e., at the boundaries of these structures, should be considered (eddy subduction pump; Boyd et al., 2019), thus reducing carbon degradation and leading to higher carbon fluxes above the predicted values (Martin et al., 1987).

Figure 9Carbon flux attenuation (log–log plot) in the water column during winter (a) and spring (b) for 2010 (extremely low oxygen ACME), 2011 (oligotrophic situation), 2012 and 2016 (ACME). Attenuation according to Martin et al. (1987; with , orange line) is shown. Note a more reduced carbon flux attenuation than that predicted by the Martin curve during the winters 2010, 2012 and 2016, when low-oxygen and low-salinity eddies passed. During the extreme winter 2010 ACME, deep-ocean fluxes increased strongly with depth (also in spring) due to flux focusing (arrows; Fischer et al., 2016). Fluxes more typical of oligotrophic conditions and carbon flux attenuation occurred in winter and spring 2011.
Estimated carbon fluxes at 100 m (flux below the photic zone) from the deep traps were between ca. 5.5 and 19.5 mg C m−2 (winter means), including the oligotrophic background scenario of winter 2011 (ca. 12 mg C m−2 d−1; Fig. 9). The highest value of 19.5 mg C m−2 d−1 during winter 2012 was about 1 order of magnitude lower compared to organic carbon fluxes of 190–230 mg m−2 d−1 at 100 m derived from oxygen consumption rates during March 2014 at CVOO (Fiedler et al., 2016). This discrepancy may be due to a strong variability in productivity and export flux between the different eddies (2012 and 2014) or caused by short-term seasonal changes in the oxygen consumption rates. At the nearby oligotrophic sediment trap site NASG in the North Atlantic subtropical gyre, a POC export flux of ca. 15 mg m−2 d−1 at 100 m was obtained, decreasing severely in the mesopelagic to almost zero at ca. 1 km water depth (Marsay et al., 2015). In the CVOO recordings, organic carbon fluxes during winter 2011 were 1.12 and 0.45 mg m−2 d−1 to the 1 km trap during oligotrophic conditions, which resembles findings from NASG (Marsay et al., 2015). During the other years, winter organic carbon fluxes at ca. 1 km were significantly higher at CVOO (3.5–5 mg C m−2 d−1, Table 3, Fig. 9) compared to typical oligotrophic settings in the NE Atlantic Ocean.
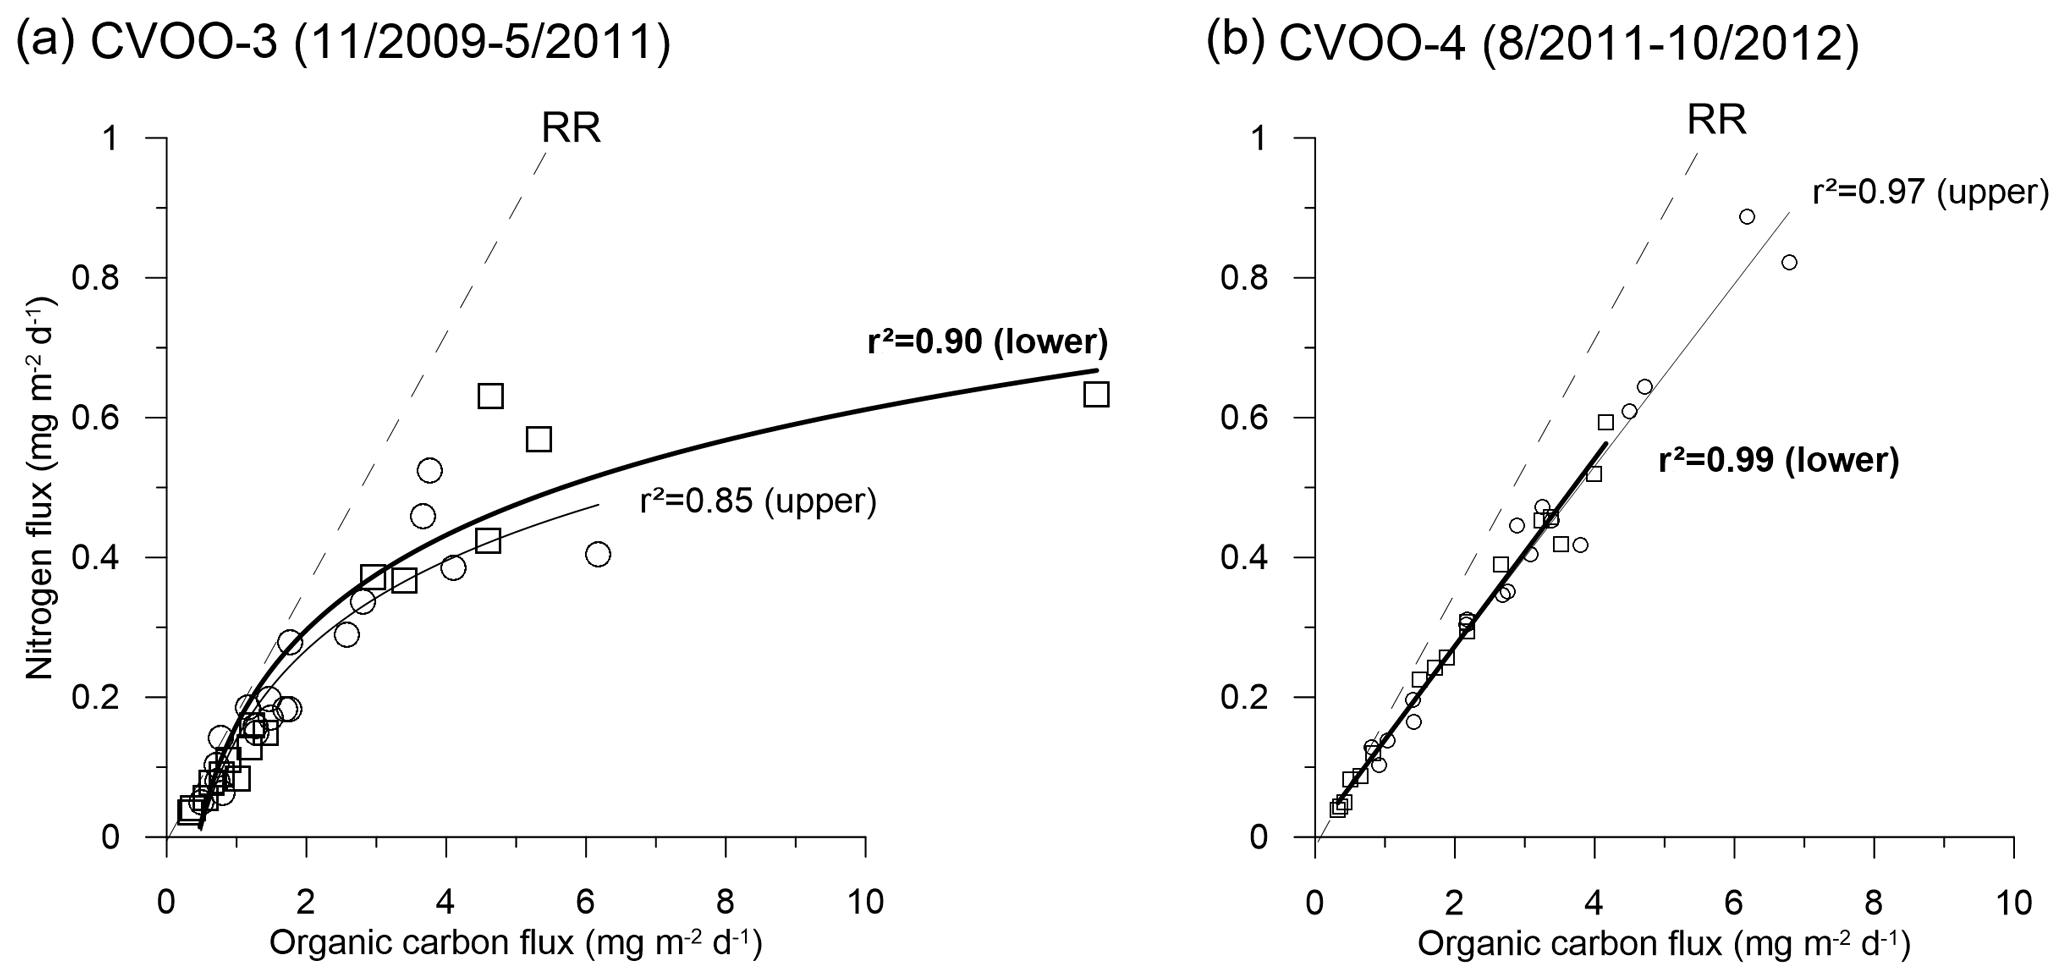
Figure 10Different C:N flux relationships (best fits) during the 2010 and 2012 ACME passages during fall–winter (2011 oligotrophic fluxes are included in a); RR is the Redfield ratio (Redfield et al., 1963). Note the non-linear changes during the extreme 2010 ACME (a), pointing to nitrogen limitation, and, for comparison, the linear relationship later in 2012 (b).
Altogether, carbon fluxes during eddy passages (Fig. 7) seem to indicate that attenuation was reduced at between ca. 1 and 3 km water depth (Fig. 9). This cannot be linked to the OMZ, which occurs between ca. 75 and 400 m water depth (Schütte et al., 2016a). The increased fluxes compared to the background situations (low biomass combined with less severe oxygen drawdown; Figs. 1b, 2, 3) may be due to a combination of higher production due to local eddy upwelling, higher aggregate formation due to the concentration of small diatoms at the eddy boundaries (Shih et al., 2015) and low oxygen concentrations, limiting degradation of the organic matter in the upper water column, i.e., allowing more organic matter to sink to the deep ocean. Whether the latter is due to reduced zooplankton grazing or less microbial degradation or both needs further exploration of particle formation and fluxes and of degradation in the epi- and mesopelagic.
Except during the extreme winter 2010 ACME, the molar C:N ratios were between ca. 9 and 10, falling in the range for degraded marine phytoplankton detritus (Conte et al., 2001; Schneider et al., 2003; Fischer et al., 2010) (Table 3). Only during winter 2016 does a mean C:N value of 7.1 point to rather fresh material sinking to the 3 km trap (Table 3). Under oligotrophic conditions during winter 2011, C:N ratios were slightly higher (10–10.4) than during the eddies in 2012 (8.7–8.9) and 2016 (7–9). This could point to a higher degradation due to zooplankton grazing during winter 2011. Other potential causes for these elevated C:N rations might be a more distant source (lateral advection) and, thus, an older age of particles combined with a higher degradation of particles reaching the trap during winter 2011.
However, during the extreme winter ACME in 2010, Fischer et al. (2016) obtained mean C:N ratios of 13.5 and 15.7 at 1 and 3 km depth, respectively, which is far above the classical Redfield ratio (Redfield et al., 1963) and typical sediment trap values for degraded phytodetritus in the bathypelagic (Schneider et al., 2003; Martin et al., 1987; Conte et al., 2001). The high values suggest the sedimentation of highly degraded zooplankton fecal pellets or very slowly settling organic matter. However, estimated settling rates of particles during the low-oxygen ACME during winter 2010 contradict this scenario (Fischer et al., 2016). The C:N ratios during the 2010 ACME (CVOO-3, both depths) provided a best fit with a non-linear function, whereas the 2012 data (CVOO-4, both depths) showed a normal linear relationship with a high correlation coefficient (Fig. 10). Investigating the composition of organic matter during the winter 2010 ACME, Fischer et al. (2016) argued that the unusually high C:N ratios may be best explained by nitrate limitation in the surface layer of the eddy. Nitrogen limitation and recycling within low-oxygen ACMEs are also considered (Karstensen et al., 2017; Löscher et al., 2015). Individual collection cups provided C:N ratios as high as 25 (deep traps; Fischer et al., 2016). Based on the organic carbon composition, we conclude that the conditions prevailing in the surface layer of the eddies during 2010, 2012 and 2016 were different, despite the fact they were characterized as ACMEs (Schütte et al., 2016a) (Table 2). Indeed, the oxygen anomaly during winter 2010 was lower and of a longer duration (the entire month of February 2010 approaching zero oxygen) compared to during 2012 (Fig. 3; Schütte et al., 2016a), thus suggesting different biogeochemical conditions. However, a relationship between fluxes (e.g., of organic carbon) and the oxygen drawdown and duration of low-oxygen conditions due to eddy passages over CVOO cannot be observed.
Multi-year monitoring of the biogeochemical particle fluxes of passing eddies north of the Cabo Verde islands (CVOO, oligotrophic setting) revealed the following major findings. During eddy passages during the winters of 2010, 2012 and 2016, particle fluxes showed a consistent seasonal flux pattern with increasing fluxes in fall, a decrease at the turn of the year and maxima around February–March. The flux of BSi showed a stronger seasonal pattern with distinct peaks compared to those of organic carbon and the lithogenic component. In addition, BSi flux patterns at 3 km depth revealed a higher seasonality compared to the BSi flux collected at 1 km depth, which was interpreted to be due to passages of low-oxygen eddies. The diatom assemblage during winter eddy passages was dominated by small diatom species, and the diatom flux was not related to the organic carbon or BSi fluxes. Such small species were presumably transported downward within large fast-settling diatom aggregates or fecal pellets. We speculate that BSi and Corg/lithogenics originate from different sources within the eddies and are transported differently to depth. Large BSi-rich ballasted aggregates containing diatoms may be formed at the eddy boundaries where high shear and turbulence occurs and may be actively transported downward (via the eddy subduction pump; Boyd et al., 2019) at the eddy boundaries to constitute distinct flux peaks at depth. Carbon flux attenuation between ca. 1 and 3 km at CVOO appears to be limited during low-oxygen-eddy passages when compared to the Martin curve (open-ocean composite). This may be due to a combination of reduced microbial degradation of organic carbon and/or lower zooplankton grazing under low oxygen availability within the eddies. We suggest that highly productive and low-oxygen eddies (ACMEs) at CVOO sequester more carbon (except in winter 2011) compared to oligotrophic conditions combined with a less severe OMZ in the epi- and mesopelagic of the eastern North Atlantic.
This study presents particle fluxes over a ca. 7-year-long period from the CVOO oligotrophic site characterized by a regular passage of low-oxygen eddies containing elevated phytoplankton biomass. This resulted in significantly higher organic carbon fluxes than during oligotrophic conditions at CVOO (during winter 2011) or in the North Atlantic subtropical gyre (e.g., sites EUMELI-oligo, NASG or BATS). This study supports other findings, suggesting a positive effect of low-oxygen-eddy structures or OMZs on organic carbon export and sequestration (e.g., Weber and Bianchi, 2020). Given that similar eddies (e.g., ACMEs) with comparable oxygen/salinity conditions release different flux signals and compositions at bathypelagic depths, it can be suggested that productivity is intermittent and may be triggered by vertical nutrient flux into the euphotic zone. Sampling with a single mooring could be another reason for the discrepancies because eddies approaching CVOO can directly move over the mooring site (i.e., flux focusing during the winter 2010 ACME; Fischer et al., 2016) or could affect CVOO only marginally. Deep-ocean sediment traps collect particles from a relatively large surface area (100 km2 or more; Siegel and Deuser, 1997); therefore the traps record flux signals from more remote areas. In contrast, oxygen and salinity were directly measured with sensors at the CVOO mooring line, and, thus, a comparison of both time series (sediment traps and sensors) will be limited.
Data are available at https://www.pangaea.de (https://doi.org/10.1594/PANGAEA.931052) (last access: 7 April 2021, Fischer and Romero, 2021).
GF and OER wrote the manuscript. AK and JK devised the study at CVOO (GEOMAR) and provided the oxygen and the oceanographic data. MI, NM and KHB contributed to the interpretation and discussion of results. MK and GR prepared the sediment traps and performed the sample analysis.
The contact author has declared that neither they nor their co-authors have any competing interests.
Publisher’s note: Copernicus Publications remains neutral with regard to jurisdictional claims in published maps and institutional affiliations.
This article is part of the special issue “Concerted multidisciplinary and multi-platform eddy studies off West Africa: mesoscale and sub-mesoscale dynamics and physical-chemical-biological coupling (BG/ESSD/OS inter-journal SI)”. It is not associated with a conference.
We are grateful to Gerd Niehus, Uwe Papenburg and Christian Begler (GEOMAR, Kiel, Germany) for the planning and deployment of the mooring arrays at CVOO. We are also indebted to the chief scientist Peter Brandt (GEOMAR). We thank the captains and crews of RV Meteor and RV MS Merian for help and assistance in deployments and recoveries of the mooring systems. We also thank Janice Malnati for CHN measurements. This work was supported through the DFG Cluster of Excellence “The Ocean in the Earth System” (MARUM), EXC 2077 390741603. Additional support was provided by the DFG Collaborative Research Centre 754 at GEOMAR. CVOO is part of the OceanSITES network. This research was also supported by a BMBF grant (03F0815D) to Gerhard Fischer and Morten Iversen through REEBUS WP-6 (MARE-N). We thank the two anonymous reviewers and the editorial team of BG for helping to improve and for handling the manuscript.
This research has been supported by the Bundesministerium für Bildung und Forschung (grant no. 03F0815D).
The article processing charges for this open-access publication were covered by the University of Bremen.
This paper was edited by Markus Kienast and reviewed by two anonymous referees.
Benitez-Nelson, C. R. and McGillicuddy, D. J.: Mesoscale physical–biological–biogeochemical linkages in the open ocean: An introduction to the results of the E-Flux and EDDIES programs, Deep-Sea Res. Pt. II, 55, 1133–1138, https://doi.org/10.1016/j.dsr2.2008.03.001, 2008.
Berger, W. H. and Wefer, G.: Export production: seasonality and intermittency, and paleoceanographic implications, Palaeogeogr., Palaeocl., 89, 245–254, https://doi.org/10.1016/0921-8181(90)90020-D, 1990.
Boyd, P. W., Claustre, H., Levy, M., Siegel, D. A., and Weber, T.: Multi-faceted particle pumps drive carbon sequestration in the ocean, Nature, 568, 327–335, 2019.
Bory, A., Jeandel, C., Leblond, N., Vangriesheim, A., Khripounoff, A., Beaufort, L., Rabouille, C., Nicolas, E., Tachikawa, K., Etcheber, H., and Buat-Menard, P.: Particle flux within different productivity regimes off the Mauritanian upwelling zone (EUMELI program), Deep-Sea Res. Pt. II, 48, 2251–2282, 2001.
Buesseler, K., Antia, A., Chen, M., Fowler, S., Gardner, W., Gustafsson, O., Harada, K., Michaels, A., van der Loeff, M., Sarin, M. M., Steinberg, D., and Trull, T.: An assessment of the use of sediment traps for estimating upper ocean particle fuxes, J. Mar. Res., 65, 345–416, https://doi.org/10.1357/002224007781567621, 2007.
Buesseler, K. O., Lamborg, C., Cai, P., Escoube, R., Johnson, R., Pike, S., Masque, P., McGillicuddy, D., and Verdeny, E.: Particle fluxes associated with mesoscale eddies in the Sargasso Sea, Deep-Sea Res. Pt. II, 55, 1426–1444, https://doi.org/10.1016/j.dsr2.2008.02.007, 2008.
Brandt, P., Bange, H. W., Banyte, D., Dengler, M., Didwischus, S.-H., Fischer, T., Greatbatch, R. J., Hahn, J., Kanzow, T., Karstensen, J., Körtzinger, A., Krahmann, G., Schmidtko, S., Stramma, L., Tanhua, T., and Visbeck, M.: On the role of circulation and mixing in the ventilation of oxygen minimum zones with a focus on the eastern tropical North Atlantic, Biogeosciences, 12, 489–512, https://doi.org/10.5194/bg-12-489-2015, 2015.
Cael, B. B., Bisson, K., Conte, M., Duret, M. T., Follett, C. L., and Henson, S. A., Honda, M. C., Iversen, M. H., Karl, D. M. , Lampitt, R. S., Mouw, C. B. , Muller-Karger, F. , Pebody, C. A., Smith Jr., K. L., and Talmy, D.: Open ocean particle flux variability from surface to seafloor, Geophys. Res. Lett., 48, e2021GL092895, https://doi.org/10.1029/2021GL092895, 2021.
Christiansen, S., Hoving, H., Schütte, F., Hauss, H., Karstensen, J., Körtzinger, A., Schröder, S., Stemmann, L., Christiansen, B., Picheral, M., Brandt, P., Robison, B., Koch, R., and Kiko, R.: Particulate matter flux interception in oceanic mesoscale eddies by the polychaete Poeobius sp., Limnol. Oceanogr., 63, 2093–2109, https://doi.org/10.1002/lno.10926, 2018.
Conte, M. H., Ralph, N., and Ross, E. H.: Seasonal and interannual variability in deep ocean particle fluxes at the Oceanic Flux Program (OFP)/Bermuda Atlantic Time Series (BATS) site in the western Sargasso Sea near Bermuda, Deep-Sea Res. Pt. II, 48, 8–9, 1471-1505, https://doi.org/10.1016/S0967-0645(00)00150-8, 2001.
Fiedler, B., Grundle, D. S., Schütte, F., Karstensen, J., Löscher, C. R., Hauss, H., Wagner, H., Loginova, A., Kiko, R., Silva, P., Tanhua, T., and Körtzinger, A.: Oxygen utilization and downward carbon flux in an oxygen-depleted eddy in the eastern tropical North Atlantic, Biogeosciences, 13, 5633–5647, https://doi.org/10.5194/bg-13-5633-2016, 2016.
Fischer, G. and Romero, O. E.: Fluxes of total mass, bulk components and diatoms at the CV trap (Cape Verde), PANGAEA [data set], https://doi.org/10.1594/PANGAEA.931052, last access: 7 April 2021.
Fischer, G. and Wefer, G.: Sampling, preparation and analysis of marine particulate matter, in: Marine particles: Analysis and Characterization, edited by: Hurd, D. C. and Spencer, D. W., AGU Monograph Series, 63, Washington, DC, 391–397, 1991.
Fischer, G., Neuer, S., Davenport, R., Romero, O., Ratmeyer, V., Donner, B., Freudenthal, T., Meggers, H., and Wefer, G.: The Northwest African Margin, in: Carbon and Nutrient Fluxes in Continental Margins: A Global Synthesis, edited by: Liu, K. K., Atkinson, L., Quinones, R., and Talaue-McManaus, L., IGBP Book Series, Springer, Berlin, 77–103, 2010.
Fischer, G., Karstensen, J., Romero, O., Baumann, K.-H., Donner, B., Hefter, J., Mollenhauer, G., Iversen, M., Fiedler, B., Monteiro, I., and Körtzinger, A.: Bathypelagic particle flux signatures from a suboxic eddy in the oligotrophic tropical North Atlantic: production, sedimentation and preservation, Biogeosciences, 13, 3203–3223, https://doi.org/10.5194/bg-13-3203-2016, 2016.
Fomba, K. W., Müller, K., van Pinxteren, D., Poulain, L., van Pinxteren, M., and Herrmann, H.: Long-term chemical characterization of tropical and marine aerosols at the Cape Verde Atmospheric Observatory (CVAO) from 2007 to 2011, Atmos. Chem. Phys., 14, 8883–8904, https://doi.org/10.5194/acp-14-8883-2014, 2014.
Gama, C., Tchepel, O., Baldasano, J.M., Basart, S., Ferreira, J., Pio, C., Cardoso, J., and Borrego, C.: Seasonal patterns of Saharan dust over the Cape Verde – a combined approach using observations and modelling, Tellus B, 67, 24410, https://doi.org/10.3402/tellusb.v67.24410, 2015.
Gaube, P., McGillicuddy, D. J., Chelton, D. B., Behrenfeld, M. J., and Strutton, P. G.: Regional variations in the influence of mesoscale eddies on near-surface chlorophyll, J. Geophys. Res.-Ocean., 119, 8195–8220, 2014.
Goldthwait, S. A. and Steinberg, D. K.: Elevated biomass of meso-zooplankton and enhanced fecal pellet flux in cyclonic and mode-water eddies in the Sargasso Sea, Deep-Sea Res. Pt. II, 55, 1360–1377, https://doi.org/10.1016/j.dsr2.2008.01.003, 2008.
Grundle, D., Löscher, C., Krahmann, G., Altabet, M., Bange, H., Karstensen, J., Körtzinger, A., and Fiedler, B.: Extreme N2O activity in an oxygenated ocean, Nat. Sci. Rep., 7, 480, https://doi.org/10.1038/s41598-017-04745-y, 2017.
Guerreiro, C. V., Baumann, K.-H., Brummer, G.-J. A., Valente, A., Fischer, G., Ziveri, P., Brotas, V., and Stuut, J.-B. W.: Carbonate fluxes by coccolithophore species between NW Africa and the Caribbean: Implications for the biological carbon pump, Limnol. Oceanogr., 66, 3190–3208, https://doi.org/10.1002/lno.11872, 2021.
Hahn, J., Brandt, P., Greatbatch, R., Krahmann, G., and Körtzinger, A.: Oxygen variance and meridional oxygen supply in the Tropical North East Atlantic oxygen minimum zone, Clim. Dynam., 43, 2999–3024, 2014.
Hauss, H., Christiansen, S., Schütte, F., Kiko, R., Edvam Lima, M., Rodrigues, E., Karstensen, J., Löscher, C. R., Körtzinger, A., and Fiedler, B.: Dead zone or oasis in the open ocean? Zooplankton distribution and migration in low-oxygen modewater eddies, Biogeosciences, 13, 1977–1989, https://doi.org/10.5194/bg-13-1977-2016, 2016.
Hedges, J. I., Baldock, J. A., Gelinas, Y., Lee, C., Peterson, M. L., and Wakeham, S. G.: The biochemical and elemental compositions of marine plankton: a NMR perspective, Mar. Chem., 78, 47–63, 2002.
Iversen, M. H. and Ploug, H.: Ballast minerals and the sinking carbon flux in the ocean: carbon-specific respiration rates and sinking velocity of marine snow aggregates, Biogeosciences, 7, 2613–2624, https://doi.org/10.5194/bg-7-2613-2010, 2010.
Iversen, M. H., Nowald, N., Ploug, H., Jackson, G. A., and Fischer, G.: High resolution profiles of vertical particulate organic matter export off Cape Blanc, Mauritania: Degradation processes and ballasting effects, Deep-Sea Res. Pt. I, 57, 771–784, https://doi.org/10.1016/j.dsr.2010.03.007, 2010.
Jackson, G. A. and Kiorboe, T.: Maximum phytoplankton concentrations in the sea, Limnol. Oceanogr., 53, 1, 395–399, https://doi.org/10.4319/lo.2008.53.1.0395, 2008.
Karstensen, J., Stramma, L., and Visbeck, M.: Oxygen minimum zones in the eastern tropical Atlantic and Pacific oceans, Prog. Oceanogr., 77, 331–350, https://doi.org/10.1016/j.pocean.2007.05.009, 2008.
Karstensen, J., Fiedler, B., Schütte, F., Brandt, P., Körtzinger, A., Fischer, G., Zantopp, R., Hahn, J., Visbeck, M., and Wallace, D.: Open ocean dead zones in the tropical North Atlantic Ocean, Biogeosciences, 12, 2597–2605, https://doi.org/10.5194/bg-12-2597-2015, 2015.
Karstensen, J., Schütte, F., Pietri, A., Krahmann, G., Fiedler, B., Grundle, D., Hauss, H., Körtzinger, A., Löscher, C. R., Testor, P., Vieira, N., and Visbeck, M.: Upwelling and isolation in oxygen-depleted anticyclonic modewater eddies and implications for nitrate cycling, Biogeosciences, 14, 2167–2181, https://doi.org/10.5194/bg-14-2167-2017, 2017.
Kiørboe, T.: Formation and fate of marine snow: small-scale processes with large-scale implications, Sci. Mar., 65, 57–71, 2001.
Korte, L. F., Brummer, G.-J. A., van der Does, M., Guerreiro, C. V., Hennekam, R., van Hateren, J. A., Jong, D., Munday, C. I., Schouten, S., and Stuut, J.-B. W.: Downward particle fluxes of biogenic matter and Saharan dust across the equatorial North Atlantic, Atmos. Chem. Phys., 17, 6023–6040, https://doi.org/10.5194/acp-17-6023-2017, 2017.
Kremling, K., Lentz, U., Zeitzschell, B., Schulz-Bull, D. E., and Duinker, J. C.: New type of time-series sediment trap for the reliable collection of inorganic and organic trace chemical substances, Rev. Scient. Instr., 67, 4360–4363, 1996.
Löscher, C. R., Fischer, M. A., Neulinger, S. C., Fiedler, B., Philippi, M., Schütte, F., Singh, A., Hauss, H., Karstensen, J., Körtzinger, A., Künzel, S., and Schmitz, R. A.: Hidden biosphere in an oxygen-deficient Atlantic open-ocean eddy: future implications of ocean deoxygenation on primary production in the eastern tropical North Atlantic, Biogeosciences, 12, 7467–7482, https://doi.org/10.5194/bg-12-7467-2015, 2015.
Maiti, K., Benitez-Nelson, C. R., Rii, Y., and Bidigare, R.: The influence of a mature cyclonic eddy on particle export in the lee of Hawaii, Deep-Sea Res. Pt. II, 55, 1445–1460, https://doi.org/10.1016/j.dsr2.2008.02.008, 2008.
Marsay, C. M., Sanders, R. J., Henson, S. A., Pabortsava, K., Achterberg, E. P., and Lampitt, R. S.: Attenuation of sinking particulate organic carbon flux through the mesopelagic ocean, P. Natl. Acad. Sci. USA, 112, 1089–1094, https://doi.org/10.1073/pnas.1415311112, 2015.
Martin, J. H., Knauer, G. A., Karl, D., and Broenkow, W. W.: VERTEX: Carbon cycling in the northeast Pacific, Deep-Sea Res. Pt. I, 34, 267–285, 1987.
McCave, I. N.: Size spectra and aggregation of suspended particles in the deep ocean, Deep-Sea Res. Pt. I, 31, 329–352, 1984.
McGillicuddy, D. J., Anderson, L. A., Bates, N. R., Bibby, T., Buesseler, K. O., Carlson, C. A., Davis, C. S., Ewart, C., Falkowski, P. G., Goldthwait, S. A., Hansell, D. A., Jenkins, W. J., Johnson, R., Kosnyrev, V. K., Ledwell, J. R., Li, Q. P., Siegel, D. A., and Steinberg, D. K.: Eddy/wind interactions stimulate extraordinary mid-ocean plankton blooms, Science, 316, 1021–1026, https://doi.org/10.1126/science.1136256, 2007.
Mittelstaedt, E.: The ocean boundary along the northwest African coast: Circulation and oceanographic properties at the sea surface, Prog. Oceanogr., 26, 307–355, 1991.
Müller, P. J. and Schneider, R.: An automated leaching method for the determination of opal in sediments and particulate matter, Deep-Sea Res. Pt. I, 40, 425–444, 1993.
Oschlies, A. and Garçon, V.: Eddy-induced enhancement of primary production in a model of the North Atlantic Ocean, Nature, 394, 266–269, 1998.
Omand, M. M., D'Asaro, E. A., Lee, C. M., Perry, M. J., Briggs, N., Cetinić, I., and Mahadevan, A.: Eddy-driven subduction exports particulate organic carbon from the spring bloom, Science, 348, 222–225, https://doi.org/10.1126/science.1260062, 2015.
Pietri, A. and Karstensen, J.: Dynamical characterization of a low oxygen submesoscale coherent vortex in the Eastern North Atlantic Ocean, J. Geophys. Res.-Ocean., 123, 2049–2065, https://doi.org/10.1002/2017JC013177, 2018.
Ploug, H., Iversen, M. H., and Fischer, G.: Ballast, sinking velocity, and apparent diffusivity within marine snow and fecal pellets: Implications for substrate turnover by attached bacteria, Limnol. Oceanogr., 53, 1878–1886, 2008.
Rasse, R. and Dall'Olmo, G.: Do Oceanic Hypoxic Regions Act as Barriers for Sinking Particles? A Case Study in the Eastern Tropical North Atlantic, Global Biogeochem. Cy., 33, 1611–1630, https://doi.org/10.1029/2019GB006305, 2019.
Redfield, A. C., Ketchum, B. H., and Richards, F. A.: The influence of organisms on the composition of seawater, in: The Sea, edited by: Hill, M. N., Vol. 2, Wiley and Sons, Chichester, 26–77, 1963.
Rii, Y. M., Brown, S., Nencioli, F., Kuwahara, V., Dickey, T., Karl, D. M., and Bidigare, R. R.: The transient oasis: Nutrient-phytoplankton dynamics and particle export in Hawaiian lee cyclones, Deep-Sea Res. Pt. II, 55, 1275–1290, 2008.
Romero, O. E. and Fischer, G.: Shift in the species composition of the diatom community in the eutrophic Mauritanian coastal upwelling: Results from a multi-year sediment trap experiment (2003–2010), Prog. Oceanogr., 159, 31–44, 2017.
Romero, O. E., Lange, C. B., Fischer, G., Treppke, U. F., and Wefer, G.: Variability in export production documented by downward fluxes and species composition of marine planktonic diatoms: Observations from the tropical and equatorial Atlantic, in: Use of Proxies in Paleoceanography, Examples from the South Atlantic, edited by: Fischer, G. and Wefer, G., Springer Verlag, Berlin, Heidelberg, 365–392, 1999.
Romero, O. E., Fischer, G., Karstensen, J., and Cermeño, P.: Eddies as trigger for diatom productivity in the open-ocean Northeast Atlantic, Prog. Oceanogr., 147, 38–48, 2016.
Romero, O. E., Baumann, K.-H., Zonneveld, K. A. F., Donner, B., Hefter, J., Hamady, B., Pospelova, V., and Fischer, G.: Flux variability of phyto- and zooplankton communities in the Mauritanian coastal upwelling between 2003 and 2008, Biogeosciences, 17, 187–214, https://doi.org/10.5194/bg-17-187-2020, 2020.
Romero, O. E., Ramondenc, S., and Fischer, G.: A 2-decade (1988–2009) record of diatom fluxes in the Mauritanian coastal upwelling: impact of low-frequency forcing and a two-step shift in the species composition, Biogeosciences, 18, 1873–1891, https://doi.org/10.5194/bg-18-1873-2021, 2021.
Sancetta, C. and Calvert, S. E.: The annual cycle of sedimentation in Saanich Inlet, British Columbia: implications for the interpretation of diatom fossil assemblages, Deep-Sea Res. Pt. I, 35, 71–90, 1988.
Schneider, B., Schlitzer, R., Fischer, G., and Noethig, E.-M.: Depth-dependent elemental compositions of particulate organic matter (POM) in the ocean. Global Biogeochemi. Cy., 17, 1032, https://doi.org/10.1029/2002GB001871, 2003.
Schrader, H.-J. and Gersonde, R.: Diatoms and silicoflagellates, in: Micropaleontological counting methods and techniques - an exercise on an eight meter section of the Lower Pliocene of Capo Rosello, Sicily, edited by: Zachariasse, W. J., Riedel, W. R., Sanfilippo, A., Schmidt, R. R., Brolsma, M. J., Schrader, H., Gersonde, R., Drooger, M. M., and Broekman, J. A., Utrecht Micropal. Bull., 17, 129–176, 1978.
Schütte, F., Brandt, P., and Karstensen, J.: Occurrence and characteristics of mesoscale eddies in the tropical northeast Atlantic Ocean, Ocean Sci., 12, 663–685, https://doi.org/10.5194/os-12-663-2016, 2016a.
Schütte, F., Karstensen, J., Krahmann, G., Hauss, H., Fiedler, B., Brandt, P., Visbeck, M., and Körtzinger, A.: Characterization of “dead-zone” eddies in the tropical Northeast Atlantic Ocean, Biogeosciences, 13, 5865–5881, https://doi.org/10.5194/bg-13-5865-2016, 2016b.
Shih, Y.-Y., Hung, C.-C., Gong, G.-C., Chung, W.-C., Wang, Y.-H., Lee, I.-H., Chen, K.-S., and Ho, C.-Y.: Enhanced Particulate Organic Carbon Export at Eddy Edges in the Oligotrophic Western North Pacific Ocean, PLoS ONE, 10, e0131538, https://doi.org/10.1371/journal.pone.0131538, 2015.
Siegel, D. A. and Deuser, W. G.: Trajectories of sinking particles in the Sargasso Sea: Modeling of statistical funnels above deep-ocean sediment traps, Deep-Sea Res. Pt. I, 44, 1519–1541, https://doi.org/10.1016/S0967-0637(97)00028-9, 1997.
Smetacek, V.: Role of sinking in diatom life-history cycles: ecological, evolutionary and geological significance, Mar. Biol., 84, 239–251, 1985.
Verdeny, E., Masqué, P., Maiti, K., Garcia-Orellana, J., Bruach, J. M., Mahaffey, C., and Benitez-Nelson, C. R.: Particle export within cyclonic Hawaiian lee eddies derived from 210Pb–210Po disequilibrium, Deep-Sea Res. Pt. II, 55, 1461–1472, https://doi.org/10.1016/j.dsr2.2008.02.009, 2008.
Waite, A. M., Stemmann, L., Guidi, L., Calil, P. H. R., Hogg, A. M. C., Feng, M., Thompson, P. A., Picheral, M., and Gorsky, G.: The wineglass effect shapes particle export to the deep ocean in mesoscale eddies, Geophys. Res. Lett., 43, 9791–9800, https://doi.org/10.1002/2015GL066463, 2016.
Weber, T. and Bianchi D.: Efficient Particle Transfer to Depth in Oxygen Minimum Zones of the Pacific and Indian Oceans, Front. Earth Sci., 8, 376, https://doi.org/10.3389/feart.2020.00376, 2020.
Zhang, Z., Wang, W., and Qiu, B.: Oceanic mass transport by mesoscale eddies, Science, 345, 322–324, https://doi.org/10.1126/science.1252418, 2014.