the Creative Commons Attribution 4.0 License.
the Creative Commons Attribution 4.0 License.
 | 20 Dec 2021
Strong temporal variation in treefall and branchfall rates in a tropical forest is related to extreme rainfall: results from 5 years of monthly drone data for a 50 ha plot
Raquel Fernandes Araujo
Samuel Grubinger
Carlos Henrique Souza Celes
Robinson I. Negrón-Juárez
Milton Garcia
Jonathan P. Dandois
Helene C. Muller-Landau
A mechanistic understanding of how tropical-tree mortality responds to climate variation is urgently needed to predict how tropical-forest carbon pools will respond to anthropogenic global change, which is altering the frequency and intensity of storms, droughts, and other climate extremes in tropical forests. We used 5 years of approximately monthly drone-acquired RGB (red–green–blue) imagery for 50 ha of mature tropical forest on Barro Colorado Island, Panama, to quantify spatial structure; temporal variation; and climate correlates of canopy disturbances, i.e., sudden and major drops in canopy height due to treefalls, branchfalls, or the collapse of standing dead trees. Canopy disturbance rates varied strongly over time and were higher in the wet season, even though wind speeds were lower in the wet season. The strongest correlate of monthly variation in canopy disturbance rates was the frequency of extreme rainfall events. The size distribution of canopy disturbances was best fit by a Weibull function and was close to a power function for sizes above 25 m2. Treefalls accounted for 74 % of the total area and 52 % of the total number of canopy disturbances in treefalls and branchfalls combined. We hypothesize that extremely high rainfall is a good predictor because it is an indicator of storms having high wind speeds, as well as saturated soils that increase uprooting risk. These results demonstrate the utility of repeat drone-acquired data for quantifying forest canopy disturbance rates at fine temporal and spatial resolutions over large areas, thereby enabling robust tests of how temporal variation in disturbance relates to climate drivers. Further insights could be gained by integrating these canopy observations with high-frequency measurements of wind speed and soil moisture in mechanistic models to better evaluate proximate drivers and with focal tree observations to quantify the links to tree mortality and woody turnover.
- Article
(3692 KB) - Full-text XML
-
Supplement
(2876 KB) - BibTeX
- EndNote


Moist tropical forests account for 40 % of the global biomass carbon stocks (Xu et al., 2021), and uncertainty regarding the future of these stocks is a major contributor to uncertainty in the future global carbon cycle (Cavaleri et al., 2015). Tropical-forest carbon stocks depend critically on tree mortality rates, and recent studies suggest tropical-tree mortality rates may be increasing due to anthropogenic global change (Brienen et al., 2015; McDowell et al., 2018). Tropical-tree mortality can be caused by a diversity of drivers including windthrow (Fontes et al., 2018), droughts (McDowell et al., 2018; Silva et al., 2018), fires (Silva et al., 2018), lightning strikes (Yanoviak et al., 2017), and biotic agents (Fontes et al., 2018). The frequency of extreme rainfall and drought events is expected to increase in tropical regions, potentially increasing associated tree mortality (IPCC, 2014; Deb et al., 2018; Aubry-Kientz et al., 2019). An improved understanding of the processes of forest disturbance is critical to constrain estimates of current and future carbon cycling in tropical forests under climate change (Leitold et al., 2018; Johnson et al., 2016; Muller-Landau et al., 2021).
Despite the importance of tree mortality to forest structure and carbon turnover rates, the mechanisms underlying tree mortality remain unclear (McDowell et al., 2018). A key problem is that remeasurement intervals of permanent plots average 5 or more years, making it difficult to link mortality variation with particular climatic events (Phillips et al., 2010; Davies et al., 2021; Arellano et al., 2019). The high rates of decomposition in tropical forests further obscure evidence of underlying mechanisms and risk factors (Arellano et al., 2019). The few studies that have quantified temporal variation of tree mortality at monthly and bi-monthly scales using ground-based data have all found higher tree mortality in times of higher rainfall (Brokaw, 1982; Fontes et al., 2018; Aleixo et al., 2019). This is consistent with the understanding that many trees die in treefalls, which are proximately caused by trunk breakage or uprooting and are associated with storms (Marra et al., 2014; Araujo et al., 2017; Fontes et al., 2018; Negrón-Juárez et al., 2017, 2018; Esquivel-Muelbert et al., 2020). The collection of additional high-temporal-resolution mortality data over large areas, together with high-temporal-resolution climatological data, can aid in linking mortality to particular climatic events and thereby elucidating mortality mechanisms (Arellano et al., 2019; McMahon et al., 2019).
Drone-acquired imagery and digital aerial photogrammetry software now provide excellent tools for monitoring forest canopies (Araujo et al., 2020), and repeat drone flights can quantify canopy dynamics over large areas at high temporal resolution. Photogrammetric analysis of simple RGB (red–green–blue) imagery enables reconstruction of the appearance and three-dimensional structure of the top of the canopy at high spatial resolution (Dandois and Ellis, 2013; Araujo et al., 2020; Zahawi et al., 2015). Comparison of photogrammetry products from successive drone flights allows for easy detection and quantification of canopy disturbances due to treefalls and branchfalls of canopy trees. Canopy trees constitute a high proportion of stems, aboveground carbon stocks, and woody productivity (Araujo et al., 2020), and thus information on their mortality rates is disproportionately useful to understanding forest dynamics and carbon cycling. Treefalls do not necessarily result in tree mortality (trees may survive and resprout), but almost all treefalls and branchfalls result in a large flux of carbon (wood) from biomass to necromass within a short time period after the event, which translates to reduced woody residence time. Periods of higher canopy disturbance rates thus represent periods of higher biomass turnover and likely correlate with higher tree mortality rates. Further, even when trees do not die from a canopy disturbance event, suffering crown loss or damage increases the risk of subsequent mortality (Arellano et al., 2019).
Monitoring canopy disturbances with drones also provides the opportunity to precisely quantify the size distributions of these canopy disturbances and to distinguish branchfalls from treefalls. Here we define a canopy disturbance as a substantial decrease in canopy height in a contiguous patch of canopy occurring over one measurement interval, such as typically results from a treefall or branchfall. Marvin and Asner (2016) and Dalagnol et al. (2021) referred to these as “dynamic canopy gaps”. By definition, canopy disturbances reduce canopy height and thereby change light regimes for understory and neighboring trees, and the magnitude of the change depends on the disturbance size in area and depth (Hubbell et al., 1999). In general, larger canopy disturbances cause larger canopy gaps as traditionally measured on the ground. Previous studies have analyzed the size distributions of static gaps – areas with canopy height below a threshold – for insights into forest structure, habitat niches, and disturbance regimes (e.g., Manrubia and Solé, 1997; Lobo and Dalling, 2013, 2014; Fisher et al., 2008). Tree species respond differently to canopy gaps of different sizes, with small gaps favoring a different set of species than large gaps (Brokaw, 1985; Denslow, 1980, 1987; Dalling et al., 2004). Branchfalls, like treefalls, are important in generating canopy gaps and contributing to woody turnover but often go unmeasured (Marvin and Asner, 2016; Leitold et al., 2018). Quantifying tree mortality and other damage contributes to a better understanding of the change of the forest structure, necromass estimates, and nutrient cycling.
Here, we use 5 years of approximately monthly drone-acquired RGB imagery for a 50 ha area of mature tropical forest on Barro Colorado Island, Panama, to investigate canopy dynamics at high temporal resolution. We aim to (1) quantify temporal variation in canopy disturbance rates and its relationship to climate variation, (2) characterize the size structure of canopy disturbances, and (3) evaluate the role of branchfalls in canopy dynamics. We expect that disturbance rates will be higher in the wet season than the dry season; we hypothesize disturbance rates will increase with the frequency of extreme rainfall and wind events; and we compare the correlations of various rainfall and wind statistics with temporal variation in disturbance rates. To characterize the size structure of canopy disturbances, we quantify the size (area) distribution and evaluate whether it is the best fit by power, Weibull, or exponential functions. Finally, we quantify the proportion of canopy disturbance due to branchfalls (rather than treefalls) and test whether branchfalls and treefalls exhibit similar patterns of temporal variation. Our results provide new insights into the patterns and drivers of canopy disturbance and tree mortality in this tropical forest and illustrate the utility of drones for quantifying canopy dynamics over large areas at high temporal resolution.
2.1 Study site
Barro Colorado Island (BCI; 9.15∘ N, 79.83∘ W) is a 15 km2 island in central Panama that was isolated from the surrounding mainland when Lake Gatun was created as part of the construction of the Panama Canal. BCI supports a tropical moist forest in the Holdridge life zone system (Holdridge, 1947). Annual precipitation averages approximately 2600 mm, with a pronounced dry season between January and April (a mean of about 3.5 months with < 100 mm per month). Mean maximum 1 d wind speeds are 8.1 and 5.8 m s−1 during the dry and wet seasons, respectively (https://smithsonian.figshare.com/articles/dataset/Yearly_Reports_Barro_Colorado_Island/11799111/2, last access: 15 December 2021). Mean annual temperature is 26 ∘C and varies little throughout the year (Windsor, 1990). The 50 ha forest dynamics plot (1000 m × 500 m) was established on BCI in 1981 and is located in an old-growth forest (Leigh, 1999), with the exception of a small area of 1.92 ha of old secondary forest (∼ 100 years old) in the northern central part of the plot (Harms et al., 2001).
2.2 Meteorological data
Meteorological data were collected in the lab clearing and Lutz tower, approximately 1.7 km northeast of the center of the 50 ha plot (https://smithsonian.figshare.com/articles/dataset/Yearly_Reports_Barro_Colorado_Island/11799111/2, last access: 15 December 2021). Wind speed was measured using an anemometer (R. M. Young wind monitor model 05103) installed at the top of Lutz tower, at 48 m height above ground and approximately 6 m above the top of the surrounding canopy. Wind speed measurements were made every 10 s, and the average, minimum, and maximum values were recorded at the end of every 15 min interval. We used the maximum wind speeds for our analyses. Rainfall was measured in the lab clearing using a tipping bucket (Hydrological Services model TB3) and recorded every 5 min; we aggregated these data to 15 min periods to match the temporal resolution of the wind speed data. Rainfall and wind speed data are available at https://biogeodb.stri.si.edu/physical_monitoring/research/barrocolorado, last access: 15 December 2021. The meteorological record had no gaps during our study period (Fig. S1).
2.3 Canopy disturbance identification
We used approximately monthly orthomosaics and canopy surface models produced from drone-acquired imagery to analyze temporal variation in canopy disturbance rates in the 50 ha forest dynamics plot between 2 October 2014 and 28 November 2019. RGB imagery was collected using a variety of drones and cameras over the years, with a horizontal spatial resolution of 3–7 cm. Imagery for each sampling date was processed using the photogrammetry software Agisoft Metashape to obtain orthomosaics and surface elevation models, which were then aligned vertically and horizontally.
We defined a canopy disturbance as a substantial decrease in canopy height in a contiguous patch of canopy occurring over one measurement interval, such as typically results from a treefall or branchfall. We identified canopy disturbances through a combination of analysis of the canopy surface model changes and visual interpretation of the orthomosaics (Fig. 1). We first differenced surface elevation models for successive dates to obtain a raster of the canopy height changes for the associated interval (Fig. 1 and Text S1 in the Supplement). We then pre-delineated major canopy disturbances by filtering for areas in which canopy height decreased more than 10 m in contiguous areas of at least 25 m2 and which had an area-to-perimeter ratio greater than 0.6. We note that 25 m2 is the minimum gap area used in previous studies of this site by Brokaw (1982) and Hubbell et al. (1999). The area-to-perimeter condition removes artifacts associated with slight shifts in the measured positions of individual trees from one image set to another, whether due to wind or alignment errors (note that this criterion involves a combination of shape and size). Finally, we systematically examined 1 ha square subplots for each pair of successive dates and edited the pre-delineated polygons, removed false positives, and added visible new canopy disturbances that were not previously delineated (whether because they were too small in area or in canopy height drop). We also classified disturbances as being due to treefalls (a whole previously live tree fell, creating a clearly visible gap on the forest floor, or the whole live crown disappeared), branchfalls (a portion of a live crown broke), or standing dead trees disintegrating based on visual inspection of the orthomosaics (Fig. S2).
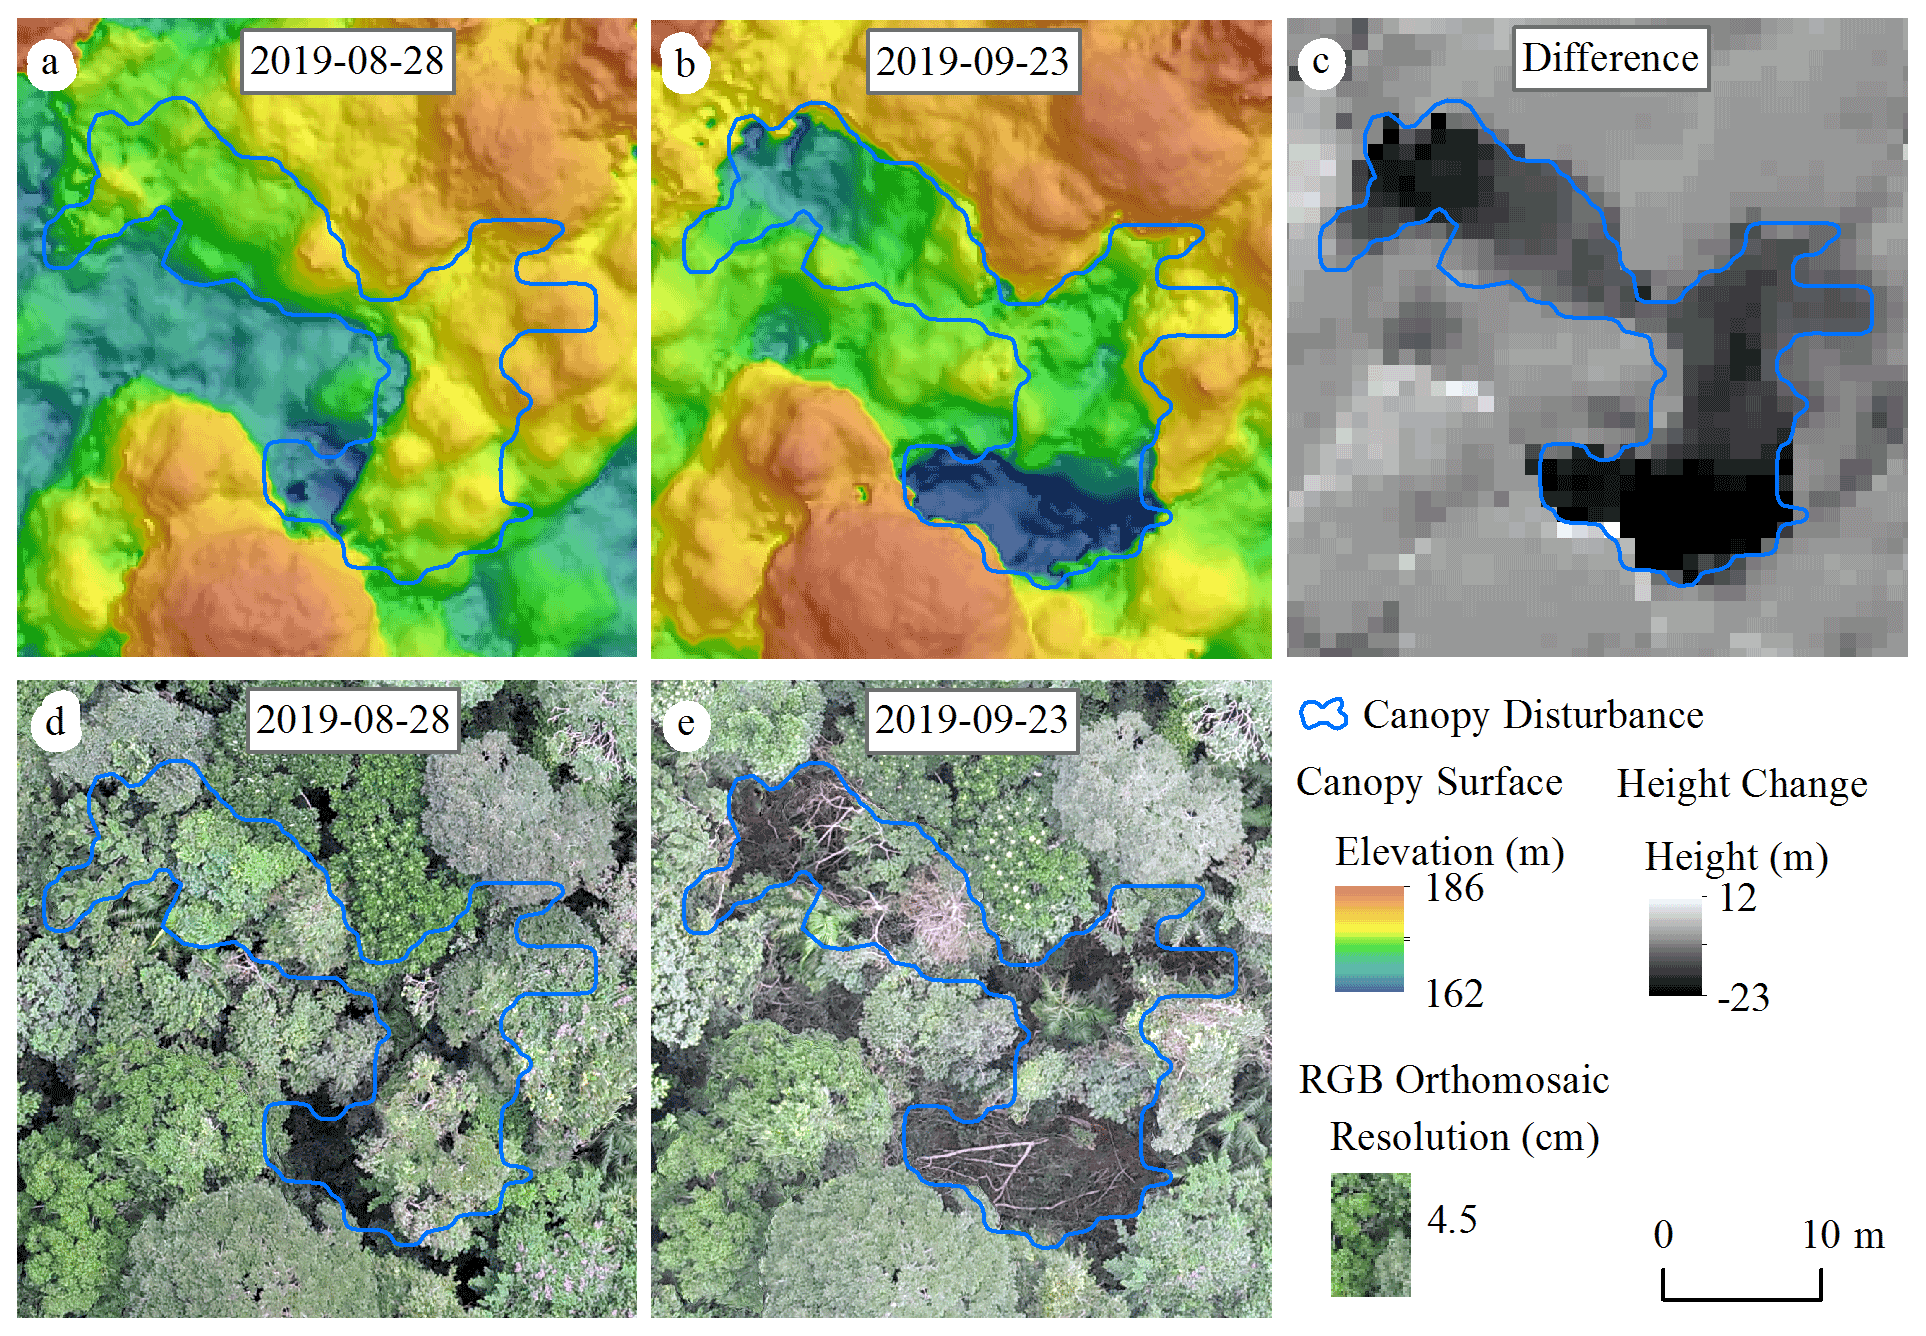
Figure 1Canopy disturbance visualized on canopy surface models and orthomosaics calculated from photogrammetric analyses of drone imagery. (a, b) Elevation models for a portion of the study area on two successive dates, 28 August (a) and 23 September 2019 (b). (c) Difference in elevation between the two dates, with the black area indicating a large decrease in canopy elevation. (d, e) RGB orthomosaics of the same dates. Please note that the date format in this figure is year-month-day.
We calculated the total number and area of canopy disturbances within the BCI 50 ha plot during the 5 years of the study. In calculating the number and total area of disturbances, we included all disturbed areas that were inside the plot boundaries (if a disturbance was on the boundary, only the area inside the plot was included). Our analyses of temporal variation employed the same definitions for numbers and areas of canopy disturbances within the 50 ha plot. For analyses of the size structure of disturbances, we included the complete areas of disturbances whose centroids were located within the plot (i.e., we excluded disturbances centered outside the plot and included area outside the plot for disturbances centered inside the plot to avoid artifacts related to reducing disturbance size by trimming at the plot boundaries).
2.4 Temporal variation in canopy disturbance rates and its relation to climate
We calculated canopy disturbance rates for each measurement interval as the percentage of area disturbed per month (i.e., per 30 d period). Specifically, we summed the total area disturbed during the measurement interval and divided by the total area of the plot and the length of the time interval. We excluded one excessively long interval (237 d – image acquisition gap) from all analyses of temporal variation; the remaining intervals ranged from 14 to 91 d, with a median of 31.5 d (Table S1). We also calculated an incidence canopy disturbance rate as the number of canopy disturbances per hectare per month. We calculated the mean; minimum; maximum; and the 25th, 50th, and 75th percentiles of interval length, number and area of canopy disturbances, and the respective monthly rates.
We compared canopy disturbance rates between wet and dry seasons and between early wet and late wet seasons. We defined the dry season as 1 January to 30 April (rainfall < 100 mm per month, Fig. S3), the early wet season as 1 May to 31 August, and the late wet season as 1 September to 31 December. Intervals that straddled more than one season were classified to the season in which they had more days. We tested for differences in canopy disturbance rates between seasons using two-tailed Student's t test on the log-transformed canopy disturbance rates for each measurement interval, after first confirming that these rates met assumptions for normality (Shapiro–Wilk test) and homogeneity of variance (Levene test).
We evaluated the relationship of temporal variation in canopy disturbance rates with temporal variation in the frequencies of climate extremes using parametric correlations. We calculated the Pearson correlations of the log-transformed canopy disturbance rates (area per time) with the log-transformed frequency of extreme rainfall and wind speed events (number per time) (i.e., ), for different definitions of extreme events. For example, one definition of an extreme event would be a 15 min period with rainfall above the 99th percentile. We evaluated three different temporal grains for defining extreme events (15 min, 1 h, and 1 d intervals); for two different meteorological variables (total rainfall and maximum wind speed); and for 100 different thresholds, corresponding to every 0.1 percentile increment between the 90th and 99.9th percentile of the corresponding distributions. We compared the predictive ability of these 600 different definitions of extreme events in terms of their Pearson correlations.
2.5 Size structure of canopy disturbances
We characterized the size structure of canopy disturbances whose geometric center was inside the plot, excluding disturbances from the one excessively long interval of 237 d. Longer time intervals increase the likelihood that what is measured as a single disturbance event in fact constitutes multiple adjoining or overlapping events. We calculated the mean, minimum, maximum, and median of the area of individual canopy disturbances. We calculated the cumulative distribution functions with respect to the disturbance size (area) of the number and total area of canopy disturbances to quantify the proportions of canopy disturbances and of total area disturbed in disturbances below any given size.
We took advantage of the three-dimensional structure of our photogrammetry data to quantify canopy disturbances in terms of their vertical height drop as well as their horizontal area. For each canopy disturbance, we calculated the average height drop from the differences in the canopy surface models. We excluded 61 canopy disturbances in which mean heights increased because they reflect errors in the canopy height models. We fit a generalized additive model (GAM) for average height drop as a function of the log-transformed area to better visualize the trend in how these were related.
We quantified the size distributions of canopy disturbances by fitting three alternative probability distributions: exponential, power (or Pareto), and Weibull as in Eqs. (1)–(3):
where λ and α are fitted parameters, x is the canopy disturbance area in square meters, e is the natural exponential basis, and N is normalization constants such that the truncated distribution integrates to 1. Recognizing that our methods are likely to miss smaller disturbances, we fit these distributions to truncated datasets, excluding disturbances below 2, 5, 10, or 25 m2. Note that 25 m2 is the minimum area for defining a canopy disturbance in our automated pre-delineation algorithm, and we are confident we captured all disturbances above this area. We are progressively less confident of our ability to capture smaller disturbances. We also truncated the fitted distributions above at the maximum possible disturbance area we could have observed using our methods (50 ha or 500 000 m2). We fit each type of distribution (exponential, power, and Weibull) to each dataset (different minimum disturbance area and corresponding truncation) using the maximum likelihood. The maximum-likelihood estimates of the parameters were those that maximized the likelihood function (Eq. 4):
We selected the model that minimized the Akaike information criterion (AIC) (Burnham and Anderson, 2002). We also evaluated the goodness of fit using the Kolmogorov–Smirnov statistic, the maximum difference in the cumulative probability distributions between the observed data and the fitted distribution (Carvalho, 2015).
2.6 Branchfalls vs. treefalls
We classified each canopy disturbance as being a branchfall, treefall, or a standing dead tree, except for those disturbances occurring in the exceptionally long time interval. In 35 cases we could not distinguish the type of disturbance, and these cases were omitted from analyses that required disturbance classification. We evaluated the relative contributions of branchfalls vs. treefalls, and we did not include standing dead trees in the analysis because our methods possibly missed standing dead trees. We separately calculated treefall and branchfall disturbance rates for each interval and relative contributions to their summed number and area. We calculated the Pearson correlations of branchfall disturbance rates with treefall disturbance rates, for both area- and number-based rates.
We identified 1048 canopy disturbances with a combined area of 56 134.37 m2 (5.61 ha) that affected the area within the BCI 50 ha plot between 2 October 2014 and 28 November 2019 (Fig. 2). During the 5 years of the study, 11.2 % of the area of the BCI 50 ha plot was affected by canopy disturbances (Fig. 2), and 0.6 % was disturbed more than once (Fig. S4).
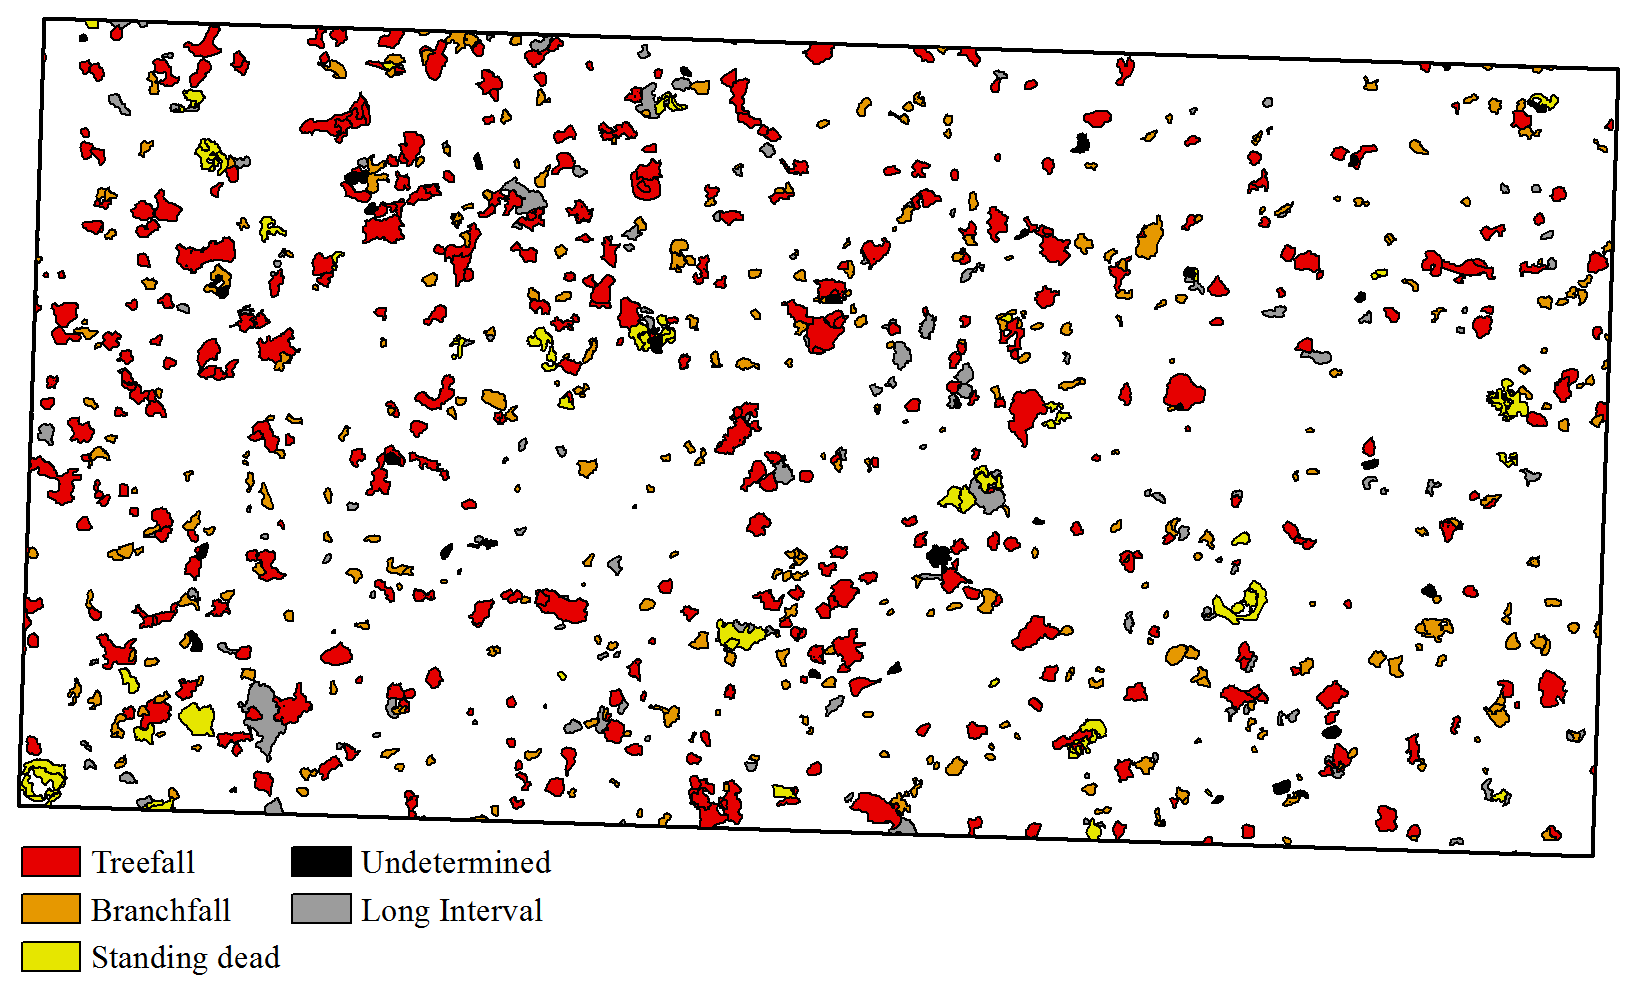
Figure 2Map of canopy disturbances on the 50 ha plot (black rectangle, 1000×500 m) on Barro Colorado Island, Panama, from 2 October 2014 to 28 November 2019.
3.1 Temporal variation in canopy disturbance rates
Temporal variation analyses included 898 disturbances or partial disturbances encompassing 49 742.1 m2 of area inside the 50 ha plot in 46 time intervals (excluding the single long interval). There was strong temporal variation in canopy disturbance rates, with similar temporal variation in the total area disturbed (Fig. 3) and in the number of disturbances (Fig. S5). The mean rate of canopy disturbance creation was 905.1 m2 per month (range of 75 to 8040.9 m2 per month), and the median was 499 m2 per month (other statistics in Table S1).
The highest disturbance rates occurred during May–July 2016, May–August 2018, and August–September 2019 (Fig. S6). The single highest disturbance rate was observed between 1 June and 13 July 2016, when 11 257 m2 of disturbances were created in just 42 d (a rate of 268 m2 d−1). A full 2.3 % of the total area of the plot was converted to new canopy disturbances during this time interval.
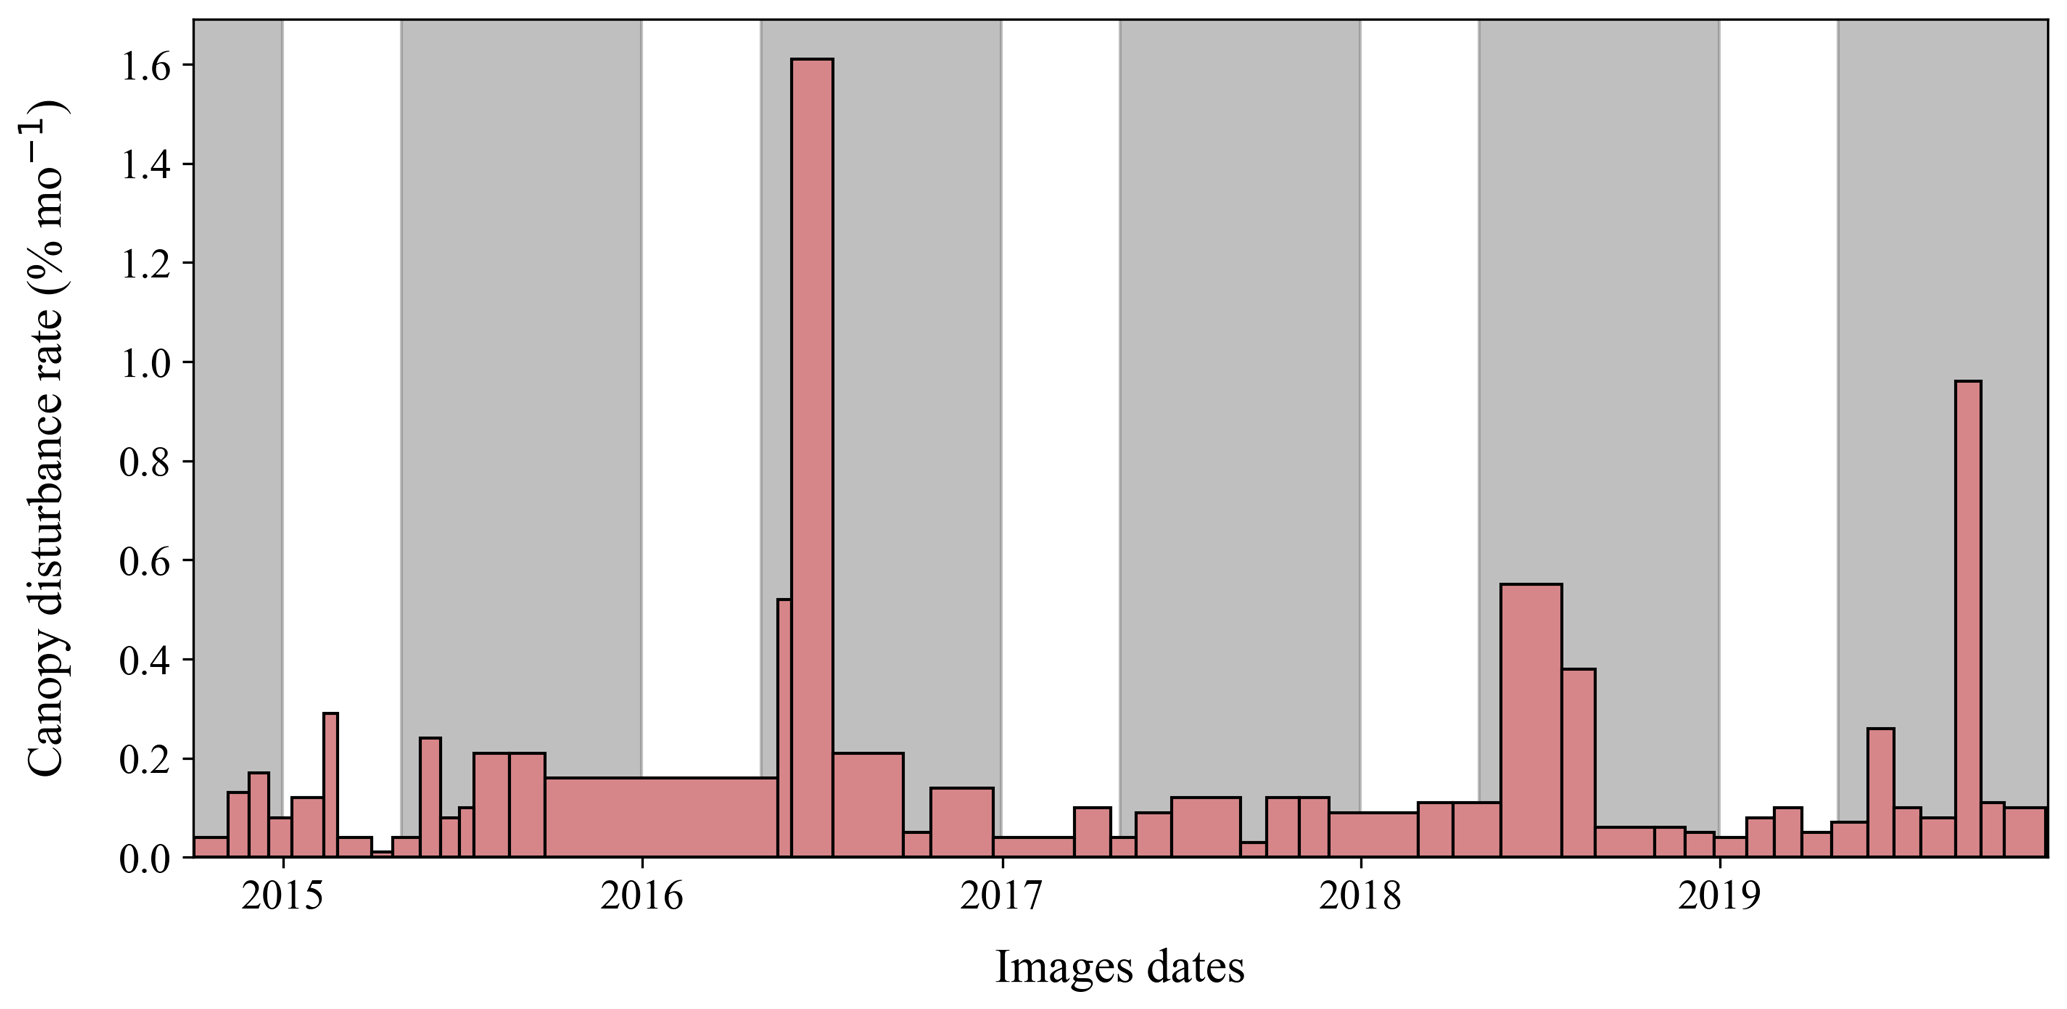
Figure 3Temporal variation in canopy disturbance rates in the 50 ha plot on Barro Colorado Island, Panama, across measurement intervals. Gray shading indicates wet seasons (May to December) of each year, and ticks on the x axis indicate the first day of each year. Rates are shown in units of percent of area per month (sum of total area disturbed during the measurement interval, divided by the total area of the plot and the length of the time interval times 30 d). Note that the total area of each rectangle is proportional to the total area of the canopy disturbed during that measurement interval.
Rates of canopy disturbances were higher during the wet season (p=0.036, Fig. 4a). There was no significant difference in rates between the early and late wet season (p=0.226, Fig. 4b). Very high rates of disturbance (> 0.3 % per month) were observed only in the wet season.
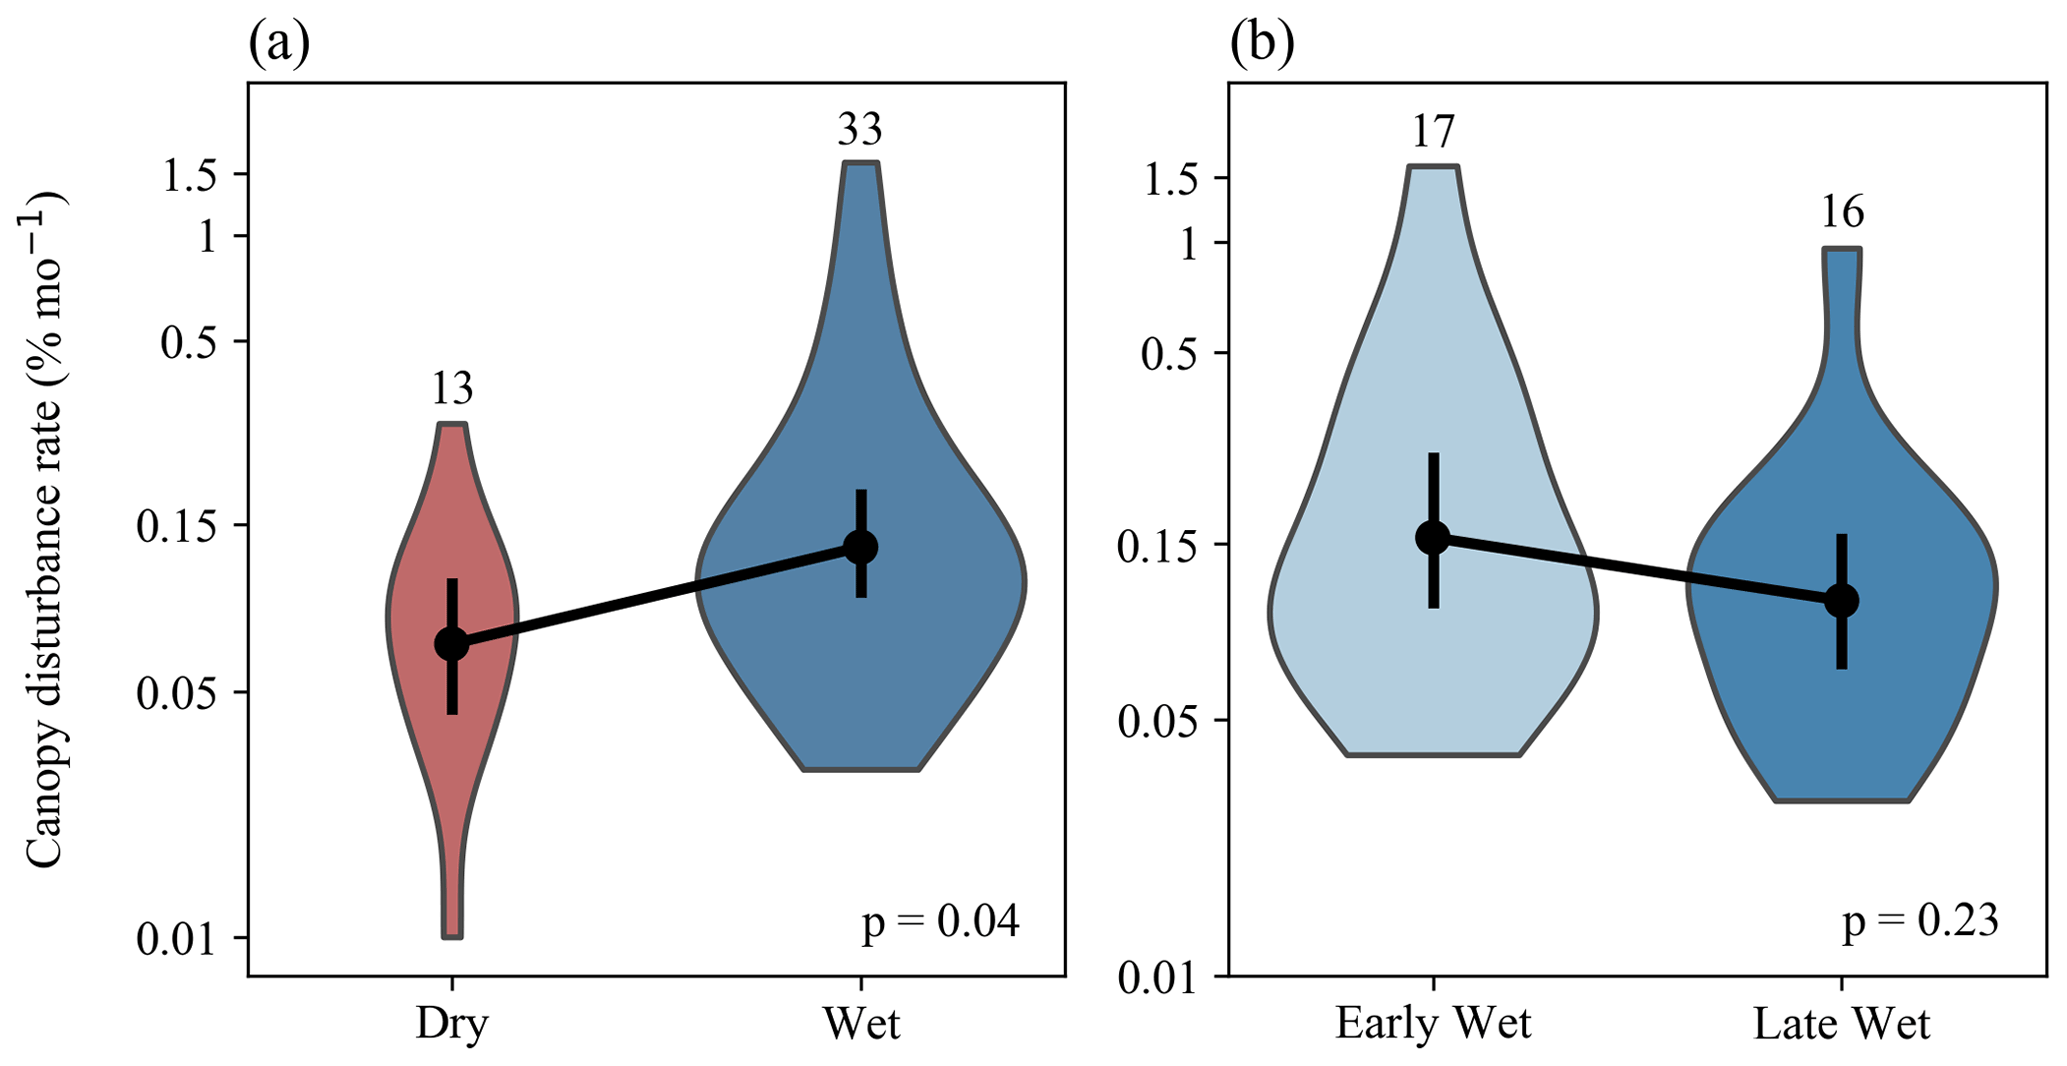
Figure 4Comparisons of canopy disturbances rates between wet and dry seasons (a) and between early and late wet seasons (b). Violin plots depict the distributions of disturbance rates (percentage of area disturbed per month) over time intervals, with the number of time intervals listed above each violin plot. Black dots and bars show mean and 95 % confidence intervals, respectively; p values are based on two-tailed Student's t tests for differences in log-transformed canopy disturbance rates between seasons.
The best correlate of temporal variation in canopy disturbance rates was the frequency of 15 min rainfall events above the 98.2th percentile, which explained 22 % of the variation (Fig. 5a). This relationship was mainly driven by events occurred during wet seasons (Fig. 5a). This threshold outperformed all other tested rainfall thresholds (all percentiles from the 90.0th to 99.9th percentile, by 0.1 % of the different frequency timescales, Fig. 5b). The 98.2th percentile corresponds to a rainfall rate of 24.3 mm h−1 (Fig. 5c). There were a total of 141 15 min rainfall events exceeding this threshold, which occurred on 98 different days (Table S2). The measurement interval with the highest disturbance rate (1 June to 13 July 2016) included 11 such high 15 min rainfall events on 6 d (Table S2). The frequency of events of high maximum wind speed was not significantly related to canopy disturbance rates. Indeed, Pearson correlations were negative for most wind speed variables (Fig. S7).

Figure 5Relation of temporal variation in canopy disturbance rates to the frequency of extreme rainfall events. (a) The relationship for the single best predictor of canopy disturbance rate is the frequency of 15 min periods with rainfall exceeding the 98.2th percentile. Each point represents one measurement interval. (b) Variation in the Pearson correlation between the canopy disturbance rate and frequency of extreme rainfall events depending on the temporal grain (colors) and percentile threshold (x axis) for defining extreme rainfall events. Open red circle represents the best correlation. (c) The relationship of the percentile threshold (x axis) and rainfall rate (y axis) for different temporal scales. Dashed red line indicates the rainfall rate in mm h−1 of the 98.2th percentile.
3.2 Size structure of canopy disturbances
Size distribution analyses included 870 canopy disturbances (with 49 495.5 m2 of total area) that had their centers inside the plot and were not part of the excluded long interval. The area of an individual canopy disturbance ranged from 2.2 to 486.7 m2, with a mean of 56.9 m2. The median disturbance area was 36.1 m2, whereas 50 % of the total area was in disturbances greater than 87.1 m2 (Fig. 6a).
The size distribution of observed canopy disturbances was close to a power function for areas above 25 m2 and was relatively flat over the range of 5 to 25 m2 (Fig. 6b). The fitted exponent of the power function was −2.16 for canopy disturbances above 25 m2, but the Weibull distribution provided a better fit than the power function (Table 1). When distributions were fit to data including smaller size classes (> 2 m2, > 5 m2, or > 10 m2), the distribution is further from a power function. The Weibull function remains the best fit; the exponential becomes the second-best fit; and the power function is the worst fit of the three (Figs. S8 and S9 and Table 1). Canopy disturbances with larger areas tended to have larger mean decreases in canopy height (Fig. 6c and d).
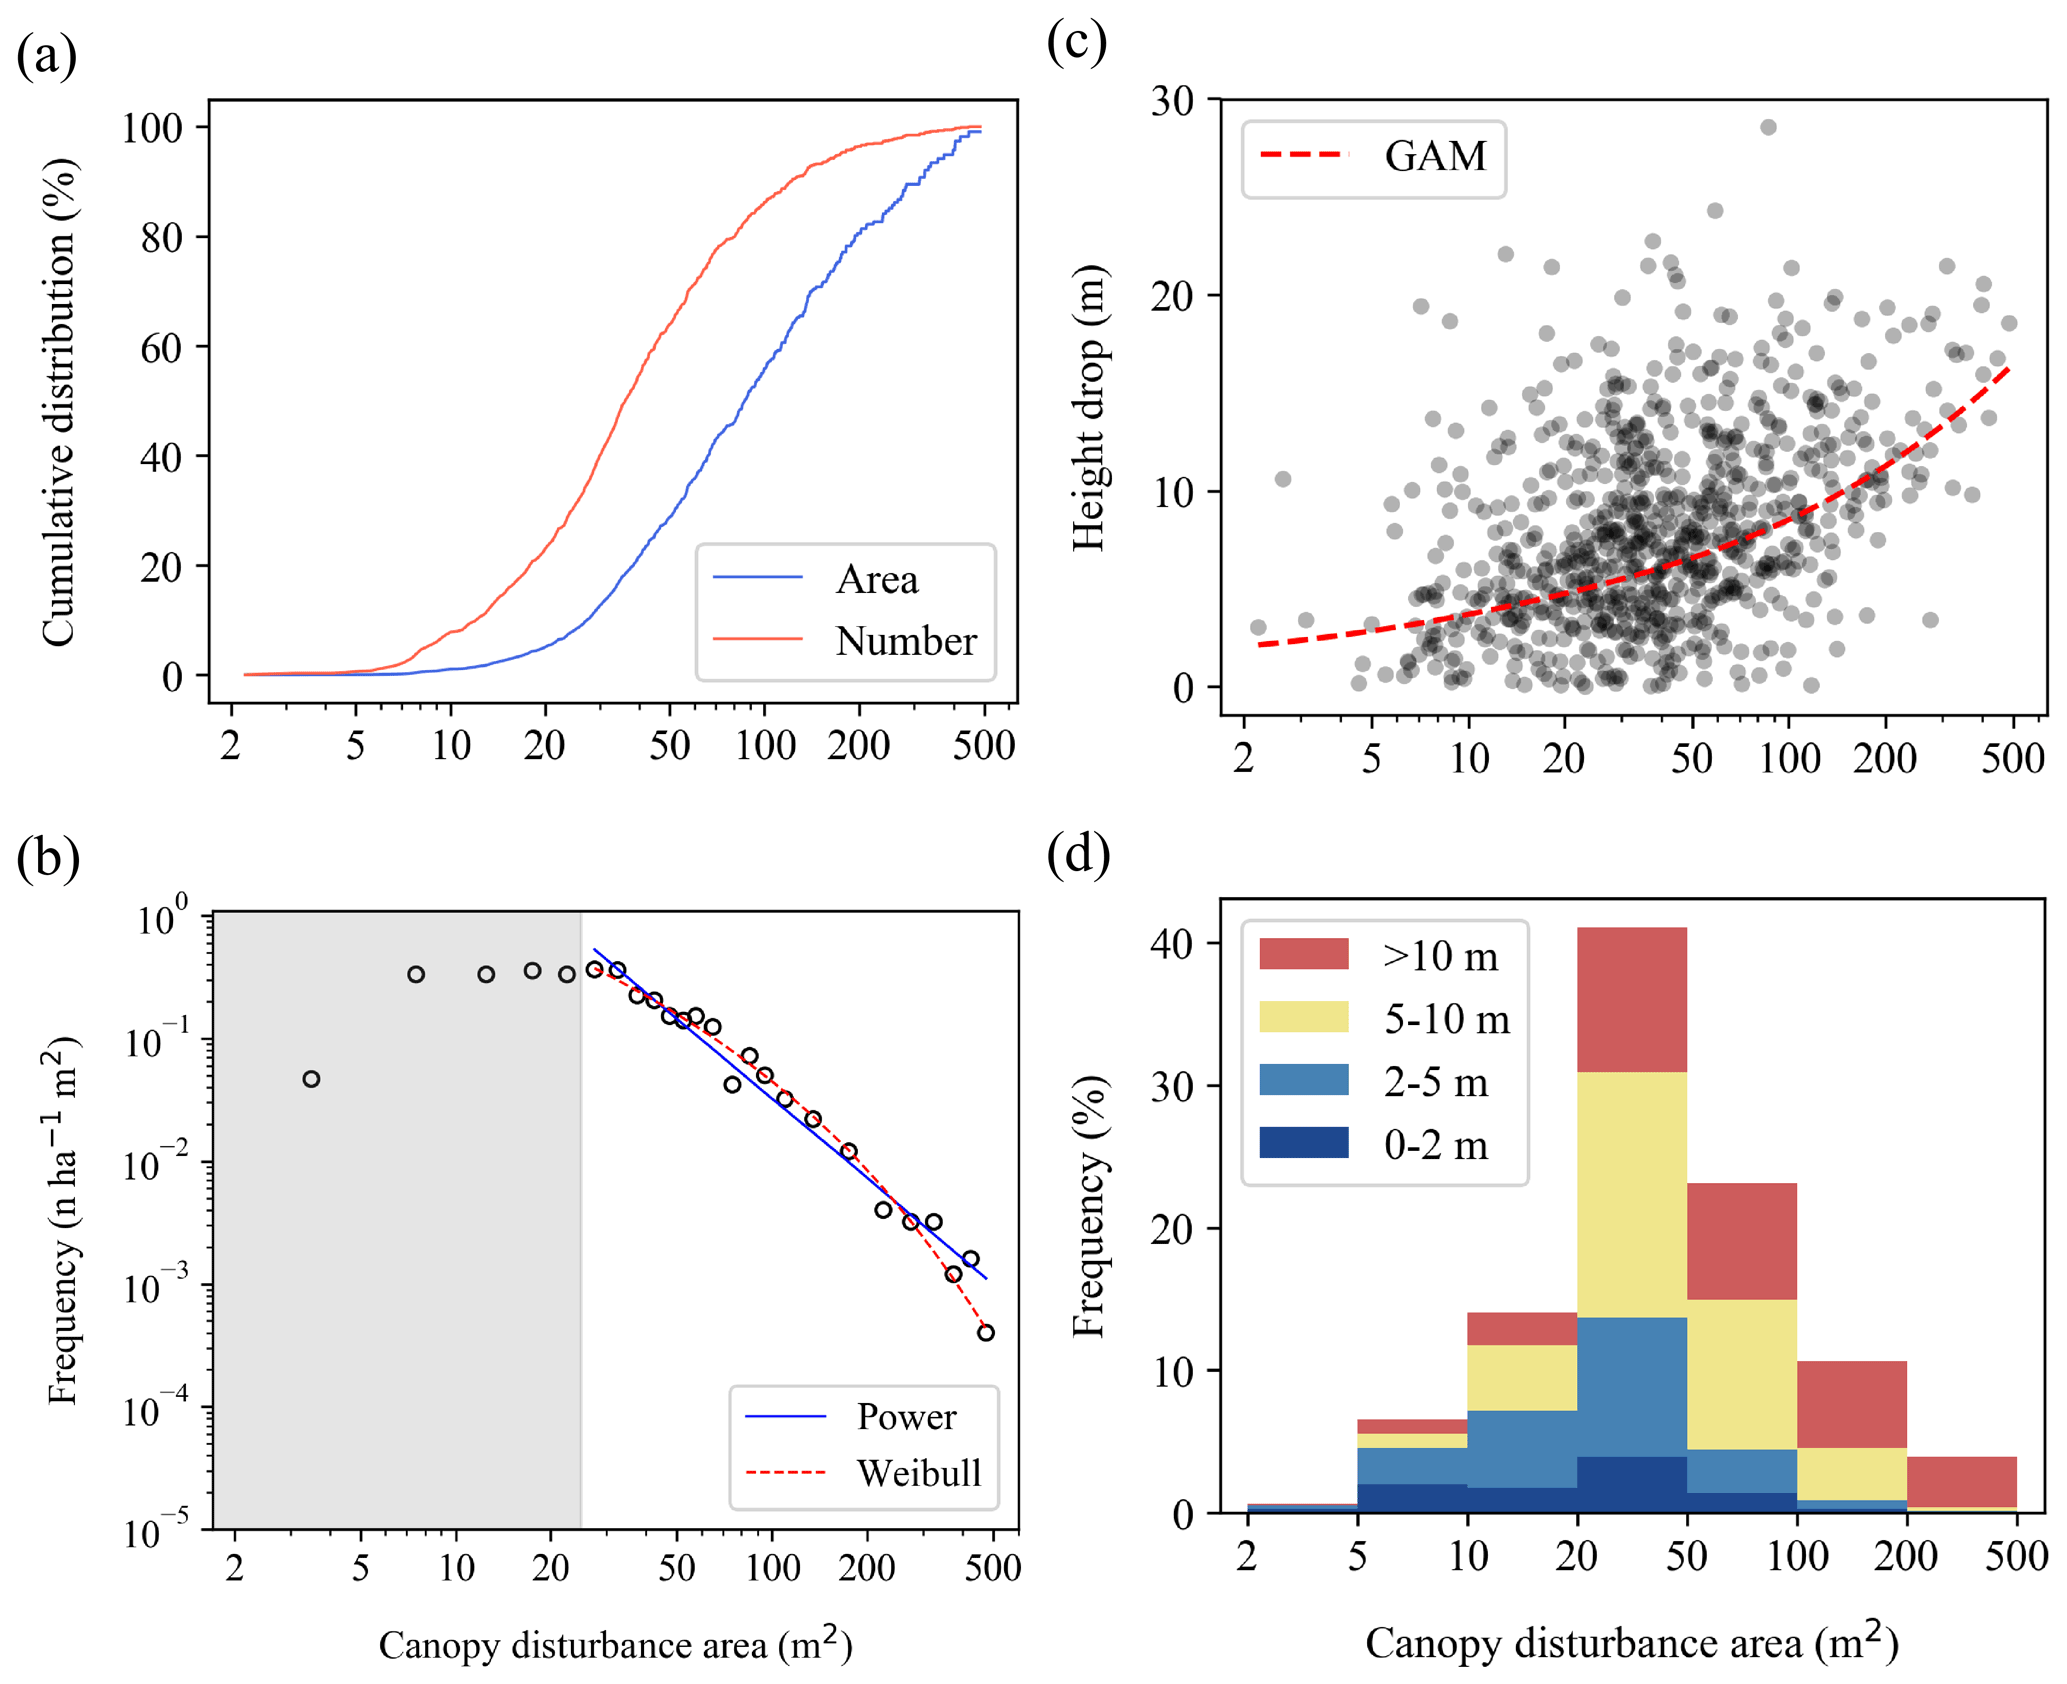
Figure 6Size structure of canopy disturbances. (a) Cumulative number and area of canopy disturbances in relation to their area. (b) Size distribution of canopy disturbances, together with Weibull and power function fits for canopy disturbances larger than 25 m2 (this threshold was chosen because we are confident we identified all canopy disturbances above this area, but we may have missed some smaller ones). (c) Relationship of mean vertical height drop to horizontal area among canopy disturbances (points), together with a GAM fit (red line) to illustrate the trend. (d) Distribution of canopy disturbances across area and height drop classes. The shaded gray in (b) indicates a canopy disturbance area lower than the 25 m2 threshold.
3.3 Treefalls and branchfalls
Analyses of the relative contributions of branchfalls, treefalls, and standing dead trees included 863 canopy disturbances or partial disturbances with 48 424.7 m2 of total area inside the 50 ha plot that could be visually classified into one of these categories and that were not part of the excluded long interval. Treefalls accounted for 66.3 % of the total observed disturbance area and 47.9 % of the total number of observed disturbances; branchfalls accounted for 23.5 % of the area and 43.5 % of the number; and standing dead trees accounted for 10.2 % of the area and 8.6 % of the number. Treefall and branchfall disturbance rates varied largely in parallel, although the ratios of their rates varied among measurement periods (Figs. 7 and S10). The ratio of the area in branchfalls to the area in treefalls ranged from 0.024 to 1.4 among measurement periods, and the ratio of the number of branchfalls to the number of treefalls ranged from 0.083 to 2.3.
Table 1Parameter values, Kolmogorov–Smirnov (K–S) statistics, the log-likelihood function, and ΔAIC values for maximum-likelihood fits of exponential, power, and Weibull probability density functions to size distributions for canopy disturbances larger than 2, 5, 10, and 25 m2. ΔAIC is the difference in AIC from the best model. The best-fit models for each dataset, as well as those within 2 ΔAIC of the best model, are highlighted in bold.
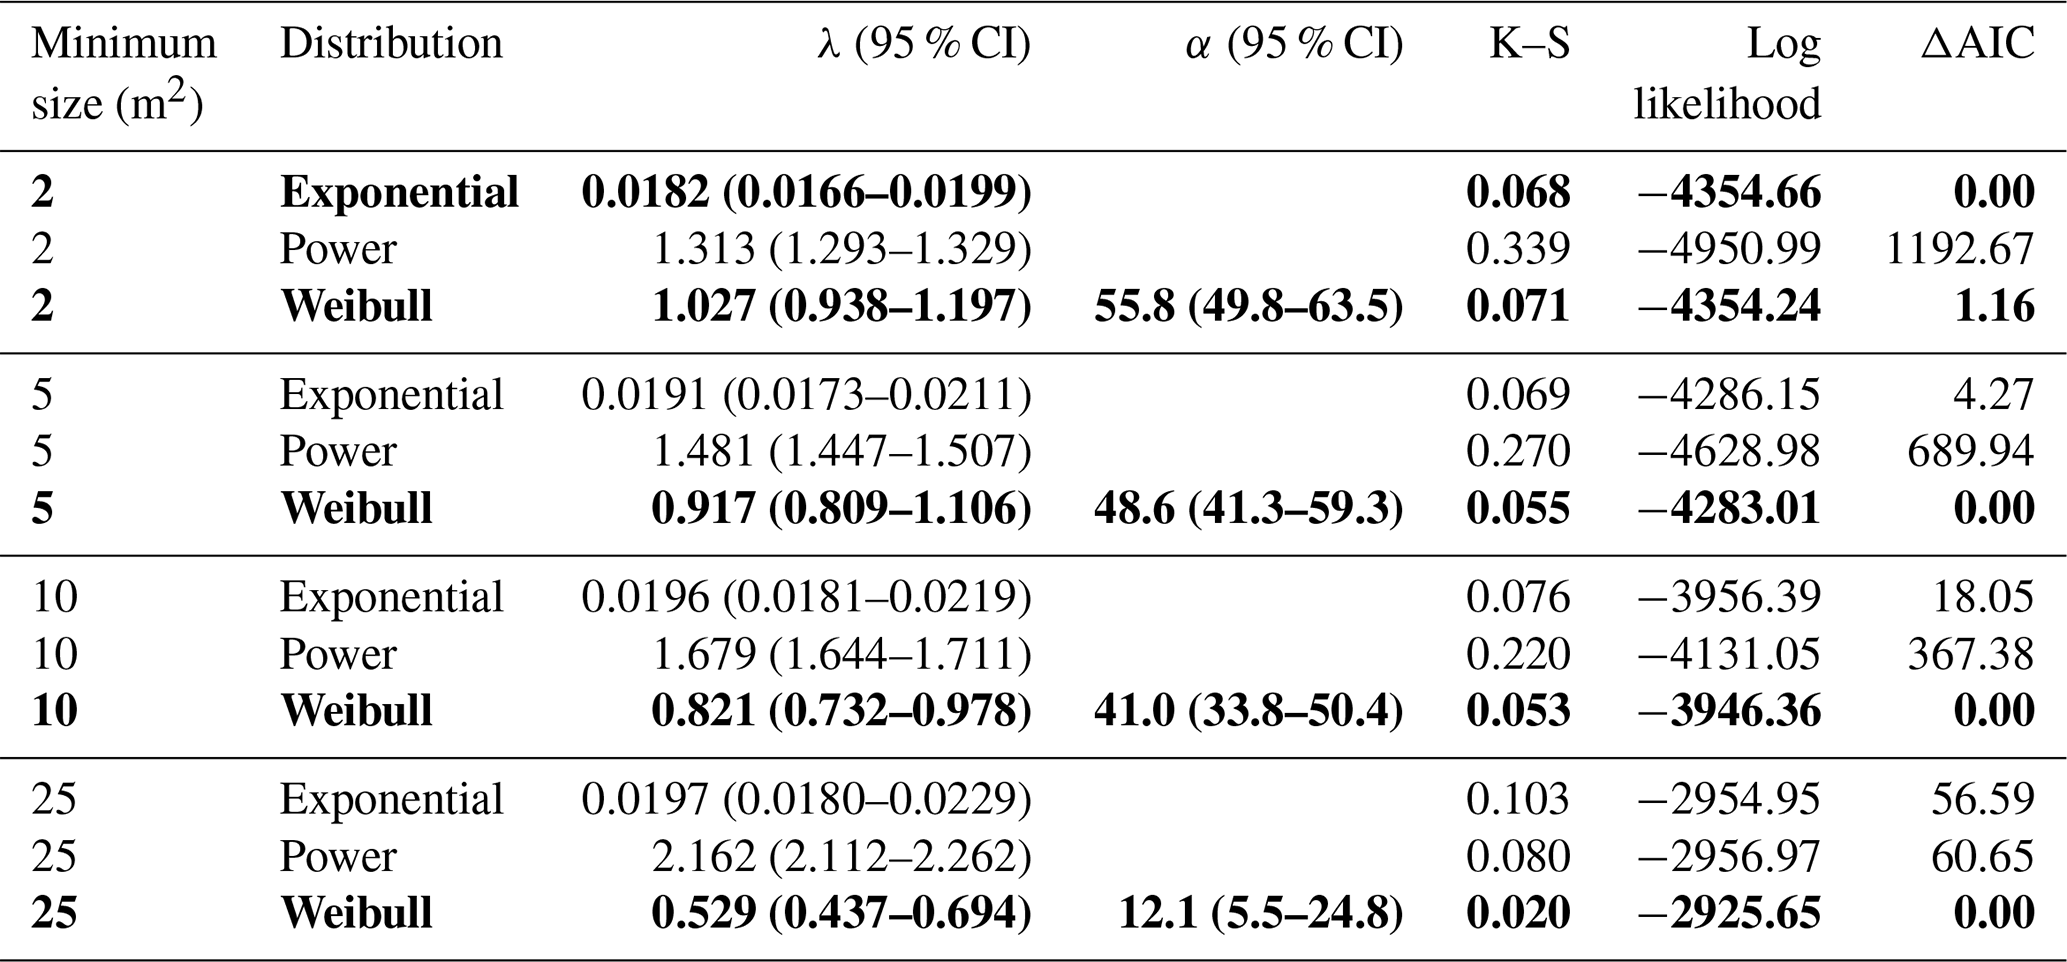

Figure 7Relationship of temporal variation in branchfall rates to temporal variation in treefall rates, when measured by total area (a) and number of events (b). The 1:1 line is shown for reference.
The use of high-frequency drone imagery enabled us to quantify temporal variation in canopy disturbance rates and to quantify the sizes of canopy disturbances at high temporal and spatial resolutions. We found that canopy disturbance rates of the BCI 50 ha plot varied strongly over time and were higher in the wet season. The frequency of extreme rainfall events was the best correlate of monthly variation in the canopy disturbance rate during the 5-year study period. In contrast, maximum wind speed was not significantly correlated. The size distribution of canopy disturbances was close to a power function for larger canopy disturbances, but the best fit was from a Weibull function overall. Branchfalls accounted for 26 % of the total area of disturbances from treefalls and branchfalls combined, and branchfall rates varied largely in parallel with treefall rates over time. These findings contributed to improve the understanding of the size distribution, temporal variation, and meteorological drivers of canopy disturbances in tropical forests.
4.1 Temporal variation in canopy disturbance
Canopy disturbance rates varied strongly over time in this moist tropical forest and were higher in the wet season. A single time interval (1 June to 13 July 2016) accounted for 20 % of the total disturbed area of the BCI 50 ha plot. The frequency of extreme rainfall events was a strong correlate of the variation in canopy disturbance rates among measurement intervals, whereas the frequency of high maximum wind speeds was not related. At our site, wind speeds are higher during the dry season, when canopy disturbance rates are lower (Figs. 4a and S1), and it is possible that wind speed is systematically underestimated in periods of high rainfall. We also note that wind speed and rainfall measurements were from a site 1.7 km from the boundary of the plot. Given the highly local nature of convective storms in the tropics, these measurements are imperfect proxies for conditions in the focal plot. Treefall and branchfall disturbance rates varied largely in parallel but not entirely. Differences in temporal patterns could in part reflect different sensitivity to particular abiotic drivers (e.g., wind regime and soil saturation).
These results are consistent with previous findings on seasonal variation and the role of rainfall in gap formation in tropical forests. A previous 4-year study on BCI found seasonal peaks in August and September, in the middle of the wet season, with monthly treefall rates significantly correlated with rainfall (r=0.47, p < 0.02) (Brokaw, 1982). Monthly tree mortality was also strongly and positively correlated with rainfall (r=0.85) in a 1-year study of a 10 ha site in the central Amazon (Fontes et al., 2018). Similarly, a study monitoring canopy trees monthly over 5 decades in the central Amazon found that trees died more often during wet months, even in drought years (Aleixo et al., 2019). A regional study of the central Amazon based on 12 years of satellite data found that major windthrows (visible on Landsat) occurred more frequently between September and February, months characterized by heavy rainfall, than the rest of the year (Negrón-Juárez et al., 2017). Studies have highlighted the importance of mesoscale convective systems, such as squall lines, for windthrows (Garstang et al., 1998; Negrón-Juárez et al., 2010, 2017; Araujo et al., 2017). In Panama, the period of June to August has the higher number of mesoscale convective systems (Jaramillo et al., 2017), and these were the months when we observed the highest canopy disturbance rates. The threshold rainfall rate of 24.3 mm h−1, which defined the extreme rainfall rate that was the best predictor of canopy disturbance formation in our study, is 4 times higher than the mean rate for mesoscale convective systems in the Panama region (Jaramillo et al., 2017), highlighting the importance of extreme events. Analysis of spatial variation in forest damage from Hurricane Maria in Puerto Rico found that total rainfall was the most important meteorological risk factor and that maximum sustained 1 min wind speeds were the second-most important; these two variables were moderately correlated (r=0.43) (Hall et al., 2020).
4.2 Mechanisms and size structure of canopy disturbances
Gaps in the forest canopy can be caused proximally by treefalls of canopy trees, branchfalls of canopy branches, the decay of standing dead canopy trees, or the decay of canopy branches. Treefalls and branchfalls of canopy trees are well-captured in our analyses, which focus on short-term changes that indicate loss of major canopy elements. In contrast, the decay of dead trees and senescing branches generally involves more subtle changes in the canopy over a longer period of time and is possibly mostly missed by our methods. Treefalls account for a majority of canopy tree mortality in most tropical forests, but the mortality of standing trees also plays a major role, especially in drought periods. Overall, treefalls (in which trees were uprooted or their trunks snapped) accounted for 51.2 % of all mortality of trees > 10 cm DBH (diameter at breast height) in a large-scale study of tree mortality in 189 Amazonian plots (Esquivel-Muelbert et al., 2020) and 65 % in a study that monitored tree mortality in 10 ha of forest in the central Amazon bi-monthly over 1 year (Fontes et al., 2018). Treefalls can involve a single canopy tree or multiple canopy trees. Multi-tree treefalls can result from coordinated disturbances over a large area (e.g., large-footprint wind disturbance) and/or from domino effects in which the failure of one canopy tree directly stresses one or more neighboring trees and causes them to fall as well (e.g., when additional trees are knocked down by the first tree or pulled down because of connections via lianas). It has been hypothesized that canopy disturbances may also be contagious over longer time intervals, with increased risk of treefall near canopy gaps, but evidence for this in tropical forests is mixed (Jansen et al., 2008). Given that our measurement intervals are relatively short (∼1 month), almost all of our mapped canopy disturbances are likely to reflect single catastrophic events.
Our study is one of several that have documented size distributions of canopy disturbances (dynamic gaps) or of static canopy gaps above some size that are approximately power functions, both on BCI (Solé and Manrubia, 1995; Lobo and Dalling, 2014) and in other tropical forests (Marvin and Asner, 2016; Asner et al., 2013; Kellner and Asner, 2009; Silva et al., 2019; Fisher et al., 2008). Static canopy gaps are areas in which the forest canopy is below a threshold height, e.g., 10 m, at a given time. A power function distribution of disturbance event sizes (here canopy disturbances) and of the sizes of disturbed areas (canopy gaps) can emerge from self-organization of dynamic systems such as forests in which individual tree growth and death depend on the sizes of neighbors (Solé and Manrubia, 1995). These same self-organized dynamics lead to the development of equilibrium size distributions of trees, which are typically well-fit by Weibull distributions in tropical forests (Muller-Landau et al., 2006a, b). The relative dearth of canopy disturbances smaller than 25 m2 in our dataset, compared to what would be expected under a power function, may be explained in part by lower detection frequencies, i.e., measurement bias. Our methods are expected to capture all treefalls and branchfalls above this threshold, but we may increasingly have missed smaller events, especially below ∼ 5 m2. However, we consider it unlikely that this is a sufficient explanation for the shortfall in small disturbances and suggest that it is more likely explained largely by the low frequency of small trees and branches in the canopy of this mature tropical forest and thus a dearth of small treefall and branchfall events.
Although rarely quantified, branchfall is an important ecological process, with major contributions to woody turnover and necromass production. We found that branchfalls were almost as common as treefalls in number, although they contributed a substantially smaller total area of disturbance. Similarly, a ground survey of 78 canopy turnover events in a Brazilian Amazon forest found that 44 % were branchfalls and accounted for 15 % of the total affected area (Leitold et al., 2018). In contrast, a landscape level analysis of lidar data concluded that branchfalls were 7 times more frequent than treefalls and accounted for 5 times more area (Marvin and Asner, 2016). However, Marvin and Asner (2016) classified branchfalls and treefalls based purely on the proportional decrease in canopy height (10 %–40 % decrease and 70 %–100 % decrease, respectively), a process liable to misclassification. It entirely ignored disturbances involving intermediate decreases in canopy height (40 %–70 %) and did not consider the possibility that any of these disturbances might be standing dead trees. Thus the differences in branchfall contribution between our work and that of Marvin and Asner (2016) may be due as much to methodological differences as to real variation in canopy dynamics.
A mechanistic understanding of the controls on woody residence time in tropical forests is urgently needed to predict the future of tropical-forest carbon stocks and biodiversity under global change (Johnson et al., 2016; McDowell et al., 2018; Muller-Landau et al., 2021). Canopy trees account for a majority of the productivity and carbon stocks in tropical forests, and their fates are disproportionately important for determining stand level woody residence time (Araujo et al., 2020). Advances in drone hardware and photogrammetric software now make it relatively inexpensive and straightforward to quantify forest canopy structure and dynamics at high spatial and temporal resolution through digital aerial photogrammetry and repeat drone imagery acquisitions. Here we applied these methods to 50 ha of old-growth tropical forest for 5 years and analyzed the resulting products to quantify major drops in canopy height such as those created by branchfalls and treefalls; we thus calculate the canopy disturbance rate. We found that canopy disturbance rates are highly temporally variable and are well-predicted by extreme rainstorms. Spatial resolutions of 3–7 cm in the orthomosaics, as used here, are now easily attained and proved sufficient to capture canopy dynamics and visually classify disturbances as treefalls, branchfalls, or the decomposition of standing dead trees.
Future research building on these approaches and expanding them to additional sites has much to contribute to our understanding of tropical-forest dynamics. The relationship of the mortality of standing dead trees to temporal climate variation could be investigated from these same data by conducting additional analyses of the orthomosaics to quantify temporal changes in leafing status of standing dead trees, prior to these trees decomposing. A better understanding of the relationship of storm conditions to treefall and branchfall rates could be obtained by combining such drone-acquired data with mechanistic models of wind damage risk (Jackson et al., 2019), collecting higher-frequency three-dimensional wind data, and/or measuring canopy dynamics at even higher temporal resolution. The use of drones with high-accuracy GPS systems, either post-processed kinematic (PPK) or real-time kinematic (RTK) systems, would also be advantageous and could enable the elimination of the alignment step of the processing as well as automation of the identification of canopy disturbances based on elevation model differences alone. Finally, we recommend carrying out flights under cloudy conditions when possible, as these diffuse lighting conditions improve visibility deeper in the canopy and reduce complications associated with shadows. The expansion of these methods to additional and larger areas, potentially in part through citizen science initiatives, has great potential to improve our understanding of the mortality of tropical-forest trees and the future of tropical forests under changing climate regimes.
Analysis codes, input data, and output results are available at https://doi.org/10.5281/zenodo.5786740 (Araujo et al., 2021a). All orthomosaics, elevation models, and shapefiles are available at the Smithsonian Figshare repository https://doi.org/10.25573/data.c.5389043.v1 (Araujo et al., 2021b).
The supplement related to this article is available online at: https://doi.org/10.5194/bg-18-6517-2021-supplement.
HCML and RFA planned and designed the research. MG and JPD collected drone data. RFA, SG, JPD, and MG processed drone imagery. RFA performed the analysis with support from HCML, CHSC, and RINJ. RFA and HCML wrote the manuscript.
The contact author has declared that neither they nor their co-authors have any competing interests.
Publisher’s note: Copernicus Publications remains neutral with regard to jurisdictional claims in published maps and institutional affiliations.
We gratefully acknowledge the financial support of the Next-Generation Ecosystem Experiments – Tropics, funded by the U.S. Department of Energy Office of Science Office of Biological and Environmental Research (Raquel Fernandes Araujo); the Smithsonian Institution Competitive Grants Program for Science (Helene C. Muller-Landau and Jonathan P. Dandois); and the Smithsonian Tropical Research Institute fellowship program (Carlos Henrique Souza Celes and Raquel Fernandes Araujo). We thank Milton Solano, Pablo Ramos, and Paulino Villareal for assistance in collecting and processing the drone imagery and Jeffrey Chambers, K. C. Cushman, and Evan Gora for providing helpful comments on an earlier version of this paper.
This research has been supported as part of the Next Generation Ecosystem Experiments-Tropics, funded by the US Department of Energy, Office of Science, Office of Biological and Environmental Research (grant no. DE-AC02-05CH11231). This research was also supported through the Smithsonian Institution Competitive Grants Program for Science and the Smithsonian Tropical Research Institute fellowship program.
This paper was edited by Alexandra Konings and reviewed by Ricardo Dal Agnol da Silva and one anonymous referee.
Aleixo, I., Norris, D., Hemerik, L., Barbosa, A., Prata, E., Costa, F., and Poorter, L.: Amazonian rainforest tree mortality driven by climate and functional traits, Nat. Clim. Change, 9, 384–388, https://doi.org/10.1038/s41558-019-0458-0, 2019.
Araujo, R. F., Nelson, B. W., Celes, C. H. S., and Chambers, J. Q.: Regional distribution of large blowdown patches across Amazonia in 2005 caused by a single convective squall line: Distribution of Amazonia Blowdown Damage, Geophys. Res. Lett., 44, 7793–7798, https://doi.org/10.1002/2017GL073564, 2017.
Araujo, R. F., Chambers, J. Q., Celes, C. H. S., Muller-Landau, H. C., Santos, A. P. F. dos, Emmert, F., Ribeiro, G. H. P. M., Gimenez, B. O., Lima, A. J. N., Campos, M. A. A., and Higuchi, N.: Integrating high resolution drone imagery and forest inventory to distinguish canopy and understory trees and quantify their contributions to forest structure and dynamics, PLoS ONE, 15, e0243079, https://doi.org/10.1371/journal.pone.0243079, 2020.
Araujo, R. F., Celes, C. H. S., Negrón-Juárez, R. I., and Muller-Landau, H. C.: Analysis codes and datasets: Strong temporal variation in treefall and branchfall rates in a tropical forest is related to extreme rainfall: results from five years of monthly drone data for a 50-ha plot, Zenodo [code], https://doi.org/10.5281/zenodo.5786740, 2021a.
Araujo, R. F., Grubinger, S., Garcia, M., Dandois, J. P., and Muller-Landau, H. C.: Collection of datasets: Strong temporal variation in treefall and branchfall rates in a tropical forest is related to extreme rainfall: results from 5 years of monthly drone data for a 50-ha plot, Smithsonian Tropical Research Institute, Collection, Figshare [data set], https://doi.org/10.25573/data.c.5389043.v1, 2021b.
Arellano, G., Medina, N. G., Tan, S., Mohamad, M., and Davies, S. J.: Crown damage and the mortality of tropical trees, New Phytol., 221, 169–179, https://doi.org/10.1111/nph.15381, 2019.
Asner, G. P., Kellner, J. R., Kennedy-Bowdoin, T., Knapp, D. E., Anderson, C., and Martin, R. E.: Forest Canopy Gap Distributions in the Southern Peruvian Amazon, PLoS ONE, 8, e60875, https://doi.org/10.1371/journal.pone.0060875, 2013.
Aubry-Kientz, M., Rossi, V., Cornu, G., Wagner, F., and Hérault, B.: Temperature rising would slow down tropical forest dynamic in the Guiana Shield, Sci. Rep., 9, 10235, https://doi.org/10.1038/s41598-019-46597-8, 2019.
Brienen, R. J. W., Phillips, O. L., Feldpausch, T. R., Gloor, E., Baker, T. R., Lloyd, J., Lopez-Gonzalez, G., Monteagudo-Mendoza, A., Malhi, Y., Lewis, S. L., Vásquez Martinez, R., Alexiades, M., Álvarez Dávila, E., Alvarez-Loayza, P., Andrade, A., Aragão, L. E. O. C., Araujo-Murakami, A., Arets, E. J. M. M., Arroyo, L., Aymard C., G. A., Bánki, O. S., Baraloto, C., Barroso, J., Bonal, D., Boot, R. G. A., Camargo, J. L. C., Castilho, C. V., Chama, V., Chao, K. J., Chave, J., Comiskey, J. A., Cornejo Valverde, F., da Costa, L., de Oliveira, E. A., Di Fiore, A., Erwin, T. L., Fauset, S., Forsthofer, M., Galbraith, D. R., Grahame, E. S., Groot, N., Hérault, B., Higuchi, N., Honorio Coronado, E. N., Keeling, H., Killeen, T. J., Laurance, W. F., Laurance, S., Licona, J., Magnussen, W. E., Marimon, B. S., Marimon-Junior, B. H., Mendoza, C., Neill, D. A., Nogueira, E. M., Núñez, P., Pallqui Camacho, N. C., Parada, A., Pardo-Molina, G., Peacock, J., Peña-Claros, M., Pickavance, G. C., Pitman, N. C. A., Poorter, L., Prieto, A., Quesada, C. A., Ramírez, F., Ramírez-Angulo, H., Restrepo, Z., Roopsind, A., Rudas, A., Salomão, R. P., Schwarz, M., Silva, N., Silva-Espejo, J. E., Silveira, M., Stropp, J., Talbot, J., ter Steege, H., Teran-Aguilar, J., Terborgh, J., Thomas-Caesar, R., Toledo, M., Torello-Raventos, M., Umetsu, R. K., van der Heijden, G. M. F., van der Hout, P., Guimarães Vieira, I. C., Vieira, S. A., Vilanova, E., Vos, V. A., and Zagt, R. J.: Long-term decline of the Amazon carbon sink, Nature, 519, 344–348, https://doi.org/10.1038/nature14283, 2015.
Brokaw, N. V. L.: Treefalls: frequency, timing, and consequences, in: The ecology of a tropical forest: seasonal rhythms and long-term changes, Smithsonian Institution, Washington, DC, 101–108, ISBN 0874746019, 1982.
Brokaw, N. V. L.: Gap-Phase Regeneration in a Tropical Forest, Ecology, 66, 682–687, https://doi.org/10.2307/1940529, 1985.
Burnham, K. P. and Anderson, D. R.: Model selection and multimodel inference: a practical information-theoretic approach, 2nd Edn., Springer-Verlag New York, New York, 520 pp., ISBN 0387953647, 2002.
Carvalho, L.: An Improved Evaluation of Kolmogorov's Distribution, J. Stat. Soft., 65, 1–8, https://doi.org/10.18637/jss.v065.c03, 2015.
Cavaleri, M. A., Reed, S. C., Smith, W. K., and Wood, T. E.: Urgent need for warming experiments in tropical forests, Glob. Change Biol., 21, 2111–2121, https://doi.org/10.1111/gcb.12860, 2015.
Dalagnol, R., Wagner, F. H., Galvão, L. S., Streher, A. S., Phillips, O. L., Gloor, E., Pugh, T. A. M., Ometto, J. P. H. B., and Aragão, L. E. O. C.: Large-scale variations in the dynamics of Amazon forest canopy gaps from airborne lidar data and opportunities for tree mortality estimates, Sci. Rep., 11, 1388, https://doi.org/10.1038/s41598-020-80809-w, 2021.
Dalling, J. W., Winter, K., and Hubbell, S. P.: Variation in growth responses of neotropical pioneers to simulated forest gaps, Funct Ecol., 18, 725–736, https://doi.org/10.1111/j.0269-8463.2004.00868.x, 2004.
Dandois, J. P. and Ellis, E. C.: High spatial resolution three-dimensional mapping of vegetation spectral dynamics using computer vision, Remote Sens. Environ., 136, 259–276, https://doi.org/10.1016/j.rse.2013.04.005, 2013.
Davies, S. J., Abiem, I., Abu Salim, K., Aguilar, S., Allen, D., Alonso, A., Anderson-Teixeira, K., Andrade, A., Arellano, G., Ashton, P. S., Baker, P. J., Baker, M. E., Baltzer, J. L., Basset, Y., Bissiengou, P., Bohlman, S., Bourg, N. A., Brockelman, W. Y., Bunyavejchewin, S., Burslem, D. F. R. P., Cao, M., Cárdenas, D., Chang, L.-W., Chang-Yang, C.-H., Chao, K.-J., Chao, W.-C., Chapman, H., Chen, Y.-Y., Chisholm, R. A., Chu, C., Chuyong, G., Clay, K., Comita, L. S., Condit, R., Cordell, S., Dattaraja, H. S., de Oliveira, A. A., den Ouden, J., Detto, M., Dick, C., Du, X., Duque, Á., Ediriweera, S., Ellis, E. C., Obiang, N. L. E., Es- ufali, S., Ewango, C. E. N., Fernando, E. S., Filip, J., Fischer, G. A., Foster, R., Giambelluca, T., Giardina, C., Gilbert, G. S., Gonzalez-Akre, E., Gunatilleke, I. A. U. N., Gunatilleke, C. V. S., Hao, Z., Hau, B. C. H., He, F., Ni, H., Howe, R. W., Hubbell, S. P., Huth, A., Inman-Narahari, F., Itoh, A., Janík, D., Jansen, P. A., Jiang, M., Johnson, D. J., Jones, F. A., Kanzaki, M., Kenfack, D., Kiratiprayoon, S., Král, K., Krizel, L., Lao, S., Larson, A. J., Li, Y., Li, X., Litton, C. M., Liu, Y., Liu, S., Lum, S. K. Y., Luskin, M. S., Lutz, J. A., Luu, H. T., Ma, K., Makana, J.-R., Malhi, Y., Martin, A., McCarthy, C., McMahon, S. M., McShea, W. J., Memiaghe, H., Mi, X., Mitre, D., Mohamad, M., Monks, L., Muller-Landau, H. C., Musili, P. M., Myers, J. A., Nathalang, A., Ngo, K. M., Norden, N., Novotny, V., O’Brien, M. J., Orwig, D., Ostertag, R., Papathanassiou, K., Parker, G. G., Perez, R., Perfecto, I., Phillips, R. P., Pongpattananurak, N., Pretzsch, H., Ren, H., Reynolds, G., Rodriguez, L. J., Russo, S. E., Sack, L., Sang, W., Shue, J., Singh, A., Song, G. M., Sukumar, R., Sun, I., Suresh, H. S., Swenson, N. G., Tan, S., Thomas, S. C., Thomas, D., Thompson, J., Turner, B. L., Uowolo, A., Uriarte, M., Valencia, R., Vandermeer, J., Vicentini, A., Visser, M., Vrska, T., Wang, X., Wang, X., Weiblen, G. D., Whitfeld, T. J. S., Wolf, A., Wright, S. J., Xu, H., Yao, T. L., Yap, S. L., Ye, W., Yu, M., Zhang, M., Zhu, D., Zhu, L., Zimmerman, J. K., and Zuleta, D.: ForestGEO: Understanding forest diversity and dynamics through a global observatory network, Biol. Conserv., 253, 108907, https://doi.org/10.1016/j.biocon.2020.108907, 2021.
Deb, J., Phinn, S., Butt, N., and Mcalpine, C.: Climate change impacts on tropical forests: identifying risks for tropical Asia, J. Trop.l Forest Sci., 30, 182–194, 2018.
Denslow, J. S.: Patterns of plant species diversity during succession under different disturbance regimes, Oecologia, 46, 18–21, https://doi.org/10.1007/BF00346960, 1980.
Denslow, J. S.: Tropical Rainforest Gaps and Tree Species Diversity, Ann. Rev. Ecol. Syst., 1, 431–451, 1987.
Esquivel-Muelbert, A., Phillips, O. L., Brienen, R. J. W., Fauset, S., Sullivan, M. J. P., Baker, T. R., Chao, K.-J., Feldpausch, T. R., Gloor, E., Higuchi, N., Houwing-Duistermaat, J., Lloyd, J., Liu, H., Malhi, Y., Marimon, B., Marimon Junior, B. H., Monteagudo-Mendoza, A., Poorter, L., Silveira, M., Torre, E. V., Dávila, E. A., del Aguila Pasquel, J., Almeida, E., Loayza, P. A., Andrade, A., Aragão, L. E. O. C., Araujo-Murakami, A., Arets, E., Arroyo, L., Aymard C., G. A., Baisie, M., Baraloto, C., Ca- margo, P. B., Barroso, J., Blanc, L., Bonal, D., Bongers, F., Boot, R., Brown, F., Burban, B., Camargo, J. L., Castro, W., Moscoso, V. C., Chave, J., Comiskey, J., Valverde, F. C., da Costa, A. L., Cardozo, N. D., Di Fiore, A., Dourdain, A., Erwin, T., Llam- pazo, G. F., Vieira, I. C. G., Herrera, R., Honorio Coronado, E., Huamantupa-Chuquimaco, I., Jimenez-Rojas, E., Killeen, T., Laurance, S., Laurance, W., Levesley, A., Lewis, S. L., Ladvocat, K. L. L. M., Lopez-Gonzalez, G., Lovejoy, T., Meir, P., Men- doza, C., Morandi, P., Neill, D., Nogueira Lima, A. J., Vargas, P. N., de Oliveira, E. A., Camacho, N. P., Pardo, G., Peacock, J., Peña-Claros, M., Peñuela-Mora, M. C., Pickavance, G., Pipoly, J., Pitman, N., Prieto, A., Pugh, T. A. M., Quesada, C., Ramirez- Angulo, H., de Almeida Reis, S. M., Rejou-Machain, M., Cor- rea, Z. R., Bayona, L. R., Rudas, A., Salomão, R., Serrano, J., Espejo, J. S., Silva, N., Singh, J., Stahl, C., Stropp, J., Swamy, V., Talbot, J., ter Steege, H., Terborgh, J., Thomas, R., Toledo, M., Torres-Lezama, A., Gamarra, L. V., van der Heijden, G., van der Meer, P., van der Hout, P., Martinez, R. V., Vieira, S. A., Cayo, J. V., Vos, V., Zagt, R., Zuidema, P., and Galbraith, D.: Tree mode of death and mortality risk factors across Amazon forests, Nat. Commun., 11, 5515, https://doi.org/10.1038/s41467-020-18996-3, 2020.
Fisher, J. I., Hurtt, G. C., Thomas, R. Q., and Chambers, J. Q.: Clustered disturbances lead to bias in large-scale estimates based on forest sample plots: Clustered disturbance and forest plot bias, Ecol. Lett., 11, 554–563, https://doi.org/10.1111/j.1461-0248.2008.01169.x, 2008.
Fontes, C. G., Chambers, J. Q., and Higuchi, N.: Revealing the causes and temporal distribution of tree mortality in Central Amazonia, Forest Ecol. Manag., 424, 177–183, https://doi.org/10.1016/j.foreco.2018.05.002, 2018.
Garstang, M., White, S., Shugart, H. H., and Halverson, J.: Convective cloud downdrafts as the cause of large blowdowns in the Amazon rainforest, Meteorl. Atmos. Phys., 67, 199–212, https://doi.org/10.1007/BF01277510, 1998.
Hall, J., Muscarella, R., Quebbeman, A., Arellano, G., Thompson, J., Zimmerman, J. K., and Uriarte, M.: Hurricane-Induced Rainfall is a Stronger Predictor of Tropical Forest Damage in Puerto Rico Than Maximum Wind Speeds, Sci. Rep., 10, 4318, https://doi.org/10.1038/s41598-020-61164-2, 2020.
Harms, K. E., Condit, R., Hubbell, S. P., and Foster, R. B.: Habitat associations of trees and shrubs in a 50-ha neotropical forest plot: Habitat associations of trees and shrubs, J. Ecol., 89, 947–959, https://doi.org/10.1111/j.1365-2745.2001.00615.x, 2001.
Holdridge, L. R.: Determination of World Plant Formations from Simple Climatic Data, Science, 105, 367–368, 1947.
Hubbell, S. P., Foster, R. B., O'Brien, S. T., Harms, K. E., Condit, R., Wechsler, B., Wright, S. J., and Loo de Lao, S.: Light-Gap Disturbances, Recruitment Limitation, and Tree Diversity in a Neotropical Forest, Science, 283, 554–557, https://doi.org/10.1126/science.283.5401.554, 1999.
IPCC: Summary for Policymakers, in: Climate Change 2014, Mitigation of Climate Change. Contribution of Working Group III to the Fifth Assessment Report of the Intergovernmental Panel on Climate Change, Cambridge University Press, United Kingdom and New York, NY, USA, 32 pp., ISBN 978-92-9169-143-2, 2014.
Jackson, T., Shenkin, A., Wellpott, A., Calders, K., Origo, N., Disney, M., Burt, A., Raumonen, P., Gardiner, B., Herold, M., Fourcaud, T., and Malhi, Y.: Finite element analysis of trees in the wind based on terrestrial laser scanning data, Agr. Forest Meteorol., 265, 137–144, https://doi.org/10.1016/j.agrformet.2018.11.014, 2019.
Jansen, P. A., Meer, P. J. V. der, and Bongers, F.: Spatial contagiousness of canopy disturbance in tropical rain forest: An individual-tree-based test, Ecology, 89, 3490–3502, https://doi.org/10.1890/07-1682.1, 2008.
Jaramillo, L., Poveda, G., and Mejía, J. F.: Mesoscale convective systems and other precipitation features over the tropical Americas and surrounding seas as seen by TRMM, Int. J. Climatol, 37, 380–397, https://doi.org/10.1002/joc.5009, 2017.
Johnson, M. O., Galbraith, D., Gloor, M., De Deurwaerder, H., Guimberteau, M., Rammig, A., Thonicke, K., Verbeeck, H., Randow, C., Monteagudo, A., Phillips, O. L., Brienen, R. J. W., Feldpausch, T. R., Lopez Gonzalez, G., Fauset, S., Quesada, C. A., Christoffersen, B., Ciais, P., Sampaio, G., Kruijt, B., Meir, P., Moorcroft, P., Zhang, K., Alvarez-Davila, E., Alves de Oliveira, A., Amaral, I., Andrade, A., Aragao, L. E. O. C., Araujo-Murakami, A., Arets, E. J. M. M., Arroyo, L., Aymard, G. A., Baraloto, C., Barroso, J., Bonal, D., Boot, R., Camargo, J., Chave, J., Cogollo, A., Cornejo Valverde, F., Lola da Costa, A. C., Di Fiore, A., Ferreira, L., Higuchi, N., Honorio, E. N., Killeen, T. J., Laurance, S. G., Laurance, W. F., Licona, J., Lovejoy, T., Malhi, Y., Marimon, B., Marimon, B. H., Matos, D. C. L., Mendoza, C., Neill, D. A., Pardo, G., Peña-Claros, M., Pitman, N. C. A., Poorter, L., Prieto, A., Ramirez-Angulo, H., Roopsind, A., Rudas, A., Salomao, R. P., Silveira, M., Stropp, J., Steege, H., Terborgh, J., Thomas, R., Toledo, M., Torres-Lezama, A., Heijden, G. M. F., Vasquez, R., Guimarães Vieira, I. C., Vilanova, E., Vos, V. A., and Baker, T. R.: Variation in stem mortality rates determines patterns of above-ground biomass in Amazonian forests: implications for dynamic global vegetation models, Glob. Change Biol., 22, 3996–4013, https://doi.org/10.1111/gcb.13315, 2016.
Kellner, J. R. and Asner, G. P.: Convergent structural responses of tropical forests to diverse disturbance regimes, Ecol. Lett., 12, 887–897, https://doi.org/10.1111/j.1461-0248.2009.01345.x, 2009.
Leigh, E. G. Jr.: Tropical forest ecology: a view from Barro Colorado Island, Oxford University Press, Oxford, 264 pp., ISBN 9780195096033, 1999.
Leitold, V., Morton, D. C., Longo, M., dos-Santos, M. N., Keller, M., and Scaranello, M.: El Niño drought increased canopy turnover in Amazon forests, New Phytol., 219, 959–971, https://doi.org/10.1111/nph.15110, 2018.
Lobo, E. and Dalling, J. W.: Effects of topography, soil type and forest age on the frequency and size distribution of canopy gap disturbances in a tropical forest, Biogeosciences, 10, 6769–6781, https://doi.org/10.5194/bg-10-6769-2013, 2013.
Lobo, E. and Dalling, J. W.: Spatial scale and sampling resolution affect measures of gap disturbance in a lowland tropical forest: implications for understanding forest regeneration and carbon storage, Proc. R. Soc. B., 281, 20133218, https://doi.org/10.1098/rspb.2013.3218, 2014.
Manrubia, S. C. and Solé, R. V.: On Forest Spatial Dynamics with Gap Formation, J. Theor. Biol., 187, 159–164, https://doi.org/10.1006/jtbi.1997.0409, 1997.
Marra, D. M., Chambers, J. Q., Higuchi, N., and Trumbore, S. E.: Large-Scale Wind Disturbances Promote Tree Diversity in a Central Amazon Forest, PLOS ONE, 9, e103711, https://doi.org/10.1371/journal.pone.0103711, 2014.
Marvin, D. C. and Asner, G. P.: Branchfall dominates annual carbon flux across lowland Amazonian forests, Environ. Res. Lett., 11, 094027, https://doi.org/10.1088/1748-9326/11/9/094027, 2016.
McDowell, N., Allen, C. D., Anderson-Teixeira, K., Brando, P., Brienen, R., Chambers, J., Christoffersen, B., Davies, S., Doughty, C., Duque, A., Espirito-Santo, F., Fisher, R., Fontes, C. G., Galbraith, D., Goodsman, D., Grossiord, C., Hartmann, H., Holm, J., Johnson, D. J., Kassim, Abd. R., Keller, M., Koven, C., Kueppers, L., Kumagai, T., Malhi, Y., McMahon, S. M., Mencuccini, M., Meir, P., Moorcroft, P., Muller-Landau, H. C., Phillips, O. L., Powell, T., Sierra, C. A., Sperry, J., Warren, J., Xu, C., and Xu, X.: Drivers and mechanisms of tree mortality in moist tropical forests, New Phytol., 219, 851–869, https://doi.org/10.1111/nph.15027, 2018.
McMahon, S. M., Arellano, G., and Davies, S. J.: The importance and challenges of detecting changes in forest mortality rates, Ecosphere, 10, e02615, https://doi.org/10.1002/ecs2.2615, 2019.
Muller-Landau, H. C., Condit, R. S., Harms, K. E., Marks, C. O., Thomas, S. C., Bunyavejchewin, S., Chuyong, G., Co, L., Davies, S., Foster, R., Gunatilleke, S., Gunatilleke, N., Hart, T., Hubbell, S. P., Itoh, A., Kassim, A. R., Kenfack, D., LaFrankie, J. V., Lagunzad, D., Lee, H. S., Losos, E., Makana, J.-R., Ohkubo, T., Samper, C., Sukumar, R., Sun, I.-F., Nur Supardi, M. N., Tan, S., Thomas, D., Thompson, J., Valencia, R., Vallejo, M. I., Munoz, G. V., Yamakura, T., Zimmerman, J. K., Dattaraja, H. S., Esufali, S., Hall, P., He, F., Hernandez, C., Kiratiprayoon, S., Suresh, H. S., Wills, C., and Ashton, P.: Comparing tropical forest tree size distributions with the predictions of metabolic ecology and equilibrium models, Ecol. Lett., 9, 589–602, https://doi.org/10.1111/j.1461-0248.2006.00915.x, 2006a.
Muller-Landau, H. C., Condit, R. S., Chave, J., Thomas, S. C., Bohlman, S. A., Bunyavejchewin, S., Davies, S., Foster, R., Gunatilleke, S., Gunatilleke, N., Harms, K. E., Hart, T., Hubbell, S. P., Itoh, A., Kassim, A. R., LaFrankie, J. V., Lee, H. S., Losos, E., Makana, J.-R., Ohkubo, T., Sukumar, R., Sun, I.-F., Nur Supardi, M. N., Tan, S., Thompson, J., Valencia, R., Munoz, G. V., Wills, C., Yamakura, T., Chuyong, G., Dattaraja, H. S., Esufali, S., Hall, P., Hernandez, C., Kenfack, D., Kiratiprayoon, S., Suresh, H. S., Thomas, D., Vallejo, M. I., and Ashton, P.: Testing metabolic ecology theory for allometric scaling of tree size, growth and mortality in tropical forests, Ecol. Lett., 9, 575–588, https://doi.org/10.1111/j.1461-0248.2006.00904.x, 2006b.
Muller-Landau, H. C., Cushman, K. C., Arroyo, E. E., Martinez Cano, I., Anderson-Teixeira, K. J., and Backiel, B.: Patterns and mechanisms of spatial variation in tropical forest productivity, woody residence time, and biomass, New Phytol., 229, 3065–3087, https://doi.org/10.1111/nph.17084, 2021.
Negrón-Juárez, R. I., Chambers, J. Q., Guimaraes, G., Zeng, H., Raupp, C. F. M., Marra, D. M., Ribeiro, G. H. P. M., Saatchi, S. S., Nelson, B. W., and Higuchi, N.: Widespread Amazon forest tree mortality from a single cross-basin squall line event: wind-driven tree mortality in amazonia, Geophys. Res. Lett., 37, 1–5, https://doi.org/10.1029/2010GL043733, 2010.
Negrón-Juárez, R. I., Jenkins, H. S., Raupp, C. F. M., Riley, W. J., Kueppers, L. M., and Marra, D. M.: Windthrow Variability in Central Amazonia, Atmosphere, 17, 1–17, 2017.
Negrón-Juárez, R. I., Holm, J. A., Marra, D. M., Rifai, S. W., Riley, W. J., Chambers, J. Q., Koven, C. D., Knox, R. G., McGroddy, M. E., Di Vittorio, A. V., Urquiza-Muñoz, J., Tello-Espinoza, R., Muñoz, W. A., Ribeiro, G. H. P. M., and Higuchi, N.: Vulnerability of Amazon forests to storm-driven tree mortality, Environ. Res. Lett., 13, 054021, https://doi.org/10.1088/1748-9326/aabe9f, 2018.
Phillips, O. L., Lloyd, J., Malhi, Y., Monteagudo, A., Almeida, S., Davila, E. A., Amaral, I., Andelman, S., Andrade, A., Arroyo, L., Aymard, G., Baker, T. R., and Bonal, D.: Drought–mortality relationships for tropical forests, New Phytol., 16, 631–646, 2010.
Silva, C. A., Valbuena, R., Pinagé, E. R., Mohan, M., Almeida, D. R. A., North Broadbent, E., Jaafar, W. S. W. M., Papa, D., Cardil, A., and Klauberg, C.: ForestGapR: An R Package for forest gap analysis from canopy height models, Method. Ecol. Evol., 10, 1347–1356, https://doi.org/10.1111/2041-210X.13211, 2019.
Silva, C. V. J., Aragão, L. E. O. C., Barlow, J., Espirito-Santo, F., Young, P. J., Anderson, L. O., Berenguer, E., Brasil, I., Foster Brown, I., Castro, B., Farias, R., Ferreira, J., França, F., Graça, P. M. L. A., Kirsten, L., Lopes, A. P., Salimon, C., Scaranello, M. A., Seixas, M., Souza, F. C., and Xaud, H. A. M.: Drought-induced Amazonian wildfires instigate a decadal-scale disruption of forest carbon dynamics, Philos. T. R. Soc. B, 373, 20180043, https://doi.org/10.1098/rstb.2018.0043, 2018.
Solé, R. V. and Manrubia, S. C.: Are rainforests self-organized in a critical state?, J. Theor. Biol., 173, 31–40, https://doi.org/10.1006/jtbi.1995.0040, 1995.
Windsor, D. M.: Climate and moisture variability in a tropical forest: long-term records from Barro Colorado Island, Panamá, Smithsonian Contributions to the Earth Sciences, 29, 1–45, https://doi.org/10.5479/si.00810274.29.1, 1990.
Xu, L., Saatchi, S. S., Yang, Y., Yu, Y., Pongratz, J., Bloom, A. A., Bowman, K., Worden, J., Liu, J., Yin, Y., Domke, G., McRoberts, R. E., Woodall, C., Nabuurs, G.-J., de-Miguel, S., Keller, M., Harris, N., Maxwell, S., and Schimel, D.: Changes in global terrestrial live biomass over the 21st century, Sci. Adv., 7, eabe9829, https://doi.org/10.1126/sciadv.abe9829, 2021.
Yanoviak, S. P., Gora, E. M., Burchfield, J. M., Bitzer, P. M., and Detto, M.: Quantification and identification of lightning damage in tropical forests, Ecol. Evol., 7, 5111–5122, https://doi.org/10.1002/ece3.3095, 2017.
Zahawi, R. A., Dandois, J. P., Holl, K. D., Nadwodny, D., Reid, J. L., and Ellis, E. C.: Using lightweight unmanned aerial vehicles to monitor tropical forest recovery, Biol. Conserv., 186, 287–295, https://doi.org/10.1016/j.biocon.2015.03.031, 2015.