the Creative Commons Attribution 4.0 License.
the Creative Commons Attribution 4.0 License.
 | 28 Jan 2021
Shift of seed mass and fruit type spectra along longitudinal gradient: high water availability and growth allometry
Shunli Yu
Guoxun Wang
Ofir Katz
Danfeng Li
Qibing Wang
Ming Yue
Canran Liu
Propagule traits vary among biomes along geographical gradients such as longitude, but the mechanisms that underlie these variations remain unclear. This study aims to explore seed mass variation patterns of different biome types along a longitudinal gradient and their underlying variation mechanisms by involving an in-depth analysis on the variation of seed mass, fruit type spectra, growth forms and dispersal mode spectra in Inner Mongolia and northeastern China. Plant community characterization and seed collection were conducted in 26 sites spreading over five vegetation types and covering 622 species belonging to 66 families and 298 genera. We found there are significantly declining trends for mean seed mass, vertebrate-dispersed species richness and fleshy-fruited species richness along a longitudinal gradient from forests to desert grasslands. However, we also found the lowest average seed mass and the smallest proportion of species dispersed by vertebrates occurring at typical grasslands in the five biomes. The variations of average seed mass display high congruence with transition of growth form spectra. The selection for these propagule attributes is driven mainly by climatic factors such as precipitation, temperature, soil moisture and evaporation, as well as by internal biotic factors such as growth forms, canopy coverage and leaf area (Ackerly and Donoghue, 1998). A hypothesis was provided that environmental factors and botanical traits that favor greater water availability lead to emergence (or speciation) of species with large seeds or fleshy fruits with high water content. Due to greater water availability and increasing leaf area, much more photosynthate (photosynthesis production) and allometric growth then ultimately increase the biome average seed mass from west to east. Phylogenetic signal or diversity are not found to be significantly involved in the effect on the patterns. A novel mechanistic framework and mathematical model are provided to expound seed variation among species or biomes.
Please read the corrigendum first before continuing.
-
Notice on corrigendum
The requested paper has a corresponding corrigendum published. Please read the corrigendum first before downloading the article.
-
Article
(1932 KB)
- Corrigendum
-
Supplement
(395 KB)
-
The requested paper has a corresponding corrigendum published. Please read the corrigendum first before downloading the article.
- Article
(1932 KB) - Full-text XML
- Corrigendum
-
Supplement
(395 KB) - BibTeX
- EndNote


Seed traits have great impact on plants' competitive ability, fitness, fecundity and reproduction. Therefore, studying seed mass variations and their mechanism is crucial for understanding a plant's ecological strategy and resource acquisition (Zanne et al., 2014) as well as deep-time origin and evolution of seed attributes. Being a relatively stable biological trait, seed mass is controlled by an appointed gene (Adamskia et al., 2009; Wang et al., 2014), while retaining a certain degree of plasticity being affected by the surrounding environment (Baker, 1972). Therefore, an individual plant's seed size is a combined result of its taxonomic group's evolutionary history and immediate selective pressures of the local environment (Westoby et al., 2002; Moles et al., 2005a). Furthermore, as an important aspect in the reproductive biology of plants, seed mass is evolutionarily associated with and corresponds to other plant traits, relating to growth forms (for instance, trees, shrubs and herbs), life history (for example, annual plants or perennial plants) (Garnier, 1992; Moles et al., 2005a), stature and canopy sizes (Venable, 1992; Leishman and Westoby, 1994; Moles et al., 2005a), dispersal modes (Greene and Johnson, 1993; Hughes et al., 1994), leaf area (Díaz et al., 2016), and plant longevity (Telenius and Torstesson, 1991), as well as to anatomical traits of flowers and fruits (Primack, 1987).
Numerous works show that seed mass varies along environmental gradients such as latitude, elevation and longitude owing to environmental variations in temperature and precipitation both among and within communities (Moles et al., 2007) and several ecological factors are proposed to explain such seed mass variation gradients or patterns, for example, temperature (Moles et al., 2014), light (or solar radiation) (Murray et al., 2004; Demalach and Kadmon, 2018), soil resource availability (Demalach and Kadmon, 2018), growth forms (Moles et al., 2005b), dispersal modes (Moles and Westoby, 2003; Herrera, 2005) and soil pH (Tautenhahn et al., 2008). However, a deep understanding of the factors that underlie these major biogeographical variations is missing (Demalach and Kadmon, 2018), especially at a continental scale along longitude. Previous work suggested that community-level average seed mass tends to decrease towards higher latitudes and elevations (Moles et al., 2007). These trends can be explained by shifts in habitat type, plant growth form spectra, seed disperser assemblage (Moles and Westoby, 2003), solar radiation and metabolic expenditure (Murray et al., 2003, 2004), and NPP (Bu et al., 2007; Guo et al., 2010) along latitudinal and elevational gradients. Additionally, species that prefer shaded habitats and late successional stages generally tend to have larger seeds than those in open arid habitats or earlier successional stages (Baker, 1972; Salisbury, 1974; Foster and Janson, 1985; Hallett et al., 2011), indicating a strong effect of high water availability on seed mass owing to low evaporation under close canopy coverage. Longitudinal variations of seed mass among species with a single genus have been discussed (Murray et al., 2003, 2004); however, there are few studies that focus on how community-level variations of seed mass (especially across species) correspond with other plant traits along longitudinal gradients, because of the difficulty to predict variations of comprehensive environmental factors arising from complex topography. In this region average seed mass is expected to decrease with declining longitude due to gradually less rainfall from forests to desert ecosystems (Murray et al., 2003, 2004). Here we present a study of community-level variations in seed mass and their relationship to position in the continent (relative to the sea) across Inner Mongolia and northeastern China, to identify the longitudinal pattern and discuss the mechanisms that may underlie them.
Previous works emphasize the role of high light acquisition and allometric growth (a growth pattern in which different parts of an organism grow at defined rates) in shaping seed mass variation through model prediction and experiment testing (Demalach and Kadmon, 2018; Demalach et al., 2019), and in this article we emphasize the importance of high water availability and allometric growth for speciation and colonization of species with large seeds due to environmental factors and biological traits. Allometry of biomass growth and size-asymmetry of light competition became the drivers of seed mass variation owing to soil resource availability and ultimate productivity heterogeneity along the soil resource gradient (surely including water gradient). As we know, primary production of communities increases across an increasing water gradient (Bai et al., 2008). This article presents a novel mechanistic framework that integrates previous theory and hypotheses (related to climate, phylogeny, water conduction systems and other traits related to water balance) to evaluate seed mass variation among species or communities.
The objectives of this study are to explore seed mass variation patterns of different community types in the region along a longitudinal gradient and seed mass variation mechanisms. First, we test whether community-level seed mass declines from forests to deserts and what drives the patterns by identifying correlations between average seed mass and precipitation and temperature. Second, we test whether species richness and growth form display similar variations to seed mass, because growth forms are the key determinant of seed mass (Moles et al., 2005b). Third, we test whether seed mass variations are significantly associated with growth forms, fruit types and dispersal modes in order to know whether woody species combine larger seeds or fleshy-fruited species. Fourth, we expound whether these patterns can be simply explained by phylogeny, latitude and elevation. Finally, we construct a general hypothesis for seed mass evolution based on our conclusions and previous research results. In addition, like most plant functional traits, seed size and fruit water content are also considered to be related to phylogenetic history (Griffiths and Lawes, 2006; Norden et al., 2012). These traits are often strongly phylogenetically conserved, so phylogenetic distances need to be considered when examining trait variation patterns and their correspondence to environmental variables (Griffiths and Lawes, 2006; Yu et al., 2017). Therefore, we also took into account the effect of phylogenetic signal or diversity on the seed mass distribution patterns in our analysis.
2.1 Study sites and plant community characterization
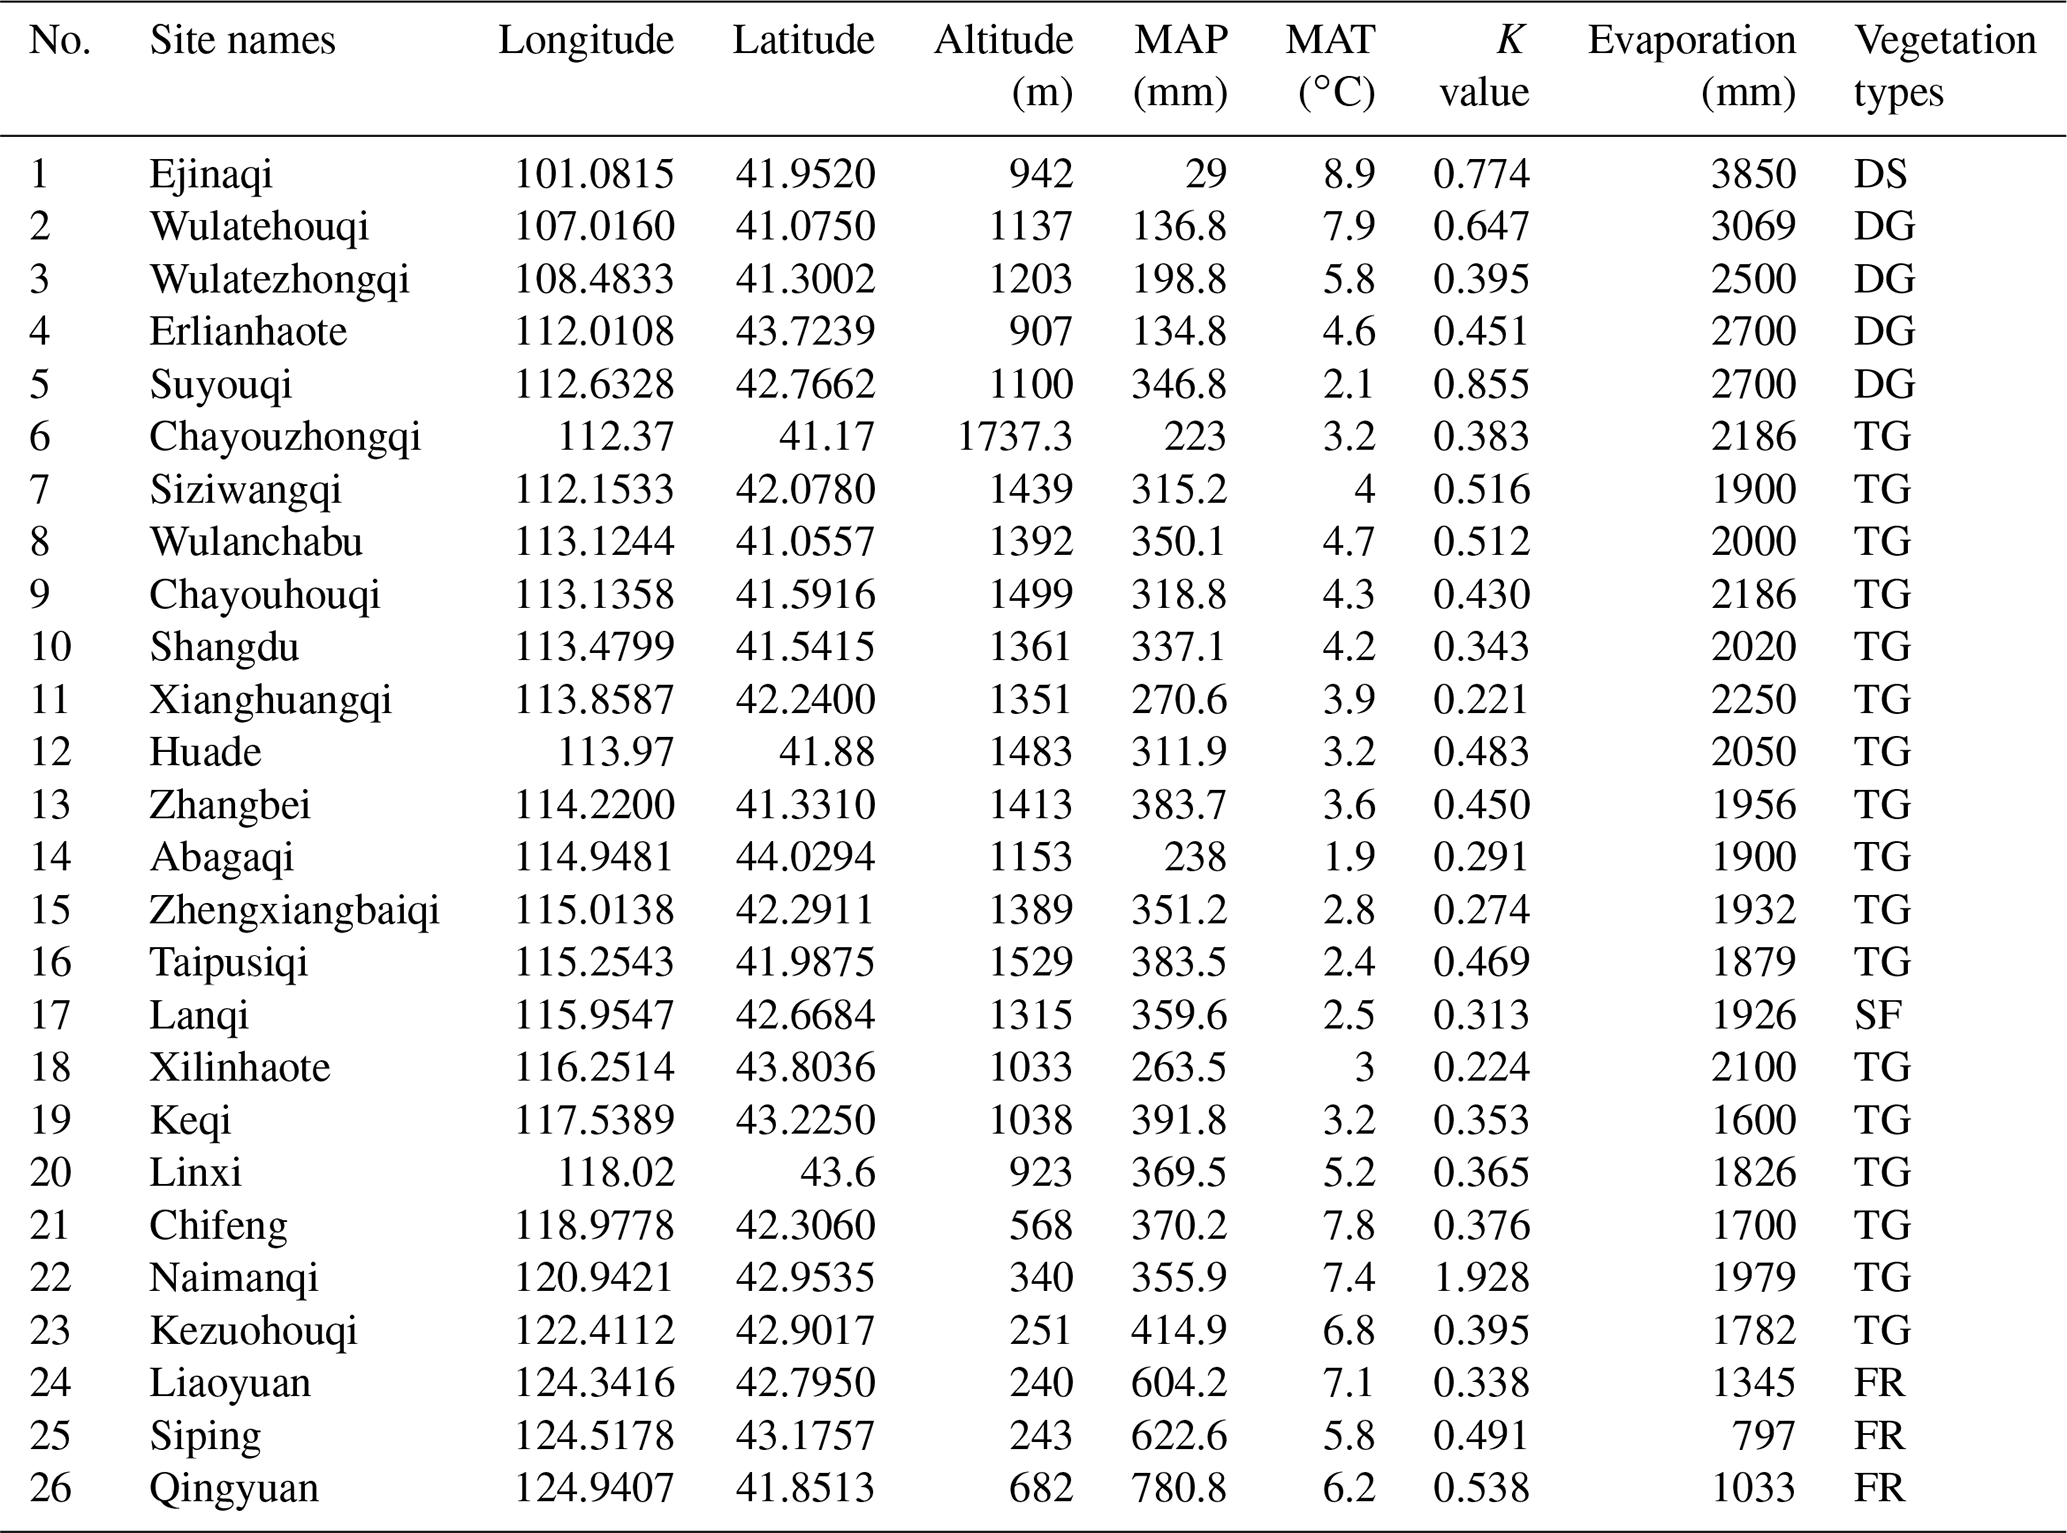
The study area is located in the continental arid Inner Mongolian plateau, where vegetation types shift from broad-leaved deciduous forest to typical grassland and finally to desert (from east to west, respectively), due to a gradual increase in sunshine duration (from 3000 to 3200 h yr−1) and intensity (from 586×104 to 796×104 KJ m−2) and decrease in rainfall (from 780.6 to 29 mm) (Table 1). The study was carried out in 26 sites along this gradient, extending between longitude 100–124∘ E (about 2864 km distance between the westernmost and easternmost sites) and 41–44∘ N in Inner Mongolia and northeastern China (Table 1).
Table 1Information about geographic positions and environmental factors in 26 sampling sites in the Inner Mongolian plateau and northeastern China (MAP: mean annual precipitation, MAT: mean annual temperature, K value: phylogenetic signal values, the small the values, the weak the signals. Vegetation types: deserts (DS), desert grasslands (DG), typical grasslands (TG), sparse forest (SF), forests (FR).
Different sampling designs were used in different habitat types, owing to differences in vegetation structure and density. Within each forest plot, 6 quadrats of 10 × 10 m2 were selected at random in undisturbed or slightly disturbed (at least in recent several years) areas. For shrub communities and herbaceous communities, 3 quadrats of 5 × 5 m2 and at least 8 quadrats 1 × 1 m2 were investigated, respectively. Species composition (species number and number of individuals per species) were recorded. The geographical positions (latitude, longitude and elevation) were measured by wireless GPS logger (HOLUX Technology Inc., Taiwan). Other physiographic factors such as grade of slope, slope aspect and micro-topography were recorded. The vegetation types were determined based on the dominant species and information referenced from the classification system of Chinese vegetation (Editorial Committee for Vegetation of China, 1980). Data of temperature and precipitation as well as other climatic factors were retrieved from the WorldClim database (http://www.worldclim.org/ version1.4, last access: 8 July 2017) using the R raster package (R Core Team, 2018): average values per site were obtained from interpolations of observed data during the period between 1950 and 2000. Two climatic variables, mean annual temperature (MAT) and mean annual precipitation (MAP), were used to analyze the relationship between seed mass and the climate along the geographical gradient (Table 1).
2.2 Seed collection and characterization
Mature seeds were collected for each species observed in each site at the start of the natural dispersal season (from June to October) during the years 2008–2014. Seeds of each species were collected from at least three mother individuals in the same stand and mixed together to avoid bias caused by maternal effects. Seeds were allowed to air-dry to a constant mass in the laboratory before being weighed. For each plant species, seed mass was calculated as the average values of 5 to 100 (even to 1000) seeds, depending on seed size and availability, and at least three repeated measurements were conducted for each species. Seed mass was measured to microgram precision on a PB303 balance (Mettler, Toledo). Seeds that were likely to be inviable (unusually small seeds that contained abnormal looking embryos or that appeared hollow) were subjectively excluded before the measurement. For some species with caryopses, achenes and utricles, the dry mass of entire propagules was weighed. Structures such as delicate wings and pappus (or hairs) strictly associated with wind dispersal were removed and the spine was retained before weighing the seeds.
Dispersal modes were assigned for all 622 species, based on ornamentation and appendages on fruits and seeds. The dispersal modes of each species were confirmed by referring to Kew Gardens data (Howe and Smallwood, 1982) and literature collections from northwestern China (Liu et al., 2014). For some species, dispersal modes were confirmed with empirical analysis according to morphological features of their diaspores, and the dispersal modes represent how seeds move from the parent plant to the soil surface. Each species was treated as having a single dispersal mode, reflecting their principal dispersal agents (PDAs) (Leishman and Westoby 1994; Butler et al., 2007): wind-adapted (279 species, with wings, hairs or a pappus), vertebrate-adapted (66 species, with an aril or fleshy fruits), ant-adapted (195 species, with an elaiosome), unassisted (70 species, no obvious morphological structure) and adhesion-adapted (12 species, with hooks, spines or bards).
2.3 Fruit types and other plant traits
Fruits were classified as fleshy if they were described in the flora as berries, drupes, pomes, rose hips, multiple fruits and pepos or as possessing fleshy pericarps or succulent tissue in general (including arils) (Yu et al., 2017). Accordingly, capsules, achenes, nuts, caryopses, legumes, follicles, pods, cremocarps, utricles, samaras and schizocarps were classified as non-fleshy (dry) fruits. Some species (e.g., Vitex nengudo var. heterophylla) that were described as fleshy-fruited in related local flora were reclassified as dry-fruited owing to very low water content.
Species life-history information is drawn primarily from the Flora of China (Editorial Committee of Chinese Flora, 2004) and based on our yearly field observations. Species in the flora were grouped into the following five major growth-form categories: trees (12 species), shrubs (65 species), subshrubs (20 species), lianas (15 species), perennials (400 species) and annuals (110 species).
2.4 Soil moisture measurement
The soil moisture of the top 10 cm was measured gravimetrically by oven-drying the samples at 105 ∘C for 24 h in 12 sites of typical grasslands and desert grasslands. Five soil samples were collected from each site on 10–17 July 2014, 21 d after rainfall.
2.5 Data analysis
Seed mass, longitude and precipitation were log-transformed before analysis to meet the normality and homoscedasticity assumptions of linear regression models. In order to ensure that any observed seed mass variation along the longitudinal gradient is independent of latitude and elevation, general linear models (GLMs) were employed. Seed mass and other plant traits were treated as the dependent variable in all analyses with latitude, longitude and climatic variables entered into models as independent variables.
The proportions and species richness of plants with various seed mass and fruit types in different communities were compared using analysis of variance (ANOVA). ANOVA was also used to compare average seed mass between different growth forms, different community types, different fruit types and dispersal types. The GLM procedure was used to examine the explanatory power of community types, dispersal types, longitude, precipitation and temperature on seed mass. All analyses were performed with R-3.3.3 (R Core Team, 2018). By use of the function commonality in the R package “yhat” (Nimon et al., 2013), we take the log-transformed seed size as a dependent variable and life forms, vegetation types and dispersal modes as independent variables with latitude, exploring the predictive power of each variable.
For the 620 species (two gymnosperm species were excluded owing to their low relatedness with most of angiosperm species), a supertree was constructed using the software Phylomatic (Webb et al., 2008). The phylogenetic backbone was based on the APG III tree (R20120829, http://phylodiversity.net/phylomatic/, last access: 10 July 2017). We quantified the strength of phylogenetic conservatism and tested the phylogenetic signal in seed mass using Pagel's λ (Pagel, 1999) and Blomberg's K (Blomberg et al., 2003) calculated using the “phylosig” function in the package “phytools” v0.2-1 (R Foundation, Vienna, Austria) (Revell et al., 2008). A λ or K of 0 indicates no phylogenetic signal (Pagel, 1999; Panchen et al., 2015). Regression analyses were conducted between phylogenetic signal and longitude across the sites in five community types. Using the phylogenetic tree with branch length, we calculated the phylogenetic diversity using the measure PD, which was defined as the minimum total length of all the phylogenetic branches required to span a given set of taxa on the phylogenetic tree (Faith, 1992). Taking mean seed mass as a dependent variable and longitude (including both linear and quadratic terms) and the phylogenetic diversity measure PD as independent variables, we built a linear model using R package stats (R Core Team, 2018).
We considered the relations between the number of species with fleshy fruits and longitude, the number of families, number of genera and the phylogenetic diversity PD. Since there are strong correlations between the latter four variables (r>0.67, p<0.001), they cannot be used in the same model. Therefore, we built four models. Each took one of the four variables as the independent variable and the number of species with fleshy fruits as a dependent variable. A generalized linear regression model with the Poisson family was fitted using R package stats (R Core Team, 2018). In the model, we also included the log (number of species) as offset.
3.1 Seed mass variations along the longitudinal gradient
Although the majority of species had medium-sized seeds (Fig. 1), variations among all species were great. There were considerable differences in average seed mass and seed spectra among the five biome types (Fig. 1). Forests have the largest average seed mass (23.45±18.34 mg), and both typical grasslands (4.75±3.93 mg) and sparse forests (4.45 ± 1.18 mg) have the lowest average seed mass. The average seed mass of forests is significantly greater than that of the sparse forests (F=12.13, p=0.0253), and deserts are remarkably larger (20.12±8.26 mg) than desert grasslands (10.08 ± 2.34 mg) (F=6.914, p=0.0466), with nearly 4.2 times smaller average seed mass from deserts to typical grasslands. The average seed mass of typical grasslands is significantly smaller than that of desert grasslands (F=11.92, p=0.0025), while there is no significant difference between average seed mass of typical grasslands and sparse grasslands (F=0.019, p=0.892).
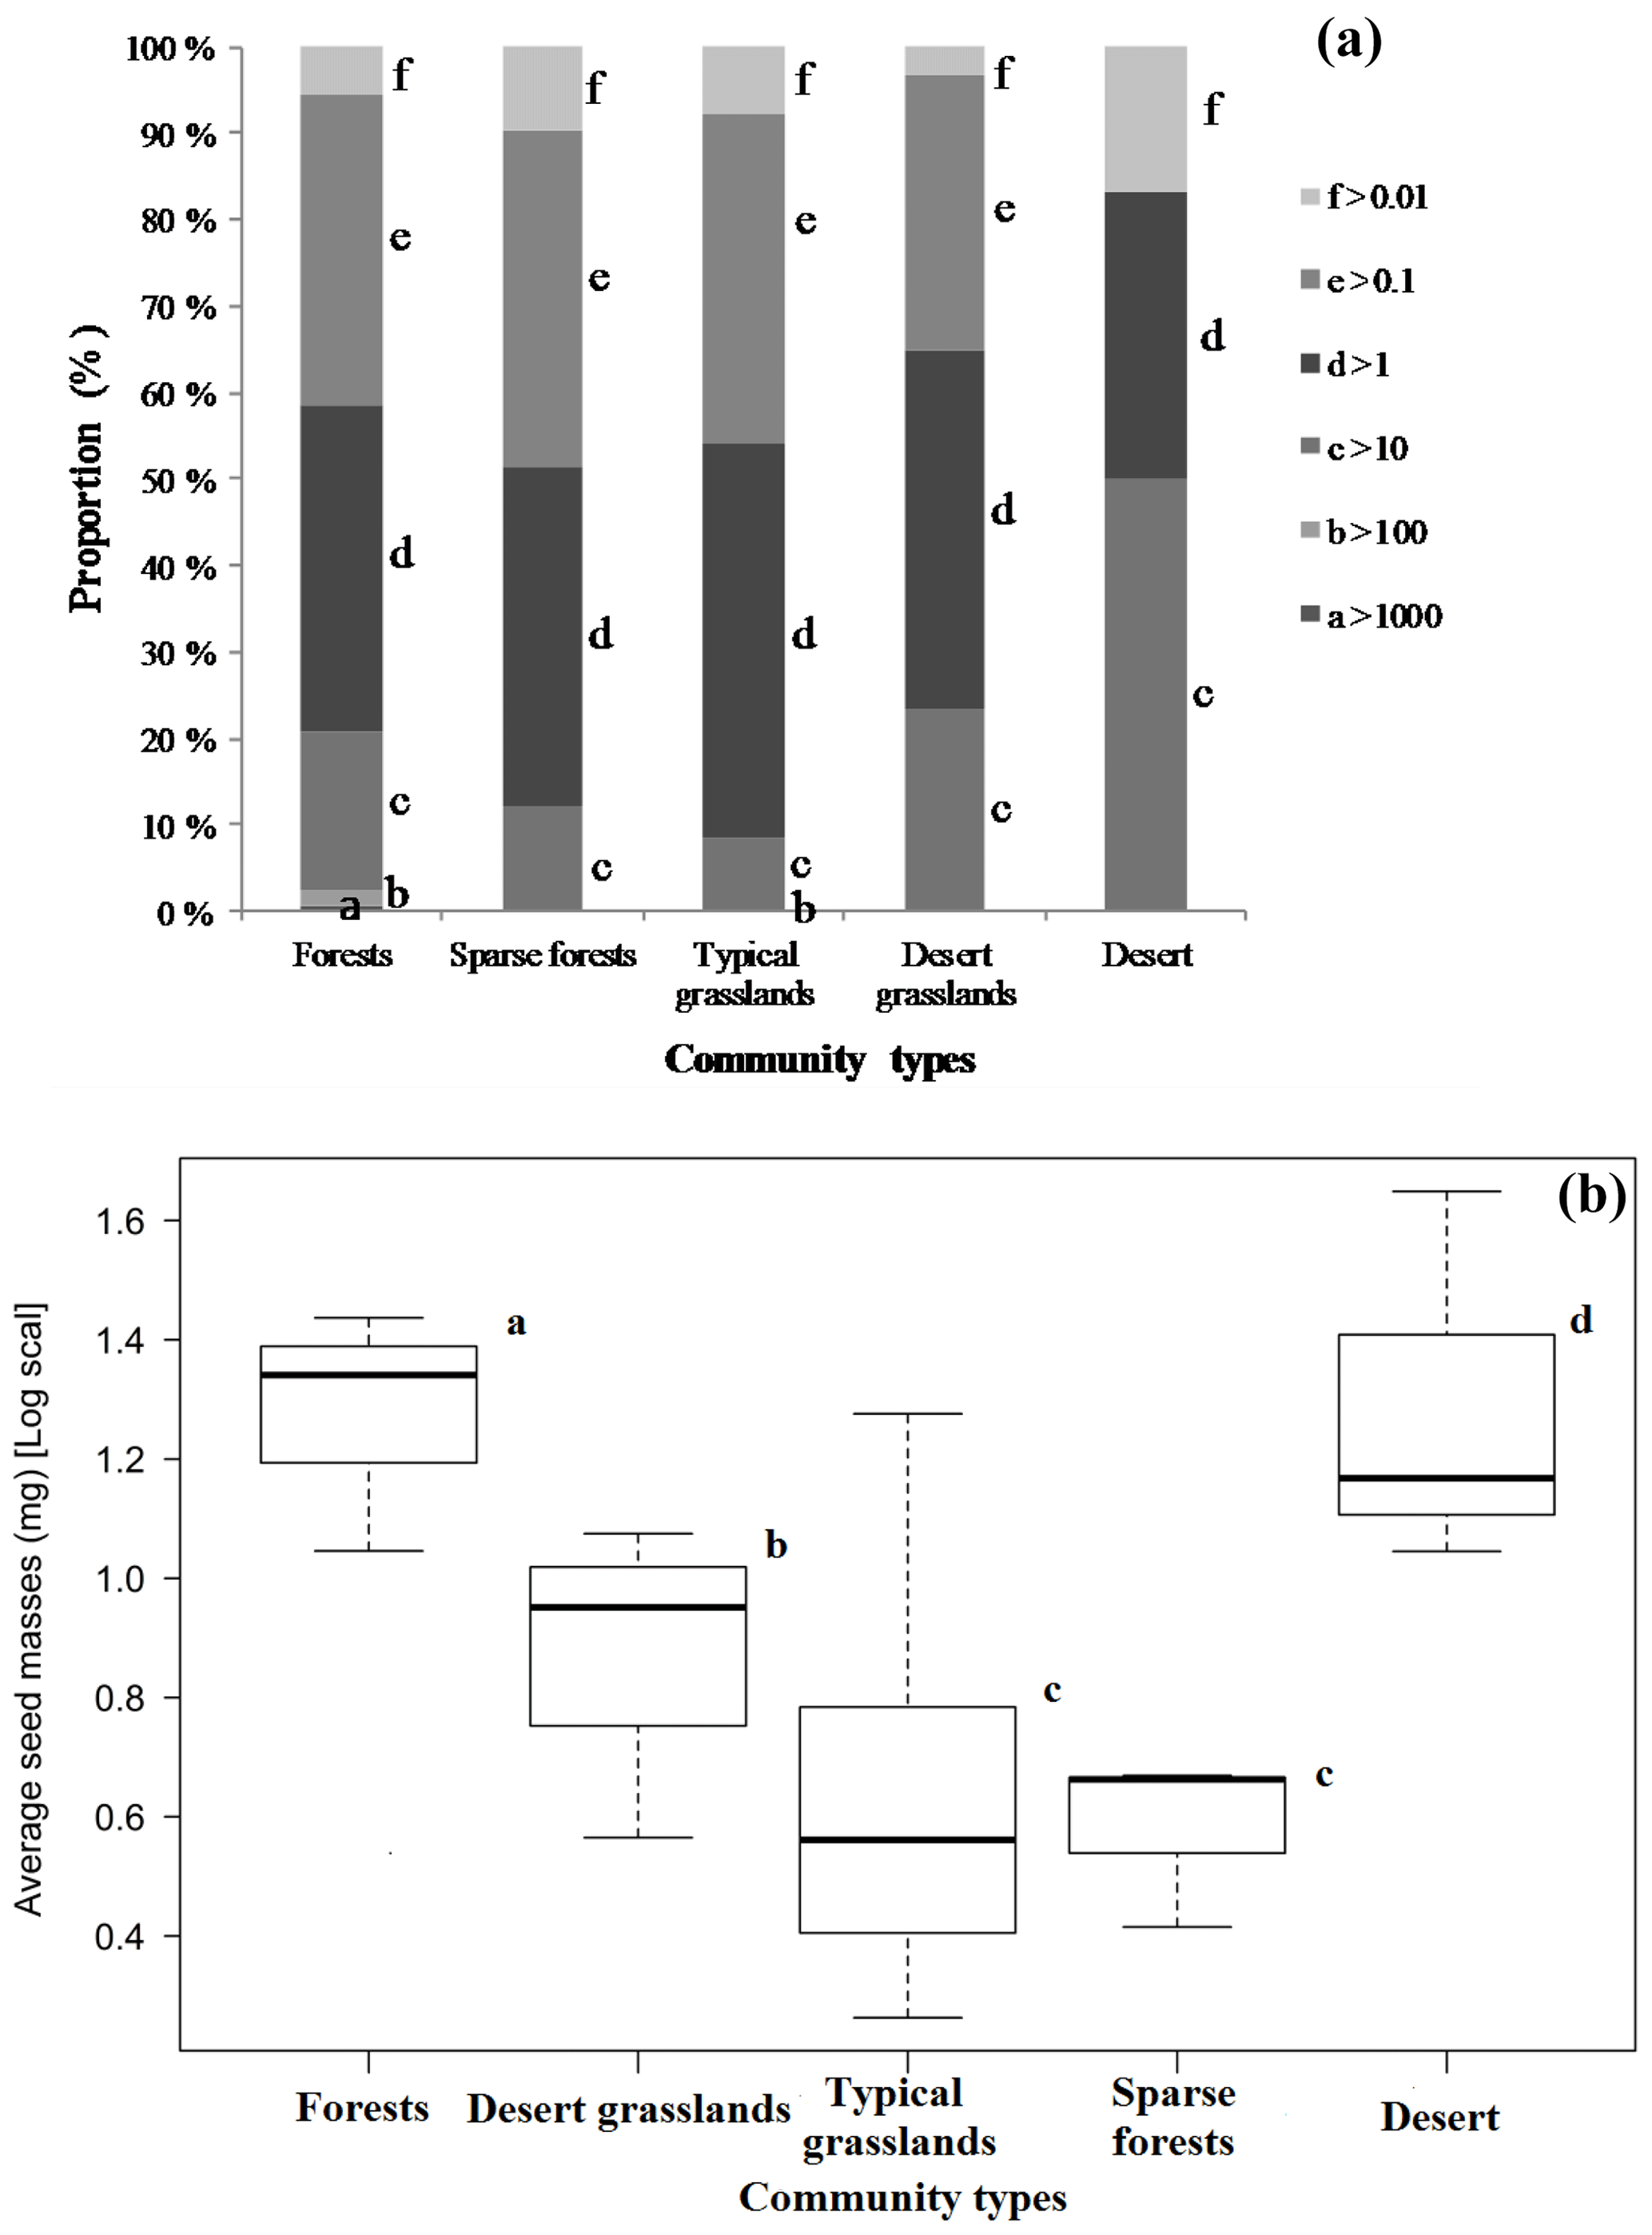
Figure 1Seed mass spectra vary among five community types in Inner Mongolia (a), and proportions of larger seeds (a) and average seed mass (b) decline from forests to desert grasslands but increase in deserts (average seed masses bearing the same letters are insignificantly different at p>0.05).
3.2 Variation of species richness, growth form spectra and abundance along the longitudinal gradient
There are declining trends for herbaceous species richness and canopy coverage from forests to desert along decreasing longitudinal gradient in this region (Table 2). Typical steppe was found to have the lowest woody species richness and highest herbaceous abundance in five community types (Table 2).
Table 2Species richness (no. per sample area) or percentages for woody plants and herbs (%) as well as abundance (individual m−2) and canopy coverage (%) in five ecosystem types.

3.3 Seed mass relations to growth forms, seed dispersers and fruit types
The average seed mass of trees was significantly larger than that of shrubs (F=12.2, p=0.000), shrubs had larger seeds than perennials (F=59.57, p=0.000), and the average seed mass of perennials was larger than that of annuals (F=4.932, p=0.0268; Fig. 2).
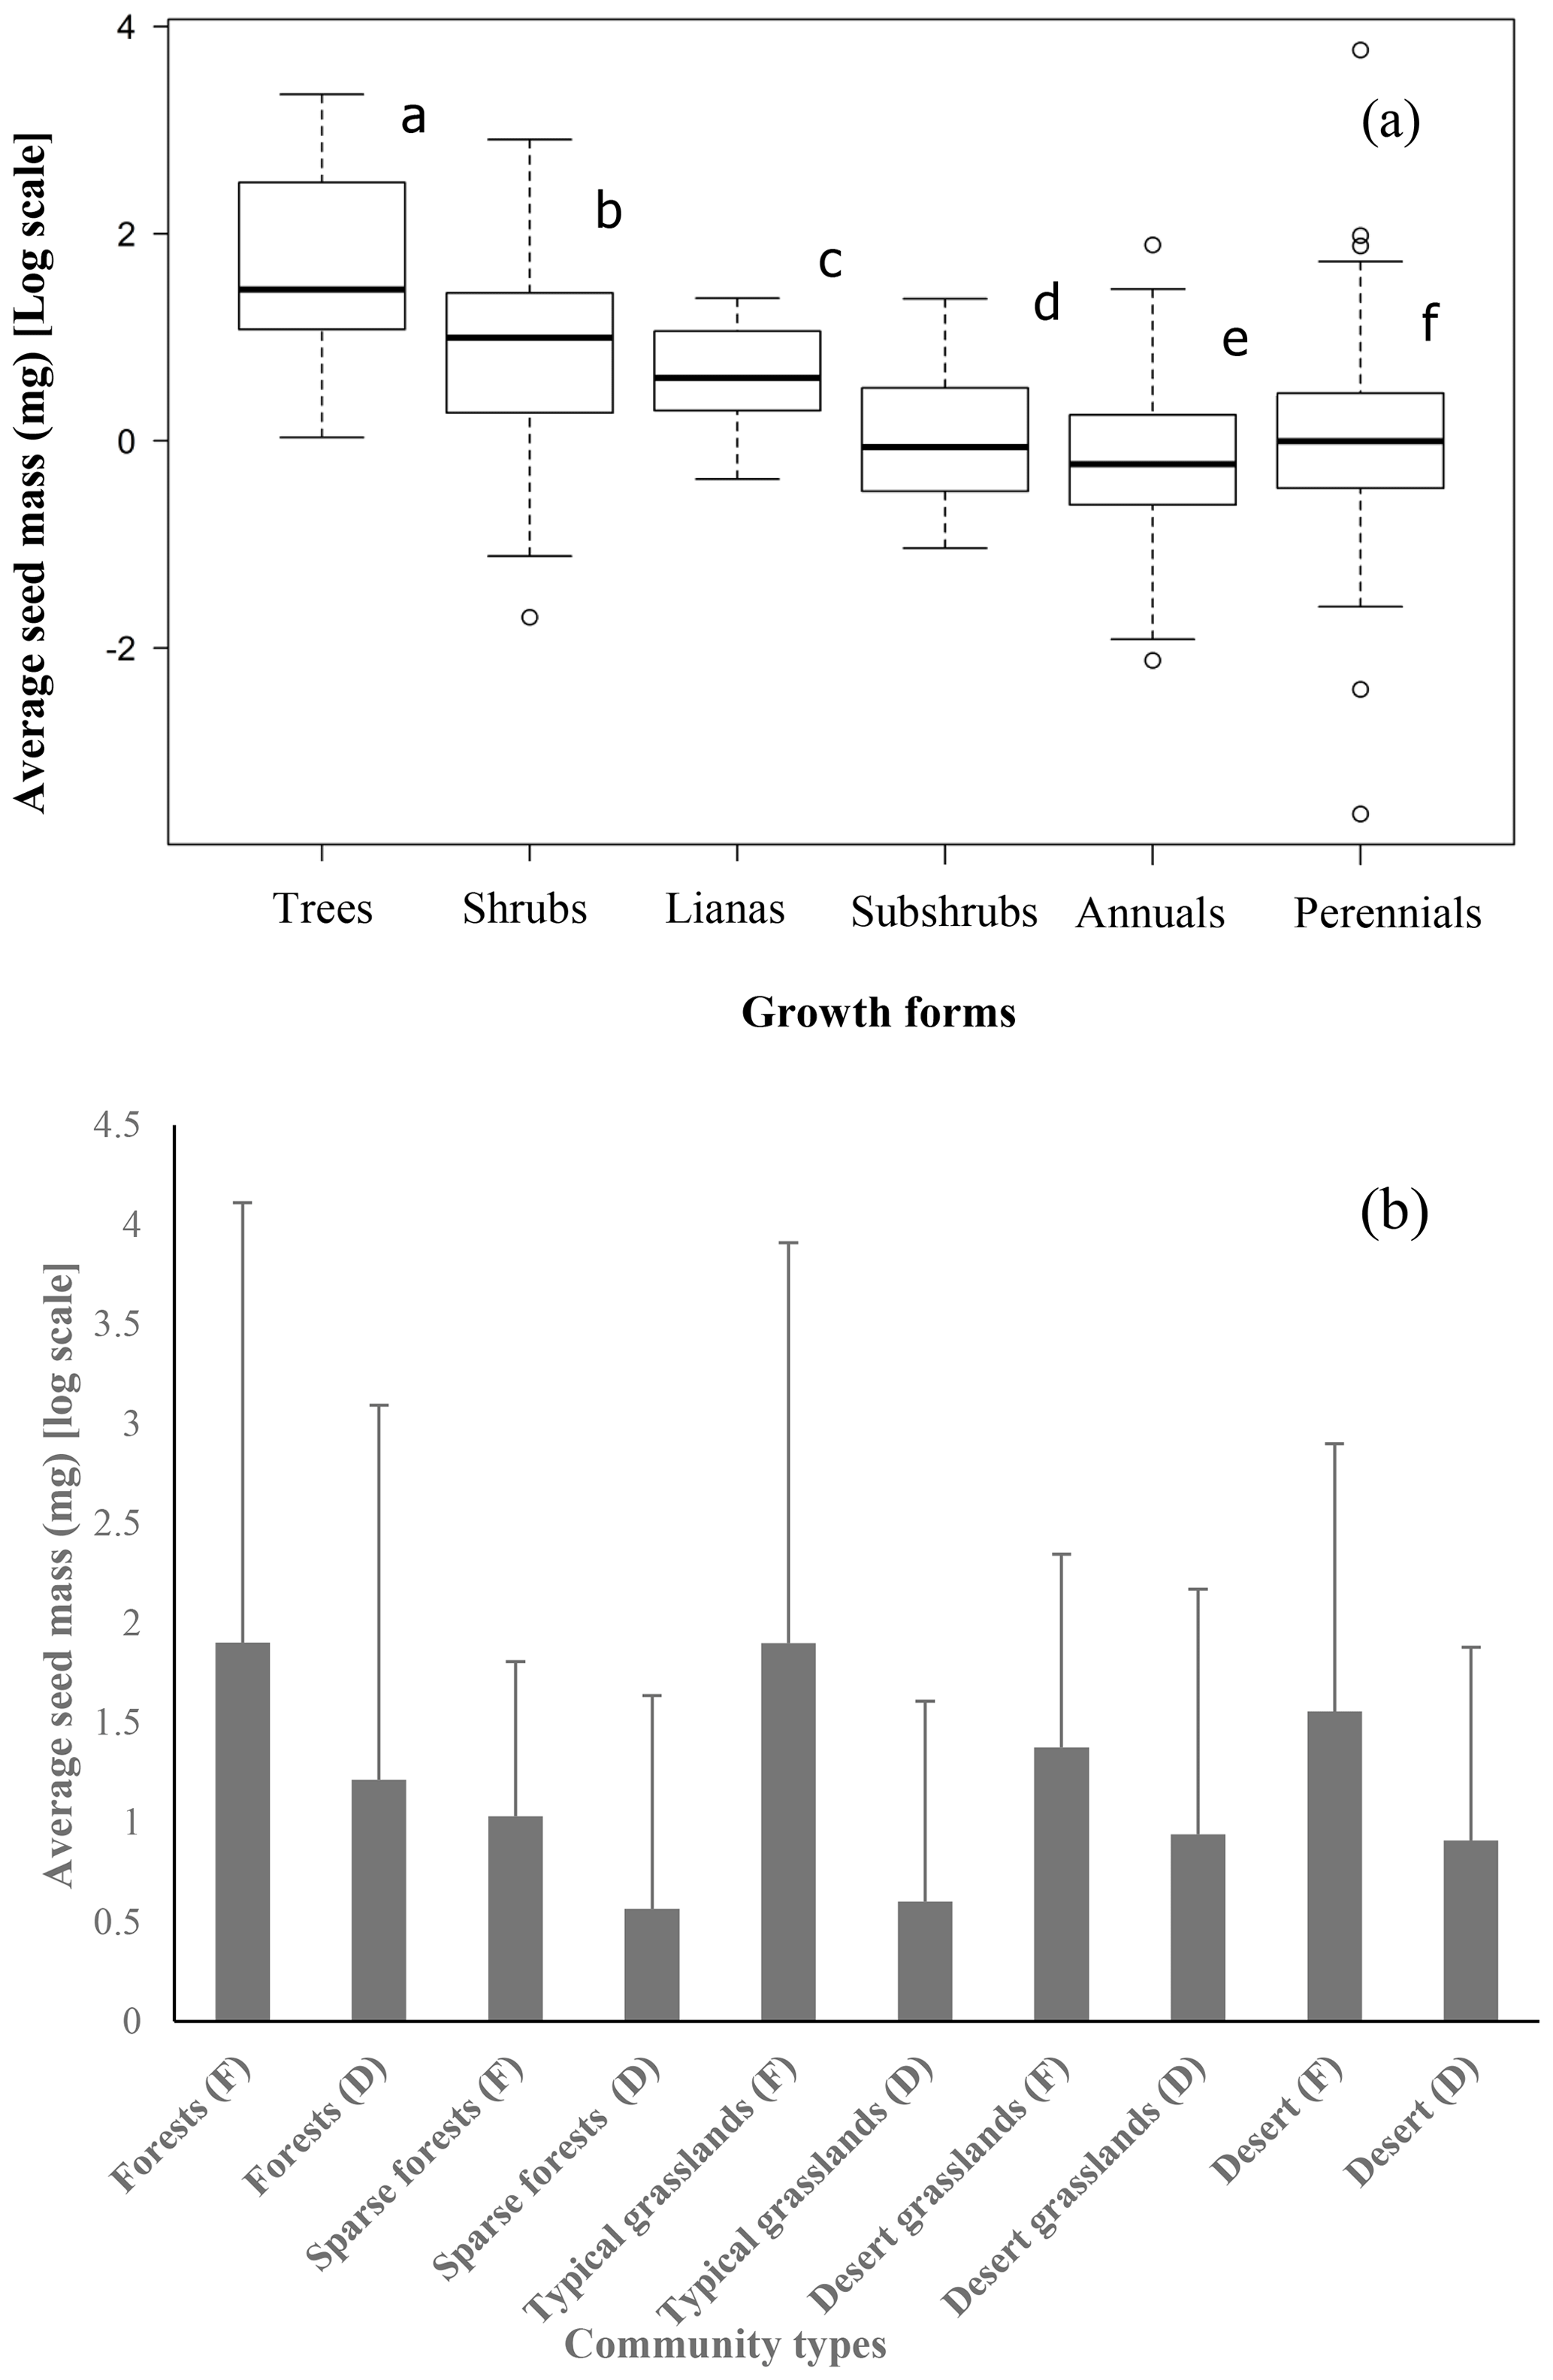
Figure 2Trees (12 species) have the largest average seed mass, followed by shrubs (65 species), lianas (15 species), subshrubs (20 species), perennial herbs (396 species) and annuals (110 species) (a) (average seed mass bearing different letters are significantly different at p<0.05). The average seed mass of fleshy fruits is larger than that of dry fruits in each community type (b) (F: fleshy fruits, D: dry fruits).
Seeds that are dispersed by vertebrates (232.09 ± 823.98 mg) were significantly larger than those dispersed by wind (2.46 ± 6.23 mg) (F=238.2, p<0.0001) and ants (3.56 ± 10.03 mg) (F=17.73, p<0.0001) and those with unassisted dispersal (7.42 ± 12.08 mg, F=17.73, p=0.000) and adhesive dispersal (5.07 ± 8.12 mg, F=17.73, p<0.0001; Table 3).
Table 3Seed mass, species number and proportions of five dispersal types in the whole study area.

The average seed mass of species with fleshy fruits (40.15 ± 110.41 mg) was significantly greater than that of species with dry fruits (26.58 ± 286.97 mg) for the whole 622 species pool (F=18.61, p=0.0125), for the five community types (Table S1 in the Supplement; Fig. 2) and for each site (Table S2; Fig. 2).
Seed mass is weakly negatively correlated with leaf area (R2=0.063, p=0.005) and not significantly correlated with SLA across all sampled species (R2=0.006, p=0.195). SLA is significantly related with leaf area (R2=0.160, p<0.001).
3.4 Seed mass relations to environmental variables
Average seed mass was minimum at approximately 114∘ longitude where typical grasslands occur (Fig. 3). However, phylogenetic diversity (PD) was not a significantly explanatory variable (p>0.8) (Fig. 3). Linear regression model shows that there is no significant decreasing trend from forests to deserts along declining longitude (F=2.289, p=0.143) in this region. If the westernmost sample site (Ejinaqi) is excluded, seed mass significantly decreases inland (R2=0.2434, F=7.398, p=0.012).
Significant negative relationships were found between seed mass and MAT (R2=0.1752, p=0.01915) and elevation (R2=0.1221, p=0.0449) across all sample sites, but no significant relationships were found between seed mass and latitude (, p=0.576) and MAP (, p=0.380). Across 23 sample sites from desert through desert grassland to typical grassland, average seed mass had a significantly negative relationship with longitude (R2=0.232, p=0.012) and MAP (R2=0.48, p=0.00015), while across 20 sample sites from typical steppe to forests average seed mass had a significantly positive relationship with longitude (R2=0.232, p=0.012) and MAP (R2=0.48, p=0.00015). The average seed mass was found to just have a weakly positive relationship with MAT both from desert through desert grassland to typical grassland and from typical grassland to the forests (R2=0.09207, p=0.08665). According to the above analysis, MAP should be a crucial environmental drive factor for seed mass variation.
In addition, average seed mass is significantly related with soil moisture (R2=0.8259, p=0.0017), and soil moisture significantly decreases with declining longitude from typical to desert grasslands (R2=0.6019, p=0.0018).
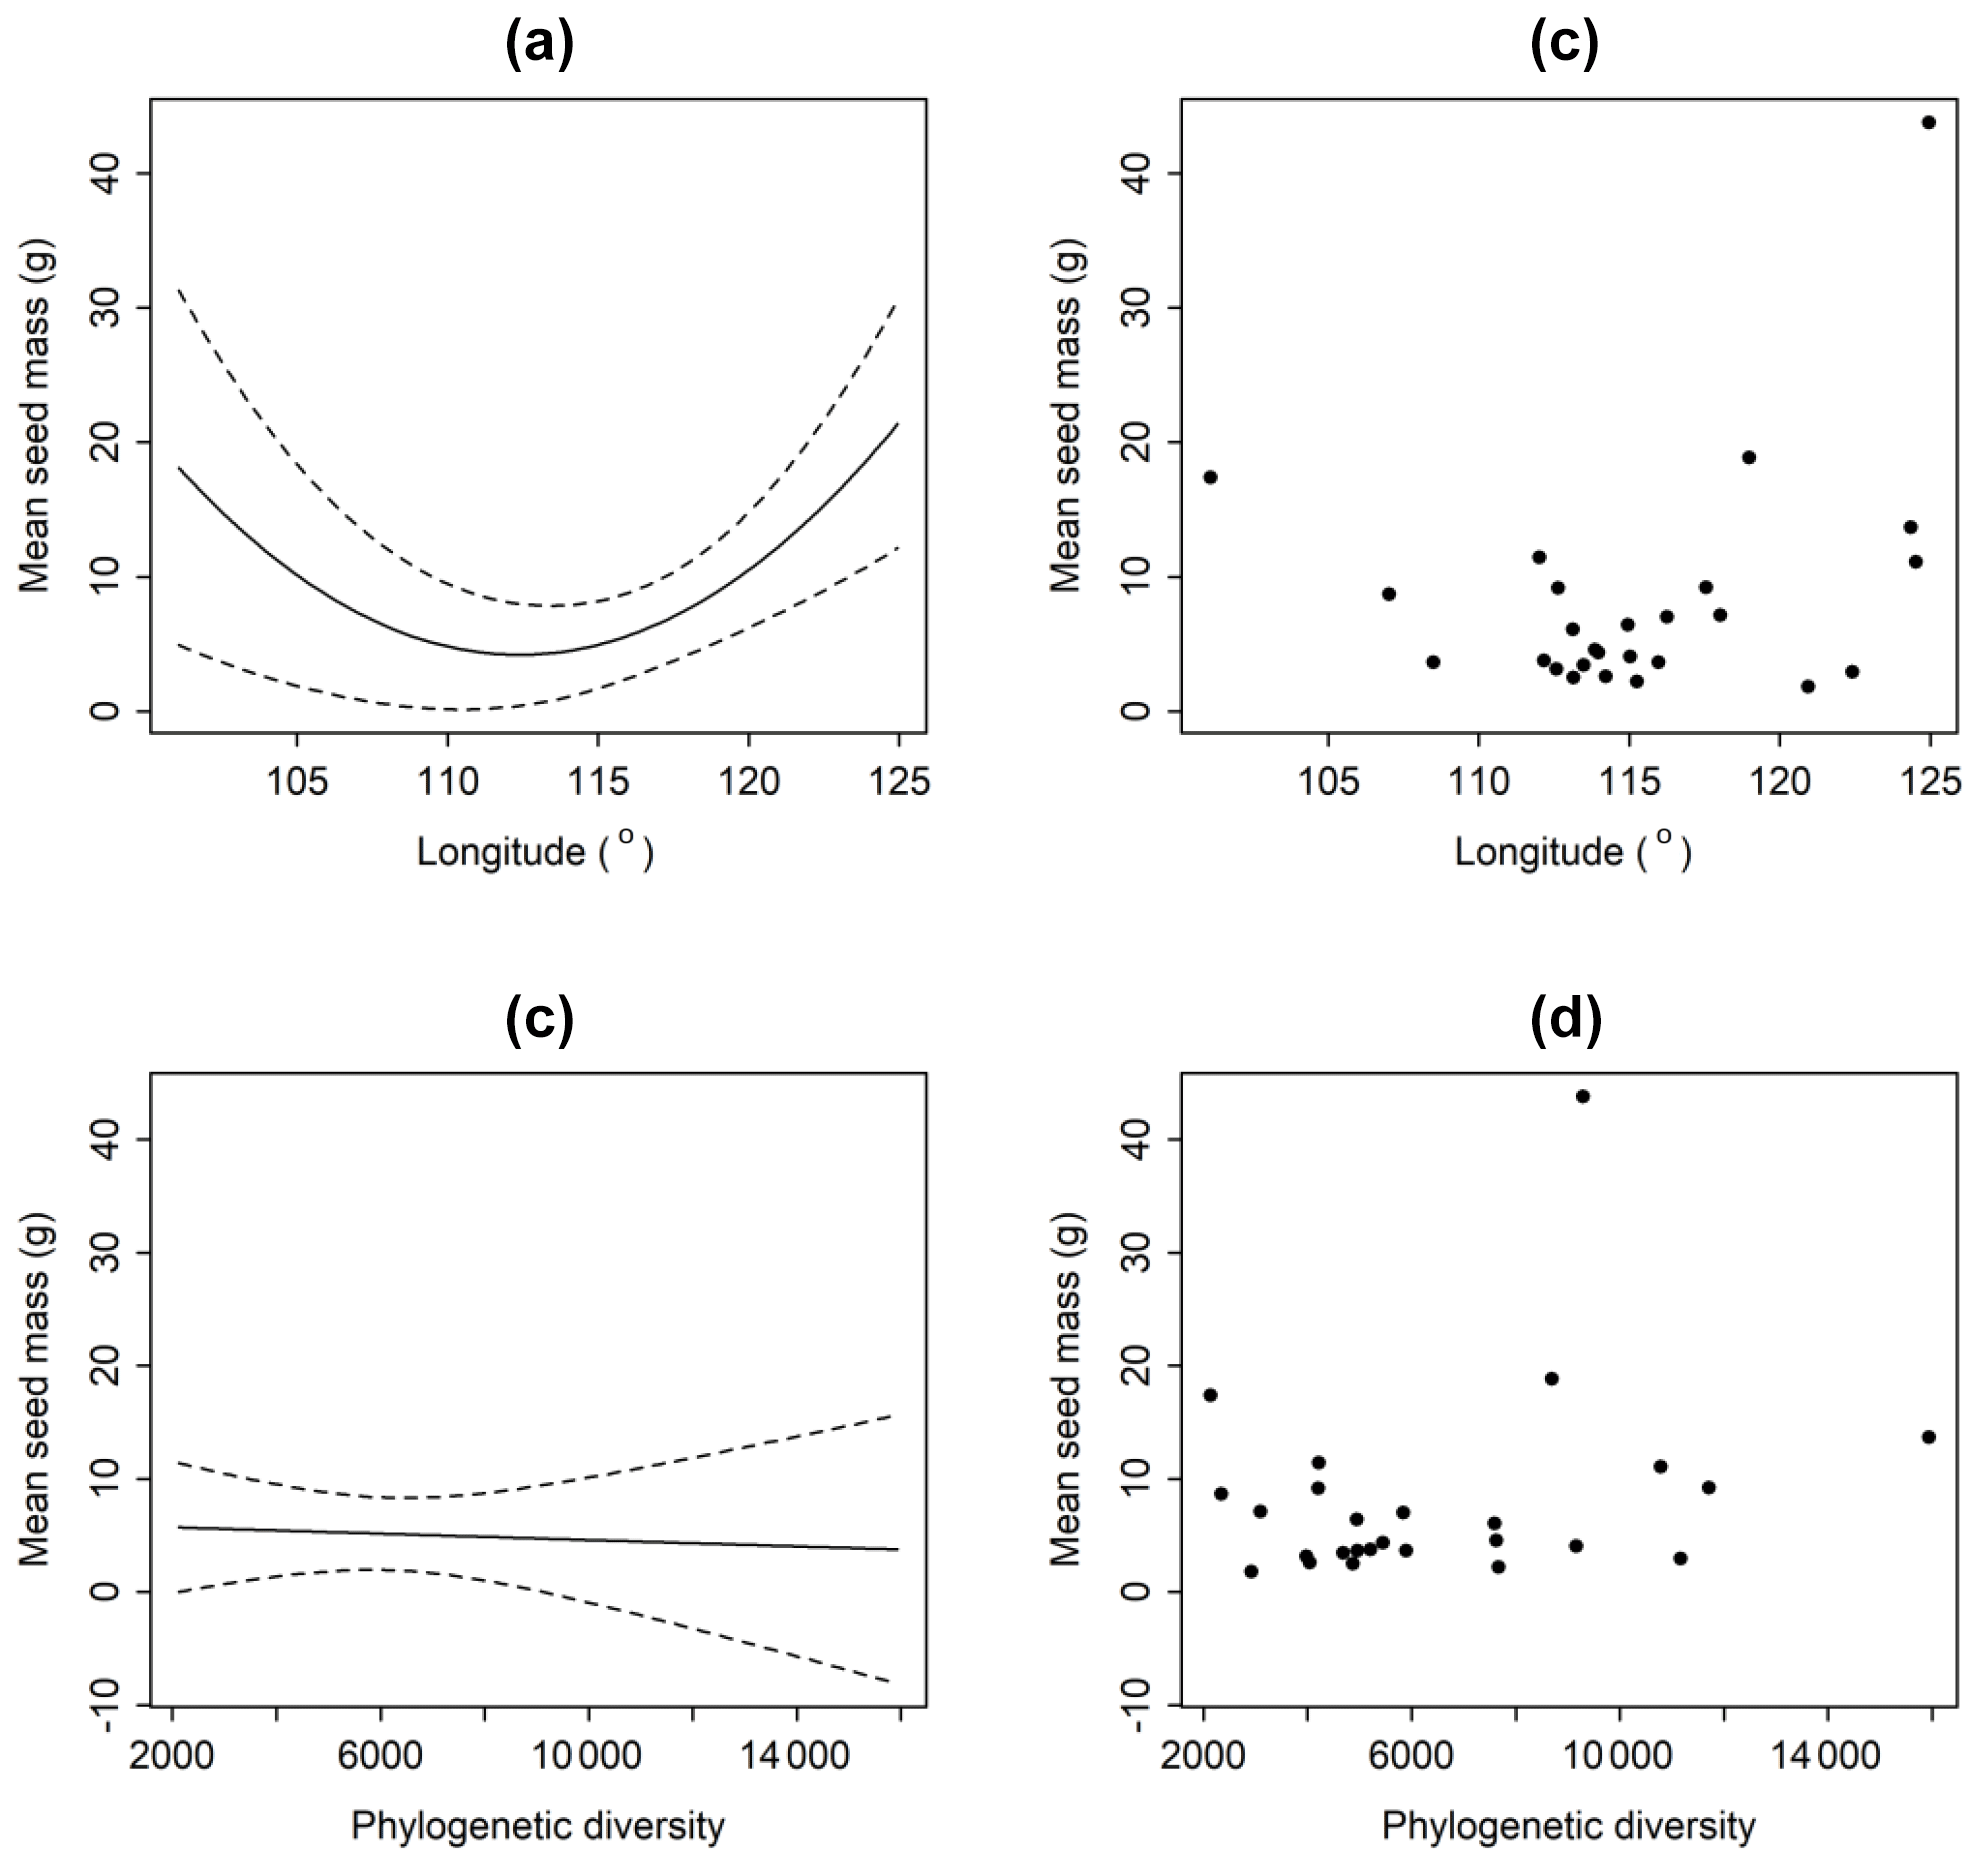
Figure 3Relationships between average seed mass of communities and longitude (a, b) and phylogenetic diversity (c, d). The average seed mass declines as longitude rises, and it reaches its bottom at around 114∘, after which that it increases. But average seed mass does not have a significant relationship with phylogenetic diversity (p>0.05).
3.5 Species richness and proportion of fleshy-fruited species
Among the five community types, forests have the highest number (7.44±1.26) and proportion (28.05 ± 6.16) of fleshy-fruited species, while desert grasslands have the lowest number (0.06 ± 0.097) and typical grasslands have the lowest proportion (1.00 ± 1.49) (Fig. 4). Fleshy-fruited species richness (F=22.25 p=0.00919) and proportion (F=18.61, p=0.0125) in sparse forests are significantly smaller than those in forests. The desert has higher fleshy-fruited species richness (F=6.081, p=0.0239) and proportion (F=24.9, p<0.0001) than desert grasslands. Sparse forests have remarkably higher fleshy-fruited species richness (F=281.3, p=0.000) and proportion (F=78.6, p=0.0009) than typical grasslands (Fig. 4).
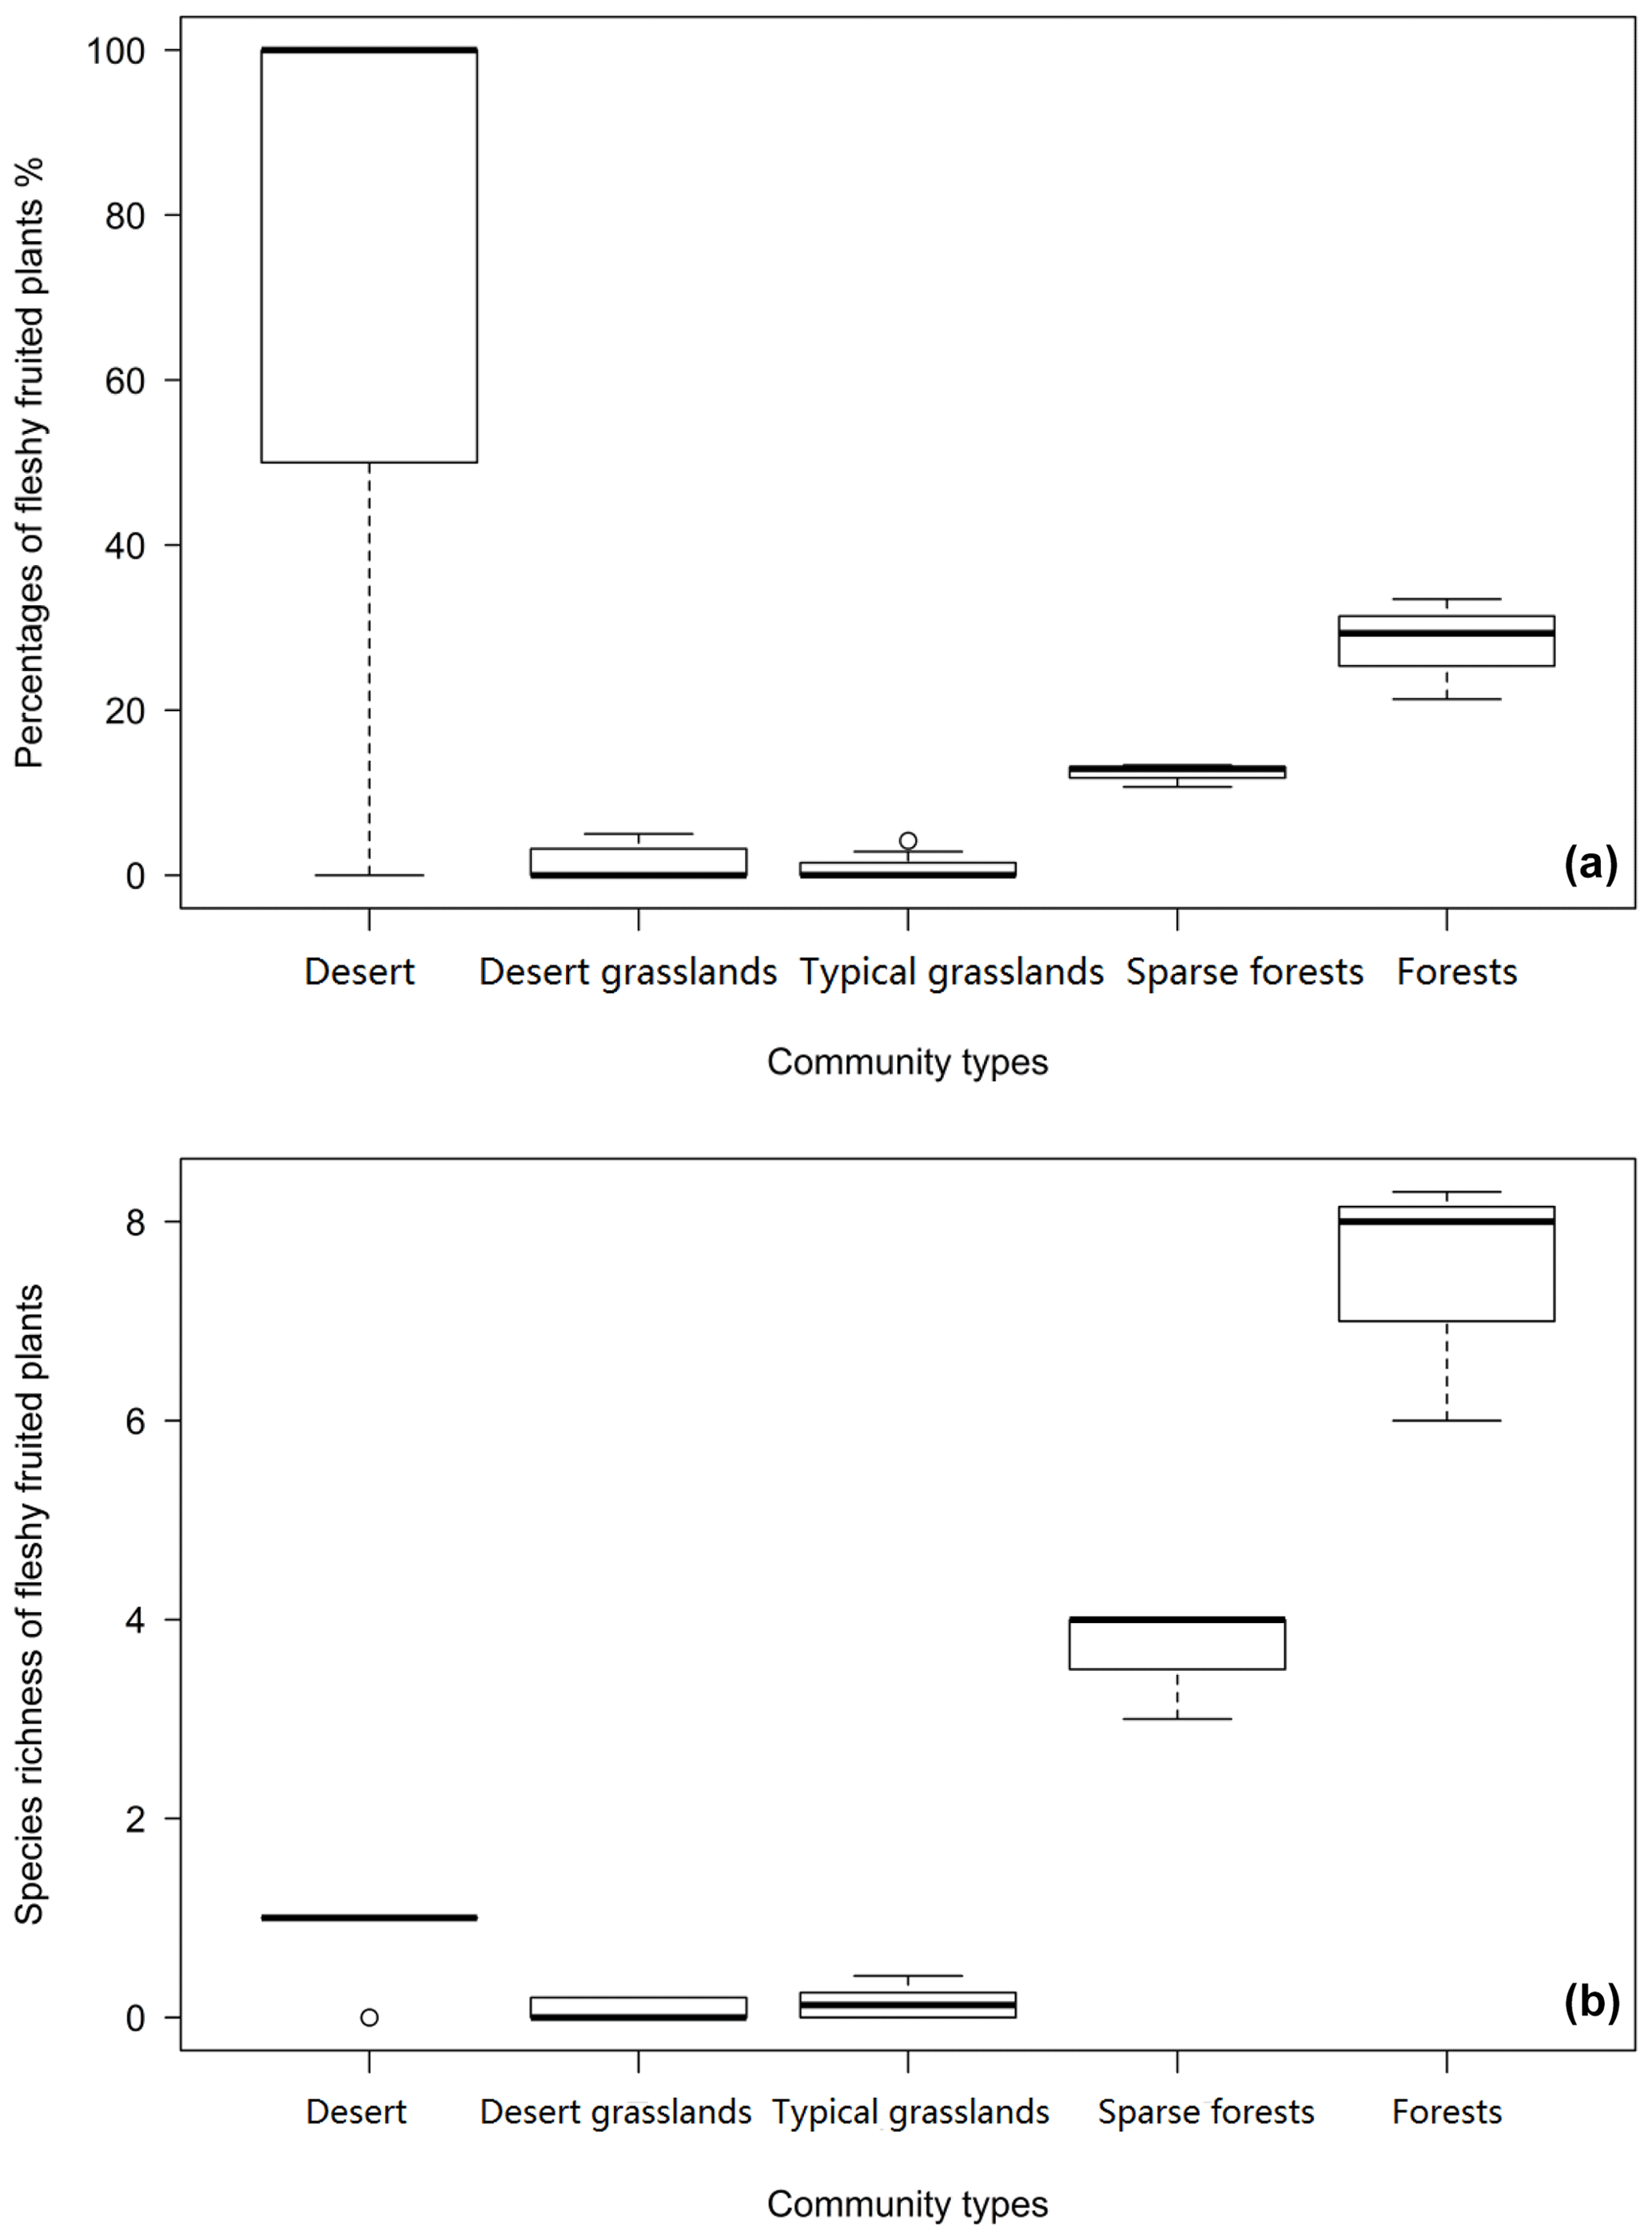
Figure 4Proportions (a) and species richness (b) of plants with fleshy fruits decline gradually from forests through sparse forests to (typical and desert) grasslands but increase in deserts (the same letter indicates difference is insignificant at p>0.05).
3.6 Fleshy-fruited species relations to environmental factors
Fleshy-fruited species richness was significantly associated with longitude (R2=0.1691, p=0.02113) and MAP (R2=0.4749, p=0.0000) across the 26 sample sites. Significantly positive correlation existed between the proportions of species with fleshy fruits and MAT (R2=0.1172, p=0.0486), while the correlation with elevation (R2=0.0938, p=0.0703) and longitude (R2=0.0831, p=0.0832) was weak. In addition, there were no significant relationships between proportions of fleshy-fruited species and latitude (, p=0.8272) as well as MAP (, p=0.8009), and no strong relationships between fleshy-fruited species richness and latitude (R2=0.0408, p=0.8899) as well as MAT (R2=0.0414, p=0.9416).
From desert through desert grassland to typical grassland, significantly positive correlations were found between richness of fleshy-fruited species and longitude (R=0.3466, p=0.0019) and MAP (R2=0.284, p=0.0052), while there were no significant correlations between the proportion of fleshy-fruited species and MAT (R2=0.1295, p=0.0513). From typical grassland to the forests, remarkable correlations occurred between the proportion of fleshy-fruited species and longitude (R2=0.324, p=0.00418) and MAP (R2=0.324, p=0.00418); however, no significant relationships were found between MAT and proportion (, p=0.9065) and species richness (, p=0.93) of fleshy-fruited plants. The number of species with fleshy fruits increased with longitude (p=0.022) and the number of families (p=0.005; Fig. 5a–b), but correlations with number of genera and phylogenetic diversity were not significant (p=0.056 and 0.058, respectively; Fig. 5c–d).
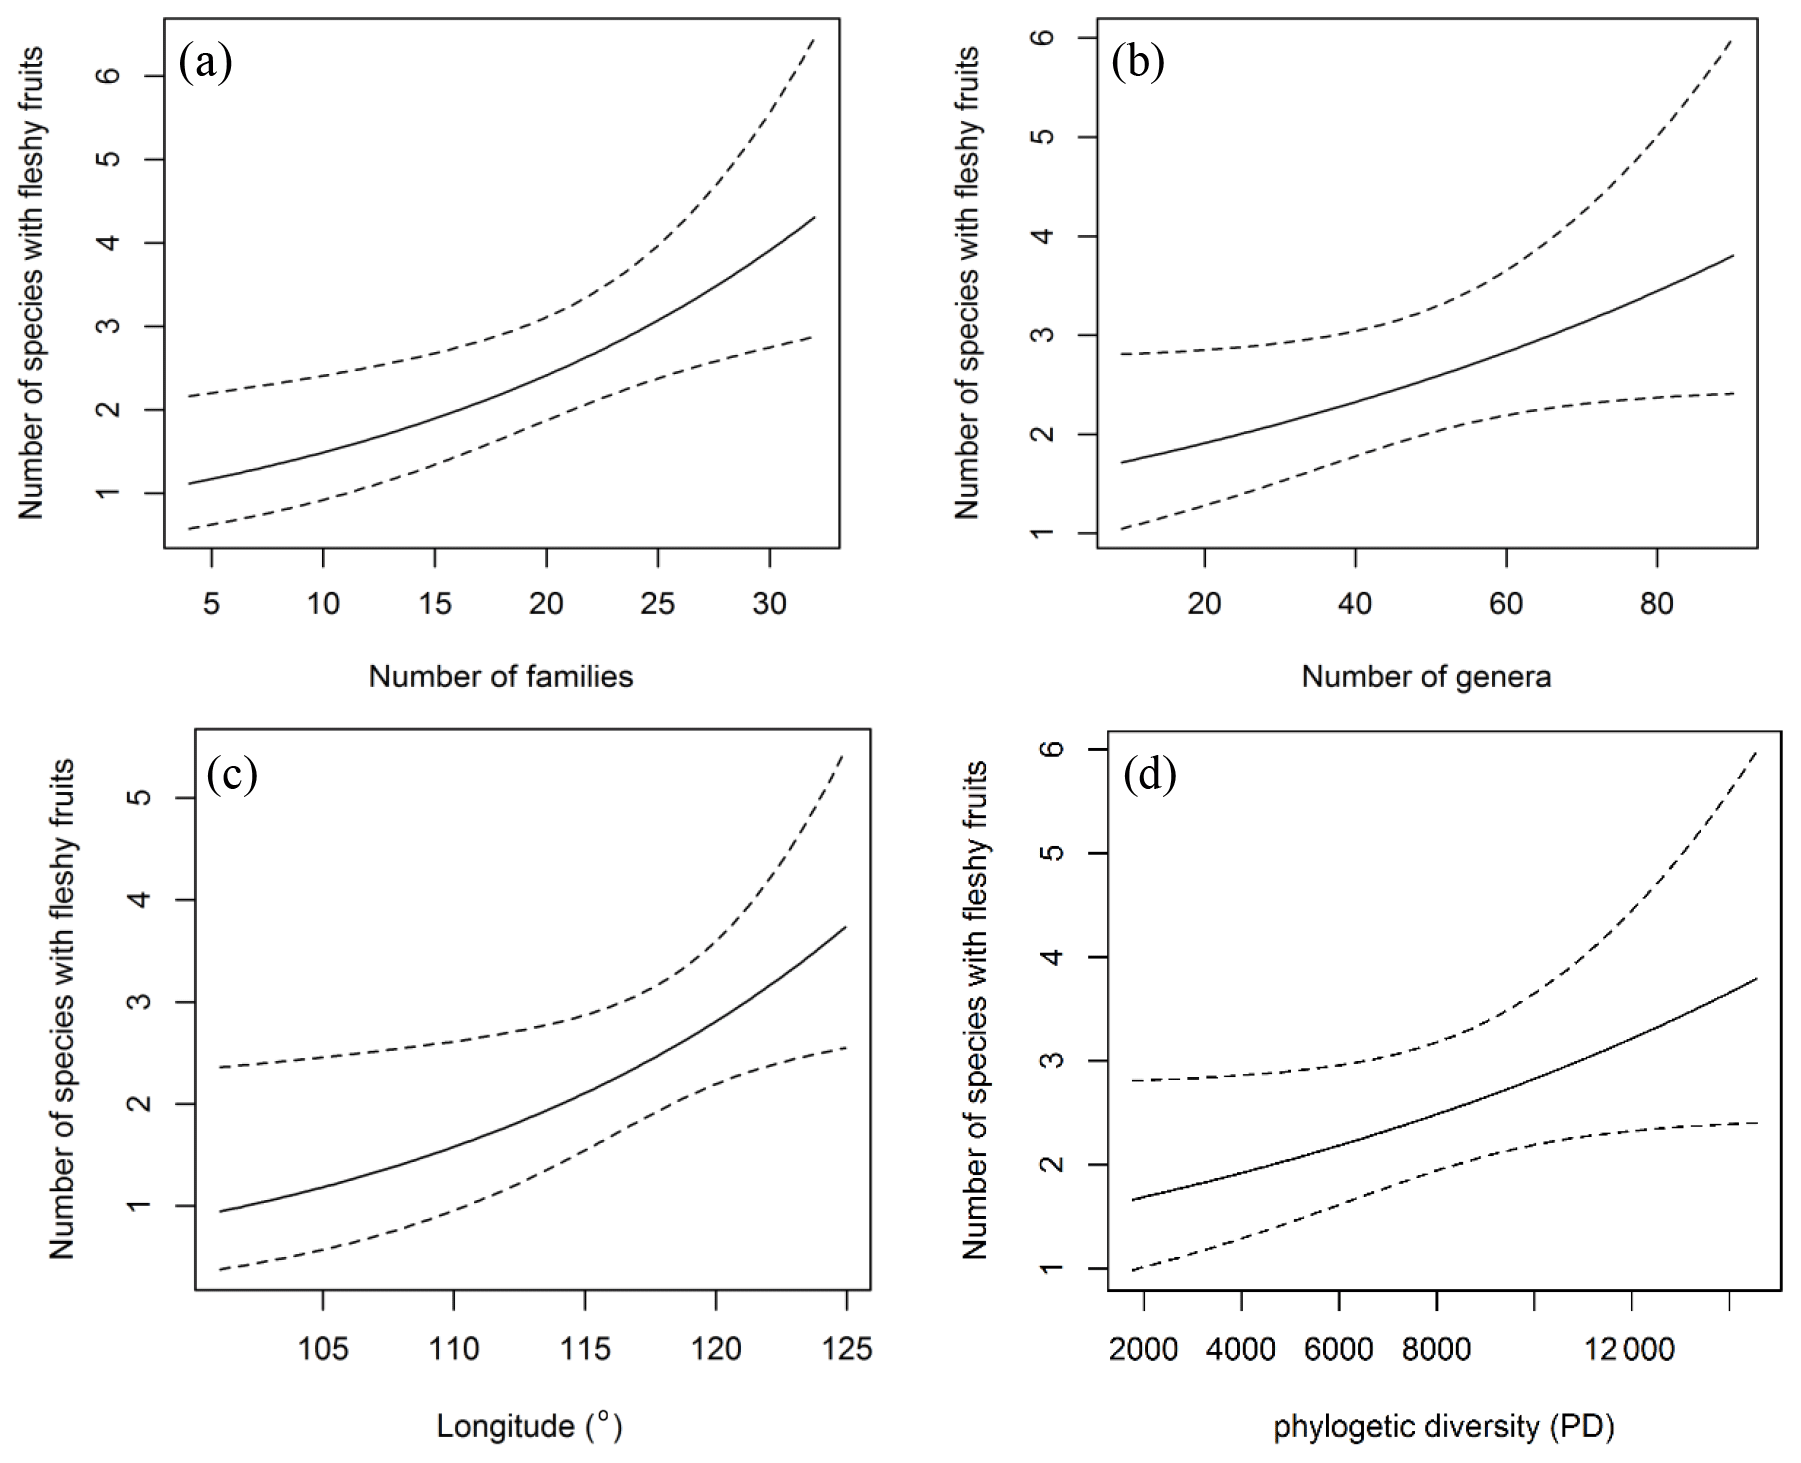
Figure 5Relationships between the number of species with fleshy fruits and longitude (a), number of families and genera (b, c) as well as phylogenetic diversity (d). The number of species with fleshy fruits increases as longitude increases. But it does not have a significant relationship with phylogenetic diversity (p>0.05).
3.7 Phylogenetic signals and their shift along longitudinal gradient
Most phylogenetic signals (k values) are weak (from 0.234 to 0.688, p>0.05) for the five biome types and for most sample plots except Naimanqi (1.928, p<0.05) in the early-successional stage. No significant relationships are found between phylogenetic signals (k values) and longitude across 26 sample sites (R=0.0403, p=0.8596). Both from desert (to desert grasslands) to typical grasslands (R=0.047, p=0.9123) and from typical grasslands to the forests (R=0.0401, p=0.6382), phylogenetic signals were not related to longitude for the five community types.
4.1 Variation of seed mass spectra and environmental factors
There is a strong and consistent effect of community type (along a longitudinal gradient) on seed mass (Figs. 1, 3). The average seed mass displays a significantly declining trend along decreasing longitude from forests to typical grasslands and then to some sites in desert grasslands in this region (Fig. 3). In these sites, average seed mass was found to have a significantly positive relationship with MAP and weakly positive relationship with MAT. The combined effects of precipitation and temperature may be, to some extent, most important to certain vegetation syndromes such as high seed mass and high fruit water content (Moles et al., 2014). High water availability can potentially produce high assimilation products, and high temperature (in the normal range of plant growth) can increase water availability.
In this study the average seed mass of each biome displays congruent distribution patterns to plant growth form spectra variation (Table 2, Fig. 1). General linear models (GLMs) revealed significant relationships between seed mass and each of the variables predicted to influence the longitudinal gradient in seed mass: plant growth form (99.76 %), vegetation types (99.01 %) and seed dispersal syndrome (99.88 %), as each variable reflects different profiles of biome syndromes, not being independent effect factors to the seed mass. Such patterns have previously been attributed mostly to a correspondence of seed mass to plant growth form and seed dispersal syndrome, which themselves are driven by climatic and environmental variations (Moles et al., 2005a, 2007). In Inner Mongolia, typical grasslands are often composed mainly of grasses (many of which are biennial and perennial) that are small-seeded (Fig. 2), whereas trees and lianas that dominate forests and shrubs that dominate deserts have the largest seeds (Fig. 2). Large seeds were proved to be often associated with woody growth forms (Salisbury, 1942; Baker, 1972; Silvertown, 1981; Mazer, 1989; Jurado et al., 1991; Leishman and Westoby, 1994; Moles et al., 2005a, b). This pattern is often attributed to woody plants' better capability to take up (Schenk and Jackson, 2002; Li et al., 2002; Qi et al., 2019) and store resources and to buffer the effects of environmental variations on seed size (Weiner, 2004; Moles et al., 2005a), or to reduced evaporation for understory species (Yu et al., 2017). Surely, woody species, on average, having larger leaves, can produce more photosynthate to invest in seeds (Díaz et al., 2016).
It is possible that larger seeds are more common in drought-prone habitats most likely because they allow seedlings to establish large root systems early, with a better chance of surviving drought (Baker, 1972; Salisbury, 1974). In this study, desert grassland and desert ecosystems are found to be dominated by shrubs that often possess larger seeds (Fig. 2). In the Inner Mongolian plateau these species are seldom exposed to strong interspecies competition or shading that make the plants invest more in propagules than in vegetative apparatus for competitive strength (Bai et al., 2008). In addition, relatively high species richness and the highest number of species occurred in this typical steppe grassland (Table 2), and in contrast, desert steppe had very low species richness and a low number of individuals (abundance) (Table 2).
With increasing MAP, the richness of wind dispersed species decreased (Table S3, Fig. S1 in the Supplement). The proportion of vertebrate dispersed species in typical grasslands was the lowest in comparison to other communities (Fig. S1). The patterns of seed dispersal syndromes observed in this study are congruent with previous findings in Australia's subtropics (Butler et al., 2007). Biotic dispersal agents exert a strong selective pressure on angiosperm species with various seed size in the Inner Mongolian plateau, as evidenced by the evolution of a wide range of adaptations for dispersal of animals (such as ants, birds, squirrels).
4.2 Variation of fruit type spectrum and associations of seed mass with fruit types
Fleshy-fruited species richness significantly corresponded to gradual changes of climate, especially for MAP (Table 1). The smallest proportion of fleshy-fruited species occurred in typical grasslands and desert grasslands (Fig. 3), in the middle zone of Inner Mongolia. Previous findings showed that fleshy-fruited species were often associated with shaded habitats, mature forests, tropical forests, regions with lower elevations and woody life forms (summarized in Yu et al., 2017), indicating high canopy coverage and low evaporation (Fig. 6). The increasing prevalence of canopy coverage (Table 2, Fig. 4) with increasing fleshy-fruited species is probably related to the prominence of species with larger seeds in such habitats. Previous hypotheses suggest that fleshy fruit evolution is related to water availability and the ineffectiveness of wind-assisted dispersal beneath a dense canopy (Butler et al., 2007; Yu et al., 2017). The reduced dispersal capability following from an increase in seed mass may be counterbalanced by the evolution of traits mediating seed dispersal by animals, such as fleshy fruits. Alternatively, increasing water availability may promote the evolution of species with fleshy fruits (Bolmgren and Eriksson, 2005; Yu et al., 2017) and large seeds.

Figure 6Mechanistic frameworks of large seeded species formation and corresponding increment process of community average seed mass.
4.3 Ecological and evolutionary drivers of seed mass variations
A consistent combination was found between the possession of fleshy fruits and heavier seeds when comparing seed mass among clades with fleshy and non-fleshy fruits (Fig. 2, Tables S1, S2). The results were largely in agreement with previous findings (Eriksson et al., 2000; Butler et al., 2007; Bolmgren and Eriksson, 2010). A possible explanation may be that woody species have larger internal water surpluses and photosynthate to invest in their seeds and fruits. Accordingly, the formation of seed mass may also be related to plant resource acquisition and allocation strategies or to the allometric growth of plant apparatus (Weiner, 2004; Price et al., 2007; Demalach and Kadmon, 2018).
As a result of evolution for high water availability, large seeds are often associated with low latitude (Moles et al., 2007) and low elevation (Bu et al., 2007), or with shaded habitats such as northern slopes (Csontos et al., 2004) and closed vegetation (Mazer, 1989; Hammond and Brown, 1995) and with late successional stages (Hammond and Brown, 1995). All those phenomena indicate that seed mass may be related to low evaporation and high water availability in plants (Fig. 6). We suggest that, as an ecological strategy, the derivation and evolution of species with large seeds may be due to improved water accommodation in plants by strong resource acquisition ability (such as having a strong water absorbing root system and advanced water conductive ability) or water retention ability (such as habituating shaded environments or developing small, thick leaves and hair or waxiness on leaves to prevent water loss) (Baker, 1972; Fonseca et al., 2000). Plant species have evolved various ecological strategies to match their environments (Laughlin, 2014). These strategies are manifested in many plant organs and traits. In the present study, seed mass is strongly connected with other biological characteristics such as plant dispersal ability (Fig. S1; Table 3), fruit types and growth forms. For example, there is a rising trend in average leaf area (Wright et al., 2004) and water-conducting conduits (Wheele et al., 2007; Zanne et al., 2014) along increasing longitude (or declining latitude and elevation). Seed mass is also sure to be coordinated with conducting issues of plant apparatus (Wheele et al., 2007; Zanne et al., 2014). Anatomical structures of lots of species indicated that the species with large seeds or fleshy fruits often have wide and long vessel elements that can provide much more water (Carlquist, 1975; Zimmermann, 1983). As suggested before, seed mass also is likely to be a result of co-evolution among various organs that determine plant responses to changing abiotic factors (Díaz and Cabido, 1997; Sandel et al., 2010).
In light of growth allometry theory, average seed mass variation should converge with community total biomass (Demalach and Kadmon, 2018). Evidently, spatial distributions of community-level seed mass and NPP consistency correspond (Moles and Westoby, 2003; Murray et al., 2003; Griffiths and Lawes, 2006; Chen et al., 2007; Chen et al., 2011). Indeed, in Inner Mongolia ANPP (aboveground net primary production) and RUE (rain-use efficiency) increased in space across different communities or ecosystems with increasing MAP eastwards (Bai et al., 2008), showing similar variation trends with the average seed mass of the biomes. Both soil moisture and soil nutrients (total N) were found to decrease significantly in Inner Mongolia from east to west (Liu et al., 2017), showing a similar variation trend with ANPP and seed mass. Moreover, water retention of plants is becoming unfavorable with an increase in evaporation westwards (Table 1).
In previous studies, soil moisture was found to not correlate with the relative abundance of fleshy-fruited species due to low temperature on water availability constraints (Yu et al., 2017). As we know, seed plants employ two main strategies to increase water use efficiency: one is to take up more water through strong root systems and the other is reducing water loss through low evapotranspiration. In our study, canopy coverage decreases from forests to sparse forests and then to grasslands and desert grasslands (Table 2). This leads to a gradual reduction in fleshy-fruited or large-seeded species richness (Fig. 5; Table 2). However, since fleshy fruits have high water content and thus require higher plant internal water content (Yu et al., 2017), we suggest the correspondence of seed size and fruit water content implies that some species evolved to contain more water or photosynthate in multiple body parts. Furthermore, CO2 concentration is generally the same everywhere, and although there is some small variation during growth seasons (Wang et al., 2002), its impact on seed mass variation patterns should be disregarded. Solar radiation variation is not very large along longitude (see site description) especially among typical grasslands, desert grasslands and deserts with similar elevation; therefore, its effect on seed mass variation is very small, since light is not a limited factor for growth in northern China according to our observation. Variation trends of sunshine hours or light intensity are contrary to that of rainfall amount along longitude. Only when water remains sufficient may strong light favor plant growth and increase seed mass. For example, a combination of much more belowground water with more sunshine hours or higher light intensity in Erjina may increase its average seed mass, and this may be responsible for larger seed mass in deserts than in some sites of desert grasslands. Therefore, combined with previous results of other studies, we deduce that drivers of seed mass spatial distribution patterns include temperature, rainfall, solar radiation, soil moisture and nutrients, leaf area canopy coverage, and their interactions; however, high water availability in plant body may be the most vital driving factor in shaping seed mass spatial distribution patterns. According to growth allometry, a fraction of photosynthate, coming from each increment of temperature, rainfall, soil moisture and nutrients, leaf area, and canopy coverage, is considered to be allocated to seeds. In addition, biological structures (such as hair or waxiness on leaf or fruits to prevent water loss), that favor water retention in the plant body would also be useful in increasing seed mass or fruit water content.
In order to understand variation mechanisms of seed mass better, a simple mechanistic model is provided to try to quantitatively explain average (or total) seed mass variation between communities for one species as follows:
St is the total seed mass of all species in a community, Sa is the average seed mass per species taken from the total community (St∕n), n is the number of species in a community, and Ci1 is the allometric growth coefficient (or allocation portion to seeds) that differ among species. Bt is total biomass from photosynthate per species. Bid value is the biomass of photosynthate related to water from conducting issues for one species, Bi0 is the biomass of photosynthate related to water from other approaches (for instances, lessening evaporation), Bl is the biomass of photosynthate related to leaf area (Fig. 6). As we know, ecological factors affecting St are numerous. St will be developed according to other sufficient data bases. For instance, seed developing time, sunshine duration and intensity, and belowground water may affect Bt; however, their extent and effects will be further defined in the future to improve and perfect Bt.
Generally, seed mass is quite phylogenetically conservative (Lord et al., 1995). However, in this study, phylogenetic signal is weak across the 26 sites (Table 1), and the phylogenetic signal is found to be not so involved in the relationships between seed mass and longitude, MAP and MAT in the five biomes. This proves that the environmental factors affect seed mass variation in the community context, and phylogenetic constraints are not significant (Figs. 3, 4). The five communities are in middle or late successional stages in which the main construction process is environmental filtering effect rather than competitive exclusion (Norden et al., 2012).
In addition, in this study we just measure the soil moisture of the top 10 cm, which mainly influences the growth of herbs, but for the growth of shrubs and trees, rich soil water below the depth of 10 cm in some areas of Ejinaqi is also useful. As mentioned above, combination of much more belowground water with more sunshine hours or higher light intensity in Erjina may increase seed mass and shape the present seed mass variation patterns in this region. Moreover, ecological-scale and micro-environmental heterogeneity often affects results of functional traits along biogeographical gradients, so further study may be necessary on a larger scale (or large investigation area) to identify the results of this article.
Mean seed mass, seed dispersal spectra, fruit type spectra and plant growth form spectra of five biome types vary significantly along a longitudinal gradient, with the lowest average seed mass and the smallest proportion of species dispersed by vertebrates occurring at the middle longitude (typical grasslands). The selection for these propagule attributes is most likely to be driven by external and internal drivers (Fig. 6); however, water availability potentials and growth allometry may be key drivers of seed mass variation along climatic gradients or resource gradients. Larger seeded species or species with fleshy fruits may have evolved due to much photosynthate or high water availability in plants. Our findings can provide help in understanding the origin and evolution of species with large seeds or fleshy fruits.
The data for this article were uploaded in the Dataset of Dryad and are available on the following website: https://doi.org/10.5061/dryad.vq83bk3rq (Yu et al., 2021).
The supplement related to this article is available online at: https://doi.org/10.5194/bg-18-655-2021-supplement.
SY led data collection and analysis, conceived the idea, and led the writing of the paper. GW and DL took part in data collection and analysis. OK assisted in paper writing. CL carried out phylogenetic analysis. QW provided soil moisture data. MY gave critical revision suggestions on an early draft. All authors contributed critically to the drafts and gave final approval for publication.
The authors declare that they have no conflict of interest.
This research has been supported by the National Natural Science Foundation of China (grant nos. 40771070 and 41171041) and the Beijing Natural Science Foundation (grant no. 5092015).
This paper was edited by Anja Rammig and reviewed by four anonymous referees.
Ackerly, D. and Donoghue, M.: Leaf size, sapling allometry, and Corner's rules: phylogeny and correlated evolution in maples (Acer), Am. Nat., 152, 767–791, 1998.
Adamski, N. M., Anastasiou, E., Eriksson, S., O'Neill, C. M., and Lenhard, M.: Local maternal control of seed size by KLUH/CYP78A5-dependent growth signaling, P. Natl. Acad. Sci. USA, 106, 20115–20120, 2009.
Bai, Y., Wu, J., Xing, Q., Pan, Q., Huang, J., Yang, D., and Han, X.: Primary production and rain use efficiency across a precipitation gradient on the Mongolia plateau, Ecology, 89, 2140–2153, 2008.
Baker, H. G.: Seed weight in relation to environmental conditions in California, Ecology, 53, 997–1010, 1972.
Blomberg, S. P., Garland, T., and Ives, A. R.: Testing for phylogenetic signal in comparative data: behavioral traits are more labile, Evolution, 57, 717, 2003.
Bolmgren, K. and Eriksson, O.: Fleshy fruits – origins, niche shifts, and diversification, Oikos, 109, 255–272, 2005.
Bolmgren, K. and Eriksson, O.: Seed mass and the evolution of fleshy fruits in angiosperms, Oikos, 119, 707–718, 2010.
Bu, H., Chen, X., Xu, X., Liu, K., Jia, P., and Du, G.: Seed mass and germination in an alpine meadow on the eastern Tsinghai-Tibet plateau, Plan. Ecol., 191, 127–149, 2007.
Butler, D., Green, R. J., Lamb, D., McDonald, W., and Forster, P.: Biogeography of seed-dispersal syndromes, life-forms and seed sizes among woody rain-forest plants in Australia's subtropics, J. Biogeogr., 34, 1736–1750, 2007.
Carlquist, S.: Ecological Strategies of Xylem Evolution, University of California Press, Berkeley and Los Angeles, USA, 1975.
Chen, B., Wang, S. Q., Liu, R. G., and Song, T.: Study on modeling and spatial pattern of net primary production in China' s terrestrial ecosystem, Res. Sci., 29, 47–53, 2007.
Chen, F., Shen, Y. J., Li, Q., Guo, Y., and Xu, L. M.: Spatio-temporal variation analysis of ecological systems NPP in China in past 30 years, Sci. Geol. Sin., 31, 1409–1414, 2011.
Csontos, P., Tamás, J., and Padani, J.: Slope aspect affects seed mass spectrum of grassland vegetation, Seed Sci. Res., 14, 379–385, 2004.
Demalach, N. and Kadmon, R.: Seed mass diversity along resource gradients: the role of allometric growth rate and size-asymmetric competition, Ecology, 99, 2196–2206, 2018.
Demalach, N., Ron, R., and Kadmon, R.: Mechanisms of seed mass variation along resource gradients, Ecol. Lett., 22, 181–189, 2019.
Díaz, S. and Cabido, M.: Plant functional types and ecosystem function in relation to global change, J. Veg. Sci., 8, 463–474, 1997.
Díaz, S., Kattge, J., Cornelissen, J. H. C. Wright, I. J., and Gorné, L. D.: The global spectrum of plant form and function, Nature, 529, 167–171, 2016.
Editorial Committee for Vegetation of China: Vegetation of China, Science Press, Beijing, China, 1980.
Editorial Committee of Chinese Flora: Flora of China, Science Press, Beijing, China, 2004 (in Chinese).
Eriksson, O., Friis, E. M., and Löfgren, P.: Seed size, fruit size, and dispersal systems in angiosperms from the Early Cretaceous to the Late Tertiary, Am. Nat., 156, 47–58, 2000.
Faith, D. P.: Conservation evaluation and phylogenetic diversity, Biol. Conser., 61, 1–10, 1992.
Fonseca, C. R., Overton, J. M., Collins, B., and Westoby, M.: Shifts in trait-combinations along rainfall and phosphorus gradients, J. Ecol., 88, 964–977, 2000.
Foster, S. and Janson, C. H.: The relationship between seed size and establishment conditions in tropical woody plants, Ecology, 66, 773–780, 1985.
Garnier, E.: Growth analysis of congeneric annual and perennial grass species, J. Ecol., 80, 665–675, 1992.
Greene, D. F. and Johnson, E. A.: Seed mass and dispersal capacity in wind-dispersed diaspores, Oikos, 76, 211–220, 1993.
Griffiths, M. E. and Lawes, M. J.: Biogeographic, environmental, and phylogenetic influences on reproductive traits in subtropical forest trees, South Africa, Ecography, 29, 614–622, 2006.
Guo, H., Mazer, S. J., and Du, G. Z.: Geographic variation in seed mass within and among nine species of Pedicularis (Orobanchaceae): effects of elevation, plant size and seed number per fruit, J. Ecol., 98, 1232–1242, 2010.
Hallett, L. M., Standish, R. J., and Hobbs, R. J.: Seed mass and summer drought survival in a Mediterranean-climate ecosystem, Plant Ecol., 212, 1479–1489, 2011.
Hammond, D. and Brown, V.: Seed size of woody plants in relation to disturbance, dispersal, soil type in wet neotropical forests, Ecology, 76, 2544–2561, 1995.
Herrera, C. M.: Seed dispersal by vertebrates, in: Plant-animal interactions: An evolutionary approach, edited by: Herrera, C. M. and Pellmyr, O., Blackwell Publishing, Oxford, UK, 185–208, 2005.
Howe, H. F. and Smallwood, J.: Ecology of seed dispersal, Ann. Rev. Ecol. Syst., 13, 201–228, 1982.
Hughes, L., Dunlop, M., French, K., Leishman, M. R., Rice, B., Rodgerson, L., and Westoby, M.: Predicting dispersal spectra: a minimal set of hypotheses based on plant attributes, J. Ecol., 82, 933–950, 1994.
Jurado, E., Westoby, M., and Nelson, D.: Diaspore weight, dispersal, growth form and perenniality of central Australian plants, J. Ecol., 79, 811–828, 1991.
Laughlin, D. C.: The intrinsic dimensionality of plant traits and its relevance to community assembly, J. Ecol., 102, 186–193, 2014.
Leishman, M. R. and Westoby, M.: Hypotheses on seed size: tests using the semiarid flora of western New South Wales, Australia, Am. Nat., 143, 890–906, 1994.
Li, H. L., Dong, Z., Wang, L. H., and Hao, Y. L.: Study on the root distribution characteristic and biomass of Ulmus pumila in Hunshandake Sands, J. Arid Land Res. Environ., 16, 99–105, 2002.
Liu, D., Zhu, W., Wang, X., Pan, Y., Wang, C., Xi, D., Bai, E., Wang, Y., Han, X., and Fang, Y.: Abiotic versus biotic controls on soil nitrogen cycling in drylands along a 3200 km transect, Biogeosciences, 14, 989–1001, https://doi.org/10.5194/bg-14-989-2017, 2017.
Liu, H. L., Zhang, D. Y., Duan, S. M., Wang, X. Y., and Song, M. F.: The relationship between diaspore characteristics with phylogeny, life history traits, and their ecological adaptation of 150 species from the cold desert of northwest China, Sci. World J., 16, 436, https://doi.org/10.1155/2014/510343, 2014.
Lord, J., Westoby, M., and Leishman, M.: Seed size and phylogeny in six temperate floras: constraints, niche conservatism, and adaptation, Am. Nat., 146, 349–364, 1995.
Mazer, S. J.: Ecological, taxonomic, and life history correlates of seed mass among Indiana dune angiosperms, Ecol. Monograp., 59, 153–175, 1989.
Moles, A. T. and Westoby, M.: Latitude, seed predation and seed mass, J. Biogeogr., 30, 105–128, 2003.
Moles, A. T., Ackerly, D. D., Webb, C. O., Tweddle, J. C., Dickie, J. B., and Westoby, M.: A brief history of seed size, Science, 307, 576–580, 2005a.
Moles, A. T., Acherly, D. D., Webb, C. O., Tweddle, J. C., Dickie, J. B., Pitman, A. J., and Westoby, M.: Factors that shape seed mass evolution, P. Natl. Acad. Sci. USA, 102, 10540–10544, 2005b.
Moles, A. T., Ackerly, D. D., Tweddle, J. C., Dickie, J. B., Smith, R., Leishman, M. R., Pitman, M. M., Mayfield, A., Wood, J., and Westoby, M.: Global patterns in seed size, Glob. Ecol. Biogeogr., 16, 109–116, 2007.
Moles, A. T., Perkins, S. E., Laffan, S. W., Flores-Moreno, H., Awasthy, M., Tindall, M. L., Sack, L., Pitman, A., Kattge, J., and Aarssen, L. W.: Which is a better predictor of plant traits: temperature or precipitation?, J. Veg. Sci., 25, 1167–1180, 2014.
Murray, B. R., Brown, A., and Grace, J.: Geographic gradients in seed size among and within perennial Australian Glycine species, Aus. J. Bot. 51, 47–56, 2003.
Murray, B. R., Brown, A., Dickman, C., and Crowther, M.: Geographical gradients in seed mass in relation to climate, J. Biogeogr., 31, 379–388, 2004.
Nimon, K., Oswald, F., and Roberts, J. K.: yhat: Interpreting Regression Effects, R package version 2.0-0, availabe at: https://CRAN.R-project.org/package=yhat (last access: 8 July 2019), 2013.
Norden, N., Letcher, S. G., Boukili, V., Swenson, N. G., and Chazdon, R.: Demographic drivers of successional changes in phylogenetic structure across life-history stages in plant communities, Ecology, 93, 70–82, 2012.
Pagel, M.: Inferring the historical patterns of biological evolution, Nature, 401, 877–884, 1999.
Price, C. A., Enqist, B. J., and Savage, V. M.: A general model for allometric covariation in botanical form and function, P. Natl. Acad. Sci. USA, 104, 13204–13209, 2007.
Primack, R. B.: Relationships among flowers, fruits and seeds, Ann. Rev. Ecol. Syst., 18, 409–430, 1987.
Qi, K., Xin, Z., Zhang, J., and Zhu, Y.: Root distribution characteristics of Ammopiptanthus mongolicus community in Ulan Buh Desert, Pratacultu. Sci., 36, 1706–1715, 2019.
R Core Team: R: A language and environment for statistical computing, R Foundation for Statistical Computing, Vienna, Austria, availabe at: https://www.R-project.org/, last access: 1 July 2018.
Revell, L. J., Harmon, L. J., Collar, D. C.: Phylogenetic signal, evolutionary process, and rate, Syst. Biol., 57, 591–601, 2008.
Salisbury, E. J.: The productive capacity of plants, G. Bell and Sons., London, UK, 1942.
Salisbury, E. J.: Seed size and mass in relation to environment, Proc. Roy. Soc. London Seri. B. Biol. Sci., 186, 83–88, 1974.
Sandel, B., Goldstein, L. J., Kraft, N. J., Okie, J. G., Shuldman, M. I., Ackerly, D. D., Cleland, E. E., and Suding, K. N.: Contrasting trait responses in plant communities to experimental and geographic variation in precipitation, New Phytol., 188, 565–575, 2010.
Schenk, H. J. and Jackson, R. B.: Rooting depths, lateral root spreads and below-ground/above-ground allometries of plants in water-limited ecosystems, J. Ecol., 90, 480–494, 2002.
Silvertown, J. W.: Seed size, life span, and germination date as coadapted features of plant life history, Am. Nat., 118, 860–864, 1981.
Tautenhahn, S., Heilmeier, H., Götzenberger, L., Klotz, S., Wirth, C., and Kühn I.: On the biogeography of seed mass in Germany – distribution patterns and environmental correlates, Ecography, 31, 457–468, 2008
Telenius, A. and Torstensson, P.: Seed wings in relation to seed size in the genus Spergularia, Oikos, 61, 216–222, 1991.
Venable, D. L.: Size-number trade-offs and the variation of seed size with plant resource status, Am. Nat., 140, 287–304, 1992.
Wang, G. C., Wen, Y. P., Kong, Q. X., Ren, L. X., Wang, M. L.: Background concentration and its variation of CO2 over China mainland, Chinese. Sci. Bull., 47, 780–783, 2002.
Wang, L., He, L. L., Li, J., Zhao, J., Li, Z. C., and He, C. Y.: Regulatory change at Physalis Organ Size 1 correlates to natural variation in tomatillo reproductive organ size, Nat. Commun. 5, 1–12, 2014.
Webb, C. O., Ackerly, D. D., and Kembel, S. W.: Phylocom: software for the analysis of community phylogenetic structure and character evolution, available at: http://www.phylodiversity.net/phylocom (last access: 8 June 2018), 2008.
Weiner, J.: Allocation, plasticity and allometry in plants, Perspec. Plant Ecol. Evol. Syst., 6, 207–215, 2004.
Westoby, M., Falster, D. S., Moles, A. T., Vesk, P. A., and Wright, I. J.: Plant ecological strategies: some leading dimensions of variation between species, Ann. Rev. Ecol. Sys., 33, 125–159, 2002.
Wheele, E. A., Baas, P., and Rodgers, S.: Variations in dicot wood anatomy: a global analysis based on the inside wood database, IAWA J., 28, 229–258, 2007.
Wright, I. J., Reich, P. B., Westoby, M., Ackerly, D. D., Baruch, Z., Bongers, F., Cavender-Bares, J., Chapin, T., Cornelissen, J. H. C., and Diemer, M.: The worldwide leaf economics spectrum, Nature, 428, 821–827, 2004.
Yu, S. L., Katz, O., Fang, W. W., Li, D. F., Sang, W. G., and Liu, C. R.: Shift of fleshy fruited species along elevation: temperature, canopy coverage, phylogeny and origin, Sci. Rep., 7, 40417, https://doi.org/10.1038/srep40417, 2017.
Yu, S. L., Wang, G. X, Katz, O., Li, D. F., Wang, Q. B., Yue, M., and Liu, C. R.: Shift of seed mass and fruit type spectra along longitudinal gradient: high water availability and growth allometry, Dataset of Dryad, https://doi.org/10.5061/dryad.vq83bk3rq, 2021.
Zanne, A. E., Tank, D. C., Cornwell, W. K., Eastman, J. M., Smith, S. A., FitzJohn, R. G., McGlinn, D. J., O'Meara, B. C., Moles, A. T., Reich, P. B., Royer, D. L., Soltis, D. E., Stevens, P. F., Westoby, M., Wright, I. J., Aarssen, L., Bertin, R. I., Calaminus, A., Govaerts, R., Hemmings, F., Leishman, M. R., Oleksyn, J., Soltis, P. S., Swenson, N. G., Warman, L., and Beaulieu, J. M.: Three keys to the radiation of angiosperms into freezing environments, Nature, 506, 12872, https://doi.org/10.1038/nature12872, 2014.
Zimmermann, M.: Xylem Structure and the Ascent of Sap, Springer, Berlin, Germany, 1983.
The requested paper has a corresponding corrigendum published. Please read the corrigendum first before downloading the article.
- Article
(1932 KB) - Full-text XML
- Corrigendum
-
Supplement
(395 KB) - BibTeX
- EndNote