the Creative Commons Attribution 4.0 License.
the Creative Commons Attribution 4.0 License.
 | 23 Dec 2021
Contrasting patterns of carbon cycling and dissolved organic matter processing in two phytoplankton–bacteria communities
Eeva Eronen-Rasimus
Eero Asmala
Tobias Tamelander
Hermanni Kaartokallio
Microbial consumption of phytoplankton-derived organic carbon in the pelagic food web is an important component of the global C cycle. We studied C cycling in two phytoplankton–bacteria systems (non-axenic cultures of a dinoflagellate Apocalathium malmogiense and a cryptophyte Rhodomonas marina) in two complementary experiments. In the first experiment we grew phytoplankton and bacteria in nutrient-replete conditions and followed C processing at early exponential growth phase and twice later when the community had grown denser. Cell-specific primary production and total community respiration were up to 4 and 7 times higher, respectively, in the A. malmogiense treatments. Based on the optical signals, accumulating dissolved organic C (DOC) was degraded more in the R. marina treatments, and the rate of bacterial production to primary production was higher. Thus, the flow of C from phytoplankton to bacteria was relatively higher in R. marina treatments than in A. malmogiense treatments, which was further supported by faster 14C transfer from phytoplankton to bacterial biomass. In the second experiment we investigated consumption of the phytoplankton-derived DOC by bacteria. DOC consumption and transformation, bacterial production, and bacterial respiration were all higher in R. marina treatments. In both experiments A. malmogiense supported a bacterial community predominated by bacteria specialized in the utilization of less labile DOC (class Bacteroidia), whereas R. marina supported a community predominated by copiotrophic Alpha- and Gammaproteobacteria. Our findings suggest that large dinoflagellates cycle relatively more C between phytoplankton biomass and the inorganic C pool, whereas small cryptophytes direct relatively more C to the microbial loop.
- Article
(3196 KB) - Full-text XML
- BibTeX
- EndNote


Dissolved organic carbon (DOC) forms the largest aquatic organic C pool (∼ 660 Pg C; Hansell et al., 2009), comparable in magnitude to atmospheric CO2 (∼ 780 Pg C; Emerson and Hedges, 2008). Phytoplankton are the most important source of autochthonous DOC in marine systems (Thornton, 2014). DOC is the main energy source for pelagic heterotrophic bacteria (Ducklow and Carlson, 1992), which quickly consume the most bioavailable organic molecules. As a result, the bulk of the marine DOC pool consists of refractory DOC (Jiao et al., 2010). Depending on the composition of DOC and surrounding conditions, DOC may accumulate in the water column (Hedges, 1992; Jiao et al., 2010; Mari et al., 2017), aggregate and sink (Engel et al., 2004), or be consumed (Azam et al., 1983; Kujawinski, 2011). The rates of these processes determine the prevalent fate of DOC and thus greatly determine total C cycling pathways.
The proportion of a phytoplankton species in a mixed community may affect the release of dissolved organic matter (DOM) within that community. The composition of phytoplankton-derived DOM is generally affected by growth phase (Urbani et al., 2005), environmental conditions (e.g., increased C : nutrient ratios of released DOM under nutrient limitation; Saad et al., 2016), and physiological state of the phytoplankton community (e.g., release of specific compounds as a result of cell death; Orellana et al., 2013). Different phytoplankton species produce different kinds of DOM (Becker et al., 2014; Mühlenbruch et al., 2018; Romera-Castillo et al., 2010; Sarmento et al., 2013), which shape the composition of the bacterial community depending on the composition of the released DOM (Romera-Castillo et al., 2011; Sarmento et al., 2013; Sarmento and Gasol, 2012; Teeling et al., 2012). Bacteria remineralize and transform organic matter and as a result produce different types of DOC (Kawasaki and Benner, 2006), nutrients (Amin et al., 2009; Christie-Oleza et al., 2017), and other substances (Croft et al., 2005) that become available to phytoplankton. Interactions among phytoplankton and bacteria may affect the composition of DOM released by phytoplankton (reviewed by Mühlenbruch et al., 2018).
Metabolic capability to utilize rapid pulses of phytoplankton-derived DOM varies among bacteria, and thus phytoplankton blooms are followed by distinct succession patterns of various bacterial genera commonly from the classes Gammaproteobacteria, Alphaproteobacteria, and Bacteroidia (Mühlenbruch et al., 2018; Teeling et al., 2012). Marine bacteria are often functionally divided in copiotrophs and oligotrophs based on their C uptake strategies. Oligotrophs are specialized in low nutrient concentrations, whereas copiotrophs thrive in high nutrient and DOM concentrations. Labile DOM attracts copiotrophic bacteria capable of quickly draining the DOM pool of its most bioavailable labile components (Pedler et al., 2014). Copiotrophic bacteria can become abundant, e.g., after phytoplankton blooms, but because oceans are mostly a low-nutrient environment copiotrophic bacteria are not as ubiquitous as oligotrophic bacteria, e.g., alphaproteobacterial SAR11 clade (Morris et al., 2002).
Optical properties of colored and fluorescent DOM (CDOM and FDOM, respectively) can be used as proxies of DOM bioavailability and source (Coble, 1996). Proxies for properties such as molecule size and amino acid content can be used to make predictions of the ecological function of the DOM pool by, for example, identifying DOM produced by phytoplankton blooms (Suksomjit et al., 2009), DOM degraded by bacteria (Kinsey et al., 2018), or DOM of freshwater origin (Coble, 1996). CDOM produced by phytoplankton differ in composition depending on phytoplankton species (Fukuzaki et al., 2014; Romera-Castillo et al., 2010). The composition is further altered by bacterial DOM utilization (Guillemette and del Giorgio, 2012; Romera-Castillo et al., 2011).
Mixed species communities mask C cycling differences that stem from the traits of individual phytoplankton species. Even during single species blooms previous environmental conditions may affect C cycling and DOM processing. Knowledge on the full cascade of C cycling through manipulated phytoplankton–bacteria communities aids to understand the contribution of individual phytoplankton species to C cycling in mixed communities. This is especially important because the composition of natural mixed phytoplankton communities seems to have little effect on the chemical composition of the accumulated autochthonous DOM, apparently due to rapid bacterial DOM processing (Haraguchi et al., 2019). In mixed phytoplankton communities it is also difficult to detect how the age and physiological state of individual phytoplankton species affects bacterial community composition (Grossart et al., 2005).
Environmental change has affected the composition of phytoplankton communities (Li et al., 2009). In the Baltic Sea spring blooms have shifted towards dinoflagellate predominance (Klais et al., 2011), and the ecological consequences of this shift are currently being investigated (Spilling et al., 2018). In this study we investigated how ecophysiology of two phytoplankton species affects microbial C cycling. We compared two common coastal phytoplankton species: a larger dinoflagellate Apocalathium malmogiense and a smaller, fast-growing cryptophyte Rhodomonas marina. In a broad sense they could be considered a K-strategist and an R-strategist, respectively (A. malmogiense can produce cysts (Kremp and Heiskanen, 1999), can use allelopathy to inhibit growth of competitors (Suikkanen et al., 2011), and has slower growth rate than R. marina). A. malmogiense is a common, bloom-forming species in the Baltic Sea during spring, and R. marina was chosen as a general model organism representing a smaller, faster-growing phytoplankton. We hypothesized that these two phylogenetically and physiologically different phytoplankton species show differences in C cycling. The focus of the experiment was to investigate whether these differences can be detected consistently on all levels of C cycling, from dissolved inorganic C (DIC) fixation via DOM release to bacterial DOM uptake and processing. Using phytoplankton cultures inoculated with natural bacterial community from the Baltic Sea, we experimentally investigated how species-specific differences in primary production (PP) and DOM production affect C flow from phytoplankton to bacteria as well as bacterial DOM consumption, production, and community composition. Our results on the effects of individual species on C cycling will increase understanding on how community shifts driven by environmental change will affect C cycling in aquatic environments.
2.1 Experimental setup
The ecophysiology of two different phytoplankton species and its effect on microbial C cycling from DIC uptake to bacterial DOC processing were investigated in an experimental study design. A larger (cell volume 3391–12764 µm3; Olenina et al., 2006) dinoflagellate Apocalathium malmogiense (Lars Gunnar Sjöstedt) Craveiro, Daugbjerg, Moestrup and Calado 2016 was compared to a smaller (mean cell volume 217 µm3; Olenina et al., 2006), fast-growing cryptophyte Rhodomonas marina (Pierre Augustin Dangeard) Lemmermann 1899. Both species are common in the Baltic Sea during spring. Phytoplankton cultures were acquired from the FINMARI culture collection/SYKE Marine Research Centre (A. malmogiense (syn. Scrippsiella hangoei), culture ID: SHTV-2, isolated in Storfjärden, Tvärminne, by Anke Kremp in 2002; R. marina, culture ID: Crypto08-A2, isolated in Storfjärden, Tvärminne by Anke Kremp in 2008). These non-axenic unialgal phytoplankton cultures were grown in artificial seawater to minimize the effect of growth medium on optical DOM properties. Cultures were inoculated with the natural bacterial community from the Baltic Sea (hereafter called A. malmogiense treatment and R. marina treatment) and then investigated experimentally for the effect of species-specific differences in PP and DOM production on C flow from phytoplankton to bacteria as well as bacterial DOM consumption, production, and community composition.
The experiment was conducted at Tvärminne Zoological Station (59.844966, 23.249642) during winter 2017–2018 in two parts: the DOM release experiment and the DOM consumption experiment (Fig. 1). The purpose of the DOM release experiment was to study the long-term net accumulation and alterations of DOM in conditions where phytoplankton produce new DOM and bacteria consume it. The purpose of the DOM consumption experiment was to study the effect of bacteria on DOM processing when the phytoplankton are removed. The experiment was timed to winter and spring months because the phytoplankton used were spring bloom species and we wanted the natural bacterial inoculum to represent winter and spring bloom bacteria. Phytoplankton batch cultures were grown in two triplicate series, one for each part of the experiment with identical growth conditions. Cultures were grown in F/2 growth medium in 5 L Erlenmeyer flasks in 4 ∘C (local seawater winter temperature) in approximately 60 µmol photons s−1 m−2 under a light–dark regime of 14 and 10 h. The growth medium was prepared in artificial seawater (autoclaved MQ water adjusted to salinity 6 using Tropic Marin Classic Sea Salt). Vials were stirred manually every 1–2 d and prior to any sampling.
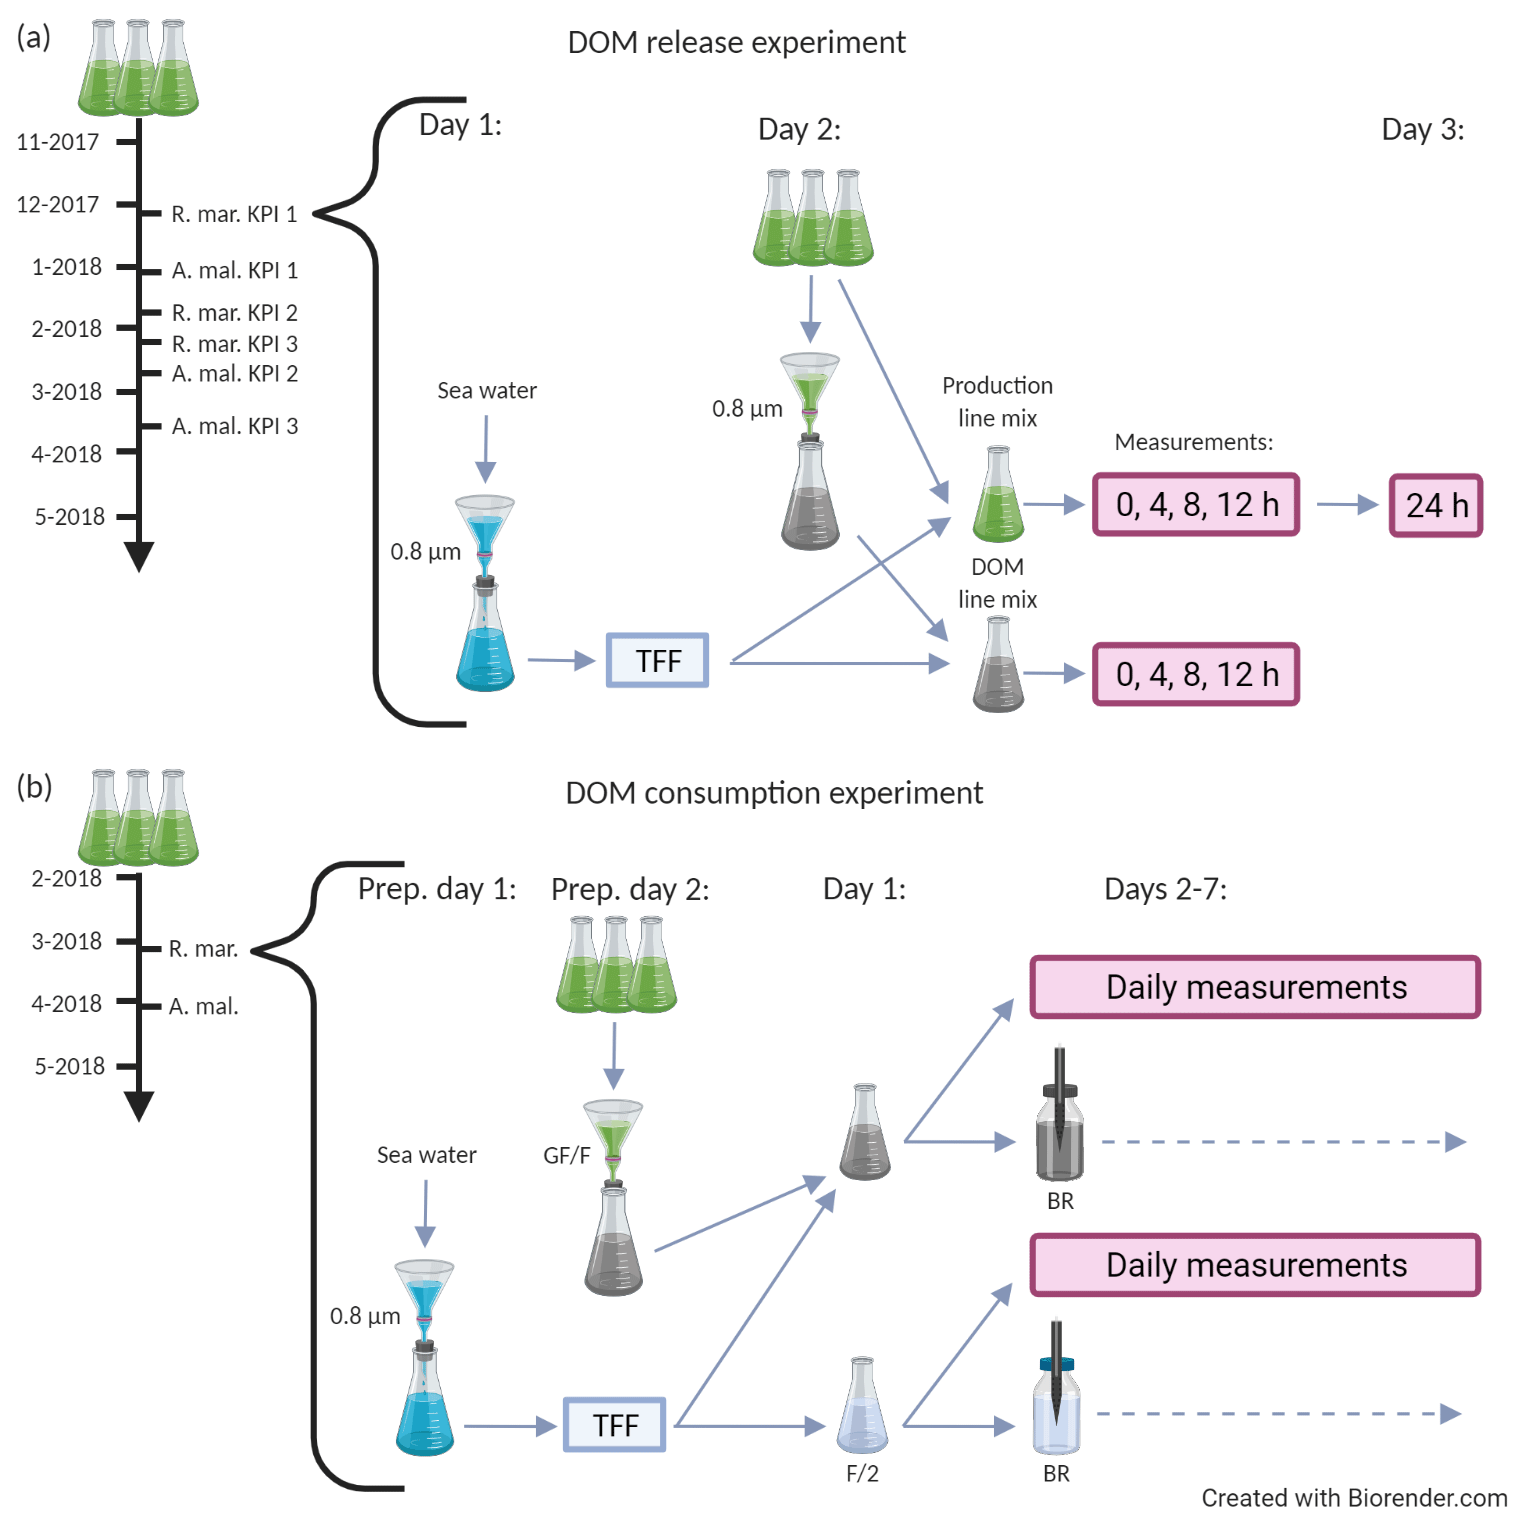
Figure 1A schematic description of the DOM release experiment (a) and the DOM consumption experiment (b). Both experiments were conducted separately for A. malmogiense and R. marina. The black timeline arrow at the far left starts from the inoculation of phytoplankton into 5 L growth vials. During the timeline phytoplankton abundance and optical properties of DOM were measured one to three times a week. Grey arrows depict the flow of water through different filtration, mixing, and measurement steps. (a, bracketed area) Procedure for an individual key point incubation, which were conducted thrice for each species. On day 1 the bacterial inoculum was prepared, on day 2 the incubation was initiated (i.e., phytoplankton treatments were established) and measurements (production line: primary production, bacterial production, 14C flow; DOM line: DOC, CDOM, bacterial abundance) were taken at 4 h intervals, and on day 3 the final primary production measurement was taken (for net primary production). (b, bracketed area) Incubation of the DOM consumption experiment, which was conducted once for each species. On preparation day 1 bacterial inoculum was prepared, on preparation day 2 the cultures were filtered, on day 1 the incubation was initiated (i.e., phytoplankton treatments were established), and measurements (DOC, CDOM, bacterial abundance, production, respiration, community composition, and growth efficiency) were taken daily until day 7. The variables measured at each phase of the two experiments are listed in Table 1. KPI: key point incubation (see text); BR: optical O2 consumption (bacterial respiration) measurement; F/2: F/2 growth medium (control); TFF: concentration of bacteria by tangential flow filtration.
In the first part of the experiment, the DOM release experiment (Fig. 1a), the phytoplankton and bacteria present in the cultures were grown together for over 4 months, and phytoplankton abundance and optical properties of DOM were monitored one to three times a week. At the beginning of the exponential growth phase and at two later stages the C flow from phytoplankton to bacteria, DOM alterations, and bacterial activity were measured using day-long incubations. During these three measurement occasions (hereafter referred to as first, second, and third KPIs after key point incubation), subsamples of phytoplankton cultures were incubated with an inoculum of natural bacterial community for 24 h and sampled at 0, 4, 8, and 12 h (+ extra sampling at 24 h for net PP). This experiment addressed the C flow in a combined phytoplankton–bacteria community system.
In the DOM release experiment concentrations of chlorophyll a (chl a) and particulate organic C and N (POC and PON, respectively) were measured, and bacterial community composition was determined, before each KPI. Two separate sample sets were incubated at each KPI.
In the first set, hereafter referred to as production line (Fig. 1a), phytoplankton cultures and bacteria (90 % vol phytoplankton culture +10 % Vol mL bacterial inoculum in 10 mL aliquots) were incubated in light and PP, and bacterial production (BP) and 14C transfer from 14C-NaHCO3 via phytoplankton to the DOC pool and bacterial biomass were measured. Transfer of 14C to DOC was investigated by filtering PP samples through 0.45 µm GD/X (Whatman) syringe filters and by measuring the radioactivity in the filtrate. Transfer of 14C from DOC to bacterial biomass was investigated by incubating the previously mentioned filtrate for 4 h in dark, after which the incubation was stopped by addition of 50 % trichloroacetic acid, and the particulate biomass in the samples was centrifuged for analysis of radioactivity. The protocol for the production line is depicted in detail in Fig. 2.
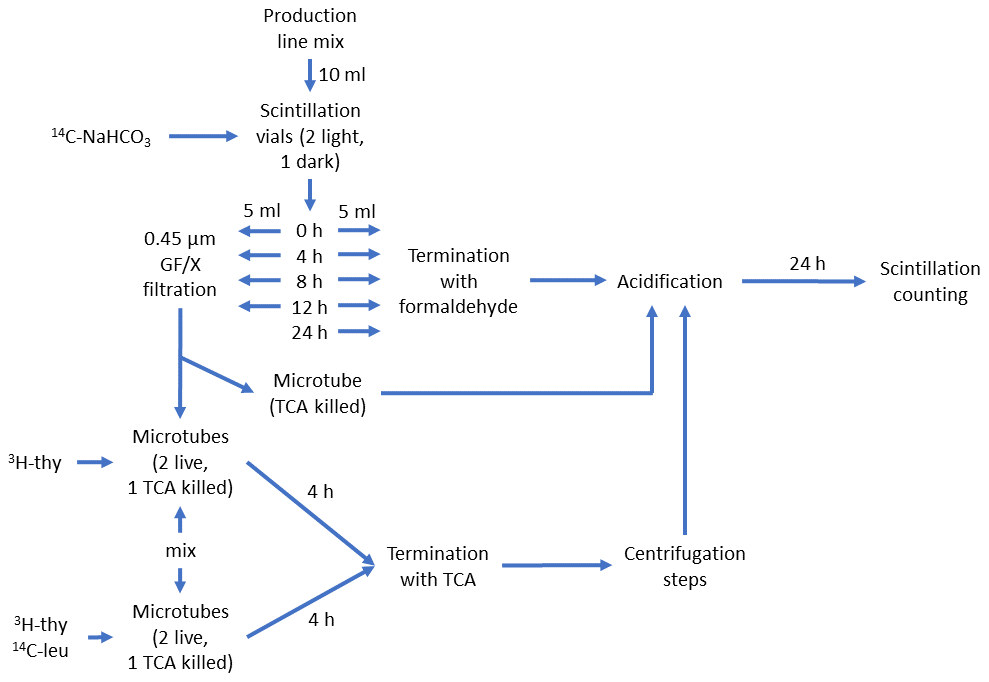
Figure 2Schematic description of the production line of the DOM release experiment. The schematic starts at the top from the “Production line mix”, which consisted of phytoplankton culture (90 % Vol.) and inoculum of seawater bacteria (explained in Fig. 1a). This was divided into five 10 mL aliquots in 20 mL scintillation vials, which were spiked with 125 µL of 23.43 µCi mL−1 14C-NaHCO3 and incubated in light for 0 to 24 h. At 0, 4, 8, and 12 h one set of incubation vials was divided in two. One half were terminated with 0.1 % formaldehyde for 14C-NaHCO3-incorporation measurement (i.e., primary production). To remove the remaining 14C-NaHCO3 prior to scintillation counting, 24 h acidification with HCl was used. The other half was filtered to remove the majority of 14C-labeled phytoplankton and bacterial cells and mixed (50:50 Vol.) with non-spiked production line mix (termed “mix” in the lower left part of the schematic). This new mixture was then spiked with either only 3H-thymidine or both 3H-thymidine and 14C-leucine and incubated for 4 h. The mixture spiked with 3H-thymidine was used to measure incorporation of 14C-labeled DOC originating from phytoplankton into bacterial biomass (3H-thymidine incorporation was measured as a control for bacterial activity). The mixture spiked with 3H-thymidine and 14C-leucine was used to measure incorporation rate of both radioisotope tracers and, subsequently, bacterial production based on both tracers. These mixtures were terminated with trichloroacetic acid (TCA, final concentration: 5 %) and measured according to the centrifugation method (Smith and Azam, 1992). Instagel Plus (PerkinElmer) was used as the scintillation cocktail, and liquid scintillation counting was done with Wallac 1414 LSC.
In the second set, hereafter referred to as DOM line (Fig. 1a), phytoplankton were removed by 0.8 µm filtration, and bacteria (225 mL filtered phytoplankton culture +25 mL bacterial inoculum) were incubated in dark and DOC concentration, optical properties of DOM, and bacterial abundance were measured. This incubation was conducted in the dark to see if the modified bacterial community influences the DOM pool already during the 12 h KPI when photosynthesis is stopped. A separate incubation mix was needed because, for technical reasons, we could not measure these variables from the mix containing radioisotopes. Inorganic nutrients (NO3−, including NO2−, and PO) were measured in untreated culture and DOM line samples at 0 and 12 h.
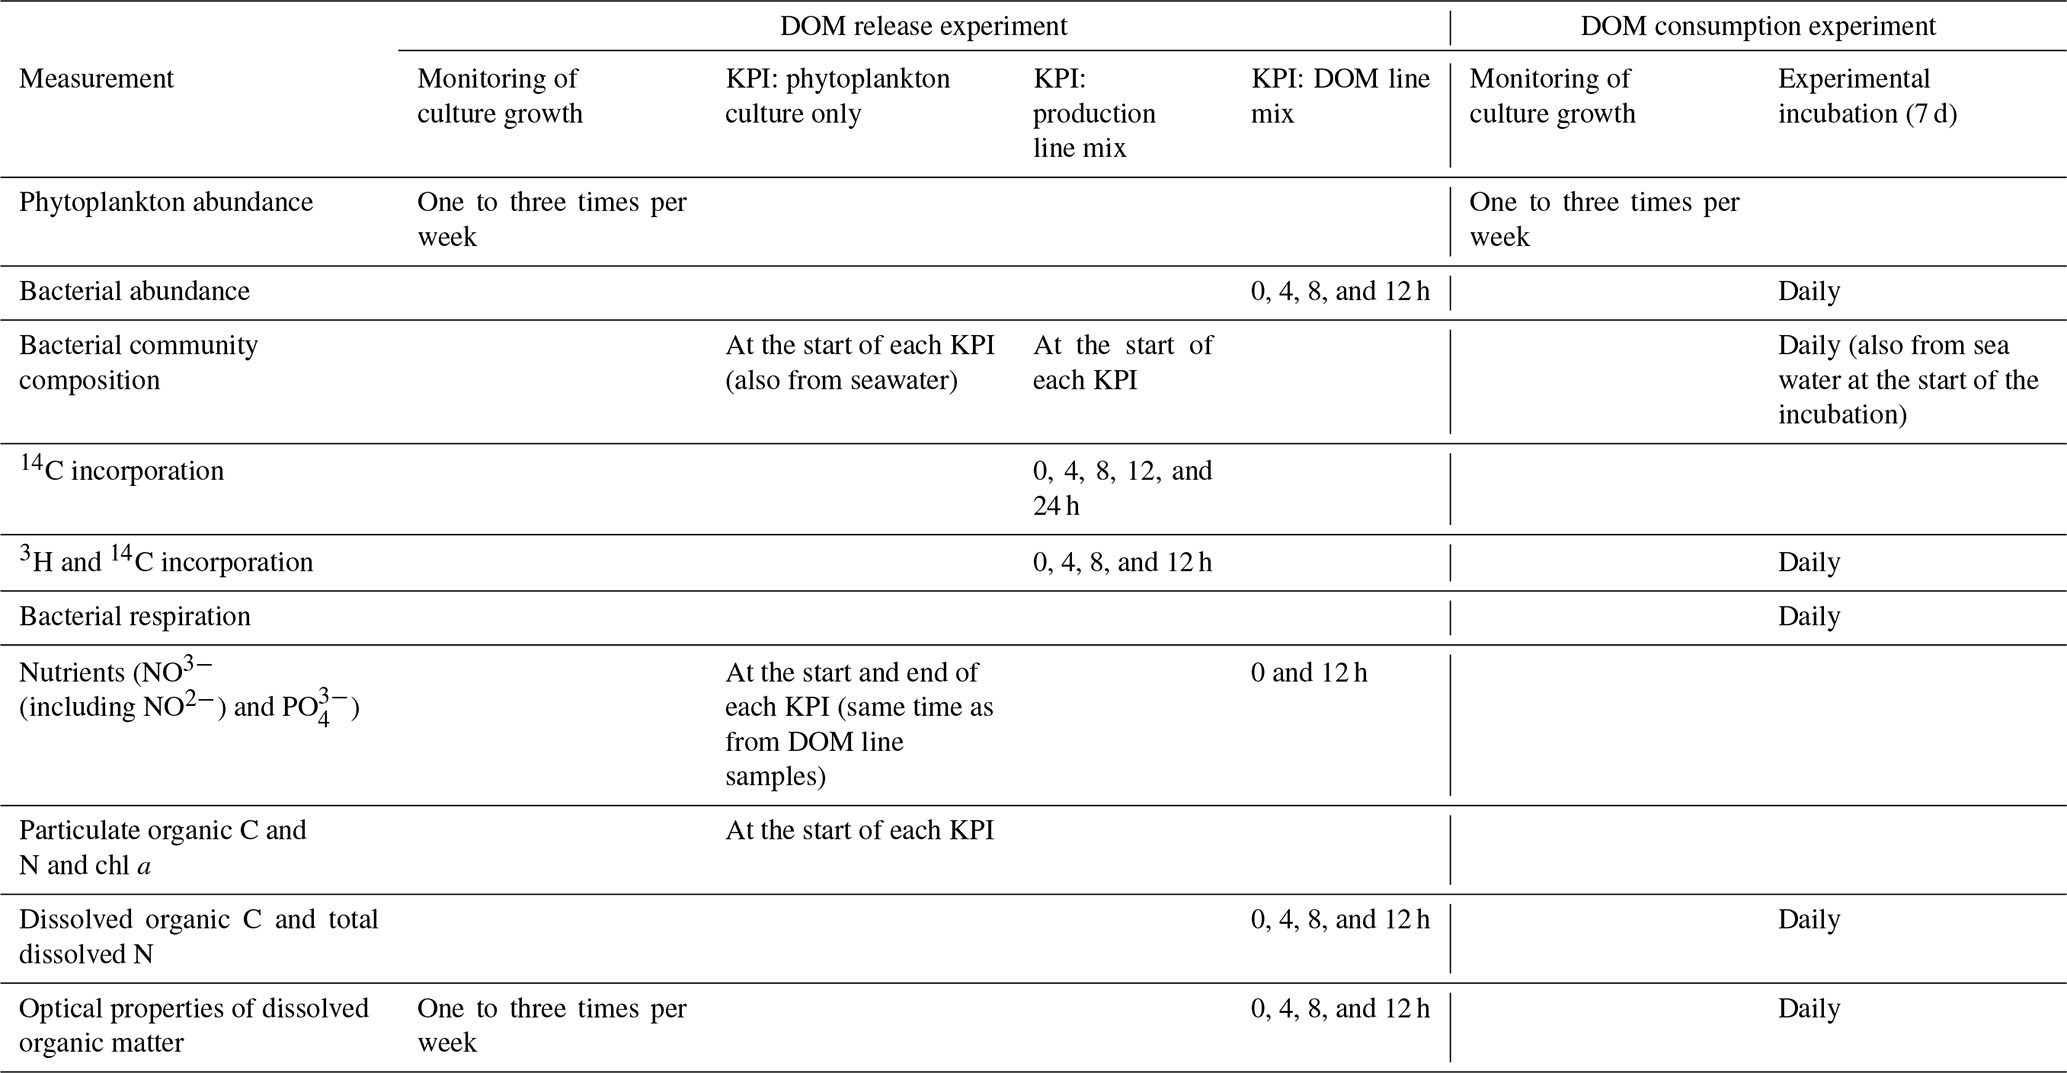
Except for PP measurements, there were no trends in any other production line or DOM line variables from 0 to 12 h measurements. Therefore the measurements at all time points within a KPI were pooled for statistical analysis and presentation. The variables measured at each phase of the DOM release experiment are listed in Table 1.
Table 1Measured variables at each stage of both parts of the experiment (DOM release experiment and DOM line experiment). The stages of the experiments are explained in the methods and in Fig. 1. In short, in the DOM release experiment monitoring of culture growth refers to the total time the cultures were grown. During this time three shorter key point incubations (KPIs) were conducted. In the DOM consumption experiment, monitoring of culture growth refers to the period before the experimental incubation.
In the second part of the experiment, the DOM consumption experiment (Fig. 1b), the phytoplankton were grown to high density (A. malmogiense: ∼ 1 × 10⁴ cells mL−1, R. marina ∼ 9 × 10⁴ cells mL−1), after which the phytoplankton and most of the bacteria were removed by filtering (GF/F filters pre-combusted 450 ∘C for 4 h; Whatman). The filtrate, inoculated with a natural bacterial community (1480 mL filtered phytoplankton culture + 120 mL bacterial inoculum), was incubated for 7 d to study the DOM processing and C flow in the bacterial compartment without phytoplankton present. To ensure nutrient-replete conditions, 18 µmol NH4Cl and 11 µmol NaH2PO4 were added in the experimental mixtures at the start of the incubation. Temperature during the incubation was increased to 10 ∘C to enhance the bacterial processes for easier detection. A control treatment containing only F/2 medium and a natural bacterial community inoculum was used to investigate how the natural bacterial community develops and how their DOC processing differs in the growth medium in the absence of DOM derived from the cultured phytoplankton and competition from cultured bacteria. During the 7 d incubation of the DOM consumption experiment DOC concentration, optical properties of DOM and bacterial abundance, production, respiration, community composition, and growth efficiency were measured daily. The variables measured at each phase of the DOM consumption experiment are listed in Table 1.
The natural bacterial community inoculum was prepared the same way for both parts. Seawater was collected at the pier of the station, and bacterial abundance and community composition were measured. Seawater was vacuum filtered using 10 mm Hg pressure through a 0.8 µm pore size polycarbonate membrane filter (∅ 47 mm; Whatman) to remove grazers including heterotrophic nanoflagellates, and 3 L of the filtrate was concentrated to about 30 mL using tangential filtration (Pall Minimate 100 kDa TFF capsule), and then diluted to 300 mL with artificial seawater, after which bacterial abundance was measured again. All handling of seawater and bacterial concentrate was done in 4 ∘C. The purpose of this treatment was to concentrate the seawater bacterial concentration 10-fold and to remove most of the marine DOM. Phytoplankton culture and bacterial concentrate were mixed in a volume ratio of 90:10 % to recreate the natural concentration of seawater bacteria. Time limitations of filtrations forced the use of only 92.5:7.5 % in the DOM consumption experiment. However, the concentration of seawater bacteria proved to be inefficient and the final ratio of seawater bacteria to bacteria present in the culture was small (DOM release experiment: A. malmogiense: 7.53 %, 0.02 %, and 0.03 %, R. marina: 18.11 %, 0.03 %, and 0.02 %, at first, second, and third KPIs, respectively; DOM consumption experiment: A. malmogiense: 3.38 %, R. marina: 1.70 %).
2.2 Laboratory analyses
2.2.1 Cell abundance
Phytoplankton and bacterial abundance were analyzed using flow cytometry (BD Accuri C6 Plus). Phytoplankton abundance was analyzed in untreated samples by plotting red fluorescence (670 nm long-pass filter, 488 nm excitation) against forward scatter. Samples for bacterial abundance were fixed with paraformaldehyde (final concentration: 0.9 %) and glutaraldehyde (final concentration: 0.045 %), incubated in the dark at room temperature for 30 min, frozen in liquid N, and stored in −80 ∘C until analysis. After thawing, samples were diluted 10–100-fold with pH 8 TE buffer, stained with Sybr Green I nucleic acid stain (final concentration 1:10 000 Vol.), and incubated in the dark at room temperature for 10 min. Heterotrophic bacteria were detected and counted by plotting green ( bandpass filter, 488 nm excitation) fluorescence against red (670 nm long-pass filter, 488 nm excitation) fluorescence so that they could be differentiated from cells containing chl a. Cytometer data were analyzed with FCS Express 5 software (De Novo software).
2.2.2 Primary production and 14C transfer
DIC was analyzed with an Elektro-Dynamo URAS-3E C analyzer against NaHCO3 standards. PP was measured from the mean of light sample 14C activity corrected with dark sample 14C activity according to Gargas (1975) with the modifications described in Fig. 2. PP measured at each KPI represents cumulative gross PP divided by time (GPP). PP at 24 h is the net PP including the dark period (NPP). PP was used to calculate community respiration according to Spilling et al. (2019) using Eq. (1). Actual respiration measurements were not available for either phytoplankton species so uniform respiration rates for light and dark periods were assumed.
GPP in A. malmogiense treatments decreased from 4 to 12 h at the second and third KPI. This might have been caused by high respiration (see results) but also by insufficient addition of 14C-NaHCO3, which might have resulted in underestimation of GPP, which we did not want to carry over to other results. Therefore GPP at 4 h was used in calculation of community respiration and 14C flow percentages.
Concentration of 14C originating from 14C-NaHCO3 in DOC and bacterial biomass was measured after the PP incubations (Fig. 2). The transfer of 14C originating from 14C-NaHCO3 measured in percent from phytoplankton via DOC to bacteria was quantified by dividing the accumulation rate of 14C in each compartment with the accumulation rate in the previous compartment (i.e., GPP : DIC, DOC : GPP, and bacterial biomass : DOC). Accumulation of 14C activity in DOC and in bacterial biomass was calculated by dividing the time-normalized activity in samples after 12 h incubation with specific activity of 14C-NaHCO3. Before calculations, 14C accumulation in the DOC pool and in bacterial biomass was corrected for the ratio of 14C-DIC to ambient DIC concentration. This was done by multiplying them with the ratio of PP to bulk 14C accumulation rate in phytoplankton biomass.
2.2.3 Bacterial production and respiration
Thymidine and leucine-based BP were measured with the centrifugation method (Smith and Azam, 1992) with modifications for the DOM release experiment described in Fig. 2. 3H-thymidine incorporation was converted to bacterial biomass increase by using conversion factors of 1.1 × 10¹⁸ cells mol−1 (Riemann et al., 1987) and 0.12 pg C × (µm3 cell−1)0.7 (Norland, 1993) using a theoretical bacterial cell volume of 0.063 µm3 cell−1 (Kuparinen, 1988). 14C-leucine incorporation was converted to bacterial biomass increase with a conversion factor of 1.55 kg C mol−1. The incorporation ratio of 3H-thymidine and 14C-leucine was calculated to investigate departures from balanced growth of bacteria (Chin-Leo and Kirchman, 1990).
From each experimental treatment in the DOM release experiment 100 mL was enclosed in airtight septum-sealed Duran bottles at the start of the incubation for bacterial respiration (BR) measurements (Fig. 1b). A needle-sheathed oxygen optode (PreSens NTH-PSt1-L5-TF-NS120/0.8-YOP) was pierced through the septum to monitor bacterial oxygen consumption with an OXY-4 micro oxygen meter (PreSens). Prior to measurements oxygen optodes were calibrated to 0 % and 100 % air saturation by exposing the optode to Na2SO3 solution and water-vapor-saturated air, respectively. Relative oxygen concentration was recorded every 10 min through the incubation. BR for each day was calculated by dividing the difference in relative O2 saturation between the start of the experiment and each day with time. Oxygen solubility of 678.8 mmol L−1 (at 10 ∘C, 1 atm, and salinity 6) was used to convert relative O2 saturation to molar concentration, which was then converted to units of mol C L−1 h−1.
Bacterial growth efficiency (BGE) each day during the DOM consumption experiment was calculated separately for thymidine and leucine-based BP using Eq. (2):
where BP is bacterial production and BR is bacterial respiration calculated as the change in C during the previous day and converted to h−1. Therefore BGE is reported starting from day 2.
2.2.4 Bacterial community composition
A total of 500 mL (seawater) or 100 mL (DOM release experiment water (DOM line mix) and DOM consumption experiment water) was vacuum filtered onto sterile 0.22 µm pore size membrane filters (∅ 47 mm; Whatman), frozen in liquid N, and stored at −80 ∘C until analysis. DNA was extracted from filters with DNeasy Power Soil kit (Qiagen) 6 months after the experiments and stored at −80 ∘C for further processing. In addition, negative controls without a sample were extracted. Only one replicate from seawater (both experiments) and cultures (DOM release experiment) was sequenced (Fig. 1). For sequencing, 16S ribosomal RNA gene region V4 was amplified with a polymerase chain reaction, using the universal bacterial primers 341F and 785R (Klindworth et al., 2013). A two-step polymerase chain reaction and Illumina MiSeq (Illumina Inc, San Diego, CA, USA) paired-end multiplex sequencing were performed at the Institute of Biotechnology, University of Helsinki, Finland. In total 16 × 106 paired raw reads were obtained with the Illumina MiSeq platform. Primer removal was done with Cutadapt (settings – m 1 – O 15 – e 0.2, V 2.1 with Python 3.5.3; Martin, 2011). Reads were merged and processed according to the DADA2 pipeline (DADA2 V 2.1.10 Rcpp V 1.0.0; Callahan et al., 2016) with filterAndTrim maxEE = 3. After filtering and trimming, a total of 11.2 × 10⁶ sequences remained from which 10.7 × 10⁶ were merged and 9.1 × 10⁶ were non-chimeric and used for further analyses. Taxonomic classification of the amplicon sequence variants (ASVs) was done with DADA2 default parameters (minBoot = 50) using Silva for DADA2 (v. 132, Quast et al., 2013, https://zenodo.org/record/1172783#.Xila11 MzZgg, last access: 16 October 2019). Before the statistical analyses, chloroplasts and mitochondria were removed, ending up with 4545 ASVs. Raw reads are deposited in the Sequence Read Archive of the National Center for Biotechnology Information under BioProject accession number PRJNA647035.
2.2.5 Dissolved C and N and optical properties of DOM
DOC and CDOM samples were prepared by filtering 20 mL of water through acid-washed and pre-combusted GF/F filters (450 ∘C, 4 h) into acid-washed and pre-combusted glass vials, which were then sealed with a septum cap. DOC samples were acidified to pH 2 with 2 M HCl and stored at −20 ∘C until analysis of DOC with a Shimadzu TOC-V CPH total organic carbon analyzer. Filtered CDOM samples were analyzed within 24 h. CDOM absorption was measured using a Shimadzu 2401PC spectrophotometer with a 4 cm quartz cuvette over the spectral range from 200 to 800 nm with 1 nm resolution. Ultrapure water (MQ) was used as the blank for all samples. Excitation–emission matrices (EEMs) of FDOM were measured with a Varian Cary Eclipse fluorometer (Agilent). Processing of the EEMs was done using the eemR package for R software (Massicotte, 2016). A blank sample was subtracted from the EEMs, and the Rayleigh and Raman scattering bands were removed from the spectra after calibration. EEMs were calibrated by normalizing to the area under the Raman water scatter peak 11 (excitation wavelength of 350 nm) of an MQ water sample run on the same session as the samples and were corrected for inner filter effects with absorbance spectra (Murphy et al., 2010). For assessing the characteristics and the quality of the DOM pool, fluorescence peaks (Coble, 1996) were extracted from the EEMs. In this study the following optical variables were used as proxies for DOM characteristics: absorbance coefficient at 254 nm (aCDOM(254)) as a general indicator of optically active molecules and light attenuation, absorption spectral slope between 275 and 295 nm (S275−295) as a proxy of molecular size (Helms et al., 2008), fluorescence peaks in T and C (Coble, 1996) as proxies of protein-like and humic-like DOM, respectively, and humification index (HIX; Zsolnay et al., 1999) as an indicator of relative humification of DOM. Additional optical variables were collected, but these were not included in the detailed analysis and are only presented in Appendix A (Figs. A1, A2 and Table A1).
2.2.6 Particulate organic C and N, chl a, and nutrients
For POC/N and chl a measurements, 20 mL of sample water was filtered through GF/F filters (for POC/N they were pre-combusted in 450 ∘C for 4 h). The POC/N filters were wrapped in a foil and stored at −20 ∘C until analysis with a Europa Scientific ANCA-MS 20-20 15N 13C mass spectrometer. Chl a filters were placed in EtOH for extraction in the dark at room temperature overnight, after which the extracts were stored at −20 ∘C until fluorometric analysis with a Varian Cary Eclipse spectrofluorometer. A total of 300 µL of sample was added into a well plate, and the fluorescence was measured (excitation/emission: 430/670 nm). Fluorescence intensity was converted to chl a concentration using chl a standards (Sigma).
Nutrient samples were frozen immediately after sampling at −20 ∘C and stored frozen until measurement according to Grasshoff et al. (1999) using a Thermo Scientific Aquakem 250 photometric analyzer.
2.2.7 Statistical analyses
All statistical analyses were done using R version 3.6.1 (R Core Team, 2019) and figures using package ggplot2 (Wickham, 2016). Differences in variables between treatments (species) and among KPIs were analyzed using Welch's ANOVA, which allows for some difference in variance among treatments. If there was no trend in measurements of all the time points within a KPI, all the measurements were pooled for the statistical analyses. For cumulative variables (14C accumulation rate in DOC and in bacterial biomass), measurements at 12 h were used in the statistical analyses. For GPP, measurements at 4 h were chosen for statistical analyses (justified in results). Significant differences among KPIs were investigated using Games–Howell post hoc test (Peters, 2018). Differences in ANOVA were considered significant at a p<0.05. Results of all Welch ANOVA tests are given in Appendix B.
All multivariate analyses for bacterial community analysis were performed on the Bray–Curtis dissimilarity matrix derived from square-root transformed values. The bacterial community dynamics in the experiments was visualized with principal coordinate analysis (PCoA). To determine whether the bacterial communities differed significantly between different phytoplankton species, a PERMANOVA (permutational multivariate analysis of variance; Anderson, 2001) was performed using the function adonis (9999 permutations) in the R package vegan (Oksanen et al., 2019). Due to the lack of replicates, differences between phytoplankton treatments with seawater and control treatments could not be tested. The homogeneity of dispersion was tested using the function betadisper (9999 permutations) in the R package vegan (Oksanen et al., 2019). To determine the association between the environmental parameters and bacterial community composition, distance-based redundancy analysis (dbRDA) with 9999 permutations (capscale; Oksanen et al., 2019) was done. Significance of the model and the explanatory variables were tested with analysis of variance (ANOVA; Oksanen et al., 2019), using 9999 permutations. Biologically most relevant factors with a variance inflation factor less than 10 that were statistically significant (p<0.05) were chosen for the analysis (vif.cca; Oksanen et al., 2019). Bar plots and PCoA (Bray–Curtis dissimilarity) were made with phyloseq v. 1.26.1 (McMurdie and Holmes, 2013).
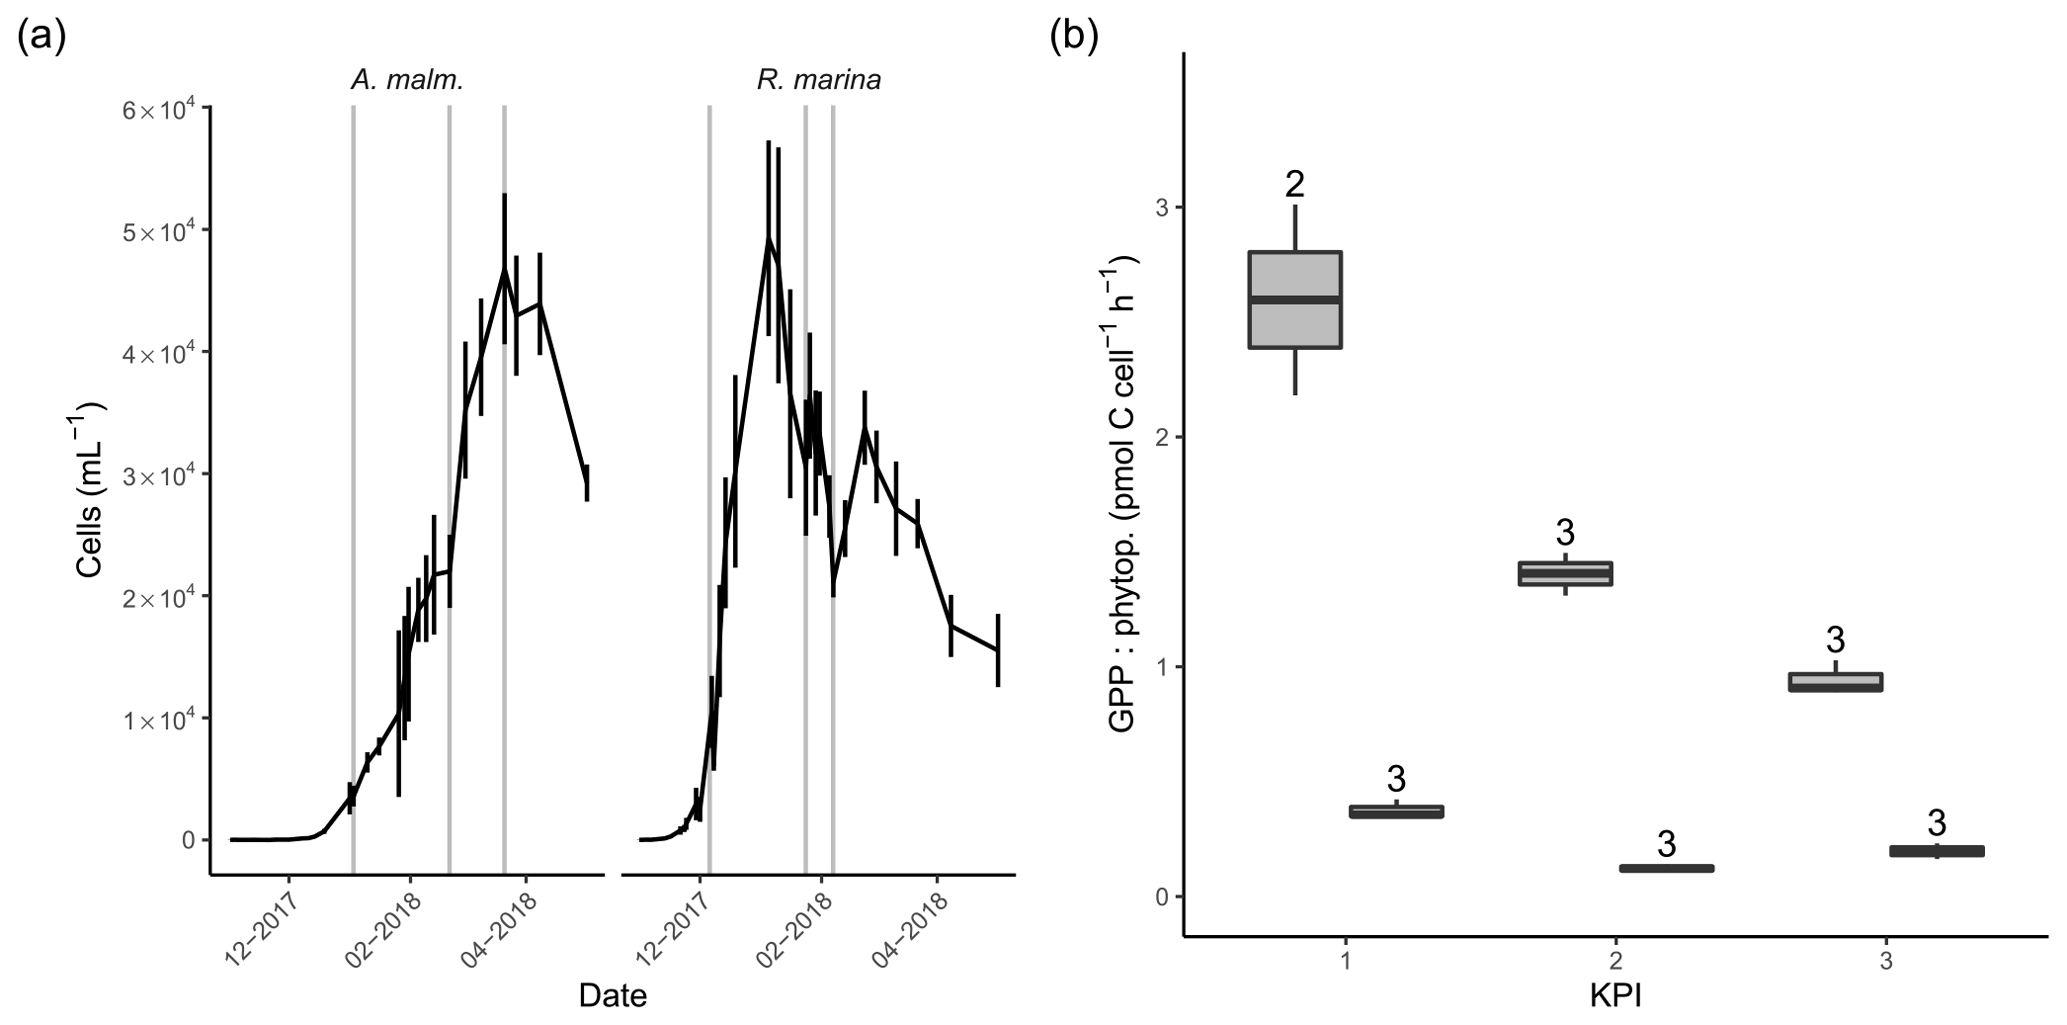
Figure 3(a) Abundance of phytoplankton (mean of three replicate treatments; error bars indicate 1 standard deviation) during the DOM release experiment. Vertical lines from left to right in each panel mark the times of the first, second, and third KPIs. (b) Cell-specific gross primary production in A. malmogiense (grey, left) and R. marina (white, right) treatments at each KPI. The number above the boxplots shows the number of measurements. Lower and upper hinges of boxes mark the first and third quartiles, respectively, while the whiskers extend to the lowest and the highest values within 1.5 times the interquartile range.
3.1 Phytoplankton growth and primary production
In the DOM release experiment R. marina grew faster to maximum density and ended the growth phase sooner than A. malmogiense (Fig. 3a). The average cell size of both phytoplankton species remained unchanged throughout the experiment, as indicated by the forward scatter results from flow cytometry (data not shown). There was no indication of N limitation during the experiment as nitrate concentrations remained high (Table A1). Phosphate was depleted in filtered A. malmogiense treatments but not in unfiltered treatments (Table A1), suggesting intracellular phosphate storing. We assumed this stored phosphate to be available to phytoplankton and bacteria and, consequently, their growth not being P limited. PP (gross, net, and cell specific) was higher in A. malmogiense treatments (Fig. 3b, Table B1).
The timing of KPIs aimed to capture comparable growth phases for these short incubations, but A. malmogiense cultures were still growing when spring bloom was closing in, so we had to initiate the measurements at earlier stages while the natural bacterial communities still resembled winter and spring communities (Fig. 3a).
In A. malmogiense treatments a second population distinguished by flow cytometry based on lower red fluorescence (chl a fluorescence) also started to grow at the same time as the main population (Table A1). This population grew linearly to about 15 % of maximum density of the main population. These were considered to possibly be cysts and were not included in A. malmogiense abundance in further analyses, although A. malmogiense does not usually produce cysts in the low temperature used in this study (Kremp et al., 2009). This decision brings a certain bias to the interpretation of the results, but we did relevant calculations with and without these cells and the results did not change significantly. We chose to exclude the group because we could not be certain of what the group consists of, and we wanted to avoid including, for example, cysts in the population of active A. malmogiense cells. We considered that doing the opposite would have introduced unknown distortion to our interpretation.
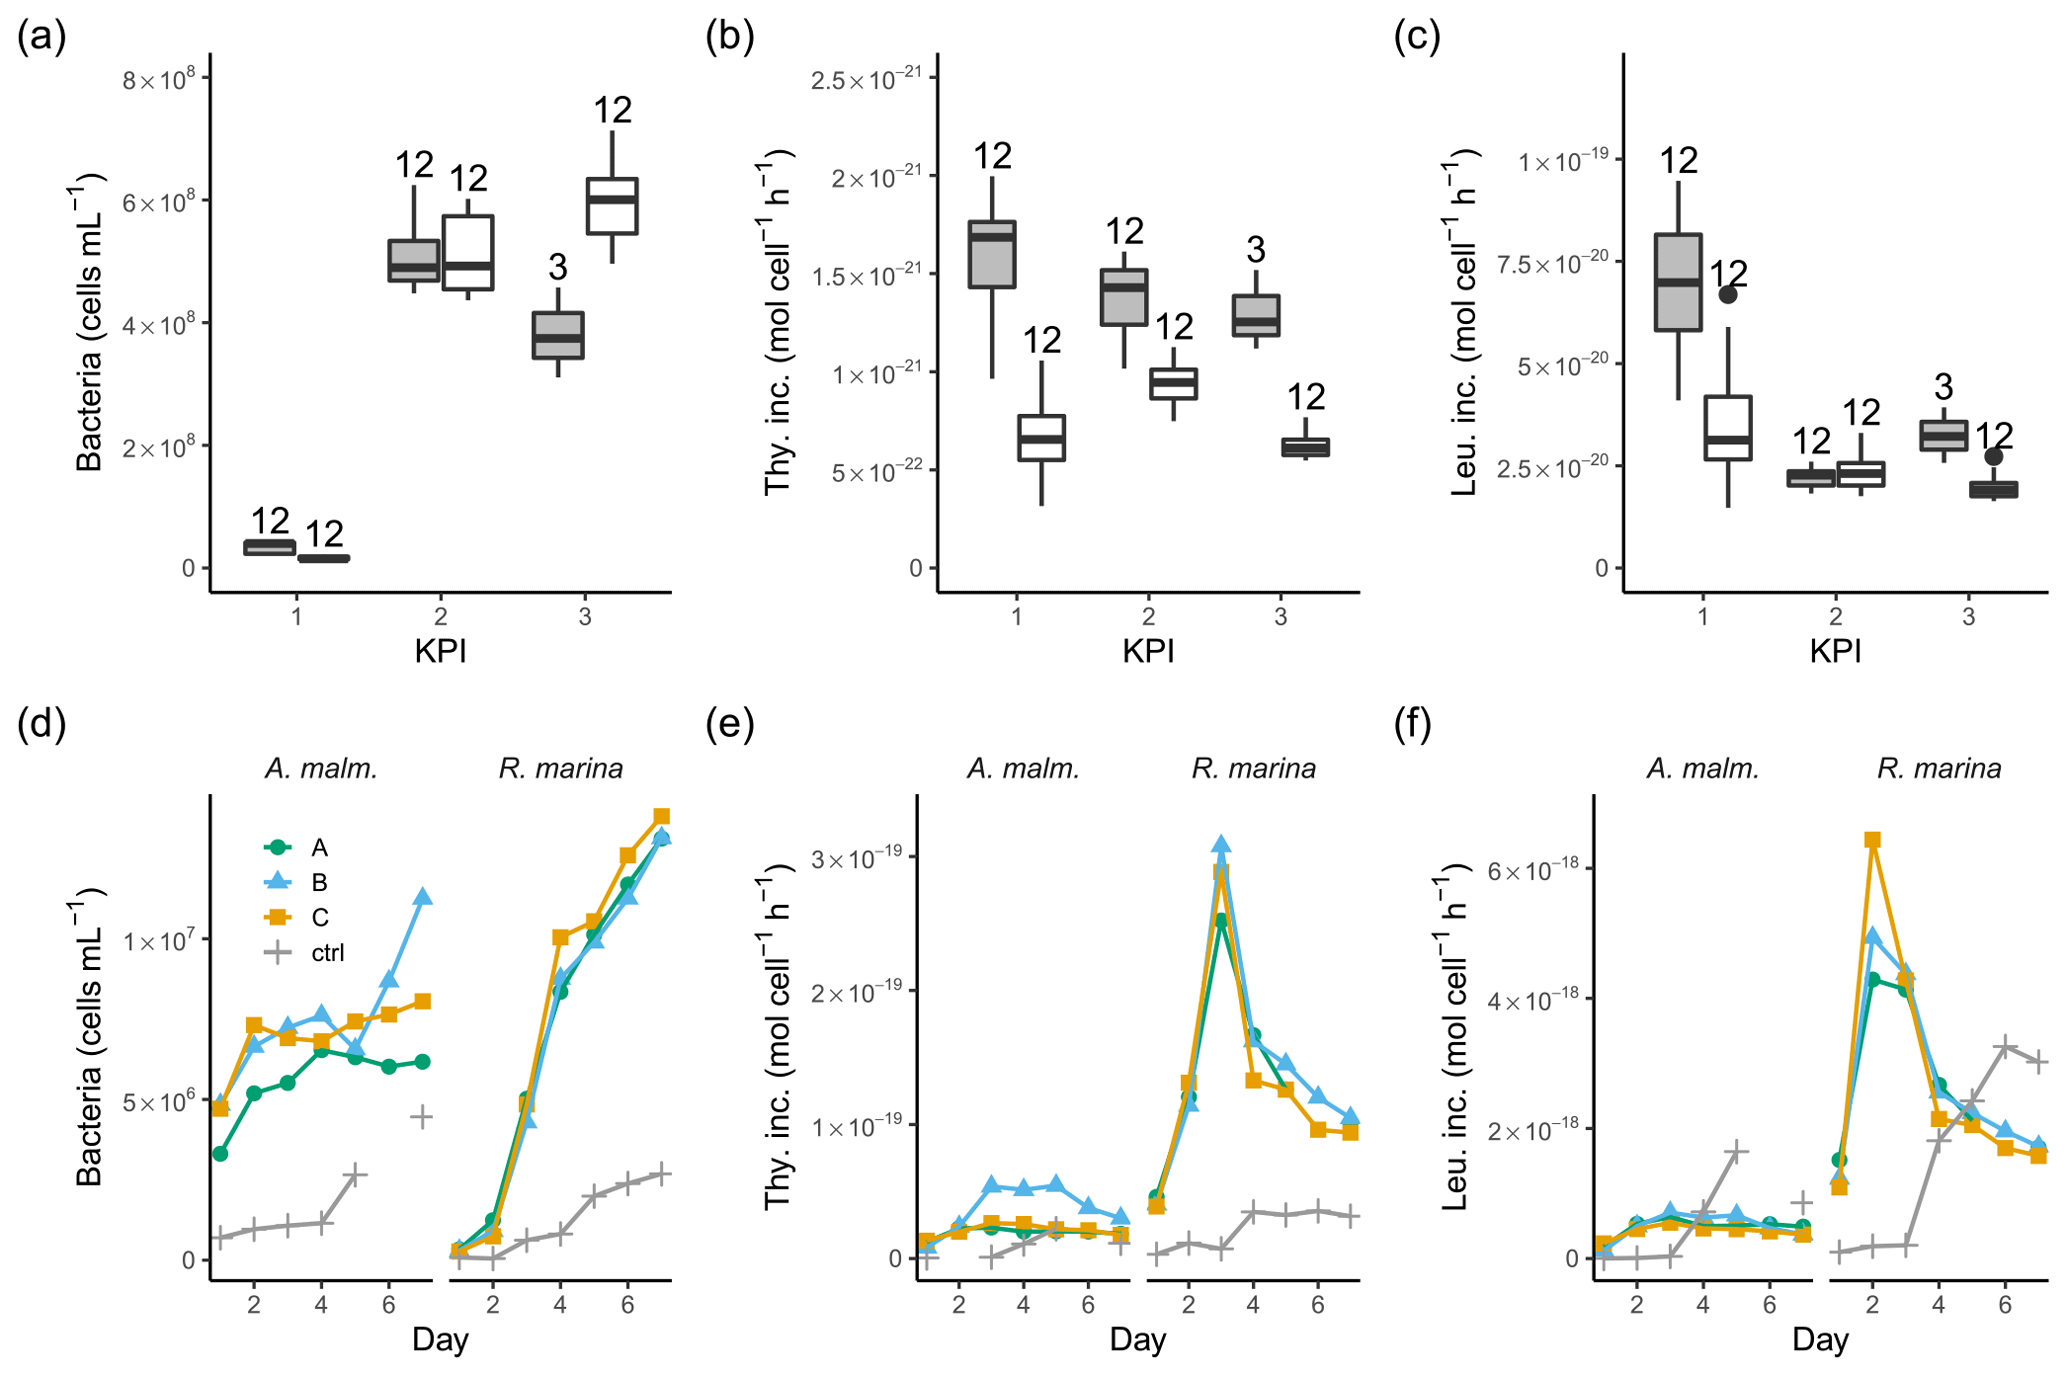
Figure 4Bacterial abundance (a, d), cell-specific bacterial thymidine (b, e), and leucine (c, f) incorporation at each KPI (0–12 h measurements pooled) in the DOM release experiment (boxplots) and in the DOM consumption experiment (line graphs). Lines A, B, and C mark different replicates (culture filtrate + seawater bacteria), and ctrl marks the control (F/2 + seawater bacteria). The number above the boxplots shows the number of measurements. Lower and upper hinges of boxes mark the first and third quartiles, respectively, while the whiskers extend to the lowest and the highest values within 1.5 times the interquartile range. Grey boxes (left) show A. malmogiense, and white boxes (right) show R. marina. Due to a measurement error only 12 h measurements of bacterial abundance are available in A. malmogiense treatments at the third KPI.
3.2 Bacterial production and 14C transport
In the DOM release experiment differences in bacterial abundance between the phytoplankton were modest at each KPI (Fig. 4a, Table B1). The ratio of bacteria to phytoplankton was between 1×10⁴ and 3×10⁴ most of the time except at the first KPI for R. marina, when it was much lower (Tables A1, B1). Thymidine incorporation was slightly higher in A. malmogiense treatments at each KPI (Fig. 4b, Table B1; see Table A1 for BP), while leucine incorporation was of equal magnitude between the species, except at the first KPI (Fig. 4c, Table B1). As a result, the ratio of leucine to thymidine incorporation was higher in R. marina treatments at the second and third KPIs (Table A1, B1). In the DOM consumption experiment, bacterial abundance increased considerably faster, and thymidine and leucine incorporation was higher in R. marina treatments than in A. malmogiense treatments (Fig. 4d–f; see Fig. A2 for BP). These observations from both experiments suggest that the R. marina community can support a more productive bacterial community in proportion to PP.
A. malmogiense cells were more efficient in incorporating DIC (i.e., higher PP, Fig. 3b), but they also respired more than R. marina cells, as shown by higher cell-specific community respiration in the DOM release experiment (Fig. 5a, Table B1). In the DOM consumption experiment, cell-specific BR was higher in R. marina treatments (Fig. 5b). Although BP was higher in R. marina treatments, the lower BR in A. malmogiense treatments led to comparable BGE in both treatments (Fig. 5c). Since BR was consistently higher in R. marina treatments (DOM consumption experiment) and the ratio of bacteria to phytoplankton cells was higher in the A. malmogiense treatments only at the first KPI (DOM release experiment, Table A1), the higher cell-specific community respiration in A. malmogiense treatments is likely mainly caused by respiration of phytoplankton.
14C-DOC, originating from 14C-NaHCO3, was produced by both species at each KPI (Fig. A3). 14C originating from 14C-NaHCO3 was incorporated in bacterial biomass at the second and third KPIs. There were considerable uncertainties with this measurement: 14C-DOC was also produced in dark controls and surprisingly much at the first KPI compared to the latter KPIs when phytoplankton biomass was much higher (Fig. A3). Regardless, these uncertainties concern both phytoplankton species, so we consider the analysis to be suitable for comparing the species, despite uncertainties in the absolute quantities of 14C in different compartments. Higher PP of A. malmogiense led to a higher fraction of 14C-NaHCO3 pool being incorporated into phytoplankton biomass compared to R. marina (Table 2). However, a larger fraction of PP ended in filtrate in R. marina treatments (Table 2). In R. marina treatments, a larger fraction of 14C-organic matter was also incorporated into bacterial biomass at the second and third KPIs (Table 2), although the difference was very small at the third KPI (at the first KPI no activity was detected in R. marina treatments so comparisons could not be made). Of all the 14C that was fixed by PP, about 5 and 4 times more ended up in bacterial biomass in R. marina treatments at the second and third KPIs, respectively (Table 2).
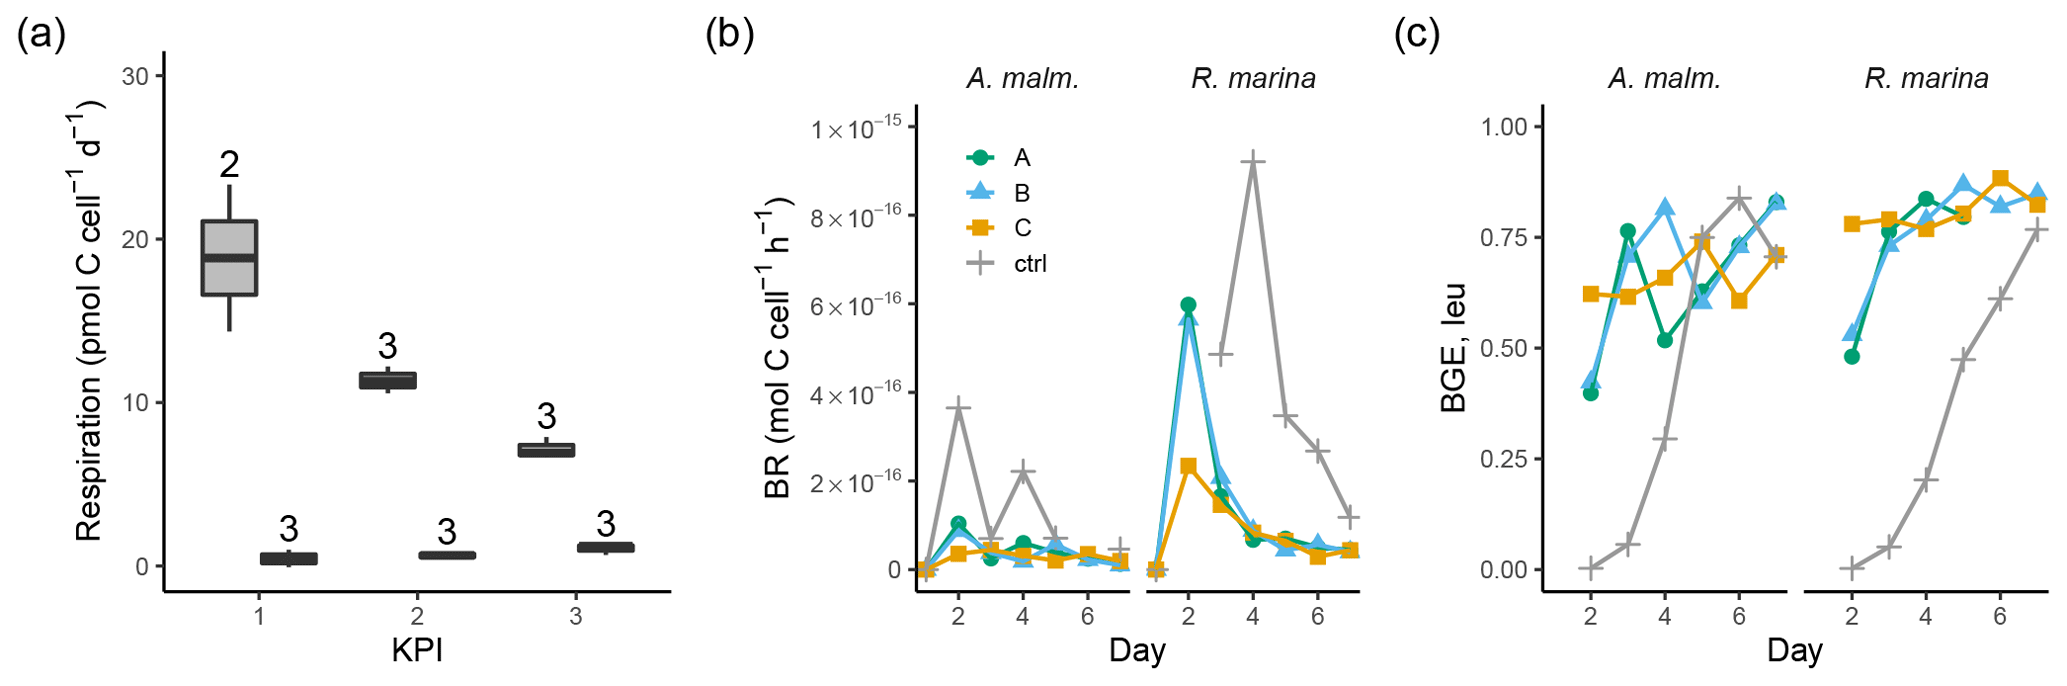
Figure 5(a) Community respiration divided by phytoplankton abundance in A. malmogiense treatments (grey, left) and R. marina treatments (white, right) at each KPI in the DOM release experiment. Cell-specific BR (b) and BGE calculated from leucine incorporation-based BP (c) in the DOM consumption experiment. Lines A, B, and C mark different replicates (culture filtrate + seawater bacteria), and ctrl marks the control (F/2 + seawater bacteria). The number above the boxplots shows the number of measurements. Lower and upper hinges of boxes mark the first and third quartiles, respectively, while the whiskers extend to the lowest and the highest values within 1.5 times the interquartile range.
Table 2Flow of 14C originating from 14C-NaHCO3 between different phases of the C cycle. Numbers are percentages of 14C accumulation rates between the phases indicated in the left column (PP : DIC is an exception as PP is a rate but DIC is a concentration). Stars indicate the significance (p values) at the side of the significantly higher percentage between species at the corresponding KPI, compared with Welch's ANOVA ( <0.001, <0.01, * <0.05). Welch ANOVA results are presented in Table B2.
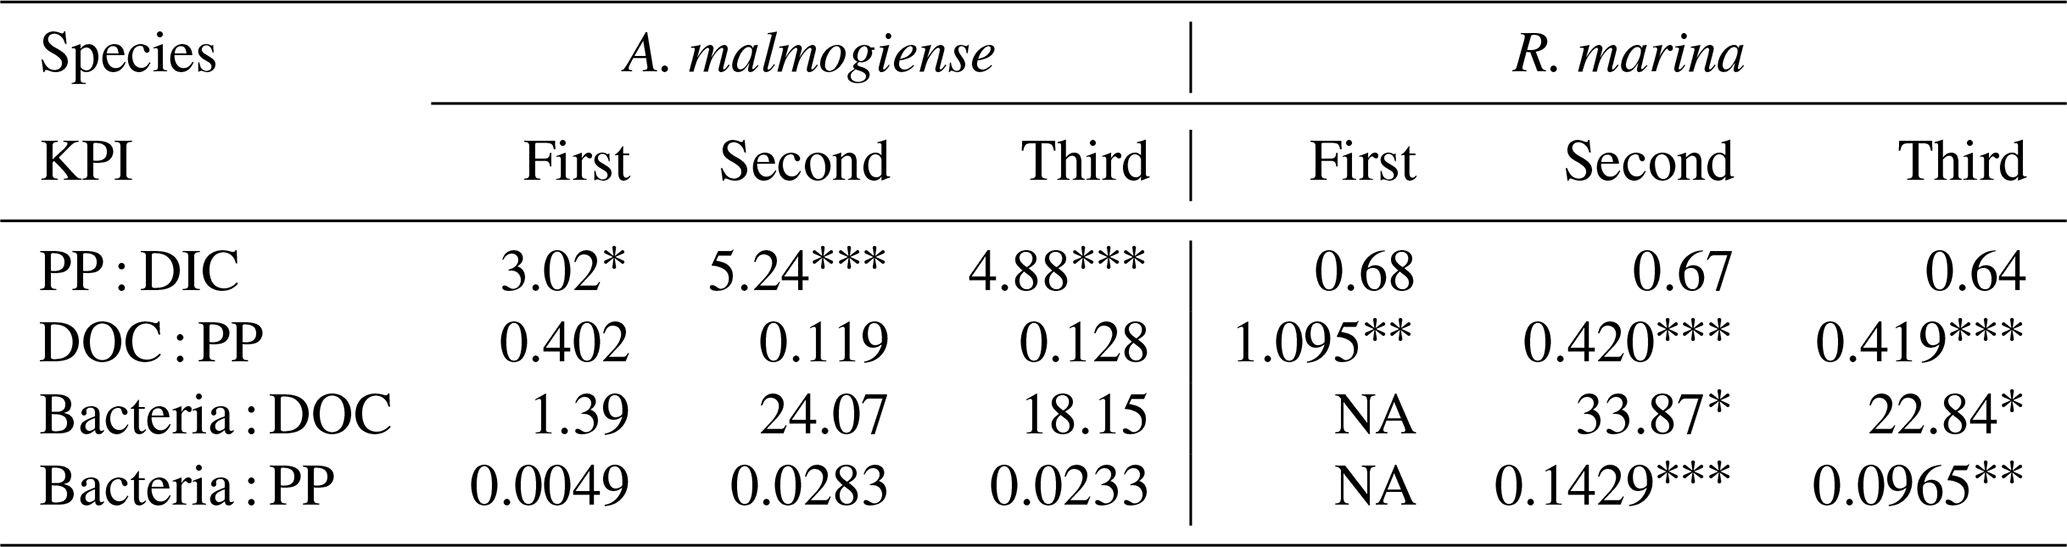
NA: not available.
3.3 Bacterial community
In both experiments, bacterial communities resembled those in the cultures and were distinct from the seawater community (bacterial inoculum), suggesting that the addition of seawater bacteria had a negligible contribution to the composition of the total bacterial community (Fig. 6).
In the DOM release experiment classes, Alphaproteobacteria, Gammaproteobacteria, and Bacteroidia predominated the bacterial communities (Fig. 6). Alphaproteobacteria increased and Gammaproteobacteria decreased from the first KPI to the second KPI, whereas Bacteroidia had its peak at the second KPI. The relative share of different classes differed between the treatments: Bacteroidia (average: 45.6 %, genera Algoriphagus and Polaribacter) and Alphaproteobacteria (average: 44.7 %, genera Pseudorhodobacter and Sphingorhabdus) were the most abundant classes in A. malmogiense treatments while Alphaproteobacteria (average: 49.9 %, genus Pseudorhodobacter) and Gammaproteobacteria (average: 38.8 %, genus Rheinheimera and RS62 marine group) predominated in the R. marina treatments. Interestingly, the class Actinobacteria (average: 2 %, genus Candidatus Aquiluna) appeared in A. malmogiense treatments and slightly increased along the experiment. Bacterial communities in both phytoplankton treatments changed between the KPIs (PCoA, Fig. 7a, c). There were also differences in bacterial communities between the phytoplankton species in relation to selected environmental variables: thymidine-based BP correlated with A. malmogiense at the second and third KPIs whereas aCDOM(254) and S275−295 correlated with R. marina at the second and third KPIs (Fig. 7c). In total, dbRDA axes 1 and 2 explained 51.33 % of the variation in bacterial community analysis.
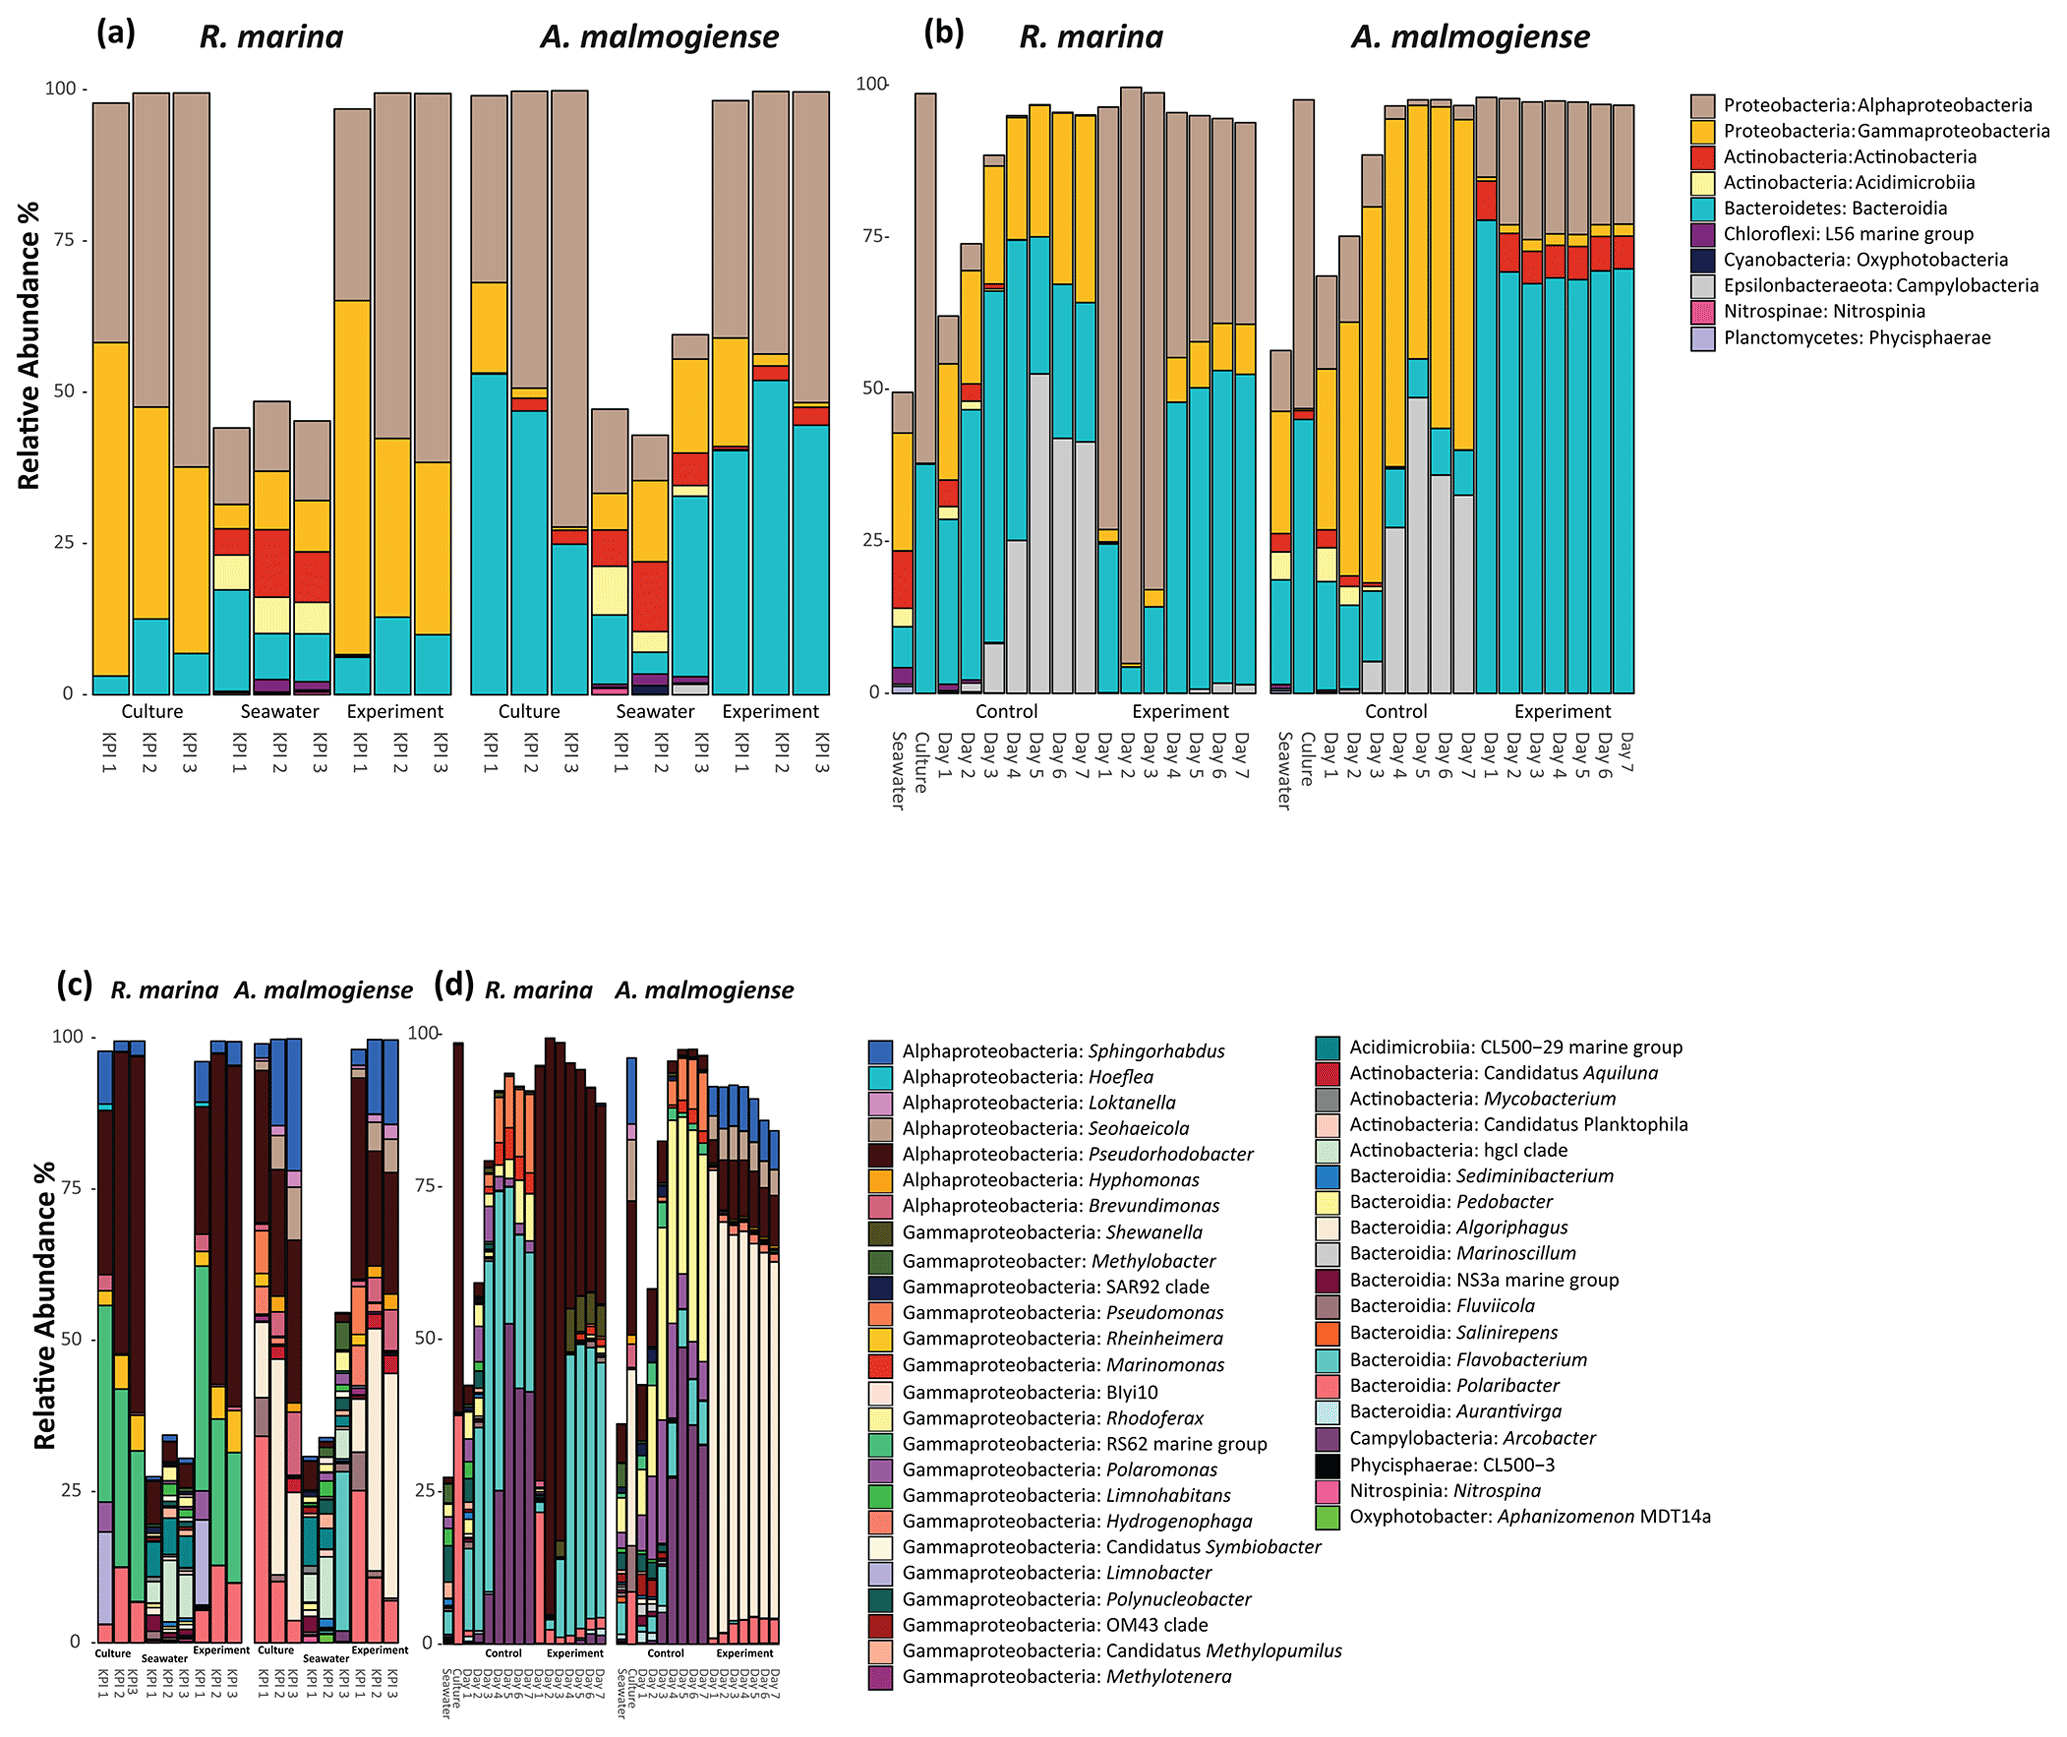
Figure 6Class-level (upper panels) and genus-level (lower panels) bacterial diversity of 16S ribosomal RNA (rRNA) gene sequences representing >1 % of all amplicon sequence variants (ASVs) in the DOM release experiment (a, c) and in the DOM consumption experiment (b, d). (a, c) The bars labeled control refer to cultures before the addition of bacterial inoculum. (b, d) The bars labeled control refer to the control treatments (F/2 + seawater bacteria).
In the DOM consumption experiment class Bacteroidia (average: 70 %, genera Algoriphagus and Polaribacter) and Alphaproteobacteria (average: 19.9 %, genera Pseudorhodobacter, Sphingorhabdus, and Seohaeicola) predominated bacterial communities in A. malmogiense treatments (Fig. 6). Congruently with the DOM release experiment, the class Actinobacteria (average: 5.7 %, genus Candidatus Aquiluna) was present throughout the experiment. In the small share of the class Gammaproteobacteria (average: 1.7 %), the most abundant were the order Betaproteobacteriales (genera Hydrogenophaga, Kerstersia, Limnobacter, Methylotenera). In R. marina Alphaproteobacteria (day 1–3 average 82 %, genus Pseudorhodobacter) predominated the bacterial communities until day 3, after which they began to decrease (day 4–7 average: 36.1 %) and Bacteroidia (day 4–7 average: 49.9 %; genus Flavobacterium) increased. Also, Gammaproteobacteria increased slightly towards the end of the experiment (day 4–7 average: 7.7 %, genera Shewanella, Marinomonas, and Polynucleobacter). In R. marina, bacterial community composition changed with time (PCoA, Fig. 7b). Bacterial communities differed significantly between the different phytoplankton treatments (adonis: R2=0.67, p<0.001), but due to the tight grouping in A. malmogiense, the homogeneity of variance was violated (betadisp: p>0.05, Fig. 7d). However, because groups were not overlapping, it can be assumed that the observed differences are true. The shift in bacterial community was also observed in relation to selected environmental parameters: bacterial communities on days 1–3 correlated with peak T and aCDOM(254), whereas on days 4–7 they correlated with thymidine-based BP (Fig. 7d). In total, dbRDA axes 1 and 2 explained 68.89 % of the variation in bacterial community analysis.
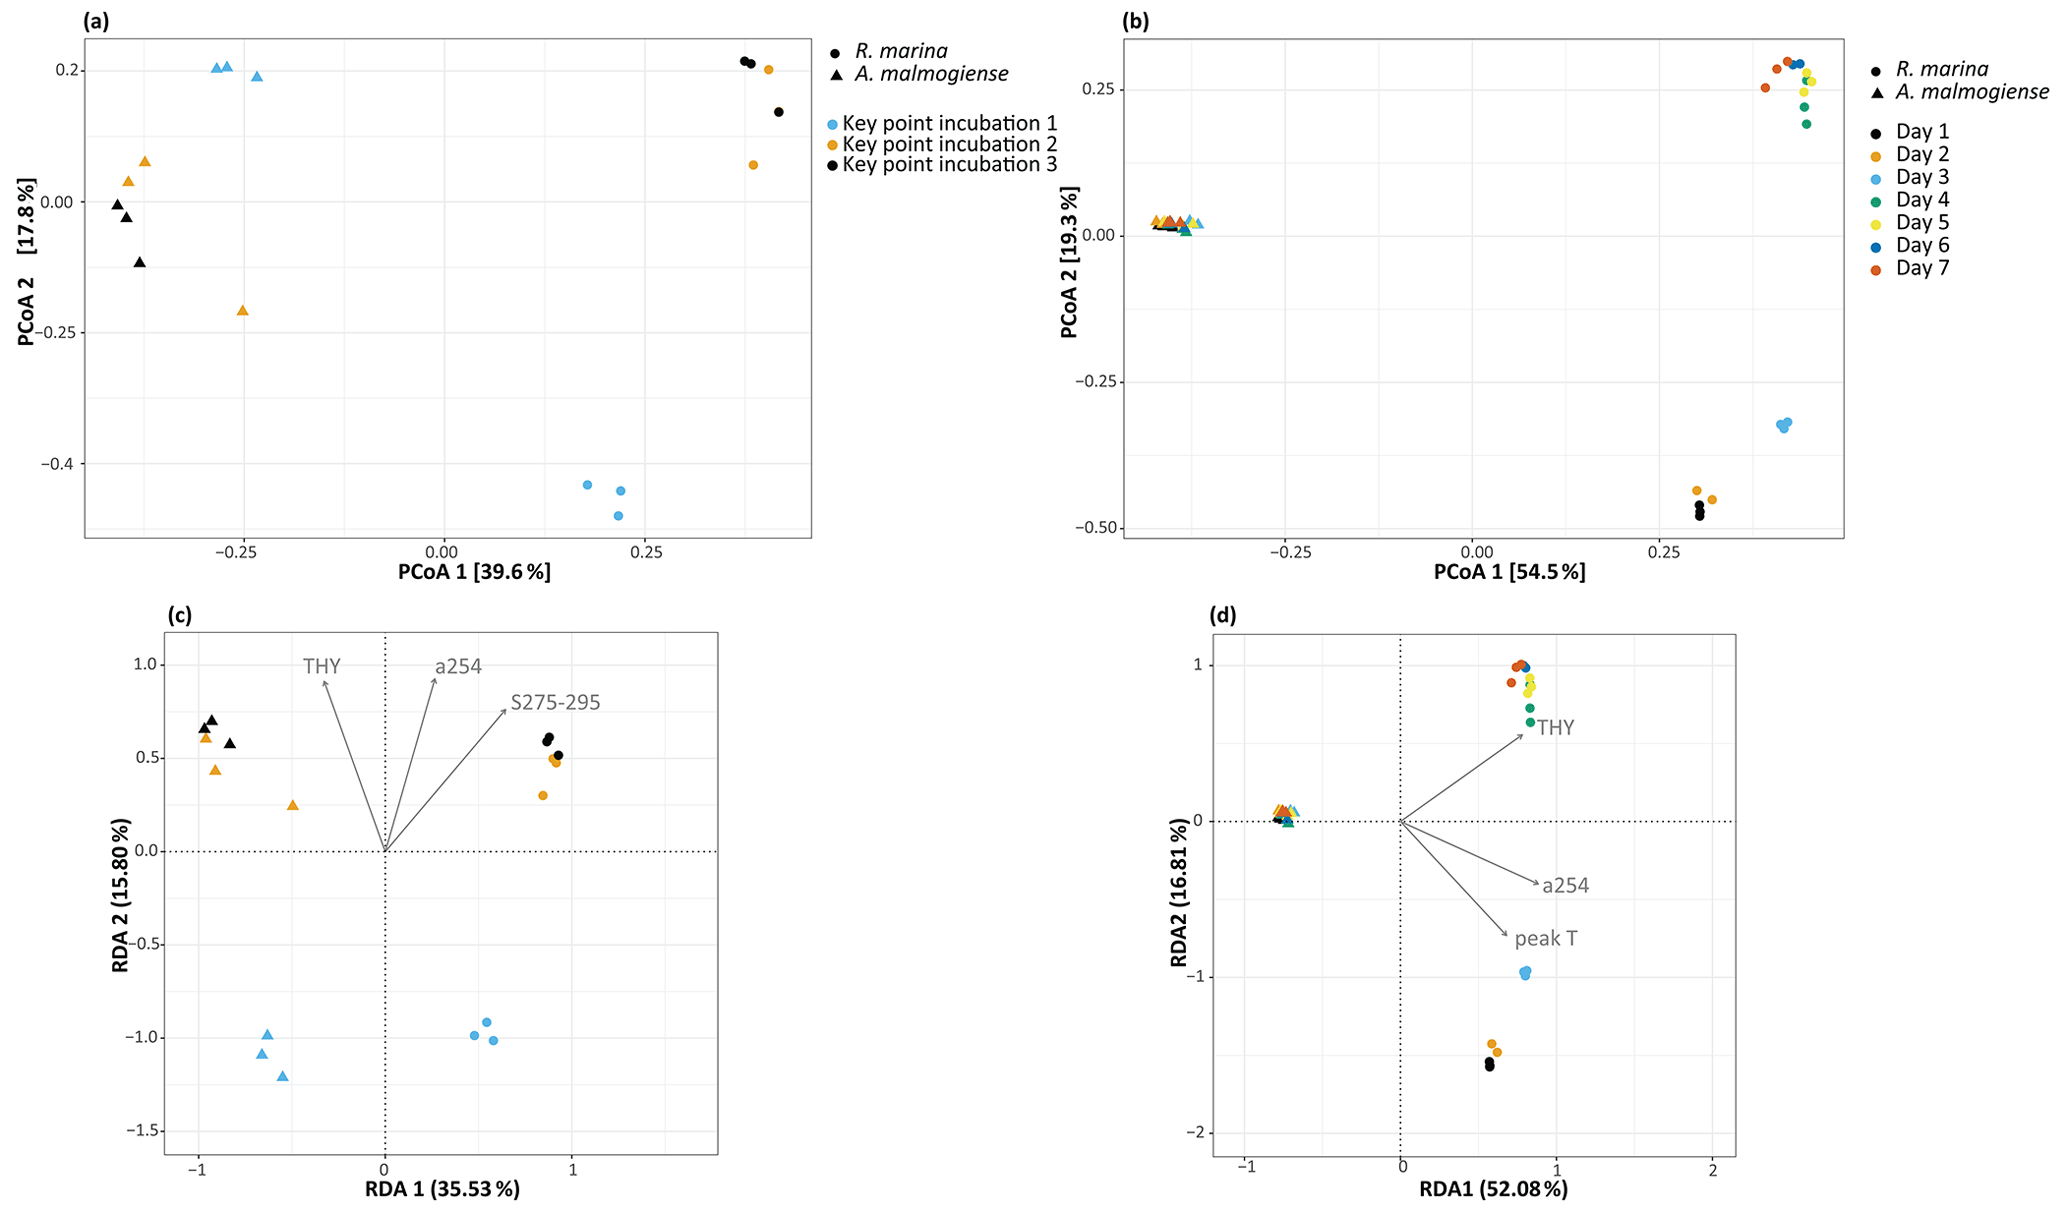
Figure 7(a, b) Principal coordinate analysis plots showing bacterial community dynamics in different experiments and (c, d) dbRDA biplots showing the relationship between bacterial communities and selected significant environmental variables (ANOVA, p<0.05) in the DOM release experiment (a, c) and DOM consumption experiment (b, d). THY: thymidine based bacterial production; a254: aCDOM(254); S275−295: S275−295.
In the control treatments of the DOM consumption experiment (seawater inoculum + growth media) bacterial communities were comparable with the seawater community in the beginning of the experiment in both experimental treatments but later developed into cultures which were different from communities in both seawater and experimental treatments (Fig. 6). Interestingly, the class Campylobacteria (genus Argobacter), which was not abundant in either of the phytoplankton treatments, began to increase in both control treatments on day 4 (Fig. 6b, d).
3.4 DOM transformations
During the DOM release experiment DOC concentrations increased in both phytoplankton treatments; however, only a very small increase from the second to third KPIs was observed in R. marina treatments (Fig. 8a). DOM absorbance and fluorescence generally started to increase when the phytoplankton started to grow (Fig. 8, Fig. A1). The general trend was the accumulation of lower-molecular-weight molecules and potentially more refractory molecules, as seen by the increase in aCDOM(254), S275−295, humic-like DOM peak C, and HIX. S275−295, peak C, and HIX increased faster in R. marina treatments (Table B1). While aCDOM(254) increased in both species during the experiment, DOC-normalized absorbance at 254 nm (Weishaar et al., 2003) increased slightly in R. marina treatments, whereas it decreased in A. malmogiense treatments (Table A1). This suggests that the increase in aCDOM(254) in R. marina treatments was caused mainly by the increase in DOC absorbing in UV region with relatively higher intensity than the bulk material, whereas in A. malmogiense treatments the increase in aCDOM(254) was caused by increased absorbance due to higher bulk DOC concentration. This was also supported by the 3 times higher aCDOM(254) production by R. marina when the aCDOM(254) consumption by bacteria during the DOM consumption experiment is subtracted from the net accumulation of aCDOM(254) in the DOM release experiment.
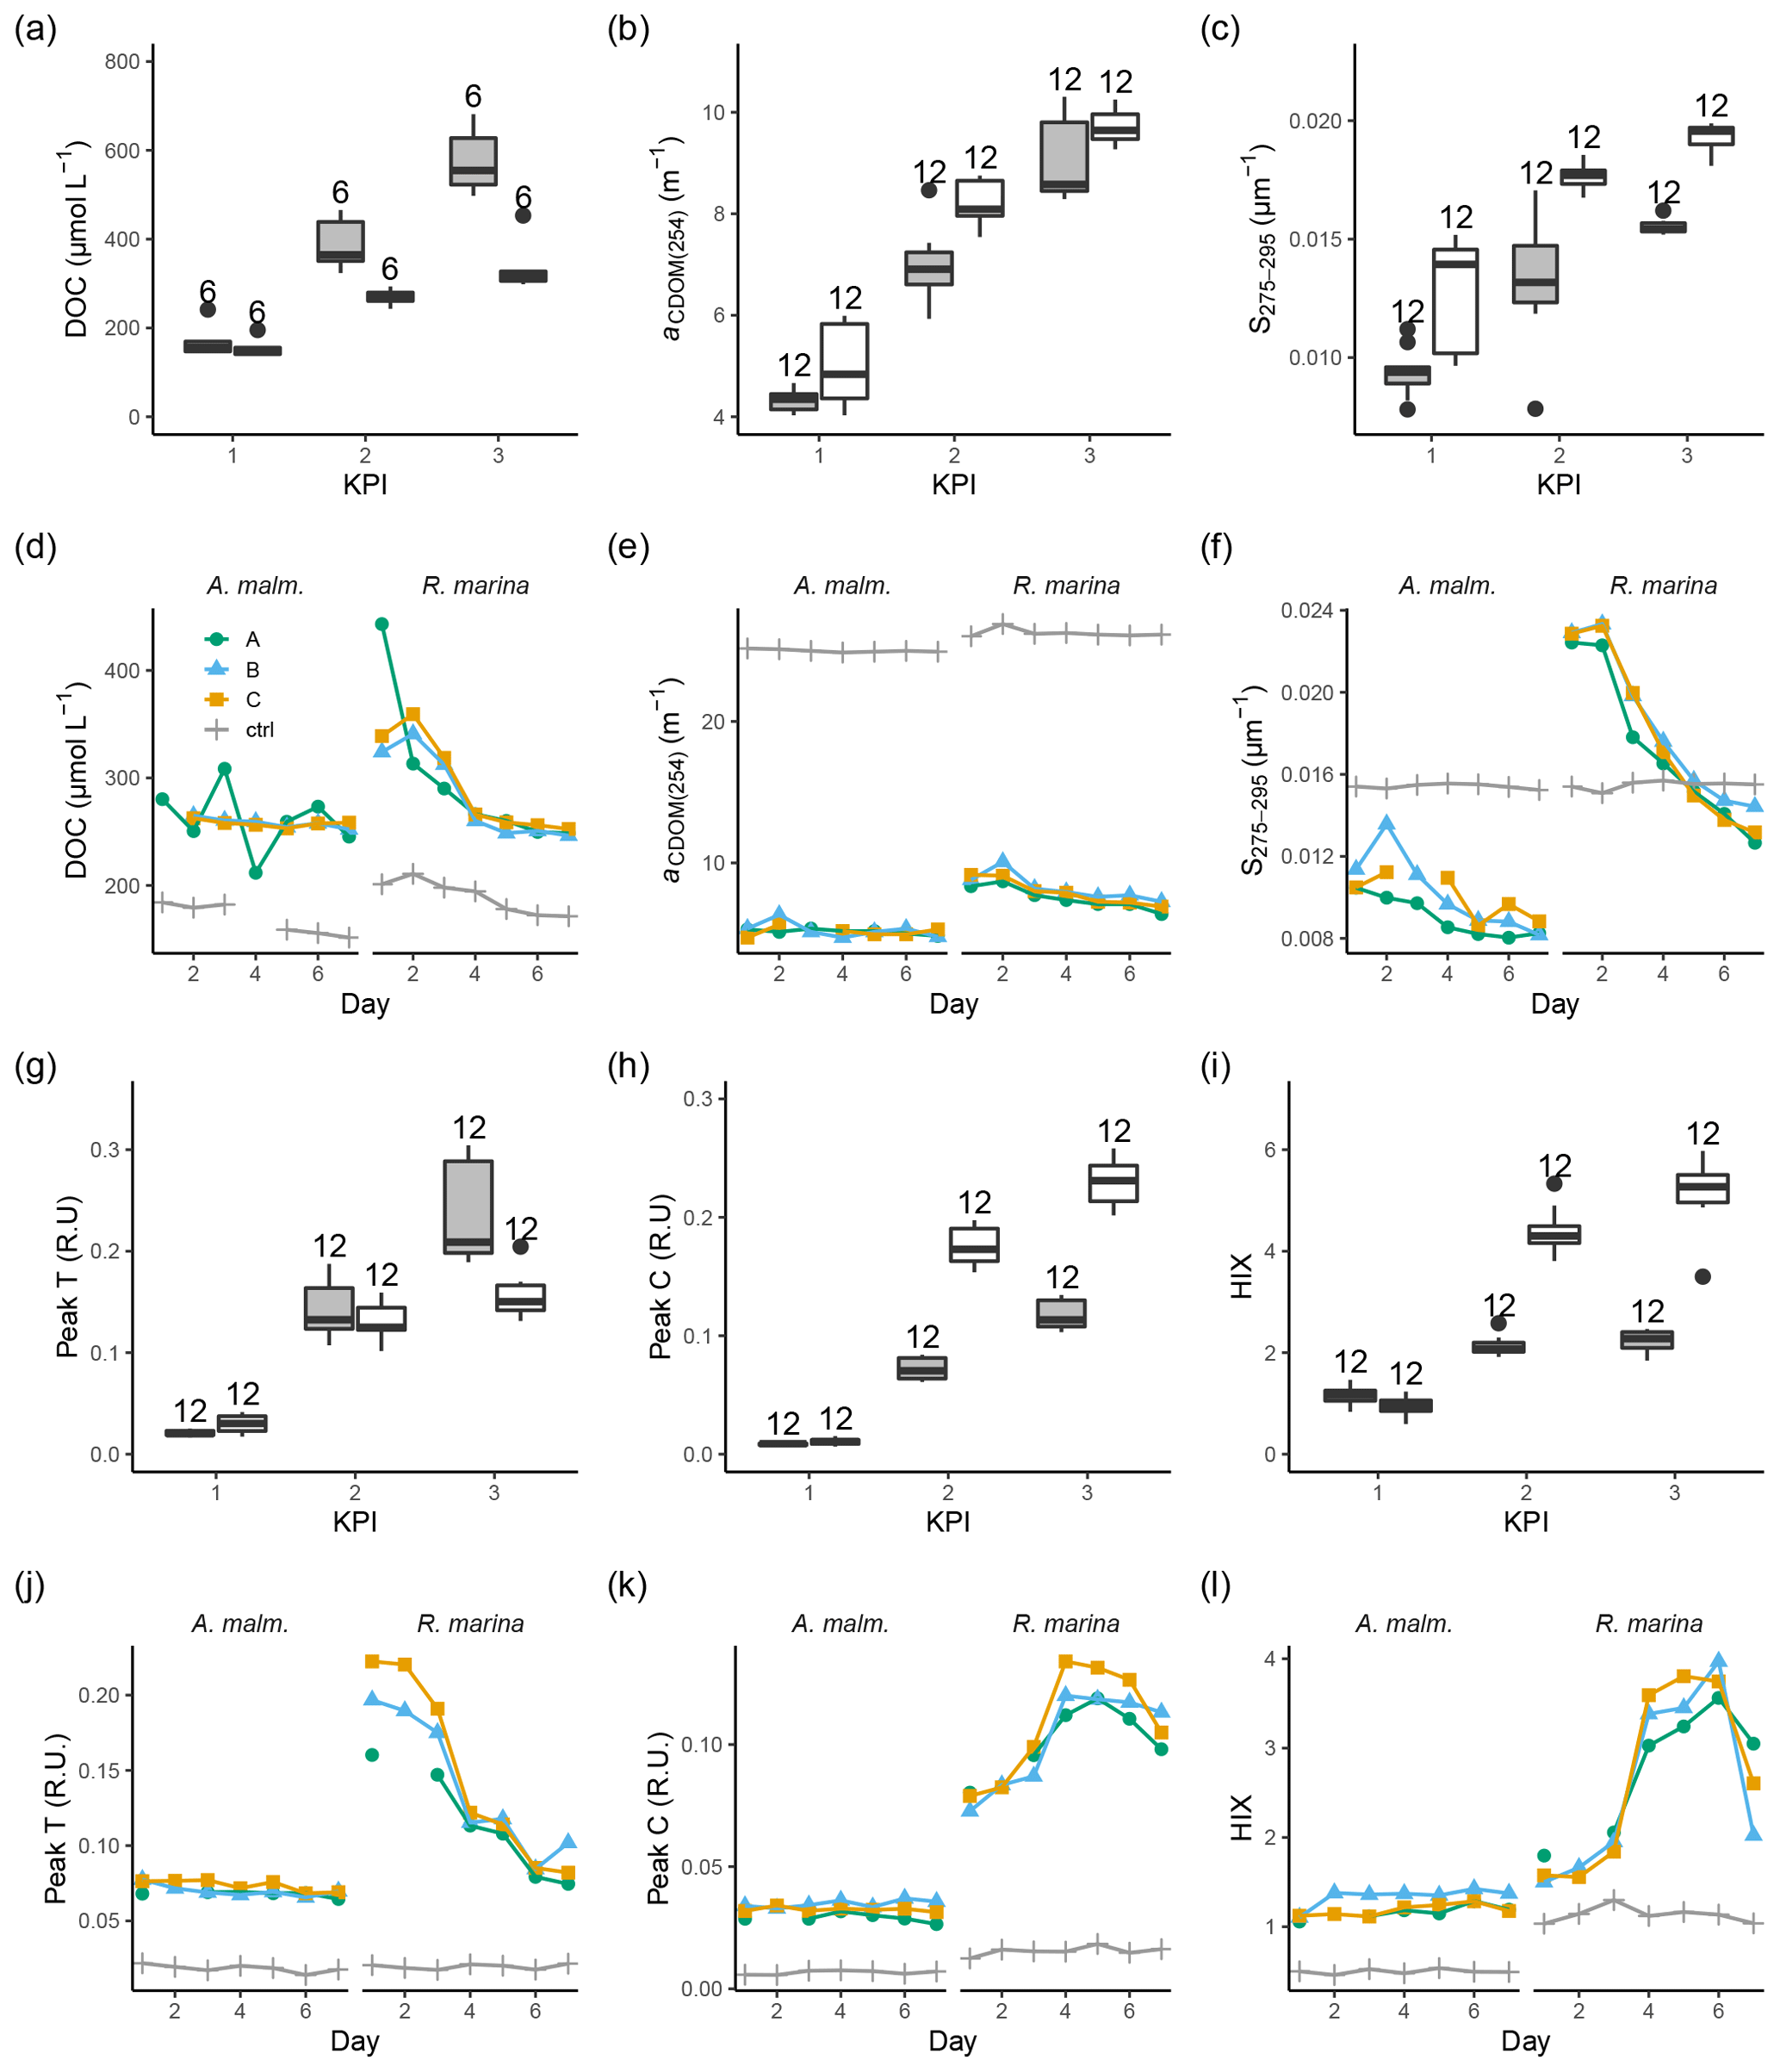
Figure 8DOC concentration (a, d), absorbance coefficient at 254 nm (b, e), spectral slope between 275 and 295 nm (c, f) fluorescence peaks T (g, j) and C (h, k), and humification index (i, l) at each KPI (0–12 h measurements pooled) in the DOM release experiment (boxplots) and in the DOM consumption experiment (line graphs). Lines A, B, and C mark different replicates (culture filtrate + seawater bacteria), and ctrl marks the control (F/2 + seawater bacteria). The number above the boxplots shows the number of measurements. Lower and upper hinges of boxes mark the first and third quartiles, respectively, while the whiskers extend to the lowest and the highest value within 1.5 times the interquartile range. Grey boxes (left) show A. malmogiense, and white boxes (right) show R. marina. Optical variables not included in the detailed analysis are presented in Fig. A1 and Table A1 (DOM release experiment) and Fig. A2 (DOM consumption experiment).
While PP (Fig. 3b) and DOC accumulation (Fig. 8a) are both higher in A. malmogiense treatments during the DOM release experiment, the difference in PP between the phytoplankton treatments is higher than the difference in DOC accumulation at corresponding KPIs. Thus, it can be assumed that a relatively larger share of fixed C is directed to respiration by A. malmogiense, as also suggested by higher community respiration (Fig. 5a), and to DOC release by R. marina. This is also supported by the higher 14C-DOC production relative to PP in R. marina treatments (Table 2). These results also suggest that DOM released by R. marina is more bioavailable to bacteria than DOM released by A. malmogiense and that the microbial loop is favored more strongly when DOM originates from R. marina.
At the beginning of the DOM consumption experiment DOC concentrations were comparable between the two phytoplankton treatments and higher than in the control treatments (Fig. 8d), indicating that considerable DOC production by phytoplankton had occurred in both treatments despite the difference in the phytoplankton abundance before the start of the incubation (R. marina: ∼ 9×10⁴ cells mL−1, A. malmogiense: ∼ 1×10⁴ cells mL−1). During the incubation the DOC concentration did not change much in A. malmogiense treatments but decreased in R. marina treatments, especially during the first 4 d.
Contrary to the DOM release experiment, in the DOM consumption experiment DOM absorbance decreased during the incubation, although often no clear change could be detected in A. malmogiense treatments (Fig. 8, Fig. A2). Peak C and HIX increased at first, as in the DOM release experiment, but started to decline at day 4 (Fig. 8k, l). Likely in the DOM release experiment the continuous production of fresh DOM by phytoplankton supplied the bacteria with bioavailable DOM, that was consumed and transformed to more refractory, UV-absorbing material. In the DOM consumption experiment the phytoplankton were no longer present as a fresh DOM source, so the bacteria started to use the more refractory material. This would also explain the bell-shaped curves (increase until day 4 and then decrease) of peak C and HIX in the DOM consumption experiment. Until day 4 the bacteria still used more bioavailable material which was left from the phytoplankton and converted it to optically active molecules, but on day 4 this material ran out and the bacteria switched to consuming more refractory, optically active material.
Species-specific differences in carbon cycling were found in both experiments: in the DOM release experiment, where simultaneous processing of DOM by phytoplankton and bacteria were investigated, and in the DOM consumption experiment, where bacterial DOM processing was investigated. Differences were clear at every level of carbon cycling: PP, flow of 14C from DIC to bacterial biomass, optical properties of DOM, and the response in the bacterial community. A. malmogiense displayed higher PP and higher community respiration and, based on the optical properties of DOM and the composition of the bacterial community, produced relatively less labile DOM than R. marina. R. marina, instead, displayed lower PP but produced more labile DOM, which supported a more productive bacterial community with a higher proportion of copiotrophs.
4.1 DOC production, transformation, and consumption
In the DOM production experiment the trends in DOC concentration and optical DOM characteristics were similar between the two phytoplankton treatments through KPIs 1–3, suggesting that there was no qualitative shift from production to consumption of any DOM fraction detected by the optical methods. As this was true for both species even though the cultures were not at the same growth phase at each KPI, the observed changes in the optical DOM properties were likely more related to the age of the culture than to growth phases. Of course, the optical method does not detect changes in the concentrations of optically inert molecules, such as simple carbohydrates, and there may have been growth-phase-dependent changes in their production (Chen and Wangersky, 1996; Urbani et al., 2005). We recognize the bias caused by measuring the two phytoplankton cultures at different growth phases; the DOM processing in the two phytoplankton treatments might have been more similar if the KPI incubations and the initiation of the DOM consumption experiment had been initiated at the same growth phases. But with the previously presented reasoning, we concluded that comparing the two phytoplankton treatments would show real differences in DOM processing of these species.
The decline in the abundance of R. marina was not fast or linear, and occasionally abundance increased again, suggesting that conditions were still quite favorable for R. marina during all KPIs. The resumption of growth might have been due to the cells turning to heterotrophy, as some Rhodomonas species are known to be mixotrophs (Ballen-Segura et al., 2017). As nutrient limitation was most likely not significant, C limitation could be another possible cause for population decline and a switch to support growth with heterotrophy. Total dissolved C was high in both R. marina and A. malmogiense treatments even at the third KPI, but since pH was not measured the relative fractions of different forms of inorganic C are not known. To our knowledge, the capacity of A. malmogiense to use different forms of inorganic C is not known, but many dinoflagellates are able to use bicarbonate (Nimer et al., 1997), suggesting that A. malmogiense was likely not C limited. The potential for C limitation of R. marina is not clear since the use of different forms of inorganic C by R. marina is not known. Some Rhodomonas species use only free CO2 (Elzenga et al., 2000), while some also seem to use bicarbonate (Camiro-vargas et al., 2005).
Optical characteristics of DOM revealed potential sources and consumption patterns in the experiments. Usually fluorescence peak T is interpreted as a proxy for bioavailable DOM (Nieto-Cid et al., 2006), but it increased in both treatments together with the signals for potentially less labile DOM (e.g., S275−295, peak C and HIX) throughout the DOM release experiment. An increase in protein-like DOM fluorescence has been connected to phytoplankton growth during simulated (Stedmon and Markager, 2005) and natural (Suksomjit et al., 2009) phytoplankton blooms, but bacterial processing can decrease protein-like fluorescence while increasing humic-like fluorescence (Romera-Castillo et al., 2011; Yamashita and Tanoue, 2004b). Therefore, simultaneous increases in peaks T and C likely occurred because of (1) excess production of protein-like DOM by phytoplankton, (2) production of less labile protein-like DOM by phytoplankton, (3) production of protein-like DOM by bacteria, or combinations of these. Not all protein-like DOM fractions are equally degradable (Yamashita and Tanoue, 2004a), and some protein-like FDOM can accumulate in the pelagic environment (Asmala et al., 2018; Yamashita et al., 2017). Production of peak T by bacteria might be due to bacterial reworking of initially labile (non-colored) autochthonous DOM into small, UV-absorbing molecules (Asmala et al., 2018; Berggren et al., 2009). In the case of R. marina, this could possibly result from the bacterial consumption of monosaccharides, which R. marina can produce in high amounts (Fernandes et al., 2017), as several bacterial species have been shown to produce peak T when grown on glucose (Fox et al., 2017).
Just like the simultaneous increase in most optical DOM variables in the DOM release experiment, the decrease in most of the FDOM variables towards the end of the DOM consumption experiment is surprising, given that bacterial processing of phytoplankton-derived DOM is usually connected to an increase in FDOM (Romera-Castillo et al., 2011). The high abundance of Pseudorhodobacter might explain part of this as Rhodobacteraceae have been connected to reduced FDOM intensities when using dinoflagellate-derived DOM (Tada et al., 2017). Bacteria may also change from a net source of protein-like FDOM to a net sink as bacterial activity increases (Guillemette and del Giorgio, 2012). This is in agreement with the decreasing peak T during the DOM consumption experiment, as the higher temperature used in the DOM consumption experiment may have directly enhanced bacterial activity. Guillemette and del Giorgio (2012) also showed that production of humic-like FDOM increases with increasing BGE, which is in line with the increase in humic-like peak C and HIX concurrent with BGE until day 4, although after that the FDOM signals decreased while BGE did not. The change in DOM processing patterns on day 4, which was suspected to have been caused by the depletion of fresh labile DOM originating from phytoplankton, was also interesting because the production of humic-like DOM should increase when bacteria shift from processing labile DOM to semi-labile DOM (Jørgensen et al., 2015).
The overall differences between A. malmogiense and R. marina are similar to those in a previous study with dinoflagellates Heterocapsa circularisquama and Alexandrium catenella and the cryptophyte Rhodomonas ovalis (Fukuzaki et al., 2014). They observed higher biomass production for the dinoflagellates and higher apparent percentage of net photosynthetic extracellular release for R. ovalis. In addition to the inherent species-specific physiological differences between A. malmogiense and R. marina, some fraction of the different DOM release might be caused by more general traits, such as the size difference between the species. Higher release of bioavailable DOM from R. marina might simply be caused by the smaller size of R. marina cells and, therefore, higher passive release of DOC (Bjørnsen, 1988).
Even though both of the phytoplankton species can be assumed to be mixotrophic (Ballen-Segura et al., 2017; Rintala et al., 2007) and phytoplankton can take up DOM in mixed communities (Bronk and Glibert, 1993; Moneta et al., 2014), significant DOM consumption by phytoplankton during this experiment was unlikely. Uptake of organic N or P would be energetically unlikely in the presence of light and available inorganic N and P. Towards the end of the experiment, if the decline of R. marina was caused by C limitation, DOM consumption would have been more likely, and an unknown fraction of changes in the properties of DOM could maybe be attributed to reuptake by phytoplankton. However, because there was a shift from increase to decrease in some optical DOM properties between the DOM release experiment and the DOM consumption experiment, the principal role of R. marina was likely still the production of DOM rather than its consumption throughout the DOM release experiment.
Because the observed changes in optical DOM properties seem to be independent of the ratio of bacterial to phytoplankton abundance, the observed changes in DOM characteristics have to arise primarily from the traits of individual phytoplankton species (rate and type of produced DOM; Fukuzaki et al., 2014) or bacterial species (rate and type of consumed and produced DOM (Fox et al., 2017; Romera-Castillo et al., 2011) instead of only from the ratio of producers to consumers. A general conclusion from DOM quality indicators is that R. marina produces comparatively more DOM, when normalized to PP, than A. malmogiense and that this DOM seems to be more efficiently consumed and altered by bacteria. However, DOC release and the rate of DOC production to PP do not necessarily reflect natural conditions precisely for either phytoplankton species since the fraction of PP released as DOC from phytoplankton is generally higher in situ than in cultures (Thornton, 2014).
4.2 Response of bacteria to DOC
The higher leucine : thymidine incorporation ratio in R. marina treatments indicates that bacteria struggled to get enough C and/or energy from DOM for balanced growth. A likely explanation for this is that the bacterial community in R. marina treatments efficiently depleted the readily available labile DOM pool, and the stable DOM release from R. marina could not keep up with the demands of the bacterial growth. This idea was supported by a much higher BP : PP ratio in R. marina treatments during the second and third KPIs. In the DOM consumption experiment bacteria growing on R. marina filtrate invested more in thymidine incorporation (lower leucine : thymidine ratio) than in the DOM release experiment. This was most likely caused by the relaxed resource competition due to dilution of bacterial abundance during the filtration and further suggests that the higher leucine : thymidine ratio in the DOM release experiment was caused by intense competition for DOM among bacteria.
In general, Bacteroidia, Alphaproteobacteria, and Gammaproteobacteria predominated bacterial communities in both DOM release and consumption experiments, and the communities reflected those in the phytoplankton cultures, indicating that the bacterial communities emerged from the phytoplankton cultures. In the beginning of the DOM consumption experiment in R. marina, the class Alphaproteobacteria (mostly genus Pseudorhodobacter) comprised 82 % of the bacterial community, which was related to the high peak T and high BP. This kind of “feast and famine” growth mode is typical for copiotrophic bacteria (Lauro et al., 2009). Alphaproteobacteria benefit from phytoplankton blooms when there is a high concentration of labile DOM available (Allers et al., 2007), and they are efficient in using amino acids (Cottrell and Kirchman, 2000; Gasol et al., 2008). The predicted high production of monosaccharides by R. marina (Fernandes et al., 2017) may explain the higher proportions of Alpha- and Gammaproteobacteria in R. marina treatments. Pseudorhodobacter has also been detected in a previous mesocosm study with Baltic Sea water (Camarena-Gómez et al., 2018) as well as in Baltic Sea bacterioplankton (Herlemann et al., 2011).
In general, the share of the class Bacteroidia (genera Algoriphagus and Polaribacter) was higher in A. malmogiense treatments in both experiments, likely reflecting the less labile DOM pool consisting of higher-molecular-weight molecules as suggested by the slightly lower S275−295 in the DOM release experiment. In the R. marina treatments of the DOM consumption experiment, the class Bacteroidia (genus Flavobacter) became abundant only after day 3 congruently with the drop in peak T, implicating that the ratio of labile to semi-labile DOM dropped on day 4 and caused a shift in bacterial community composition towards more moderate copiotrophs. The phylum Bacteroidetes is well known for its capability to degrade high-molecular-weight DOM (Cottrell and Kirchman, 2000; Romera-Castillo et al., 2011) with their polysaccharide utilizing enzymes (Grondin et al., 2017). Both Polaribacter and Flavobacterium are common moderate copiotrophs and detected from phytoplankton blooms (Mühlenbruch et al., 2018; Teeling et al., 2012). In addition, Polaribacter and Algoriphagus have been detected in previous Baltic Sea mesocosm studies (Camarena-Gómez et al., 2018; Herlemann et al., 2017).
Actinobacteria, which were present in A. malmogiense treatments, are members of autochthonous bacterioplankton in the Baltic Sea (Riemann et al., 2008), occupying several different niches, and thus likely have various different functions in the Baltic Sea food web (Holmfeldt et al., 2009). They have also occurred with dinoflagellates in a previous mesocosm experiment with Baltic Sea water (Camarena-Gómez et al., 2018). In the Baltic Sea, some Actinobacteria are linked to high DOC concentrations and terrestrial DOM close to the land (Holmfeldt et al., 2009), and others are outcompeted by fast-growing copiotrophs when phytoplankton-derived DOM is available (Pérez and Sommaruga, 2006). Possibly, in A. malmogiense treatments the presumably less labile DOM allowed them to compete better with the copiotrophic Alpha- and Gammaproteobacteria. However, it is also possible that the filtration in the DOM consumption experiment caused a bias and favored them due to their small size (Hahn et al., 2003).
In the DOM consumption experiment, a shift in the preferred substrate for bacterial consumption and a concurrent shift in the bacterial community were obvious in R. marina treatments even though DOC concentration was still high after the incubation. This highlights the strong connection between phytoplankton DOM release and bacterial processes. The existing DOM pool explains only part of the mechanisms which structure the bacterial community. The fast flow of 14C from the DIC pool through phytoplankton to the DOC pool and bacterial biomass in DOM release experiment supports this statement. The observed patterns in the bacterial community composition support the interpretation from Sect. 4.1 that DOM was more labile in R. marina treatments than in A. malmogiense.
In both phytoplankton treatments the final bacterial community at the end of the DOM release experiment resembled the community at the end of the DOM consumption experiment and was seemingly unaffected by the addition of seawater bacteria. Most likely the low number of bacteria in the bacterial inoculum could not compete with the high number of pre-existing bacteria. This suggests that the phytoplankton–bacteria communities in the cultures were somewhat stable and resistant to minor introductions of foreign bacteria. This is in line with other studies which have shown stable and predictable bacterial communities associated with certain phytoplankton species (e.g., Schäfer et al., 2002; Sapp et al., 2007; Goecke et al., 2013; Buchan et al., 2014; Krohn-Molt et al., 2017; Mönnich et al., 2020). A variety of mutualistic or algicidal interactions between bacteria and phytoplankton are known (Seymour et al., 2017). Phytoplankton might affect bacterial community composition by producing certain amino acids (Tada et al., 2017), which may in part explain why the development of the bacterial community in the DOM consumption experiment was connected to peak T. The minor differences in the thymidine and leucine incorporation between the species in the DOM release experiment despite the major differences in PP and DOC processing, and the comparable BGE between species in the DOM consumption experiment, suggest that the bacterial communities, while different in composition, are functionally optimized to grow using the DOC produced by the host phytoplankton. The difference between control treatments and experimental replicates of the DOM consumption experiment suggests that phytoplankton-derived DOM, not the growth medium, is the main driver for bacterial community and DOM processing dynamics.
4.3 Ecological implications of species-specific DOC dynamics
This experiment used phytoplankton batch cultures with higher concentrations of phytoplankton and bacteria than in natural waters to better detect the studied processes. The volume-related production rates in the experiment are therefore assumed to be higher than in the natural experiments, but cell-specific production rates are likely closer to the natural environment. We therefore did not compare the rates in the experiment with rates in the natural environment. Instead we assumed that the differences in rates between the two phytoplankton species would also be similar in the natural environment. Likewise, even though most of the bacteria in the experiment consisted of bacteria which had grown for long in culture conditions together with the phytoplankton, their relationships with the investigated DOM properties resembled relationships in natural communities. Thus, we assume that these two phytoplankton species would also benefit the same bacterial taxa in the natural environment.
A recent study connected a dinoflagellate community consisting of A. malmogiense and related species to lower BP and a distinct bacterial community, compared to communities with common spring bloom diatom species (Camarena-Gómez et al., 2018). The results with A. malmogiense support their view that DOC released from some dinoflagellate species may lead to lower efficiency of the microbial loop.
When dinoflagellate blooms are not terminated in mass encystment, they are expected to lyse in the water column and contribute to the pelagic DOC pool (Spilling et al., 2018). Our results indicate that blooms predominated by A. malmogiense indeed release high amounts of DOC, but this DOC may not be readily bioavailable for bacteria coinciding with phytoplankton blooms and may, therefore, stay in the pelagic system for longer. High biomass production combined with release of less bioavailable DOC could lead to direct grazing being favored over microbial loop. Thus, a probable long-term effect of A. malmogiense predominance in natural communities on C cycling is the accumulation of less bioavailable DOC at the expense of sedimentation and microbial loop. Also, pronounced cycling of C between phytoplankton biomass, and DIC pool can be expected, as community respiration was high and dinoflagellates are generally considered to have high respiration rates (Taylor and Pollingher, 1987).
Compared to A. malmogiense, R. marina produces less phytoplankton biomass and the DOC it releases is more bioavailable. Thus, blooms predominated by R. marina may favor the microbial loop and DOC processing over grazing. Since Alpha- and Gammaproteobacteria, which were common in R. marina treatments, are heavily grazed by heterotrophic nanoflagellates (Alonso-Sáez et al., 2009), R. marina predomination may increase C transfer through the microbial loop. In addition, the higher BR in the DOM release experiment may indicate that total C fixation is lower during such blooms. Rhodomonas species have not traditionally been connected to periods of high DOC release from phytoplankton (Storch and Saunders, 1978), and, according to our results, this might be the result of fast bacterial consumption of DOC released by Rhodomonas species. The very fast consumption and transformation of DOC in R. marina treatments in the DOM consumption experiment support the assumption of fast DOC depletion in natural R. marina predominated blooms.
Strong extrapolations of these results to related phytoplankton species or to phytoplankton of similar size should be made with caution, as even much more closely related phytoplankton species may support differing bacterial communities (Grossart et al., 2005) and, consequently, different C cycling dynamics. Instead, we want to highlight the importance of studying C cycling between individual phytoplankton species and related bacterial communities in order to understand the mixed phytoplankton communities of the natural environments. These community manipulation experiments should also include protozoan grazers as their impact on DOM composition and processing can be significant (Kujawinski et al., 2016). Grazing may, for example, alter bacterial community composition by removing groups which are less resistant to grazing (Alonso-Sáez et al., 2009), enhance DOM production (Strom et al., 1997), and affect the lability of the produced DOM (Fouilland et al., 2014), all of which can be assumed to affect C cycling. Better knowledge on C cycling at the species level will help in predicting how the large-scale change in phytoplankton community composition will affect C cycling at the ecosystem level.
Two common phytoplankton species in the Baltic Sea, A. malmogiense and R. marina, produce DOM with different bioavailability and support distinct bacterial communities specialized in utilizing this specific DOM source. This results in different C cycling patterns: A. malmogiense cells circulate more C between DIC and phytoplankton biomass, while producing less labile DOC. R. marina releases more labile DOC, and relatively more C is thus directed towards the bacterial community. DOC released by R. marina is taken up, incorporated, and respired faster than DOC released by A. malmogiense. Differences were clear at every level of C cycling: PP, flow of 14C from DIC to bacterial biomass, optical properties of DOM, and the response in the composition and activity of the bacterial community. This experiment supports the view that phytoplankton and bacteria are intimately connected through the rapid bacterial consumption of DOM released by phytoplankton and that this connection explains bacterioplankton dynamics better than the composition of the ambient DOM pool. An experimental approach based on monocultures was necessary to quantify these differences in C pathways. To better understand C cycling in a natural environment, it may be beneficial to also see natural pelagic microbial communities as collections of various linked phytoplankton–bacteria associations with distinctive C cycling patterns.

Figure A1CDOM and FDOM variables in phytoplankton cultures during the DOM release experiment. (a–h) Absorption coefficients at different wavelengths. (i, j, l) Spectral slopes between different wavelength ranges. (k) Ratio of spectral slopes between 275–295 and 350–400 nm (Helms et al., 2008). (n) Peak M, marine humic-like DOM (Coble, 1996). (p) FI, fluorescence index (Mcknight et al., 2001). (q) HIX, humification index (Zsolnay et al., 1999). (r) BIX, biological index (Huguet et al., 2009). (s) DOC concentration at each KPI. Vertical lines from left to right in each panel mark the times of the first, second, and third KPIs. Error bars indicate 1 standard deviation. The number above the boxplots shows the number of measurements. Lower and upper hinges of boxes mark the first and third quartiles, respectively, while the whiskers extend to the lowest and the highest values within 1.5 times the interquartile range. Grey boxes (left) show A. malmogiense, and white boxes (right) show R. marina.
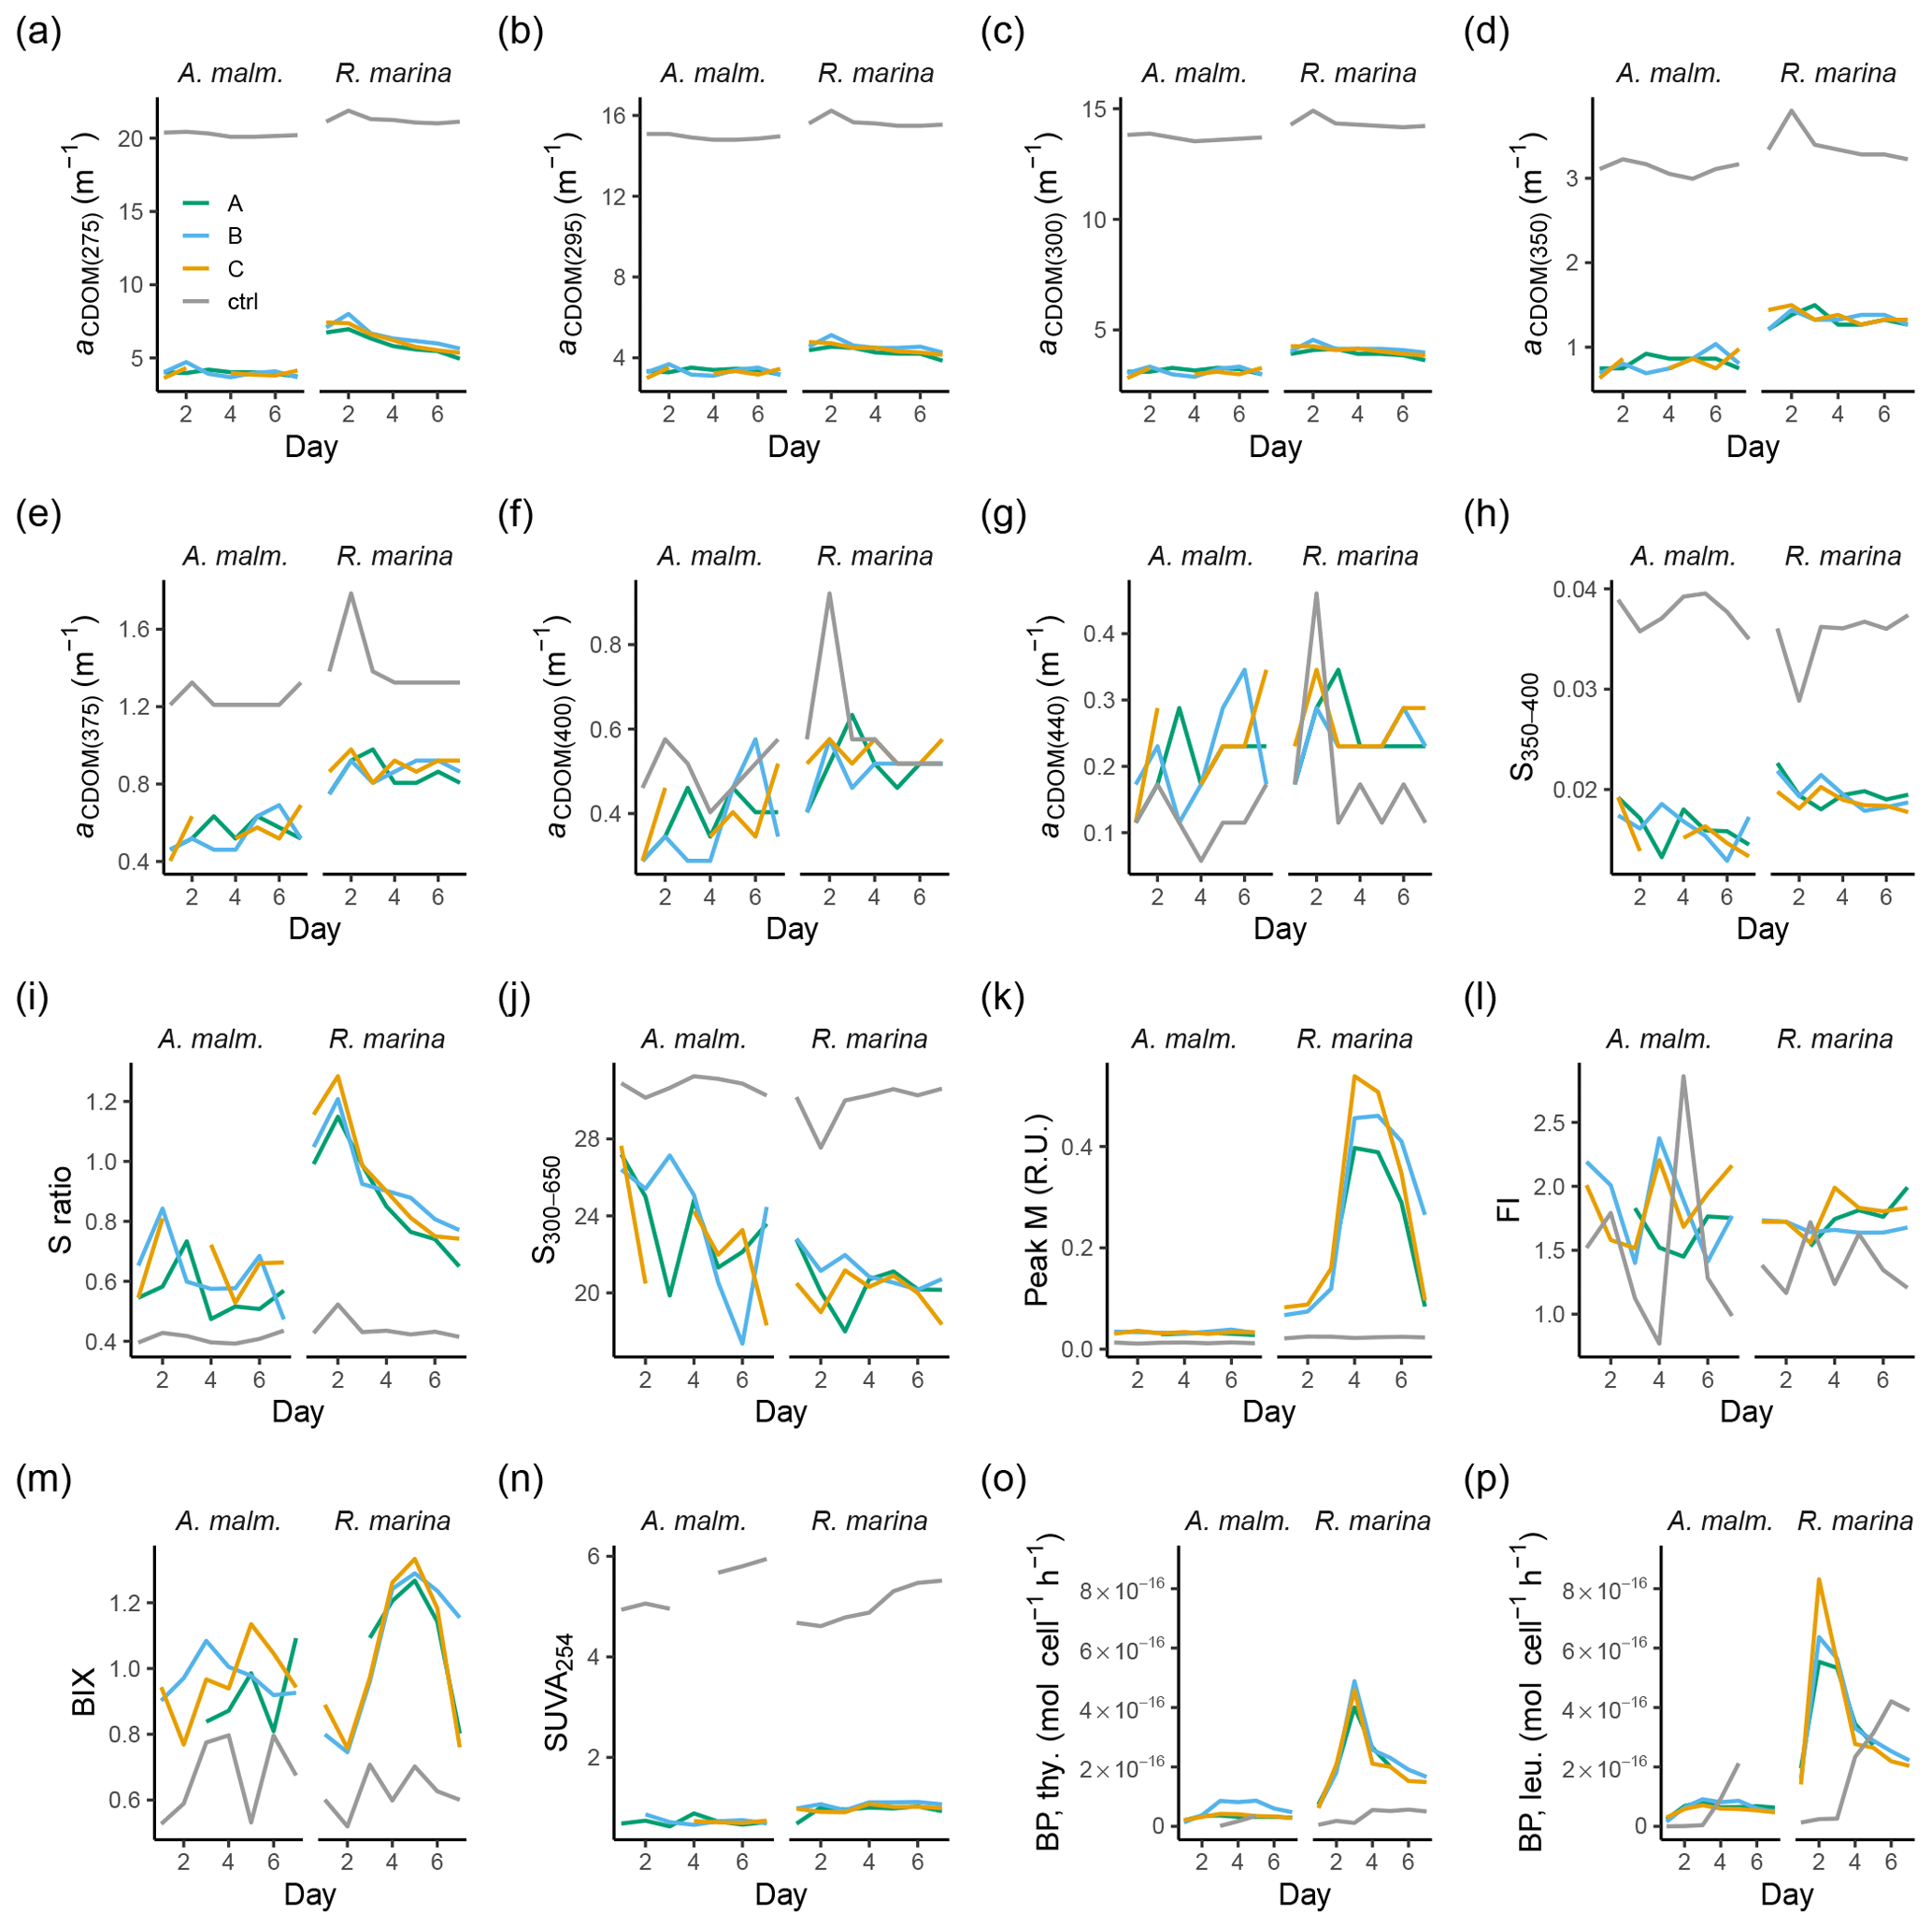
Figure A2Those CDOM and FDOM variables (a–n) in the DOM consumption experiment, which were measured but not included in the more detailed analysis, and bacterial production measurements (o–p). (a–g) Absorption coefficients at different wavelengths. (h, j) Spectral slopes between different wavelength ranges. (i) Ratio of spectral slopes between 275–295 nm and 350–400 nm (Helms et al., 2008). (k) Peak M, marine humic-like DOM (Coble, 1996). (l) FI, fluorescence index (Mcknight et al., 2001). (m) BIX, biological index (Huguet et al., 2009). (n) SUVA254, DOC-normalized absorbance at 254 nm (Weishaar et al., 2003). Bacterial production based on thymidine (o) and leucine (p) incorporation. Lines A, B, and C mark different replicates (culture filtrate + seawater bacteria), and ctrl marks the control (F/2 + seawater bacteria).
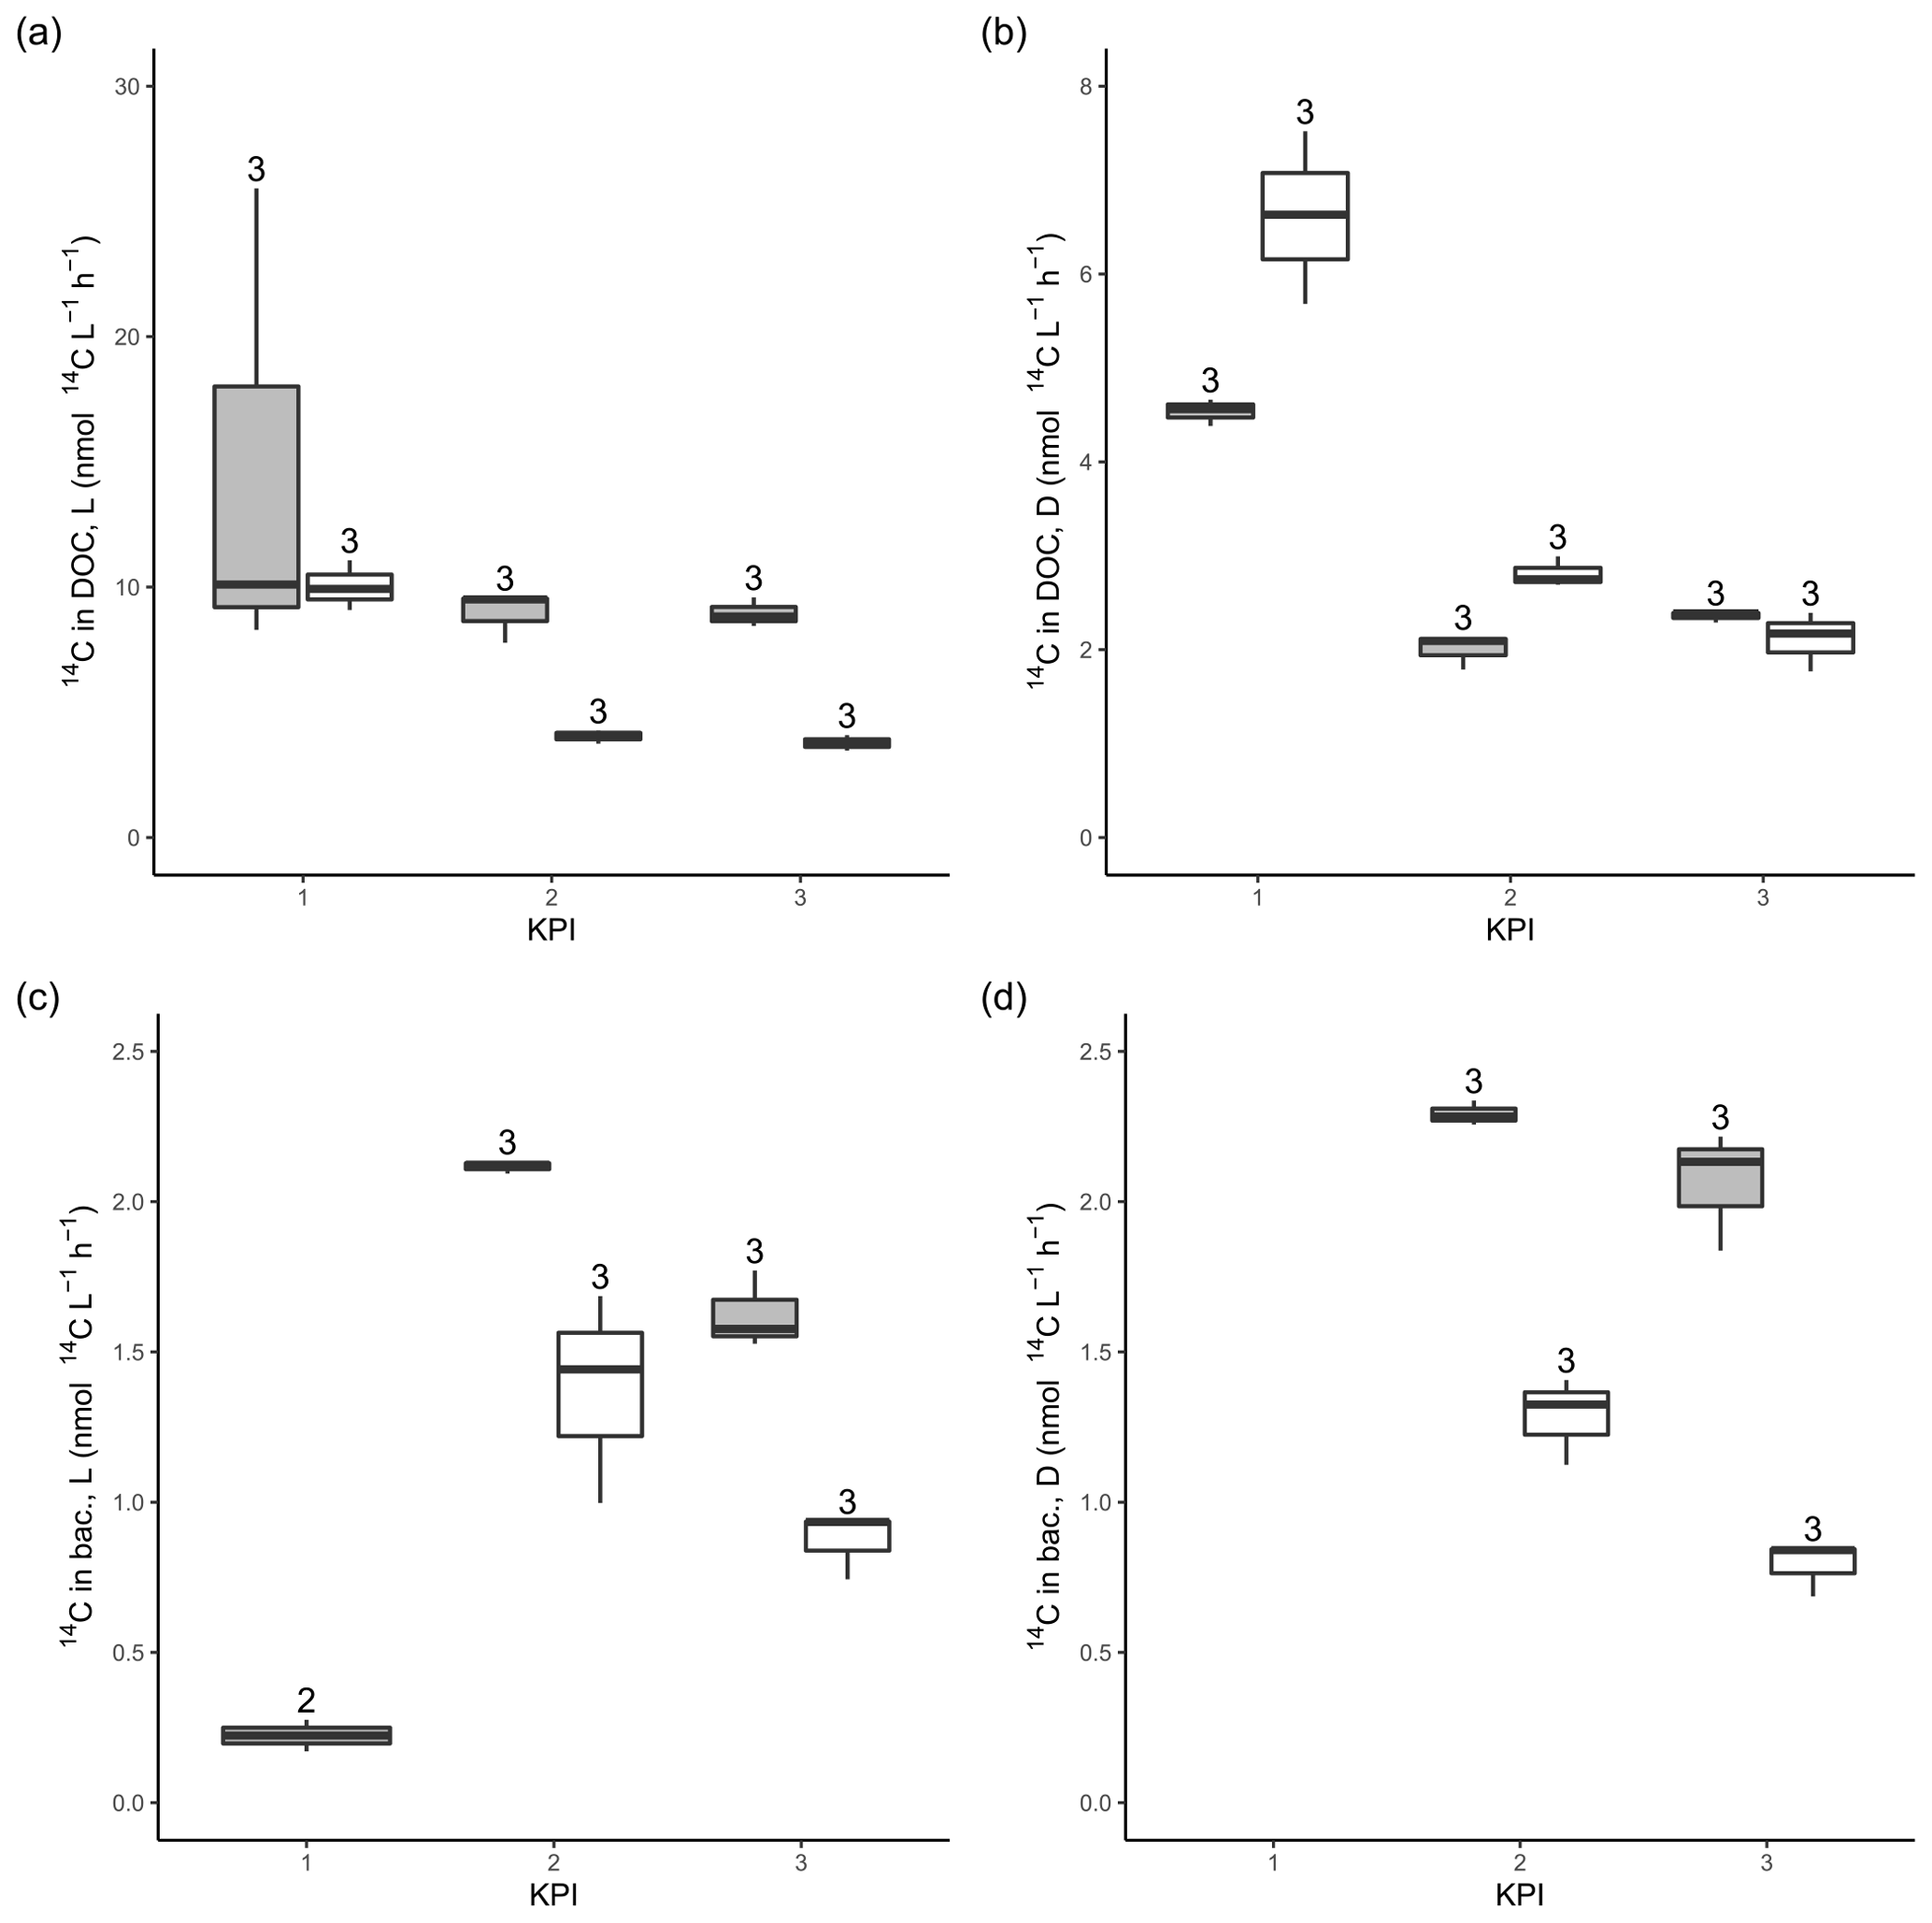
Figure A314C activity originating from 14C-NaHCO3 in the DOC pool in the filtrates from light (a) and dark (b) primary production incubation samples. 14C activity originating from 14C-NaHCO3 in bacterial biomass after 4 h of dark incubation of filtrate from light (c) and dark (d) primary production incubation samples amended with non-spiked cultures. The number above the boxplots shows the number of measurements. Lower and upper hinges of boxes mark the first and third quartiles, respectively, while the whiskers extend to the lowest and the highest values within 1.5 times the interquartile range. Grey boxes (left) show A. malmogiense, and white boxes (right) show R. marina.
Table A1Mean±1 SD of additional variables at each KPI in the DOM release experiment. S ratio: ratio of spectral slopes between 275–295 and 350–400 nm (Helms et al., 2008). Peak M: marine humic-like DOM (Coble, 1996). FI: fluorescence index (Mcknight et al., 2001). BIX: biological index (Huguet et al., 2009).
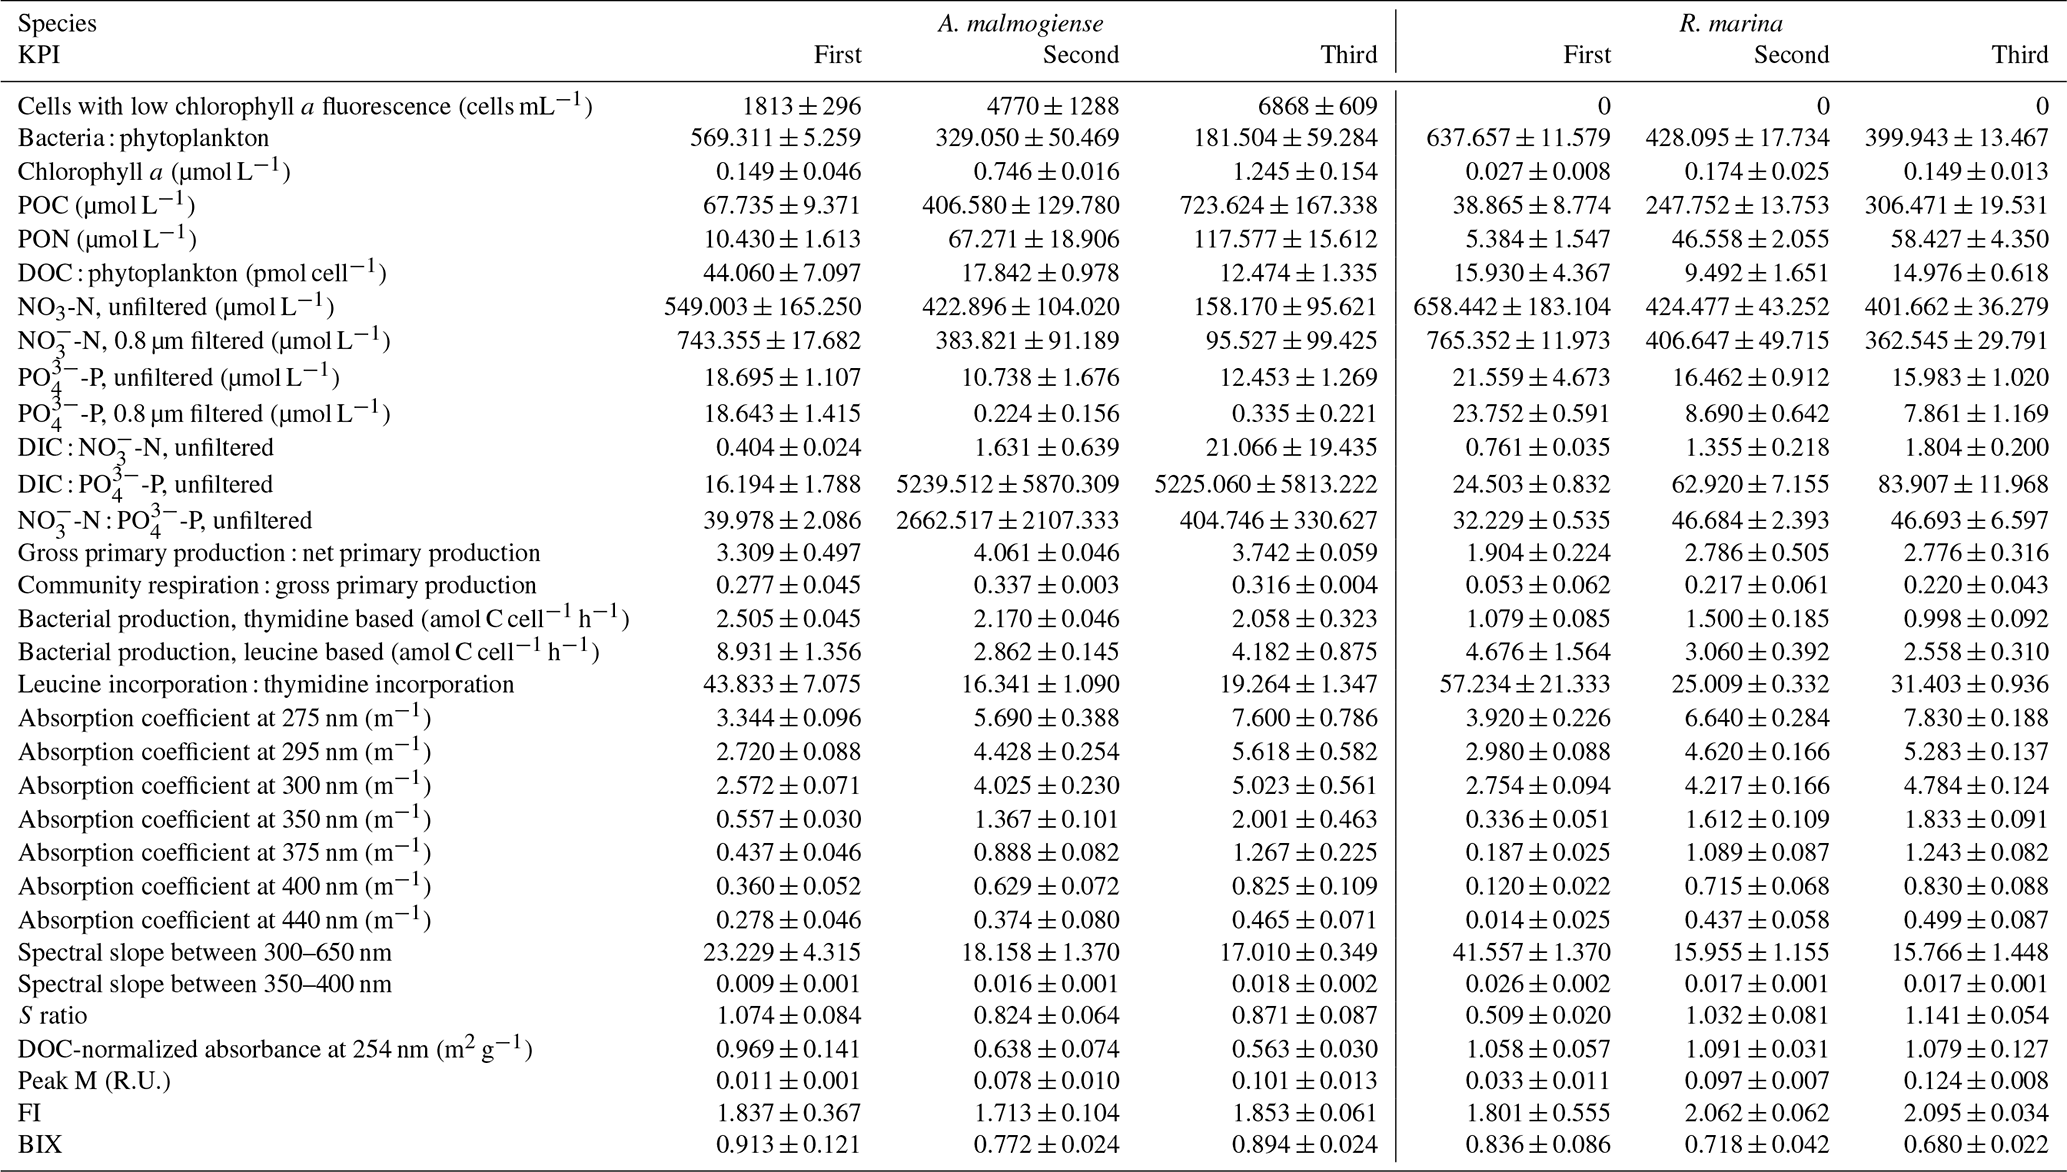
Table B1Welch ANOVA results of the DOM release experiment. Each line presents the test of difference between the phytoplankton species for the given variable at the given KPI.

Table B2Welch ANOVA results of 14C flow (Table 2). Each line presents the test of difference between the phytoplankton species for the given ratio at the given KPI.
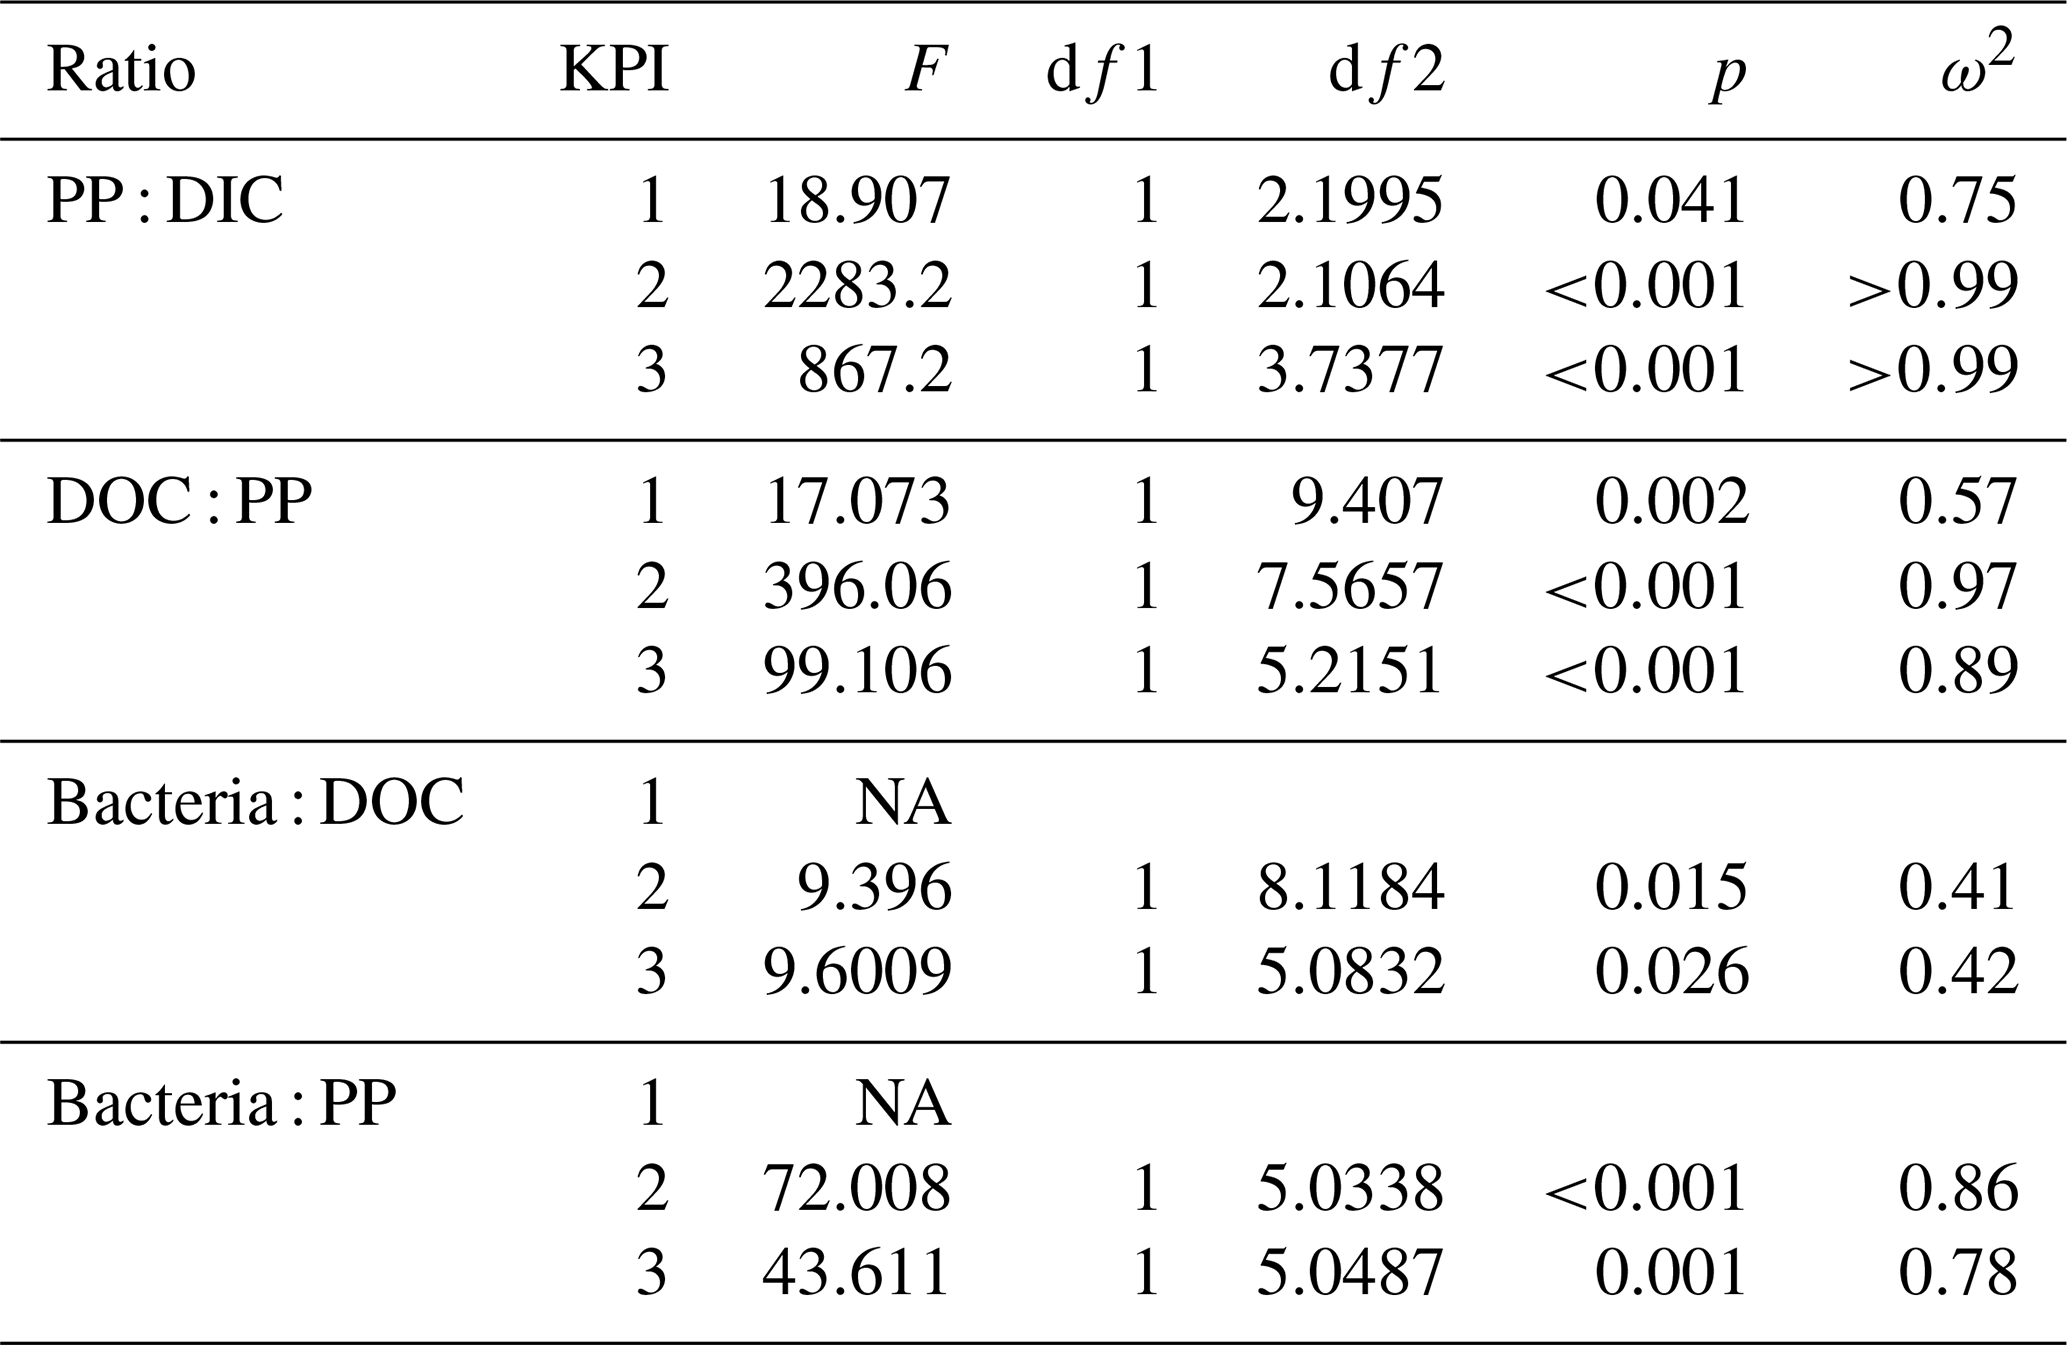
NA: not available.
Raw reads are deposited in the Sequence Read Archive of the National Center for Biotechnology Information under BioProject accession number PRJNA647035. Other data for this study were published open access at PANGAEA (Elovaara et al., 2021).
SE, TT, and HK designed the experiment. SE conducted the experiment. EER processed bacterial community composition data. EA processed DOM optics data. SE processed remaining data. SE wrote the manuscript with contributions from the other authors.
The contact author has declared that neither they nor their co-authors have any competing interests.
Publisher's note: Copernicus Publications remains neutral with regard to jurisdictional claims in published maps and institutional affiliations.
We thank Timo Tikka for help in establishing the experiments; Tvärminne Zoological Station for producing facilities, practical aid, and analyses; and Heidi Hällfors for aid and expertise related to phytoplankton cultures. We thank the anonymous reviewers for considerably improving the manuscript. The study utilized the Finnish Environment Institute Marine Research Centre marine research infrastructure as a part of the national FINMARI RI consortium.
This research has been supported by the Walter ja Andrée de Nottbeckin Säätiö (grant “Phytoplankton mortality in marine ecosystems: Feedbacks to the pelagic detritus pool and biogeochemical cycling in a changing environment”), the Maa-ja vesitekniikan tuki ry (grant no. 13-8120-15), and the Societas pro Fauna et Flora Fennica (grant no. 5.12.2019). Eero Asmala was supported by the Academy of Finland (grant no. 309748). Tobias Tamelander was funded by the WANS and by the Swedish Cultural Heritage Foundation. Open-access funding was provided by the Finnish Environment Institute.
This paper was edited by Yuan Shen and reviewed by Youhei Yamashita and one anonymous referee.
Allers, E., Gómez-Consarnau, L., Pinhassi, J., Gasol, J. M., Šimek, K., and Pernthaler, J.: Response of Alteromonadaceae and Rhodobacteriaceae to glucose and phosphorus manipulation in marine mesocosms, Environ. Microbiol., 9, 2417–2429, https://doi.org/10.1111/j.1462-2920.2007.01360.x, 2007.
Alonso-Sáez, L., Unanue, M., Latatu, A., Azua, I., Ayo, B., Artolozaga, I., and Iriberri, J.: Changes in marine prokaryotic community induced by varying types of dissolved organic matter and subsequent grazing pressure, J. Plankton Res., 31, 1373–1383, https://doi.org/10.1093/plankt/fbp081, 2009.
Amin, S. A., Green, D. H., Hart, M. C., Küpper, F. C., Sunda, W. G., and Carrano, C. J.: Photolysis of iron – siderophore chelates promotes bacterial – algal mutualism, P. Natl. Acad. Sci. USA, 106, 17071–17076, https://doi.org/10.1073/pnas.0905512106, 2009.
Anderson, M. J.: A new method for non-parametric multivariate analysis of variance, Austral. Ecol., 26, 32–46, https://doi.org/10.1111/j.1442-9993.2001.01070.pp.x, 2001.
Asmala, E., Haraguchi, L., Markager, S., Massicotte, P., Riemann, B., Staehr, P. A., and Carstensen, J.: Eutrophication Leads to Accumulation of Recalcitrant Autochthonous Organic Matter in Coastal Environment, Global Biogeochem. Cy., 32(11), 1673–1687, https://doi.org/10.1029/2017GB005848, 2018.
Azam, F., Fenchel, T. M., Field, J. G., Gray, J. S., Meyer-Reil, L. A., and Thingstad, F.: The ecological role of water-column microbes in the sea, Mar. Ecol. Prog. Ser., 10, 257–263, https://doi.org/10.3354/meps010257, 1983.
Ballen-Segura, M., Felip, M., and Catalan, J.: Some mixotrophic flagellate species selectively graze on archaea, Appl. Environ. Microbiol., 83, 1–11, https://doi.org/10.1128/AEM.02317-16, 2017.
Becker, J. W., Berube, P. M., Follett, C. L., Waterbury, J. B., Chisholm, S. W., DeLong, E. F., and Repeta, D. J.: Closely related phytoplankton species produce similar suites of dissolved organic matter, Front. Microbiol., 5, 1–14, https://doi.org/10.3389/fmicb.2014.00111, 2014.
Berggren, M., Laudon, H., and Jansson, M.: Aging of allochthonous organic carbon regulates bacterial production in unproductive boreal lakes, Limnol. Oceanogr., 54, 1333–1342, https://doi.org/10.4319/lo.2009.54.4.1333, 2009.
Bjørnsen, P. K.: Phytoplankton exudation of organic matter: Why do healthy cells do it?, Limnol. Oceanogr., 33, 151–154, https://doi.org/10.4319/lo.1988.33.1.0151, 1988.
Bronk, D. A. and Glibert, P. M.: Application of a 15N tracer method to the study of dissolved organic nitrogen uptake during spring and summer in Chesapeake Bay, Mar. Biol., 115, 501–508, 1993.
Buchan, A., LeCleir, G. R., Gulvik, C. A., and González, J. M.: Master recyclers: features and functions of bacteria associated with phytoplankton blooms, Nat. Rev. Microbiol., 12, 686–698, https://doi.org/10.1038/nrmicro3326, 2014.
Callahan, B. J., McMurdie, P. J., Rosen, M. J., Han, A. W., Johnson, A. J. A., and Holmes, S. P.: DADA2: High-resolution sample inference from Illumina amplicon data [code], Nat. Method., 13, 581–583, https://doi.org/10.1038/nmeth.3869, 2016.
Camarena-Gómez, M. T., Lipsewers, T., Piiparinen, J., Eronen-Rasimus, E., Perez-Quemaliños, D., Hoikkala, L., Sobrino, C., and Spilling, K.: Shifts in phytoplankton community structure modify bacterial production , abundance and community composition, Aquat. Microb. Ecol., 81, 149–170, https://doi.org/10.3354/ame01868, 2018.
Camiro-vargas, T. K., Hernández-Ayón, J. M., Valenzuela-espinoza, E., Delgadillo-hinojosa, F., and Ramón, C.-M.: Dissolved inorganic carbon uptake by Rhodomonas sp. and Isochrysis aff . galbana determined by a potentiometric technique, Aquac. Eng., 33, 83–95, https://doi.org/10.1016/j.aquaeng.2004.10.001, 2005.
Chen, W. and Wangersky, P. J.: Production of dissolved organic carbon in phytoplankton cultures as measured by high-temperature catalytic oxidation and ultraviolet photo-oxidation methods, J. Plankton Res., 18, 1201–1211, 1996.
Chin-Leo, G. and Kirchman, D.: Unbalanced growth in natural assemblages of marine bacterioplankton, Mar. Ecol. Prog. Ser., 63, 1–8, https://doi.org/10.3354/meps063001, 1990.
Christie-Oleza, J. A., Sousoni, D., Lloyd, M., Armengaud, J., and Scanlan, D. J.: Nutrient recycling facilitates long-term stability of marine microbial phototroph-heterotroph interactions, Nat. Microbiol., 2, 1–10, https://doi.org/10.1038/nmicrobiol.2017.100, 2017.
Coble, P. G.: Characterization of marine and terrestrial DOM in the seawater using exciting-emission matrix spectroscopy, Mar. Chem., 51, 325–346, https://doi.org/10.1016/0304-4203(95)00062-3, 1996.
Cottrell, M. T. and Kirchman, D. L.: Natural Assemblages of Marine Proteobacteria and Members of the Cytophaga-Flavobacter Cluster Consuming Low- and High- Molecular-Weight Dissolved Organic Matter, Appl. Environ. Microbiol., 66, 1692–1697, 2000.
Croft, M. T., Lawrence, A. D., Raux-Deery, E., Warren, M. J., and Smith, A. G.: Algae acquire vitamin B12 through a symbiotic relationship with bacteria, Nature, 438, 90–93, https://doi.org/10.1038/nature04056, 2005.
Ducklow, H. W. and Carlson, C. A.: Oceanic Bacterial Productivity, in Advances in Microbial Ecology, Plenum Press, New York, NY, 1992.
Elovaara, S., Eronen-Rasimus, E., Asmala, E., Tamelander, T., and Kaartokallio, H.: Phytoplankton and bacterial production, 14C-transfer and optical characteristics of dissolved organic matter (DOM) from a microcosm experiment, Gulf of Finland, Baltic Sea, PANGAEA, https://doi.org/10.1594/PANGAEA.937723, 2021.
Elzenga, J. T. M., Prins, H. B. A., and Stefels, J.: The role of extracellular carbonic anhydrase activity in inorganic carbon utilization of Phaeocystis globosa ( Prymnesiophyceae ): A comparison with other marine algae using the isotopic disequilibrium technique, Limnol. Oceanogr., 45, 372–380, 2000.
Emerson, S. R. and Hedges, J. I.: Chemical Oceanography and the Marine Carbon Cycle, Campridge University Press, New York, NY, 2008.
Engel, A., Thoms, S., Riebesell, U., Rochelle-Newall, E., and Zondervan, I.: Polysaccharide aggregation as a potential sink of marine dissolved organic carbon, Nature, 428, 929–932, https://doi.org/10.1038/nature02453, 2004.
Fernandes, T., Fernandes, I., Andrade, C. A. P., Ferreira, A., and Cordeiro, N.: Marine microalgae monosaccharide fluctuations as a stress response to nutrients inputs, Algal Res., 24, 340–346, https://doi.org/10.1016/j.algal.2017.04.023, 2017.
Fouilland, E., Tolosa, I., Bonnet, D., Bouvier, C., Bouvier, T., Bouvy, M., Got, P., Le Floc'h, E., Mostajir, B., Roques, C., Sempéré, R., Sime-Ngando, T., and Vidussi, F.: Bacterial carbon dependence on freshly produced phytoplankton exudates under different nutrient availability and grazing pressure conditions in coastal marine waters, FEMS Microbiol. Ecol., 87, 757–769, https://doi.org/10.1111/1574-6941.12262, 2014.
Fox, B. G., Thorn, R. M. S., Anesio, A. M., and Reynolds, D. M.: The in situ bacterial production of fluorescent organic matter; an investigation at a species level, Water Res., 125, 350–359, https://doi.org/10.1016/j.watres.2017.08.040, 2017.
Fukuzaki, K., Imai, I., Fukushima, K., Ishii, K. I., Sawayama, S., and Yoshioka, T.: Fluorescent characteristics of dissolved organic matter produced by bloom-forming coastal phytoplankton, J. Plankton Res., 36, 685–694, https://doi.org/10.1093/plankt/fbu015, 2014.
Gargas, E.: A Manual for Phytoplankton Primary Production Studies in the Baltic, Balt. Mar. Biol., 2, 1–88, 1975.
Gasol, J. M., Pinhassi, J., Alonso-Sáez, L., Ducklow, H., Herndl, G. J., Koblízek, M., Labrenz, M., Luo, Y., Morán, X. A. G., Reinthaler, T., and Simon, M.: Towards a better understanding of microbial carbon flux in the sea, Aquat. Microb. Ecol., 53, 21–38, https://doi.org/10.3354/ame01230, 2008.
Goecke, F., Thiel, V., Wiese, J., Labes, A., and Imhoff, J. F.: Algae as an important environment for bacteria – phylogenetic relationships among new bacterial species isolated from algae, Phycologia, 52, 14–24, 2013.
Grasshoff, K., Kremling, K., and Ehrhardt, M.: Methods of Seawater Analysis, 3rd Edn., Wiley-VCH, Weinheim, 1999.
Grondin, J. M., Tamura, K., Déjean, G., Abbott, D. W., and Brumer, H.: Polysaccharide Utilization Loci: Fueling Microbial Communities, J. Bacteriol., 199, 1–15, 2017.
Grossart, H., Levold, F., Allgaier, M., Simon, M., and Brinkhoff, T.: Marine diatom species harbour distinct bacterial communities, Environ. Microbiol., 7, 860–873, https://doi.org/10.1111/j.1462-2920.2005.00759.x, 2005.
Guillemette, F. and del Giorgio, P. A.: Simultaneous consumption and production of fluorescent dissolved organic matter by lake bacterioplankton, Environ. Microbiol., 14, 1432–1443, https://doi.org/10.1111/j.1462-2920.2012.02728.x, 2012.
Hahn, M. W., Lünsdorf, H., Wu, Q., Schauer, M., Höfle, M. G., Boenigk, J., and Stadler, P.: Isolation of Novel Ultramicrobacteria Classified as Actinobacteria from Five Freshwater Habitats in Europe and Asia, Appl. Environ. Microbiol., 69, 1442–1451, 2003.
Hansell, D. A., Carlson, C. A., Repeta, D. J., and Schlitzer, R.: Dissolved organic matter in the ocean: a controversy stimulates new insights, Oceanography, 22, 202–211, 2009.
Haraguchi, L., Asmala, E., Jakobsen, H. H., and Carstensen, J.: Composition of natural phytoplankton community has minor effects on autochthonous dissolved organic matter characteristics, Mar. Biol. Res., 15, 357–375, https://doi.org/10.1080/17451000.2019.1662449, 2019.
Hedges, J. I.: Global biogeochemical cycles: progress and problems, Mar. Chem., 39, 67–93, 1992.
Helms, J. R., Stubbins, A., Ritchie, J. D., Minor, E. C., Kieber, D. J., and Mopper, K.: Absorption spectral slopes and slope ratios as indicators of molecular weight, source, and photobleaching of chromophoric dissolved organic matter, Limnol. Oceanogr., 53, 955–969, https://doi.org/10.4319/lo.2009.54.3.1023, 2008.
Herlemann, D. P. R., Labrenz, M., Jürgens, K., Bertilsson, S., Waniek, J. J., and Andersson, A. F.: Transitions in bacterial communities along the 2000 km salinity gradient of the Baltic Sea, ISME J., 5, 1571–1579, https://doi.org/10.1038/ismej.2011.41, 2011.
Herlemann, D. P. R., Manecki, M., Dittmar, T., and Jürgens, K.: Differential responses of marine , mesohaline and oligohaline bacterial communities to the addition of terrigenous carbon, Environ. Microbiol., 19, 3098–3117, https://doi.org/10.1111/1462-2920.13784, 2017.
Holmfeldt, K., Dziallas, C., Titelman, J., Pohlmann, K., Grossart, H. P., and Riemann, L.: Diversity and abundance of freshwater Actinobacteria along environmental gradients in the brackish northern Baltic Sea, Environ. Microbiol., 11, 2042–2054, https://doi.org/10.1111/j.1462-2920.2009.01925.x, 2009.
Huguet, A., Vacher, L., Relexans, S., Saubusse, S., Froidefond, J. M., and Parlanti, E.: Properties of fluorescent dissolved organic matter in the Gironde Estuary, Org. Geochem., 40, 706–719, https://doi.org/10.1016/j.orggeochem.2009.03.002, 2009.
Jiao, N., Herndl, G. J., Hansell, D. A., Benner, R., Kattner, G., Wilhelm, S. W., Kirchman, D. L., Weinbauer, M. G., Luo, T., Chen, F., and Azam, F.: Microbial production of recalcitrant dissolved organic matter: Long-term carbon storage in the global ocean, Nat. Rev. Microbiol., 8, 593–599, https://doi.org/10.1038/nrmicro2386, 2010.
Jørgensen, L., Stedmon, C. A., Kaartokallio, H., Middelboe, M., and Thomas, D. N.: Changes in the composition and bioavailability of dissolved organic matter during sea ice formation, Limnol. Oceanogr., 60, 817–830, https://doi.org/10.1002/lno.10058, 2015.
Kawasaki, N. and Benner, R.: Bacterial release of dissolved organic matter during cell growth and decline: Molecular origin and composition, Limnol. Oceanogr., 51, 2170–2180, https://doi.org/10.4319/lo.2006.51.5.2170, 2006.
Kinsey, J. D., Corradino, G., Ziervogel, K., Schnetzer, A., and Osburn, C. L.: Formation of Chromophoric Dissolved Organic Matter by Bacterial Degradation of Phytoplankton-Derived Aggregates, Front. Mar. Sci., 4, 1–16, https://doi.org/10.3389/fmars.2017.00430, 2018.
Klais, R., Tamminen, T., Kremp, A., Spilling, K., and Olli, K.: Decadal-scale changes of Dinoflagellates and Diatoms in the Anomalous Baltic Sea spring bloom, PLoS One, 6, e21567, https://doi.org/10.1371/journal.pone.0021567, 2011.
Klindworth, A., Pruesse, E., Schweer, T., Peplies, J., Quast, C., Horn, M., and Glöckner, F. O.: Evaluation of general 16S ribosomal RNA gene PCR primers for classical and next-generation sequencing-based diversity studies, Nucl. Acid. Res., 41, 1–11, https://doi.org/10.1093/nar/gks808, 2013.
Kremp, A. and Heiskanen, A. S.: Sexuality and cyst formation of the spring-bloom dinoflagellate Scrippsiella hangoei in the coastal northern Baltic Sea, Mar. Biol., 134, 771–777, https://doi.org/10.1007/s002270050594, 1999.
Kremp, A., Rengefors, K., and Montresor, M.: Species-specific encystment patterns in three Baltic cold-water dinoflagellates: The role of multiple cues in resting cyst formation, Limnol. Oceanogr., 54, 1125–1138, https://doi.org/10.4319/lo.2009.54.4.1125, 2009.
Krohn-Molt, I., Alawi, M., Förstner, K. U., Wiegandt, A., Burkhardt, L., Indenbirken, D., Thieß, M., Grundhoff, A., Kehr, J., Tholey, A., and Streit, W. R.: Insights into Microalga and bacteria interactions of selected phycosphere biofilms using metagenomic, transcriptomic, and proteomic approaches, Front. Microbiol., 8, 1–14, https://doi.org/10.3389/fmicb.2017.01941, 2017.
Kujawinski, E. B.: The Impact of Microbial Metabolism on Marine Dissolved Organic Matter, Ann. Rev. Mar. Sci., 3, 567–599, https://doi.org/10.1146/annurev-marine-120308-081003, 2011.
Kujawinski, E. B., Longnecker, K., Barott, K. L., Weber, R. J. M., and Kido Soule, M. C.: Microbial community structure affects marine dissolved organic matter composition, Front. Mar. Sci., 3, 1–15, https://doi.org/10.3389/fmars.2016.00045, 2016.
Kuparinen, J.: Development of bacterioplankton during winter and early spring at the entrance to the Gulf of Finland, Baltic Sea, Int. Vereinigung für Theor. und Angew. Limnol. Verhandlungen, 23, 1869–1878, 1988.
Lauro, F. M., Mcdougald, D., Thomas, T., Williams, T. J., Egan, S., Rice, S., Demaere, M. Z., Ting, L., Ertan, H., Johnson, J., Ferriera, S., Lapidus, A., Anderson, I., Kyrpides, N., Munk, A. C., Detter, C., Han, C. S., Brown, M. V, Robb, F. T., Kjelleberg, S., and Cavicchioli, R.: The genomic basis of trophic strategy in marine bacteria, P. Natl. Acad. Sci. USA, 106, 15527–15533, 2009.
Li, W. K. W., Mclaughlin, F. A., Lovejoy, C., and Carmack, E. C.: Smallest Algae Thrive As the Arctic Ocean Freshens, Science, 326, p. 539, https://doi.org/10.1126/science.1179798, 2009.
Mari, X., Passow, U., Migon, C., Burd, A. B., and Legendre, L.: Transparent exopolymer particles: Effects on carbon cycling in the ocean, Prog. Oceanogr., 151, 13–37, https://doi.org/10.1016/j.pocean.2016.11.002, 2017.
Martin, M.: Cutadapt removes adapter sequences from high-throughput sequencing reads, EMBnet Journal, 17, 10–12, 2011.
Massicotte, P.: eemR: Tools for Pre-Processing Emission-Excitation-Matrix (EEM) Fluorescence Data, R package version 0.1.5.9000 [code], available at: https://github.com/PMassicotte/eemR (last access: 24 May 2019), 2016.
Mcknight, D. M., Boyer, E. W., Westerhoff, P. K., Doran, P. T., Kulbe, T., and Andersen, D. T.: Spectrofluorometric characterization of dissolved organic matter for indication of precursor organic material and aromaticity, Limnol. Oceanogr., 46, 38–48, 2001.
McMurdie, P. J. and Holmes, S.: phyloseq: An R Package for Reproducible Interactive Analysis and Graphics of Microbiome Census Data [code], PLoS One, 8, e61217, https://doi.org/10.1371/journal.pone.0061217, 2013.
Moneta, A., Veuger, B., van Rijswijk, P., Meysman, F., Soetaert, K., and Middelburg, J. J.: Dissolved inorganic and organic nitrogen uptake in the coastal North Sea: A seasonal study, Estuar. Coast. Shelf Sci., 147, 78–86, https://doi.org/10.1016/j.ecss.2014.05.022, 2014.
Mönnich, J., Tebben, J., Bergemann, J., Case, R., Wolhlrab, S., and Harder, T.: Niche-based assembly of bacterial consortia on the diatom Thalassiosira rotula is stable and reproducible, ISME J., 14, 1614–1625, https://doi.org/10.1038/s41396-020-0631-5, 2020.
Morris, R. M., Rappé, M. S., Connon, S. A., Vergin, K. L., Siebold, W. A., Carlson, C. A., and Giovannoni, S. J.: SAR11 clade dominates ocean surface bacterioplankton communities, Nature, 420, 806–810, https://doi.org/10.1038/nature01281.1., 2002.
Mühlenbruch, M., Grossart, H. P., Eigemann, F., and Voss, M.: Mini-review: Phytoplankton-derived polysaccharides in the marine environment and their interactions with heterotrophic bacteria, Environ. Microbiol., 20, 2671–2685, https://doi.org/10.1111/1462-2920.14302, 2018.
Murphy, K. R., Butler, K. D., Spencer, R. G. M., Stedmon, C. A., Boehme, J. R., and Aiken, G. R.: Measurement of dissolved organic matter fluorescence in aquatic environments: An interlaboratory comparison, Environ. Sci. Technol., 44, 9405–9412, https://doi.org/10.1021/es102362t, 2010.
Nieto-Cid, M., Álvarez-Salgado, X. A., and Pérez, F. F.: Microbial and photochemical reactivity of fluorescent dissolved organic matter in a coastal upwelling system, Limnol. Oceanogr., 51, 1391–1400, 2006.
Nimer, N. A., Iglesias-rodriguez, M. D., and Merrett, M. J.: Bicarbonate utilization by marine phytoplankton species, J. Phycol., 631, 625–631, 1997.
Norland, S.: The Relationship Between Biomass and Volume of Bacteria, in Handbook of Methods in Aquatic Microbial Ecology, Routledge, 303–306, 1993.
Oksanen, J., Blanchet, F. G., Friendly, M., Kindt, R., Legendre, P., McGlinn, D., Minchin, P. R., O'Hara, R. B., Simpson, G. L., Solymos, P., Stevens, M. H. H., Szoecs, E., and Wagner, H.: vegan: Community Ecology Package, R package version 2.5-5 [code], available at: https://CRAN.R-project.org/package=vegan (last access: 23 April 2020), 2019.
Olenina, I., Hajdu, S., Edler, L., Andersson, A., Wasmund, N., Busch, S., Göbel, J., Gromisz, S., Huseby, S., Huttunen, M., Jaanus, A., Kokkonen, P., Ledaine, I., and Niemkiewicz, E.: Biovolumes and Size-Classes of Phytoplankton in the Baltic Sea, HELCOM Balt, Sea Environ. Proc., 106, 1–144, 2006.
Orellana, M. V, Pang, W. L., Durand, P. M., Whitehead, K., and Baliga, N. S.: A Role for Programmed Cell Death in the Microbial Loop, PLoS One, 8, e62595, https://doi.org/10.1371/journal.pone.0062595, 2013.
Pedler, B. E., Aluwihare, L. I., and Azam, F.: Single bacterial strain capable of significant contribution to carbon cycling in the surface ocean, P. Natl. Acad. Sci. USA, 111, 7202–7207, https://doi.org/10.1073/pnas.1401887111, 2014.
Pérez, M. T. and Sommaruga, R.: Differential effect of algal- and soil-derived dissolved organic matter on alpine lake bacterial community composition and activity, Limnol. Oceanogr., 51, 2527–2537, https://doi.org/10.4319/lo.2006.51.6.2527, 2006.
Peters, G.: userfriendlyscience: Quantitative analysis made accessible, R package version 0.7.2 [code], https://doi.org/10.17605/osf.io/txequ, 2018.
Quast, C., Pruesse, E., Yilmaz, P., Gerken, J., Schweer, T., Yarza, P., Peplies, J., and Glöckner, F. O.: The SILVA ribosomal RNA gene database project: improved data processing and web-based tools [data set], Nucl. Acid. Res., 41, 590–596, https://doi.org/10.1093/nar/gks1219, 2013.
R Core Team: R: A language and environment for statistical computing, R Foundation for Statistical Computing [code], Vienna, Austria, available at: https://www.R-project.org/ (last access: 1 March 2020), 2019.
Riemann, B., Bjørnsen, P. K., Newell, S., and Fallon, R.: Calculation of cell production of coastal marine bacteria based on measured incorporation of [3H]thymidine, Limnol. Oceanogr., 32, 471–476, https://doi.org/10.4319/lo.1987.32.2.0471, 1987.
Riemann, L., Leitet, C., Pommier, T., Simu, K., Holmfeldt, K., Larsson, U., and Hagstro, Å.: The Native Bacterioplankton Community in the Central Baltic Sea Is Influenced by Freshwater Bacterial Species?, Appl. Environ. Microbiol., 74, 503–515, https://doi.org/10.1128/AEM.01983-07, 2008.
Rintala, J. M., Spilling, K., and Blomster, J.: Temporary cyst enables long-term dark survival of Scrippsiella hangoei (Dinophyceae), Mar. Biol., 152, 57–62, https://doi.org/10.1007/s00227-007-0652-x, 2007.
Romera-Castillo, C., Sarmento, H., Álvarez-Salgado, X. A., Gasol, J. M., and Marrase, C.: Production of chromophoric dissolved organic matter by marine phytoplankton, Limnol. Oceanogr., 55, 446–454, 2010.
Romera-Castillo, C., Sarmento, H., Álvarez-Salgado, X. A., Gasol, J. M., and Marrase, C.: Net Production and Consumption of Fluorescent Colored Dissolved Organic Matter by Natural Bacterial Assemblages Growing on Marine Phytoplankton Exudates, Appl. Environ. Microbiol., 77, 7490–7498, https://doi.org/10.1128/AEM.00200-11, 2011.
Saad, E. M., Longo, A. F., Chambers, L. R., Huang, R., Benitez-Nelson, C., Dyhrman, S. T., Diaz, J. M., Tang, Y., and Ingall, E. D.: Understanding marine dissolved organic matter production: Compositional insights from axenic cultures of Thalassiosira pseudonana, Limnol. Oceanogr., 61, 2222–2233, https://doi.org/10.1002/lno.10367, 2016.
Sapp, M., Schwaderer, A. S., Wiltshire, K. H., Hoppe, H.-G., Gerdts, G., and Wichels, A.: Species-specific bacterial communities in the phycosphere of microalgae?, Microb. Ecol., 53, 683–699, https://doi.org/10.1007/s00248-006-9162-5, 2007.
Sarmento, H. and Gasol, J. M.: Use of phytoplankton-derived dissolved organic carbon by different types of bacterioplankton, Environ. Microbiol., 14, 2348–2360, https://doi.org/10.1111/j.1462-2920.2012.02787.x, 2012.
Sarmento, H., Romera-Castillo, C., Lindh, M., Pinhassi, J., Sala, M. M., Gasol, J. M., Marrasé, C., and Taylor, G. T.: Phytoplankton species-specific release of dissolved free amino acids and their selective consumption by bacteria, Limnol. Oceanogr., 58, 1123–1135, https://doi.org/10.4319/lo.2013.58.3.1123, 2013.
Schäfer, H., Abbas, B., Witte, H., and Muyzer, G.: Genetic diversity of “satellite” bacteria present in cultures of marine diatoms, FEMS Microbiol. Ecol., 42, 25–35, https://doi.org/10.1016/S0168-6496(02)00298-2, 2002.
Seymour, J. R., Amin, S. A., Raina, J. B., and Stocker, R.: Zooming in on the phycosphere: The ecological interface for phytoplankton-bacteria relationships, Nat. Microbiol., 2, 1–12, https://doi.org/10.1038/nmicrobiol.2017.65, 2017.
Smith, D. C. and Azam, F.: A simple, economical method for measuring bacterial protein synthesis rates in seawater using 3H-leucine, Mar. Microb. Food Webs, 6, 107–114, 1992.
Spilling, K., Olli, K., Lehtoranta, J., Kremp, A., Tedesco, L., Tamelander, T., Klais, R., Peltonen, H., and Tamminen, T.: Shifting Diatom – Dinoflagellate Dominance During Spring Bloom in the Baltic Sea and its Potential Effects on Biogeochemical Cycling, Front. Mar. Sci., 5, 327, https://doi.org/10.3389/fmars.2018.00327, 2018.
Spilling, K., Fuentes-Lema, A., Quemaliños, D., Klais, R., and Sobrino, C.: Primary production, carbon release, and respiration during spring bloom in the Baltic Sea, Limnol. Oceanogr., 64, 1779–1789, https://doi.org/10.1002/lno.11150, 2019.
Stedmon, C. A. and Markager, S.: Tracing the production and degradation of autochthonous fractions of dissolved organic matter by fluorescence analysis, Limnol. Oceanogr., 50, 1415–1426, 2005.
Storch, T. A. and Saunders, G. W.: Phytoplankton extracellular release and its relation to the seasonal cycle of dissolved organic carbon in a eutrophic lake, Limnol. Oceanogr., 23, 112–119, https://doi.org/10.4319/lo.1978.23.1.0112, 1978.
Strom, S. L., Benner, R., Ziegler, S., and Dagg, M. J.: Planktonic grazers are a potentially important source of marine dissolved organic carbon, Limnol. Oceanogr., 42, 1364–1374, https://doi.org/10.4319/lo.1997.42.6.1364, 1997.
Suikkanen, S., Hakanen, P., Spilling, K., and Kremp, A.: Allelopathic effects of Baltic Sea spring bloom dinoflagellates on co-occurring phytoplankton, Mar. Ecol. Prog. Ser., 439, 45–55, https://doi.org/10.3354/meps09356, 2011.
Suksomjit, M., Nagao, S., Ichimi, K., Yamada, T., and Tada, K.: Variation of dissolved organic matter and fluorescence characteristics before, during and after phytoplankton bloom, J. Oceanogr., 65, 835–846, https://doi.org/10.1007/s10872-009-0069-x, 2009.
Tada, Y., Nakaya, R., Goto, S., Yamashita, Y., and Suzuki, K.: Distinct bacterial community and diversity shifts after phytoplankton-derived dissolved organic matter addition in a coastal environment, J. Exp. Mar. Bio. Ecol., 495, 119–128, https://doi.org/10.1016/j.jembe.2017.06.006, 2017.
Taylor, F. J. R. and Pollingher, U.: Ecology of Dinoflagellates, in: Biology of Dinoflagellates, Blackwell Scientific Publications, Oxford, 1987.
Teeling, H., Fuchs, B. M., Becher, D., Klockow, C., Gardebrecht, A., Bennke, C. M., Kassabgy, M., Huang, S., Mann, A. J., Waldmann, J., Weber, M., Klindworth, A., Otto, A., Lange, J., Bernhardt, J., Reinsch, C., Hecker, M., Peplies, J., Bockelmann, F. D., Callies, U., Gerdts, G., Wichels, A., Wiltshire, K. H., Glöckner, F. O., Schweder, T., and Amann, R.: Substrate-controlled succession of marine bacterioplankton populations induced by a phytoplankton bloom, Science, 336, 608–611, https://doi.org/10.1126/science.1218344, 2012.
Thornton, D. C. O.: Dissolved organic matter (DOM) release by phytoplankton in the contemporary and future ocean, Eur. J. Phycol., 49, 20–46, https://doi.org/10.1080/09670262.2013.875596, 2014.
Urbani, R., Magaletti, E., Sist, P., and Cicero, A. M.: Extracellular carbohydrates released by the marine diatoms Cylindrotheca closterium, Thalassiosira pseudonana and Skeletonema costatum: Effect of P-depletion and growth status, Sci. Total Environ., 353, 300–306, https://doi.org/10.1016/j.scitotenv.2005.09.026, 2005.
Weishaar, J. L., Aiken, G. R., Bergamaschi, B. A., Fram, M. S., Fujii, R., and Mopper, K.: Evaluation of specific ultraviolet absorbance as an indicator of the chemical composition and reactivity of dissolved organic carbon, Environ. Sci. Technol., 37, 4702–4708, https://doi.org/10.1021/es030360x, 2003.
Wickham, H.: ggplot2: Elegant Graphics for Data Analysis, Springer-Verlag, New York, 2016.
Yamashita, Y. and Tanoue, E.: Chemical characteristics of amino acid-containing dissolved organic matter in seawater, Org. Geochem., 35, 679–692, https://doi.org/10.1016/j.orggeochem.2004.02.007, 2004a.
Yamashita, Y. and Tanoue, E.: In situ production of chromophoric dissolved organic matter in coastal environments, Geophys. Res. Lett., 31, 1–5, https://doi.org/10.1029/2004GL019734, 2004b.
Yamashita, Y., Hashihama, F., Saito, H., Fukuda, H., and Ogawa, H.: Factors controlling the geographical distribution of fluorescent dissolved organic matter in the surface waters of the Pacific Ocean, Limnol. Oceanogr., 62, 2360–2374, https://doi.org/10.1002/lno.10570, 2017.
Zsolnay, A., Baigar, E., Jimenez, M., Steinweg, B., and Saccomandi, F.: Differentiating with fluorescence spectroscopy the sources of dissolved organic matter in soils subjected to drying, Chemosphere, 38, 45–50, https://doi.org/10.1016/S0045-6535(98)00166-0, 1999.
- Abstract
- Introduction
- Methods
- Results
- Discussion
- Conclusions
- Appendix A: Variables which were measured but not included in the detailed analysis
- Appendix B: Results of statistical tests
- Data availability
- Author contributions
- Competing interests
- Disclaimer
- Acknowledgements
- Financial support
- Review statement
- References