the Creative Commons Attribution 4.0 License.
the Creative Commons Attribution 4.0 License.
 | 05 Feb 2021
Predicting evapotranspiration from drone-based thermography – a method comparison in a tropical oil palm plantation
Christian Stiegler
Alexander Röll
Tania June
Hendrayanto
Alexander Knohl
Dirk Hölscher
For the assessment of evapotranspiration, near-surface airborne thermography offers new opportunities for studies with high numbers of spatial replicates and in a fine spatial resolution. We tested drone-based thermography and the subsequent application of the DATTUTDUT energy balance model using the widely accepted eddy covariance technique as a reference method. The study site was a mature oil palm plantation in lowland Sumatra, Indonesia. For the 61 flight missions, latent heat flux estimates of the DATTUTDUT (Deriving Atmosphere Turbulent Transport Useful To Dummies Using Temperature) model with measured net radiation agreed well with eddy covariance measurements (r2 = 0.85; MAE = 47; RMSE = 60) across variable weather conditions and times of day. Confidence intervals for slope and intercept of a model II Deming regression suggest no difference between drone-based and eddy covariance methods, thus indicating interchangeability. The DATTUTDUT model is sensitive to the configuration of the net radiation assessment. Overall, we conclude that drone-based thermography with energy balance modeling is a reliable method complementing available methods for evapotranspiration studies. It offers promising, additional opportunities for fine grain and spatially explicit studies.
- Article
(7921 KB) - Full-text XML
- BibTeX
- EndNote


Evapotranspiration (ET) is a central flux in the hydrological cycle on a regional and on a global scale. Terrestrial ET consumes almost two-thirds of terrestrial precipitation (Oki and Kanae, 2006). There is an interest in better understanding ET and its drivers as climate change is expected to increase atmospheric evaporative demand, and droughts are predicted to become more severe and frequent in the future (Prudhomme et al., 2014). ET is also strongly affected by land-cover and land-use changes, which are currently very pronounced in tropical regions (Hansen et al., 2013).
The eddy covariance (EC) technique is a widely accepted and well-established method to quantify ET at the stand scale (Baldocchi et al., 2001; Fisher et al., 2017). It results in a single latent heat (LE) flux value integrated over the footprint of the EC tower at a given time that can be converted to an ET estimate. A spatial fine grain attribution of different surface patches to this overall ET value is generally not possible. The EC method is costly and labor intensive; therefore, a relatively low number of spatial replicates within a given region and among its different ecosystems are typically available. The EC method also has certain constrains regarding topography, atmospheric turbulence and landscape heterogeneity (Göckede et al., 2008).
A complementary approach for assessing LE at larger spatial scales is the use of remotely sensed land surface temperatures (LSTs) as boundary conditions for energy balance modeling and subsequent conversion to ET (Brenner et al., 2017; Guzinski et al., 2014; Hoffmann et al., 2016; Ortega-Farías et al., 2016; Xia et al., 2016). Transpiration from leaf surfaces leads to evaporative cooling of the canopy; LSTs, along with air temperature, can thus be used as a reliable indicator of plant water use, both in monocultures and in spatially highly heterogeneous systems such as natural forests (Lapidot et al., 2019). Compared to the EC method, this approach can potentially increase the number of spatial replicates within and among ecosystems, and it is also applicable in challenging terrain. Remotely sensed LSTs are regarded as good indicators for plant water use, stress and transpiration (Jones and Vaughan, 2010). One approach to obtain LST data is the use of satellite-based observations (Allen et al., 2007; Bastiaanssen et al., 1998; Ershadi et al., 2013). However, the spatial resolution of LST satellite data such as Landsat TM, ASTER, MODIS or AVHRR ranges from 90 m to 1 km, limiting the distinction of plant canopies and soil (Berni et al., 2009). A higher temporal resolution of satellite-based thermal infrared (TIR) observations is usually associated with a lower spatial resolution, and TIR data from satellites in both high spatial and high temporal resolutions are not yet available (Brenner et al., 2017). Additionally, clouds are barriers for thermal radiation and therefore have a strong effect on the quality and availability of satellite-based TIR observations (Guzinski et al., 2013). This is of particular importance in regions with frequent cloud cover such as in tropical environments.
An alternative recently emerging approach to measure LSTs is the use of drones. Radiometric TIR sensors for LST recording have become lightweight and affordable, and drones are now capable of carrying adequate payloads for reasonable time spans. Near-surface thermography-based studies allow for temporal resolutions in flexible, e.g., hourly, time steps and a spatial resolution in the decimeter scale or finer. Drone-based TIR recording and subsequent modeling of LE with energy balance models has previously shown promising results for short grass and crop vegetation in central Europe (Brenner et al., 2018; Hoffmann et al., 2016). However, remote sensing of LST from drones is challenging and involves careful planning. Recording LST close to the surface results in a high resolution but reduces the area covered in a certain time span compared to surveying from a higher altitude. Increasing flight altitude reduces spatial resolution of LST images and thus increases the averaging of surface temperatures from individual canopies, soil patches and branches from neighboring canopies into a single pixel (Still et al., 2019). Further, air humidity can have a major effect on measurement accuracy as water vapor not only attenuates the signals from the surface of interest to the sensor but also emits its own thermal radiation (Still et al., 2019).
Different energy balance models are available to compute LE from LST and subsequently calculate ET. In the one-source energy balance model DATTUTDUT (Deriving Atmosphere Turbulent Transport Useful To Dummies Using Temperature) (Timmermans et al., 2015), fluxes are estimated by relating single pixel temperatures to local temperature extremes. Crucial in applying such energy balance models is how the net radiation (Rn) is implemented. In the original formulation of the DATTUTDUT model, Rn is fully modeled, assuming a range of prerequisites and environmental conditions (Timmermans et al., 2015). Using airplanes or drones to record LSTs, the DATTUTDUT model previously showed promising results for grass and vineyard surfaces in temperate and subtropical regions (Brenner et al., 2018; Xia et al., 2016). However, to our knowledge, a comprehensive method comparison considering potential errors in both a reference method (e.g., the EC technique) and novel drone-based approaches is not yet available. Since full method comparisons based on model II regression require a sample size of at least n=60 data pairs (Legendre and Legendre, 2003), many previous studies with smaller sample sizes were constrained to using error terms and correlation coefficients.
The current study was conducted in the lowlands of Jambi province (Sumatra, Indonesia) where, over the last decades, large areas of rainforest have been converted to rubber and oil palm plantations (Clough et al., 2016; Margono et al., 2012). This resulted in regional-scale changes in transpiration (Röll et al., 2019) and land surface warming (Sabajo et al., 2017). We assessed energy fluxes in a mature monoculture oil palm plantation and compared the LE estimates of drone-based methods with the established EC method as measured ground-based reference. The DATTUTDUT energy balance model was tested, with three different configurations for the determination of Rn (fully modeling Rn, Rn estimates based on short-wave irradiance and measuring Rn). The objectives of our study were to compare LE estimates from the drone-based methods to the EC technique, with a special focus on the detection of proportional and continuous errors among the methods and an evaluation of the model's prediction performance. The present study focuses on the comparison of different drone-based methods as a baseline for future ecological studies, rather than applying the methods to different land-use types.
2.1 Study site
The study site is located in the lowlands of Jambi province (Sumatra, Indonesia) near the Equator (1.6929879 S, 103.3914411 E; 76 m a.s.l.). Average annual air temperature in the region is 26.5 ∘C, and average annual precipitation is 2235 mm yr−1 (Drescher et al., 2016). At the time of our measurement campaign in August 2017, the studied monoculture oil palm (Elaeis guineensis) plantation was 15 years old. Palm stem density was 140 palms ha−1, with an average palm height of 14.3 m and an average canopy radius of 4.5 m. Leaf area index (LAI) was estimated at 3.64 m2 m−2 (Fan et al., 2015), and canopy cover was estimated to be 90 %. Plantation management included the removal of older and non-vital leaves from the oil palms, herbicide application to remove most understory plants and fertilization (196 kg N ha−1 yr−1) (Meijide et al., 2017). The average annual oil palm yield is 27.7 Mg ha−1. An EC tower (22 m height) is situated in the center of the site with a fetch of up to 500 m in all directions (Meijide et al., 2017) (Fig. 1).
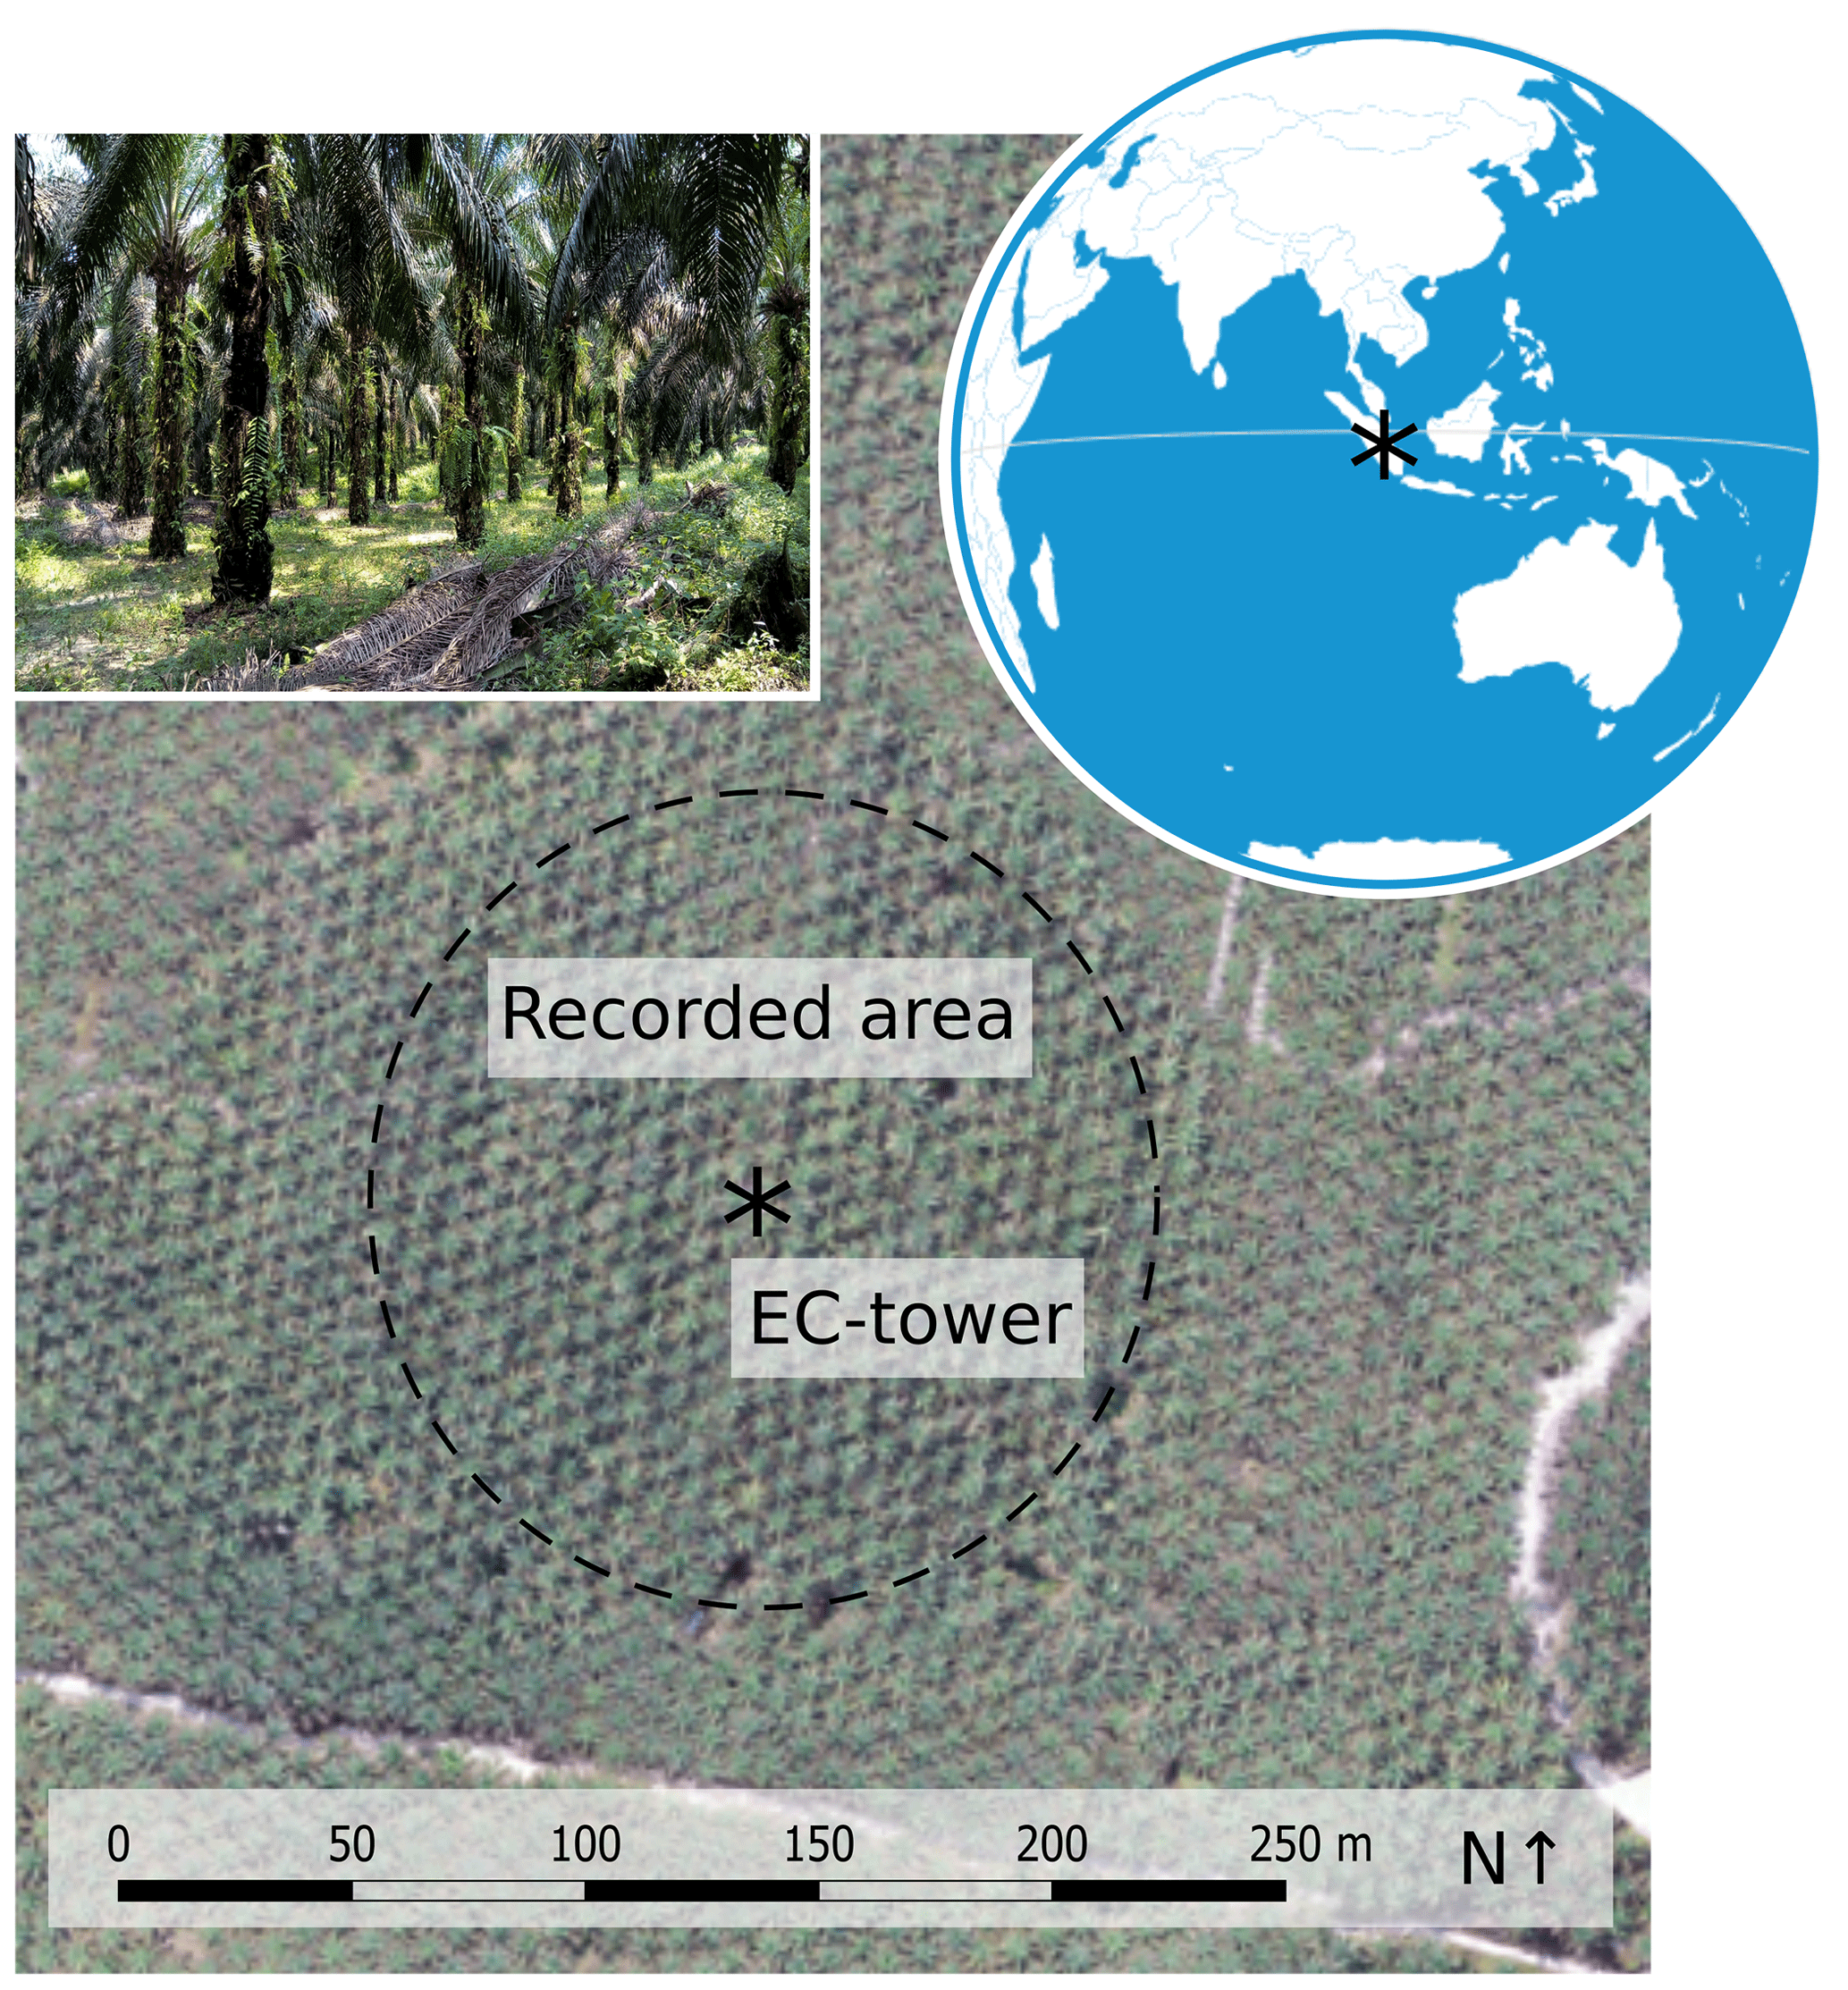
Figure 1The study site in a mature commercial oil palm plantation in the lowlands of Jambi province, Sumatra, Indonesia.
2.2 Drone-based image acquisition
We used an octocopter drone (MK EASY Okto V3; HiSystems, Germany) equipped with a thermal and an RGB camera mounted in a stereo setup on a gimbal to ensure nadir perspective. The radiometric thermal camera was a FLIR Tau 2 640 (FLIR Systems, USA) attached to a TeAx ThermalCapture module (TeAx Technology, Germany). The sensor covers spectral bands ranging from 7.5 to 13.5 µm with a relative thermal accuracy of 0.04 K and an absolute thermal accuracy of ± 2 K (FLIR Systems, USA). The RGB camera was based on an Omnivision OV12890 CMOS sensor (Omnivision, USA) with a 170∘ field-of-view (FOV) fish-eye lens. Instead of the mosaicking approaches applied in most of the mentioned previous studies, we used a single image recording concept as faster image acquisition allows for a denser temporal resolution of LSTs. To capture an area of 100 m radius around the EC tower in a single shot of the thermal camera, images were taken from 260 m altitude. Image corners were removed due to vignetting effects. During a consecutive 5 d flight campaign in August 2017, 61 LST datasets and matching EC measurements were recorded. Flights were conducted between 09:00 and 16:00 LT (local time), in accordance with the 30 min intervals of the EC averaging cycles, resulting in 10 to 14 flights per day. All LSTs were measured using a fixed emissivity of one as the energy balance model would introduce an emissivity parameter in the process.
2.3 Energy balance models
LSTs are recorded as “snapshots” representing an instantaneous state of surface temperatures. Soil-Vegetation-Atmosphere Transfer (SVAT) models use these instantaneous observations of LST to solve the energy balance equation and estimate instantaneous fluxes. In our study the one-source energy balance model DATTUTDUT (Timmermans et al., 2015) was applied. Using drones, the proximity of the thermal camera to the surface is much closer compared to other typical carriers (such as satellites or planes); hence, atmospheric effects are supposed to have only a very minor effect. We used directional radiometric temperature recordings from the drone as input without applying further corrections. All model configurations in this study use instantaneous land surface temperatures (LSTs) to solve the energy balance equation:
where Rn is the net radiation, G is the ground heat flux, and the turbulent fluxes H and LE represent sensible and latent heat fluxes, respectively. Rn is estimated by calculating the budget of incoming (↓) and outgoing (↑) long-wave (Rl) and short-wave (Rs) radiation:
where the short-wave component is calculated by multiplying incoming short-wave radiation Rs↓ [W m−2] with its absorption ratio deducted from the combined soil and vegetation albedo Psurf. This way, reflected outgoing short-wave radiation Rs↑ is subtracted from the energy balance. The long-wave radiation budget is calculated from surface (soil and vegetation) emissivity εsurf, atmospheric emissivity εatm, the Stefan–Boltzmann constant σ ( W m−2 K−4), air temperature Tair and radiometric land surface temperature Tsurf (both in kelvin). The incoming long-wave radiation component is added to the budget and the outgoing long-wave radiation is subtracted.
2.3.1 DATTUTDUT
Key input for the DATTUTDUT model is a LST map from where the hottest (Tmax) and the 0.005 quantile of coldest pixels (Tmin) are extracted, assuming that hot pixels are a result of very little to no evapotranspiration and cold pixels originate from a high evapotranspiration rate (Timmermans et al., 2015). Fully modeled Rn is computed based on downwelling short-wave radiation estimates calculated using sun–earth geometry to solve Eq. (2). Therefore, surface albedo Psurf is calculated as in Timmermans et al. (2015) based on the assumption that dense vegetation appears colder than rocks or soil in the thermal imagery (Brutsaert, 1982; Garratt, 1992):
Downwelling short-wave radiation Rs↓ is calculated from the dimensionless atmospheric transmissivity τ and the exoatmospheric short-wave radiation SWexo=1360 W m−2 (Timmermans et al., 2015). Transmissivity τ is calculated as described in Burridge and Gadd (1977) using the solar elevation angle α that was determined from the geographic position of our site and the coordinated universal time (UTC) of the measurements:
Timmermans et al. (2015) suggest using a constant value of 0.7 for τ and 0.8 atmospheric emissivity (εatm), but as our flight times range from 09:00 to 16:30 LT, we decided to include the solar elevation angle as in Eq. (4). Further, we used a constant surface emissivity (εsurf) of 0.98 as recommended for vegetation-dominated areas (Jones and Vaughan, 2010) and not 1.0 as simplified in the original formulation of the DATTUTDUT model. Air temperature Tair was calculated as the 0.005 quantile of the coldest pixels in the image.
As the original DATTUTDUT formulation does not account for cloud cover, Eq. (5) is replaced by measured short-wave irradiance as in Brenner et al. (2018) for model runs with Rn_sw. For model runs with Rn_mes, Eq. (2) was replaced by Rn measurements recorded at the EC tower.
The sum of the turbulent fluxes is calculated by subtracting G from Rn. The result is allocated into its components H and LE, using the evaporative fraction (EF) (Timmermans et al., 2015):
To implement the DATTUTDUT model, we used the QGIS3 plugin QWaterModel (Ellsäßer et al., 2020) that is provided with an easy-to-use graphical user interface.
The actual amount of evapotranspiration (ET, in mm h−1) was calculated similar to Timmermans et al. (2015):
where LE is the latent heat flux in W m−2, t is the respective time span in seconds and Tair is the air temperature in kelvin.
2.4 Eddy covariance measurements
The micrometeorological tower is located in the center of the study site (Fig. 1). The EC technique was used to measure LE and H fluxes from high-frequency (10 Hz) measurements of above-canopy water vapor concentration, sonic temperature and 3-D wind components. The flux system consisted of a sonic anemometer (Metek uSonic-3 Scientific, Elmshorn, Germany) and a fast response open-path CO2 H2O infrared gas analyzer (Li-Cor7500A, LI-COR Inc., Lincoln, USA) installed at 22 m height. Meteorological variables were measured every 10 s, averaged to 10 min means and stored on a DL16 Pro data logger (Thies Clima, Göttingen, Germany). Rn and its components were measured with a net radiometer (CNR4, Kipp & Zonen, Delft, the Netherlands) at 22 m height. Air temperature and relative humidity were measured with thermohygrometers (type 1.1025.55.000, Thies Clima, Göttingen, Germany) at 16.3 m height. Further, a wind direction sensor (Thies Clima, Göttingen, Germany) (22 m height) and three-cup anemometers (Thies Clima, Göttingen, Germany) (18.5, 15.4, 13 and 2.3 m heights) for wind speed measurements were installed on the tower. Ground heat flux was measured using heat flux plates (HFP01, Huxeflux, Delft, the Netherlands) at 10 cm depth. Additional soil moisture and temperature measurements (Trime-Pico 32, Imko, Ettlingen, Germany) above the heat flux plate at 5 cm depth were used to calculate heat flux at the soil surface. EC data recording, filtering and processing were carried out identical to the methodology described in Meijide et al. (2017) for the same study site. As the applied drone-based model assumes full energy balance closure, we used the Bowen ratio closure method (Pan et al., 2017; Twine et al., 2000) to compute full closure for the EC measurements. The Bowen ratio method was found to produce the most congruent results in conjunction with drone-based latent heat flux estimates (Brenner et al., 2017) and was therefore applied in this study. The energy balance closure (EBC) of the reference EC measurements was 0.77 (r2=0.87), which is in line with EBC reported for other tall vegetation canopies (Stoy et al., 2013). Since the DATTUTDUT energy balance model assumes full EBC, we applied the so-called Bowen ratio closure method to the EC data (Pan et al., 2017). The method assumes that wind measurements miss some of the total covariance and dispersive fluxes. Therefore, underestimations of LE and H are carried over proportionally because of similarity among fluxes (Twine et al., 2000). The Bowen ratio closure method proportionally assigns the underestimated turbulent energy to LE and H fluxes to reach full EBC.
EC data processing and quality checks were performed following the methodology described in Meijide et al. (2017). Following Mauder and Foken (2006), flux estimates during low turbulence and thus stable atmospheric conditions were removed from the analysis; however, low turbulence mainly occurred during night hours and was not observed during the daytime drone flights. Generally, the EC method is associated with uncertainties of 5 %–20 % (Foken, 2008). Further limitations are the high costs and quite specific requirements regarding size and terrain of the study site.
2.5 Statistical analyses
Both methods, the reference EC technique and the drone-based estimates, are associated with a certain degree of uncertainty. A model II Deming regression (Deming, 1964) was applied for the analysis to consider uncertainties in both x and y variables (Cornbleet and Gochman, 1979; Glaister, 2001). We assumed that the error ratio () of the variances (σ) of errors on y (εi) and on x (δi) would not differ from 1, which is the standard procedure if both uncertainties are unknown (Legendre and Legendre, 2003). We used the interquartile range method with a factor k=1.5 to remove outliers from the regression. A Durbin–Watson test was applied to test for correlation in error terms. We checked for heteroscedasticity visually and using a White test. Normal distribution of error terms was tested visually plotting standardized residuals vs. theoretical quantities and performing a Shapiro–Wilk test. Standard errors and confidence intervals for slope and intercept of the Deming regression were calculated using analytical methods (parametric) and the jackknife method (Armitage et al., 2001; Linnet, 1993). As further supporting indicators of model performance, we calculated the coefficients of determination (r2), the mean absolute error (MAE), the root mean square error (RMSE), and slope and intercept from the Deming regression. Statistics such as r2 have their limitations in method comparison since they are designed to indicate how well the resulting model of the regression describes the outcome and are not necessarily a good measure for systematic bias between methods. However, they are used as a statistic in this study since they represent an additional indicator for interpretation. Linearity was checked visually plotting residuals vs. fitted values.
All modeling procedures and parts of the statistical analyses were computed using Python version 3.7.1 (Python Software Foundation), involving the libraries NumPy 1.14.2, SciPy 1.1.0, pandas 0.23.1, scikit-learn 0.19.1, gdal 2.3.2, Astropy 3.2.2 and tkinter 8.6. The Deming regression was computed using the mcr v2.2.1 package (Manuilova et al., 2014) in R version 3.6.1 (R Development Core Team, 2019). Graphic representation was processed in Python using the Matplotlib 3.0.2 and Seaborn 0.9.0 libraries.
2.6 Dataset characteristics
The dataset offers a comparatively high number of replicates from 61 drone flights and the corresponding eddy covariance measurements, enabling a method comparison which requires at least n=60 observations (Legendre and Legendre, 2003). The data were recorded at a 30 min frequency to facilitate the analysis of daily courses of evapotranspiration behavior, creating a trade-off situation of more flights per day with shorter flight times per flight. Because flight times were so short, only a smaller footprint with a radius of 100 m around the eddy covariance station was covered, while the footprint recorded with the eddy covariance system ranged up to a 500 m radius around the tower. Therefore, the reduced area of the drone-recorded LST maps is often smaller than the extent of the eddy covariance footprint. We have several reasons to assume that this does not cause major problems for the comparison though: the study area is very homogenous with an elevation difference of 5 m in the eddy covariance footprint, and the biosphere is strongly dominated by only one species (oil palm). The plantation is very well managed so that all oil palm canopies are alive; no oil palms have died and only dry leaves are removed.
3.1 Meteorology
During our 61 flight missions, cloudiness was variable from clear sky to full cloud cover; short-wave irradiance ranged from 204 to 1110 W m−2. The prevailing wind direction was from northeast, at an average wind speed of 1.7 m s−1. Canopy air temperature ranged from 22.5 to 32.3 ∘C, and relative humidity varied between 62 % and 99 %. Temperature differences between measured air temperature at 16.3 m (top of canopy) and mean land surface temperatures ranged from 0.005 K to a single peak of 8.689 K for the single flights, while the daily averaged differences ranged from 1.32 to 2.13 K. The energy balance closure of the reference EC measurements was 0.77 (r2=0.87).
3.2 Drone-based modeling methods vs. eddy covariance method
At the time of the drone flights, LE from the EC method ranged between 87 and 596 W m−2 (mean: 337 W m−2) and eddy covariance-derived evapotranspiration was on average 0.43 ± 0.21 mm h−1, with peak evapotranspiration of up to 0.87 mm h−1 during midday. Congruence of LE estimates with reference EC measurements differed among the three applied models and was further affected by the configuration of the Rn assessment (Fig. 2). The assumptions for Rn_mod were not always met as cloud cover was present during several flights; consequently, the corresponding net radiation estimates were too high, leading to a substantial overestimation especially of smaller latent heat fluxes in the DATTUTDUT model. The short-wave irradiance-based Rn_sw configuration resulted in Rn estimates that were on average very comparable with the measured net radiation Rn_mes but also showed a rather high variation (Fig. 2). Generally, error metrics were reduced and agreement was increased the more measurement-controlled the Rn determination process was.
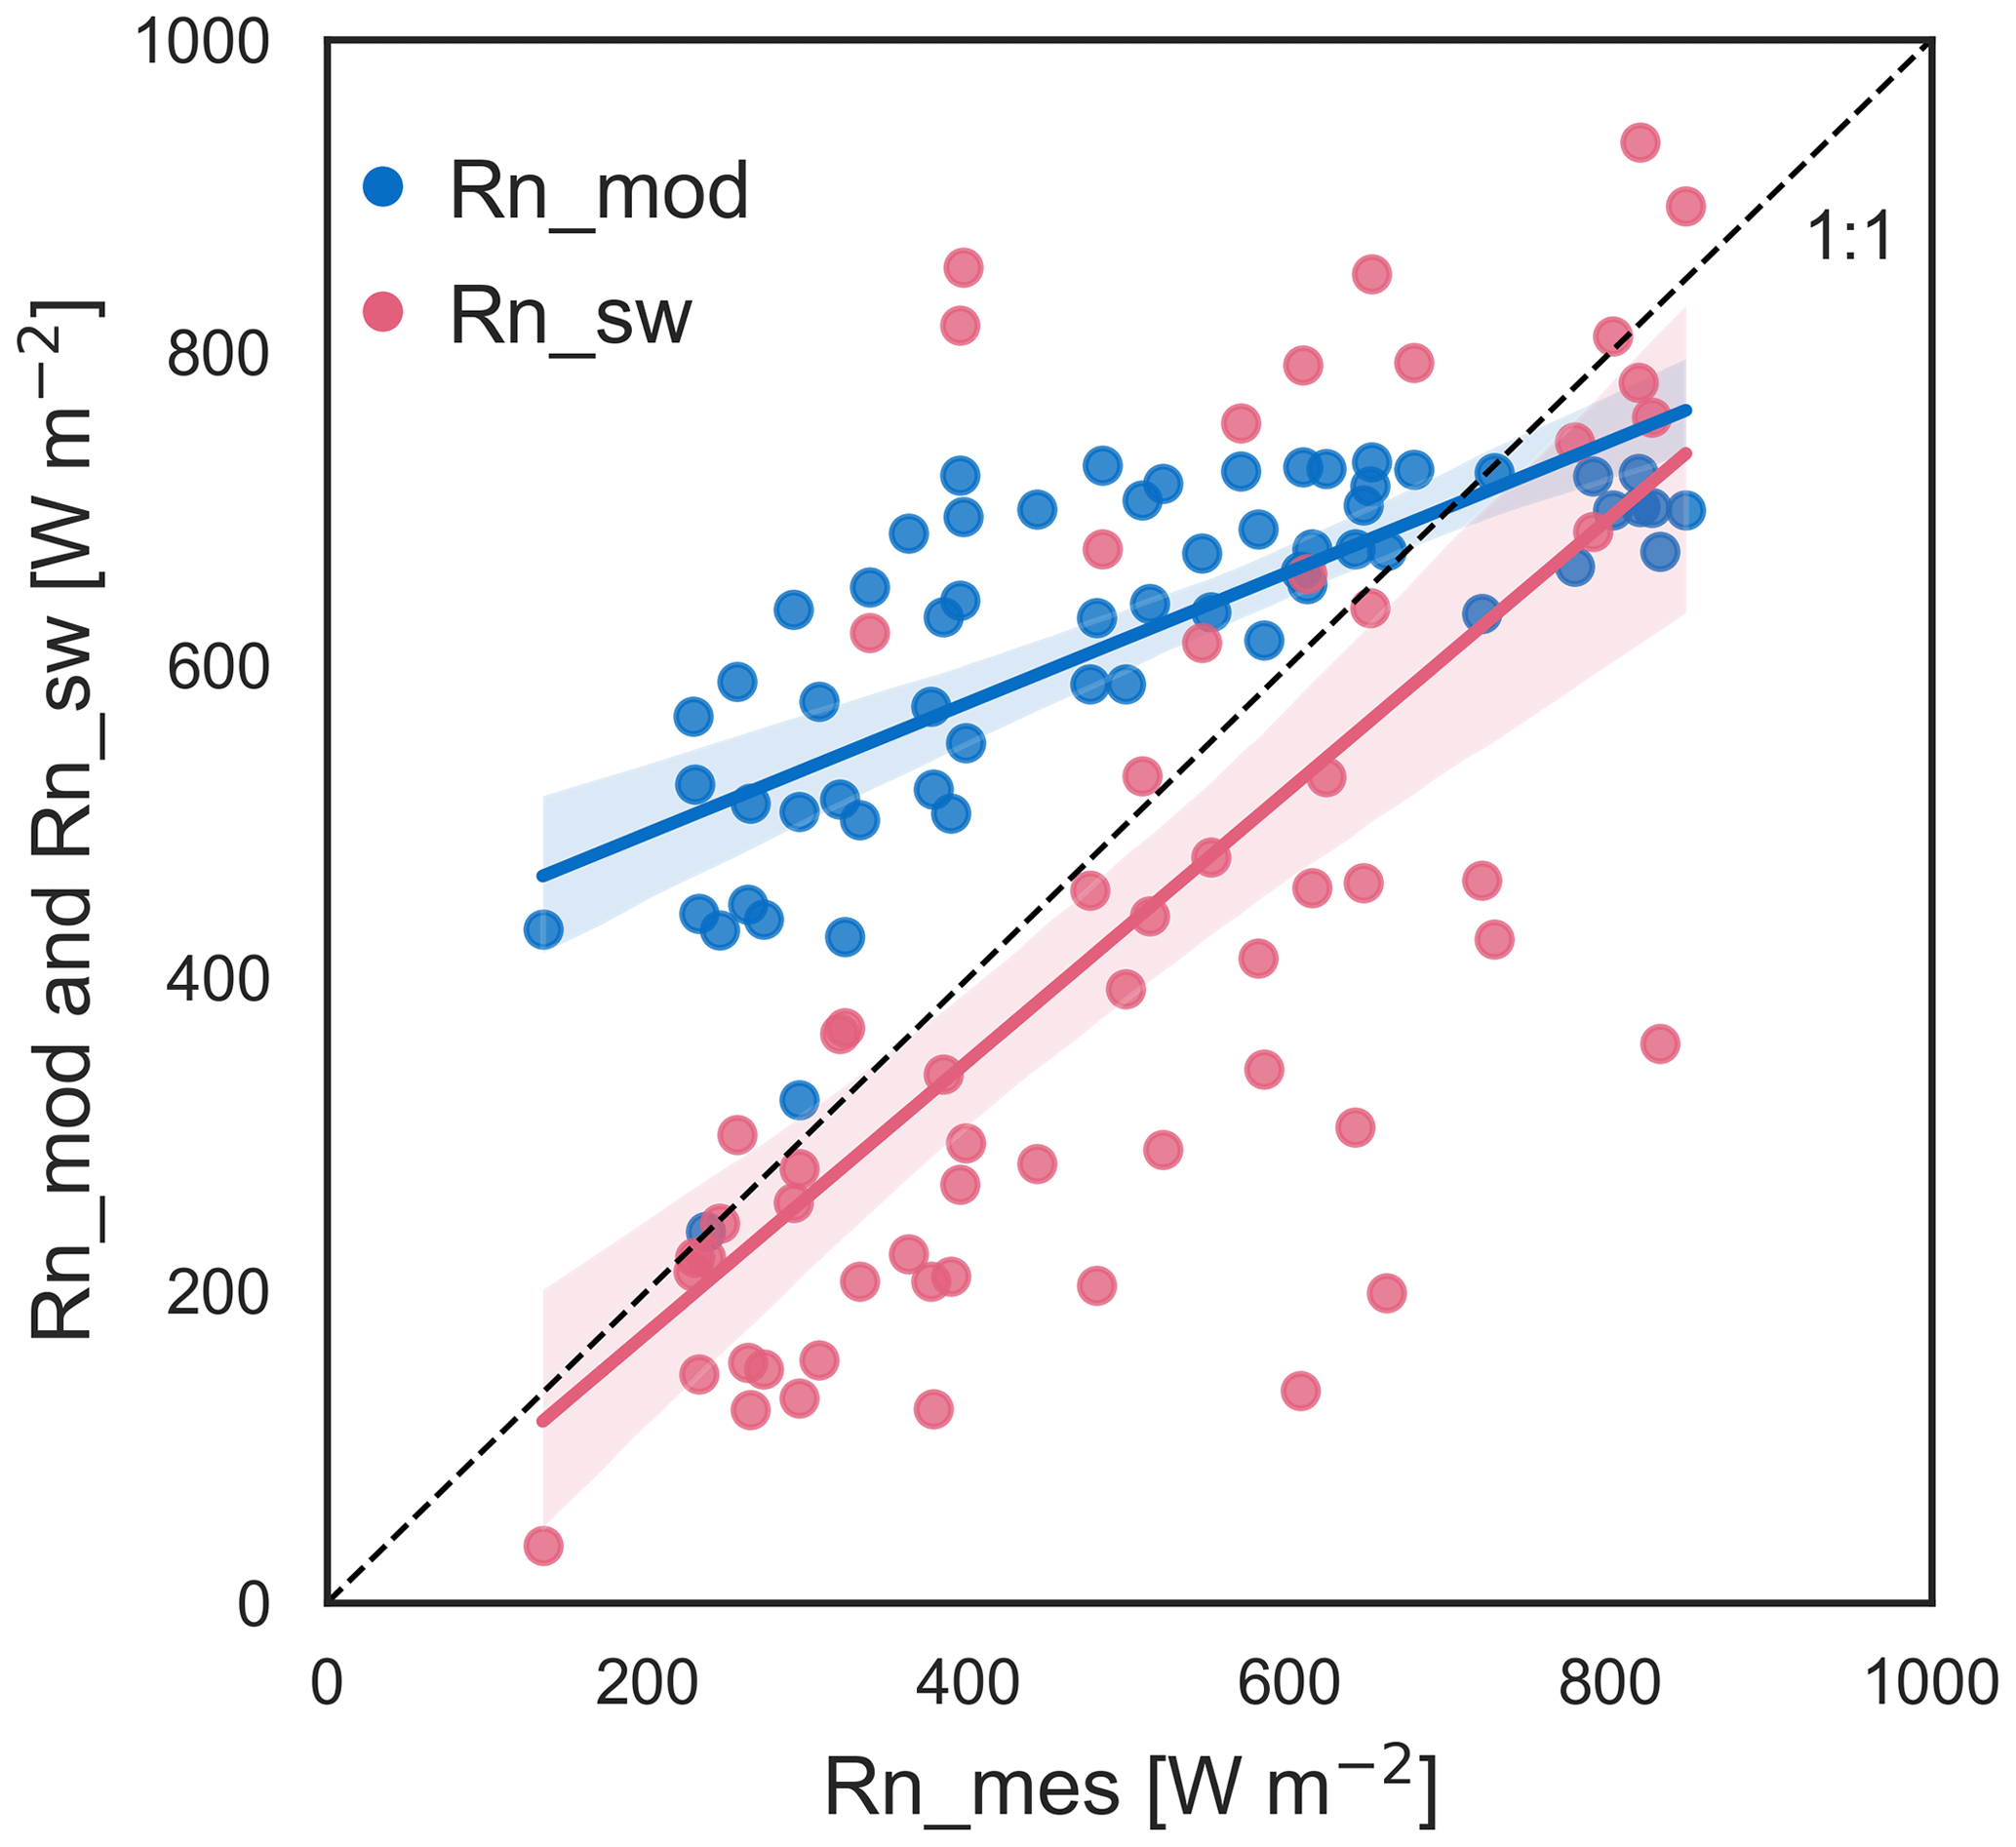
Figure 2Measured net radiation (Rn_mes) plotted against fully modeled net radiation (Rn_mod) and net radiation estimates based on short-wave irradiance (Rn_sw).
DATTUTDUT LE estimates closely agreed with EC measurements around noon, but were higher in the morning and afternoon hours, which is caused by overestimations of Rn from the Rn_mod method (Fig. 3a). The DATTUTDUT model configuration with Rn_sw produced LE estimates that matched LE from EC more closely (Fig. 3b). DATTUTDUT computed similar or higher estimates of LE compared to the EC measurements during noon but mostly underestimated LE fluxes in the morning and afternoon. With Rn_mes configuration, DATTUTDUT computed closely matching LE estimates at all times of day across the 5 d measurement period (Fig. 3c).
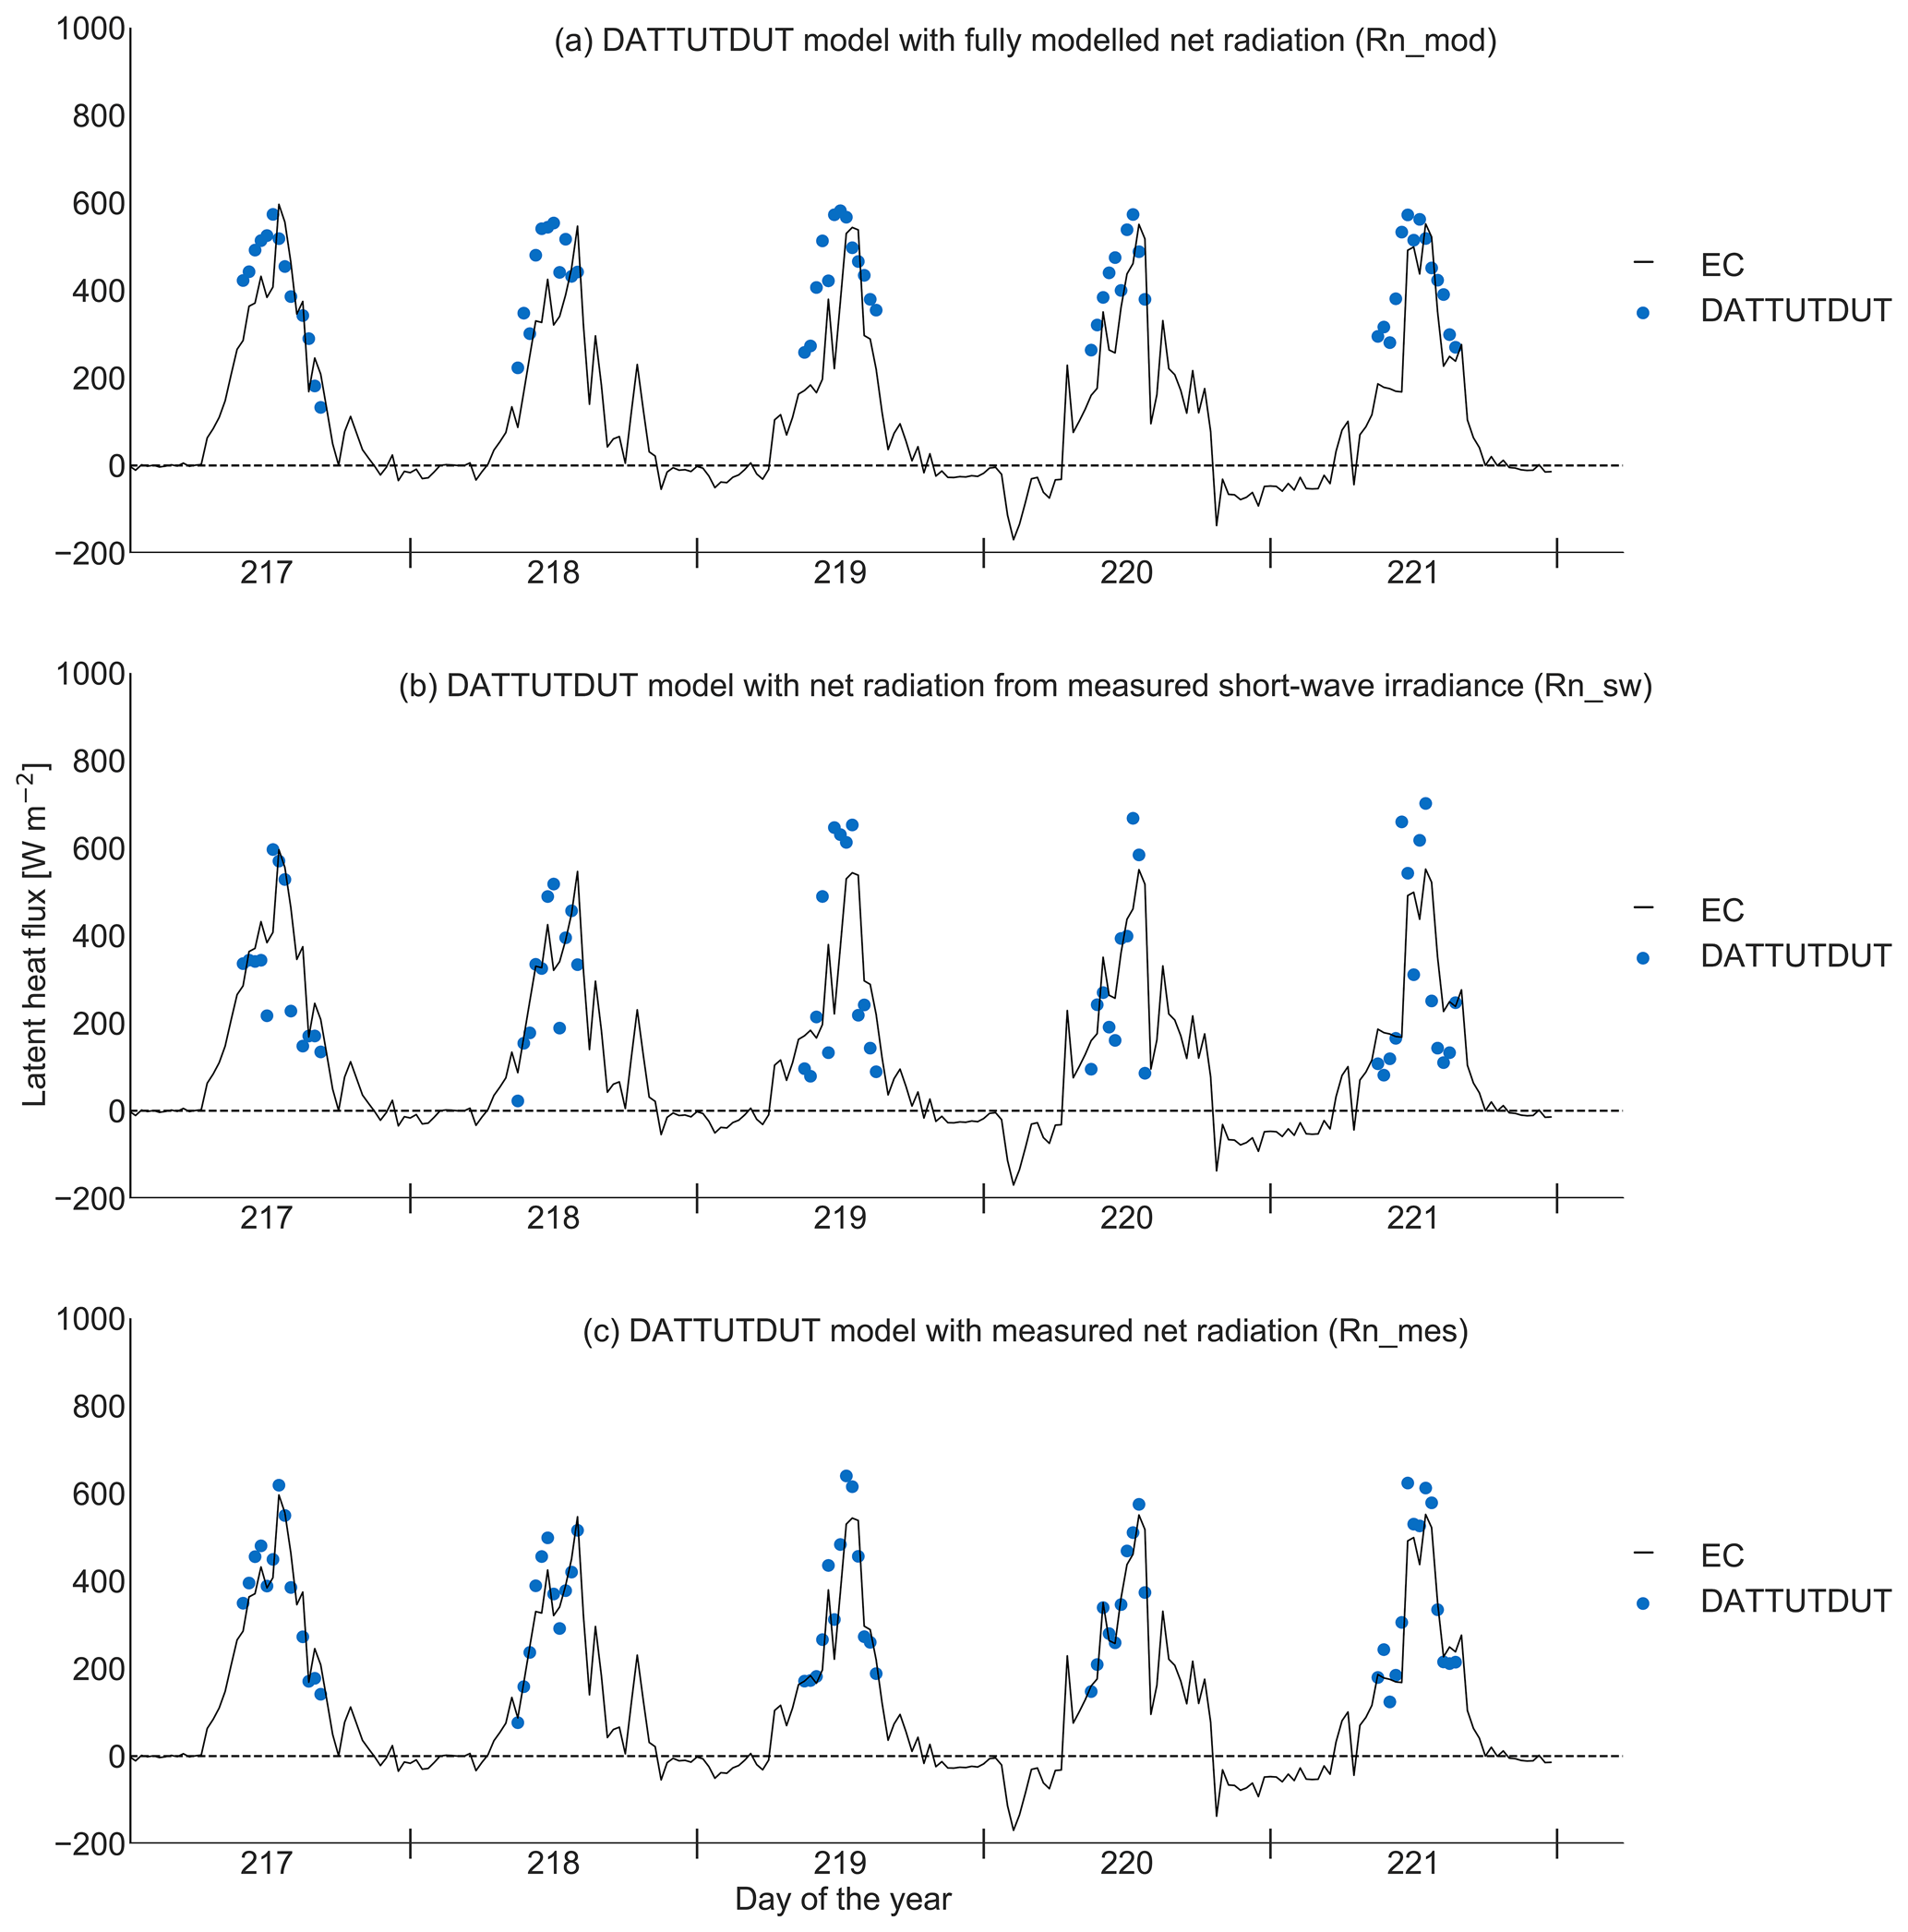
Figure 3Latent heat flux (LE) from the DATTUTDUT energy balance model and three different configurations of net radiation (Rn) determination (Rn_mod, Rn_sw, Rn_mod) and eddy covariance measurements (EC) over five consecutive days (n = 61 flight missions).
Across all times of day and weather conditions (n=61 flight missions), congruence among drone-based LE estimates and reference EC measurements was highest for the DATTUTDUT model with Rn_mes configuration (r2 = 0.85); MAE and RMSE were 47 and 60 W m−2, respectively (Fig. 4). To compare the model predictions and the eddy covariance measurements, we computed a Deming regression between both LE predictions from the models and LE estimates by the EC method. The methods are considered to be statistically interchangeable if the confidence intervals of the slope and intercept include one and zero, respectively. If the confidence intervals for the intercept of the Deming regression include zero, there is no constant or continuous error between the two methods. If the confidence intervals for the intercept do not include zero, both methods differ by a constant amount, i.e., the new method has a continuous error compared to the reference method. In contrast, the confidence intervals of the slope of the Deming regression indicate whether there is a proportional error between the methods, which increases proportionally with the magnitude of the predicted value. Deming regression of the LE estimates of the DATTUTDUT model with Rn_mes configuration showed no significant proportional or constant error compared to EC measurements as the values one and zero lay within the respective 99 % confidence interval ranges of slope and intercept (Fig. 5). It is thus indicated that there is no significant difference between LE estimates from DATTUTDUT with Rn_mes configuration and the EC technique. In the Rn_sw configuration, the DATTUTDUT model showed no significant proportional and continuous error of LE estimates compared to EC measurements (Fig. 5). However, the confidence intervals for model runs with the Rn_sw configuration were rather wide, indicating a large level of uncertainty. The DATTUTDUT model in the Rn_mod configuration showed significant proportional and constant errors or large biases compared to EC measurements, as well as very large confidence intervals (Figs. 4 and 5).
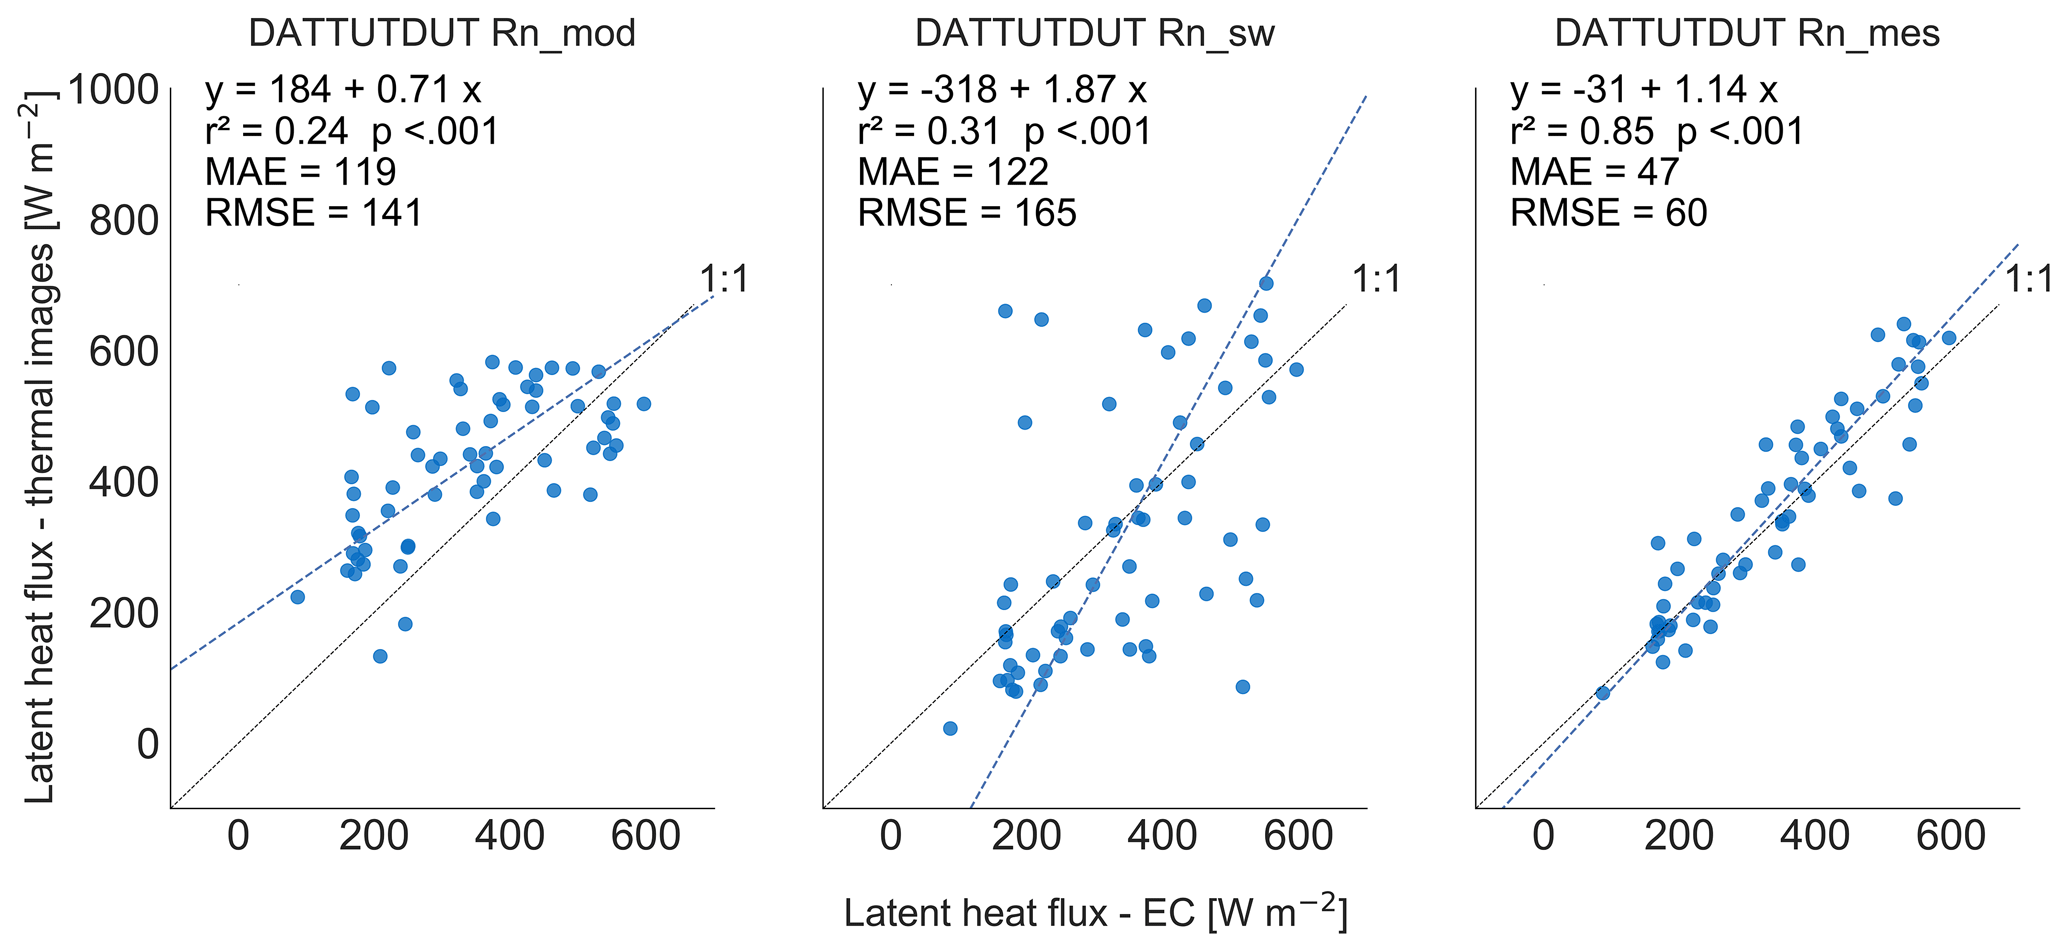
Figure 4Model II Deming regression of latent heat flux estimates from drone-based DATTUTDUT energy balance model and different configurations of net radiation (Rn_mod, Rn_sw, Rn_mes) with the eddy covariance method (n = 61 flight missions).
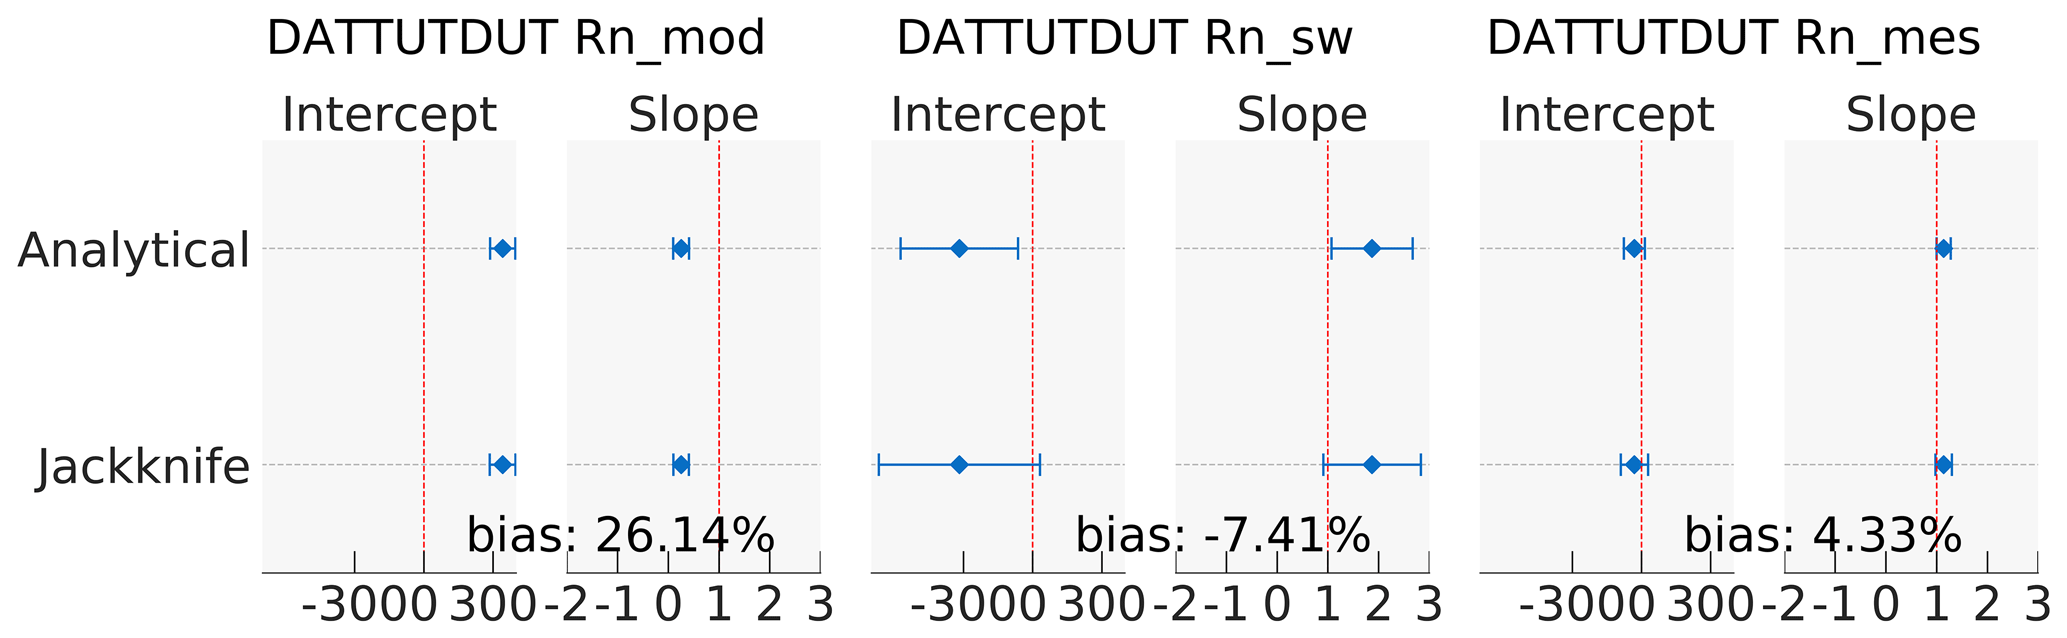
Figure 5Confidence intervals for intercept and slope of Deming regression for the different LE estimation approaches compared with EC measurements. x level for the bias is the mean of the established EC reference method. The intercept is displayed in W m−2.
3.3 Spatial distribution of LE
For 9 August 2017, 12:30 LT, the DATTUTDUT model in Rn_mes configuration predicted a mean of 526 W m−2 (minimum of 0 on the corrugated iron roof of the EC tower system, maximum of 637 W m−2, coefficient of variation 7.53 %, for the analyzed 18 383 pixels) (Fig. 6), which translates to a mean ET of 0.778 mm m−2 h−1. Locally, i.e., in the center of oil palm crowns, high LE of >400 W m−2 was observed, while LE from soil and ground vegetation areas between oil palm canopies was lower. The LE fluxes of all pixels were almost normally distributed for the one-source energy balance model DATTUTDUT in all configurations, mainly showing differences in the range and magnitude of LE estimates (Fig. 7).
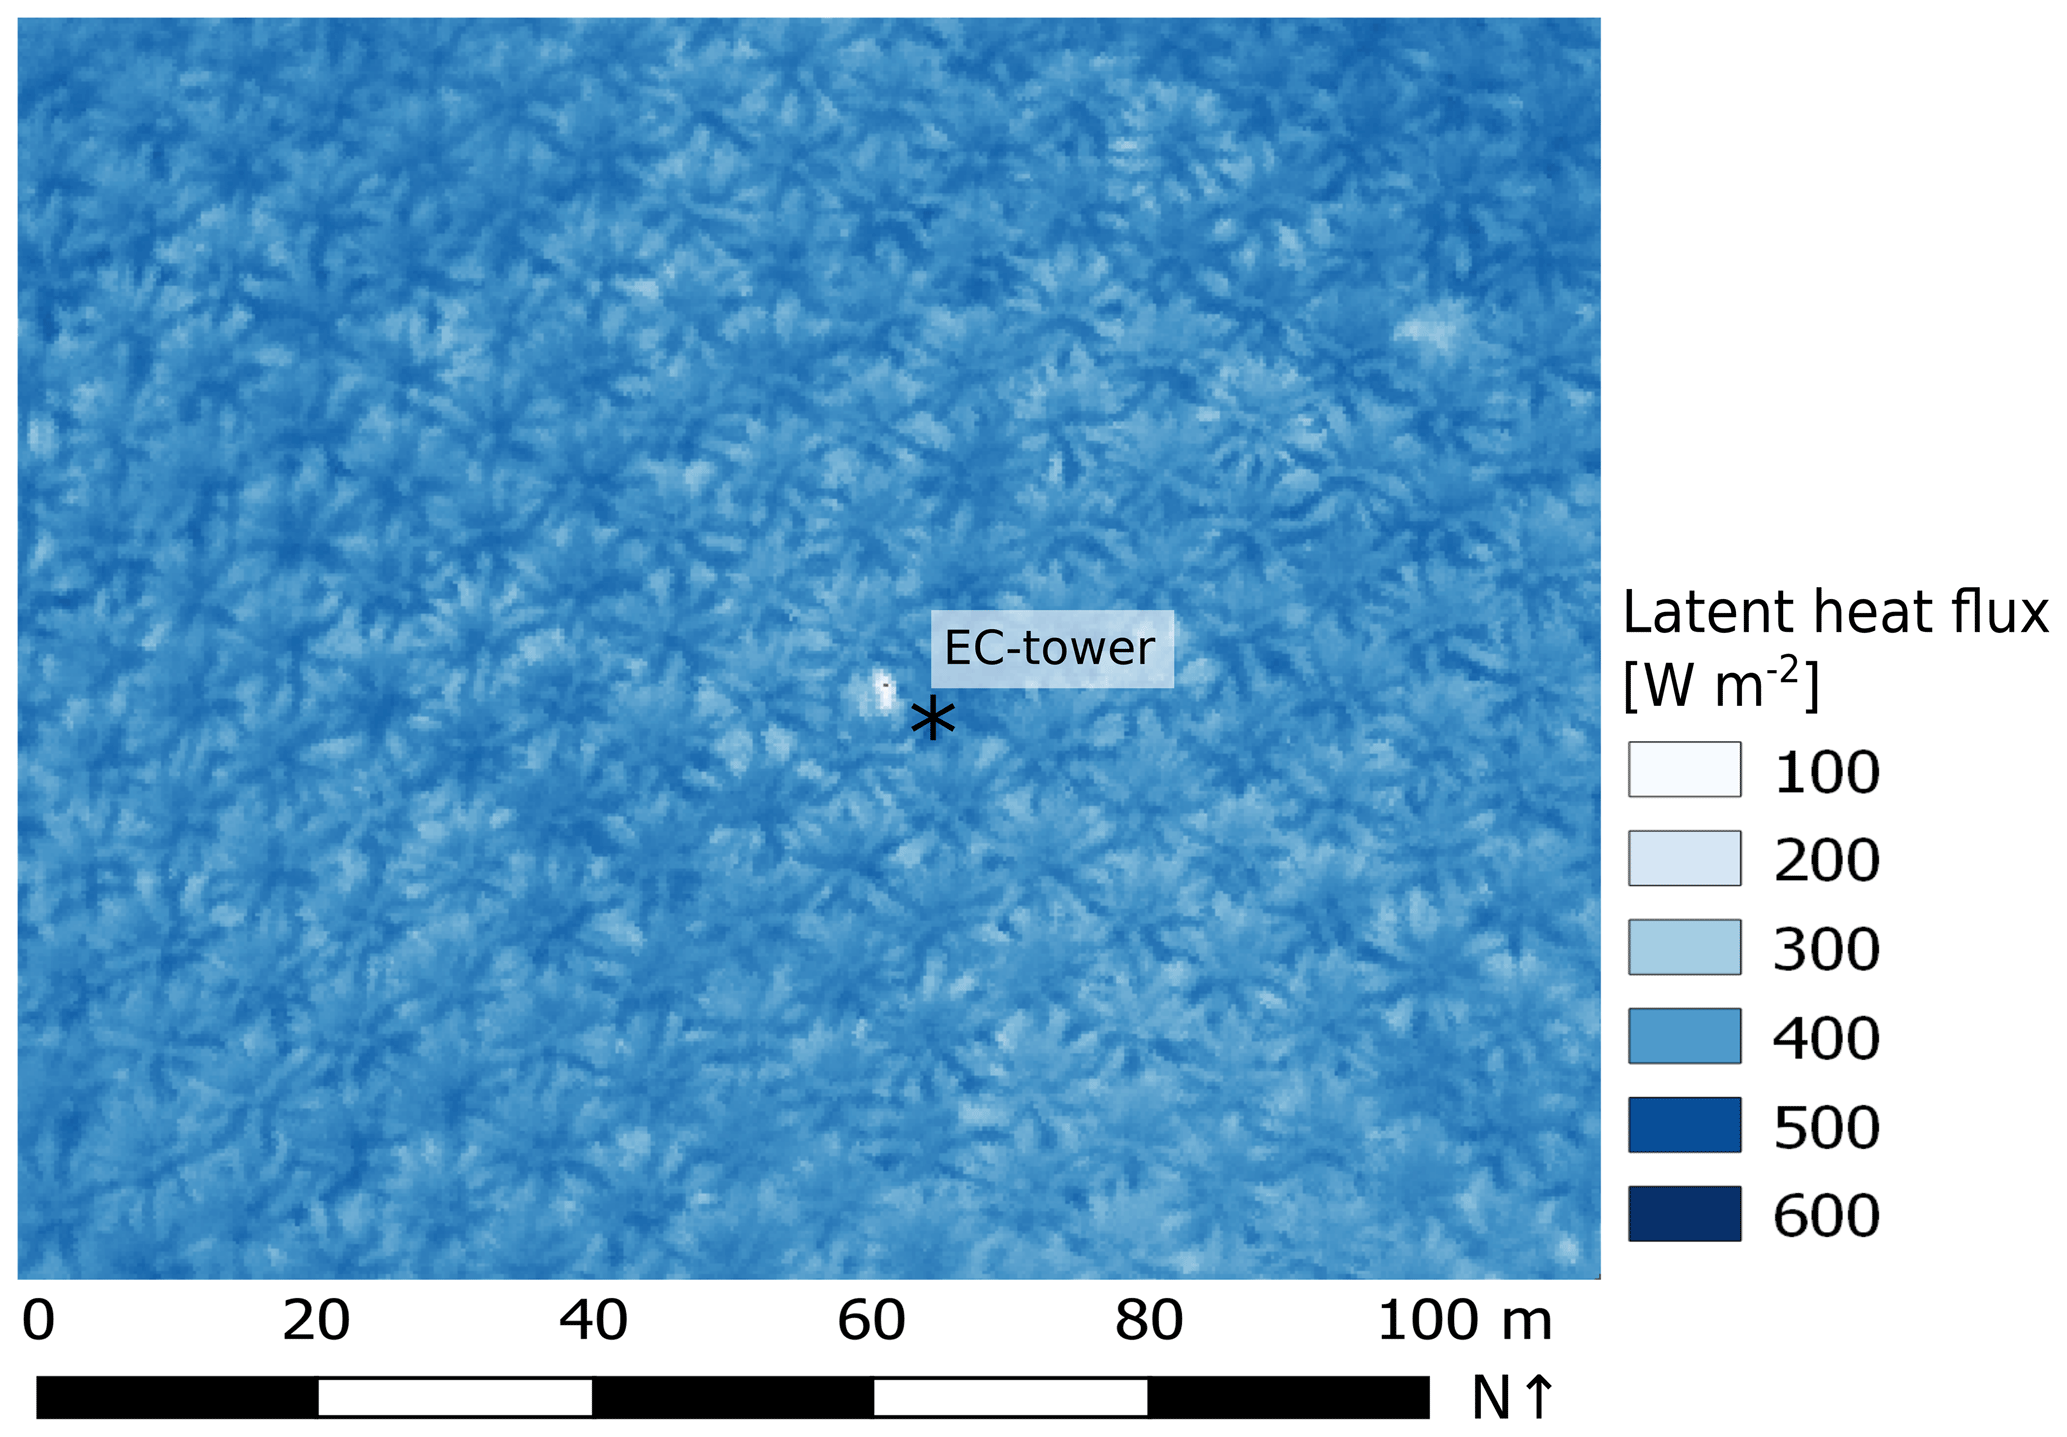
Figure 6Spatial distribution of latent heat flux from drone-based thermography and subsequent energy balance modeling (DATTUTDUT with Rn_mes configuration, 9 August 2017, 12:30 LT).
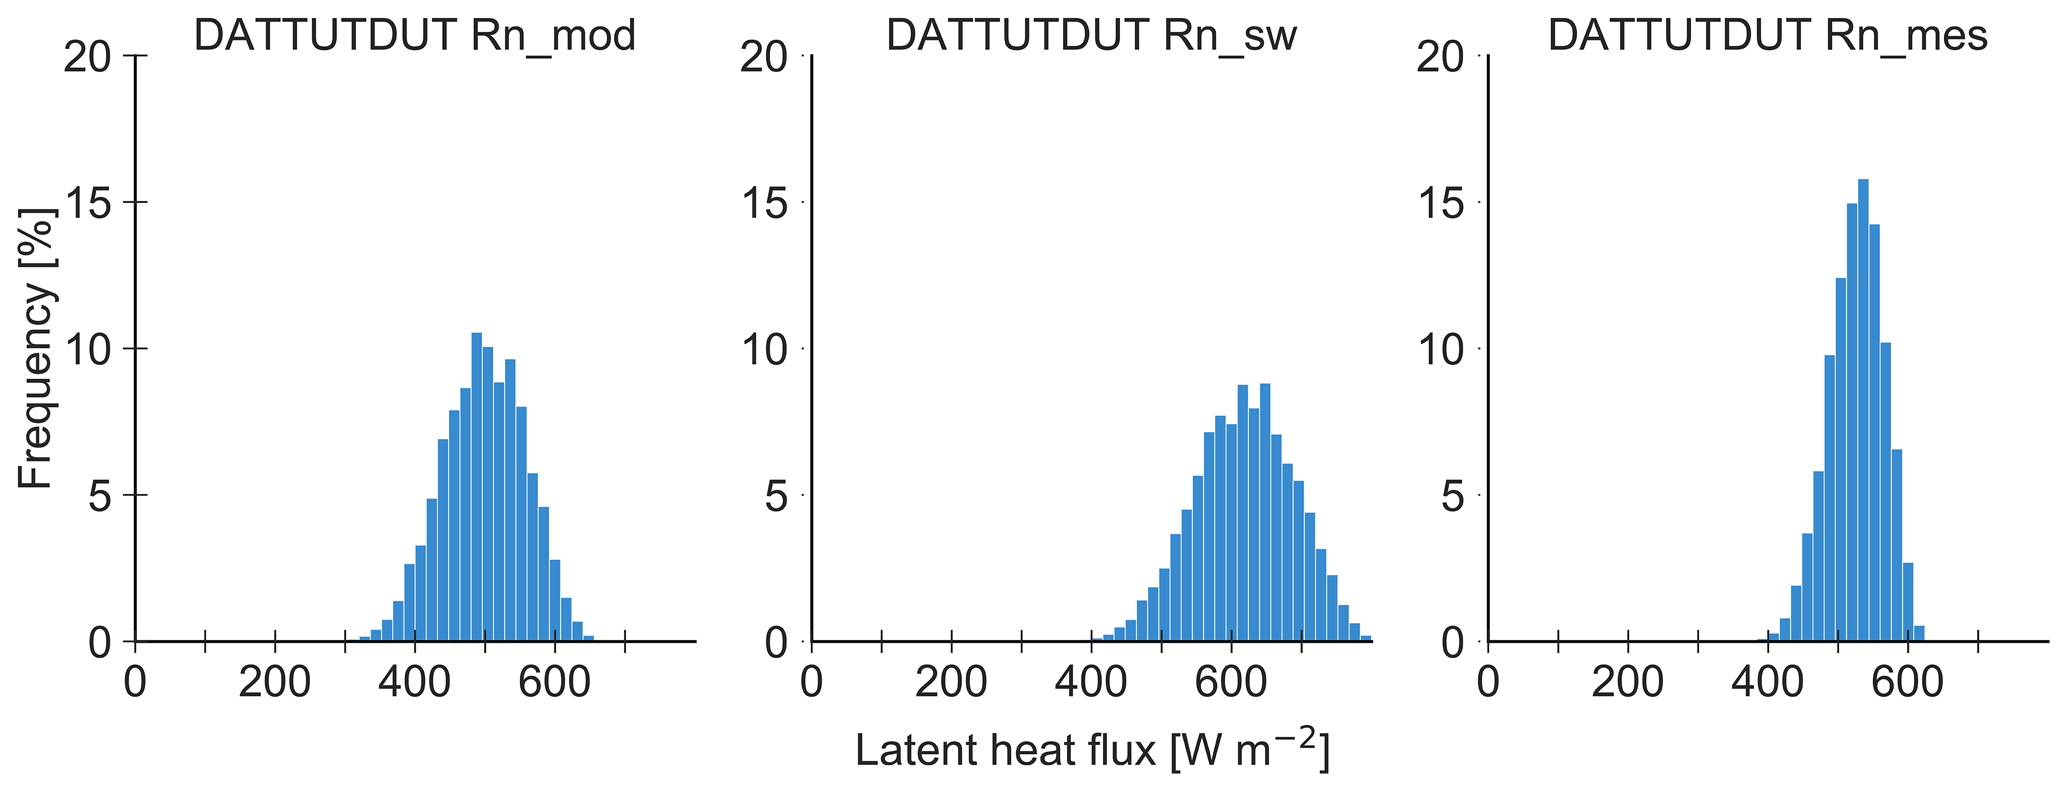
Figure 7Frequency distribution of latent heat flux for the model output from all three configurations (Rn_mod, Rn_sw and Rn_mes) from the same thermal image as shown in Fig. 6 (9 August 2017, 12:30 LT). Absolute histogram bin size was set to 16 W m−2; we used 50 bins from 0 to 800 W m−2.
Our study indicates a high agreement between latent heat fluxes assessed by drone-based thermography and the eddy covariance technique. However, the performance of the applied energy balance model differed and among the different configurations of net radiation assessments (Figs. 3 and 4). Model II Deming regression analyses and associated quality assessments suggest interchangeability between the DATTUTDUT model in Rn_mes configuration and the EC technique (Figs. 4 and 5). Applying this configuration, a fine grain spatial analysis of latent heat fluxes suggests relatively low heterogeneity of LE in the studied tropical oil palm plantation (Fig. 6).
4.1 Drone-based LE modeling vs. eddy covariance measurements
The confidence intervals of slope and intercept of the Deming regression indicate that the one-source energy balance model DATTUTDUT with Rn_mes configuration is statistically interchangeable with the established EC method for estimating LE fluxes. There are advantages and limitations to both methods. For example, the DATTUTDUT model provides insights into the spatial distribution of LE fluxes within the full extent of the available LST maps, whereas the EC technique averages the LE fluxes within its footprint to a single value. On the other hand, the DATTUTDUT model is temporally limited to the availability of LST maps, whereas the EC method can measure fluxes continuously over several years once the equipment is in place. The DATTUTDUT model with Rn_mes configuration further requires additional measurements of short- and long-wave radiation. In our study, these measurements were taken with the EC equipment, but future stand-alone drone approaches are possible by using onboard miniaturized radiation sensors (Castro Aguilar et al., 2015; Suomalainen et al., 2018). However, the accuracy of such onboard radiation sensors should first be tested against reference methods, e.g., visually by scatter or intercomparison plots (Castro Aguilar et al., 2015; Suomalainen et al., 2018) or with a model II regression procedure evaluating the interchangeability of methods and measurements (Passing and Bablok, 1983).
The DATTUTDUT model with the Rn_sw configuration showed a significant proportional error compared to EC measurements, which was mainly rooted in the high variance of the Rn_sw estimates. The short-wave irradiance measurements used in this study were stored as 10 min averages that probably did not represent the high level of irradiance variations in the tropical study area adequately. Previous studies have pointed out that Rn derivation based on short-wave irradiance measurements is challenging as long-wave radiation budgets are often completely independent from their short-wave counterparts (Hoffmann et al., 2016). Estimation errors in long-wave radiation budgets have, for example, been reported to be related to high relative air humidity, when some of the original model assumptions are no longer met (Hoffmann et al., 2016). We observed a negative correlation (r2 = 0.46) between incoming long-wave irradiance and relative humidity and assume that the high relative humidity in our tropical study area may have affected the determination of Rn when using the Rn_sw configuration through inaccuracies in estimating long-wave radiation budgets and therefore causing the observed significant continuous errors. Since we recorded the data during very different times of day and weather situations, the short-wave irradiance-based approach might not be the most adequate means of Rn derivation. However, this approach can be very useful for measurements without the presence of clouds or high levels of relative humidity. We thus also consider the Rn_sw configuration valuable for future research, particularly because measurements of incoming short-wave radiation are much easier to implement than assessing complete short- and long-wave radiation budgets as necessary for the Rn_mes configuration. The application of the Rn_sw configuration for a one-source energy balance model such as DATTUTDUT was also tested in two previous studies, with similar results to our study, i.e., a reduction of errors compared to its original formulation with fully modeled Rn_mod (Brenner et al., 2018; Xia et al., 2016).
Lastly, the model configuration Rn_mod did not produce accurate LE estimates for the DATTUTDUT model, as many of the basic assumptions for fully modeled Rn determination are not met in tropical environments such as our equatorial study area. As such, the sky is often cloudy, while haze frequently occurs during periods without rainfall. Even if no clouds are visible, relative humidity is often high, which interferes with the clear-sky assumptions of the Rn_mod configuration (Still et al., 2019).
The relatively simple DATTUTDUT model produced precise LE estimates compared to eddy covariance reference measurements. Similar conclusions were reached by Brenner et al. (2018), where DATTUTDUT marginally outperformed the more complex TSEB (two-source energy balance) model. On the other hand, contrasting observations were made by Xia et al. (2016) in vineyards with more extreme temperature divergences between soil and vegetation, where the TSEB model produced more precise estimates of LE than the DATTUTDUT model. This was explained by the better physical representation of energy and radiative exchange in the more complex TSEB model. The authors further point out that Rn determination is not the only source of error in the DATTUTDUT model (Xia et al., 2016). However, limitations of the presented methods compared with the reference EC method still exist. As such, the thermography-based recording process for land surface temperatures can be affected by water vapor, haze or dust, which increase atmospheric emissivity. Also, wind and turbulence cooling effects that compete with evaporative cooling are not captured in this approach.
We used the Bowen ratio method to close the energy balance for the reference EC measurements. As reported by Xia et al. (2016), agreement between measured EC and modeled LE estimates could potentially be increased by using the residual method from Twine et al. (2000) for energy balance closure. Further potential improvements include the aerial sampling alignment with the EC measurement logging cycles. We compared snapshot measurements of LST to 30 min averages of EC measurements for the corresponding times in an environment where key variables such as solar irradiance can change very quickly. Better matching the measurement cycle duration may further improve agreement between the methods and was already suggested in a previous study (Brenner et al., 2018). Further, in our study the aerial-derived LST images represented only the center area of the (at times quite variable and large) EC footprint. Covering the whole potential area of the footprint in all directions could also increase agreement between the measurements but would require an even higher flight altitude or longer flight times to cover the whole area; both options would reduce the number of temporal replicates and increase errors from measurements and processing but could nonetheless be viable approaches for other research questions.
Only few previous studies have demonstrated applicability and limitations of estimating LE with energy balance models from non-satellite data. In these studies, LSTs were, for example, recorded from drones for European grasslands and croplands (Brenner et al., 2018; Hoffmann et al., 2016) and from drones or airplanes for taller vegetation including olive orchards and vineyards (Ortega-Farías et al., 2016; Xia et al., 2016). Our study adds to this an application of these models in a tropical environment, for higher vegetation (i.e., oil palm) and across variable times of day and weather conditions. Generally, the equatorial study site was rather challenging due to high temperatures, high humidity and frequent occurrence of haze, as well as for logistical reasons. Additionally, many previous drone-based studies were conducted on grasslands (e.g., Brenner et al., 2017, 2018) or on low-growing crops such as wheat fields (Hoffmann et al., 2016) but not on crops with a rather complex canopy structure such as oil palm. On the other hand, our study site showed large temperature differences between soil and canopy, which simplified the distinguishing of each fraction. We further analyzed for the first time whether models and EC measurements based on drone data can be used interchangeably, as our large sample size of n=61 flights allowed for a method comparison based on a model II Deming regression (Legendre and Legendre, 2003). We conclude that this is the case for some model configurations, above all for the DATTUTDUT model with Rn_mes configuration.
4.2 Spatial distribution of latent heat fluxes
A particular strength of drone-based thermal imagery is the high spatial resolution which allows for spatially explicit assessments of evapotranspiration, within and potentially also beyond the footprints of EC towers. The outlines of the single oil palm canopies are clearly visible in the LE flux map (Fig. 6), with the highest LE fluxes occurring in the center of the oil palm canopies. We assume that this spatial pattern is caused by an increased local LAI in the centers of the oil palm canopies, while leaf area density decreases towards the outer canopies. Further, the central areas of oil palm canopies are more exposed to sunlight and wind throughout most of the day, increasing their potential for (evapo)transpiration compared to canopy edges. Mixed pixel effects (among soil and canopy) likely also contribute to the observed lower LE fluxes towards the borders of oil palm canopies. Further contributing factors to higher LE fluxes in the centers of oil palm canopies could be leaf age (with younger leaves in the center) and additional ET from pockets in the axils of pruned leaves along the stem, which contain small water reservoirs and epiphytes (Meijide et al., 2017; Tarigan et al., 2018).
The LE fluxes histogram shows only few pixel values of zero and most pixels closely distributed around the mean. For all Rn configurations, mean and median are very similar indicating close to zero skewness. Such a distribution tending towards unimodality is also considered typical for landscapes where ET is highly dominated by one species (Xia et al., 2016).
Drone-based methods have a large untapped potential for ecological applications, e.g., regarding ecohydrological optimization in land-use systems and designing the climate-smart urban landscapes of the future. We see great potential in the drone-based remote sensing applications presented in this study, especially when recent developments in drone–environment interaction, mobile edge computing (potentially aboard the drone) and communication technologies such as LoRaWAN (Long Range Wide Area Network) or 5G are combined (Becerra, 2019; Marchese et al., 2019). Autonomous acquisition of LSTs over EC stations and the surrounding areas can be supplemented by onboard and ground sensors. Energy balance models can then potentially be calculated using edge computing schemes aboard the drone to enable a dense temporal resolution of LST, flux and ET maps in almost real time. This concept can, for example, be used for the attribution of fluxes in mixed species plant communities and the study of edge effects in landscapes, and it can be further adapted to detect water stress in agriculture and forests.
Drone-based thermography and subsequent energy balance modeling under certain configurations can be considered a highly reliable method for estimating latent heat flux and evapotranspiration; for some configurations, statistical interchangeability is suggested with the established eddy covariance technique. They thus complement the asset of available methods for evapotranspiration studies by fine grain and spatially explicit assessments.
The final data used for the statistical tests were uploaded to the Göttingen Research Online database (https://doi.org/10.25625/JY9AFT, Ellsäßer, 2020). Raw thermal images, orthomosaics and terrain data, georeferenced rasters, and model configurations are available upon request to the corresponding author.
The study was conceptualized by DH in cooperation with H (drone measurements) and AK in cooperation with TJ (eddy covariance measurements). FE led the writing of the paper with help from AR, and DH supervised the work. FE collected and processed the drone data and CS the eddy covariance data. FE conducted data processing, model application, statistical analysis and production of plots in cooperation mainly with DH and AR. FE, DH and AR created a first version of the manuscript, which was further improved in cooperation with all authors.
The authors declare that they have no conflict of interest.
This study was funded by the Deutsche Forschungsgemeinschaft (DFG, German Research Foundation) – project number 192626868 – in the framework of the collaborative German–Indonesian research project CRC990 (subprojects A02 and A03). We thank the Ministry of Research, Technology and Higher Education (Ristekdikti) for providing the research permit for the field work (nos. 322/SIP/FRP/E5/Dit.KI/IX/2016, 329/SIP/FRP/E5/Dit.KI/IX/2016 and 28/EXT/SIP/FRP/E5/Dit.KI/VII/2017). We thank our field assistants Zulfi Kamal, Basri, Bayu and Darwis for great support during the field campaigns and Edgar Tunsch, Malte Puhan, Frank Tiedemann and Dietmar Fellert for their technical support. We also thank Perseroan Terbatas Perkebunan Nusantara VI, Batang Hari Unit (PTPN6) for giving us permission to conduct our research at the oil palm plantation. Thanks to all “EFForTS” colleagues and friends in Indonesia, Germany and around the world.
This research has been supported by the Deutsche Forschungsgemeinschaft (grant no. 192626868).
This open-access publication was funded
by the University of Göttingen.
This paper was edited by Dan Yakir and reviewed by Tamir Klein and one anonymous referee.
Allen, R. G., Tasumi, M., and Trezza, R.: Satellite-Based Energy Balance for Mapping Evapotranspiration with Internalized Calibration (METRIC)-Model, J. Irrig. Drain. Eng., 133, 380–394, https://doi.org/10.1061/(ASCE)0733-9437(2007)133:4(380), 2007.
Armitage, P., Berry, G., and Matthews, J. N. S.: Statistical methods in medical research, 4th edition, Blackwell Science, Malden, MA, USA, 2001.
Baldocchi, D., Falge, E., Gu, L., Olson, R., Hollinger, D., Running, S., Anthoni, P., Bernhofer, C., Davis, K., Evans, R., Fuentes, J., Goldstein, A., Katul, G., Law, B., Lee, X., Malhi, Y., Meyers, T., Munger, W., Oechel, W., Paw, U. K. T., Pilegaard, K., Schmid, H. P., Valentini, R., Verma, S., Vesala, T., Wilson, K., and Wofsy, S.: FLUXNET: A New Tool to Study the Temporal and Spatial Variability of Ecosystem-Scale Carbon Dioxide, Water Vapor, and Energy Flux Densities, B. Am. Meteorol. Soc., 82, 2415–2434, https://doi.org/10.1175/1520-0477(2001)082<2415:FANTTS>2.3.CO;2, 2001.
Bastiaanssen, W. G. M., Menenti, M., Feddes, R. A., and Holtslag, A. A. M.: A remote sensing surface energy balance algorithm for land (SEBAL). 1. Formulation, J. Hydrol., 212/213, 198–212, https://doi.org/10.1016/S0022-1694(98)00253-4, 1998.
Becerra, V. M.: Autonomous control of unmanned aerial vehicles, Electronics, 8, 452, https://doi.org/10.3390/electronics8040452, 2019.
Berni, J. A. J., Zarco-Tejada, P. J., Sepulcre-Cantó, G., Fereres, E., and Villalobos, F.: Mapping canopy conductance and CWSI in olive orchards using high resolution thermal remote sensing imagery, Remote Sens. Environ., 113, 2380–2388, https://doi.org/10.1016/j.rse.2009.06.018, 2009.
Brenner, C., Thiem, C. E., Wizemann, H.-D., Bernhardt, M., and Schulz, K.: Estimating spatially distributed turbulent heat fluxes from high-resolution thermal imagery acquired with a UAV system, Int. J. Remote Sens., 38, 3003–3026, https://doi.org/10.1080/01431161.2017.1280202, 2017.
Brenner, C., Zeeman, M., Bernhardt, M., and Schulz, K.: Estimation of evapotranspiration of temperate grassland based on high-resolution thermal and visible range imagery from unmanned aerial systems, Int. J. Remote Sens., 39, 5141–5174, https://doi.org/10.1080/01431161.2018.1471550, 2018.
Brutsaert, W.: Evaporation into the Atmosphere: Theory, history, and applications, Reidel Publishing Co., Dordrecht, https://doi.org/10.1002/qj.49710945917, 1982.
Burridge, D. M. and Gadd, A. J.: The Meteorological Office operational 10-level numerical weather prediction model (December 1975), British Meteorological Office, Bracknell, England, available at: https://trove.nla.gov.au/version/9853886 (last access: 15 March 2020), 1977.
Campbell, G. S. and Norman, J. M.: An Introduction to Environmental Biophysics, Springer, New York, USA, 1998.
Castro Aguilar, J. L., Gentle, A. R., Smith, G. B. and Chen, D.: A method to measure total atmospheric long-wave down-welling radiation using a low cost infrared thermometer tilted to the vertical, Energy, 81, 233–244, https://doi.org/10.1016/j.energy.2014.12.035, 2015.
Clough, Y., Krishna, V. V., Corre, M. D., Darras, K., Denmead, L. H., Meijide, A., Moser, S., Musshoff, O., Steinebach, S., Veldkamp, E., Allen, K., Barnes, A. D., Breidenbach, N., Brose, U., Buchori, D., Daniel, R., Finkeldey, R., Harahap, I., Hertel, D., Holtkamp, A. M., Hörandl, E., Irawan, B., Jaya, I. N. S., Jochum, M., Klarner, B., Knohl, A., Kotowska, M. M., Krashevska, V., Kreft, H., Kurniawan, S., Leuschner, C., Maraun, M., Melati, D. N., Opfermann, N., Pérez-Cruzado, C., Prabowo, W. E., Rembold, K., Rizali, A., Rubiana, R., Schneider, D., Tjitrosoedirdjo, S. S., Tjoa, A., Tscharntke, T., and Scheu, S.: Land-use choices follow profitability at the expense of ecological functions in Indonesian smallholder landscapes, Nat. Commun., 7, 1–12, https://doi.org/10.1038/ncomms13137, 2016.
Cornbleet, P. J. and Gochman, N.: Incorrect Least-Squares Regression Coefficients in Method-Comparison Analysis, Clin. Chem., 25, 432–438, 1979.
Deming, W. E.: Statistical adjustment of data, Dover Books Math. Ser., Dover Publications, New York, USA, 1964.
Drescher, J., Rembold, K., Allen, K., Beckschäfer, P., Buchori, D., Clough, Y., Faust, H., Fauzi, A. M., Gunawan, D., Hertel, D., Irawan, B., Jaya, I. N. S., Klarner, B., Kleinn, C., Knohl, A., Kotowska, M. M., Krashevska, V., Krishna, V., Leuschner, C., Lorenz, W., Meijide, A., Melati, D., Nomura, M., Pérez-Cruzado, C., Qaim, M., Siregar, I. Z., Steinebach, S., Tjoa, A., Tscharntke, T., Wick, B., Wiegand, K., Kreft, H., and Scheu, S.: Ecological and socio-economic functions across tropical land use systems after rainforest conversion, Philos. Trans. R. Soc. B Biol. Sci., 371, 20150275, https://doi.org/10.1098/rstb.2015.0275, 2016.
Ellsäßer, F.: Evapotranspiration measurements and prediction in an oil palm plantation, https://doi.org/10.25625/JY9AFT, Göttingen Research Online/Data, V2, 2020.
Ellsäßer, F., Röll, A., Stiegler, C., Hendrayanto and Hölscher, D.: Introducing QWaterModel, a QGIS plugin for predicting evapotranspiration from land surface temperatures, Environ. Model. Softw., 130, 6, https://doi.org/10.1016/j.envsoft.2020.104739, 2020.
Ershadi, A., McCabe, M. F., Evans, J. P., and Walker, J. P.: Effects of spatial aggregation on the multi-scale estimation of evapotranspiration, Remote Sens. Environ., 131, 51–62, https://doi.org/10.1016/j.rse.2012.12.007, 2013.
Fan, Y., Roupsard, O., Bernoux, M., Le Maire, G., Panferov, O., Kotowska, M. M., and Knohl, A.: A sub-canopy structure for simulating oil palm in the Community Land Model (CLM-Palm): phenology, allocation and yield, Geosci. Model Dev., 8, 3785–3800, https://doi.org/10.5194/gmd-8-3785-2015, 2015.
Fisher, J. B., Melton, F., Middleton, E., Hain, C., Anderson, M., Allen, R., McCabe, M. F., Hook, S., Baldocchi, D., Townsend, P. A., Kilic, A., Tu, K., Miralles, D. D., Perret, J., Lagouarde, J.-P., Waliser, D., Purdy, A. J., French, A., Schimel, D., Famiglietti, J. S., Stephens, G., and Wood, E. F.: The future of evapotranspiration: Global requirements for ecosystem functioning, carbon and climate feedbacks, agricultural management, and water resources: The future of evapotranspiration, Water Resour. Res., 53, 2618–2626, https://doi.org/10.1002/2016WR020175, 2017.
Foken, T.: THE ENERGY BALANCE CLOSURE PROBLEM: AN OVERVIEW, Ecol. Appl., 18, 1351–1367, https://doi.org/10.1890/06-0922.1, 2008.
Garratt, J. R.: The Atmospheric Boundary Layer, Cambridge University Press, Cambridge, UK, 1992.
Glaister, P.: Least Sq. Revisit. Math. Gaz., 85, 104–107, https://doi.org/10.2307/3620485, 2001.
Göckede, M., Foken, T., Aubinet, M., Aurela, M., Banza, J., Bernhofer, C., Bonnefond, J. M., Brunet, Y., Carrara, A., Clement, R., Dellwik, E., Elbers, J., Eugster, W., Fuhrer, J., Granier, A., Grünwald, T., Heinesch, B., Janssens, I. A., Knohl, A., Koeble, R., Laurila, T., Longdoz, B., Manca, G., Marek, M., Markkanen, T., Mateus, J., Matteucci, G., Mauder, M., Migliavacca, M., Minerbi, S., Moncrieff, J., Montagnani, L., Moors, E., Ourcival, J.-M., Papale, D., Pereira, J., Pilegaard, K., Pita, G., Rambal, S., Rebmann, C., Rodrigues, A., Rotenberg, E., Sanz, M. J., Sedlak, P., Seufert, G., Siebicke, L., Soussana, J. F., Valentini, R., Vesala, T., Verbeeck, H., and Yakir, D.: Quality control of CarboEurope flux data – Part 1: Coupling footprint analyses with flux data quality assessment to evaluate sites in forest ecosystems, Biogeosciences, 5, 433–450, https://doi.org/10.5194/bg-5-433-2008, 2008.
Guzinski, R., Anderson, M. C., Kustas, W. P., Nieto, H., and Sandholt, I.: Using a thermal-based two source energy balance model with time-differencing to estimate surface energy fluxes with day–night MODIS observations, Hydrol. Earth Syst. Sci., 17, 2809–2825, https://doi.org/10.5194/hess-17-2809-2013, 2013.
Guzinski, R., Nieto, H., Jensen, R., and Mendiguren, G.: Remotely sensed land-surface energy fluxes at sub-field scale in heterogeneous agricultural landscape and coniferous plantation, Biogeosciences, 11, 5021–5046, https://doi.org/10.5194/bg-11-5021-2014, 2014.
Hansen, M. C., Potapov, P. V., Moore, R., Hancher, M., Turubanova, S. A., Tyukavina, A., Thau, D., Stehman, S. V., Goetz, S. J., Loveland, T. R., Kommareddy, A., Egorov, A., Chini, L., Justice, C. O., and Townshend, J. R. G.: High-Resolution Global Maps of 21st-Century Forest Cover Change, Science, 342, 850–853, https://doi.org/10.1126/science.1244693, 2013.
Hoffmann, H., Nieto, H., Jensen, R., Guzinski, R., Zarco-Tejada, P., and Friborg, T.: Estimating evaporation with thermal UAV data and two-source energy balance models, Hydrol. Earth Syst. Sci., 20, 697–713, https://doi.org/10.5194/hess-20-697-2016, 2016.
Jones, H. G. and Vaughan, R. A.: Remote sensing of vegetation: principles, techniques, and applications, Oxford University Press, Oxford, UK and New York, UK, 2010.
Lapidot, O., Ignat, T., Rud, R., Rog, I., Alchanatis, V., and Klein, T.: Use of thermal imaging to detect evaporative cooling in coniferous and broadleaved tree species of the Mediterranean maquis, Agric. For. Meteorol., 271, 285–294, https://doi.org/10.1016/j.agrformet.2019.02.014, 2019.
Legendre, P. and Legendre, L.: Numerical Ecology, 2/20 edition, Elsevier, Amsterdam, the Netherlands, 2003.
Linnet, K.: Evaluation of Regression Procedures for Method Comparison Studies, Clin. Chem., 39, 424–432, 1993.
Manuilova, E., Schuetzenmeister, A., and Model, F.: mcr: Method Comparison Regression, available at: https://cran.r-project.org/web/packages/mcr/index.html last access: 8 January 2020.
Marchese, M., Moheddine, A., and Patrone, F.: IoT and UAV Integration in 5G Hybrid Terrestrial-Satellite Networks, Sensors, 19, 3704, https://doi.org/10.3390/s19173704, 2019.
Margono, B. A., Turubanova, S., Zhuravleva, I., Potapov, P., Tyukavina, A., Baccini, A., Goetz, S., and Hansen, M. C.: Mapping and monitoring deforestation and forest degradation in Sumatra (Indonesia) using Landsat time series data sets from 1990 to 2010, Environ. Res. Lett., 7, 034010, https://doi.org/10.1088/1748-9326/7/3/034010, 2012.
Mauder, M. and Foken, T.: Impact of post-field data processing on eddy covariance flux estimates and energy balance closure, Meteorol. Z., 15, 597–609, https://doi.org/10.1127/0941-2948/2006/0167, 2006.
Meijide, A., Röll, A., Fan, Y., Herbst, M., Niu, F., Tiedemann, F., June, T., Rauf, A., Hölscher, D., and Knohl, A.: Controls of water and energy fluxes in oil palm plantations: Environmental variables and oil palm age, Agric. For. Meteorol., 239, 71–85, https://doi.org/10.1016/j.agrformet.2017.02.034, 2017.
Oki, T. and Kanae, S.: Global Hydrological Cycles and World Water Resources, Am. Assoc. Adv. Sci., 313, 1068–1072, https://doi.org/10.1126/science.1128845, 2006.
Ortega-Farías, S., Ortega-Salazar, S., Poblete, T., Kilic, A., Allen, R., Poblete-Echeverría, C., Ahumada-Orellana, L., Zuñiga, M., and Sepúlveda, D.: Estimation of Energy Balance Components over a Drip-Irrigated Olive Orchard Using Thermal and Multispectral Cameras Placed on a Helicopter-Based Unmanned Aerial Vehicle (UAV), Remote Sens., 8, 638, https://doi.org/10.3390/rs8080638, 2016.
Pan, X., Liu, Y., Fan, X., and Gan, G.: Two energy balance closure approaches: applications and comparisons over an oasis-desert ecotone, J. Arid Land, 9, 51–64, https://doi.org/10.1007/s40333-016-0063-2, 2017.
Passing, H. and Bablok, W.: A New Biometrical Procedure for Testing the Equality of Measurements from Two Different Analytical Methods. Application of linear regression procedures for method comparison studies in Clinical Chemistry, Part I, Clin. Chem. Lab. Med., 21, 709–720, https://doi.org/10.1515/cclm.1983.21.11.709, 1983.
Prudhomme, C., Giuntoli, I., Robinson, E. L., Clark, D. B., Arnell, N. W., Dankers, R., Fekete, B. M., Franssen, W., Gerten, D., Gosling, S. N., Hagemann, S., Hannah, D. M., Kim, H., Masaki, Y., Satoh, Y., Stacke, T., Wada, Y., and Wisser, D.: Hydrological droughts in the 21st century, hotspots and uncertainties from a global multimodel ensemble experiment, P. Natl. Acad. Sci., 111, 3262–3267, https://doi.org/10.1073/pnas.1222473110, 2014.
R Development Core Team: R: A language and environment for statistical computing. R Foundation for Statistical Computing, Vienna, Austria, available at: https://www.R-project.org/ (last access: 30 October 2020), 2019.
Röll, A., Niu, F., Meijide, A., Ahongshangbam, J., Ehbrecht, M., Guillaume, T., Gunawan, D., Hardanto, A., Hendrayanto Hertel, D., Kotowska, M. M., Kreft, H., Kuzyakov, Y., Leuschner, C., Nomura, M., Polle, A., Rembold, K., Sahner, J., Seidel, D., Zemp, D. C., Knohl, A., and Hölscher, D.: Transpiration on the rebound in lowland Sumatra, Agric. For. Meteorol., 274, 160–171, https://doi.org/10.1016/j.agrformet.2019.04.017, 2019.
Sabajo, C. R., le Maire, G., June, T., Meijide, A., Roupsard, O., and Knohl, A.: Expansion of oil palm and other cash crops causes an increase of the land surface temperature in the Jambi province in Indonesia, Biogeosciences, 14, 4619–4635, https://doi.org/10.5194/bg-14-4619-2017, 2017.
Still, C., Powell, R., Aubrecht, D., Kim, Y., Helliker, B., Roberts, D., Richardson, A. D., and Goulden, M.: Thermal imaging in plant and ecosystem ecology: applications and challenges, Ecosphere, 10, e02768, https://doi.org/10.1002/ecs2.2768, 2019.
Stoy, P. C., Mauder, M., Foken, T., Marcolla, B., Boegh, E., Ibrom, A., Arain, M. A., Arneth, A., Aurela, M., Bernhofer, C., Cescatti, A., Dellwik, E., Duce, P., Gianelle, D., van Gorsel, E., Kiely, G., Knohl, A., Margolis, H., McCaughey, H., Merbold, L., Montagnani, L., Papale, D., Reichstein, M., Saunders, M., Serrano-Ortiz, P., Sottocornola, M., Spano, D., Vaccari, F., and Varlagin, A.: A data-driven analysis of energy balance closure across FLUXNET research sites: The role of landscape scale heterogeneity, Agric. For. Meteorol., 171/172, 137–152, https://doi.org/10.1016/j.agrformet.2012.11.004, 2013.
Suomalainen, J., Hakala, T., Alves de Oliveira, R., Markelin, L., Viljanen, N., Näsi, R., and Honkavaara, E.: A Novel Tilt Correction Technique for Irradiance Sensors and Spectrometers On-Board Unmanned Aerial Vehicles, Remote Sens., 10, 2068, https://doi.org/10.3390/rs10122068, 2018.
Tarigan, S., Wiegand, K., Sunarti, and Slamet, B.: Minimum forest cover required for sustainable water flow regulation of a watershed: a case study in Jambi Province, Indonesia, Hydrol. Earth Syst. Sci., 22, 581–594, https://doi.org/10.5194/hess-22-581-2018, 2018.
Timmermans, W. J., Kustas, W. P., and Andreu, A.: Utility of an Automated Thermal-Based Approach for Monitoring Evapotranspiration, Acta Geophys., 63, 1571–1608, https://doi.org/10.1515/acgeo-2015-0016, 2015.
Twine, T. E., Kustas, W. P., Norman, J. M., Cook, D. R., Houser, P. R., Meyers, T. P., Prueger, J. H., Starks, P. J., and Wesely, M. L.: Correcting eddy-covariance flux underestimates over a grassland, Agric. For. Meteorol., 103, 279–300, https://doi.org/10.1016/S0168-1923(00)00123-4, 2000.
Xia, T., Kustas, W. P., Anderson, M. C., Alfieri, J. G., Gao, F., McKee, L., Prueger, J. H., Geli, H. M. E., Neale, C. M. U., Sanchez, L., Alsina, M. M., and Wang, Z.: Mapping evapotranspiration with high-resolution aircraft imagery over vineyards using one- and two-source modeling schemes, Hydrol. Earth Syst. Sci., 20, 1523–1545, https://doi.org/10.5194/hess-20-1523-2016, 2016.