the Creative Commons Attribution 4.0 License.
the Creative Commons Attribution 4.0 License.
 | 08 Feb 2021
Cross-basin differences in the nutrient assimilation characteristics of induced phytoplankton blooms in the subtropical Pacific waters
Fuminori Hashihama
Hiroaki Saito
Taketoshi Kodama
Saori Yasui-Tamura
Jota Kanda
Iwao Tanita
Hiroshi Ogawa
E. Malcolm S. Woodward
Philip W. Boyd
Ken Furuya
To better understand the nutrient assimilation characteristics of subtropical phytoplankton, deep-water addition incubation experiments were carried out on surface waters collected at seven stations across the subtropical North and South Pacific Ocean. These deep-water additions induced phytoplankton blooms with nutrient drawdown at all stations. The drawdown ratios of dissolved inorganic nitrogen (DIN) to phosphate (PO4) varied from 14.1 to 30.7 at the PO4-replete stations in the central North Pacific (CNP) and eastern South Pacific (ESP). These ratios were similar to the range represented by the canonical Redfield ratio (16) through to typical particulate N:P ratios in the surface subtropical ocean (28). In contrast, lower DIN:PO4 drawdown ratios (7.7–13.3) were observed in induced blooms at the PO4-depleted stations in the western North Pacific (WNP). The DIN:PO4 drawdown ratios in the PO4-replete ESP were associated with eukaryote-dominated blooms, while those in the PO4-depleted WNP were associated with eukaryotic and cyanobacterial blooms. The surplus PO4 assimilation, relative to DIN, by phytoplankton in the WNP was not expected based on their typical cellular N:P ratio and was likely due to the high PO4 uptake capability as induced by low-PO4-adapted phytoplankton. The low- and high-P* ( DIN/16) regimes geographically corresponded to the low and high DIN:PO4 drawdown ratios in the WNP and the CNP or ESP, respectively. The basin-wide P* distribution in the oligotrophic Pacific surface waters showed a clear regional trend from low in the WNP (<50 nM) to high in the ESP (>100 nM). These results suggest that the subtropical phytoplankton blooms as observed in our experiments could be an important factor controlling P* as well as the commonly recognized dinitrogen fixation and denitrification characteristics.
- Article
(1220 KB) - Full-text XML
- BibTeX
- EndNote


The surface waters of the subtropical oceans are characterized by strong stratification, low nutrients, and low phytoplankton biomass (Karl, 2002). In this regime, primary production is largely sustained by regenerated production (f ratio: ∼0.1, Dugdale and Goering, 1967; Eppley and Peterson, 1979) and driven by small phytoplankton such as the picocyanobacteria Prochlorococcus and Synechococcus (Waterbury et al., 1979; Chisholm et al., 1988). Despite the persistent oligotrophic regime, phytoplankton blooms with large diatoms and cyanobacteria occur occasionally in the subtropical oceans and have large impacts on new production and export production (Benitez-Nelson et al., 2007; McGillicuddy et al., 2007; Dore et al., 2008; Wilson and Qiu, 2008; Karl et al., 2012; Villareal et al., 2012; Hashihama et al., 2014). The mechanisms that bring about the development of these blooms are not simple, but fundamentally they involve nutrient supply with physical forcing (Wilson et al., 2013; Toyoda and Okamoto, 2017).
The nutrient supply to surface subtropical oceans is important for many aspects of biogeochemical cycling and food-web dynamics as it drives new production and net community production (Sarmiento and Gruber, 2006; Saito, 2019). Seasonal variations in dissolved inorganic carbon and dissolved oxygen in the subtropical oceans highlight the net productive systems, which are potentially sustained by intermittent nutrient supply from deep water (Michaels et al., 1994; Dore et al., 2003; Johnson et al., 2010). Deep water contains high amounts of nutrients such as nitrate (NO3), phosphate (PO4), and silicic acid (Si(OH)4), and their supply into the surface ocean temporarily alleviates phytoplankton nutrient stress. Several ship-based experimental studies indicate that deep-water additions to subtropical surface waters have induced phytoplankton blooms (Mahaffey et al., 2012; Lampe et al., 2019; Robidart et al., 2019). These studies highlight the shifts in phytoplankton community structure, growth characteristics, and gene expression during the bloom development. However, although nutrient assimilation characteristics are important mechanisms driving the net production, they were not fully described, for example the drawdown ratios (e.g. ΔNO3:ΔPO4 and ΔSi(OH)4:ΔNO3), in these studies.
Phytoplankton N:P stoichiometry is generally based on the canonical ratio of 16 (Redfield, 1958). However, subtropical phytoplankton have higher N:P cellular ratios than the Redfield ratio, and its mean value for subtropical waters is 28 (Martiny et al., 2013). This higher ratio suggests that subtropical phytoplankton assimilate nutrients with higher N:P ratios than 16. If subtropical phytoplankton were to assimilate the upwelled deep-water nutrients which have nearly Redfield NO3:PO4 ratios (∼16, Fanning, 1992), PO4-excess waters would remain at the surface. The PO4 anomaly () in the upper 120 m of the water column has indeed positive values throughout the subtropical oceans (Deutsch et al., 2007). As with N* (Gruber and Sarmiento, 1997; Deutsch et al., 2001), P* is recognized to be controlled by dinitrogen (N2) fixation and denitrification (Deutsch et al., 2007), but it may also be influenced by phytoplankton uptake of the upwelled deep-water nutrients.
Subtropical phytoplankton utilize not only NO3 and PO4 but also nitrite (NO2), ammonium (NH4), dissolved organic nitrogen (DON), and dissolved organic phosphorus (DOP). Amongst them, the concentrations of DON and DOP are 1 to 3 orders of magnitude higher than those of dissolved inorganic nitrogen (DIN: the sum of NO3, NO2, and NH4) and PO4 in subtropical surface waters (Karl and Björkman, 2015; Sipler and Bronk, 2015). The majority of DON and DOP is likely refractory, but the bioavailable forms such as urea, amino acid, and ATP play important roles in sustaining primary production in the inorganic-nutrient-depleted subtropical waters (Kanda et al., 1985; Zubkov et al., 2004; Casey et al., 2009; Hill et al., 2011; Shilova et al., 2017; Björkman et al., 2018). Thus, the dynamics of alternative nutrients other than NO3 and PO4 should be considered when examining the nutrient assimilation characteristics of subtropical phytoplankton blooms.
Along with N and P assimilation, Si is also assimilated during diatom blooms. Several field studies reported anomalous Si(OH)4 removal relative to NO3 and PO4 at the sites of diatom blooms in the subtropical oceans (Benitez-Nelson et al., 2007; Hashihama et al., 2014). These Si(OH)4 removals were not accompanied by stoichiometrically equivalent N and P removals as with a typical ratio of (Redfield, 1958; Brzezinski, 1985). Given the linkages between Si and other elemental cycles, it is important to understand Si dynamics in the subtropical oceans. However, the Si dynamics cannot be fully explored from snapshot observations in the field (Hashihama et al., 2014), and to understand them experimental validations are required.
In this study, our aim was to reveal N, P, and Si assimilation characteristics of subtropical phytoplankton blooms as induced by deep-water additions. The onboard bottle incubation experiments were conducted across the subtropical Pacific Ocean, which has a large geographical variation in surface PO4 from very low (<10 nM) in the western North Pacific (WNP) to high (>100 nM) in the eastern South Pacific (ESP) (Hashihama et al., 2019; Martiny et al., 2019; Hashihama et al., 2020). Since subtropical phytoplankton respond to nanomolar increases in nutrient concentrations (Garside, 1985; Eppley and Renger, 1988; Eppley et al., 1990), we used sensitive liquid waveguide spectrophotometry for measuring nanomolar NO3, NO2, NH4, PO4, and Si(OH)4. The nanomolar nutrient data enabled us to calculate accurate stoichiometric ratios for N, P, and Si. Along with the inorganic nutrients, we also examined DON and DOP variations during the incubation experiments. These deep-water addition experiments successfully induced phytoplankton blooms, while the nutrient drawdown ratios showed geographical patterns concomitant with the surface PO4 distributions. Here we conclude by discussing the mechanism of the regionally different drawdown ratios and its possible influence on P* distribution in the subtropical Pacific Ocean.
2.1 Study areas and water sampling
Observations were conducted at seven stations in the subtropical North and South Pacific Ocean (Table 1 and Fig. 1). Station A in the WNP was occupied in July 2010 during the R/V Tansei Maru KT-10-13 cruise. Stations 2–21 were occupied along the transect from the WNP (2 and 5) to the ESP (15, 18, and 21) through the central North Pacific (CNP, 8) for the period from December 2011 to January 2012 during the R/V Hakuho Maru KH-11-10 cruise. Water sampling was performed using a conductivity–temperature–depth (CTD) system (Sea-Bird Electronics) equipped with HCl-cleaned Teflon-coated Niskin-X bottles (General Oceanics). Water samples for incubation experiments were collected from 10 m depth (hereafter referred to as “surface”) at all stations. At stations A and 2 in the WNP, deep water from 1500 m depth was also collected.
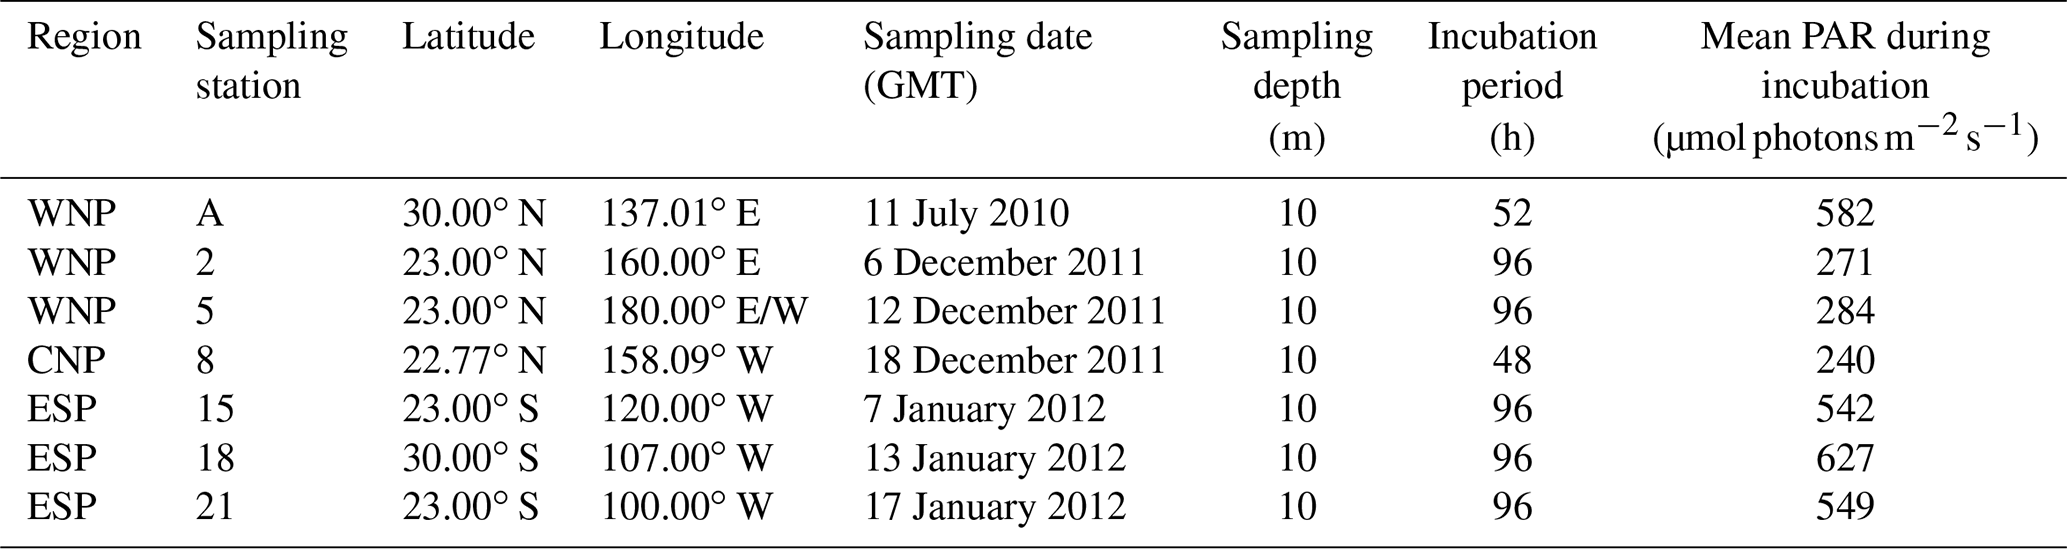
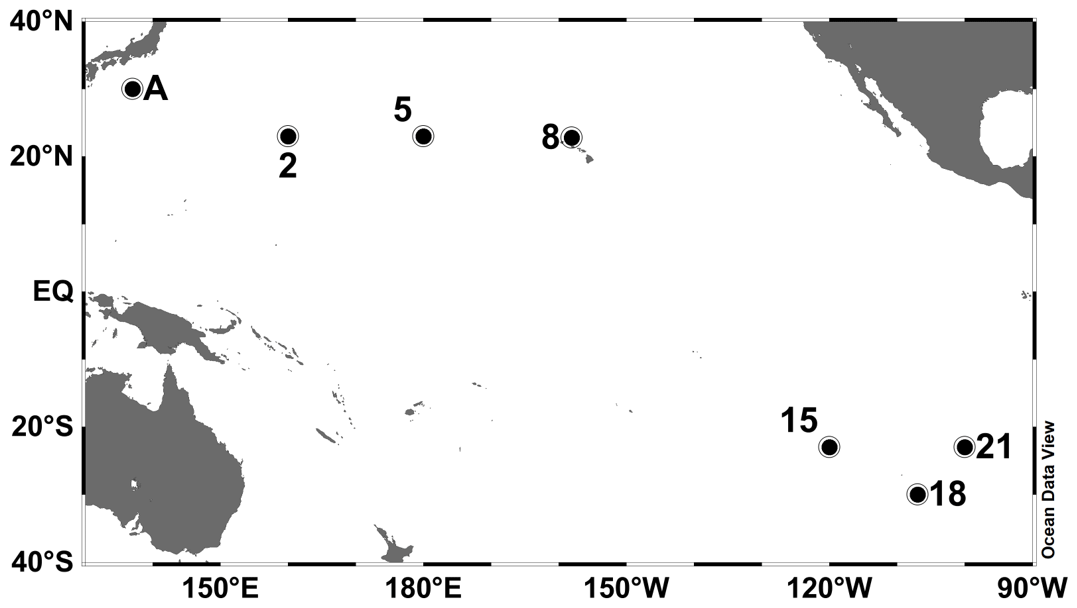
Figure 1Study areas and sampling stations in the subtropical Pacific Ocean. Station A was occupied in July 2010 during the R/V Tansei Maru KT-10-13 cruise. Stations 2–21 were occupied for the period from December 2011 to January 2012 during the R/V Hakuho Maru KH-11-10 cruise.
2.2 Deep-water addition incubation experiments
Surface waters collected from 10 m depth were poured into 2.3 L HCl-cleaned polycarbonate bottles, and then 50 mL of deep water was immediately added to the triplicate bottles (2.1 % deep-water addition). Filtration of the deep water was not conducted to avoid NH4 contamination. Although the deep water contains heterotrophs, their influences on the results of incubation experiments were expected to be at negligible levels because, in addition to the large dilution of deep water (2.1 % of the total water), prokaryotic abundance and production are generally much lower in the deep water than in the surface water as exponentially decreasing with depth (Yokokawa et al., 2013). The deep waters collected at stations A and 2 were added to the surface water samples at stations A and 2–21, respectively. The deep waters for the experiments at stations 5–21 were kept frozen (−20 ∘C) until used at each station. Nutrient concentrations in the deep waters at stations A and 2 were 37.1 and 39.0 µM DIN, 2.1 and 2.9 µM PO4, and 134.5 and 140.5 µM Si(OH)4, respectively. For all experiments, triplicate control bottles were prepared. Both the treated and control bottles were incubated for 48–96 h (Table 1) in an on-deck incubator with flowing surface seawater, which was shaded with appropriate sheeting to give 30 % of full sunlight so as to mimic the ambient photosynthetically active radiation (PAR) condition at 10 m depth. The ambient PAR on deck was continuously monitored by a LI-COR quantum sensor (LI-190R) with a data logger (LI-1400), and its mean values during the incubation periods including day and night times are presented in Table 1. During the incubation periods (48–96 h), the bottles were subsampled five to six times for nanomolar nutrients, three times for DON and DOP, and one time (at the end point) for phytoplankton. Initial phytoplankton samples at time zero were collected in single or duplicate directly from the Niskin-X bottles. At the end point, water volumes in the bottles just prior to final sampling were approximately 1.8 L. The DON and DOP samples were not collected at station A during the KT-10-13 cruise. To assess any significant decrease or increase in the concentrations of nanomolar nutrients, DON, and DOP during the incubation periods, linear regression analyses were performed. In addition, a Student t test and paired t test were performed to determine significant differences between the measured parameter values. In this paper, the significance is reported where p<0.05. In the calculation of the nutrient drawdown ratio, its error was estimated based on the error propagation rule (Miller and Miller, 1993).
2.3 Determinations of nanomolar nutrients
Water samples for nanomolar nutrients were collected in 30 mL HCl-cleaned polypropylene tubes and were frozen at −20 ∘C until analysis. The concentrations of NO3, NO2, NH4, PO4, and Si(OH)4 were determined using an automated liquid waveguide spectrophotometric system equipped with 50–100 cm liquid waveguide capillary cells (LWCC, World Precision Instruments) (Hashihama et al., 2009; Hashihama and Kanda, 2010; Hashihama et al., 2014, 2015). The detection limits for NO3, NO2, NH4, PO4, and Si(OH)4 were 3, 2, 6, 3, and 11 nM, respectively. Although we collected triplicate water samples from the incubated bottles, triplicate analytical data were not available for several samples.
2.4 Determinations of DON and DOP
Water samples for DON and DOP were collected in HCl-cleaned polypropylene tubes after removing particulate matter by filtering through pre-combusted Whatman GF/F filters. The samples were frozen at −20 ∘C until analysis. Total dissolved nitrogen (TDN) and phosphorus (TDP) were quantified by a persulfate oxidation method (Hansen and Koroleff, 1999) with a QuAAtro TN-TP analyser (SEAL Analytical) (Yasui et al., 2016; Yasui-Tamura et al., 2020). The concentration of DON was derived from the difference between TDN and DIN concentrations, and that of DOP was derived from the difference between TDP and PO4 concentrations. As with the nutrients (Sect. 2.3), triplicate analytical data on DON and DOP were not obtained for some samples.
2.5 Phytoplankton pigment analysis
Phytoplankton pigment analysis was performed using high-performance liquid chromatography (HPLC). Water volumes of 440–3000 mL were filtered onto GF/F filters, and the filter samples were immediately frozen in liquid nitrogen and stored in a deep freezer (−80 ∘C) until analysis. Pigment analysis was conducted using the method of Zapata et al. (2000) with a HPLC system (Hashihama et al., 2008). Six phytoplankton pigments – chlorophyll a (Chl a), divinyl chlorophyll a (DVchl a), 19′-butanoyloxyfucoxanthin (But-fuco), fucoxanthin (Fuco), 19′-hexanoyloxyfucoxanthin (Hex-fuco), and zeaxanthin (Zea) – were quantified from the peak area calibrated against that of standard pigments (DHI Water and Environment). Total chlorophyll a (Tchl a: the sum of Chl a and DVchl a) was used as an index of total phytoplankton biomass. Total fucoxanthin (Tfuco: the sum of But-fuco, Fuco, and Hex-fuco) was used as a representative marker of eukaryotic phytoplankton. Zea and DVchl a were markers of cyanobacteria and Prochlorococcus, respectively.
2.6 Microscopic analysis of phytoplankton
Water volumes of 100–1000 mL seawater samples were fixed with neutralized formalin at a final concentration of 1 % (). The fixed samples were concentrated through sedimentation in a land-based laboratory. Diatom species were identified and enumerated under an inverted microscope (Utermöhl, 1958).
2.7 P* determination using nanomolar nutrient data
Surface P* at the experimental stations was calculated using the measured nanomolar PO4 and DIN data through an equation P* DIN/16. In addition, to reveal basin-wide distribution of surface (≤10 m) P* over the oligotrophic Pacific area (40∘ N–40∘ S), we assembled nanomolar (<1000 nM) data sets of PO4 and NO3 plus NO2 (N+N), most of which were previously published by the authors in this study (Hashihama et al., 2009; Kitajima et al., 2009; Shiozaki et al., 2009; Hashihama et al., 2010; Sato et al., 2010; Shiozaki et al., 2010; Girault et al., 2013; Sato et al., 2013; Hashihama et al., 2014; Shiozaki et al., 2014; Girault et al., 2015; Sato et al., 2015, 2016; Shiozaki et al., 2016, 2017; Ellwood et al., 2018; Horii et al., 2018; Shiozaki et al., 2018; Hashihama et al., 2019; Martiny et al., 2019; Sato and Hashihama, 2019; Yamaguchi et al., 2019; Hashihama et al., 2020; Jiang et al., 2021; Yamaguchi et al., 2021). We also included several unpublished data sets collected by Fuminori Hashihama and Taketoshi Kodama. These data sets were obtained by using the liquid waveguide spectrophotometry for PO4 and N+N (Woodward, 2002; Hashihama et al., 2009). Since surface NH4 concentrations were typically low at the sub-nanomolar level and the NH4 data were relatively limited compared to the PO4 and N+N data, we did not use the NH4 data to show the basin-wide distribution of P*. Thus, the P* in this case was calculated through the equation .
3.1 Initial conditions
High temperature (21.76–26.91 ∘C) and high salinity (34.07–36.50) in the surface waters (10 m) of the seven experimental stations indicated that typical subtropical oceanic waters prevailed in the study regions (Table 2). DIN concentrations at the surface were consistently lower than 50 nM, while PO4 concentrations varied geographically and were extremely low in the WNP (<10 nM; stations A, 2, and 5), intermediate in the CNP (53 nM; station 8), and high in the ESP (>100 nM; stations 15, 18, and 21). Surface P* at these stations showed a geographical variation similar to PO4 concentrations, and this trend was due to the consistently low concentrations of DIN found at those stations. Si(OH)4 concentrations were higher in the WNP and CNP (767–1276 nM; stations A, 2, 5, and 8) than the ESP (427–541 nM; stations 15, 18, and 21), and DON and DOP concentrations ranged from 3.47 to 4.45 µM and 0.10 to 0.21 µM, respectively.
Tchl a concentrations at the surface were less than 129 ng L−1, with low values at stations 18 and 21 in the ESP (18 and 3 ng L−1, Table 2). Tfuco, Zea, and DVchl a all showed geographical variations similar to Tchl a. Tfuco and Zea play roles in light harvesting and photoprotection, respectively (Falkowski and Raven, 2007). Based on these roles, Tfuco content in eukaryotes should be higher in the low-PAR regime than in the high-PAR regime, while Zea content in cyanobacteria should be higher in the high-PAR regime than in the low-PAR regime. However, Tfuco:Zea ratios (0.4–2.6) were not consistently higher in the low-PAR WNP and CNP (≤284 , stations 2, 5, and 8, Table 1) than in the high-PAR WNP and ESP (≥542 , stations A, 15, 18, and 21, Table 1), indicating that these ratios represent the biomass proportion of cyanobacteria to eukaryotes rather than the results of photoacclimation and/or photoadaptation. The Tfuco:Zea ratios were lower than 1.0 except for station 18 in the ESP (2.6), where the biomass proportion of eukaryotes to cyanobacteria was relatively high. DVchl a : Tchl a ratios are indices of the biomass proportion of Prochlorococcus to total phytoplankton because DVchl a and Chl a play a common role in light harvesting. The DVchl a : Tchl a ratios were mostly 0.4–0.5, but the lower ratios were observed at stations 18 and 21 in the ESP (0.1 and 0.2). Cell densities of surface diatoms were consistently low (3–88 cells L−1) at all stations.
Table 2Initial conditions for incubation samples collected from 10 m depth. Errors represent standard deviations (n=3). No error means no triplicate data set.
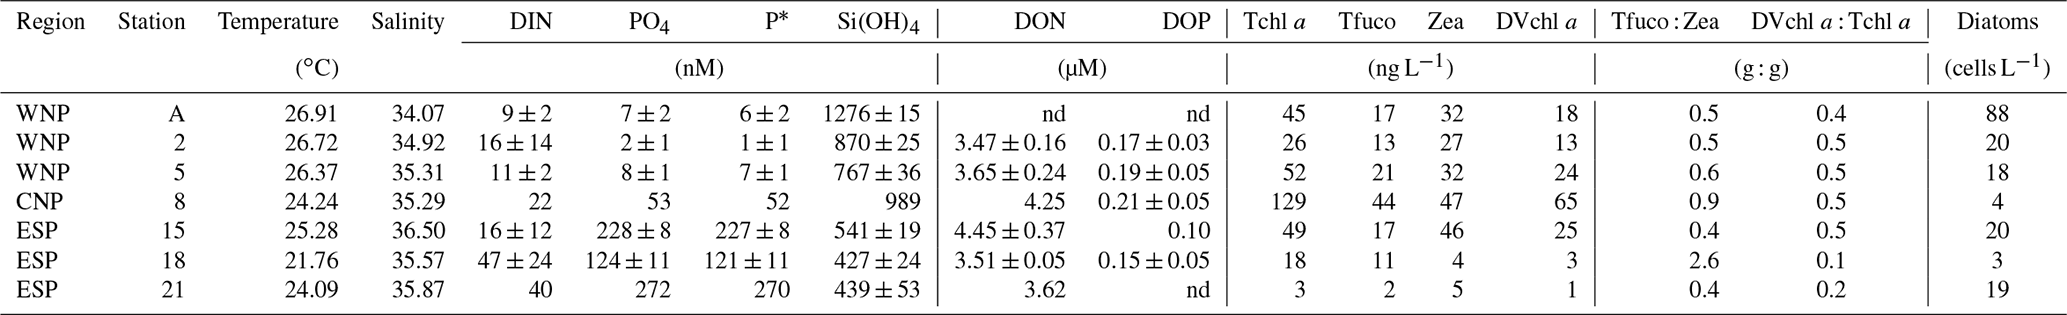
nd: no data.
3.2 Phytoplankton response to deep-water additions
Mean Tchl a concentrations were 3 to 10 times higher in the treated bottles than observed for the control bottles in all experiments, although no significant difference was observed at station A due to a highly variable results in the treated bottles (Fig. 2a). These trends in increasing Tchl a indicate that the deep-water additions positively induced phytoplankton blooms. The Tchl a differences between the treated and control bottles were greatest at station A in the WNP (178 ng L−1) and station 15 in the ESP (306 ng L−1), and net growth rates of the blooms (as Tchl a, relative to the control) were higher at these two stations (0.70 and 0.58 d−1) than other stations (0.27–0.50 d−1). Mean Tfuco concentrations were significantly higher in the treated than in the control bottles except for station A (Fig. 2b). Mean Zea concentrations were significantly higher in the treated bottles in the WNP (stations A, 2, and 5) and at two sites of the ESP (stations 15 and 21) (Fig. 2c). Mean DVchl a concentrations were significantly higher in the treated bottles at two sites in the WNP (stations 2 and 5) and station 21 in the ESP (Fig. 2d). The pigment concentrations in the control bottles were similar to those in the initial conditions, indicating that changes in pigment concentrations due to photoacclimation during the incubation periods are small.
Mean Tfuco:Zea ratios were higher in the treated than in the control bottles, although no significant differences were observed at stations A and 18 (Fig. 2e). The higher Tfuco:Zea ratios in the treated bottles imply that biomass increases in eukaryotes were relatively large compared to those of cyanobacteria. The ratios of Tfuco:Zea in the treated bottles were higher in the ESP (stations 15, 18, and 21) than the WNP and CNP (stations A, 2, 5, and 8), indicating that the proportions of eukaryotes (cyanobacteria) were higher (lower) in the ESP than the WNP and CNP. Mean DVchl a : Tchl a ratios were significantly lower in the treated bottles than the control, except for stations 18 and 21 in the ESP, where the ratios in the control were quite low (<0.1) as observed in the initial conditions (Fig. 2f).
Cell densities of diatoms were significantly higher in the treated bottles at two sites of the WNP (stations A and 2) and station 18 in the ESP (Fig. 2g). An exceptionally high mean density of diatoms (907 cells L−1), mostly consisting of Nitzschia longissima, was observed in the treated bottles at station 15 in the ESP, although no significant difference between the densities in the control and treated bottles was seen.
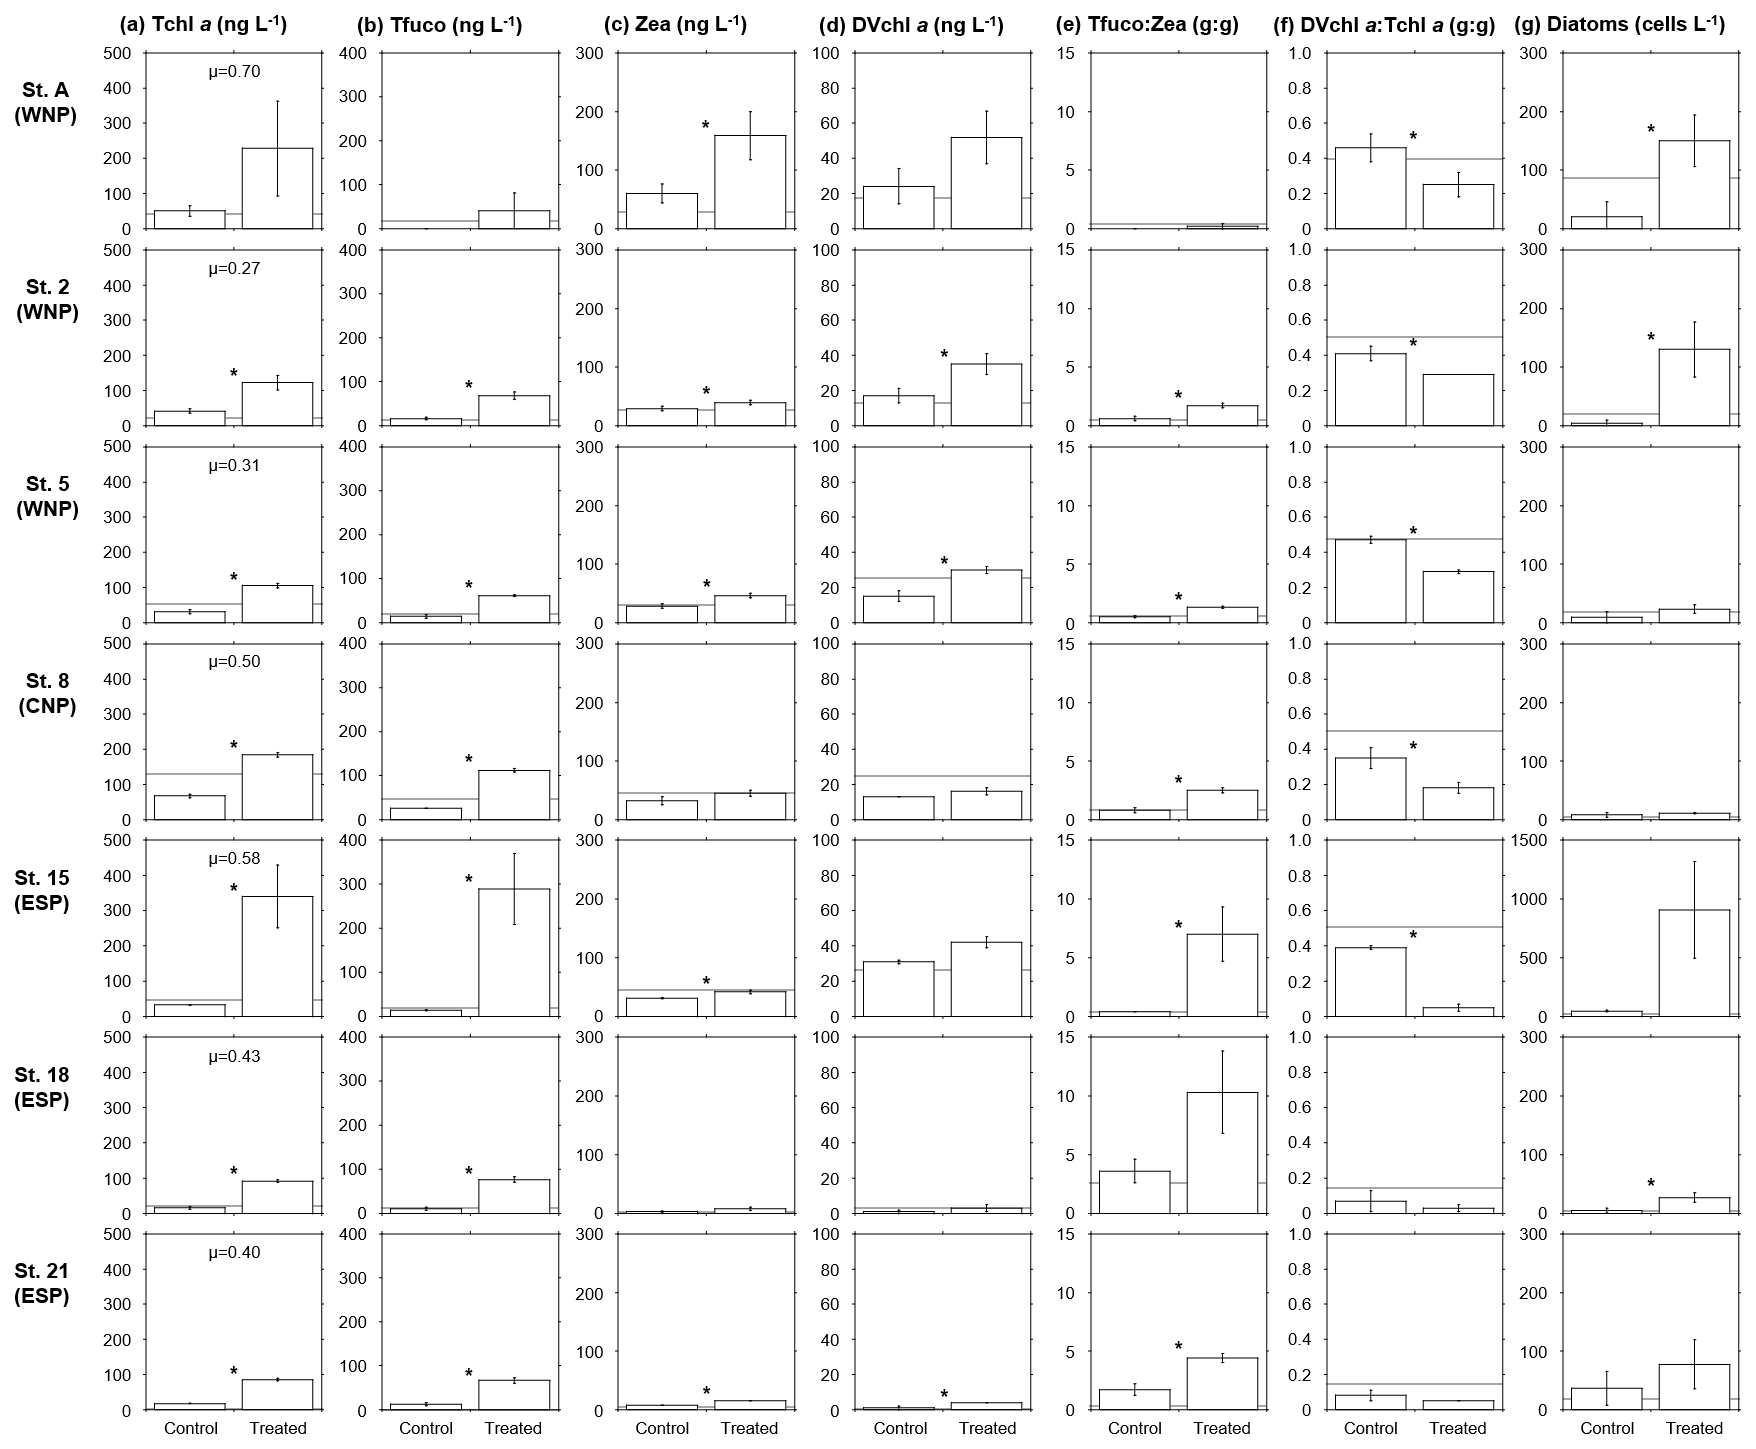
Figure 2(a) Tchl a, (b) Tfuco, (c) Zea, (d) DVchl a, (e) Tfuco:Zea ratios, (f) DVchl a : Tchl a ratios, and (g) diatom cell densities in the control and treated bottles after 48–96 h incubations at seven stations. A grey horizontal line in each panel indicates a mean or single concentration of each pigment at the initial point. Error bars denote standard deviations (n=3). Significant differences (t test, p<0.05) between the values in the control and treated bottles are depicted by asterisks. Net growth rates, μ (d−1), of the phytoplankton blooms (as Tchl a, relative to the control) are denoted in (a) Tchl a. In (g) diatom cell densities, a scale of the y axis at station 15 (∼1500 cells L−1) is different from those at other stations (∼300 cells L−1).
3.3 Nutrient drawdown
Following the phytoplankton blooms, DIN and PO4 concentrations in the treated bottles at all stations showed significant linear decreases as a function of the incubation times (r2>0.82, Fig. 3a and b). In contrast, the concentrations in the control bottles at all stations showed no significant trends. The DIN decreases were largely ascribed to NO3 decreases (Fig. A1a), and, interestingly, NO2 concentrations in the treated bottles at all stations significantly increased with time (Fig. A1b). There were also significant linear increases in the control bottles for NO3 at stations 8 and 15 and for NO2 at station 18, but these changes were quite small (<13 nM). NH4 concentrations in the treated and control bottles showed no significant trends with time, but occasionally high standard deviations (>100 nM) were observed (Fig. A1c).
Drawdown rates (slopes of linear regression lines in Fig. 3a and b) of DIN and PO4 in the treated bottles varied from 1.38 to 7.37 nmol N L−1 h−1 and from 0.13 to 0.71 nmol P L−1 h−1, respectively. These rates were not significantly different from the rates derived from the first 36–48 h incubation data (paired t test, p>0.05). The drawdown rates were relatively low (≤1.49 nmol N L−1 h−1 and ≤0.15 nmol P L−1 h−1, respectively) in the WNP during winter (December, stations 2 and 5), where relatively low mean PAR was observed during the incubation periods (≤284 , Table 1). Differences between the control-corrected mean concentrations of DIN and PO4 at the start and end points of the incubation (ΔDIN and ΔPO4) varied from 123 to 749 nM and from 9 to 53 nM, respectively (Table 3). The values of ΔDIN and ΔPO4 normalized by the incubation times (h) were almost identical to the drawdown rates of DIN and PO4 in the treated bottles (r2=0.99 and r2=0.91 in linear regressions, respectively).
Unlike the DIN and PO4 concentrations, Si(OH)4 concentrations in the treated bottles at all stations did not show any significant linear decreases with the occasionally high standard deviations (>500 nM) (Fig. 3c). The insignificant trends in Si(OH)4 concentrations were also observed in the control bottles at all stations. The difference between the control-corrected mean Si(OH)4 concentrations at the start and end points (ΔSi(OH)4) showed net drawdown values ranging from 7 to 465 nM, although mean Si(OH)4 concentrations in the treated bottles at the start and end points were not significantly different except at station A (Table 3).

Figure 3Temporal changes in concentrations of (a) DIN, (b) PO4, and (c) Si(OH)4 in the control (blue) and treated (red) bottles during the incubation periods at seven stations. Error bars denote standard deviations (n=3). Duplicate or single data are denoted as mean or single values without error bars. Linear regression lines are depicted when significant decreases (p<0.05) in the mean concentrations against time were observed. Errors of slope and intercept represent 95 % confidence intervals.
Table 3Nutrient drawdowns and their ratios throughout the incubation periods. Errors represent 95 % confidence intervals. No error means no triplicate data set.
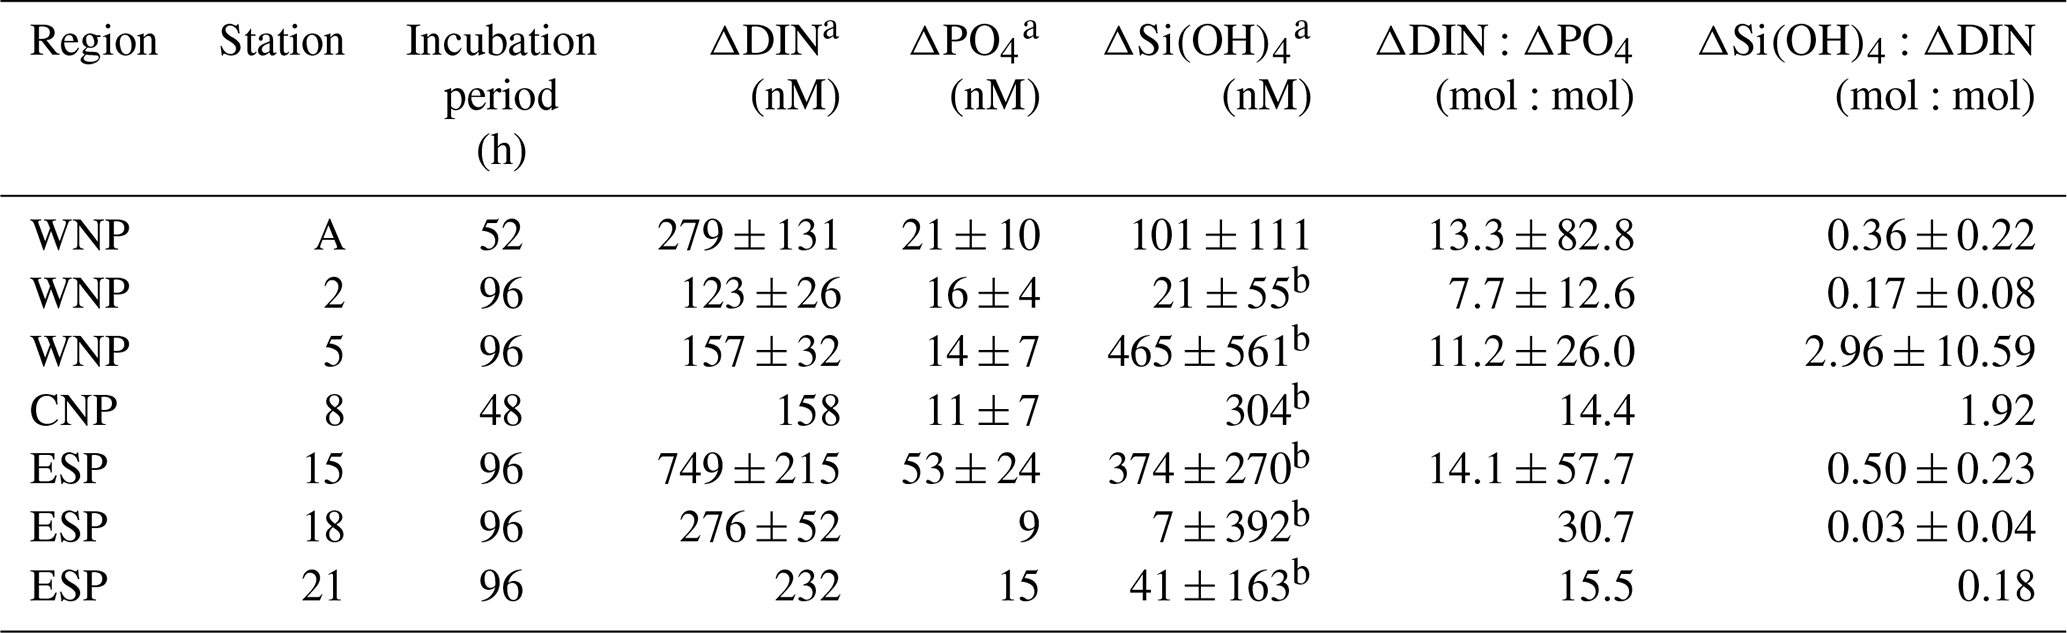
a Difference between the control-corrected mean concentrations at start and end points of incubations. b No significant difference between the mean Si(OH)4 concentrations in the treated bottles at start and end points of incubations (t test, p>0.05).
3.4 Nutrient drawdown ratio
In all experiments, the enriched nutrients in the treated bottles were not fully taken up by phytoplankton during the incubation periods (Fig. 3). Therefore, we assessed the nutrient drawdown ratios using ΔDIN, ΔPO4, and ΔSi(OH)4 (Table 3). ΔDIN:ΔPO4 ratios varied from 7.7 to 30.7. Although 95 % confidence intervals of these ratios were large (12.6–82.8), the relatively lower ratios (≤13.3) were convergent in the WNP (stations A, 2, and 5). ΔSi(OH)4:ΔDIN ratios varied from 0.03 to 2.96, with most stations less than 1 except for stations 5 and 8. However, these ratios, except at station A (0.36), involved uncertainties due to no significant decreases in Si(OH)4 concentrations in the treated bottles during the incubations.
We also evaluated the drawdown characteristics using the control-corrected mean concentrations of DIN and PO4 at sampling points during the incubation periods. A plot of PO4 against DIN showed strong negative linear relationships (r2>0.75), except for station 21 (r2=0.23) (Fig. 4). Here, the drawdown ratio of DIN to PO4 was expressed as 1 slope of the linear regression and ranged from 10.2 to 31.7 with 95 % confidence intervals between 1.8 and 41.6. These drawdown ratios were almost identical to the ΔDIN:ΔPO4 ratios in Table 3 (r2=0.95 in linear regression). In addition, we observed unique variations in PO4 intercepts of the linear regression lines. The PO4 intercepts varied from −23 to 34 nM, with 95 % confidence intervals between 11 and 74 nM and the relatively lower values ( nM) being convergent in the WNP (stations A, 2, and 5).
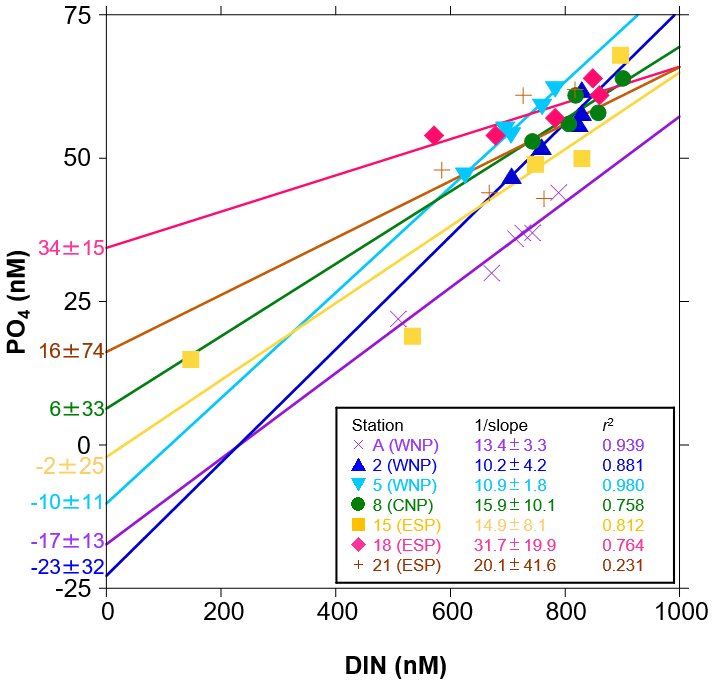
Figure 4Scatter plots of the control-corrected mean concentrations of PO4 against DIN in the incubation experiments at seven stations. Linear regression lines with their parameters (1 slope, PO4 intercept, and r2) at seven stations were denoted by the different colours. Errors of 1 slope and PO4 intercept represent 95 % confidence intervals.
3.5 DON and DOP
DON and DOP concentrations in both the treated and control bottles did not show any significant increase or decrease as a function of the incubation time, except for DOP in the treated bottles at station 8 in the CNP (Fig. A2a and b). At this station, the DOP concentrations in the treated bottles significantly increased with time, although the change over 48 h (0.03 µM) was smaller than that from 0 to 24 h (−0.07 µM) in the control bottles. Overall, the DON and DOP concentrations in the treated bottles were similar to those in the control bottles, indicating that the deep water did not contain significant amounts of DON and DOP, and its additions did not alter DON and DOP regimes during the incubation periods.
3.6 Basin-wide P* distribution in the oligotrophic Pacific
The assembled surface N+N and PO4 data (Fig. A3a and b) revealed a detailed surface P* distribution over the oligotrophic Pacific Ocean (Fig. 5). The distributional pattern of P* was similar to that of PO4 (Fig. A3b), mainly due to a broad area with low N+N (<100 nM) (Fig. A3a). The P* showed a clear west–east gradient from <50 nM in the western basin to ∼500 nM in the eastern basin. In the western basin, the extremely low P* (<10 nM) was found in the WNP. Stations A, 2, and 5 were located within this low-P* area. Station 8 was in the intermediate P* area (50–100 nM) in the CNP, while stations 15, 18, and 21 were within the high-P* area (>100 nM) in the ESP.
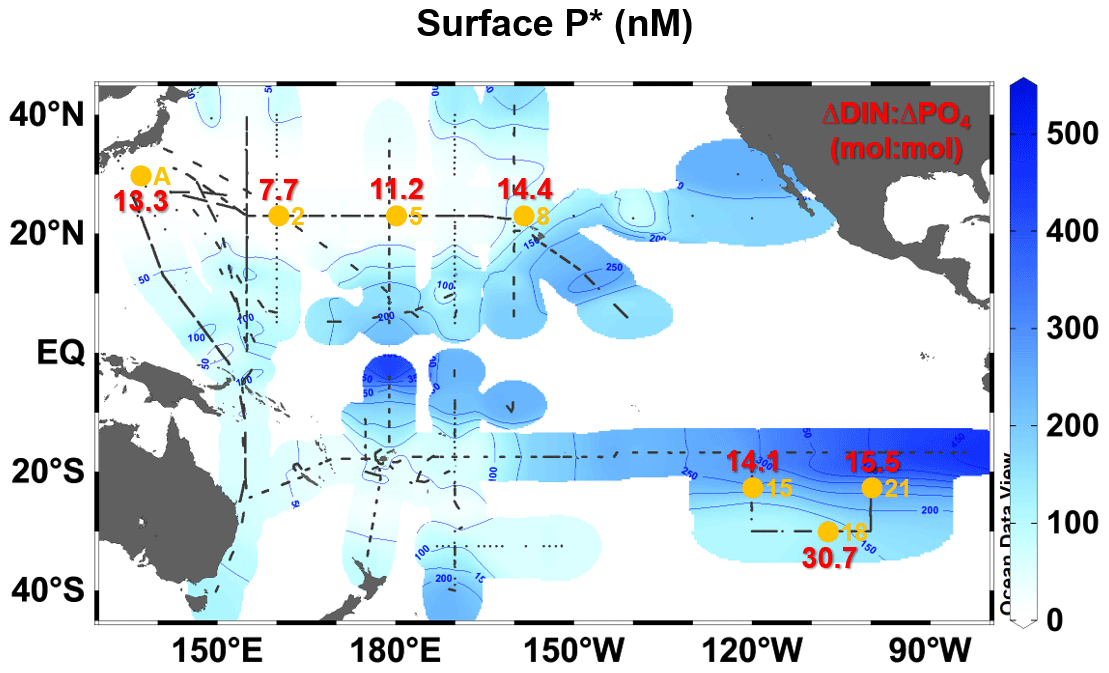
Figure 5Surface distributions of P* in the oligotrophic Pacific Ocean (40∘ N–40∘ S). The P* data were derived from the assembled data on nanomolar concentrations (<1000 nM) of PO4 and N+N. Small black dots denote sampling stations for the nanomolar PO4 and N+N. Large orange circles denote the stations where the incubation experiments were conducted. Red values indicate the experimentally determined ΔDIN:ΔPO4 ratios (Table 3).
4.1 Phytoplankton blooms following deep-water additions
Our study confirms that deep-water additions induced phytoplankton blooms in various regions of the subtropical Pacific Ocean. Such induced blooms have also been reported at station ALOHA in the subtropical North Pacific Ocean (Mahaffey et al., 2012). The ALOHA experiments revealed that Tchl a-based growth rates following deep-water additions were higher in boreal summer than boreal winter. A similar seasonal trend was observed in the North Pacific stations reported here; net growth rates were higher at the westernmost site in July (station A, 0.70 d−1) than other sites in December (stations 2, 5, and 8, 0.27–0.50 d−1) (Fig. 2a). The low growth rates in winter could be explained by low assimilation rates of nutrients (Fig. 3). These results suggest that the magnitude of a subtropical phytoplankton bloom is regulated by additional seasonal factors such as PAR (Table 1).
The net phytoplankton growth rates were relatively low at stations 18 and 21 in the ESP (0.43 and 0.40 d−1, respectively, Fig. 2a), even for austral summer conditions with high PAR (Table 1). Since the ESP is known as a low-dust-deposition area, growth by the resident phytoplankton is considered to be limited by iron (Fe) (Jickells et al., 2005; Blain et al., 2008; Wagener et al., 2008; Moore et al., 2013). However, a Fe-enrichment incubation experiment at station 18 demonstrated that there was no significant difference between the Fe-enriched and control bottles for phytoplankton, nutrients, DON, and DOP during a 96 h incubation, and also these parameter values were little changed from their initial values as the initial values lay within standard deviations of the mean values in the Fe-enriched and control bottles (Appendix A, Table A1). Similar experimental results were reported by Bonnet et al. (2008), and they suggested that phytoplankton growth in the ESP is limited by N rather than Fe. Furthermore, the deep waters used in this study were from a depth (1500 m) within North Pacific intermediate water that typically contains high concentrations of dissolved Fe (>0.6 nM, i.e. not iron-limiting) (Nishioka et al., 2013, 2020). These lines of evidence imply that surface phytoplankton in the ESP and their bloom formation were not primarily limited by Fe. Although grazing by zooplankton is a possible factor controlling phytoplankton net growth, it was suggested to be weak in the case of the subtropical phytoplankton blooms following deep-water additions (Mahaffey et al., 2012). There is further research required to understand the factors controlling the bloom development in the ESP.
The induced phytoplankton blooms in this study were accompanied by changes in community structure. Several nutrient enrichment experiments conducted in the subtropical oceans have demonstrated significant increases in eukaryotic phytoplankton following nutrient enrichments, particularly of N (Bonnet et al., 2008; Moore et al., 2008; Mahaffey et al., 2012; Shilova et al., 2017; Rii et al., 2018; Lampe et al., 2019; Robidart et al., 2019). Similar blooms dominated by eukaryotic phytoplankton were also observed at most stations in this study as evidenced by the Tfuco increases (Fig. 2b). In addition, significant increases in cyanobacteria (Zea and DVchl a) following deep-water additions were also observed particularly in the WNP and CNP (Fig. 2c and d). The relative proportions of cyanobacteria to eukaryotes in the treated bottles were lower in the ESP than the WNP and CNP (Fig. 2e). At stations 18 and 21 in the ESP, the low proportions of Prochlorococcus at time zero (Table 2) might influence the low proportions of cyanobacteria in the induced phytoplankton blooms. On the other hand, the relative increases in cyanobacterial abundances in the North Pacific experiments are likely driven by seasonal phytoplankton response to nutrient enrichment. Mahaffey et al. (2012) reported that there were smaller increases in eukaryote abundances in winter than in summer at station ALOHA following deep-water additions. Because of this, the relative increases in cyanobacteria in the wintertime North Pacific (stations 2, 5, and 8) might be significant. However, although station A in the WNP was occupied in summer, we did not observe any significant eukaryotic bloom following deep-water addition (Fig. 2e). This opposing trend at station A could be due to regional differences of seasonal phytoplankton responses to nutrient enrichments, as summer eukaryotic blooms frequently occur in the eastern basin compared to the western basin in the North Pacific (Wilson, 2011; Villareal et al., 2012; Hashihama et al., 2014; Jiang et al., 2021).
4.2 N and P drawdown characteristics
Our incubation experiments have revealed consistent linear decreases in DIN and PO4 concentrations, at nanomolar levels, along with the development of phytoplankton blooms (Fig. 3a and b). Additionally, accurate measurements of nanomolar inorganic N species detected the consistent increases in NO2 concentrations in the treated bottles in which there were large decreases in NO3 concentrations. This trend was particularly prominent at station A (Fig. A1a and b). These NO2 increases could be due to in vitro nitrification of NH4 and/or incomplete assimilation of NO3 by phytoplankton (Lomas and Lipschultz, 2006). While the factors controlling regional or seasonal differences in these NO2 increases remains unknown, we demonstrate that sensitive measurements for multiple nutrients enable us to detect trace, but important, biogeochemical dynamics in response to the addition of nutrient-rich deep water.
Unlike the DIN and PO4, DON and DOP concentrations did not show any consistent changes over time despite the occurrence of the phytoplankton blooms (Fig. A2). Although natural phytoplankton in the nutrient-depleted oligotrophic oceans show high affinity to DON and DOP (Karl and Björkman, 2015; Sipler and Bronk, 2015), the DON and DOP concentrations here did not indicate a net drawdown in either the treated or control bottles. For the treated bottles, phytoplankton N and P demands were largely met by the enriched inorganic nutrients – which were not exhausted during the incubation periods (Fig. 3a and b). The DON and DOP dynamics during the development of phytoplankton blooms appear to be in an equilibrium between uptake and release, as seen under ambient conditions like those in the control bottles (Fig. A2).
Although the induced phytoplankton blooms in this study were solely dependent on DIN and PO4, regionally unique ΔDIN:ΔPO4 ratios were unveiled (Table 3). The ΔDIN:ΔPO4 ratios showed a geographical trend with relatively lower ratios in the PO4-depleted WNP (7.7–13.3) than in the other PO4-replete regions (14.1–30.7) although there were large variations in 95 % confidence intervals (12.6–82.8). While the ratios in the PO4-replete regions were similar to the range (16–28) from the Redfield ratio to the subtropical particulate N:P ratios (Redfield, 1958; Martiny et al., 2013), those in the WNP were convergently lower than 16. Cellular N:P ratios in the subtropical phytoplankton are higher in cyanobacteria (25–35) than for eukaryotes (16) (Martiny et al., 2013). Because the phytoplankton blooms in the WNP were composed of communities with a relatively high proportion of cyanobacteria (Fig. 2e and f), the lower ΔDIN:ΔPO4 ratios (7.7–13.3) could not be explained by phytoplankton cellular N:P ratios. Since macro-scale (>2000 km) exhaustion of PO4 in the WNP is coupled with N2 fixation (Hashihama et al., 2009; Martiny et al., 2019), N2 fixation by diazotrophic cyanobacteria might potentially meet some of phytoplankton N demand. However, assuming a relatively high N2 fixation rate in the WNP (5 nmol N L−1 d−1, Hashihama et al., 2020), the contributions of N2 fixation to Δ(DIN+N2) were small (4–16 %), leading to still lower ratios (8.9–13.8) than 16.
Other explanations for the regionally unique ΔDIN:ΔPO4 ratios we observed (Table 3) are based on resident communities being primed for rapid P acquisition. Lomas et al. (2014) reported that phytoplankton in the western subtropical North Atlantic have active PO4 transporters which are rapidly induced under severely PO4 depleted condition. In addition, several studies have reported that microbial genes for the high-affinity PO4 transporter (pstSCAB) are enriched in the PO4-depleted regions in the western North Atlantic and WNP compared to the PO4-replete regions in the CNP and ESP (Coleman and Chisholm, 2010; Hashihama et al., 2019). These studies indicated that the phytoplankton in the PO4-depleted regions possess a high PO4 uptake capability. Since N perturbation to phytoplankton little alters their cellular N quota (Moreno and Martiny, 2018), a high cellular P accumulation by the high uptake capability could induce the surplus drawdowns of PO4 relative to DIN in the incubation experiments of the PO4-depleted WNP. Since DOP uptake and release in the treated bottles in the WNP were balanced (Fig. A2), the assimilated PO4 would be sustained in the cellular P components such as polyphosphate, which typically accumulates in particulate P in the PO4-depleted regions such as the western North Atlantic and WNP (Martin et al., 2014; Hashihama et al., 2020).
4.3 Si and N drawdown characteristics
Previous field studies have reported that natural diatom blooms in the subtropical North Pacific were accompanied by high Si(OH)4:DIN drawdown ratios (>1) (Benitez-Nelson et al., 2007; Hashihama et al., 2014). However, in our incubation experiments, most of the ΔSi(OH)4:ΔDIN ratios were less than 1 and involved no significant values of ΔSi(OH)4 (Table 3). Furthermore, there was no significant ΔSi(OH)4 even with a large increase (806 cells L−1 relative to the control) in diatom stocks at station 15 (Table 3 and Figs. 2g and 3c). This increased diatom density is comparable to that in the natural bloom in the WNP reported by Hashihama et al. (2014). This mismatch between increased stocks and little change in ΔSi(OH)4 implies that the ΔSi(OH)4:ΔDIN ratio is not so high in an early stage of diatom blooms. Si(OH)4 uptake and release would be balanced in the early bloom phase. In addition, a low ΔSi(OH)4:ΔDIN ratio in the early bloom phase was also observed in a mesoscale Fe-enrichment experiment in the northeastern part of the subarctic Pacific, suggesting no Fe limitation of diatoms in the early bloom phase (Boyd et al., 2005). Probably, in a Fe- or DIN-depleted late stage of the bloom, selective Si(OH)4 removal by diatoms (>1 of ΔSi(OH)4:ΔDIN) occurs through putative biogeochemical processes such as selective Si export (Si pump), anomalous-Si-uptake-associated diatom physiology, and/or Si uptake supported by N2 fixation (Dugdale and Wilkerson, 1998; Takeda, 1998; Boyd et al., 2005; Benitez-Nelson et al., 2007; Brzezinski et al., 2011; Krause et al., 2013; Hashihama et al., 2014).
4.4 Possible influences of the subtropical phytoplankton blooms on P* distribution
The present study is the first to reveal basin-wide distributions of surface P* in the oligotrophic Pacific Ocean using nanomolar N+N and PO4 data (Fig. 5). The distributional pattern of surface P* coincided with that obtained in the upper 120 m using micromolar NO3 and PO4 data (Deutsch et al., 2007), indicating that a relatively homogenous P* condition prevails throughout the water column from the surface to 120 m depth. Based on the conventional concept, the upper layer P* is likely controlled by N2 fixation and denitrification (Deutsch et al., 2007). However, by comparing surface P* distribution with experimentally determined ΔDIN:ΔPO4 ratios across the subtropical Pacific, we see insights into additional controls on P*. The low (≤13.3) and high (≥14.1) ΔDIN:ΔPO4 ratios geographically corresponded to the low and high P* in the WNP (<50 nM, stations A, 2, and 5) and the CNP and ESP (>50 nM, stations 8, 15, 18, and 21), respectively (Fig. 5).
A comparison of the PO4 intercepts that were determined from the deep-water addition experiments with surface P* (from ambient concentrations) was conducted (Fig. 6). This cross-comparison was valuable since both represent metrics for excess PO4 that remains after DIN exhaustion. The PO4 intercepts and P* are hereafter referred to as “bloom P*” and “ambient P*”, respectively. The bloom and ambient P* showed a similar geographical trend, with both being relatively low in the PO4-depleted WNP (stations A, 2, and 5) when compared with the PO4-replete regions (stations 8, 15, 18, and 21). The 1- to 2-orders-of-magnitude-higher ambient P* than bloom P* in the PO4-replete regions suggests that, rather than phytoplankton uptake, denitrification (and also anammox) has a more pronounced influence on setting excess PO4 in those regions. This trend may be particularly important in the ESP, which is the vicinity of an oxygen minimum zone with active denitrification and anammox conditions (Paulmier and Ruiz-Pino, 2009). Alternately, N2 fixation may exert an influence on ambient P* in the PO4-depleted WNP. However, several studies reported that directly measured N2 fixation rates are not consistently high in the WNP compared to other subtropical Pacific regions (Shiozaki et al., 2009, 2010; Bonnet et al., 2017; Hashihama et al., 2020). Given that natural phytoplankton blooms in the subtropical oceans have a large impact on nutrient dynamics through new production (Benitez-Nelson et al., 2007; McGillicuddy et al., 2007; Dore et al., 2008), the surplus PO4 removal by phytoplankton bloom as observed in our experiments might play a significant role in maintaining low ambient P* in the WNP.
Furthermore, we found the unique result that bloom P* showed negative values in the PO4-depleted WNP (stations A, 2, and 5), while the ambient P* did not exhibit negative values (Fig. 6). The difference between the bloom P* and ambient P* largely depends on the different N:P consumption ratios of ≤13.3 and 16, respectively. If the low N:P consumption ratios (≤13.3) are consistently dominant in the PO4-depleted WNP, alternative P sources other than PO4 would be required to fully exhaust DIN. Since lower DOP concentrations and higher alkaline phosphatase activity were observed in the WNP, compared to other subtropical Pacific regions (Hashihama et al., 2019, 2020), active DOP utilization in the WNP likely contributes to the DIN exhaustion. These perspectives suggest that, in the studies on subtropical nutrient biogeochemistry using N:P stoichiometry, the bioavailable fraction of DOP could be an important factor as well as DIN and PO4.
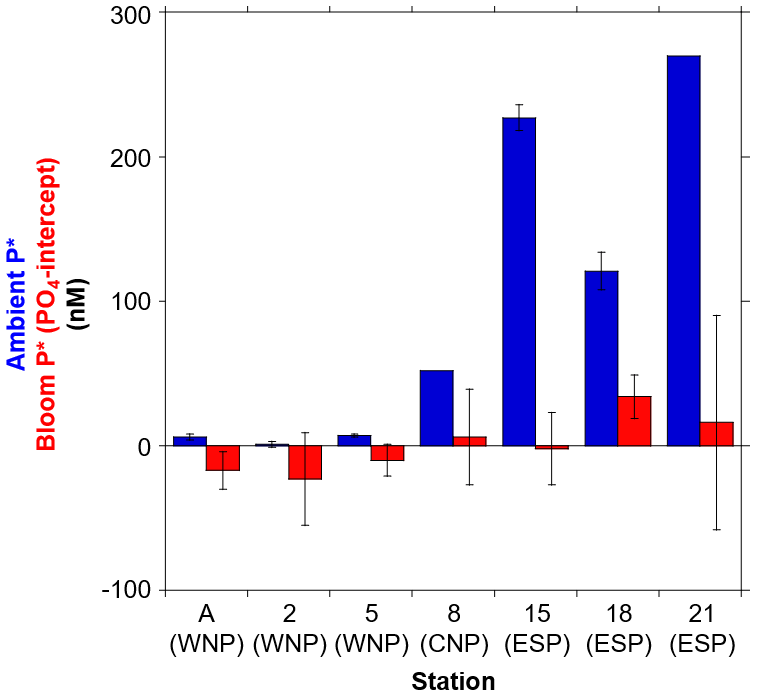
Figure 6Comparison of ambient P* (blue) and bloom P* (red) at seven stations. The bloom P* is identical to the experimentally determined PO4 intercept in Fig. 4. Error bars denote 95 % confidence intervals. The ambient P* values at stations 8 and 21 have no error bar due to no triplicate data set.
By applying highly sensitive analytical methodology, we have revealed nutrient drawdowns and their ratios during the developments of phytoplankton blooms as induced by deep-water additions to the surface water of the oligotrophic Pacific Ocean. The ΔDIN:ΔPO4 ratios showed a geographical variation from low in the PO4-depleted WNP to high in the PO4-replete ESP. While the ΔDIN:ΔPO4 ratios in the PO4-replete regions were similar to the range from the Redfield ratio to the typical subtropical particulate N:P ratio (16–28), those in the PO4-depleted regions (7.7–13.3) could not be expected from the conventional phytoplankton N:P ratios. The lower ΔDIN:ΔPO4 ratios were likely due to the high PO4 uptake capability of low-PO4-adapted subtropical phytoplankton. The regional trend in ΔDIN:ΔPO4 ratios was aligned with that of ambient P* in the oligotrophic Pacific. Although it remains necessary to examine nutrient assimilation characteristics in natural phytoplankton blooms, the regional variation in ΔDIN:ΔPO4 ratios as observed in our experiments appears to at least control basin-scale ambient P* distribution in addition to conventional N2 fixation and denitrification (also anammox). We have also demonstrated that accurate measurements of nanomolar nutrients are powerful tools in investigating trace nutrient dynamics. Further application of these tools to the field and experimental studies would be beneficial for the understanding of nutrient biogeochemistry in the oligotrophic ocean.
The Fe-enrichment incubation experiment was conducted using the surface water (10 m depth) collected at station 18 in the ESP (Table 1 and Fig. 1). Water sampling was performed using HCl-cleaned Teflon-coated Niskin-X bottles (General Oceanics) on a CTD system (Sea-Bird Electronics) attached to a titanium-armoured cable. This sampling procedure succeeded in avoiding Fe contamination as reported previously (Shiozaki et al., 2018). The surface water was poured into 1.19 L polycarbonate bottles, and then Fe was enriched as iron chloride (FeCl3, Iron Standard Solution Fe 1000, Wako) at the final concentration of 1.8 nM. The triplicate bottles for either Fe enrichment or control were prepared. These bottles were pre-cleaned sequentially with neutral detergent, 1 M HCl, and 0.3 M hot HCl (for analysis of poisonous metals, Wako) and filled with pure water for a day (Takeda and Obata, 1995). Both the Fe-enriched and control bottles were incubated for 96 h in the on-deck incubator as described in Sect. 2.2. After 96 h, the incubated bottles were sampled for nanomolar nutrients, DON, DOP, and Tchl a. Initial samples for nanomolar nutrients, DON, DOP, and Tchl a were collected in duplicate directly from the Niskin-X bottles. The samples for nanomolar nutrients, DON, and DOP were processed and analysed as described in Sect. 2.3 and 2.4. For Tchl a here, a water volume of 100 mL was filtered onto GF/F filters, and the filter samples extracted with N,N-dimethylformamide (DMF, Wako) were analysed using a Turner Design fluorometer (Suzuki and Ishimaru, 1990). A Student t test was performed to determine significant differences (p<0.05) between the measured parameter values in the Fe-enriched and control bottles.
Table A1Results of a Fe-enrichment incubation experiment at station 18 in the ESP. Errors represent standard deviations (n=3). Differences between mean values in control and Fe treatment were insignificant for all parameters (t test, p>0.05).
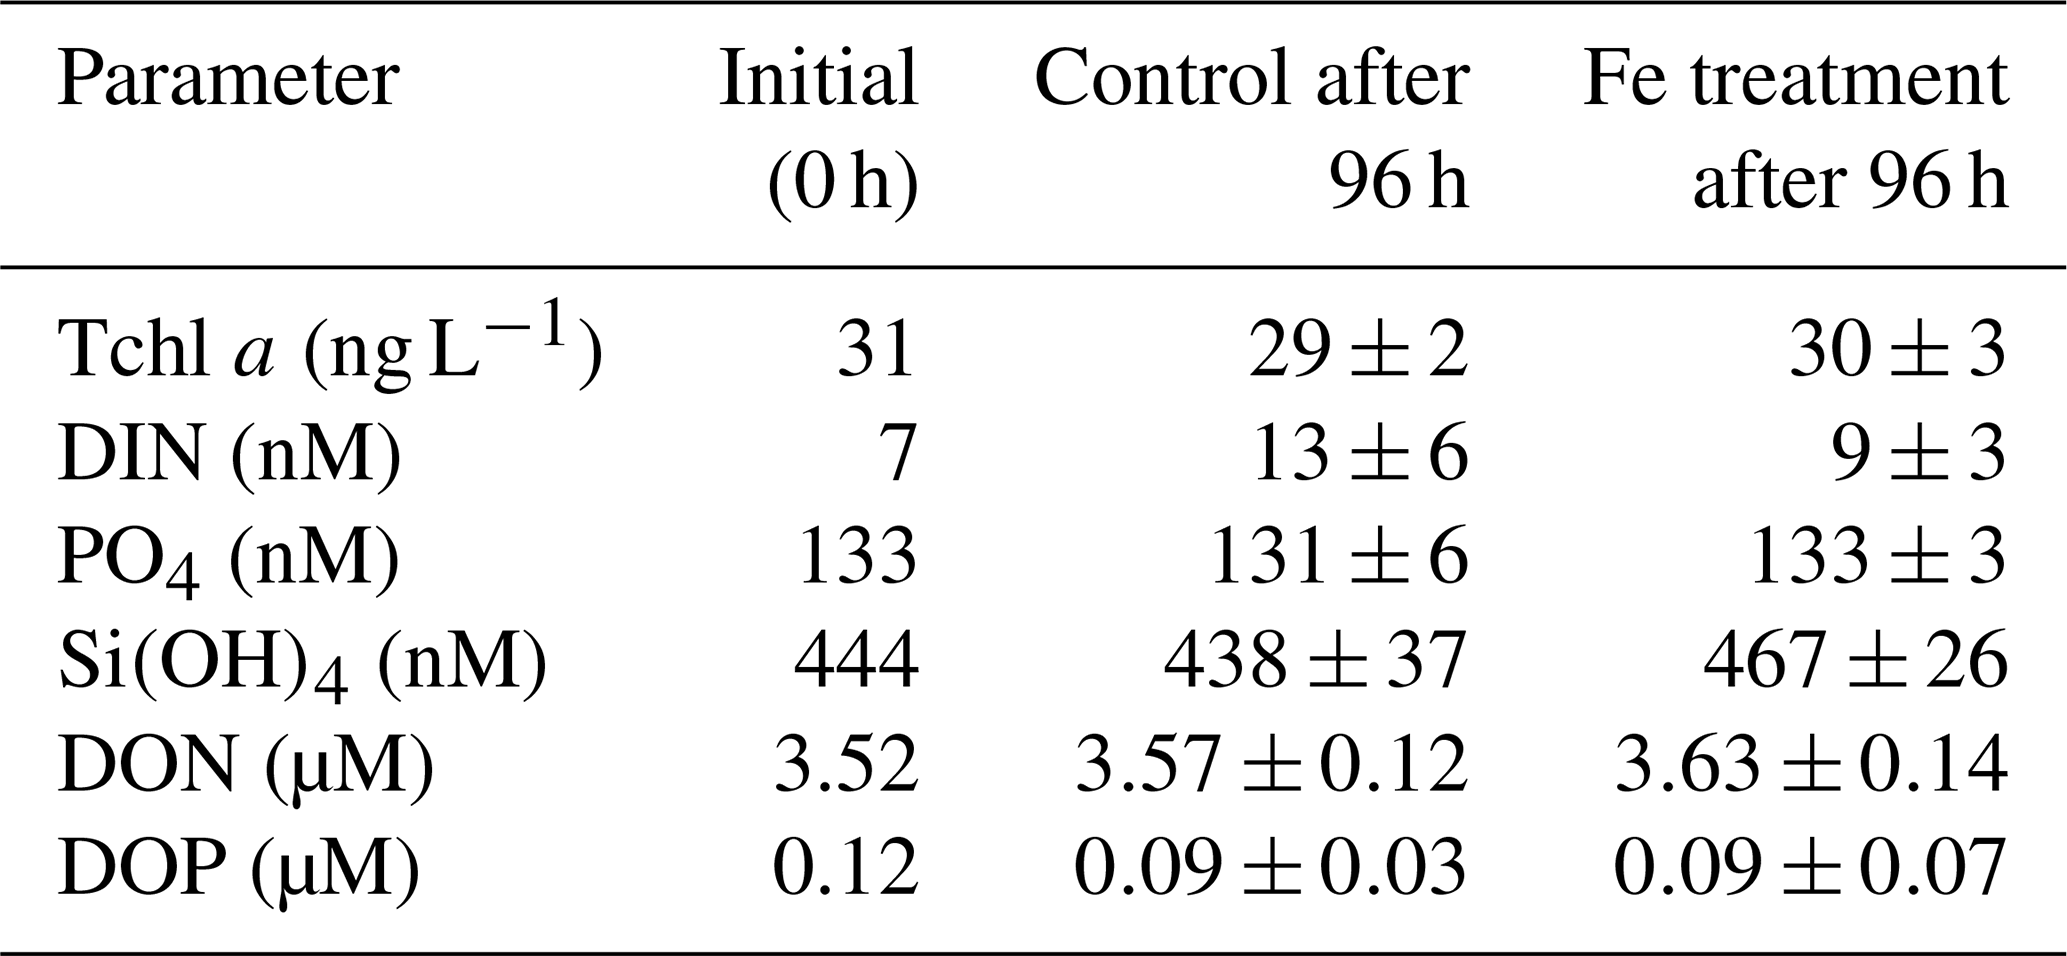
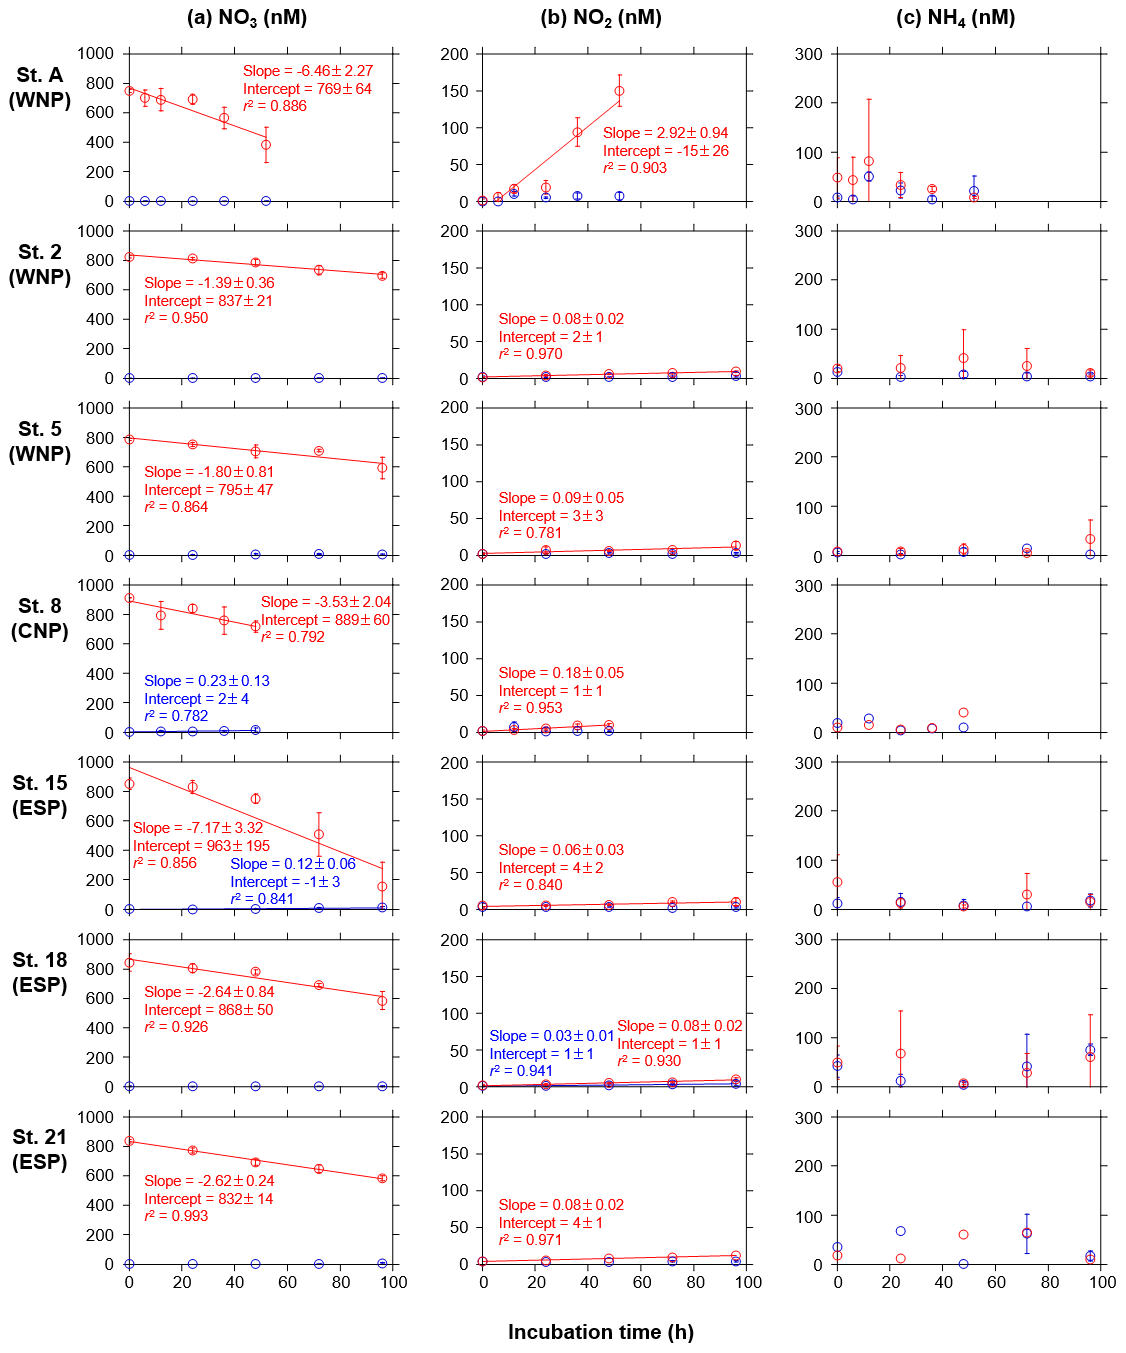
Figure A1Temporal changes in concentrations of (a) NO3, (b) NO2, and (c) NH4 in the control (blue) and treated (red) bottles during the incubation periods at seven stations. Error bars denote standard deviations (n=3). Duplicate or single data are denoted as mean or single values without error bars. Linear regression lines are depicted when significant decreases or increases (p<0.05) in the mean concentrations against time were observed. Errors of slope and intercept represent 95 % confidence intervals.
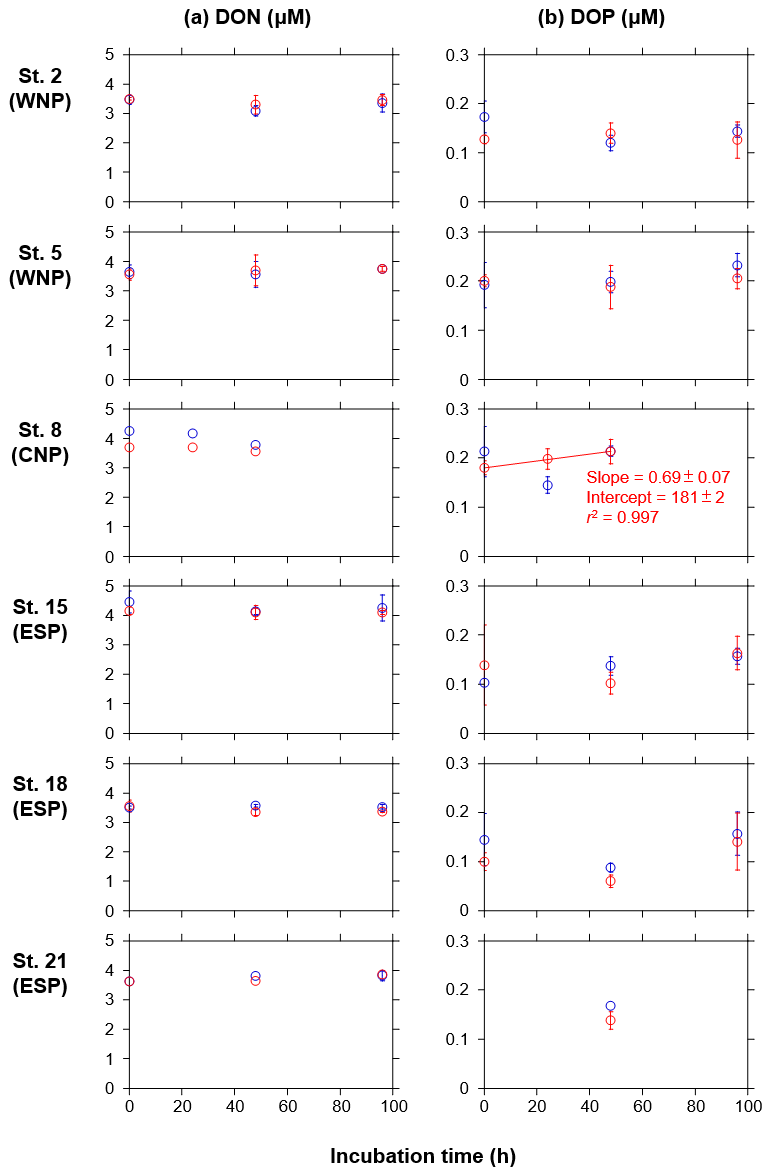
Figure A2Temporal changes in concentrations of (a) DON and (b) DOP in the control (blue) and treated (red) bottles during the incubation periods at six stations during the KH-11-10 cruise. Error bars denote standard deviations (n=3). Duplicate or single data are denoted as mean or single values without error bars. A linear regression line is depicted in the DOP concentrations in the treated bottle at station 8, as a significant increase (p<0.05) in the mean concentration against time was observed. Errors of slope and intercept represent 95 % confidence intervals.
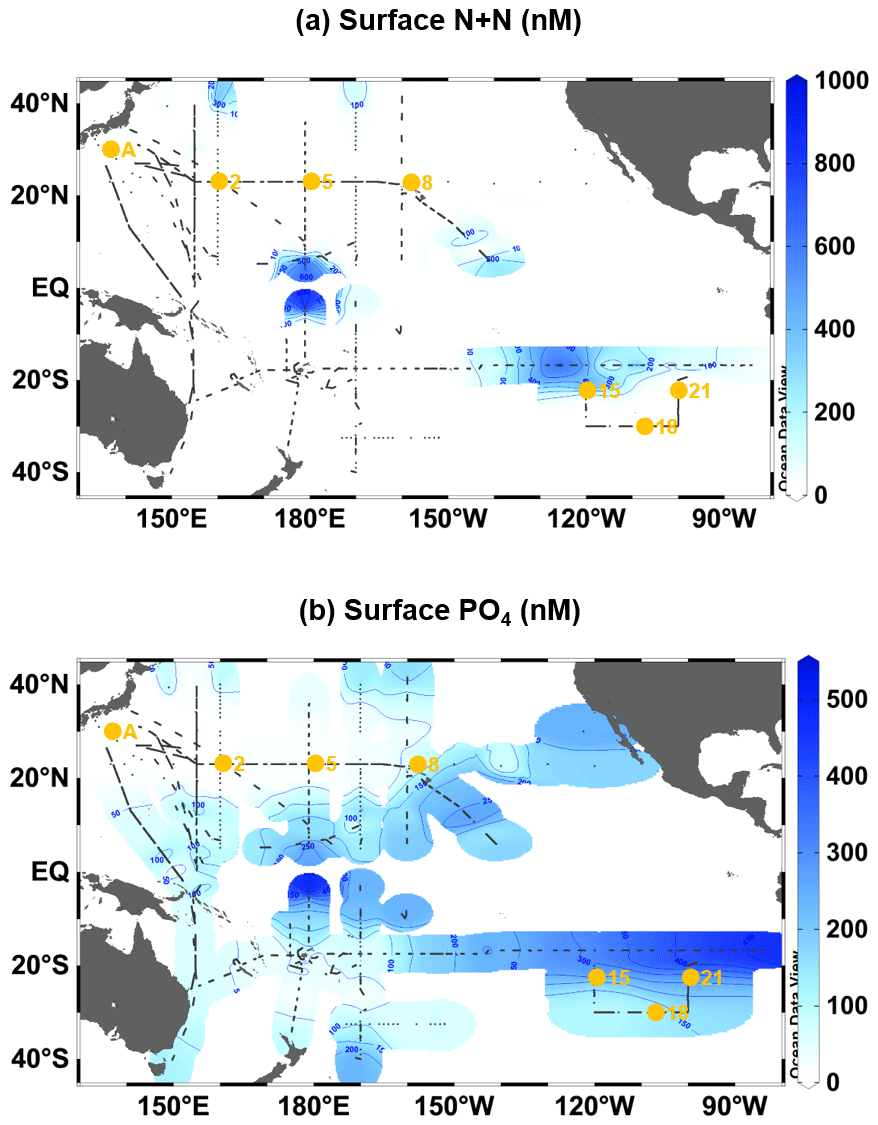
Figure A3Surface distributions of nanomolar concentrations (<1000 nM) of (a) N+N and (b) PO4 in the oligotrophic Pacific Ocean (40∘ N–40∘ S). Small black dots denote sampling stations for the nanomolar PO4 and N+N. Large orange circles denote the stations where the incubation experiments were conducted.
The data are available upon request to the corresponding author (Fuminori Hashihama).
FH designed the incubation experiments. KF, HS, HO, and PWB designed the sampling schemes across the subtropical North and South Pacific. FH, TK, JK, and EMSW collected nanomolar nutrient data. SYT, FH, and JK collected DON and DOP data. FH collected phytoplankton data. FH and IT performed the Fe-enrichment incubation experiment. FH wrote the manuscript. All authors reviewed and approved the manuscript.
The authors declare that they have no conflict of interest.
We thank the officers, crew, and scientists of the cruises of R/V Tansei Maru and R/V Hakuho Maru (Japan Agency for Marine-Earth Science and Technology) for their cooperation at sea. These cruises were performed under the cooperative research system of the Atmosphere and Ocean Research Institute, The University of Tokyo. We are grateful to Shinko Kinouchi and Shuhei Suwa for help with sample collections during the cruises.
This research has been supported by JSPS/MEXT KAKENHI (grant nos. 18067007, 22710006, 24710004, 24121001, 24121003, 24121005, 15H02802, and 17H01852) and a New Zealand international visiting scientist grant.
This paper was edited by Julia Uitz and reviewed by two anonymous referees.
Benitez-Nelson, C. R., Bidigare, R. R., Dickey, T. D., Landry, M. R., Leonard, C. L., Brown, S. L., Nencioli, F., Rii, Y. M., Maiti, K., Becker, J. W., Bibby, T. S., Black, W., Cai, W. J., Carlson, C. A., Chen, F., Kuwahara, V. S., Mahaffey, C., McAndrew, P. M., Quay, P. D., Rappé, M. S., Selph, K. E., Simmons, M. P., and Yang, E. J.: Mesoscale eddies drive increased silica export in the subtropical Pacific Ocean, Science, 316, 1017–1021, 2007.
Björkman, K. M., Duhamel, S., Church, M. J., and Karl, D. M.: Spatial and temporal dynamics of inorganic phosphate and adenosine-5'-triphosphate in the North Pacific Ocean, Front. Mar. Sci., 5, 235, https://doi.org/10.3389/fmars.2018.00235, 2018.
Blain, S., Bonnet, S., and Guieu, C.: Dissolved iron distribution in the tropical and sub tropical South Eastern Pacific, Biogeosciences, 5, 269–280, https://doi.org/10.5194/bg-5-269-2008, 2008.
Bonnet, S., Guieu, C., Bruyant, F., Prášil, O., Van Wambeke, F., Raimbault, P., Moutin, T., Grob, C., Gorbunov, M. Y., Zehr, J. P., Masquelier, S. M., Garczarek, L., and Claustre, H.: Nutrient limitation of primary productivity in the Southeast Pacific (BIOSOPE cruise), Biogeosciences, 5, 215–225, https://doi.org/10.5194/bg-5-215-2008, 2008.
Bonnet, S., Caffin, M., Berthelot, H., and Moutin, T.: Hotspot of N2 fixation in the western tropical South Pacific pleads for a spatial decoupling between N2 fixation and denitrification, P. Natl. Acad. Sci. USA, 114, E2800–E2801, 2017.
Boyd, P. W., Strzepek, R., Takeda, S., Jackson, G., Wong, C. S., McKay, R. M., Law, C., Kiyosawa, H., Saito H., Sherry, N., Johnson, K., Gower, J., and Ramaiah, N.: The evolution and termination of an iron-induced mesoscale bloom in the northeast subarctic Pacific, Limnol. Oceanogr., 50, 1872–1886, 2005.
Brzezinski, M. A.: The Si:C:N ratio of marine diatoms: interspecific variability and effect of some environmental variables, J. Phycol., 21, 347–357, 1985.
Brzezinski, M. A., Krause, J. W., Church, M. J., Karl, D. M., Li, B., Jones, J. L., and Updyke, B.: The annual silica cycle of the North Pacific subtropical gyre, Deep-Sea Res. Pt. I, 58, 988–1001, 2011.
Casey, J. R., Lomas, M. W., Michelou, V. K., Dyhrman, S. T., Orchard, E. D., Ammerman, J. W., and Sylvan, J. B.: Phytoplankton taxon-specific orthophosphate (Pi) and ATP utilization in the western subtropical North Atlantic, Aquat. Microb. Ecol., 58, 31–44, 2009.
Chisholm, S. W., Olson, R. J., Zettler, E. R., Goericke, R., Waterbury, J. B., and Welschmeyer, N. A.: A novel free-living prochlorophyte abundant in the oceanic euphotic zone, Nature, 334, 340–343, 1988.
Coleman, M. L. and Chisholm, S. W.: Ecosystem-specific selection pressures revealed through comparative population genomics, P. Natl. Acad. Sci. USA, 107, 18634–18639, 2010.
Deutsch, C., Gruber, N., Key, R. M., and Sarmiento, J. L.: Denitrification and N2 fixation in the Pacific Ocean, Global Biogeochem. Cy., 15, 485–506, 2001.
Deutsch, C., Sarmiento, J. L., Sigman, D. M., Gruber, N., and Dunne, J. P.: Spatial coupling of nitrogen inputs and losses in the ocean, Nature, 445, 163–167, 2007.
Dore, J. E., Lukas, R., Sadler, D. W., and Karl, D. M.: Climate-driven changes to the atmospheric CO2 sink in the subtropical North Pacific Ocean, Nature, 424, 754–757, 2003.
Dore, J. E., Letelier, R. M., Church, M. J., Lukas, R., and Karl, D. M.: Summer phytoplankton blooms in the oligotrophic North Pacific Subtropical Gyre: Historical perspective and recent observations, Prog. Oceanogr., 76, 2–38, 2008.
Dugdale, R. C. and Goering, J. J.: Uptake of new and regenerated forms of nitrogen in primary productivity, Limnol. Oceanogr., 12, 196–206, 1967.
Dugdale, R. C. and Wilkerson, F. P.: Silicate regulation of new production in the equatorial Pacific upwelling, Nature, 391, 270–273, 1998.
Ellwood, M. J., Bowie, A. R., Hassler, C., Law, C. S., Baker, A., Sander, S., Stevens, C., Townsend, A., Woodward, E. M. S., Wuttig, K., Gault-Ringold, M., Maher, W. A., Marriner, A., Nodder, S., Merwe, P. v. d., and Boyd, P. W.: Insights into the biogeochemical cycling of iron, nitrate, and phosphate across a 5,300 km South Pacific zonal section (153∘ E–150∘ W), Global Biogeochem. Cy., 32, 187–207, 2018.
Eppley, R. W. and Peterson, B. J.: Particulate organic matter flux and planktonic new production in the deep ocean, Nature, 282, 677–680, 1979.
Eppley, R. W. and Renger, E. H.: Nanomolar increase in surface layer nitrate concentration following a small wind event, Deep-Sea Res., 35, 1119–1125, 1988.
Eppley, R. W., Garside, C., Renger, E. H., and Orellana, E.: Variability of nitrate concentration in nitrogen-depleted subtropical surface waters, Mar. Biol., 107, 53–60, 1990.
Falkowski, P. G. and Raven, J. A.: Aquatic photosynthesis, 2nd edn., Princeton University Press, Princeton, 2007.
Fanning, K. A.: Nutrient provinces in the sea: concentration ratios, reaction rate ratios, and ideal covariation, J. Geophys. Res., 97, 5693–5712, 1992.
Garside, C.: The vertical distribution of nitrate in open ocean surface water, Deep-Sea Res. Pt. I, 32, 723–732, 1985.
Girault, M., Arakawa, H., Barani, A., Ceccaldi, H. J., Hashihama, F., Kinouchi, S., and Gregori, G.: Distribution of ultraphytoplankton in the western part of the North Pacific subtropical gyre during a strong La Niña condition: relationship with the hydrological conditions, Biogeosciences, 10, 5947–5965, https://doi.org/10.5194/bg-10-5947-2013, 2013.
Girault, M., Arakawa, H., Barani, A., Ceccaldi, H. J., Hashihama, F., and Gregori, G.: Heterotrophic prokaryote distribution along a 2300 km transect in the North Pacific subtropical gyre during a strong La Niña conditions: relationship between distribution and hydrological conditions, Biogeosciences, 12, 3607–3621, https://doi.org/10.5194/bg-12-3607-2015, 2015.
Gruber, N. and Sarmiento, J. L.: Global patterns of marine nitrogen fixation and denitrification, Global Biogeochem. Cy., 11, 235–266, 1997.
Hansen, H. P. and Koroleff, F.: Determination of nutrients, in: Methods of Seawater Analysis, 3rd edn., edited by: Grasshoff, K., Kremling, K., and Ehrhardt, D., Wiley, Weinheim, 159–228, 1999.
Hashihama, F. and Kanda, J.: Automated colorimetric determination of trace silicic acid in seawater by gas-segmented continuous flow analysis with a liquid waveguide capillary cell, La mer, 47, 119–127, 2010.
Hashihama, F., Horimoto, N., Kanda, J., Furuya, K., Ishimaru, T., and Saino, T.: Temporal variation in phytoplankton composition related to water mass properties in the central part of Sagami Bay, J. Oceanogr., 64, 23–37, 2008.
Hashihama, F., Furuya, K., Kitajima, S., Takeda, S., Takemura, T., and Kanda, J.: Macro-scale exhaustion of surface phosphate by dinitrogen fixation in the western North Pacific, Geophys. Res. Lett., 36, L03610, https://doi.org/10.1029/2008GL036866, 2009.
Hashihama, F., Sato, M., Takeda, S., Kanda, J., and Furuya, K.: Mesoscale decrease of surface phosphate and associated phytoplankton dynamics in the vicinity of the subtropical South Pacific islands, Deep-Sea Res. Pt. I, 57, 338–350, 2010.
Hashihama, F., Kanda, J., Maeda, Y., Ogawa, H., and Furuya, K.: Selective depressions of surface silicic acid within cyclonic mesoscale eddies in the oligotrophic western North Pacific, Deep-Sea Res. Pt. I, 90, 115–124, 2014.
Hashihama, F., Kanda, J., Tauchi, A., Kodama, T., Saito, H., and Furuya, K.: Liquid waveguide spectrophotometric measurement of nanomolar ammonium in seawater based on the indophenol reaction with o-phenylphenol (OPP), Talanta, 143, 374–380, 2015.
Hashihama, F., Suwa, S., Kanda, J., Ehama, M., Sakuraba, R., Kinouchi, S., Sato, M., Yamaguchi, T., Saito, H., Ogura, Y., Hayashi, T., Mori, H., Kurokawa, K., Suzuki, S., and Hamasaki, K.: Arsenate and microbial dynamics in different phosphorus regimes of the subtropical Pacific Ocean, Prog. Oceanogr., 176, 102115, https://doi.org/10.1016/j.pocean.2019.05.007, 2019.
Hashihama, F., Saito, H., Shiozaki, T., Ehama, M., Suwa, S., Sugiyama, T., Kato, H., Kanda, J., Sato, M., Kodama, T., Yamaguchi, T., Horii, S., Tanita, I., Takino, S., Takahashi, K., Ogawa, H., Boyd, P. W., and Furuya, K.: Biogeochemical controls of particulate phosphorus distribution across the oligotrophic subtropical Pacific Ocean, Global Biogeochem. Cy., 34, e2020GB006669, https://doi.org/10.1029/2020GB006669, 2020.
Hill, P. G., Mary, I., Purdie, D. A., and Zubkov, M. V.: Similarity in microbial amino acid uptake in surface waters of the North and South Atlantic (sub-)tropical gyres, Prog. Oceanogr., 91, 437–446, 2011.
Horii, S., Takahashi, K., Shiozaki, T., Hashihama, F., and Furuya, K.: Stable isotopic evidence for the differential contribution of diazotrophs to the epipelagic grazing food chain in the mid-Pacific Ocean, Global Ecol. Biogeogr., 27, 1467–1480, 2018.
Jiang, S., Hashihama, F., and Saito, H.: Phytoplankton growth and grazing mortality through the oligotrophic subtropical North Pacific, J. Oceanogr., https://doi.org/10.1007/s10872-020-00580-4, online first, 2021.
Jickells, T. D., An, Z. S., Andersen, K. K., Baker, A. R., Bergametti, G., Brooks, N., Cao, J. J., Boyd, P. W., Duce, R. A., Hunter, K. A., Kawahata, H., Kubilay, N., laRoche, J., Liss, P. S., Mahowald, N., Prospero, J. M., Ridgwell, A. J., Tegen, I., and Torres, R.: Global iron concentrations between desert dust, ocean biogeochemistry, and climate, Science, 308, 67–71, 2005.
Johnson, K. S., Riser, S. C., and Karl, D. M.: Nitrate supply from deep to near-surface waters of the North Pacific subtropical gyre, Nature, 465, 1062–1065, 2010.
Kanda, J., Saino, T., and Hattori, A.: Nitrogen uptake by natural populations of phytoplankton and primary production in the Pacific Ocean: Regional variability of uptake capacity, Limnol. Oceanogr., 30, 987–999, 1985.
Karl, D. M.: Nutrient dynamics in the deep blue sea, TRENDS Microbiol., 10, 410–418, 2002.
Karl, D. M. and Björkman, K. M.: Dynamics of dissolved organic phosphorus, in: Biogeochemistry of Marine Dissolved Organic Matter, edited by: Hansell, D. A. and Carlson, C. A., Academic Press, Burlington, 233–334, 2015.
Karl, D. M., Church, M. J., Dore, J. E., Letelier, R. M., and Mahaffey, C.: Predictable and efficient carbon sequestration in the North Pacific Ocean supported by symbiotic nitrogen fixation, P. Natl. Acad. Sci. USA, 109, 1842–1849, 2012.
Kitajima, S., Furuya, K., Hashihama, F., Takeda, S., and Kanda, J.: Latitudinal distribution of diazotrophs and their nitrogen fixation in the tropical and subtropical western North Pacific, Limnol. Oceanogr., 54, 537–547, 2009.
Krause, J. W., Brzezinski, M. A., Villareal, T. A., and Wilson, C.: Biogenic silica cycling during summer phytoplankton blooms in the North Pacific subtropical gyre, Deep-Sea Res. Pt. I, 71, 49–60, 2013.
Lampe, R. H., Wang, S., Cassar, N., and Marchetti, A.: Strategies among phytoplankton in response to alleviation of nutrient stress in a subtropical gyre, The ISME journal, 13, 2984–2997, 2019.
Lomas, M. W. and Lipschultz, F.: Forming the primary nitrite maximum: Nitrifiers or phytoplankton, Limnol. Oceanogr., 51, 2453–2467, 2006.
Lomas, M. W., Bonachela, J. A., Levin, S. A., and Martiny, A. C.: Impact of ocean phytoplankton diversity on phosphate uptake, P. Natl. Acad. Sci. USA, 111, 17540–17545, 2014.
Mahaffey, C., Björkman, K. M., and Karl, D. M.: Phytoplankton response to deep seawater nutrient addition in the North Pacific Subtropical Gyre, Mar. Ecol. Prog. Ser., 460, 13–34, 2012.
Martin, P., Dyhrman, S. T., Lomas, M. W., Poulton, N. J., and Van Mooy, B. A.: Accumulation and enhanced cycling of polyphosphate by Sargasso Sea plankton in response to low phosphorus, P. Natl. Acad. Sci. USA, 111, 8089–8094, 2014.
Martiny, A. C., Pham, C. T. A., Primeau, F. W., Vrugt, J. A., Moore, J. K., Levin, S. A., and Lomas, M. W.: Strong latitudinal patterns in the elemental ratios of marine plankton and organic matter, Nat. Geosci., 6, 279–283, 2013.
Martiny, A. C., Lomas, M. W., Fu, W., Boyd, P. W., Chen, Y.-l. L., Cutter, G. A., Ellwood, M. J., Furuya, K., Hashihama, F., Kanda, J., Karl, D. M., Kodama, T., Li, Q. P., Ma, J., Moutin, T., Woodward, E. M. S., and Moore, J. K.: Biogeochemical controls of surface ocean phosphate, Sci. Adv., 5, eaax0341, https://doi.org/10.1126/sciadv.aax0341, 2019.
McGillicuddy Jr., D. J., Anderson, L. A., Bates, N. R., Bibby, T., Buesseler, K. O., Carlson, C. A., Davis, C. S., Ewart, C., Falkowski, P. G., Goldthwait, S. A., Hansell, D. A., Jenkins, W. J., Johnson, R., Kosnyrev, V. K., Ledwell, J. R., Li, Q. P., Siegel, D. A., and Steinberg, D. K.: Eddy/wind interactions stimulate extraordinary mid-ocean plankton blooms, Science, 316, 1021–1026, 2007.
Michaels, A. F., Bates, N. R., Buesseler, K. O., Carlson, C. A., and Knap, A. H.: Carbon-cycle imbalances in the Sargasso Sea, Nature, 372, 537–540, 1994.
Miller, J. C. and Miller, J. N.: Statistics for Analytical Chemistry, 2nd edn, Ellis Horwood, New York, 1993.
Moore, C. M., Mills, M. M., Langlois, R., Milne, A., Achterberg, E. P., LaRoche, J., and Geider, R. J.: Relative influence of nitrogen and phosphorus availability on phytoplankton physiology and productivity in the oligotrophic sub-tropical North Atlantic Ocean, Limnol. Oceanogr., 53, 291–305, 2008.
Moore, C. M., Mills, M. M., Arrigo, K. R., Berman-Frank, I., Bopp, L., Boyd, P. W., Galbraith, E. D., Geider, R. J., Guieu, C., Jaccard, S. L., Jickells, T. D., Roche, J. L., Lenton, T. M., Mahowald, N. M., Marañón, E., Marinov, I., Moore, J. K., Nakatsuka, T., Oschlies, A., Saito, M. A., Thingstad, T. F., Tsuda, A., and Ulloa, O.: Processes and patterns of oceanic nutrient limitation, Nat. Geosci., 6, 701–710, 2013.
Moreno, A. R. and Martiny, A. C.: Ecological Stoichiometry of Ocean Plankton, Annu. Rev. Mar. Sci., 10, 43–69, 2018.
Nishioka, J., Nakatsuka, T., Watanabe, Y. W., Yasuda, I., Kuma, K., Ogawa, H., Ebuchi, N., Scherbinin, A., Volkov, Y. N., Shiraiwa, T., and Wakatsuchi, M.: Intensive mixing along an island chain controls oceanic biogeochemical cycles, Global Biogeochem. Cy., 27, 920–929, 2013.
Nishioka, J., Obata, H., Ogawa, H., Ono, K., Yamashita, Y., Lee, K., Takeda, S., and Yasuda, I.: Subpolar marginal seas fuel the North Pacific through the intermediate water at the termination of the global ocean circulation, P. Natl. Acad. Sci. USA, 117, 12665–12673, 2020.
Paulmier, A. and Ruiz-Pino, D.: Oxygen minimum zones (OMZs) in the modern ocean, Prog. Oceanogr., 80, 113–128, 2009.
Redfield, A. C.: The biological control of chemical factors in the environment, Am. Sci., 46, 205–221, 1958.
Rii, Y. M., Bidigare, R. R., and Church, M. J.: Differential responses of eukaryotic phytoplankton to nitrogenous nutrients in the North Pacific Subtropical Gyre, Front. Mar. Sci., 5, 92, https://doi.org/10.3389/fmars.2018.00092, 2018.
Robidart, J. C., Magasin, J. D., Shilova, I. N., Turk-Kubo, K. A., Wilson, S. T., Karl, D. M., Scholin, C. A., and Zehr, J. P.: Effects of nutrient enrichment on surface microbial community gene expression in the oligotrophic North Pacific Subtropical Gyre, The ISME journal, 13, 374–387, 2019.
Saito, H.: The Kuroshio: its recognition, scientific activities and emerging issues, in: Kuroshio Current, edited by: Nagai, T., Saito, H., Suzuki, K., and Takahashi, M., AGU-Wiley Geophysical Monograph, 243, 3–11, 2019.
Sarmiento, J. L. and Gruber, N.: Organic matter production, in: Ocean Biogeochemical Dynamics, Princeton University Press, Princeton, 102–172, 2006.
Sato, M. and Hashihama, F.: Assessment of potential phagotrophy by pico- and nanophytoplankton in the North Pacific Ocean using flow cytometry, Aquat. Microb. Ecol., 82, 275–288, 2019.
Sato, M., Hashihama, F., Kitajima, S., Takeda, S., and Furuya, K.: Distribution of nano-sized Cyanobacteria in the western and central Pacific Ocean, Aquat. Microb. Ecol., 59, 273–282, 2010.
Sato, M., Sakuraba, R., and Hashihama, F.: Phosphate monoesterase and diesterase activities in the North and South Pacific Ocean, Biogeosciences, 10, 7677–7688, https://doi.org/10.5194/bg-10-7677-2013, 2013.
Sato, M., Kodama, T., Hashihama, F., and Furuya, K.: The effects of diel cycles and temperature on size distributions of pico- and nanophytoplankton in the subtropical and tropical Pacific Ocean, Plankton Benthos Res., 10, 26–33, 2015.
Sato, M., Shiozaki, T., and Hashihama, F.: Distribution of mixotrophic nanoflagellates along the latitudinal transect of the central North Pacific, J. Oceanogr., 73, 159–168, 2016.
Shilova, I. N., Mills, M. M., Robidart, J. C., Turk-Kubo, K. A., Björkman, K. M., Kolber, Z., Rapp, I., van Dijken, G. L., Church, M. J., Arrigo, K. R., Achterberg, E. P., and Zehr, J. P.: Differential effects of nitrate, ammonium, and urea as N sources for microbial communities in the North Pacific Ocean, Limnol. Oceanogr., 62, 2550–2574, 2017.
Shiozaki, T., Furuya, K., Kodama, T., and Takeda, S.: Contribution of N2 fixation to new production in the western North Pacific Ocean along 155∘ E, Mar. Ecol. Prog. Ser., 377, 19–32, 2009.
Shiozaki, T., Furuya, K., Kodama, T., Kitajima, S., Takeda, S., Takemura, T., and Kanda, J.: New estimation of N2 fixation in the western and central Pacific Ocean and its marginal seas, Global Biogeochem. Cy., 24, GB1015, https://doi.org/10.1029/2009GB003620, 2010.
Shiozaki, T., Kodama, T., and Furuya, K.: Large-scale impact of the island mass effect through nitrogen fixation in the western South Pacific Ocean, Geophys. Res. Lett., 41, 2907–2913, 2014.
Shiozaki, T., Ijichi, M., Isobe, K., Hashihama, F., Nakamura, K., Ehama, M., Hayashizaki, K., Takahashi, K., Hamasaki, K., and Furuya, K.: Nitrification and its influence on biogeochemical cycles from the equatorial Pacific to the Arctic Ocean, The ISME journal, 10, 2184–2197, 2016.
Shiozaki, T., Bombar, D., Riemann, L., Hashihama, F., Takeda, S., Yamaguchi, T., Ehama, M., Hamasaki, K., and Furuya, K.: Basin scale variability of active diazotrophs and nitrogen fixation in the North Pacific, from the tropics to the subarctic Bering Sea, Global Biogeochem. Cy., 31, 996–1009, 2017.
Shiozaki, T., Bombar, D., Riemann, L., Sato, M., Hashihama, F., Kodama, T., Tanita, I., Takeda, S., Saito, H., Hamasaki, K., and Furuya, K.: Linkage between dinitrogen fixation and primary production in the oligotrophic South Pacific Ocean, Global Biogeochem. Cy., 32, 1028–1044, 2018.
Sipler, R. E. and Bronk, D. A.: Dynamics of dissolved organic nitrogen, in: Biogeochemistry of Marine Dissolved Organic Matter, edited by: Hansell, D. A. and Carlson, C. A., Academic Press, Burlington, 127–232, 2015.
Suzuki, R. and Ishimaru, T.: An improved method for the determination of phytoplankton chlorophyll using N,N-Dimethylformamide, Journal of the Oceanographical Society of Japan, 46, 190–194, 1990.
Takeda, S.: Influence of iron availability on nutrient consumption ratio of diatoms in oceanic waters, Nature, 393, 774–777, 1998.
Takeda, S. and Obata, H.: Response of equatorial Pacific phytoplankton to subnanomolar Fe enrichment, Mar. Chem. 50, 219–227, 1995.
Toyoda, T. and Okamoto, S.: Physical forcing of late summer chlorophyll a blooms in the oligotrophic eastern North Pacific, J. Geophys. Res.-Oceans, 122, 1849–1861, 2017.
Utermöhl, H.: Zur Vervollkommung der quantitativen Phytolankton-Methodik, Internationale Vereinigung für Theoretische und Angewandte Limnologie: Mitteilungen, 9, 1–39, 1958.
Villareal, T. A., Brown, C. G., Brzezinski, M. A., Krause, J. W., and Wilson, C.: Summer diatom blooms in the North Pacific Subtropical Gyre: 2008–2009, PLoS ONE, 7, e33109, https://doi.org/10.1371/journal.pone.0033109, 2012.
Wagener, T., Guieu, C., Losno, R., Bonnet, S., and Mahowald, N.: Revisiting atmospheric dust export to the Southern Hemisphere ocean: Biogeochemical implications, Global Biogeochem. Cy., 22, GB2006, https://doi.org/10.1029/2007GB002984, 2008.
Waterbury, J. B., Watson, S. W., Guillard, R. R. L., and Brand, L. E.: Widespread occurrence of a unicellular, marine planktonic, cyanobacterium, Nature, 277, 293–294, 1979.
Wilson, C.: Chlorophyll anomalies along the critical latitude at 30∘ N in the NE Pacific, Geophys. Res. Lett., 38, L15603, https://doi.org/10.1029/2011gl048210, 2011.
Wilson, C. and Qiu, X.: Global distribution of summer chlorophyll blooms in the oligotrophic gyres, Prog. Oceanogr., 78, 107–134, 2008.
Wilson, C., Villareal, T. A., Brzezinski, M. A., Krause, J. W., and Shcherbina, A. Y.: Chlorophyll bloom development and the subtropical front in the North Pacific, J. Geophys. Res.-Oceans, 118, 1473–1488, 2013.
Woodward, E. M. S.: Nanomolar detection for phosphate and nitrate using liquid waveguide technology, Eos T. Am. Geophys. Un., Vo. 83, 2002.
Yamaguchi, T., Sato, M., Hashihama, F., Ehama, M., Shiozaki, T., Takahashi, K., and Furuya, K.: Basin-scale variations in labile dissolved phosphoric monoesters and diesters in the central North Pacific Ocean, J. Geophys. Res.-Oceans, 124, 3058–3072, 2019.
Yamaguchi, T., Sato, M., Hashihama, F., Kato, H., Sugiyama, T., Ogawa, H., Takahashi, K., and Furuya, K.: Longitudinal and vertical variations of dissolved labile phosphoric monoesters and diesters in the subtropical North Pacific, Front. Microbiol., 11, 570081, https://doi.org/10.3389/fmicb.2020.570081, 2021.
Yasui, S., Kanda, J., Usui, T., and Ogawa, H.: Seasonal variations of dissolved organic matter and nutrients in sediment pore water in the inner part of Tokyo Bay, J. Oceanogr., 72, 851–866, 2016.
Yasui-Tamura, S., Hashihama, F., Ogawa, H., Nishimura, T., and Kanda, J.: Automated simultaneous determination of total dissolved nitrogen and phosphorus in seawater by persulfate oxidation method, Talanta Open, 2, 100016, https://doi.org/10.1016/j.talo.2020.100016, 2020.
Yokokawa, T., Yang, Y., Motegi, C., and Nagata, T.: Large-scale geographical variation in prokaryotic abundance and production in meso- and bathypelagic zones of the central Pacific and Southern Ocean, Limnol. Oceanogr., 58, 61–73, 2013.
Zapata, M., Rodríguez, F., and Garrido, J. L.: Separation of chlorophylls and carotenoids from marine phytoplankton: a new HPLC method using a reversed phase C8 column and pyridine-containing mobile phases, Mar. Ecol. Prog. Ser., 195, 29–45, 2000.
Zubkov, M. V., Tarran, G. A., and Fuchs, B. M.: Depth related amino acid uptake by Prochlorococcus cyanobacteria in the Southern Atlantic tropical gyre, FEMS Microbiol. Ecol., 50, 153–161, 2004.