the Creative Commons Attribution 4.0 License.
the Creative Commons Attribution 4.0 License.
 | 10 Feb 2021
Methane efflux from an American bison herd
Adam A. Cook
John E. Dore
Natascha Kljun
William Kleindl
E. N. Jack Brookshire
Tobias Gerken
American bison (Bison bison L.) have recovered from the brink of extinction over the past century. Bison reintroduction creates multiple environmental benefits, but impacts on greenhouse gas emissions are poorly understood. Bison are thought to have produced some 2 Tg yr−1 of the estimated 9–15 Tg yr−1 of pre-industrial enteric methane emissions, but few measurements have been made due to their mobile grazing habits and safety issues associated with measuring non-domesticated animals. Here, we measure methane and carbon dioxide fluxes from a bison herd on an enclosed pasture during daytime periods in winter using eddy covariance. Methane emissions from the study area were negligible in the absence of bison (mean ± standard deviation = −0.0009 ± 0.008 µmol m−2 s−1) and were significantly greater than zero, 0.048 ± 0.082 µmol m−2 s−1, with a positively skewed distribution, when bison were present. We coupled bison location estimates from automated camera images with two independent flux footprint models to calculate a mean per-animal methane efflux of 58.5 µmol s−1 per bison, similar to eddy covariance measurements of methane efflux from a cattle feedlot during winter. When we sum the observations over time with conservative uncertainty estimates we arrive at 81 g CH4 per bison d−1 with 95 % confidence intervals between 54 and 109 g CH4 per bison d−1. Uncertainty was dominated by bison location estimates (46 % of the total uncertainty), then the flux footprint model (33 %) and the eddy covariance measurements (21 %), suggesting that making higher-resolution animal location estimates is a logical starting point for decreasing total uncertainty. Annual measurements are ultimately necessary to determine the full greenhouse gas burden of bison grazing systems. Our observations highlight the need to compare greenhouse gas emissions from different ruminant grazing systems and demonstrate the potential for using eddy covariance to measure methane efflux from non-domesticated animals.
- Article
(3474 KB) - Full-text XML
-
Supplement
(395 KB) - BibTeX
- EndNote


The American bison (Bison bison L.) was hunted to near extinction during European expansion across North America (Flores, 1991; Isenberg, 2000; Smits, 1994). Fewer than 100 reproductive individuals existed on private ranches in the United States during the late 19th century from an original population of 30 million to 60 million (Hedrick, 2009). The current bison population of about 500 000 is due to the collective efforts of sovereign American Indian tribes, government agencies and private landowners (Gates et al., 2010; Sanderson et al., 2008; Zontek, 2007), all of whom have spurred a growing interest in bison reintroduction. The bison population is likely to further increase, increasing the incentive for researchers and land managers to understand the environmental impacts of their expansion.
The ecological role of bison has become better understood as populations have recovered (Allred et al., 2001; Hansen, 1984; Knapp et al., 1999). Bison feed preferentially on grasses (Plumb and Dodd, 1993; Steuter and Hidinger, 1999) and often enhance forb diversity as a result (Collins and Steinauer, 1998; Hartnett et al., 1996; Towne et al., 2005). They tend to graze in preferred meadows during winter and search broadly for the most energy-dense forages during the growing season (Fortin et al., 2003; Geremia et al., 2019), often in areas which have recently burned (Allred et al., 2011; Coppedge and Shaw, 1998; Vinton et al., 1993). Combined, these observations suggest that bison select for forage quality rather than quantity, which likely impacts their efflux of methane – which all ruminants emit – because ruminant methane emission is related to feed quality (Hammond et al., 2016), including cellulose and hemicellulose intake (Moe and Tyrrell, 1979). It remains unclear how much methane results from the cellulose-rich grass-dominated diet of bison given their preference for fresh foliage and if management for bison may increase or diminish the greenhouse gas burden of ruminant-based agriculture.
Atmospheric methane concentrations have been rising at an accelerated rate since 2016 for reasons that remain unclear (Nisbet et al., 2019), and there is an urgent need to improve our understanding of its surface–atmosphere flux. Between 30 % and 40 % of current anthropogenic methane emissions are due to enteric fermentation in livestock (Kirschke et al., 2013), and the greenhouse gas burden of cattle alone is some 5 Pg carbon dioxide equivalent yr−1 (Gerber et al., 2013; FAO, 2017). Methane emission estimates from livestock have tended to increase as more information becomes available (Beauchemin et al., 2008; Thornton and Herrero, 2010; Wolf et al., 2017), further emphasizing their critical role in global greenhouse gas budgets (Reisinger and Clark, 2018). Reducing unnecessary greenhouse gas emissions is a global imperative for Earth system management, and reducing enteric methane sources is seen as a promising approach to do so (Boadi and Wittenber, 2002; DeRamus et al., 2003; Herrero, et al., 2016; Hristov et al., 2013; Johnson and Johnson, 1995; Moss et al., 2000).
Bison in North America are thought to have been responsible for some 2.2 Tg yr−1 (Kelliher and Clark, 2010; Smith et al., 2016) of the 9–15 Tg yr−1 of pre-industrial enteric methane emissions (Thompson et al., 1993; Chappellaz et al., 1993; Subak, 1994). Enteric CH4 emissions from wild ruminants in the United States in the pre-settlement period comprised nearly 90 % of current CH4 emissions from domesticated ruminants assuming a historic bison population size of 50 million (Hristov, 2012), further demonstrating the importance of bison to methane fluxes in the past. The current and future contributions of non-domesticated ungulates to methane fluxes are uncertain (Crutzen et al., 1985). Previous approaches used inventory approaches or scaling equations that were not derived using methane efflux measurements from bison; the only direct bison methane flux observations that we are aware of measured 30 L of methane per kilogram of dry food intake (17 g methane per kilogram of dry food intake) from 1-year-old penned female bison fed alfalfa pellets (Galbraith et al., 1998), more than elk (Cervus elaphus) and white-tailed deer (Odocoileus virginianus) on a dry matter intake basis and similar to dairy cattle fed high maize silage (Hammond et al., 2016). Cattle methane emissions tend to be greater when fed alfalfa than grass (Chaves et al., 2006) such that existing published values may not represent an accurate estimate of the methane efflux from bison in a natural field setting, which has not been measured to date.
Here, we measure methane flux from a bison herd on winter pasture using the eddy covariance technique (Dengel et al., 2011; Felber et al., 2015; Prajapati and Santos, 2018; Sun et al., 2015). We use flux footprint analyses combined with bison locations determined using automated cameras to estimate methane flux on a per-animal basis and discuss observations in the context of eddy covariance methane flux measurements from other ruminants.
2.1 Study site
The study site is a 5.5 ha fenced pasture on the Flying D Ranch near Gallatin Gateway, Montana, USA (45.557∘, −111.229∘), on a floodplain immediately west of the Gallatin River (Fig. 1). Daily high temperatures average 1.6 ∘C, and daily low temperatures average −11.5 ∘C at Bozeman Yellowstone International Airport (BZN), located 24 km north-northeast of the site, during the November–February measurement period. BZN records an average of 18.2 mm of precipitation per month during November–February, almost entirely as snowfall. A herd of 39 bison entered the pasture on 17 November 2017 and left on 3 February 2018. The average (mean ± standard deviation) bison weight measured by the landowners on 16 November 2017 before bison entered the pasture was 329 ± 28 kg, and the bison varied in age from 0.5 to 7.5 years old (Table S1). Bison consumed a mixture of perennial grasses grown in situ that was supplemented by perennial grass hay grown in nearby fields (Table S2) delivered every 3 d on average (Table S3) such that the management approach shares features with pasture and feedlot systems.
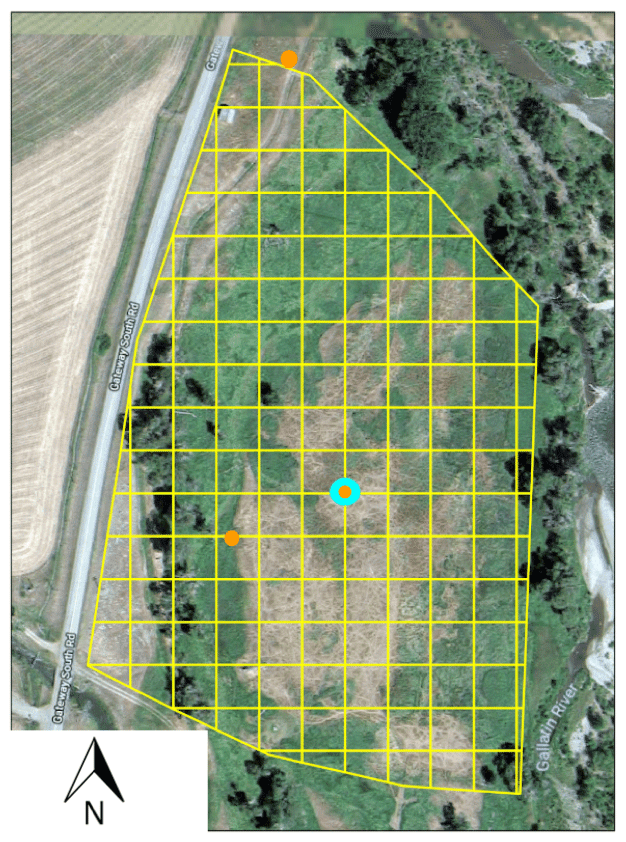
Figure 1The study site near Gallatin Gateway, MT (45.557∘, −111.229∘). Bison locations are mapped within the 20 m grid here superimposed in yellow. The tower location is in cyan, and game camera locations are indicated in orange. Background image: © Google, Maxar Technologies and the USDA Farm Service Agency 2018.
2.2 Instrumentation
A 3 m tower was installed near the center of the study pasture during November 2017 (Fig. 1) and surrounded by electric fencing to avoid bison damage. Four game cameras (TimelapseCam, Wingscapes, EBSCO Industries, Inc., Birmingham, Alabama, USA) were mounted to the tower and pointed in cardinal directions. Two additional game cameras were mounted near the pasture edge facing the tower. Cameras captured images every 5 min, and an example of an individual image from the south-facing camera located on the northern edge of the study pasture is shown in Fig. 2. Bison locations at the 0.5 h time interval of the eddy covariance measurements were estimated by manually attributing bison locations to squares in a 20 m grid overlaid on the pasture area (Fig. 1). The 20 m grid size represents the grid that we felt that we were able to attribute bison locations given features of the field that could be identified by camera, and we treat these observations as an initial guess that is subject to uncertainty. We test the sensitivity of per-animal methane efflux estimates to bison location estimates as described in the section on spatial uncertainty below.

Figure 2A sample image of bison as viewed from the south-facing time-lapse camera located to the north of the study area (Fig. 1). The eddy covariance installation is visible toward the center of the study site. Please note that the date format in this figure is month day year (mm dd, yy) and that the time format uses the 12 h clock (AM and PM).
Incident and outgoing shortwave and longwave radiation and thereby the net radiation were measured using an NR01 net radiometer (Hukseflux, Delft, the Netherlands) mounted 1.5 m a.g.l. (meters above ground level). An SR50 sonic distance sensor (Campbell Scientific Inc., Logan, UT, USA) was installed at 1.3 m to gauge snow depth, and air temperature and relative humidity were measured at 2.25 m using an HMP45C probe (Vaisala, Vantaa, Finland). Average 0–30 cm soil moisture and temperature were collected using CS650 probes (Campbell Scientific). Meteorological variables were measured once per minute, and 0.5 h averages were stored using a CR3000 datalogger (Campbell Scientific).
Three-dimensional wind velocity was measured using a CSAT3 sonic anemometer (Campbell Scientific) at 2.0 m a.g.l. (meters above ground level). Carbon dioxide mixing ratios were measured at 10 Hz using an LI-7200 closed-path infrared gas analyzer (LI-COR Biosciences, Inc.) with an inlet placed at the same height as the center of the sonic anemometer. Methane mixing ratios were measured at 10 Hz using a LI-7700 open-path infrared gas analyzer (LI-COR Biosciences, Inc., Lincoln, Nebraska, USA) with the center of the instrument likewise located at 2.0 m and a 22 cm horizontal offset from the sonic anemometer; open- and closed-path infrared gas analyzers for eddy covariance have similar performance in field settings (Detto et al., 2011; Deventer et al., 2019). We use the atmospheric convention in which flux from the biosphere to the atmosphere is positive. Measurements were made during winter daytime hours from 07:00 to 17:00 local time to avoid depleting the battery bank and to ensure sufficient light to estimate bison location using game cameras. Flux measurements began on 14 November 2017 and ended on 14 February 2018.
Bison are dangerous and will charge humans. Their presence complicated data retrieval and game camera upkeep; some high-frequency flux measurements were overwritten, and cameras were shut down during exceptionally cold periods, resulting in missing measurements. Simultaneous flux and photographic data were obtained for the 7 January to 13 February 2018 period excluding 10 January 2018 when instruments were obstructed by snowfall. Flux data without accompanying game camera footage were obtained for the periods from 14 to 29 November 2017 and 31 December 2017 to 6 January 2018.
2.3 Flux calculations
Methane and carbon dioxide fluxes were calculated using an EddyPro (LI-COR Biosciences, Lincoln, Nebraska, USA). Standard double rotation, block averaging and covariance maximization with default processing options were applied. Spike removal was performed as described by Vickers and Mahrt (1997), and spikes were defined as more than 3.5 standard deviations from the mean mixing ratio for carbon dioxide and more than 8 standard deviations from the mean mixing ratio for methane given the expectation of intermittent methane spikes from the bison herd. The default dropout, absolute limit and discontinuity tests were applied using the default settings following recommendations by Dumortier et al. (2019), and the Moncrieff et al. (1997) and Moncrieff et al. (2004) low- and high-pass filters were applied. The Webb–Pearman–Leuning correction (Webb et al., 1980) was applied to calculate methane efflux using the open-path LI-7700 sensor. Estimates of storage flux in the 2 m airspace below the infrared gas analyzers were assumed to be minor and excluded from the flux calculation. Flux measurements for which the quality control flag was greater than one following Mauder and Foken (2011) (see also Foken et al., 2004) were discarded, and the net effect of all corrections when bison were present was a methane flux reduction of 14 %. Measurements that exceeded an absolute value of 1 µmol m−2 s−1 for the case of methane flux and 20 µmol m−2 s−1 for the case of carbon dioxide flux were discarded following an analysis of the probability distribution of observations. We tested the sensitivity of flux measurements to the friction velocity (u*) to see if measurements made under conditions of insufficient turbulence should be excluded from the analysis despite the daytime-only flux measurement approach.
2.4 Flux footprint modeling
The eddy covariance flux footprint was calculated using the approach of Hsieh et al. (2000) extended to two dimensions following Detto and Katul (2006). Such analytical footprint models have been found to give minimally biased estimates of point-source fluxes in field settings (Dumortier et al., 2019). We performed the footprint analysis on a 1 m grid and aggregated values to the 20 × 20 m grid to which the bison locations were estimated (Fig. 1). To further characterize the uncertainty in our per-animal methane flux estimates, described next, we also applied the flux footprint parameterization method of Kljun et al. (2015) aggregated to the same 20 × 20 m grid. The Kljun et al. (2015) model performed best in point-source experiments (Heidbach et al., 2017) and is widely used by the flux community. Figure 3 demonstrates an example of flux footprints for both models for a single 0.5 h period.
The momentum roughness height (z0 m) is required by both footprint models. Instead of assuming a constant z0 m over snow of 0.001 m (Andreas et al., 2004), we followed the approach of Baum et al. (2008), who calculated a unique z0 m for each 0.5 h eddy covariance measurement for a cattle feedlot system by rearranging the wind profile equation:
where z is measurement height; u is wind speed; k is the von Kármán constant; and ψm is the correction factor for atmospheric stability, here following Brutsaert (1982). The zero-plane displacement (d) for a field with obstacles is calculated following Verhoef et al. (1997):
where a is the frontal area index of the obstacles (Raupach, 1994), here bison:
The calculation of a uses the number of animals (n=39), the size of the pasture (S, m2), and the average breadth (b, m) and height (h, m) of the animals. We used established relationships for beef cattle as a function of weight (ASABE, 2006) given the lack of similar equations for bison. h was adjusted upward by 50 % such that the height of adult males better matched average values of fully grown bison on the order of 1.8 m. The methane source location was assumed to be near the ground or snow surface per the typical posture of bison, assuming that most methane efflux in ruminants is from erucation. We used the mean value of per-animal flux estimated by the two footprint models and the variance between them to calculate footprint uncertainty.
2.5 Per-bison methane flux estimation
Given that mean methane emissions were not significantly different from zero in the absence of bison – as detailed in “Results” – we assume that observed methane emissions are due to bison in the flux footprint. The relative contribution of bison to each 0.5 h eddy covariance measurement was calculated by expanding the approach of Dumortier et al. (2019) (see also Prajapati and Santos, 2019) for multiple point sources. From the definition of the footprint function (e.g., Schmid, 1997), the measured density of a scalar X, FX, for our study area of 8×12 grid cells (Fig. 1) is
where ϕij is the value of the footprint function in grid cell ij, x and y are the dimensions of the 20 m grid cells (i.e., 400 m2), and Fij is the flux from grid cell ij. We have n=39 sources (i.e., bison) that are free to wander to any grid cell ij, and we have no basis for identifying individual bison given the resolution of the cameras, noting that this is possible using higher-resolution cameras (Merkle and Fortin, 2014) or GPS instruments. We also have no basis for determining if the methane sources of individual bison are different using our approach, so we must assume that methane efflux from each bison is equal, i.e.,
where nij is the number of bison in grid cell ij (i.e., per 400 m−2), 〈fij〉 is the average flux per bison in grid cell ij and the average per-bison flux 〈fx〉 is
We only adopt this approach for calculating average methane efflux per bison, as measured carbon dioxide fluxes in the absence of bison were significantly greater than zero. Methane efflux values less than −200 µmol per bison s−1 and greater than 300 µmol per bison s−1 were treated as outliers and excluded based on an analysis of the probability distribution of observations. After filtering for eddy covariance measurement quality, outliers and photograph availability, measurements with bison in the flux footprint were available on 158 0.5 h periods when applying the Hsieh et al. (2000) footprint model and 146 0.5 h periods when applying the Kljun et al. (2015) footprint model, noting that their dimensions differ (e.g., Fig. 3).

Figure 3An eddy covariance flux footprint calculated following (a) Hsieh et al. (2000) extrapolated to two dimensions following Detto and Katul (2006) and (b) Kljun et al. (2015) for a single 30 min interval superimposed on the study field (Fig. 1). The purple, pink and white areas represent the 95 %, 75 % and 50 % footprint at 10:30–11:00 mountain standard time on 8 January 2018. The fraction of the footprint in each grid box is summed for each 20 m pixel to calculate the contribution of each pixel to the total flux. Background image: © Google, Maxar Technologies and the USDA Farm Service Agency 2018.
2.6 Uncertainty estimation
Our observations are subject to multiple sources of uncertainty including uncertainty from eddy covariance measurements, footprint models and bison location estimates. Uncertainty of the eddy covariance methane flux measurements was determined by Deventer et al. (2019) to be between 6 % and 41 % for 0.5 h fluxes. We use an uncertainty of 41 %, as we are primarily concerned with providing a conservative uncertainty assessment and take the absolute value of the measurements multiplied by this percentage to calculate uncertainty due to eddy covariance measurements. Uncertainty due to the flux footprint was calculated as the mean percent difference in per-bison flux calculated using the Hsieh et al. (2000) and Kljun et al. (2015) footprint models.
Uncertainty due to bison location estimates is more difficult to calculate. The location of bison in the pasture was approximated visually by identifying the position of bison in relation to static cues in the study area using 5 min photographs. Observations were then aggregated to 0.5 h flux measurement periods. This approach results in spatial uncertainty in bison location, especially due to movements within 0.5 h periods and potential misallocation to nearby grid cells (Fig. 1). We acknowledge that uncertainty in the bison location estimate is likely using our approach and explored the sensitivity of per-bison methane flux estimates to bison location using stochastic simulations in order to arrive at a conservative uncertainty estimate.
The camera measurements resulted in many pixels where bison were not observed (e.g., Fig. S1), but there is a finite probability that this absence was in error. Pixels near populated pixels likely have a higher probability that bison were located within them because small movements within 0.5 h periods were common and because their locations may have been misallocated due to measurement uncertainty. We therefore sought an approach that simulates a spatial distribution of bison that is constrained by the camera measurements. To do so, we treated the camera measurements as an initial guess of their location that helped us define a likelihood surface. The likelihood surface was determined using two-dimensional Tikhonov regularization (Tikhonov and Arsenin, 1977), a classic mathematical technique to solve ill-posed problems, here the challenge of estimating the likelihood of bison location with intermittent and uncertain observations as described in detail in the Supplement. The probability of the 39 bison landing in a pixel is informed by this likelihood surface, and we used 100 simulations for both the Hsieh et al. (2000) footprint and the Kljun et al. (2015) footprint along with four different values of the spatial smoothness of the probability surface defined by the Lagrange multiplier (Eq. S1). An example of a likelihood surface generated for a single 0.5 h observation of bison locations and different values of the Lagrange multiplier is shown in Fig. S1. We explore the sensitivity of per-bison methane emissions to the Tikhonov regularization approach in the Supplement (Figs. S2 and S3).
We took the percent difference between the calculated per-bison methane emissions and values from the 200 stochastic simulations as the uncertainty due to bison location. Total uncertainty was then calculated by summing variances for the spatial uncertainty, footprint model uncertainty and eddy covariance uncertainty. We suggest strategies for reducing uncertainty in the “Discussion” section.
3.1 Meteorology
Air temperature averaged −2.8 ∘C, and soil temperature averaged −0.3 ∘C during the measurement period (Fig. 4a). Incident shortwave radiation ranged between 100 and 400 W m−2 during peak daylight hours (10:00–14:00 local time) across the study period, and clear conditions were common except for 4 weeks beginning in mid-December (Fig. 4b). Snow depth within the tower enclosure increased from 0.15 m to nearly 0.4 m in late 2017 and decreased to 0.1 m beginning in late January 2018 (Fig. 4c), noting that snow outside of the electrified tower enclosure was often trampled (see Fig. 2). The mean (median) wind direction was 221∘ (208∘) during periods when visible imagery of bison locations was available and eddy covariance measurements passed quality control checks (Fig. 5).
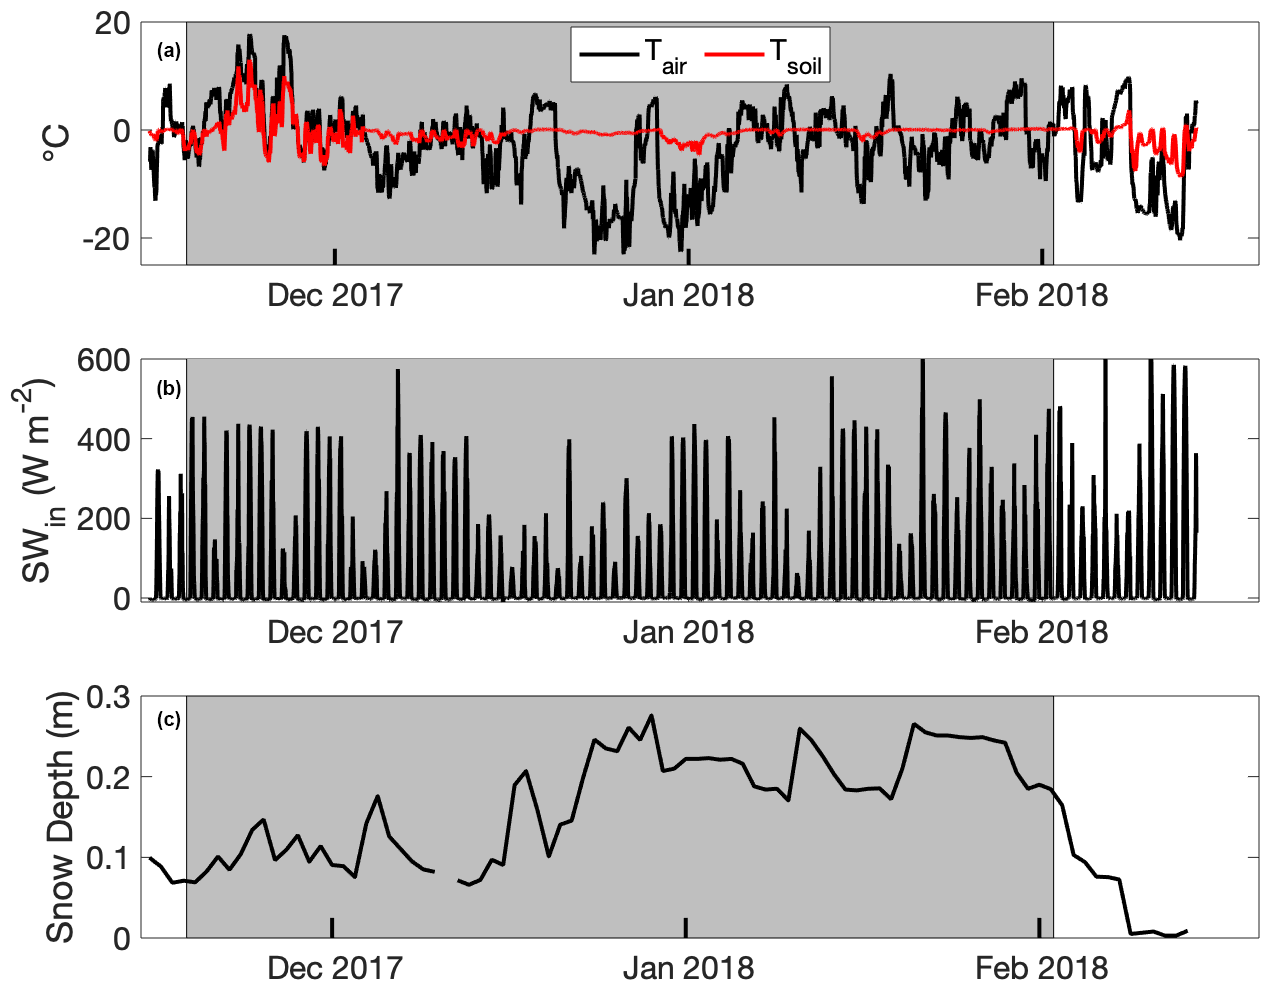
Figure 4(a) Air (Tair) and soil temperature (Tsoil), (b) incident shortwave radiation (SWin), and (c) snow depth from a micrometeorological tower enclosed within an electric fence on a bison pasture near Gallatin Gateway, Montana, USA. Bison were present in the pasture during the interval bounded by the gray background.

Figure 5A wind rose following Pereira (2020) for periods when eddy covariance measurements and bison location measurements were available. WS: wind speed.
3.2 Gas flux
Methane fluxes from 0.5 h periods averaged 0.048 ± 0.081 µmol m−2 s−1 (mean ± standard deviation), and carbon dioxide fluxes averaged 1.6 ± 1.4 µmol m−2 s−1 when bison were present (Fig. 6), noting again that measurements were made only during daytime periods. Median z0 m was 0.017 m in the absence of bison and 0.028 m when bison were present, the latter similar to z0 m established for grass fields with intermittent obstacles (Wieringa, 1992). Methane flux in the absence of bison averaged −0.0009 ± 0.008 µmol m−2 s−1, and carbon dioxide flux averaged 0.64 ± 1.0 µmol m−2 s−1, significantly lower than when bison were present (p<0.001 for both CH4 and CO2). CO2 flux was significantly related to methane flux and explained 52 % of its variance when bison were present but only 7 % when they were absent (Fig. 7). CO2 flux was significantly and positively related to air and soil temperature across the entire measurement record (p<0.001 in both cases), but methane flux was not. There were no significant temporal patterns of methane flux during the daytime periods investigated here, and neither incident nor net radiation were related to methane flux. Methane flux was not significantly different during days when feed was delivered (0.051 ± 0.083 µmol m−2 s−1) and days when it was not (0.035 ± 0.10 µmol m−2 s−1) (p=0.075) when bison were present.

Figure 6The daily mean and standard error carbon dioxide and methane fluxes with standard error during daytime hours (07:00–17:00) from the study pasture near Gallatin Gateway, Montana, USA. The gray background denotes the interval during which bison were present on the study site.
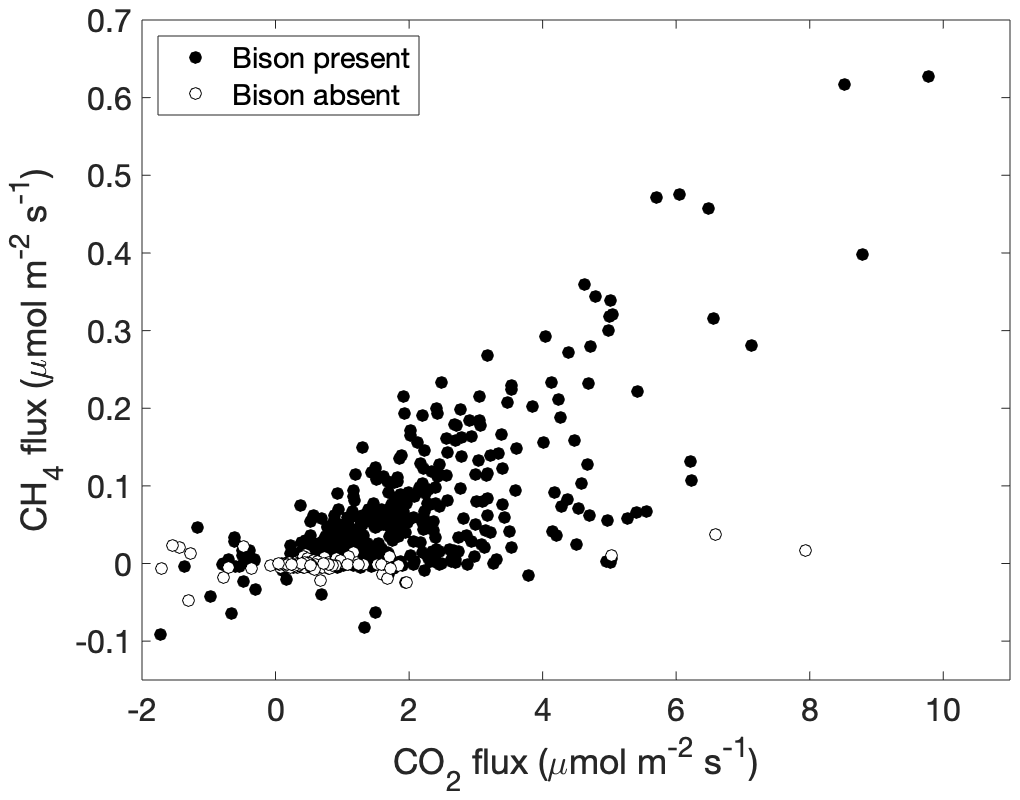
Figure 7The relationship between carbon dioxide and methane fluxes from the study pasture is shown for periods when bison were present (filled circles) and when bison were absent (open circles).
Methane flux was significantly and positively related to friction velocity in the absence of bison at u* values greater than 0.2 m s−1 (p = 0.003) but not positively related to u* values less than 0.2 m s−1, indicating that flux measurements were unrelated to friction velocity values commonly associated with insufficient turbulence (Fig. 8a). Carbon dioxide flux was not related to u* in the absence of bison (Fig. 8b), but negative values were observed at u* values greater than 0.45 m s−1. Given these observations, we did not apply a u* filter to our eddy covariance measurements, which were made only during daytime periods. We discuss potential reasons for the observed increase in methane flux and negative CO2 flux with high values of u* in the “Discussion” section.
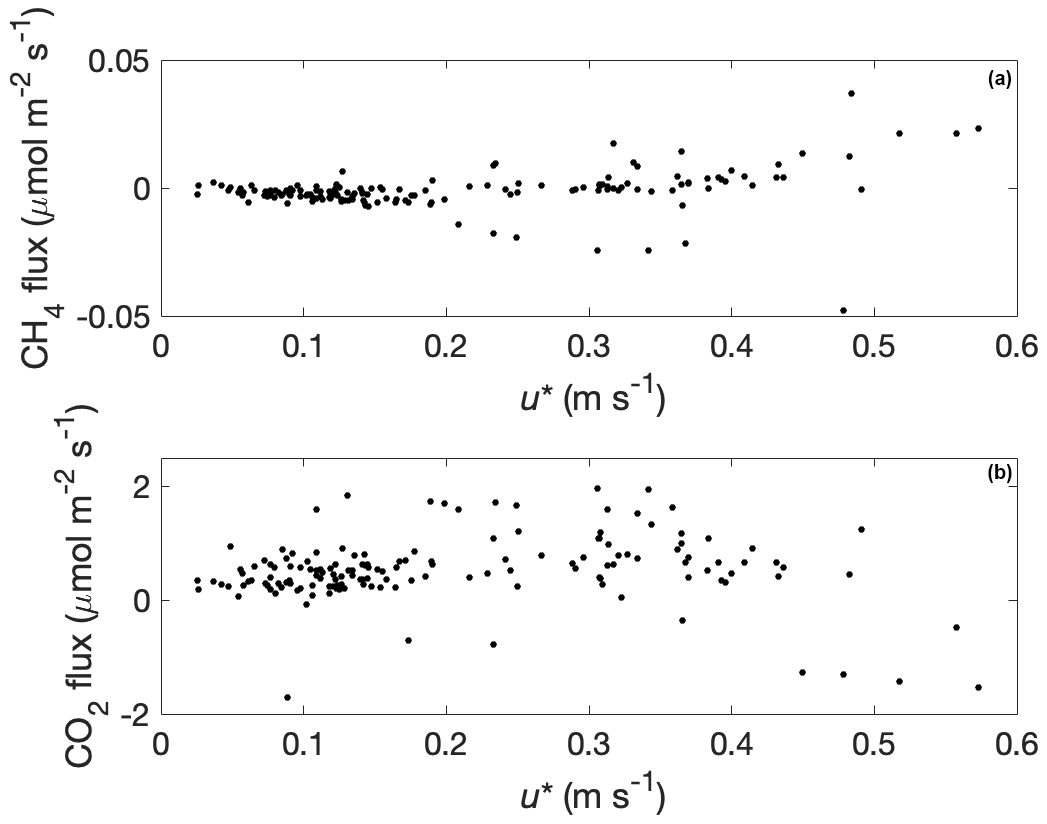
Figure 8Methane (a) and carbon dioxide (b) fluxes as a function of friction velocity (u*) when bison were absent from the study pasture.
3.3 Bison location and methane efflux
Time-lapse camera footage yielded usable imagery for 444 0.5 h periods, of which 245 0.5 h periods had available eddy covariance observations and of which 177 had eddy covariance measurements that passed quality control criteria. Bison tended to aggregate in an area on the western side of the pasture near the location where supplemental hay was often provided (Fig. 9a). They intermittently visited the area north of the tower in mornings and afternoons and intermittently made sporadic mass movements to the southernmost edge of the field near its gate during midday periods (Fig. 9b–d).
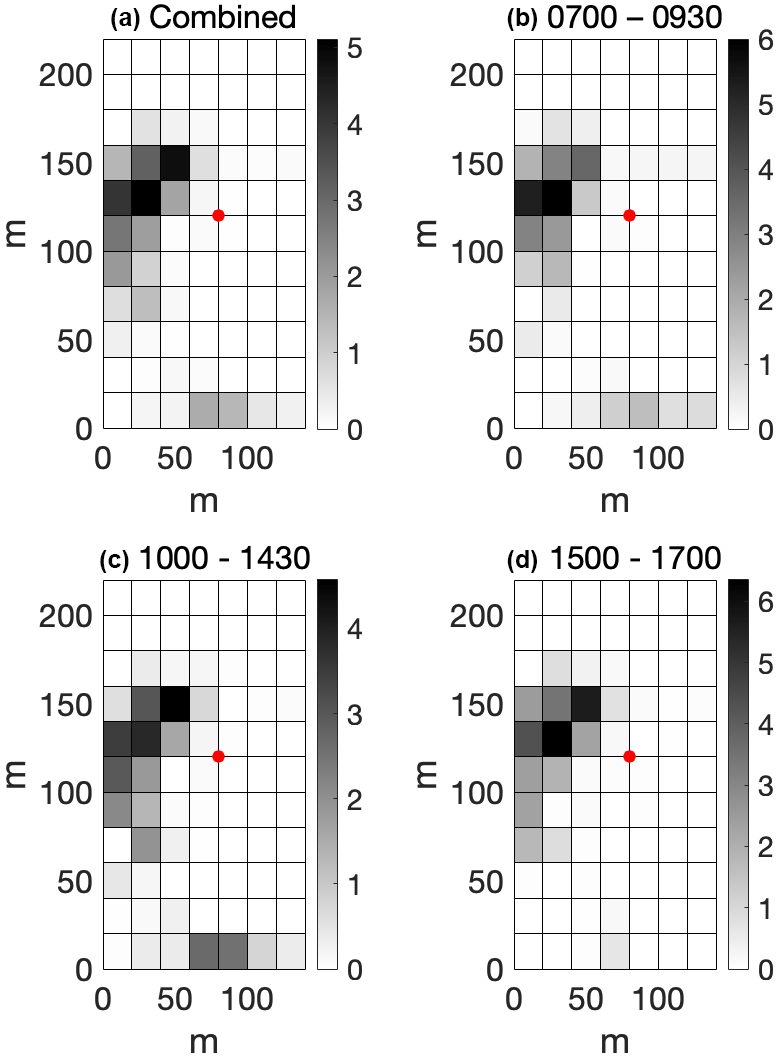
Figure 9Average proportional bison density for three periods of the day. Each colored pixel represents a 20 m grid square; red dots denote the location of the eddy covariance tower; and subplot titles refer to local time. Color denotes the average number of bison present in each grid cell for the 39-animal herd.
Bison were located within the 90 % flux footprint 40 % of the time (Fig. 10). There were 158 0.5 h observations with bison in the flux footprint when applying the Hsieh et al. (2000) footprint model, and 146 observations were available when applying the Kljun et al. (2015) footprint model; an average of eight (seven) bison were within the 90 % flux footprint of the Hsieh et al. (2000) (Kljun et al., 2015) models. When excluding periods for which bison were absent from the flux footprint, this value increased to 21 (20), respectively (Fig. 10). Per-bison methane emission estimates when using the Hsieh et al. (2000) footprint model had an average (mean ± standard error) of 55 ± 0.96 µmol per bison s−1 and a median of 29 µmol per bison s−1 as a result of the positively skewed measurement distribution (Fig. 11a). These estimates are 11 % lower than per-bison methane emission estimates from the Kljun et al. (2015) footprint model, which returned an average (mean ± standard error) of 62±0.91 µmol per bison s−1, which demonstrates that per-animal flux estimates are sensitive to flux footprint methodology.
Per-bison methane flux estimates from stochastic simulations of bison location were sensitive to the smoothness of the likelihood surface (Fig. 12). Combining per-bison methane flux estimates from all 100 simulations resulted in a standard deviation of 6.2 µmol per bison s−1 when using the Hsieh et al. (2000) model and 5.8 µmol per bison s−1 when using the Kljun et al. (2015) model. If we sum variances to combine uncertainties due to spatial uncertainty, flux footprint and the eddy covariance measurements themselves and extrapolate observations to the daily timescale commonly used in other methane flux studies, we arrive at a mean daily methane efflux of 81 g CH4 per bison d−1 with 95 % confidence intervals between 54 and 109 g CH4 per bison d−1. The uncertainty is dominated by uncertainty due to bison location (46 % of the total uncertainty), then the flux footprint model (33 %), then the eddy covariance measurements (21 %).
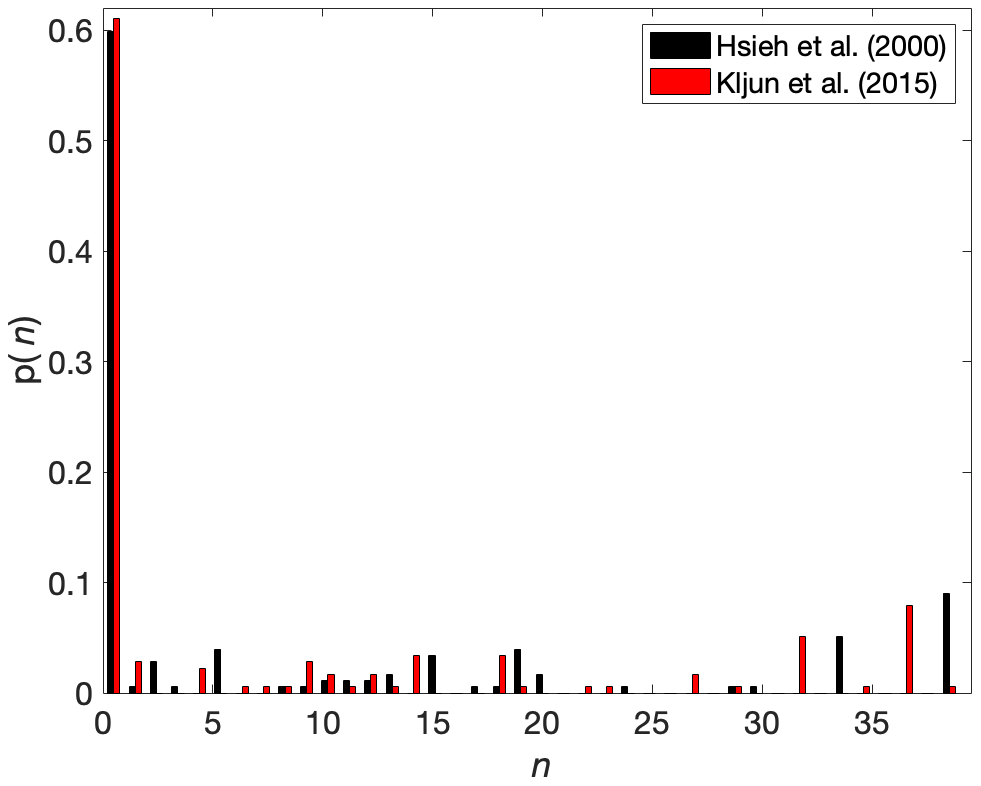
Figure 10The probability (p(n)) of the number of bison (n) in the 90 % flux footprint for the Hsieh et al. (2000) and Kljun et al. (2015) footprint models for periods when flux measurements were made and camera imagery was available.
The eddy covariance flux footprint analysis coupled to bison location estimates from automated camera images resulted in a mean methane flux of 55 µmol per bison s−1 when applying the Hsieh et al. (2000) footprint model and 62 µmol per bison s−1 when applying the Kljun et al. (2015) footprint model for a combined mean ± variance of 58.5 µmol per bison s−1 or 81 g CH4 per bison d−1with 95 % confidence intervals between 54 and 109 g CH4 per bison d−1. Measurements were made during daytime periods in winter and are sensitive to estimates of bison location (Fig. 12). If we naively assume that methane flux from bison varies negligibly across the full diurnal and seasonal range, a notion that needs to be substantiated, our measurements roughly correspond to 30 kg methane per bison yr−1 with 95 % confidence intervals between 20 and 40 kg methane per bison yr−1. Below, we discuss potential reasons for the bison methane emissions observed here as well as strategies for reducing uncertainty in eddy covariance measurements of methane flux from non-domesticated ruminants.
4.1 Bison methane flux observations in the context of other grazing systems
It is important to study methane emissions from other grazing systems to place our observations into a broader context and, moving forward, to design grazing systems that minimize greenhouse gas burdens. From this perspective, our simple seasonal scaling exercise may underestimate or overestimate methane emissions from bison grazing systems for multiple reasons that must be kept in mind when interpreting results. Methane emissions from cattle have been observed to be on the order of 10 %–17 % higher in summer than winter (Todd et al., 2014; Prajapati and Santos, 2018, 2019) such that our wintertime methane flux observations may be lower than what full annual measurements would yield. Our observations were similar to wintertime measurements of beef cattle in a feedlot, on the order of 75 g CH4 per animal d−1 (Prajapati and Santos, 2019), which to a first order suggests that bison and cattle grazing systems may have similar methane efflux. Our study pasture shares features with both feedlot and grazing systems with important implications for methane efflux. The bison were free to graze (Fig. 2) but were also supplied supplemental hay at regular intervals (Table S2). In other words, it is safe to assume that the animals were well-fed, which cannot be assumed to be the case during winter in a wildland bison grazing system. Cattle in Africa were observed to have higher methane yields per unit feed when feed intake was below maintenance levels during the dry season when food is scarce (Goopy et al., 2020). Bison in natural grazing systems may also have a greater methane yield per unit feed when food is scarce during winter but lower total methane efflux if less feed is consumed given the strong relationship between feed intake and methane production (Johnson and Johnson, 1995).
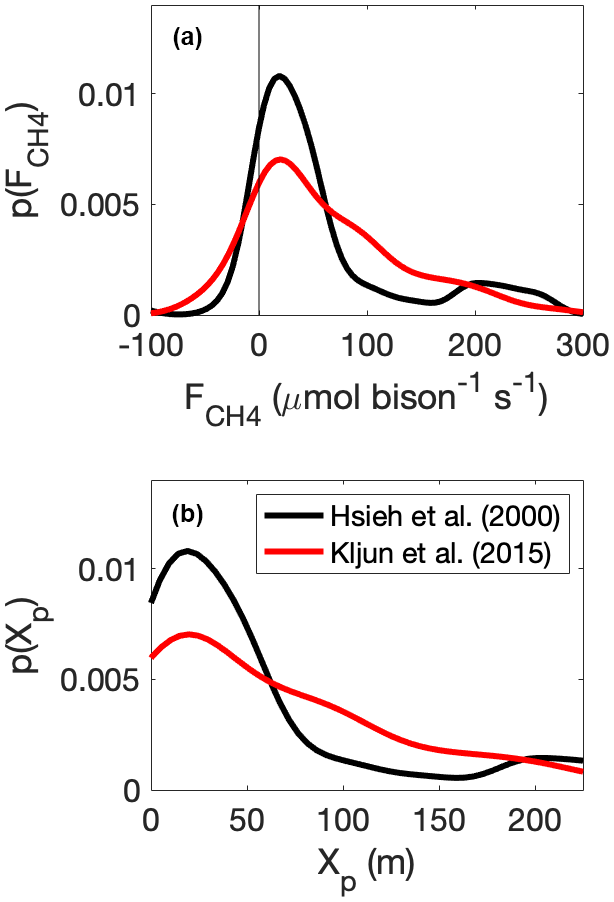
Figure 11Kernel density estimates of the distribution (p) of (a) methane efflux () on a per-bison basis and (b) the peak (Xp) of the source-weight function for 0.5 h flux footprints derived from the Hsieh et al. (2000) and Kljun et al. (2015) flux footprint models.
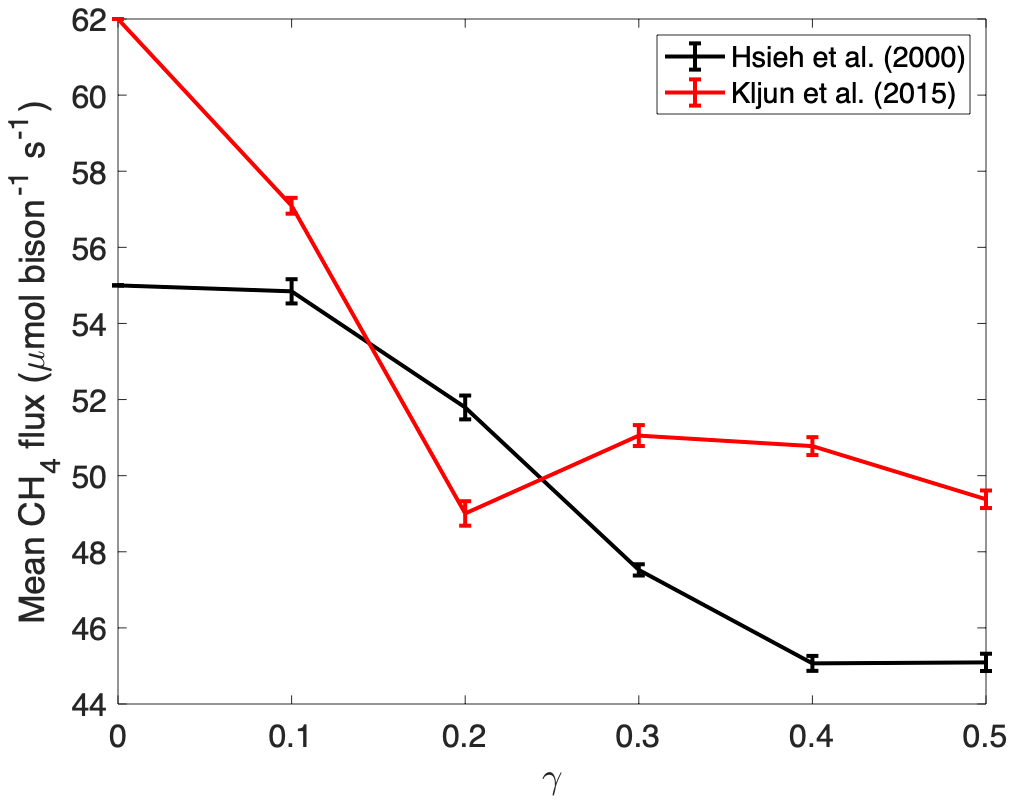
Figure 12The estimated mean per-bison CH4 efflux from stochastic simulations of bison locations using a probability surface defined by two-dimensional Tikhonov regularization (see Supplement) for different values of the Lagrange multiplier γ. Error bars represent standard error about the mean of 20 simulations.
We did not observe significant differences in methane efflux over the course of the day, noting that our observations were limited to daytime periods because we had little basis to determine animal location at night. Other studies have observed higher methane efflux from cattle during feeding times (Gao et al., 2011), but bison also frequently graze at night, leaving it unclear if they also exhibit daytime and nighttime differences in methane flux with implications for scaling flux across time. Methane efflux was not significantly higher during days when supplemental hay was provided (p=0.075), suggesting that the opportunity to graze throughout the day regardless of supplemental food muted any diurnal methane efflux cycle that may have been present if they fed at preferred times.
Nutritional needs also impact methane efflux; dairying buffalo cows for example are estimated to have higher methane emissions than other buffalo (Cóndor et al., 2008). The study herd comprised numerous pregnant females (Table S1) that have higher metabolic requirements such that methane flux values may be higher than a herd with fewer pregnant animals. Taken as a whole, there is no evidence from our measurements that bison have more or less methane efflux than typical values reported for cattle. We note that it is critical to make full year-round methane flux measurements to understand the seasonal course of bison methane efflux to establish defensible annual sums.
4.2 Methane and carbon dioxide efflux in response to environmental variables and bison presence
Methane flux was not related to air or soil temperature but was related to u* – especially at relatively high values of u* – in the absence of bison (Fig. 8). These observations are consistent with a potential pressure pumping mechanism for trace gases through snow at higher wind speeds (Bowling and Massman, 2011), although it is unclear why this relationship exists for methane flux and not carbon dioxide flux as is frequently found in snow-covered conditions (Rains et al., 2016). Carbon dioxide flux at high values of u* was negative, indicating net CO2 uptake by the biosphere, which is unlikely in our study site during winter, suggesting that values with excessively high u* may need to be filtered, but with only five observations of CO2 flux less than zero it is unclear how to apply such a filter in our case.
Insufficient evidence exists in our data record to attribute observed methane efflux to the onset of freezing conditions in soil (Mastepanov et al., 2008). We note that extensive snow trampling (e.g., Fig. 2) likely resulted in a situation where snow depth (Fig. 4c) and its insulating effect on soil temperature (Fig. 4a) varied across the field and therefore differed from snow and soil measurements taken within the instrumentation enclosure. Regardless, mean methane flux when bison were absent, −0.0009 µmol m−2 s−1, was nearly 2 orders of magnitude less than the mean methane flux when bison were present, 0.041 µmol m−2 s−1. Whereas we cannot exclude – and in fact expect – non-zero background methane fluxes from non-bison sources in a grassland in winter in the vicinity of a riparian area (Fig. 1; Merbold et al., 2013; McLain and Martens, 2006; Mosier et al., 1991), these are minor compared to the CH4 flux attributable to bison (Figs. 6 and 7). Bison are associated with a distinct methane flux signature as shown by the immediate decline of methane fluxes following their removal from the study pasture (Fig. 6) and strong relationship with carbon dioxide flux (Fig. 7) given the common source of respiration and most enteric methane losses from the muzzles of ungulates. Methane flux was related to carbon dioxide flux when bison were present or absent (Fig. 7), suggesting both soil and ruminant sources (and in the case of methane sinks) of both gases (Baldocchi et al., 2012; Gourlez de la Motte et al., 2019).
It is important to note that potential methane fluxes from bison manure may have been dampened by freezing conditions but may be an important methane source during warmer conditions if it enters anoxic conditions. Manure is thought to contribute a nontrivial portion (10–14 Tg CH4 yr−1) of total global ruminant methane efflux (77 Tg CH4 yr−1; Johnson and Ward, 1996; Moss et al., 2000), noting that some farm-scale studies arrive at lower percentages (Taylor et al., 2017). Though we observed neither higher methane efflux early in the study period when soil temperature was above freezing nor temperature sensitivity of methane efflux in the presence or absence of bison, it is important to note that field-scale methane efflux may be diminished by the thermal environment of manure in our measurements but is still likely to be relatively low in a rangeland setting (Steed and Hashimoto, 1994).
4.3 Bison spatial distribution and measurement uncertainty
Ruminant behavior is an important consideration when measuring field-scale efflux (Gourlez de la Motte et al., 2019). The spatial distribution of bison in the study pasture often varied from morning to midday and afternoon (Fig. 9). It is difficult to infer from the available data whether the study bison are more active during morning and evening hours in the pasture environment like cattle (Gregorini, 2012). Supplemental hay was made available to the bison approximately 50 m west of the tower, and increases in the frequency of bison appearance there are associated with the animals' preferred feeding times after dawn and before dusk, but observed methane flux did not vary as a function of time of day (e.g., Dengel et al., 2011) as noted above. Regardless, ruminant methane flux measurements are simpler to make when animals congregate (Coates et al., 2017; Tallec et al., 2012) as was often observed in our study (e.g., Figs. 2, 9 and 10). Aggregation behavior in our study bison herd was often upwind of the eddy covariance tower (Figs. 5 and 9) and resulted in more overlap between flux footprint and bison location than would have occurred if bison locations were randomly distributed throughout the study area, emphasizing the importance of tower placement in eddy covariance studies of grazing systems.
Despite the largely favorable location of the herd with reference to wind direction and the flux footprint, spatial uncertainties in bison location dominated the total uncertainty calculated here. More accurate location observations are a logical way to reduce this uncertainty. Uncertainties in flux footprint modeling for methane source attribution were also nontrivial on the order of 33 % of total uncertainty. Footprint models of the type used here have been found to accurately estimate point sources of trace gas flux (Heidbach et al., 2017; Dumortier et al., 2019), but it is important to note that footprint modeling techniques play a large role in the spatial attribution of observed fluxes of ruminant trace gas flux (Felber et al., 2015). Prajapati and Santos (2018), for instance, found that an analytical model (Kormann and Meixner, 2001) predicted flux footprint areas 5 to 6 times larger than did an approximation of a Lagrangian dispersion model (Kljun et al., 2002) did such that footprint model uncertainty is a major source of uncertainty for measuring methane flux from multiple point sources as we also find here. Regarding the footprint model it is also important to note that emitted gas is warmer than the surrounding environment in our case. It is unclear how well typical eddy covariance flux footprint models simulate the release location of heated parcels, but we note that heat is also transferred more efficiently than passive scalars like methane in the convective sublayer (Katul et al., 1995) such that methane transport should not be assumed to behave like heat. It is also unclear for our case if a point near the snow surface accurately represented the typical parcel release height. We were unable to track individual animals with different muzzle heights, noting that the animals were also frequently grazing with muzzle below the snow surface such that the true parcel release point represented a wide range of heights that we had little basis to simulate from available observations.
4.4 Future directions for greenhouse gas accounting in ruminant grazing systems
Methane efflux cannot be completely removed from ruminant grazing systems; some 4.6 %–6.2 % of gross energy intake is lost as methane in cattle, sheep and goats worldwide (Johnson and Ward, 1996) with cattle often falling on the higher end of the observed range (Lassey et al., 1997). But there are other aspects of bison ecology that merit consideration when designing greenhouse-gas-cognizant grazing systems. For example, cattle tend to graze close to water more frequently than bison do (Allred et al., 2011) with unclear consequences for riparian vegetation, water quality and potential methane efflux from wallows. Cattle also tend to graze for longer periods than bison (Plumb and Dodd, 1993), and it is unclear if there is an associated consequence for methane efflux. Future work should consider the large inter-animal variability in methane efflux (Lassey et al., 1997), possibly using advanced techniques for identifying individual animals through photographs (Merkle and Fortin, 2014) or tracking devices (Felber et al., 2015). Animal age and size are also important factors in ruminant methane efflux (Jiao et al., 2014), and individual tracking may improve our estimates of this variability in a field setting. That being said, it will be difficult to measure the methane contributions of different animals in species that tend to herd using eddy covariance.
Adding seasonal foraging behavior, estimating emissions from individual animals, and addressing seasonal and inter-annual variability and trends in forage nutrition are likely to further improve prediction of methane emissions from grazing systems (Moraes et al., 2014). Advanced eddy covariance algorithms are also likely to improve flux estimates on short timescales, noting that non-stationary bursts have not been found to create systematic bias in methane budgets measured over longer time periods using eddy covariance (Göckede et al., 2019). Of these, advanced footprint attribution techniques like environmental response functions designed to create improved maps of surface–atmosphere fluxes (Metzger et al., 2013; Xu et al., 2017) may be uniquely applicable to the challenging case presented by grazing systems with mobile point sources and intermittent biogeochemical hotspots created by animal waste. Going forward, increases in atmospheric carbon dioxide concentrations are likely to decrease forage quality (Jégo et al., 2013), resulting in higher ratios of leaf carbon to nitrogen and increasing ruminant methane emissions (Lee et al., 2017), all else being equal. Understanding greenhouse gas fluxes from ruminants is therefore likely to be even more important in the future. An ongoing interest in bison reintroduction and ungulate ecology coupled with established micrometeorological measurement techniques will help us understand the present and future role that bison and other alternative grazing systems play in the Earth system.
We measured methane efflux from a bison herd from an enclosed pasture using the eddy covariance method. Measurements were made during winter and background methane flux measurements in the absence of bison were not different from zero. Bison were free to graze and were also fed supplemental hay, which likely resulted in different methane efflux from that of a natural herd. Regardless of potential differences in greenhouse gas fluxes between wild and managed bison, bison are not domesticated, and it is difficult to make measurements of their greenhouse gas efflux using standard techniques like chambers or the sulfur hexafluoride method. Our results suggest that eddy covariance is a promising method for measuring trace gas fluxes from non-domesticated ruminants and that improved technologies for tracking animal movement is a logical way to reduce total uncertainties in observations. There is little evidence from our observations that methane efflux from the study herd differed from wintertime methane efflux from a cattle feedlot system, but full annual flux observations are necessary to understand if methane efflux from bison differs from the cattle management systems that originally replaced them and are now in turn being increasingly replaced by bison across much of their native range by a diverse group of Native American tribes and private landowners who share a common interest in bison reintroduction and conservation.
Code for the Hsieh et al. (2000) footprint is available at https://nicholas.duke.edu/people/faculty/katul/Matlab_footprint.html and code for the Kljun et al. (2015) footprint is available at http://footprint.kljun.net. Eddy covariance and micrometeorological data have been submitted to AmeriFlux for publication at https://ameriflux.lbl.gov/sites/siteinfo/US-Tur.
The supplement related to this article is available online at: https://doi.org/10.5194/bg-18-961-2021-supplement.
PCS designed the study with AAC, JED and WK and wrote the paper with all coauthors. AAC collected data and analyzed them with PCS and TG. NK assisted with the footprint analysis.
The authors declare that they have no conflict of interest.
We wish to acknowledge the Indigenous nations on whose ancestral lands the study took place and recognize that the infrastructure used for this project was built on Indigenous land. We recognize multiple Indigenous nations as past, present and future caretakers of this land, whose stewardship of the region was interrupted through their physical removal by the 1830 Indian Removal Act and through US assimilation policies explicitly designed to eradicate Indigenous language and ways of being until the 1970s. Paul C. Stoy acknowledges support from the Graduate School at Montana State University and the University of Wisconsin–Madison. Funding for the LI-7700 methane analyzer used in this work was provided to JED by an NSF-EPSCoR award (no. EPS-1101342) and Montana State University. Daniel Salinas, Gabriel Bromley, Zheng Fu and James Irvine provided technical assistance, and Aaron Bird Bear and colleagues provided cultural knowledge. This work could not have been completed without permission of Turner Enterprises, Inc. and the assistance of Carter Kruse and Danny Johnson.
This research has been supported by the US National Science Foundation (grant nos. DEB-1552976 and OIA-1632810) and the USDA National Institute of Food and Agriculture (grant no. 228396).
This paper was edited by Lutz Merbold and reviewed by four anonymous referees.
Allred, B. W., Fuhlendorf, S. D., and Hamilton, R. G.: The role of herbivores in Great Plains conservation: comparative ecology of bison and cattle, Ecosphere 2, 1–17, 2011.
Andreas, E. L., Jordan, R. E., Guest, P. S., Persson, O. G., Grachev, A. A., and Fairall, C. W.: Roughness lengths over snow, 18th Conference on Hydrology of the American Meteorological Society, Seattle, WA, 11–15 January, 2004.
ASAE D321.2 MAR1985 (R2015) Dimensions of Livestock and Poultry, available at: https://www.asabe.org/Publications-Standards/Standards-Development/National-Standards/Published-Standards (last access: 20 February 2020), 2015.
Baldocchi, D. D., Detto, M., Sonnentag, O., Verfaillie, J., Teh, Y. A., Silver, W., and Kelley, N. M.: The challenges of measuring methane fluxes and concentrations over a peatland pasture, Agr. Forest Meteorol. 153, 177–187, 2012.
Baum, K. A., Ham, J. M., Brunsell, N. A., and Coyne, P. I.: Surface boundary layer of cattle feedlots: Implications for air emissions measurement. Agr. Forest. Meteorol. 148, 1882–1893, 2008.
Beauchemin, K. A., Kreuzer, M., O'Mara, F., and McAllister, T. A.: Nutritional management for enteric methane abatement: a review, Aust. J. Exp. Agric., 48, 21–27, 2008.
Boadi, D. A. and Wittenberg, K. M.: Methane production from dairy and beef heifers fed forages differing in nutrient density using the sulphur hexafluoride (SF6) tracer gas technique, Can. J. Anim. Sci., 82, 201–206, 2002.
Bowling, D. R. and Massman, W. J.: Persistent wind-induced enhancement of diffusive CO2 transport in a mountain forest snowpack, J. Geophys. Res. 116, 1–15, 2011.
Brutsaert, W.: Evaporation into the Atmosphere: Theory, History, and Applications, Kluwer, Dordrecht, 1982.
Chappellaz, J. A., Fung, I. Y., and Thompson A. M.: The atmospheric CH4 increase since the Last Glacial Maximum, Tellus B, 45, 228–241, 1993.
Chaves, A. V., Thompson, L., C., Iwaasa, A., D., Scott, S., L., Olson, M. E., Benchaar, C., Veira, D., M., and McAllister, T., A.: Effect of pasture type (alfalfa vs. grass) on methane and carbon dioxide production by yearling beef heifers, Can. J. Anim. Sci., 86, 409–418, 2006.
Coates, T., W., Benvenutti, M. A., Flisch, T. K., Charmley, E., McGinn, S. M., and Chen D.: Applicability of eddy covariance to estimate methane emissions from grazing cattle, J. Environ. Qual. 47, 54-61, 2017.
Collins, S. L. and Steinauer, E. M.: Disturbance, diversity and species interactions in tallgrass prairie, in: Grassland Dynamics: Long-Term Ecological Research in Tallgrass Prairie, edited by: Knapp, A. K., Briggs, J. M., Hartnett, D. C. and Collins, S. C., Oxford University Press, Oxford, 140–156, 1998.
Cóndor, R. D., Valli, L., De Rosa, G., Di Francia, A., and De Lauretis, R: Estimation of the methane emission factor for the Italian Mediterranean buffalo, Animal, 2, 1247–1253, 2008.
Coppedge, B. R. and Shaw, J. H.: Bison grazing patterns on seasonally burned tallgrass prairie, J. Range Manage., 51, 258–264, 1998.
Crutzen, P. J., Aselmann, I., and Seiler, W.: Methane production by domestic animals, wild ruminants, other herbivorous fauna, and humans, Tellus B, 38, 271–284, 1985.
Dengel, S., Levy, P. E., Grace, J., Jones, S. K., and Skiba, U. M.: Methane emissions from sheep pasture, measured with an open-path eddy covariance system, Glob. Change Biol., 17, 3524–3533, 2011.
DeRamus, H. A., Clement, T. C., Giampola, D. D., and Dickison, P. C.: Methane emissions of beef cattle on forages, J. Environ. Qual., 32, 269–277, 2003.
Detto, M. and Katul, G. G.: Simplified expressions for adjusting higher-order turbulent statistics obtained from open path gas analyzers, Bound.-Lay. Meteorol., 122, 205–216, 2006.
Detto, M., Verfaillie, J., Anderson, F., Xu, L., and Baldocchi, D.: Comparing laser-based open- and closed-path gas analyzers to measure methane fluxes using the eddy covariance method, Agr. Forest Meteorol., 151, 1312–1324, 2011.
FAO: Global Livestock Environmental Assessment Model (GLEAM), Rome, available at: http://www.fao.org/fileadmin/user_upload/gleam/docs/GLEAM_2.0_Model_description.pdf (last access: 22 January 2020), 2017.
Deventer, M. J., Deventer, M., Griffis, T. J., Roman, D., Kolka, R. K., Wood, J. D., Erickson, M., Baker, J. M., and Millet, D. B.: Error characterization of methane fluxes and budgets derived from a long-term comparison of open- and closed-path eddy covariance systems, Agr. Forest Meteorol., 278, 107638, https://doi.org/10.1016/j.agrformet.2019.107638, 2019.
Dumortier, P., Aubinet, M., Lebeau, F., Naiken, A., and Heinesch, B.: Point source emission estimation using eddy covariance: Validation using an artificial source experiment, Agr. Forest Meteorol., 266–267, 148–156, 2019.
Felber, R., Münger, A., Neftel, A., and Ammann, C.: Eddy covariance methane flux measurements over a grazed pasture: effect of cows as moving point sources, Biogeosciences, 12, 3925–3940, https://doi.org/10.5194/bg-12-3925-2015, 2015.
Flores D: Bison ecology and bison diplomacy: The southern plains from 1800 to 1850, J. Am. Hist., 78, 465–485, 1991.
Fortin, D., Fryxell, J. M., O'Brodovich, L., and Frandsen, D.: Foraging ecology of bison at the landscape and plant community levels: the applicability of energy maximization principles, Oecologia, 134, 219–227, 2003.
Galbraith, J. K., Mathison, G. W., Hudson, R. J., McAllister, T. A., and Cheng, K.-J.: Intake, digestibility, methane and heat production in bison, wapiti and white-tailed deer, Can. J. Anim. Sci., 78, 681–691, 1998.
Foken T., Göckede, M., Mauder, M., Mahrt, L., Amiro, B., and Munger W.: Post-field data quality control, in: Handbook of micrometeorology: A guide for surface flux measurement and analysis, edited by: Lee, X., Massman, W. J., and Law, B., Kluwer, Dordrecht, The Netherlands, 2004.
Gao, Z., Yuan, H., Ma, W., Liu, X., and Desjardins, R. L.: Methane emissions from a dairy feedlot during the fall and winter seasons in Northern China, Environ. Pollut. 159, 1183–1189, 2011.
Gates, C. C., Freese, C. H., Gogan, P. J., and Kotzman, M.: American bison: status survey and conservation guidelies 2010, IUCN, 2010.
Gerber, P. J., Steinfeld, H., Henderson, B., Mottet, A., Opio, C., Dijkman, J., Falcucci, A., and Tempio, G.: Tackling climate change through livestock - A global assessment of emissions and mitigation opportunities, Food and Agriculture Organization of the United Nations (FAO), Rome, 2013.
Geremia, C., Merkle, J. A., Eaker, D. R., Wallen, R. L., White, P. J., Hebblewhite, M., and Kaufman, M. J.: Migrating bison engineer the green wave, P. Natl. Acad. Sci. USA, 116, 25707–25713, 2019.
Gregorini, P.: Diurnal grazing pattern: its physiological basis and strategic management, Anim. Prod. Sci., 52, 416–430, 2012.
Göckede, M., Kittler, F., and Schaller, C.: Quantifying the impact of emission outbursts and non-stationary flow on eddy-covariance CH4 flux measurements using wavelet techniques, Biogeosciences, 16, 3113–3131, https://doi.org/10.5194/bg-16-3113-2019, 2019.
Goopy, J. P., Korir D., Pelster, D., Ali, A. I. M., Wassie, S. E., Schlecht, E., Dickenhoefer, U., Merbold, L., and Butterbach-Bahl, K.: Severe below-maintenance feed intake increases methane yield from enteric fermentation in cattle, Br. J. Nutr., 123, 1239–1246, 2020.
Gourlez de la Motte, L., Dumortier, P., Beckers, Y., Bodson, B., Heinesch, B., and Aubinet, M.: Herd position habits can bias net CO2 ecosystem exchange estimates in free range grazed pastures, Agr. Forest Meteorol. 268, 156–168, 2019.
Hammond, K. J., Jones, A. K., Humphries, D. J., Crompton, L. A., and Reynolds, C. K.: Effects of diet forage source and neutral detergent fiber content on milk production of dairy cattle and methane emissions determined using GreenFeed and respiration chamber techniques, J. Dairy Sci. 99, 7904–7917, 2016.
Hanson, J. R.: Bison ecology in the Northern Plains and a reconstruction of bison patterns for the North Dakota region, Plains Anthropol., 29, 93–113, 1984.
Hartnett, D. C., Hickman, K. R., and Fischer, W. L. E.: Effects of bison grazing, fire, and topography on floristic diversity in tallgrass prairie, J. Range Manage., 49, 413–420, 1996.
Hedrick, P. W.: Conservation genetics and North American bison (Bison bison), J. Hered., 100, 411–420, 2009.
Herrero, M., Henderson, B., Havlík, P., Thornton, P. K., Conant, R. T., Smith, P., Wirsenius, S., Hristov, A. N., Gerber, P., Gill, M., Butterbach-Bahl, K., Valin, H., Garnett, T., and Stehfest, E.: Greenhouse gas mitigation potentials in the livestock sector, Nat. Clim. Change, 6, 452–461, https://doi.org/10.1038/nclimate2925, 2016.
Heidbach, K., Schmid, H.-P., and Mauder, M.: Experimental evaluation of flux footprint models, Agr. Forest Meteorol., 246, 142–153, 2017.
Hristov, A. N.: Historic, pre-European settlement, and present-day contribution of wild ruminants to enteric methane emissions in the United States, J. Animal Sci., 90, 1371–1375, 2012.
Hristov, A. N., Oh, J., Firkins, J. L., Dijkstra, J., Kebreab, E., Waghorn, G., Makkar, H. P. S., Adesogan, A. T., Yang, W., Lee, C., Gerber, P. J., Henderson, B., and Tricarico, J. M.: Special topics – Mitigation of methane and nitrous oxide emissions from animal operations: I. A review of enteric methane mitigation options, J. Animal Sci., 91, 5045–5069, https://doi.org/10.2527/jas.2013-6583, 2013.
Hsieh, C.-I., Katul, G., and Chi, T.-W.: An approximate analytical model for footprint estimation of scalar fluxes in thermally stratified atmospheric flows, Adv. Water Resour., 23, 765–772, 2000.
Isenberg, A. C.: The Destruction of the Bison: An Environmental History, 1750–1920, Cambridge Univ. Press, Cambridge, UK, 2000.
Jégo, G., Bélanger, G., Tremblay, G. F., Jing, Q., and Baron, V. S.: Calibration and performance evaluation of the STICS crop model for simulating timothy growth and nutritive value, Field Crops Res., 151, 65–77, 2013.
Jiao, H., Yan, T., Wills, D. A., Carson, A. F., and McDowell, D. A.: Development of prediction models for quantification of total methane emission from enteric fermentation of young Holstein cattle at various ages, Agr. Ecosyst. Environ., 183, 160–166, 2014.
Johnson, K. A. and Johnson, D. E.: Methane emissions from cattle, J. Anim. Sci., 73, 2483–2491, 1995.
Johnson, D. E. and Ward, G. M.: Estimates of animal methane emissions. Environ. Monit. Assess., 42, 133–141, 1996.
Katul, G., Goltz, S. M., Hsieh, C. I., Cheng, Y., Mowry, F., and Sigmon, J.: Estimation of surface heat and momentum fluxes using the flux-variance method above uniform and non-uniform terrain, Bound.-Lay. Meteorol., 74, 237–260, 1995.
Kelliher, F. M. and Clark, H.: Methane emissions from bison – An historic herd estimate for the North American Great Plains, Agr. Forest Meteorol., 150, 473–477, 2010.
Kirschke, S., Bousquet, P., Ciais, P., Saunois, M., Canadell, J. G., Dlugokencky, E. J., Bergamaschi, P., Bergmann, D., Blake, D. R., Bruhwiler, L., Cameron-Smith, P., Castaldi, S., Chevallier, F., Feng, L., Fraser, A., Heimann, M., Hodson, E. L., Houweling, S., Josse, B., Fraser, P. J., Krummel, P. B., Lamarque, J.-F., Langenfelds, R. L., Le Quéré, C., Naik, V., O'Doherty, S., Palmer, P. I., Pison, I., Plummer, D., Poulter, B., Prinn, R. G., Rigby, M., Ringeval, B., Santini, M., Schmidt, M., Shindell, D. T., Simpson, I. J., Spahni, R., Steele, L. P., Strode, S. A., Sudo, K., Szopa, S., van der Werf, G. R., Voulgarakis, A., van Weele, M., Weiss, R. F., Williams, J. E., and Zeng, G.: Three decades of global methane sources and sinks, Nat. Geosci., 6, 813–823, 2013. Kljun, N., Rotach, M. W., and Schmid, H. P.: A 3D Backward Lagrangian Footprint Model for a Wide Range of Boundary Layer Stratifications, Bound.-Lay. Meteorol., 103, 205–226, 2002.
Kljun, N., Calanca, P., Rotach, M. W., and Schmid, H. P.: A simple two-dimensional parameterisation for Flux Footprint Prediction (FFP), Geosci. Model Dev., 8, 3695–3713, https://doi.org/10.5194/gmd-8-3695-2015, 2015.
Knapp, A. K., Blair, J. M., Briggs, J. M., Collins, S. L., Hartnett, D. C., Johnson, L. C., and Towne, G. E.: The keystone role of bison in North American tallgrass prairie, Bioscience, 49, 39–50, 1999.
Kormann, R. and Meixner F. X.: An analytical footprint model for non-neutral stratification, Bound.-Lay. Meteorol., 99, 207–224, 2001.
Lassey, K. R., Ulyatt, M. J., Martin, R. J., Walker, C. F., and Shelton, I., D.: Methane emissions measured directly from grazing livestock in New Zealand, Atmos. Environ.: 31, 2905–2914, 1997.
Lee, M. A., Davis, A. P., Chagunda, M. G. G., and Manning, P.: Forage quality declines with rising temperatures, with implications for livestock production and methane emissions, Biogeosciences, 14, 1403–1417, https://doi.org/10.5194/bg-14-1403-2017, 2017.
Mastepanov, M., Sigsgaard, C., Dlugokencky, E. J., Houweling, S., Ström, L., Tamstorf, M. P., and Christensen, T. R.: Large tundra methane burst during onset of freezing, Nature, 456, 628–631, 2008.
Mauder, M. and Foken, T.: Documentation and instruction manual of the eddy-covariance software package TK3, available at: https://epub.uni-bayreuth.de/342/1/ARBERG046.pdf (last access: 15 January 2020), 2011.
McLain, J. E. and Martens, D. A.: Moisture controls on trace gas fluxes in semiarid riparian soils, Soil Sci. Soc. Am. J., 70, 367–377, 2006.
Merbold, L., Steinlin, C., and Hagedorn, F.: Winter greenhouse gas fluxes (CO2, CH4 and N2O) from a subalpine grassland, Biogeosciences, 10, 3185–3203, https://doi.org/10.5194/bg-10-3185-2013, 2013.
Metzger, S., Junkermann, W., Mauder, M., Butterbach-Bahl, K., Trancón y Widemann, B., Neidl, F., Schäfer, K., Wieneke, S., Zheng, X. H., Schmid, H. P., and Foken, T.: Spatially explicit regionalization of airborne flux measurements using environmental response functions, Biogeosciences, 10, 2193–2217, https://doi.org/10.5194/bg-10-2193-2013, 2013.
Merkle, J. A. and Fortin D.: Likelihood-based photograph identification: Application with photographs of free-ranging bison, Wildlife Soc. B., 38, 196–204, 2014.
Moncrieff, J., Clement, R., Finnigan, J., and Meyers, T.: Averaging, detrending, and filtering of eddy covariance time series, in: Handbook of Micrometeorology, edited by: Lee, X., Massman, W. J., and Law, B., Springer, Dordrecht, 7–31, 2004.
Moncrieff, J. B., Massheder, J. M., De Bruin, H., Elbers, J., Friborg, T., Heusinkveld, B., Kabat, P., Scott, S., Søgaard, H., and Verhoef, A.: A system to measure surface fluxes of momentum, sensible heat, water vapour and carbon dioxide. J. Hydrology, 188, 589–611, 1997.
Moraes, L. E., Strathe, A. B., Fadel, J. G., Casper, D. P., and Kebreab, E.: Prediction of enteric methane emissions from cattle, Glob. Change Biol., 20, 2140–2148, 2014.
Moe, P. W. and Tyrrell, H. F.: Methane production in dairy cows, J. Dairy Sci., 62, 1583–1586, 1979.
Mosier, A., Schimel, D., Valentine, D., Bronson, K., and Parton, W. Methane and nitrous oxide fluxes in native, fertilized and cultivated grasslands, Nature, 350, 330–332, 1991.
Moss, A. R., Jouany, J.-P., and Newbold, J.: Methane production by ruminants: its contribution to global warming, Ann. Zootech., 49, 231–253, 2000.
Nisbet, E. G., Manning, M. R., Dlugokencky, E. J., Fisher, R. E., Lowry, D., Michel, S. E., Lund Myhre, C., Platt, S. M., Allen, G., Bousquet, P., Brownlow, R., Cain, M., France, J. L., Hermansen, O., Hossaini, R., Jones, A. E., Levin, I., Manning, A. C., Myhre, G., Pyle, J. A., Vaughn, B. H., Warwick, N. J., and White, J. W. C.: Very strong atmospheric methane growth in the 4 Years 2014–2017: Implications for the Paris Agreement, Global Biogeochem. Cy., 33, 318–342, 2019.
Pereira, D.: Wind Rose, available at: https://www.mathworks.com/matlabcentral/fileexchange/47248-wind-rose, MATLAB Central File Exchange, last access: 27 May 2020.
Plumb, G. E. and Dodd J. L.: Foraging ecology of bison and cattle on a mixed prairie: implications for natural area management, Ecol. App., 3, 631–643, 1993.
Prajapati, P. and Santos, E. A.: Estimating methane emissions from beef cattle in a feedlot using the eddy covariance technique and footprint analysis, Agr. Forest Meteorol., 258, 18–28, 2018.
Prajapati, P. and Santos, E. A.: Estimating Herd‐Scale Methane Emissions from Cattle in a Feedlot Using Eddy Covariance Measurements and the Carbon Dioxide Tracer Method, J. Environ. Qual., 48.5, 1427–1434, 2019.
Rains, F. A., Stoy, P. C., Welch, C. M., Montagne, C., and McGlynn, B. L.: A comparison of methods reveals that enhanced diffusion helps explain cold-season soil CO2 efflux in a lodgepole pine ecosystem, Cold Reg. Sci. Technol., 121, 16–24, 2016.
Raupach, M. R.: Simplified expressions for vegetation roughness length and zero-plane displacement as functions of canopy height and area index, Bound.-Lay. Meteorol., 71.1, 211–216, 1994.
Reisinger, A. and Clark, H.: How much do direct livestock emissions actually contribute to global warming?, Glob. Change Biol., 24, 1749–1761, 2018.
Sanderson, E. W., Redford, K. H., Weber, B., Aune, K., Baldes, D., Berger, J., Carter, D., Curtin, C., Derr, J., Bodrott, S., Fearn, E., Fleener, C., Forrest, S., Gerlach, C., Gates, C. C.m Gross, J. E., Gogan, P., Grassel, S., Hilty, J. A., Jensen, M., Kunkel, K., Lammers, D., List, R., Minowski, K., Olson, T., Pague, C., Robertson, P., and Stephenson, B.: The ecological future of the North American Bison: Conceiving long-term, large-scale conservation of wildlife, Cons. Biol., 22, 252–266, 2008.
Schmid, H. P.: Experimental design for flux measurements: matching scales of observations and fluxes. Agr. Forest Meteorol., 87, 179–200, 1997.
Smith, F. A., Hammond, J. I., Balk, M. A., Elliott, S., M., Lyons, S., K., Pardi, M., I., Tomé, C. P., Wagner, P. J. and Westover, M., L.: Exploring the influence of ancient and historic megaherbivore extirpations on the global methane budget, P. Natl. Acad. Sci. USA, 113, 874–879, 2016.
Smits, D. D.: The frontier army and the destruction of the buffalo: 1865–1883, West. Hist. Q., 25, 313–338, 1994.
Steed Jr., J. and Hashimoto, A. G.: Methane emissions from typical manure management systems, Bioresource Technol., 50, 123–130, 1994.
Steuter, A. A. and Hidinger, L.: Comparative ecology of bison and cattle on mixed-grass prairie, Gt. Plains Res. 9, 329–342, 1999.
Subak, S.: Methane from the House of Tudor and the Ming Dynasty: Anthropogenic emissions in the sixteenth century, Chemosphere, 29, 843–854, 1994.
Sun, K., Tao, L., Miller, D. J., Zondlo, M. A., Shonkwiler, K. B., Nash, C., and Ham, J. M.: Open-path eddy covariance measurements of ammonia fluxes from a beef cattle feedlot, Agr. Forest Meteorol., 213, 193–202, 2015.
Tallec, T., Klumpp, K., Hensen, A., Rochette, Y., and Soussana, J.-F.: Methane emission measurements in a cattle grazed pasture: a comparison of four methods, Biogeosciences Discuss., 9, 14407–14436, https://doi.org/10.5194/bgd-9-14407-2012, 2012.
Taylor, A. M., Amiro, B. D., Tenuta, M., and Gervais, M.: Direct whole-farm greenhouse gas flux measurements from a beef cattle operation, Agr. Ecosyst. Environ., 239, 65–79, 2017.
Thompson, A. M., Chappellaz, J. A., Fung, I. Y., and Kucsera, T. L.: The atmospheric CH4 increase since the Last Glacial Maximum, Tellus B, 45, 242–257, 1993.
Tikhonov, A. N. and Arsenin, V. Y.: Solutions of ill-posed problems, Winston, Washington, D. C., 1977.
Thornton, P. K. and Herrero, M.: Potential for reduced methane and carbon dioxide emissions from livestock and pasture management in the tropics, P. Natl. Acad. Sci. USA, 107, 19667–19672, 2010.
Todd, R. W., Altman, M. B., Cole, N. A., and Waldrip, H. M.: Methane emissions from a beef cattle feedyard during winter and summer on the Southern High Plains of Texas, J. Environ. Qual., 43, 1125–1130, 2014.
Towne, E. G., Hartnett, D. C., Cochran, R. C.: Vegetation trends in tallgrass prairie from bison and cattle grazing, Ecol. Appl., 15, 1550–1559, 2005.
Verhoef, A., McNaughton, K. G., and Jacobs, A. F. G.: A parameterization of momentum roughness length and displacement height for a wide range of canopy densities, Hydrol. Earth Syst. Sci., 1, 81–91, https://doi.org/10.5194/hess-1-81-1997, 1997.
Vickers, D. and Mahrt, L.: Quality control and flux sampling problems for tower and aircraft data, J. Atmos. Ocean. Technol., 14, 512–526, 1997.
Vinton, M. A., Hartnett, D. C., Finck, E. J., and Briggs, J. M.: Interactive effects of fire, bison (Bison bison) grazing and plant community composition in tallgrass prairie, Am. Midl. Nat., 129, 10–18, 1993.
Webb, E. K., Pearman, G. I., and Leuning, R.: Correction of flux measurements for density effects due to heat and water vapour transfer, Q. J. R. Meteorol. Soc., 106, 85–100, 1980.
Wieringa, J.: Updating the Davenport roughness classification, J. Wind Eng. Ind., 41, 357–368, 1992.
Wolf, J., Asrar, G. R., and West, T. O.: Revised methane emissions factors and spatially distributed annual carbon fluxes for global livestock, Carbon Balance Manag., 12, 16, https://doi.org/10.1186/s13021-017-0084-y, 2017.
Xu, K., Metzger, S., and Desai, A. R.: Upscaling tower-observed turbulent exchange at fine spatio-temporal resolution using environmental response functions, Agr. Forest Meteorol., 232, 10–22, 2017.
Zontek, K.: Buffalo Nation: American Indian Efforts to Restore the Bison, Bison Books, University of Nebraska Press, Lincoln, NE, USA, 2007.