the Creative Commons Attribution 4.0 License.
the Creative Commons Attribution 4.0 License.
 | 03 Mar 2022
Marine CO2 system variability along the northeast Pacific Inside Passage determined from an Alaskan ferry
Geoffrey T. Lebon
Christen D. Harrington
Yuichiro Takeshita
Allison Bidlack
Information on marine CO2 system variability has been limited along the northeast Pacific Inside Passage despite the region's rich biodiversity, abundant fisheries, and developing aquaculture industry. Beginning in 2017, the Alaska Marine Highway System M/V Columbia has served as a platform for surface underway data collection while conducting twice weekly ∼1600 km transits between Bellingham, Washington, and Skagway, Alaska. Marine CO2 system patterns were evaluated using measurements made over a 2-year period, which revealed the seasonal cycle as the dominant mode of temporal variability. The amplitude of this signal varied spatially and was modulated by the relative influences of tidal mixing, net community production, and the magnitude and character of freshwater input. Surface water pHT (total hydrogen ion scale) and aragonite saturation state (Ωarag) were determined using carbon dioxide partial pressure (pCO2) data with alkalinity derived from a regional salinity-based relationship, which was evaluated using intervals of discrete seawater samples and underway pH measurements. High-pCO2, low-pHT, and corrosive Ωarag conditions (Ωarag<1) were seen during winter and within persistent tidal mixing zones, and corrosive Ωarag values were also seen in areas that receive significant glacial melt in summer. Biophysical drivers are shown to dominate pCO2 variability over most of the Inside Passage except in areas highly impacted by glacial melt. pHT and Ωarag extremes were also characterized based on degrees of variability and severity, and regional differences were evident. Computations of the time of detection identified tidal mixing zones as strategic observing sites with relatively short time spans required to capture secular trends in seawater pCO2 equivalent to the contemporary rise in atmospheric CO2. Finally, estimates of anthropogenic CO2 showed notable spatiotemporal variability. Changes in total hydrogen ion content ([H+]T), pHT, and Ωarag over the industrial era and to an atmospheric pCO2 level consistent with a 1.5 ∘C warmer climate were theoretically evaluated. These calculations revealed greater absolute changes in [H+]T and pHT in winter as opposed to larger Ωarag change in summer. The contemporary acidification signal everywhere along the Inside Passage exceeded the global average, with specific areas, namely Johnstone Strait and the Salish Sea, standing out as potential bellwethers for the emergence of biological ocean acidification (OA) impacts. Nearly half of the contemporary acidification signal is expected over the coming 15 years, with an atmospheric CO2 trajectory that continues to be shaped by fossil–fuel development.
- Article
(30848 KB) - Full-text XML
-
Supplement
(19494 KB) - BibTeX
- EndNote


Atmospheric carbon dioxide (CO2) has increased over the industrial era from 278 ppm in 1765 to 414 ppm in 2020 due to the emissions of CO2 from fossil fuel combustion and land use change, which combined have mobilized a total of 690 ± 80 Gt of carbon (Friedlingstein et al., 2021). So far over the industrial era, an estimated 180 ± 35 Gt of this carbon pool has transferred into the ocean (Friedlingstein et al., 2021), known as the oceanic anthropogenic CO2 component (Sabine et al., 2004), and led to changes in the marine CO2 system, including reduced carbonate ion content ([CO]) and pHT (total hydrogen ion scale) and increased total hydrogen ion content ([H+]T) and CO2 partial pressure (pCO2). These marine CO2 system changes are collectively referred to as “ocean acidification” (Caldeira and Wickett, 2003; Doney et al., 2009; Feely et al., 2004a, 2009), and two recent assessments estimate an average pHT decline for the global surface ocean on the order of 0.1 units over the industrial era (Jiang et al., 2019; Lauvset et al., 2020). In conjunction with this pHT decline, reductions in [CO] have simultaneously decreased the saturation states (Ω) of carbonate biominerals, with aragonite as the most soluble carbonate biomineral typically targeted in biological studies investigating the effects of ocean acidification (OA). Ωarag is a ratio of the product of [CO] and calcium content over the solubility product for aragonite, and this ratio dictates the thermodynamic favorability of aragonite precipitation. If Ωarag is >1, precipitation is favored over dissolution. Globally, average surface Ωarag is estimated to have declined by 0.53 units (Lauvset et al., 2020). These assessments of global average pHT and Ωarag decline over the industrial era are based on calculations of anthropogenic CO2 content; however, long-term change in both pHT and Ωarag resulting from anthropogenic CO2 input is captured in multidecadal open-ocean time series datasets (Bates et al., 2014; Doney et al., 2020; Franco et al., 2021).
Along the continental margins, seawater conditions may not track the global average surface ocean pHT decline, particularly in the northeast Pacific where seawater is less buffered than in some other ocean regions, thereby making it more sensitive to increasing anthropogenic CO2 (Feely et al., 2008, 2018; Lauvset et al., 2020; Cai et al., 2020; Jiang et al., 2015). One estimate of pHT decline on this margin suggests twice the global average based on fossil foraminifera shells preserved in marine sediments (Osborne et al., 2020). Even with the potential for larger pHT decline along the northeast Pacific margin, putting this change into context can be challenging. Given that pHT is negative log10 of [H+]T, the absolute change in [H+]T varies based on the initial pHT for the same degree of pHT decline (Fassbender et al., 2021, 2017). For example, a 0.1-unit pHT decrease with an initial pHT of 7.6 will result in an absolute [H+]T change of 6.3 nmol kg−1, whereas the same degree of pHT decrease with an initial pHT of 8.4 will drive a 1 nmol kg−1 [H+]T change. This clarification is important because the absolute change in acidity can be different despite the same relative change in pHT, and confusion may be enhanced when considering that some continental margins likely have experienced different relative pHT change compared to the global surface ocean average (Osborne et al., 2020; Evans et al., 2019; Pacella et al., 2018; Salisbury and Jönsson, 2018), including in some coastal ecosystems currently being evaluated for their OA mitigation potential (Ricart et al., 2021; Kroeker et al., 2021).
The magnitude of OA-driven marine CO2 system changes and an ecosystem's mitigation potential are both critical areas of research because negative impacts are already being felt by some vulnerable marine species. Along the northeast Pacific continental margin, larval shellfish mortality within hatcheries has been tied directly to low Ωarag (Barton et al., 2012), and some adaptation measures to avoid such conditions have been developed (Barton et al., 2015). Other shell-forming marine species in this region are also exhibiting impacts from OA, including Dungeness crab (Bednarsek et al., 2020; Berger et al., 2021) and pteropods (Bednarsek et al., 2017, 2021; Mekkes et al., 2021). The general consensus is that calcifying species may be the most directly impacted (Kroeker et al., 2013; Haigh et al., 2015; Marshall et al., 2017), although sensitivity to OA appears to be very species, life stage, and population specific (Doney et al., 2020) with the potential for compensatory mechanisms to help sustain populations (Peck et al., 2018; Bednarsek et al., 2021). However, there is a high likelihood of enhanced vulnerabilities by other co-occurring stressors like warming (Kroeker et al., 2013) and reduced oxygen content (Gobler and Baumann, 2016). Biological stressors, such as viral pathogens and harmful algal species, may also become more prevalent or virulent in association with changes in marine CO2 chemistry and warming (Raven et al., 2020; Asplund et al., 2013). The sum of both the direct and indirect effects from OA and other co-stressors threatens marine food webs (Jin et al., 2020), harvested species (Ekstrom et al., 2015), and dependent coastal communities (Mathis et al., 2015); understanding this threat demands assessing how the marine CO2 system has and will evolve through time.
Determining long-term trends in coastal settings is difficult because of inherent high variability resulting from a number of processes unique to the land–ocean interface. Physical forcing from upwelling-favorable winds or tide-induced vertical mixing can result in surface water pCO2 that is super-saturated with respect to the atmosphere, whereas high rates of primary production draw down surface water pCO2 to well below atmospheric levels. Additionally, freshwater input from land can act to dilute total dissolved inorganic carbon (TCO2) and total alkalinity and reduce pCO2 (Meire et al., 2015), or, alternatively, increase pCO2 through the respiration of riverine organic matter (Ward et al., 2017). These processes all occur on different timescales, are not uniformly important across coastal settings, and collectively act to make resolving the relatively small anthropogenic CO2 signal difficult to disentangle from environmental variability. Resolving environmental variability, even to the point of capturing seasonal cycles, remains a challenge in many settings due to a lack of measurements (Hales et al., 2008). In the northeast Pacific between British Columbia (BC) and southeast Alaska (AK), modeling efforts have aided in addressing this knowledge gap and have indicated the relative significance of freshwater input (Siedlecki et al., 2017; Hauri et al., 2020) and its source character (Pilcher et al., 2016), as well as projected warming, deoxygenation, and acidification on multidecadal timescales (Holdsworth et al., 2021). However, observations remain essential to evaluate model output and confirm our understanding of the governing processes that shape marine CO2 system variability, particularly in nearshore settings.
The Inside Passage is a roughly 1600 km network of coastal waterways that spans the semi-enclosed Salish Sea, the central and northern BC coast, and southeast AK. This nearshore region is a key interface between the Pacific coastal temperate rainforest (O'Neel et al., 2015; Bidlack et al., 2021) and a highly productive continental shelf ecosystem (Ware and Thomson, 2005; Jackson et al., 2015). The area experiences a wide array of physical and biogeochemical drivers including intense tidal currents within narrow passages that induce persistent vertical mixing (Whitney et al., 2005; Dosser et al., 2021), strong autumn and winter storms (Stabeno et al., 2004), high runoff from rainfall and snowmelt and glacial-melt sources (Morrison et al., 2012; Beamer et al., 2016; Edwards et al., 2020; Neal et al., 2010), high terrestrial organic carbon input (Edwards et al., 2020; Oliver et al., 2017; St. Pierre et al., 2021), and remotely forced influences such as El Niño events and marine heat waves (Bond et al., 2015; Jackson et al., 2018).
The coastal ocean from BC to southeast AK has large under-sampled areas (Hales et al., 2008; Evans and Mathis, 2013) and coarse temporal information on marine CO2 system variability based on direct measurements (Evans and Mathis, 2013; Evans et al., 2012; Tortell et al., 2012) except within the Salish Sea where seasonal and spatial patterns are more constrained (Evans et al., 2019; Cai et al., 2021; Ianson et al., 2016; Fassbender et al., 2018a; Feely et al., 2010; Lowe et al., 2019). We reduced this information gap by outfitting a passenger ferry within the Alaska Marine Highway System (AMHS) fleet, the M/V Columbia, with instrumentation to monitor surface ocean conditions along the Inside Passage (Fig. 1). We report here on surface underway measurements made from November 2017 to October 2019, and we use this dataset to describe marine CO2 system patterns and quantify the relative importance of key drivers in shaping the observed variability. We also evaluate marine CO2 system extremes and their timing along the ferry transit, which likely has implications for the exposure histories of vulnerable species. Finally, we estimate the anthropogenic CO2 content accrued over the industrial era; assess the impact this perturbation has had on [H+]T, pHT, and Ωarag; and theoretically gauge the extent of acidification implied by the Paris Agreement (UNFCC, 2015) to limit global warming to preferably 1.5 ∘C relative to pre-industrial levels, what we refer to as the “1.5 ∘C acidification level”. The so-called “remaining 1.5 ∘C carbon budget” translates to an atmospheric CO2 level which would be reached with all potential mitigation pathways (Rogelj et al., 2018) and therefore can be viewed as the best case scenario for the maximum acidification owing to anthropogenic CO2 input.
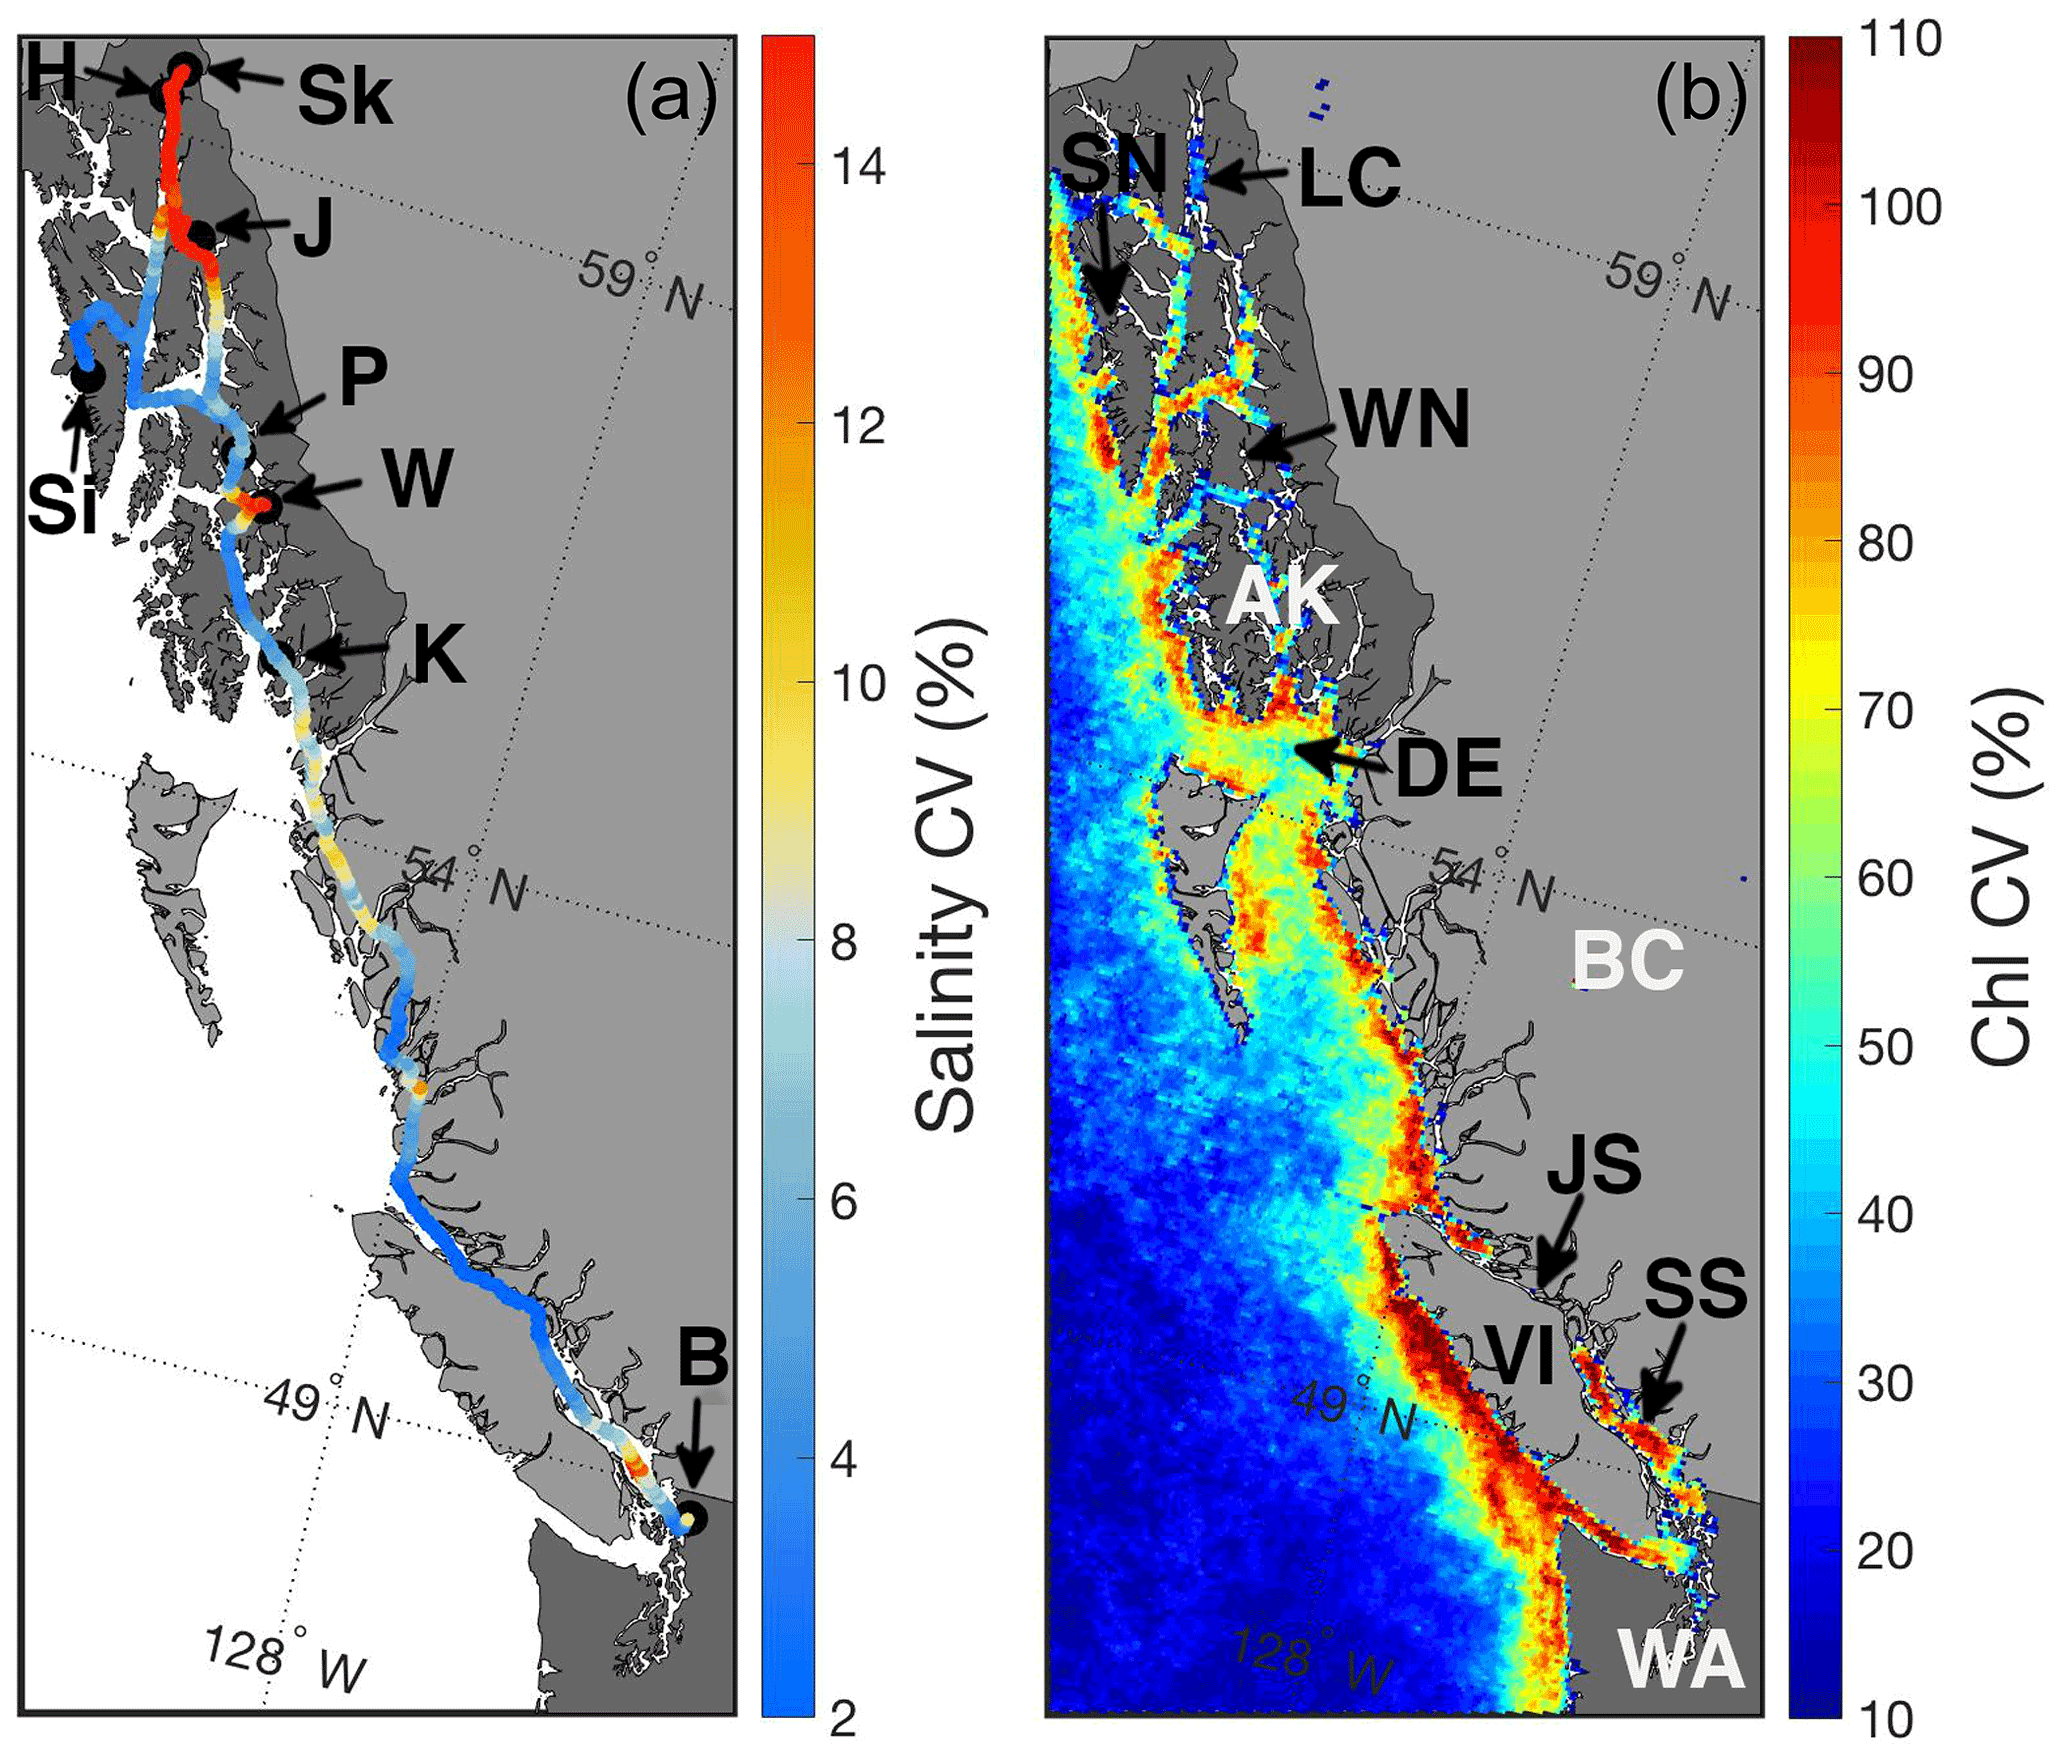
Figure 1Surface salinity along the Inside Passage expressed as the coefficient of variation (CV; %; a) computed for monthly grid cells from underway measurements made from the M/V Columbia between 3 November 2017 and 2 October 2019. Areas of the highest salinity CV are due to large freshwater input, and black circles with labels mark the Alaska Marine Highway System terminals: Bellingham, WA (B); Ketchikan, AK (K); Wrangell, AK (W); Petersburg, AK (P); Juneau, AK (J); Haines, AK (H); Skagway, AK (Sk); and Sitka, AK (Si). Also shown is the surface chlorophyll CV (%; b) from Moderate Resolution Imaging Spectroradiometer (MODIS) Level 3, 4 km mapped data from February to October 2018 and 2019. Areas of high chlorophyll CV reflect instances of biomass accumulation presumably owing to periods of high primary productivity. Areas labeled in the figure panel are the states of Washington (WA) and Alaska (AK), the province of British Columbia (BC), Lynn Canal (LC), Sergius Narrows (SN), Wrangell Narrows (WN), Dixon Entrance (DE), Johnstone Strait (JS), Vancouver Island (VI), and the Salish Sea (SS).
3.1 Underway instrumentation
The AMHS M/V Columbia transited the 1600 km Inside Passage on a weekly basis (Sect. S1). Surface (∼2 m) seawater pCO2 data were obtained from measurements of CO2 mixing ratio (xCO2) made using a General Oceanics 8050 (GO8050) pCO2 measuring system following recommended protocols (Pierrot et al., 2009). Seawater was drawn into the M/V Columbia through an intake located in the bow thruster engine room and supplied to the GO8050 and ancillary sensors using a HP self-priming centrifugal pump (AMT 429A-98 or similar) located ∼2 m from the seawater intake. Temperature measurements were made at the seawater intake using an SBE 38 digital oceanographic thermometer with an accuracy reported by Sea-Bird Electronics of 0.001 ∘C. Seawater was then circulated from the bow thruster room up one deck to the car deck and then aft approximately 30 m along the starboard side to where the GO8050 and ancillary sensors were installed. The seawater circulation loop was split at this location between the GO8050 wet box and an ancillary sensor loop consisting of an SBE 45 MicroTSG thermosalinograph and an Aanderaa 4330F oxygen optode. The accuracy of the temperature measurement from the SBE 45 was reported as 0.001 ∘C when interfaced with the SBE 38, and the accuracy of the conductivity measurement was 0.0003 S m−1. Salinity, computed from conductivity and temperature, is reported here on the Practical Salinity Scale (PSS-78). The accuracy of the Aanderaa 4330F oxygen optode reported by the manufacturer Xylem was <1.5 %. All ancillary sensors were serviced annually, and a multipoint calibration was conducted on the oxygen optode at the Aanderaa facility in Norway. Oxygen data from the Aanderaa 4330F were output in µmol L−1, salinity-corrected using the approach described in Bittig et al. (2018), and then density-corrected to µmol kg−1. Oxygen data are reported here as the difference from saturated values (ΔO2).
Seawater entered the GO8050 wet box at ∼2.9 L min−1 and ∼10 psi and then was circulated into a water-jacketed (to minimize warming) primary showerhead equilibrator with a liquid volume of ∼0.5 L and to a smaller secondary equilibrator with a liquid volume of ∼0.1 L. The primary equilibrator was maintained at ambient pressure on the car deck by a vent that was plumbed to the secondary equilibrator and then to the primary equilibrator. The pressure difference between inside the primary equilibrator and the car deck was monitored using a Setra pressure transducer (model 239) with a 0.15 hPa uncertainty. The secondary equilibrator serves to pre-equilibrate (make-up) air entering the primary equilibrator through the vent due to any loss through the headspace gas recirculation loop. A flow meter was present at the opening of the vent in order to monitor make-up air flow into the equilibrator. The headspace gas volume of the primary equilibrator was ∼0.8 L, and seawater temperature was monitored within the primary equilibrator using a Fluke thermometer (model 1523) and thermistor probe (model 5610) with an uncertainty of 0.01 ∘C.
Atmospheric air was drawn from an intake on the foredeck to the GO8050 wet box. Both the equilibrator headspace gas and atmospheric air were dried using a condenser (Peltier thermoelectric cooling device) and Permapure Nafion drying tubes in order to minimize the correction for water vapor content associated with band-broadening within the infrared gas analyzer located in the GO8050 dry box. The analyzer housed in the GO8050 dry box was a LI-COR LI840A CO2–H2O gas analyzer with a root-mean-square noise level for 1 Hz measurements of 1 ppm reported by the manufacturer. Dried equilibrator headspace and atmospheric gases were supplied to the analyzer from the wet box at ∼0.1 L min−1. In addition to the analysis of equilibrator headspace and atmospheric gases, four standard gases of known mixing ratio (150, 349, 449, and 850 ppm; Praxair) were also plumbed to provide gas flow to the GO8050. Praxair standard gases were evaluated by calibrating a LI840A using the Praxair gases, and then the calibrated analyzer was used to measure the CO2 content of a World Meteorological Organization (WMO) traceable standard gas cylinder from the National Oceanic and Atmospheric Administration Earth System Research Laboratories (ESRL) Greenhouse Gas Global Reference Network. The Praxair gas standard calibrated LI840 was able to reproduce the certified ESRL standard to within 0.1 %.
The GO8050 was controlled using National Instruments LabVIEW software run on a PC laptop computer. The software controls data acquisition from the GO8050, an interface box connecting the SBE 38 and the SBE 45, the Aanderaa 4330F, the primary equilibrator temperature and pressure sensors, a Vaisala digital barometer (0.07 mbar accuracy) with a model 61002 Gill pressure port and GPS antenna positioned adjacent to the atmospheric air intake, and the LI840A, while also controlling a Valco Instruments Co. Inc. (VICI) multi-port actuator that cycles between the gas streams plumbed to the dry box. The software captured measurements from all ancillary sensors as well as analyses of the four gas standards of known CO2 content, 12 measurements of atmospheric CO2, and 240 seawater CO2 measurements in a cycle that was repeated every 8.5 h with a 2 min measurement frequency. The seawater and atmospheric CO2 analyses were run in a sequence of three atmospheric measurements and 60 seawater measurements that was repeated four times between standardization. Analyses of each gas standard were interpolated over the time record of the dataset and used to create calibration functions needed to correct the raw LI840A xCO2 data. Calibrated seawater xCO2 data in dry air were quality-controlled and then converted to CO2 partial pressure (pCO2) in wet air at the equilibrator temperature by using atmospheric pressure measured by the LI840A plus the differential pressure recorded in the equilibrator corrected for the removal of water vapor. Finally, seawater pCO2 in wet air was adjusted to sea surface temperature using the offset between SBE 45 temperature recorded at the GO8050 and intake temperature from the SBE 38 located at the seawater intake with zero lag (0.3 ∘C ± 0.17 ∘C), as the lag between the temperature measurements at these two locations was determined to be less than the measurement frequency.
Total uncertainty in our pCO2 measurements is the combined uncertainties from calibration, equilibrator temperature, equilibrator pressure, and the warming correction added in quadrature. At contemporary atmospheric pCO2 levels near 400 µatm, these component uncertainties would equate to 0.4, 0.06, 0.17, and 3.9 µatm. Typically, underway pCO2 measurement uncertainties are reported as a function of uncertainties in the equilibrator temperature and pressure and the water vapor pressure (Wanninkhof et al., 2013). Considering our dried gas stream that minimizes uncertainty from water vapor pressure, the uncertainty from just the equilibrator temperature and pressure, with inclusion of the calibration uncertainty, would equal 0.44 µatm. However, taking into account uncertainty in the warming correction (while still not addressing deviations from a constant pCO2 temperature sensitivity) increases the pCO2 uncertainty to 3.92 µatm. While we prefer the more typical assessment that points to a lower pCO2 uncertainty, we use a conservative ∼1 % pCO2 uncertainty below to estimate the uncertainties in derived marine CO2 system parameters.
In June 2019, a BioGeoChemical SUrface MOnitoring-system (BGC-SUMO) was configured with the GO8050 to provide underway pH measurements on the total hydrogen ion scale (pHT). The BGC-SUMO measures pHT, temperature, and nitrate concentration, although the latter measurement was not successful on this vessel. The pHT was measured using a Deep-Sea DuraFET, consisting of an ion-sensitive field effect transistor (ISFET) and a chloride ion-selective electrode as the reference (Johnson et al., 2016). Thus, seawater is unmodified, and no chemicals are added as it flows through the BGC-SUMO. The pHT sensor was calibrated prior to deployment on the M/V Columbia, and its performance was verified based on discrete samples taken alongside the sensor (n=9) throughout the deployment (Takeshita et al., 2018). Based on this comparison, we assume an uncertainty in pHT of 0.01. Maintenance on all instrumentation configured aboard the M/V Columbia was conducted during service stops in Ketchikan to prevent biofouling.
3.2 Discrete sample collection
Discrete seawater samples were collected on two ferry trips in November 2017 and August 2018. Samples were drawn from the seawater supply line immediately upstream of the GO8050 into rinsed 350 mL amber soda-lime glass bottles and analyzed for TCO2 and pCO2 within a month of collection following methods described elsewhere (Evans et al., 2019). Briefly, TCO2 and pCO2 were analyzed from the same sample bottle in this order at the Hakai Institute's Quadra Island Field Station using a Burke-o-Lator pCO2–TCO2 analyzer. The TCO2 measurement was achieved by acidification and gas stripping followed by non-dispersive infrared detection using a LI-COR LI840A and consumed ∼60 mL of sample. TCO2 measurements were adjusted using correction factors developed through the analysis of certified reference materials (CRMs) from Andrew Dickson (Scripps Institute of Oceanography), with typical correction factors between 0.99 and 1.01. Uncertainty in the discrete TCO2 measurement was determined to be 0.3 % (Evans et al., 2019). The pCO2 measurement was achieved by headspace gas recirculation between the LI840A and the sample bottle in a closed loop until equilibration of the headspace gas with the seawater sample pCO2 was obtained (roughly 6 min). Uncertainty in the discrete pCO2 measurement was determined to be 1 %. The TCO2 measurement was subsequently headspace gas corrected (Wanninkhof and Thoning, 1993), and then alkalinity (Alk) was computed using the pCO2 and head space gas-corrected TCO2 data with a MATLAB version of CO2SYS (Sharp et al., 2021) and the carbonic acid dissociation constants of Waters et al. (2014), bisulfate dissociation constant of Dickson et al. (1990), fluoride and hydrogen association constants from Perez and Fraga (1987), and boron chlorinity ratio of Uppström (1974). Alk computed in this way excluded contributions from organic acids, phosphate, and silicate.
3.3 Calculations
3.3.1 Gap filling, marine CO2 calculations, and gridding
The record of underway measurements from the M/V Columbia contained a number of data gaps related to service interruptions, the largest of which was between October 2018 and March 2019 when the ferry went into dry dock for the winter. However, there was a period from 25 August to 2 October 2019 when only the direct pCO2 measurements were compromised due to an issue with the LI-COR. Subsequently, pCO2 was estimated indirectly using pHT measurements and a regional Alk–salinity relationship (Evans et al., 2015). To fill these missing data, pHT measurements were interpolated to the measurement time of the GO8050. pCO2 was then computed using the time-matched pHT data with the relationships described above and derived Alk. Missing measured pCO2 observations in late 2019 were filled with the computed values.
Seawater pHT, [H+]T, and Ωarag were computed for the entire dataset using the salinity, intake temperature, the gap-filled pCO2 record, and Alk derived from salinity (Evans et al., 2015) with the dissociation constants and relationships described above using a MATLAB version of CO2SYS (Sharp et al., 2021). Uncertainty in pHT, [H+]T, and Ωarag derived from our pCO2 record coupled with salinity-based Alk determinations was assessed using the error propagation routine from Orr et al. (2018) updated in the most recent MATLAB version of CO2SYS (Sharp et al., 2021). Combined standard uncertainties for pHT, [H+]T, and Ωarag were computed using the previously described 1 % pCO2 uncertainty, the reported 17.21 µmol kg−1 uncertainty in the regional Alk–salinity relationship (Evans et al., 2015), and the default uncertainties for the dissociation constants within the error propagation routine. pHT, [H+]T, and Ωarag uncertainties were computed across the range of observed Alk values and with pCO2 computed across a range TCO2:Alk ratios spanning 0.85 to 1 for each corresponding Alk value (Fig. S1). These calculations were done at a constant temperature and with salinity ranging from 10 to 32 corresponding with the range of Alk values. Importantly, marine CO2 system data quality falls into two objectives as defined by the Global Ocean Acidification Observing Network (Newton et al., 2015; Tilbrook et al., 2019): (1) weather and (2) climate. The weather data quality objective is thought sufficient for identifying spatial and temporal patterns excluding long-term trends, which is considered more appropriate for data reaching the stringent climate quality objective to assess. The mean pHT, [H+]T, and Ωarag uncertainties from our calculations are 0.01, 0.23 nmol kg−1, and 0.07 respectively. These values meet the Global Ocean Acidification Observing Network weather data quality objective. However, we note that uncertainties vary across the range of values considered. For instance, Ωarag uncertainty is higher at higher Ωarag values, whereas pHT uncertainty is higher at lower salinity and Alk (Fig. S1).
To evaluate basic statistics along the M/V Columbia transit, including means, coefficients of variation (CV), and lower 5th percentiles, as well as assess seasonal drivers and the time of detection that are both described below, observations were gridded by isolating and averaging data within 0.03∘ by 0.03∘ grid cells. It is important to note that due to the 2018–2019 winter data gap, gridded averages likely over-represent spring and summer relative to the autumn and winter conditions. This grid size equalled roughly 6 km2 across the latitudinal range of the M/V Columbia transit. Analyses using gridded data were only conducted on grid cells containing more than 40 measurements.
3.3.2 Seasonal drivers
Assessing the drivers of seasonal pCO2 variations requires isolating the thermodynamic and biophysical components of the variability. The process to achieve this is described in Sect. S2, and results in isolating the pCO2 temperature component (pCO2 T component), the pCO2 salinity component (pCO2 S component), and remaining variability from biophysical drivers. Seasonal amplitudes of each component of pCO2 variability were assessed, and the ratio of the amplitude of thermodynamic (T, S, or combined TS) to biophysical drivers (BT, BS, BTS; where subscript denotes the removed terms) defines which is more important for determining pCO2 variability on an annual basis (Takahashi et al., 2002; Fassbender et al., 2018b).
3.3.3 Severity and time of detection
We determined the severity of derived pHT and Ωarag in each grid cell based on the lower 5th percentile as in Chan et al. (2017) and the timing of severe conditions as the mode of all months of observations less than or equal to the lower 5th percentile of each grid cell. We also assessed the time of detection (ToD) within each grid cell of the M/V Columbia transit in order to guide future observational efforts targeting the identification of long-term change. ToD is similar to the time of emergence used in climate studies (Henson et al., 2017) with the exception that it includes measurement uncertainty (Carter et al., 2019b). Both of these terms represent the time required for a secular trend, in our case increasing seawater pCO2 from anthropogenic CO2 uptake, to emerge from the “noise” in an environmental dataset. Monthly mean pCO2 is computed from the observations occurring within each grid cell, and then the observations are differenced from the monthly mean in order to compute de-seasonalized anomalies (i.e., removing the large-amplitude seasonal cycle from the noise). The standard deviation of the de-seasonalized anomalies was combined in quadrature with the pCO2 measurement uncertainty to represent the remaining environmental noise and compute ToD as
where the pCO2 growth rate used here was 2.5 µatm yr−1 and is approximately the average of annual values from the National Oceanic and Atmospheric Administration ESRL over the 2014–2019 period. Importantly, we consider ToD as a guiding metric. The growth of seawater pCO2 can vary across coastal settings and may or may not be entirely driven by anthropogenic CO2 input (Laruelle et al., 2018; Salisbury and Jönsson, 2018). For example, changes in nutrient input from runoff can alter the pCO2 growth rate from an expected anthropogenic CO2-driven signal (Turk et al., 2019). Therefore, we present ToD only to discuss how these data might be used to target observing efforts and not as absolute values.
3.3.4 Anthropogenic CO2
Anthropogenic CO2 content was estimated using the ΔTCO2 approach (Takeshita et al., 2015; Pacella et al., 2018; Evans et al., 2019), which is a simplification of the ΔC∗ method (Sabine et al., 2002; Gruber et al., 1996), and assumes a constant TCO2 disequilibrium with the atmosphere defined as
where TCO2,obs is the observed TCO2 and is the TCO2 content that would result from equilibration with the atmospheric pCO2 at the time of last contact with the atmosphere (current year minus the age of the water mass), at the derived Alk and at the observed temperature and salinity. The time of last contact with the atmosphere represents the age of a water mass in years and is zero for most surface measurements except in areas where deep water is mixed to the surface. Water mass age was estimated by dividing the measured apparent oxygen utilization (AOU, or the inverse of ΔO2) by the oxygen utilization rate (OUR). A value of 4.1 µmol kg−1 yr−1 for OUR was taken from the literature for Pacific subarctic upper water (Feely et al., 2004b) and used in this calculation. Using the ΔTCO2,diseq term and assuming patterns in derived Alk and observed temperature and salinity are largely invariant, the TCO2 for a given year can be estimated by
where TCO2,year is the TCO2 content for a specific year and is the TCO2 content that would be realized if that surface water mass were in equilibrium with the atmospheric pCO2 that occurred during a given year, corrected for the age of the water mass, and at the contemporary derived Alk and observed temperature and salinity. The anthropogenic CO2 content is then determined as the difference between the TCO2 for a given year and the TCO2 content for the year 1765. Historical atmospheric CO2 mol fractions based on observations and projected atmospheric CO2 for the shared socio-economic pathways (SSPs) were obtained from Meinshausen et al. (2020) using their data portal (http://greenhousegases.science.unimelb.edu.au, last access: May 2020) and converted to pCO2 assuming standard atmospheric pressure. pHT, [H+]T, and Ωarag were computed for each year from 1765 onward using the TCO2 estimated for a given year with the modern derived Alk and observed temperature and salinity. It is important to acknowledge that uncertainty in estimating anthropogenic CO2 content using this approach is at least 5 µmol kg−1 based on similarities with the ΔC∗ method (Sabine et al., 2002). Uncertainty stems from a number of sources, including the key assumptions of constant TCO2 disequilibria and unchanged variation in the natural carbon cycle, temperature, and salinity. Inadequacies in these assumptions can lead to biases in anthropogenic CO2 (Matsumoto and Gruber, 2005), which in turn influences estimations of past and future pHT, [H+]T, and Ωarag.
4.1 Time and space variability
Over 244 000 seawater temperature, salinity, O2, and pCO2 measurements were made on the M/V Columbia during 135 north- and south-bound transits of the Inside Passage over a 2-year period. These data revealed substantial spatiotemporal variability in surface seawater conditions along this 1600 km stretch of coastline. The spatial and temporal mosaic captured by these measurements (Figs. 2 and 3) portrays two key features of the Inside Passage: (1) the dominant mode of temporal variability is the seasonal cycle, and (2) there is regional variability in the seasonal cycle amplitude that is modulated by the relative influences of tidal mixing, net community production, and the magnitude and character of freshwater input.
Between November and March, cold seawater spanned the entire Inside Passage, with the coldest water in southeast AK generally near 4 ∘C, but 0.5 ∘C was observed near Juneau. Seasonal warming in most regions began in April and occurred earlier in the Salish Sea, which was consistent with satellite observations that identified earlier seasonal warming in this region relative to coastal areas to the north (Jackson et al., 2015). Surface salinity was fresher throughout the year in the Salish Sea, although variability in salinity was larger in southeast AK (Figs. 1 and 2) where seasonal freshwater delivery to the coastal ocean contributes 41 % of the freshwater input to the Gulf of Alaska (Edwards et al., 2020). The combined estimates of discharge from each major watershed along the Inside Passage from Edwards et al. (2020) and Morrison et al. (2012) indicate that over 570 km3 yr−1 of freshwater enters the northeast Pacific from southeast AK, an amount that exceeds the Mississippi River discharge (Dai and Trenberth, 2002). Along the BC portion of the Inside Passage, discharge is near 390 km3 yr−1 with almost a quarter of this amount originating from the Fraser River. Despite lower runoff from BC, its influence on salinity manifests earlier than the peak freshwater input in southeast AK (Fig. 2) due to the high contribution of snowmelt to the late spring and early summer discharge (Morrison et al., 2012). In southeast AK, seasonal reduction in salinity began in May and reached the summer minima in August. Low-salinity conditions were uniform over an area that encompassed Lynn Canal and the inside waterways around Juneau (Figs. 1 and 2). The late summer minimum in salinity reflects the significant contribution of glacial melt in the most northern portion of the Inside Passage (Neal et al., 2010; Edwards et al., 2020). Seasonal variation in temperature and salinity was reduced in some confined waterways, such as Johnstone Strait (Fig. 1), owing to the influence of intense tidal mixing in these areas that dampens the seasonal cycle amplitude (Dosser et al., 2021; Whitney et al., 2005). Despite the emergence of a marine heat wave in the North Pacific in late 2019 (Amaya et al., 2020), spring and summer patterns in temperature and salinity appeared similar between 2018 and 2019.
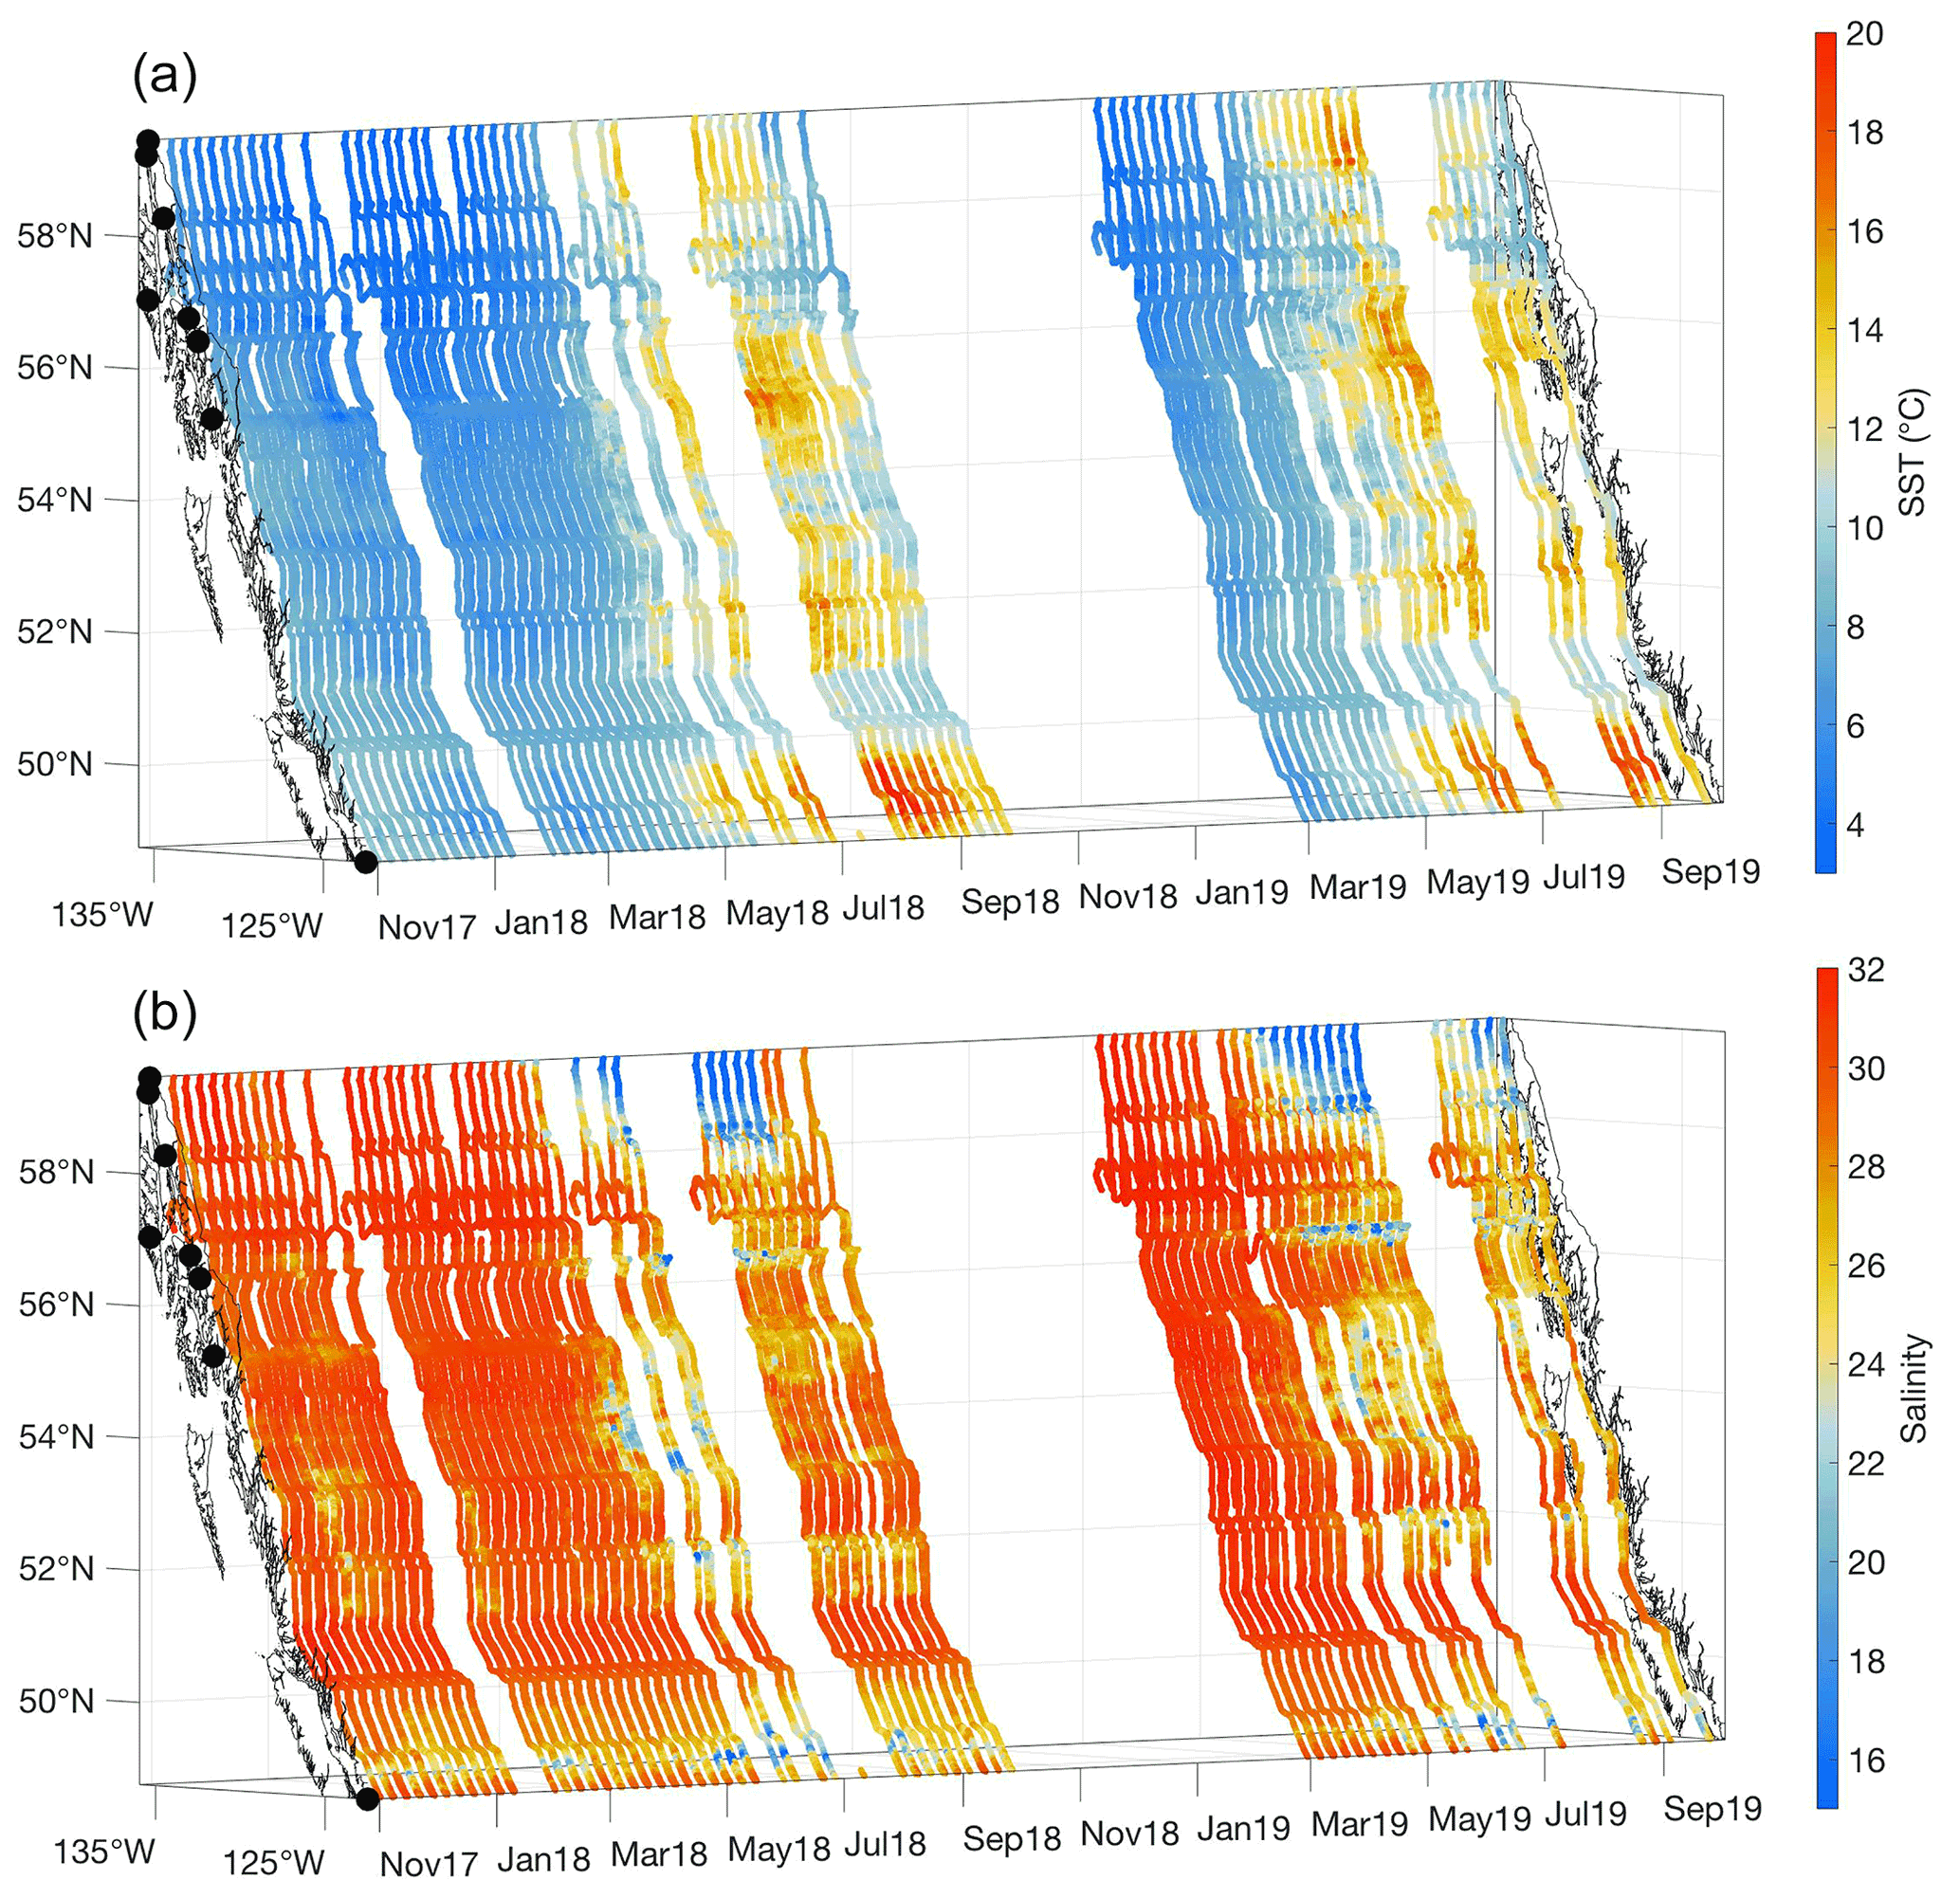
Figure 2Sea surface temperature (SST; ∘C; a) and salinity (b) measured between 3 November 2017 and 2 October 2019. The x and y axes represent longitude and latitude, respectively, and with the coastline and terminal positions shown as in Fig. 1 and time increasing along the z axis.
Across most of the Inside Passage, ΔO2 and pCO2 showed an inverse relationship (Fig. 3). Where ΔO2 values were positive, pCO2 was undersaturated with respect to the atmosphere, and this combination likely reflects the influence of primary productivity exceeding rates of organic matter respiration, i.e., positive net community production (NCP). Abiotic changes in ΔO2 result from changes in temperature and salinity as well as bubble injection and wave breaking (Juranek et al., 2019), although we contend that the latter two drivers may be of lesser importance in the protected Inside Passage waterways. Seasonal warming increases both ΔO2 and pCO2. However, we observed an increase in ΔO2 with a corresponding decrease in pCO2, which strongly suggests that O2 supersaturation and pCO2 drawdown resulted from positive NCP (Tortell et al., 2012; Juranek et al., 2019). In areas outside of the influence of tidal mixing, the signals of O2 supersaturation and pCO2 drawdown were initiated in response to the spring phytoplankton bloom, and generally were sustained through summer until the autumn storm season commenced (Evans et al., 2019; Fassbender et al., 2018a). An exception was Lynn Canal in southeast Alaska (Fig. 1) where the relationship between O2 and pCO2 diverged in summer (Fig. 3) when the seasonal change in salinity was maximal (Fig. 2). The addition of cold glacial meltwater results in undersaturated surface pCO2 (Cai et al., 2021; Pilcher et al., 2016; Evans et al., 2014) while also increasing oxygen solubility and subsequently decreasing ΔO2 (Fig. 3). The diverging character between O2 and pCO2 within Lynn Canal in summer dissipated during autumn when salinity increased in response to storm-induced vertical mixing. Autumn marked the transition back to supersaturated pCO2 with respect to the atmosphere throughout the Inside Passage. Inter-annual variability was apparent in this dataset during the spring and summer months, as 2019 had slightly greater O2 supersaturation and pCO2 drawdown during spring in the Salish Sea and on the central BC coast and throughout much of the summer in southeast AK (Fig. 3).
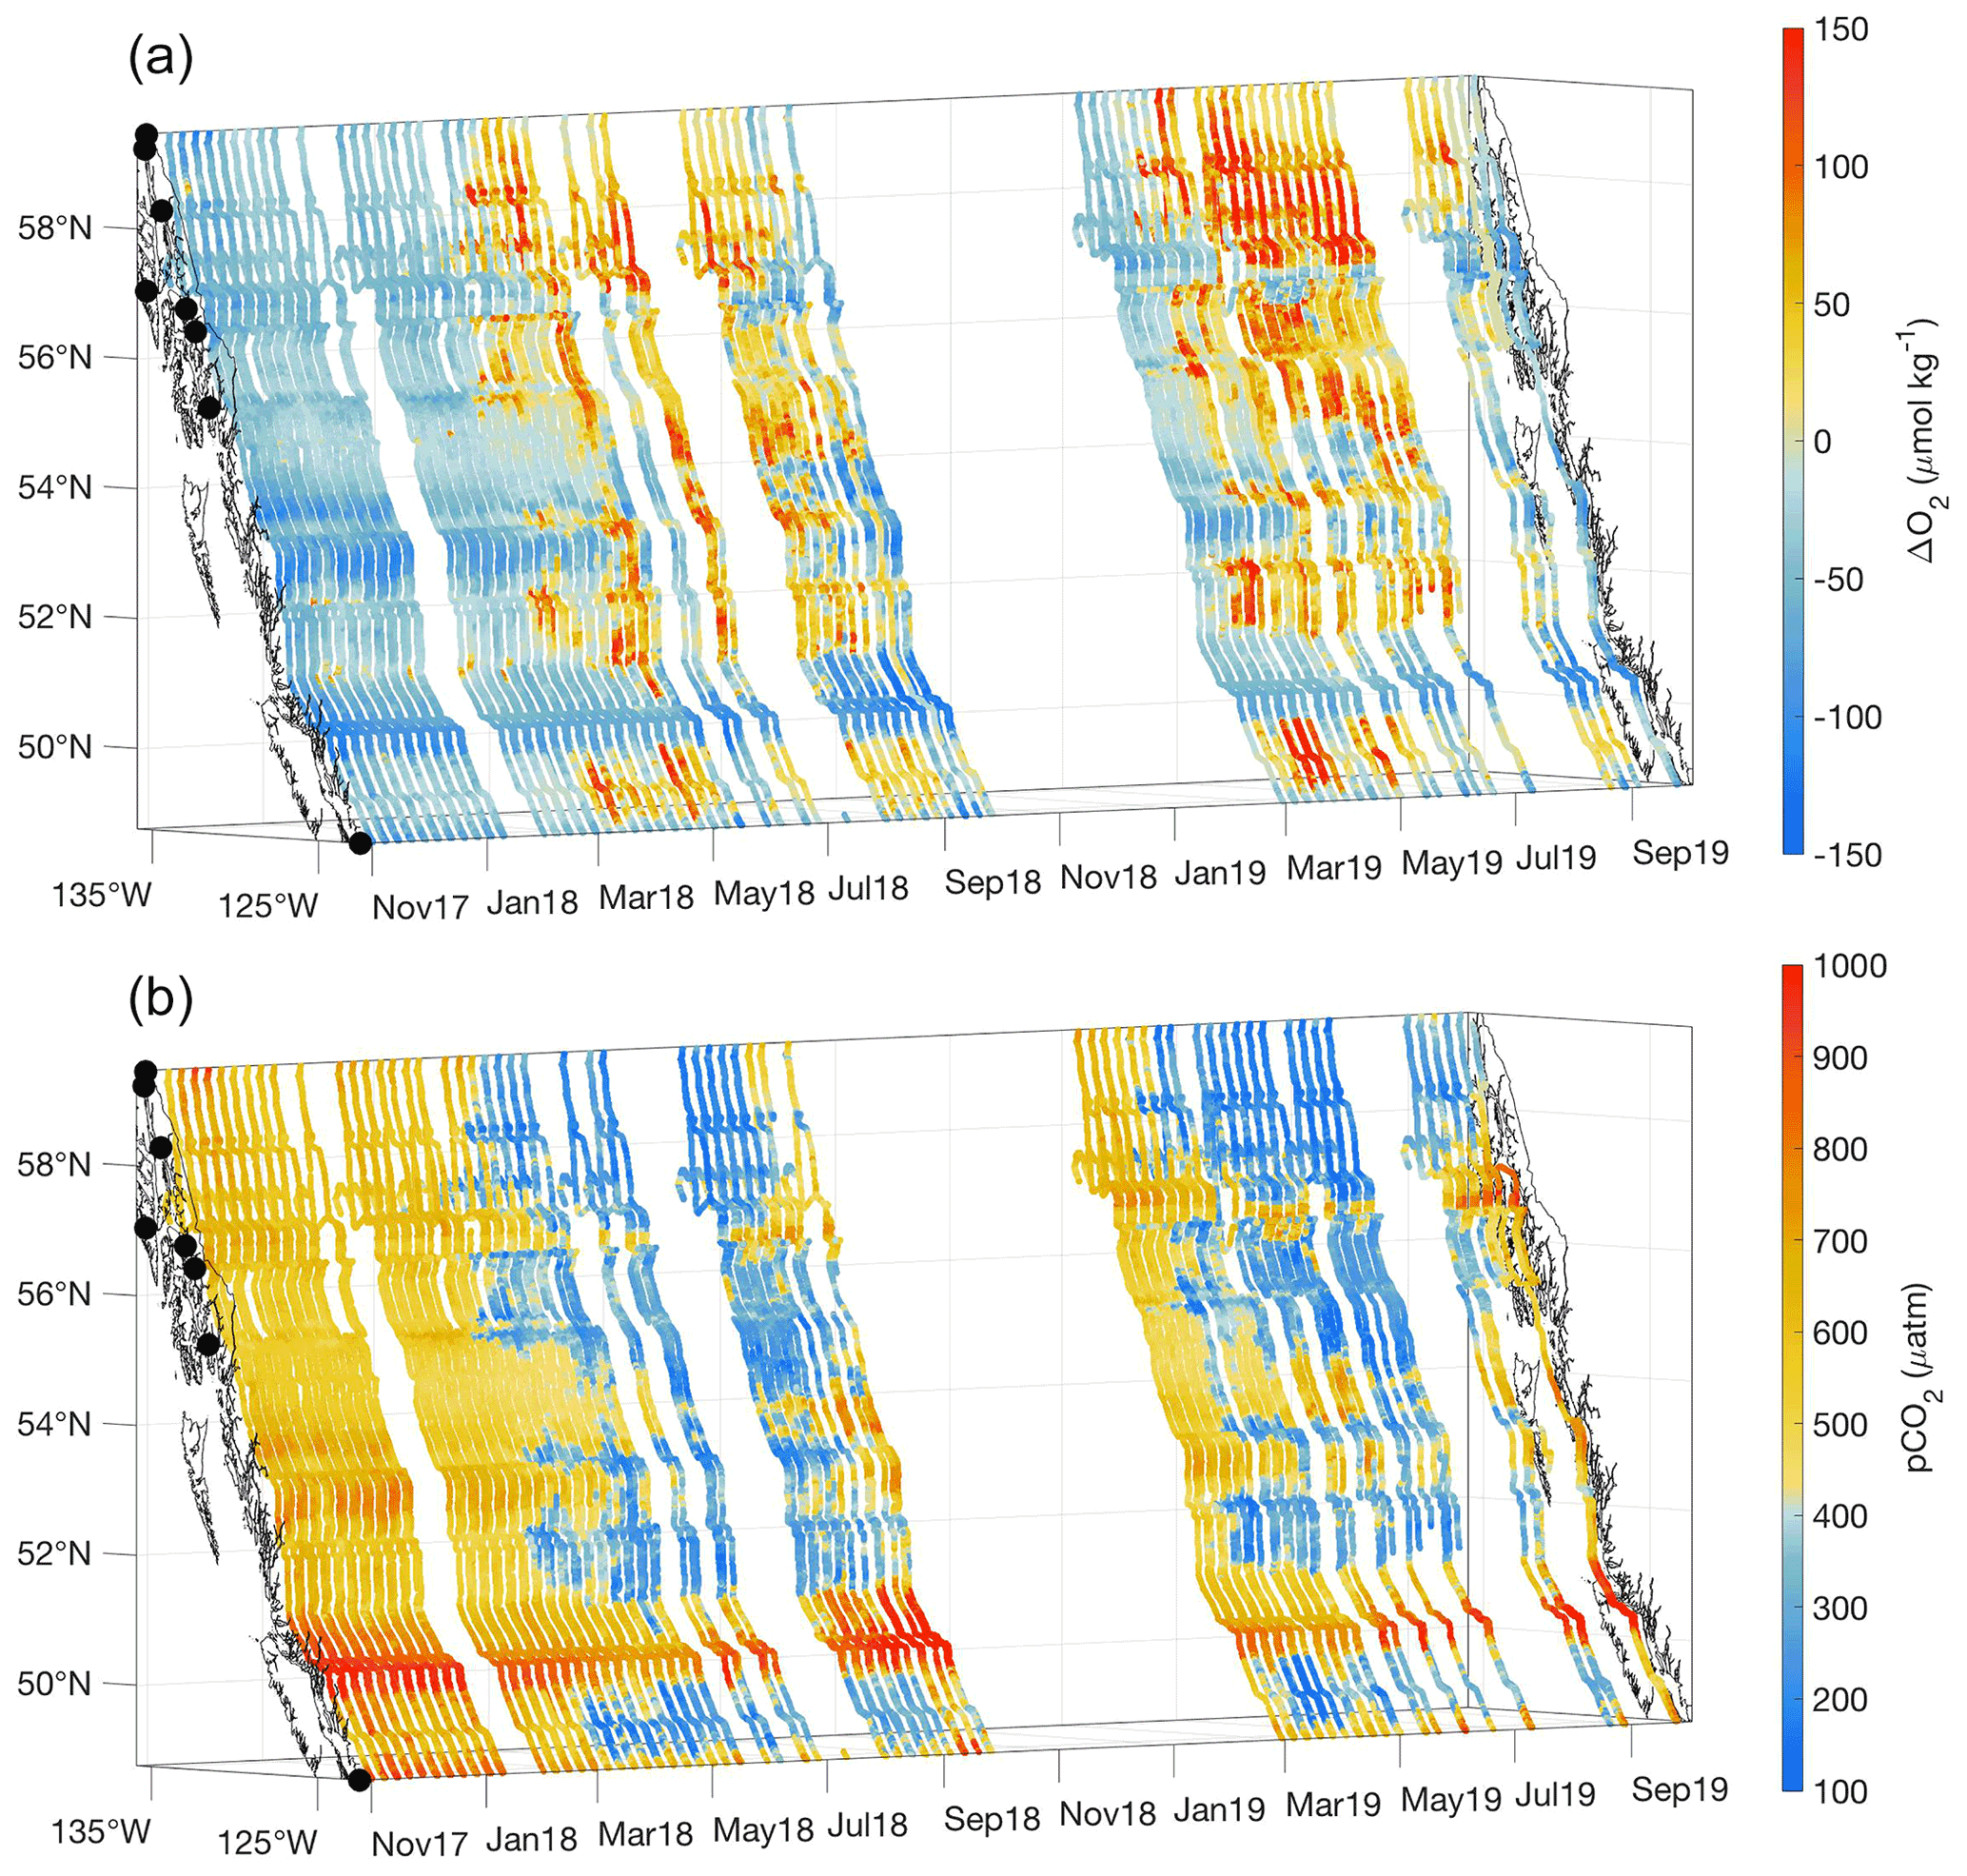
Figure 3ΔO2 (µmol kg−1; a) and pCO2 (µatm; b) measured between 3 November 2017 and 2 October 2019. The x and y axes represent longitude and latitude, respectively, and with the coastline and terminal positions shown as in Fig. 1 and time increasing along the z axis.
Seasonal O2 supersaturation and pCO2 drawdown do not occur uniformly along the Inside Passage but in distinct regions separated by areas of tidal mixing that support sustained low-O2 and high-pCO2 conditions (Fig. 3) due to the near-continuous ventilation of sub-surface waters (Whitney et al., 2005; Dosser et al., 2021; Evans et al., 2012; Tortell et al., 2012). The most obvious region of intense tidal mixing along this coastline was in Johnstone Strait between Vancouver Island and mainland BC (Fig. 1), but other areas were also evident, including in the narrow waterway north of Sitka known as Sergius Narrows (Fig. 1). As mentioned above, the seasonal amplitude in the tidal mixing zones is reduced because the water column may be completely mixed, and seasonal variation in these areas may more reflect that of sub-surface water entering the mixing zone laterally (Dosser et al., 2021). Since seasonality in these areas is potentially more influenced by sub-surface source waters, the seasonal cycle can be out of phase with adjacent areas outside of the tidal mixing zones. This was most obvious in Johnstone Strait, where high-pCO2 conditions outside of this area were generally seen during winter, whereas within this region, the highest pCO2 was in autumn. The highest observed seawater pCO2 was near 1200 µatm in Johnstone Strait during September. Winter pCO2 values outside of the tidal mixing zones broadly ranged between 450 and 800 µatm, being higher in regions with less direct connection to the open continental shelf, such as in the semi-enclosed Salish Sea, in areas of the central BC coast, and in southeast AK (Fig. 3). These areas receive high amounts of riverine organic matter (St. Pierre et al., 2021; Oliver et al., 2017; Johannessen et al., 2003) that may be confined to the nearshore zone by winter-time downwelling circulation (Thomson, 1981; Weingartner et al., 2009) and there subsequently remineralized by the microbial community (St. Pierre et al., 2020), leading to elevated surface pCO2 nearshore that is not seen in the offshore data along this coast (Evans and Mathis, 2013). In tidal mixing zones like Johnstone Strait, the highest pCO2 in early autumn decreased through winter to a minimum by late spring, albeit with values that were still supersaturated with respect to atmospheric pCO2. This difference in timing likely reflects the seasonality of sub-surface waters (Dosser et al., 2021), since, without a short residence time (Pawlowicz et al., 2007), these waters would experience a build-up of respiratory CO2 through the growing season as organic matter rains out of the surface layer and is respired at depth by the microbial community. We suggest this sub-surface respiration signal is ventilated in the tidal mixing zones and is responsible for the early autumn peak in surface pCO2.
Seawater pHT and Ωarag variability was evaluated by employing an Alk–salinity relationship developed from observations spanning a large portion of the region (Evans et al., 2015). Validation of this relationship was done using Alk determined from seawater samples collected during ferry ride-along cruises and processed as described above. These cruises occurred in November 2017 and August 2018 and spanned the dynamic range of observed salinity conditions (Fig. 2). During November, comparison between discrete Alk and salinity-derived Alk was within 2 times the root-mean-square error of the salinity-based relationship (Fig. S2). During August, larger divergence between discrete and salinity-derived Alk occurred in low-salinity water within the northernmost portion of the Inside Passage. Specifically in the area of Lynn Canal, Alk determined from the salinity-based relationship overpredicted bottle-determined Alk by at most 200 µmol kg−1. Salinity-based Alk determination was further evaluated in 2019 by comparing estimated pHT, computed from directly measured pCO2 and salinity-based Alk, to directly measured pHT (Fig. S3). pHT was measured from June to October 2019 over the period of lowest observed salinities in southeast AK and revealed a similar pattern to the discrete Alk comparison. Divergence between estimated and directly measured pHT was greatest in seawater with salinity <22 and north of 57∘ N in the region around Juneau and up Lynn Canal (Fig. S3). In the analysis that follows, we continue to use salinity-based Alk with our gap-filled pCO2 record to determine components of the marine CO2 system along the Inside Passage, but we acknowledge that the northernmost region during summer is likely more corrosive for aragonite than our analysis suggests because of our Alk over-predictions in low-salinity water. It is also possible that local deviations from the assumption of proportionality between salinity and calcium made within CO2SYS may counteract a portion of this “missing” corrosive signal in the low-salinity surface water of southeast AK (Beckwith et al., 2019). The presence of proton-binding dissolved organic molecules may cause additional complication by impacting the interpretation of low-salinity Alk measurements used to generate the regional Alk–salinity relationship (Sharp and Byrne, 2020). While the magnitude of how corrosive Ωarag is during the melt season in the northernmost area of the Inside Passage may be less well-constrained, the drivers and timing of adverse conditions should not deviate from what we describe below. The confounding factors of variable freshwater Alk, interpretations of Alk measurements in the presence of proton-binding dissolved organic molecules, and potential for non-zero calcium end-members in this region all demand further study in order to more accurately assess the magnitude of corrosive summer Ωarag conditions in these glacial-melt-influenced waters.
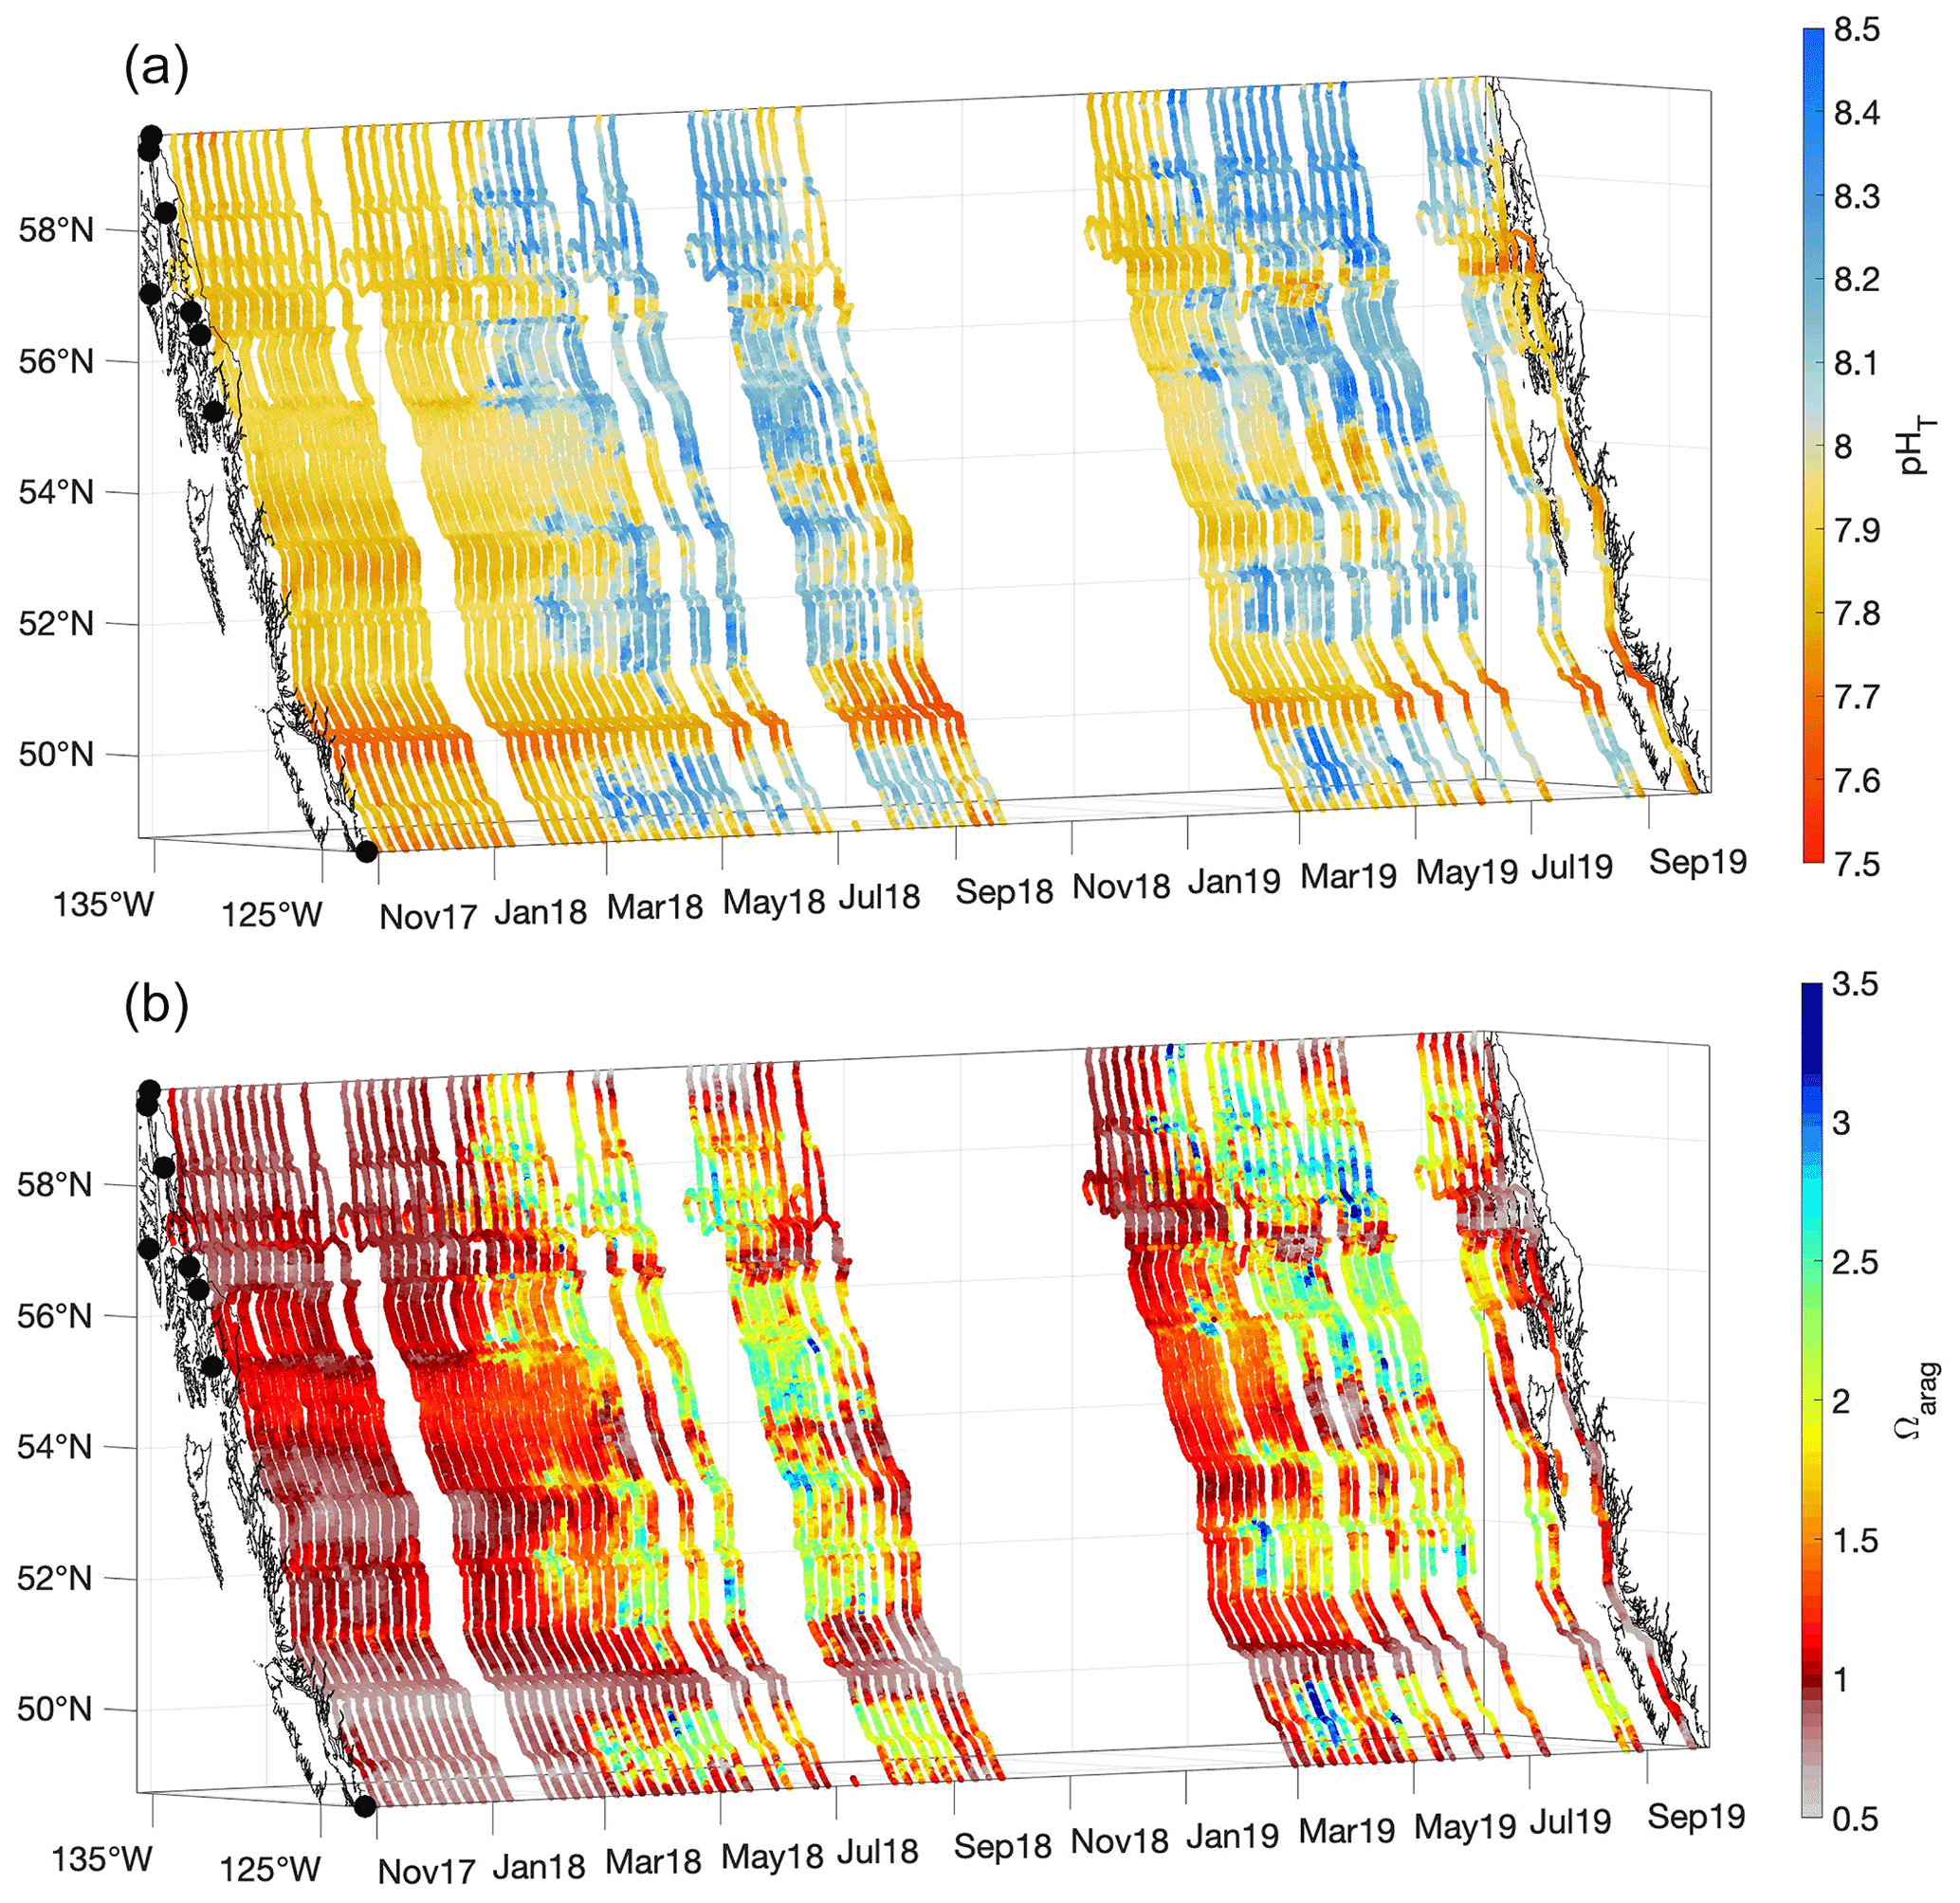
Figure 4pHT (total scale; a) and Ωarag (b) derived from measurements made from 3 November 2017 to 2 October 2019. The x and y axes represent longitude and latitude, respectively, and with the coastline and terminal positions shown as in Fig. 1 and time increasing along the z axis.
Patterns in seawater pHT and Ωarag were largely the inverse of that for pCO2 (Fig. 4); areas exhibiting pCO2 undersaturation with respect to the atmosphere typically co-occurred with high-pHT and high-Ωarag conditions, whereas regions with high pCO2 have low pHT and Ωarag. Areas with both high pHT and Ωarag have experienced recent positive NCP that would also support O2 supersaturation and pCO2 drawdown (Figs. 3 and 4). The evidence of inter-annual variability discussed above for spring and summer O2 and pCO2 was apparent for pHT and Ωarag, with 2019 exhibiting more frequent occurrences of Ωarag>3 compared to 2018. pHT and Ωarag were lowest in most areas during winter and year-round within tidal mixing zones. Winter Ωarag values were <1 in all regions that lacked direct connection to the open continental shelf, specifically within the Salish Sea, Johnstone Strait, inside waterways on the central and northern BC coast, and in southeast AK. Corrosive conditions for aragonite persisted throughout the year in Johnstone Strait, and in an area known as Wrangell Narrows between Wrangell and Petersburg (Fig. 1). In the northernmost area of the Inside Passage, a short period of Ωarag conditions >1 occurred between March and June, resulting from the spring phytoplankton bloom as evidenced by co-occurring O2 supersaturation and pCO2 drawdown (Fig. 3). Once the summer melt season commenced, the Inside Passage-wide minimum in Ωarag was observed in this region despite the over-prediction in Alk in low-salinity water mentioned above. Lynn Canal exhibited the most corrosive conditions for aragonite along the 1600 km M/V Columbia transit due to the large contribution of meltwater in this region (Fig. 2). Such corrosive conditions in glacial-melt-influenced settings have been reported previously in AK (Reisdorph and Mathis, 2013; Evans et al., 2014) as well as in Svalbard (Ericson et al., 2019; Cantoni et al., 2020). Co-occurring corrosive conditions for aragonite (Fig. 4) and undersaturated pCO2 with respect to the atmosphere (Fig. 3) are unique to cold glacial-melt-influenced coastal regions, which likely enables a positive feedback whereby CO2 influx from the atmosphere either enhances or prolongs corrosive summer Ωarag conditions (Evans et al., 2014; Ericson et al., 2019; Cantoni et al., 2020).
4.2 Seasonal drivers
pCO2 variability is determined by thermodynamic and biophysical forcings, the latter being the sum of the physical and biogeochemical influences of vertical mixing, horizontal transport, NCP, sea–air CO2 exchange, and calcification. Seasonal variation in pCO2 reflects the interaction of these terms, which often are competing. For instance, warming and freshwater input have opposing influences on CO2 solubility such that together they can dampen pCO2 variability (Cai et al., 2021; Salisbury and Jönsson, 2018). As described (Sect. S2), the ratio of the seasonal amplitude of pCO2 at Tmean (B; Fig. S4) to the pCO2 T component (T; Fig. S5) provides information on whether biophysical processes or seasonal warming are more important for shaping pCO2 variability within a region. Takahashi et al. (2002) describe this as (or as a difference, T–B; see their Fig. 9), where if (or T–B) is greater than 1 (or positive), seasonal temperature change is the dominant process determining pCO2 variability. The global analysis by Takahashi et al. (2002) suggests that in the area closest to BC and southeast AK, temperature and biophysical processes play equal roles in determining pCO2. A more recent analysis by Fassbender et al. (2018b) produced similar results for the northeast Pacific with balanced roles of temperature and biophysical processes evident closest to the coast. However, both of these analyses were conducted with large global grids that did not resolve the coastal margin and did not differentiate the role of freshwater given the open-ocean focus.
In the nearshore zone spanning BC and southeast AK, it is essential to account for salinity variation when assessing pCO2 variability. As pointed out by Sarmiento and Gruber (2006), variations in pCO2 that result from changes in salinity cannot be evaluated based solely on the salinity sensitivity (Takahashi et al., 1993) because this only accounts for changes in solubility and not the corresponding change in TCO2 and Alk from a decrease in salinity. Instead, the contribution of changes in salinity to the pCO2 variability can be evaluated by incorporating TCO2 and Alk buffer factors into the calculation (Sect. S2). Changes in salinity would result from both freshwater input (decrease) and vertical mixing (increase) and are expressed here as the pCO2 S component (S; Fig. S6). As mentioned, the pCO2 S component and pCO2 T component can be in opposition such that their corresponding influences on pCO2 are counterbalanced (Fig. S7). However, there are times and locations when these factors are not balanced. Lynn Canal (Fig. 1) during the summer months is an important example of an area and time period when salinity variability exceeds the influence of seasonal warming (Fig. 5). Subtracting both the pCO2 S component and the pCO2 T component (TS) from the observed pCO2 leaves remaining variability associated with NCP, calcification, and gas exchange (Fig. S8). Given that calcification is only episodically important in this region and gas exchange is generally slow (on the order of months), this remaining pCO2 variability largely reflects the influence of NCP, or CO2 removal and addition by organic matter production and degradation.
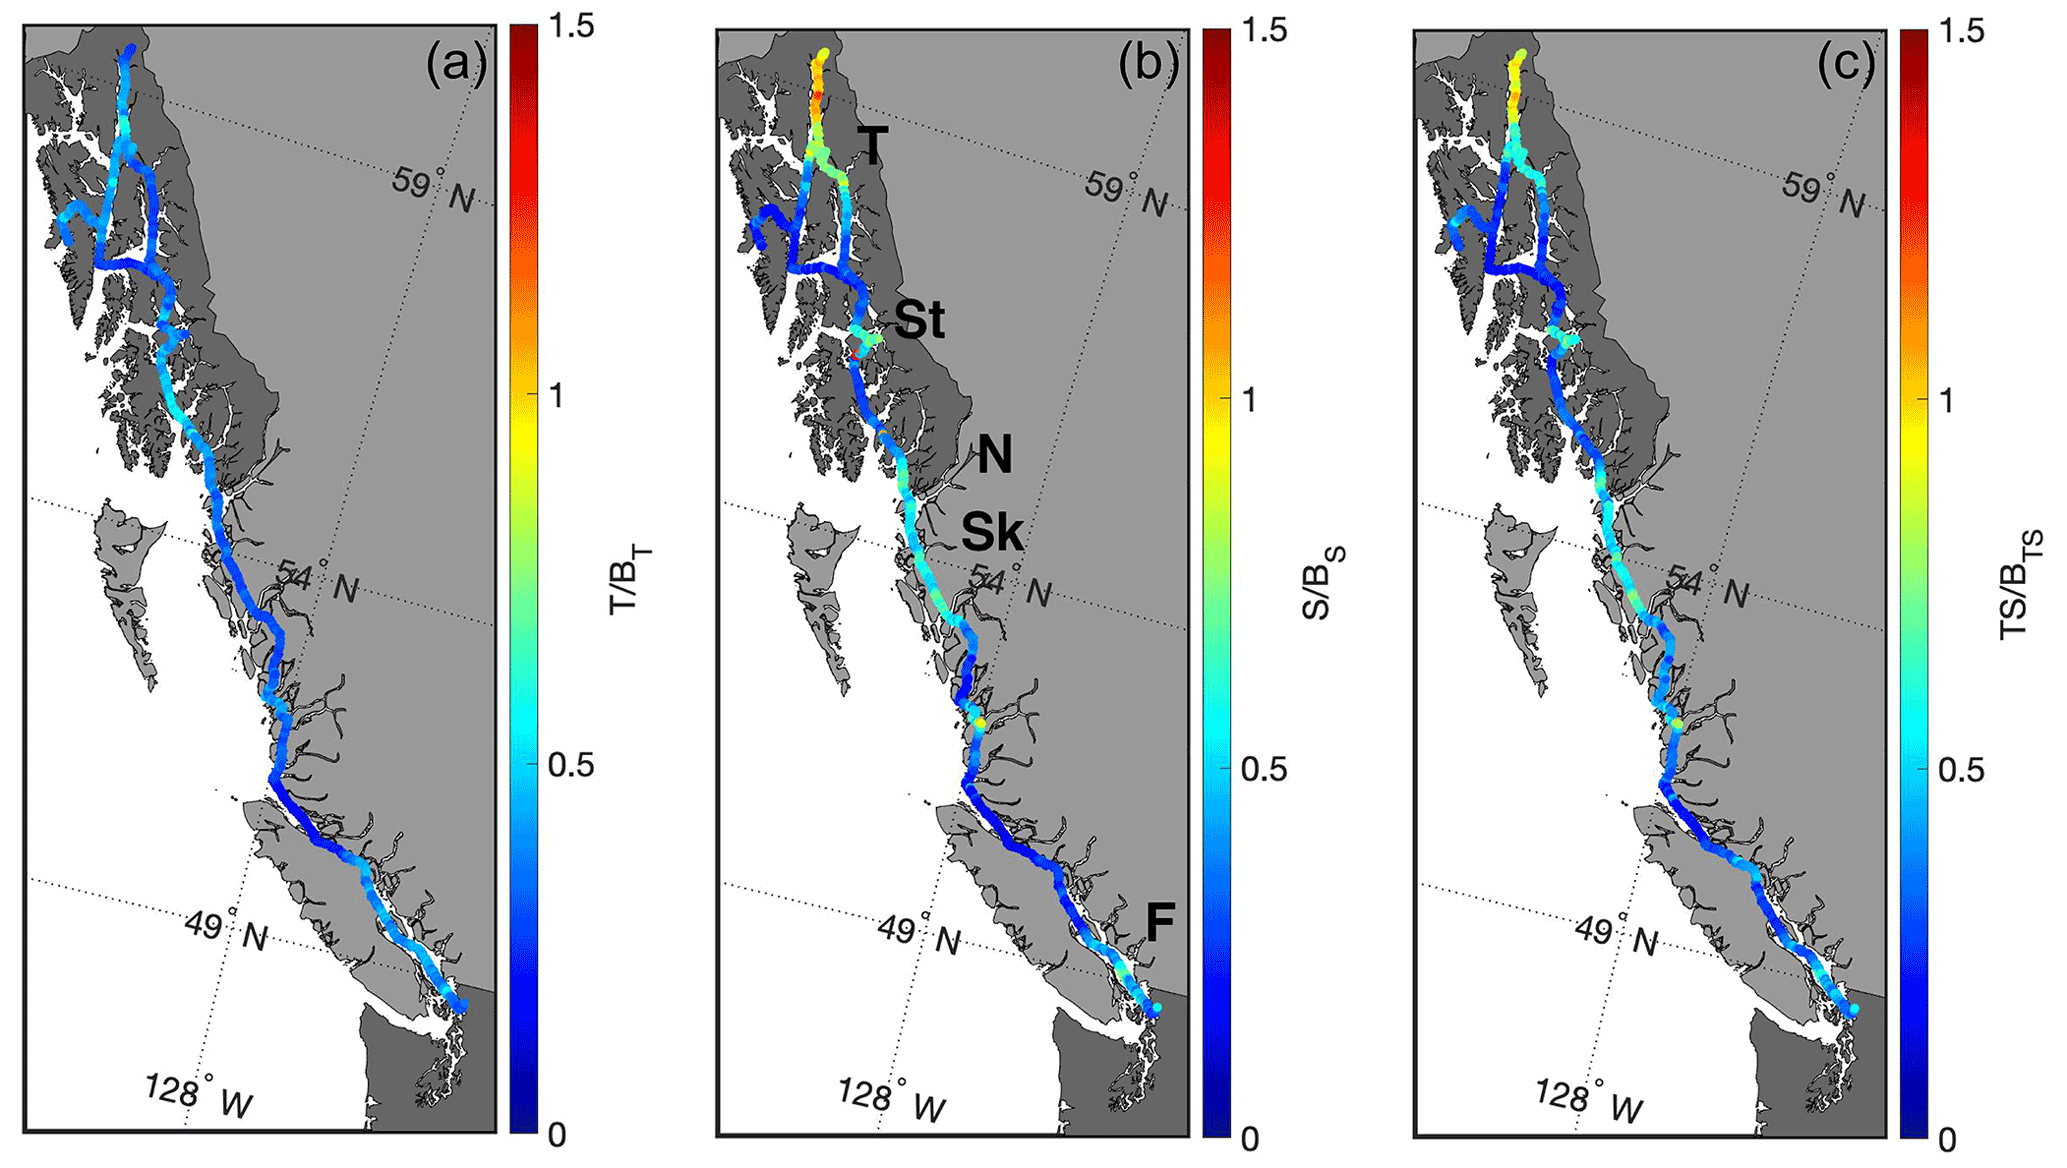
Figure 5Ratios of the seasonal amplitudes of thermodynamic and biophysical drivers of pCO2 variability. (a) The ratio of the amplitude of the temperature component (T) to the amplitude of the remaining biophysical components (BT). (b) The ratio of the amplitude of the salinity component (S) to the amplitude of the remaining biophysical components (BS). Areas with major river outflows are highlighted in this panel (Taku River (T), Stikine River (St), Nass River (N), Skeena River (Sk), and the Fraser River (F)). (c) The ratio of the amplitude of the combined temperature and salinity components (TS) to the amplitude of the remaining biophysical components (BTS).
As illustrated in Fig. 5, the biophysical component dominates over the temperature component in shaping pCO2 variability on an annual basis everywhere along the Inside Passage. Excluding Lynn Canal, the salinity component is also less important than the biophysical component, even in areas adjacent to major river outflows. At the outflows of major rivers, such as the Fraser and Stikine (Fig. 5), the salinity component is an important contributor but still roughly 30 % less than the amplitude of the biophysical component. In Lynn Canal, salinity variance exceeded all other locations along the Inside Passage (Figs. 1 and 2), which resulted in a dominant contribution to the pCO2 variability (Fig. 5). Temperature counterbalanced some of the salinity component in Lynn Canal, such that this was the only area where there was near equivalence between the combined thermodynamic components and the biophysical drivers in determining pCO2. These computations show the spatial complexity in the balance between thermodynamic and biophysical drivers in the nearshore zone and that the influence of salinity must be considered with temperature in settings with significant freshwater input. The importance of salinity in shaping marine CO2 system variability in this region has been discussed previously in modeling studies by Siedlecki et al. (2017) and Hauri et al. (2020), as well as by Pilcher et al. (2016), who evaluated the role of variability in freshwater Alk end-members in enhancing nearshore atmospheric CO2 uptake. However, the contributions of thermodynamic versus biophysical drivers to the observed variability have not been evaluated to the extent shown here, which indicated the dominance of biophysical drivers over most of the Inside Passage.
The northernmost reach of the Inside Passage is heavily influenced by changes in salinity resulting from the volume of glacial melt water entering this area (Neal et al., 2010; Edwards et al., 2020). Reisdorph and Mathis (2013) first described the influence of meltwater on marine CO2 chemistry in this region, and subsequent observational and modeling work has considered the de-coupling that can occur between pCO2 and Ωarag in locales of significant cold glacial melt discharge (Evans et al., 2014; Ericson et al., 2019; Hauri et al., 2020; Cantoni et al., 2020). Given that atmospheric CO2 uptake is promoted in glacially influenced regions, these areas may be important amplifiers of OA (Cantoni et al., 2020; Ericson et al., 2019; Evans et al., 2014). Increasing glacial discharge, changes in glacial meltwater Alk as glaciers further recede and the flow path over land to the ocean increases, increasing glacial river temperatures, and increasing organic matter decomposition in glacial rivers are all factors that would modulate the extremely corrosive conditions found within these nearshore environments, as well as the decoupling between pCO2 and Ωarag. Given the potential for intensifying positive feedback with further increasing atmospheric pCO2 and enhanced sea–air CO2 exchange, thereby amplifying the already extreme Ωarag conditions, additional research effort should target these areas in order to understand which feedbacks dominate from seasonal to inter-annual timescales.
4.3 Characterizing regional extremes
Identifying regional extremes in the marine CO2 system is important for characterizing environmental variability, identifying where unfavorable conditions for vulnerable marine species occur more often or more intensely, and pin-pointing areas that may experience faster rates of change from anthropogenic CO2 input (Feely et al., 2018; Hare et al., 2020). Marine CO2 system extremes were characterized here based on pHT and Ωarag variability and severity (Chan et al., 2017). Importantly, these two descriptors for extremes may not manifest the same way in a region or with the same timing; a region may have severely low pHT but also low variability and experience severely low pHT at a different time of year than in adjacent areas. pHT and Ωarag extremes can also be temporally mismatched within a region.

Figure 6Panels (a–c) show the pHT coefficient of variation (CV), severity, and the timing of severe pHT conditions, respectively. Panels (d–f) show the same parameters for Ωarag.
Extremes, as defined by the variability, were regionally similar for pHT and Ωarag; both the Salish Sea and select areas in southeast AK exhibited large variability relative to other areas along the Inside Passage (Fig. 6). Contrasting these highly variable areas, Johnstone Strait, Sergius Narrows, and Wrangell Narrows (Fig. 1) all had low variability owing to the influence of persistent tidal mixing. Using severity to portray extremes provided a nearly inverse picture, with Johnstone Strait exhibiting both severe pHT and Ωarag, while Lynn Canal had severe Ωarag values but less severe pHT. Notably, Ωarag severity was only above 1 in surface water most exposed to the open northeast Pacific between AK and BC, an area known as Dixon Entrance (Fig. 1), and in Sitka; areas exposed to the open continental shelf generally had less severe and variable pHT and Ωarag compared to more confined waters along the Inside Passage.
There were also differences in the timing of severe pHT and Ωarag conditions across and within regions (Fig. 6). The majority of Inside Passage waters experienced severe pHT and Ωarag between November and February when seawater pCO2 was highest; however, severe conditions occurred in some areas earlier in the year. In Johnstone Strait, most severe pHT and Ωarag occurred in September, whereas most severe pHT and Ωarag conditions occurred in June in areas proximal to the Skeena and Stikine outflows due to the influence of the snowmelt freshet (Fig. 5). In Lynn Canal, most severe Ωarag values were in August coinciding with the peak input of glacial melt and in November for pHT owing to storm-induced vertical mixing. The variation in timing of most severe conditions along the Inside Passage may have regionally distinct biological implications when these coincide with times when more sensitive life stages of vulnerable species are present. In addition, the different characterization of extremes based on variability and severity has potential implications for adaptation trajectories as, for example, vulnerable organisms in Johnstone Strait would experience a sustained corrosive and moderately stable low-pHT environment, whereas in much of southeast AK, vulnerable organisms would be subjected to large swings in marine CO2 system parameters over the year. While some research considers long-term exposure to variable marine CO2 conditions to be a factor enhancing physiological tolerance to OA (Kapsenberg and Cyronak, 2019), other research suggests that organisms living in persistently low-pH environments might be more locally adapted (Chan et al., 2017). Here we provide information on the locations of both of these types of settings such that future work can move to examine how species fare along this gradient within the Inside Passage.
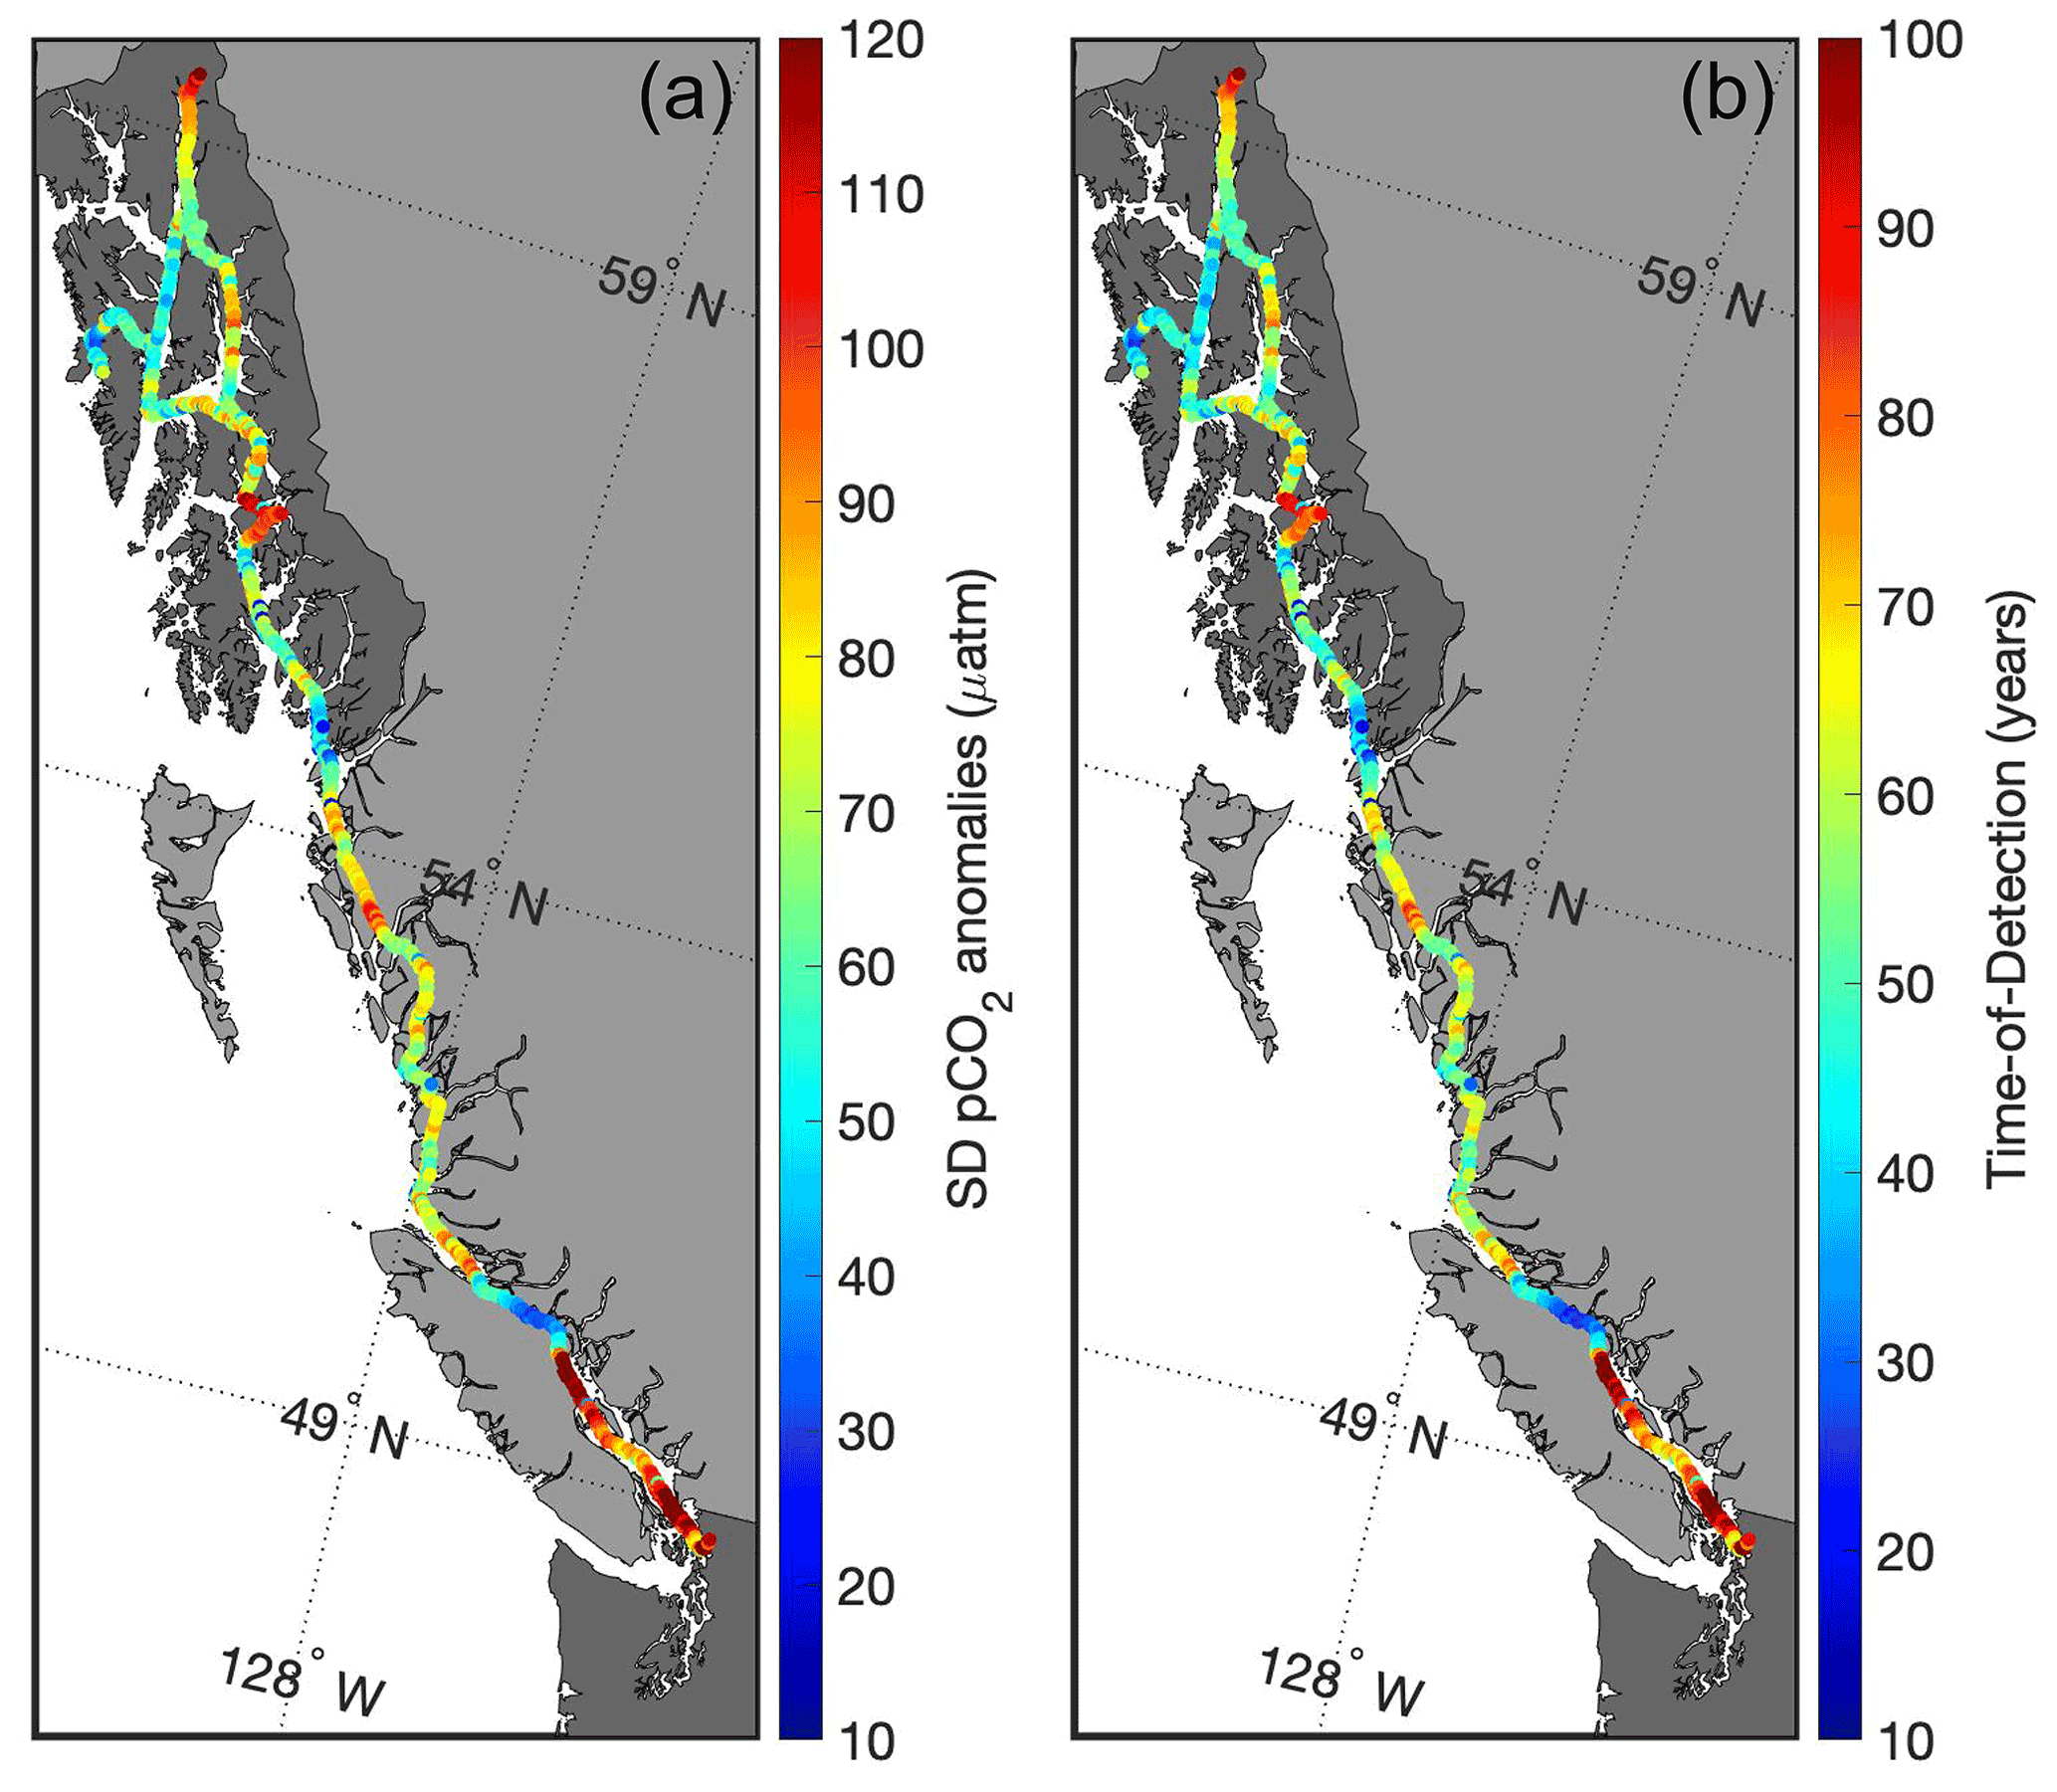
Figure 7Standard deviation of pCO2 anomalies (µatm; a) and the time of detection (years; b) to resolve the secular trend of increasing seawater pCO2 that tracks the contemporary rise in atmospheric CO2.
Characterizing extremes is also useful for guiding observing efforts by identifying locations that either minimize the amount of time anticipated to observe an OA-driven change in the marine CO2 system or capture a key process that may be driving large-amplitude signals in a region (Turk et al., 2019). Areas with low natural variability require fewer years to resolve a secular trend as opposed to regions of high variability (Sutton et al., 2019). Figure 7 shows the standard deviation of de-seasonalized pCO2 observations (anomalies), representing the environmental noise along the Inside Passage, with the resulting ToD (computed following Eq. 1). The Salish Sea, the area near the Stikine River, and the northern portion of Lynn Canal all have very long ToD, and observing efforts in these regions would be better suited for targeting the processes discussed previously that shape the variability. As these processes may themselves be subject to climate change (Bidlack et al., 2021), tracking their evolving influence on marine CO2 system parameters will provide valuable information on the dynamics organisms are subjected to in these highly variable environments. On the other hand, Johnstone Strait, the area south of Ketchikan, and Sergius Narrows all have much shorter ToD (Fig. 7). These areas would be ideal for placing observing assets aimed at resolving long-term secular trends. It is also important to understand that the ToD estimates computed here are “forced” values (Turk et al., 2019), in that they are based on seawater pCO2 increasing at a similar pace to the present atmospheric CO2 increase (Sutton et al., 2019). In some cases, there may be an observed trend in a time series that differs from the forced trend (Laruelle et al., 2018), and this can reflect either the role of other processes independent of anthropogenic CO2 increase that modulates the trend in seawater pCO2 (Turk et al., 2019; Salisbury and Jönsson, 2018) or faster increases in pCO2 resulting from anthropogenic CO2 addition in weakly buffered settings (Feely et al., 2018). Areas, such as Johnstone Strait, with low variability that results in short ToD, and with severe pHT and Ωarag stemming from higher TCO2:Alk ratios and weaker buffering, likely will exhibit faster rates of change than estimated by forced ToD values. Identifying and establishing these areas as sentinel sites for tracking OA would optimize coastal observing efforts aimed at resolving long-term secular trends.
4.4 Estimating past and future conditions
We consider below how the marine CO2 system along the Inside Passage has evolved over the industrial era as well as what additional change might be anticipated if greenhouse gas emissions are reduced to reach the preferable Paris Agreement target of 1.5 ∘C warming (UNFCC, 2015); referred to here as the 1.5 ∘C acidification level. It is important to note that our evaluation is theoretical and only considers the role of anthropogenic CO2 and not the influence of other forcings like increasing temperature or changing freshwater input. Following the approach outlined above, anthropogenic CO2 for Inside Passage surface waters was determined and showed notable spatiotemporal variability (Fig. 8). This variability was strongly influenced by freshwater input and water mass age, of which the latter ranged from 0 to 35 years (Fig. S9). Maximal age estimates were confined to the areas of persistent tidal mixing and were similar to estimates from other studies for the age of upwelled water present on the northeast Pacific continental shelf (Feely et al., 2008; Murray et al., 2015). This agreement is encouraging considering the potential for inaccurately representing OUR in the calculation due to a likely higher oxygen utilization in the confined nearshore regions (Johannessen et al., 2014; Pawlowicz et al., 2007). It is therefore worth considering how inaccurately estimating water mass age translates to uncertainty in anthropogenic CO2 and characterization of preindustrial [H+]T, pHT, and Ωarag. Inaccurate water mass age estimates are more influential in older water masses at the surface and over time periods when atmospheric pCO2 is changing faster (i.e., when computing contemporary ΔTCO2,diseq). Keeping this in mind, we consider how a 50 % uncertainty in the age of surface water in Johnstone Strait impacts our estimation of preindustrial conditions. An overestimate of the age by 50 % results in a lower ΔTCO2,diseq by 11.2 µmol kg−1 and a higher anthropogenic CO2 by 11.6 µmol kg−1. This overestimate adjusts the contemporary [H+]T, pHT, and Ωarag acidification signals (i.e., the difference between contemporary and preindustrial values) by 0.96 nmol kg−1, −0.03, and −0.08, respectively. An underestimate of the age by 50 % would increase ΔTCO2,diseq by 9.6 µmol kg−1 and decrease anthropogenic CO2 by 10 µmol kg−1. The contemporary [H+]T, pHT, and Ωarag acidification signals would adjust by −1.4 nmol kg−1, 0.04, and 0.07, respectively. Despite the presence of variability in the age estimate for Johnstone Strait (Fig. S9), we suggest it is unlikely that the age is underestimated. Rather, this variability is more likely a function of seasonal variation in sub-surface water mass oxygen utilization (Johannessen et al., 2014) and the application of a constant OUR; although, given that the presence of older, upwelled water is seasonal along this coastline (Feely et al., 2016), some variability in the age of surface water masses within persistent tidal mixing zones is expected. We therefore use the absolute values of the shifts in [H+]T, pHT, and Ωarag resulting from an overestimate of the water mass age by 50 % as uncertainty bounds when considering the contemporary and 1.5 ∘C acidification levels.
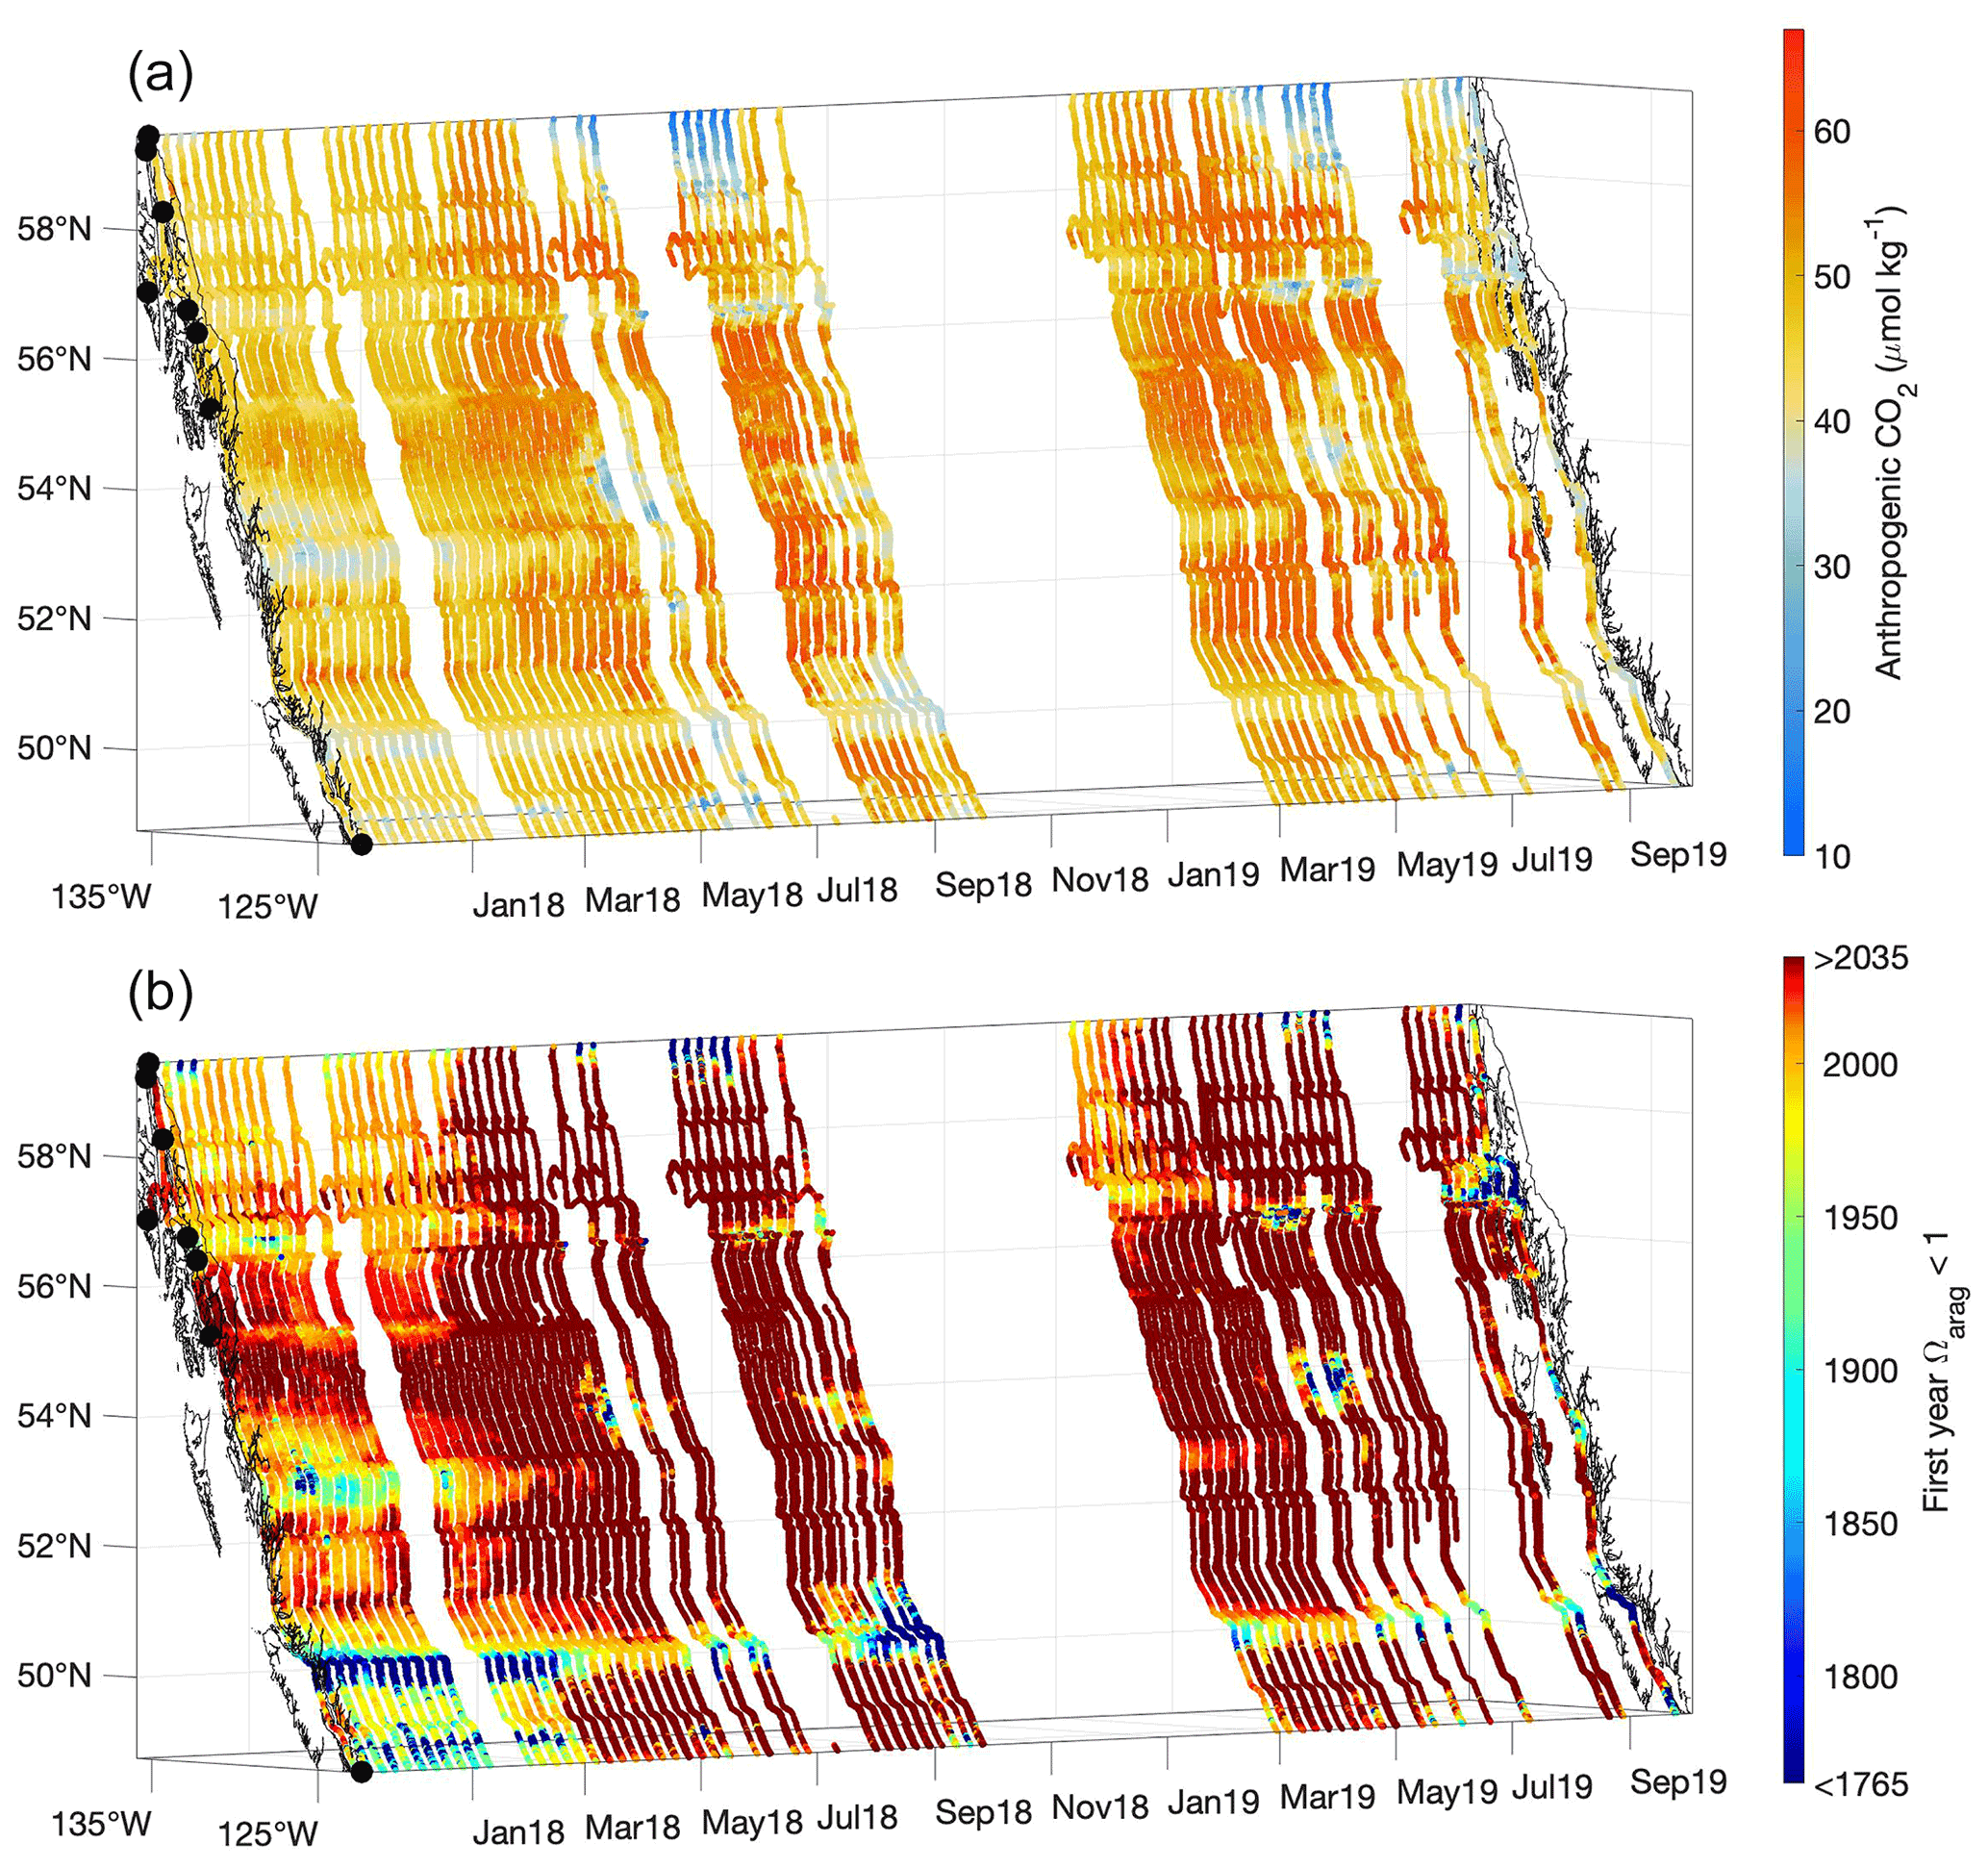
Figure 8Contemporary anthropogenic CO2 content (µmol kg−1; a) and the estimated first year when Ωarag was <1 (b). The x and y axes represent longitude and latitude, respectively, and with the coastline and terminal positions shown as in Fig. 1 and time increasing along the z axis.
Interestingly, areas identified previously as pHT and Ωarag extrema based on severity, due to either persistent tidal mixing or glacial melt input, were not locales containing the highest anthropogenic CO2 content. Instead, the highest values were in regions that experienced the greatest O2 supersaturation and pCO2 drawdown during summer (Figs. 3 and 8). The highest estimated values were near 66 µmol kg−1 and similar to other estimates for coastal northeast Pacific surface water (Carter et al., 2019a; Feely et al., 2016); however, much lower values were evident in some locations. The Salish Sea is considered to have more moderate anthropogenic CO2 levels (Feely et al., 2010; Hare et al., 2020; Evans et al., 2019), but the freshest areas observed in southeast AK exhibited very low anthropogenic CO2 content. Such weakly buffered areas are likely locations that have been corrosive for aragonite prior to the industrial era. To consider this possibility, we estimated the first year when Ωarag was <1 along the Inside Passage (Fig. 8) by calculating the anthropogenic CO2 content accrued each year along with the resulting change in Ωarag over the industrial era. The most weakly buffered areas, either due to being very fresh or because of ventilation of sub-surface water with high TCO2 relative to Alk, are shown by this calculation to have been corrosive at least on a seasonal basis since the start of the industrial era (Fig. 8). These naturally corrosive hot spots are being amplified by anthropogenic CO2 addition such that, for example, Johnstone Strait now experiences under-saturation throughout the year (Fig. 4). The shift to corrosive winter conditions has occurred over more recent decades outside of the mixing zones. Winter surface water in the Salish Sea likely transitioned to Ωarag<1 beginning around 1950, consistent with the emergence of corrosive winter values found in a previous study (Evans et al., 2019). Similar winter transition timing was evident for Inside Passage waters on the central BC coast, although it has appeared more recently within the last few decades over large portions of southeast AK (Fig. 8).
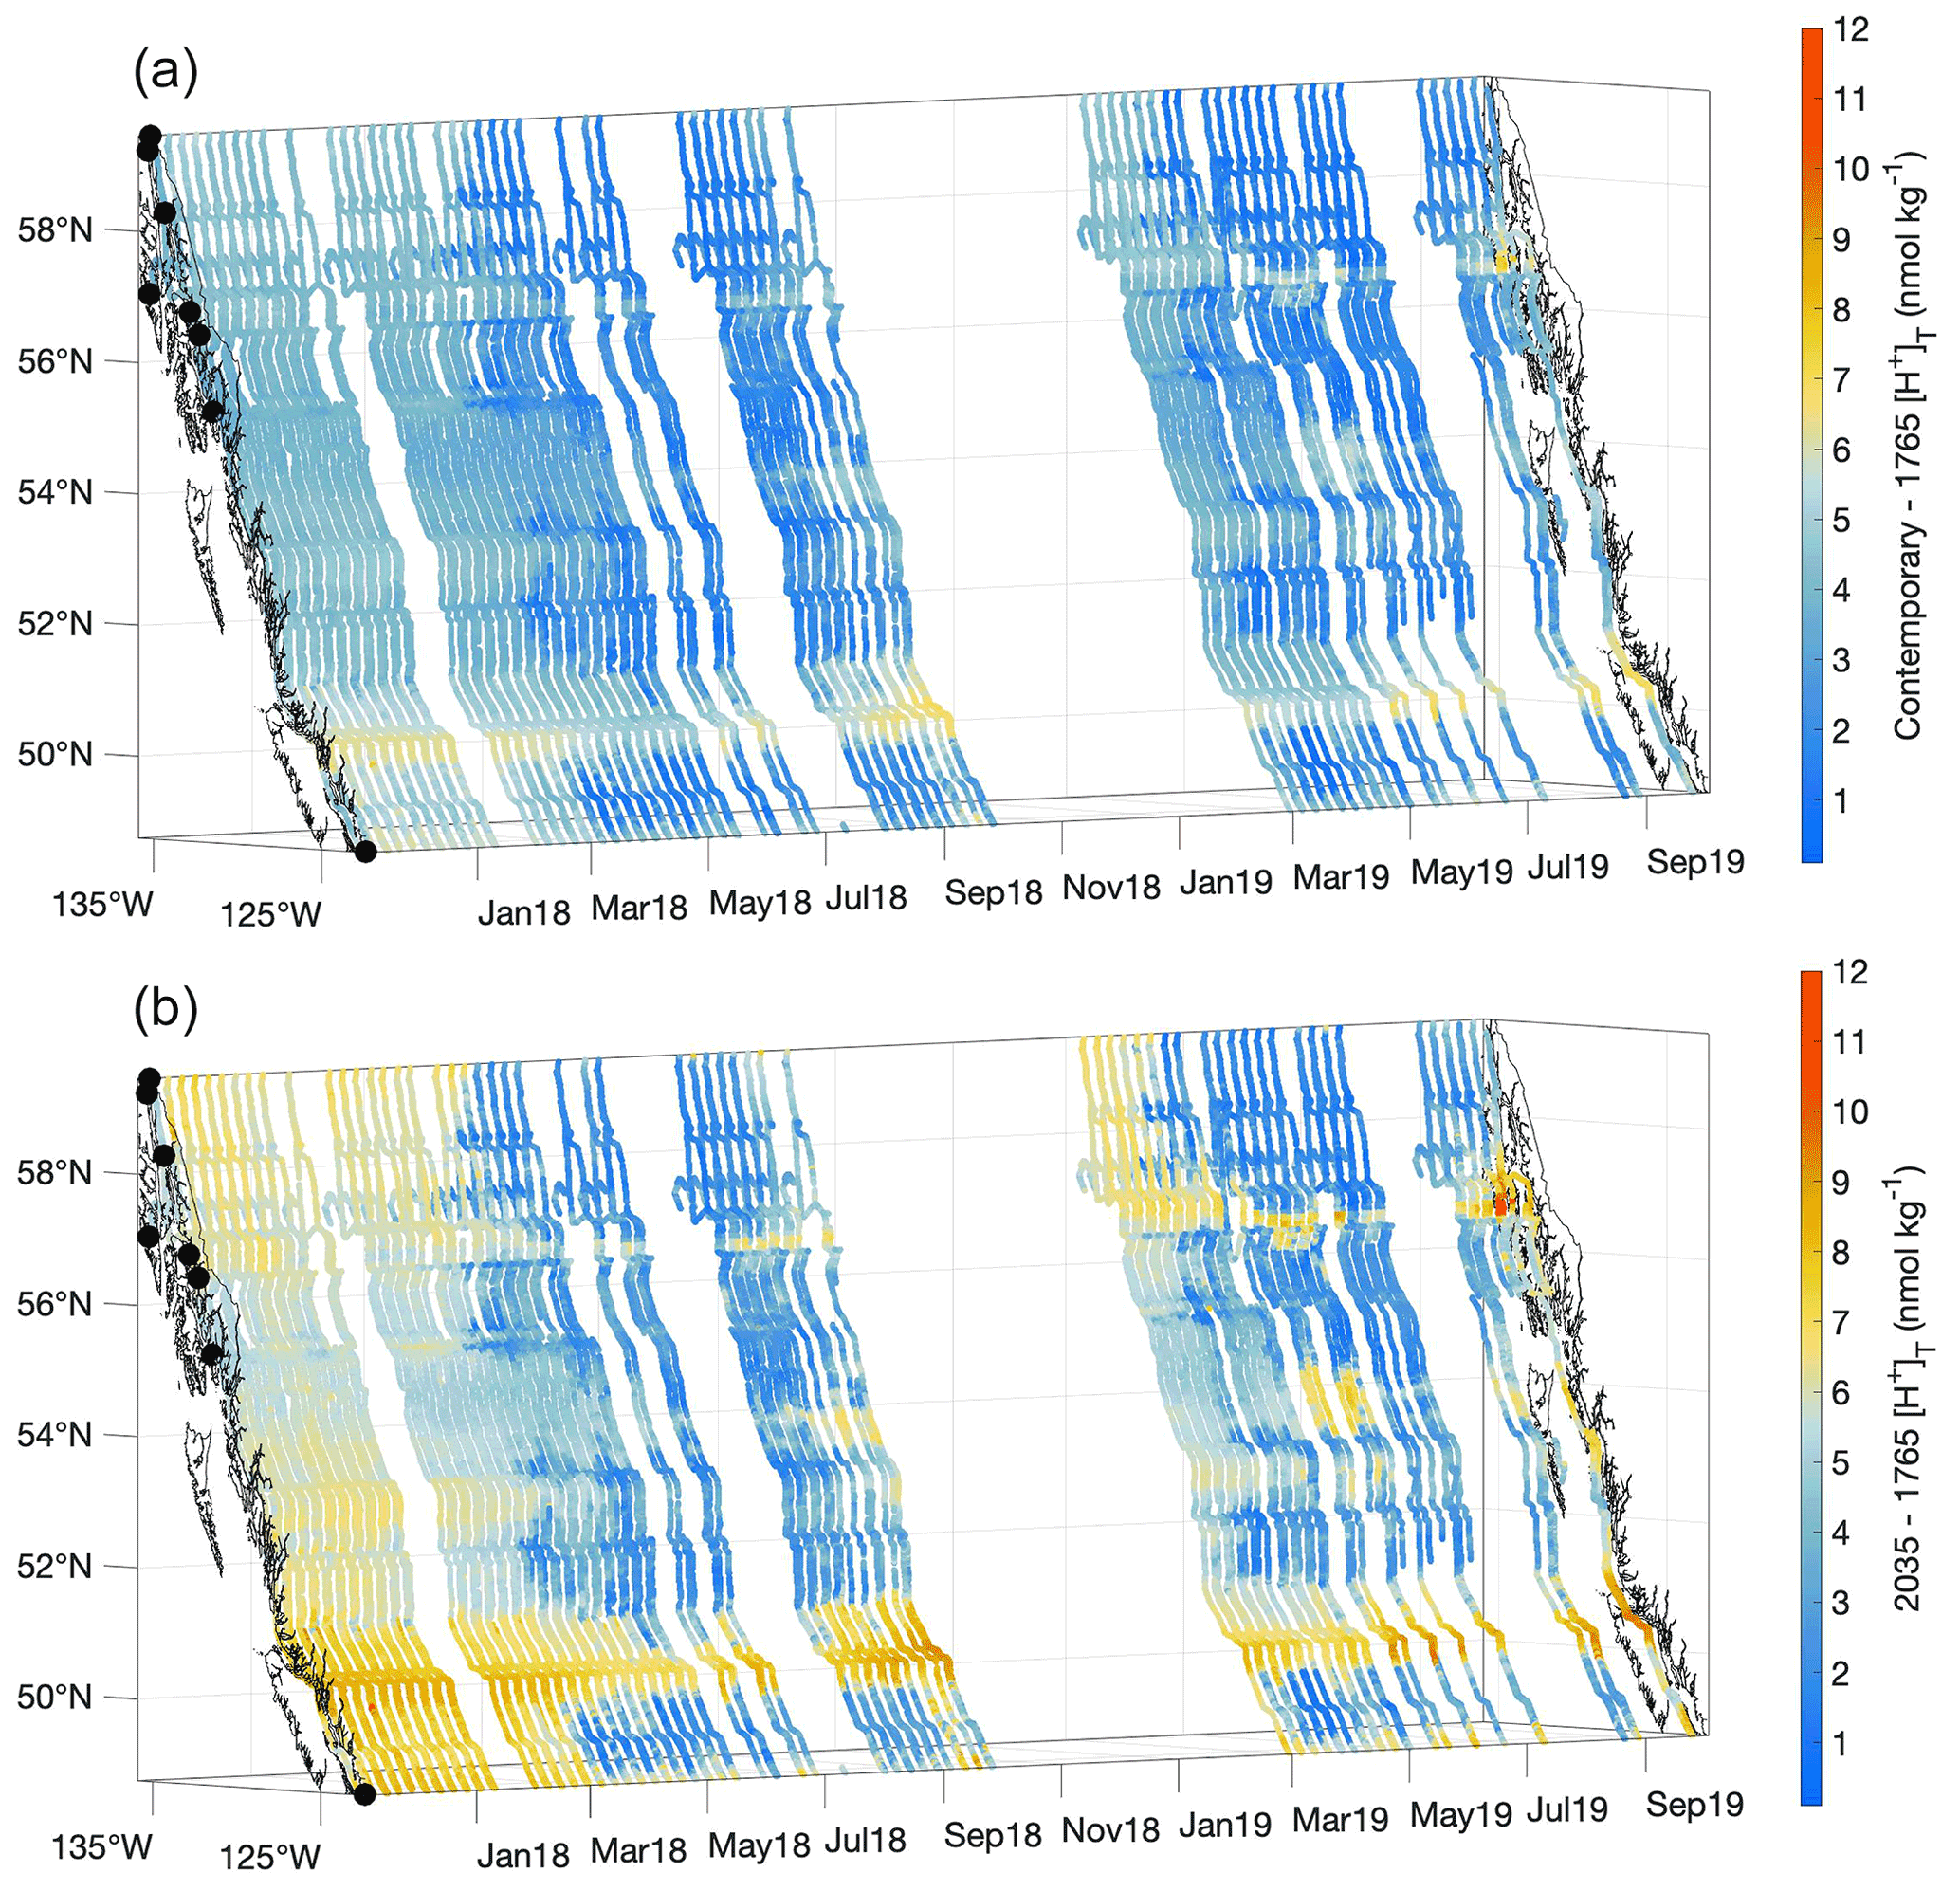
Figure 9Contemporary [H+]T values minus the estimated values for 1765 (nmol kg−1; a) and the estimated values for 2035 minus the 1765 values (nmol kg−1; b). The x and y axes represent longitude and latitude, respectively, and with the coastline and terminal positions shown as in Fig. 1 and time increasing along the z axis.
Matthews et al. (2021) determined the allowable future CO2 emissions that limit global warming to the preferred 1.5 ∘C level stated in the Paris Agreement (UNFCC, 2015), the so-called “remaining carbon budget”, to be 440 GtCO2 from 2020 onwards. Using the relationships described in Friedlingstein et al. (2021), full emission of the remaining carbon budget can be equated to a rise in atmospheric CO2. With 3664 GtCO2 equalling 1 GtC, and every 2124 GtC of emissions increasing atmospheric CO2 by 1 ppm, the remaining carbon budget would drive an increase in atmospheric CO2 of 56 ppm. At 1 atmosphere of pressure, combining the contemporary atmospheric CO2 mole fraction with the remaining carbon-budget-forced atmospheric CO2 increase results in an atmospheric pCO2 of 468 µatm. The time at which this atmospheric pCO2 would be realized is trajectory-dependent, with both the sustainable development pathway (SSP1) and the fossil-fuel development pathway (SSP5) reaching this atmospheric pCO2 level at different times (Meinshausen et al., 2020). SSP5 reaches, and surpasses, this value quickly, by roughly 2035. SSP1 takes longer and reaches this level by 2063. Here we use this atmospheric CO2 target to consider the theoretical 1.5 ∘C acidification level and report the year 2035 as the fastest trajectory following the central estimate for the year when 1.5 ∘C warming would be reached if the current rate of warming continues (IPCC, 2018). However, what is important is that this is an anticipated extent of OA reachable with either trajectory. If our society follows SSP1, this is theoretically the most acidification we should expect without considering amplifying processes. However, if we follow a SSP5-type scenario, acidification will surpass what we estimate below.
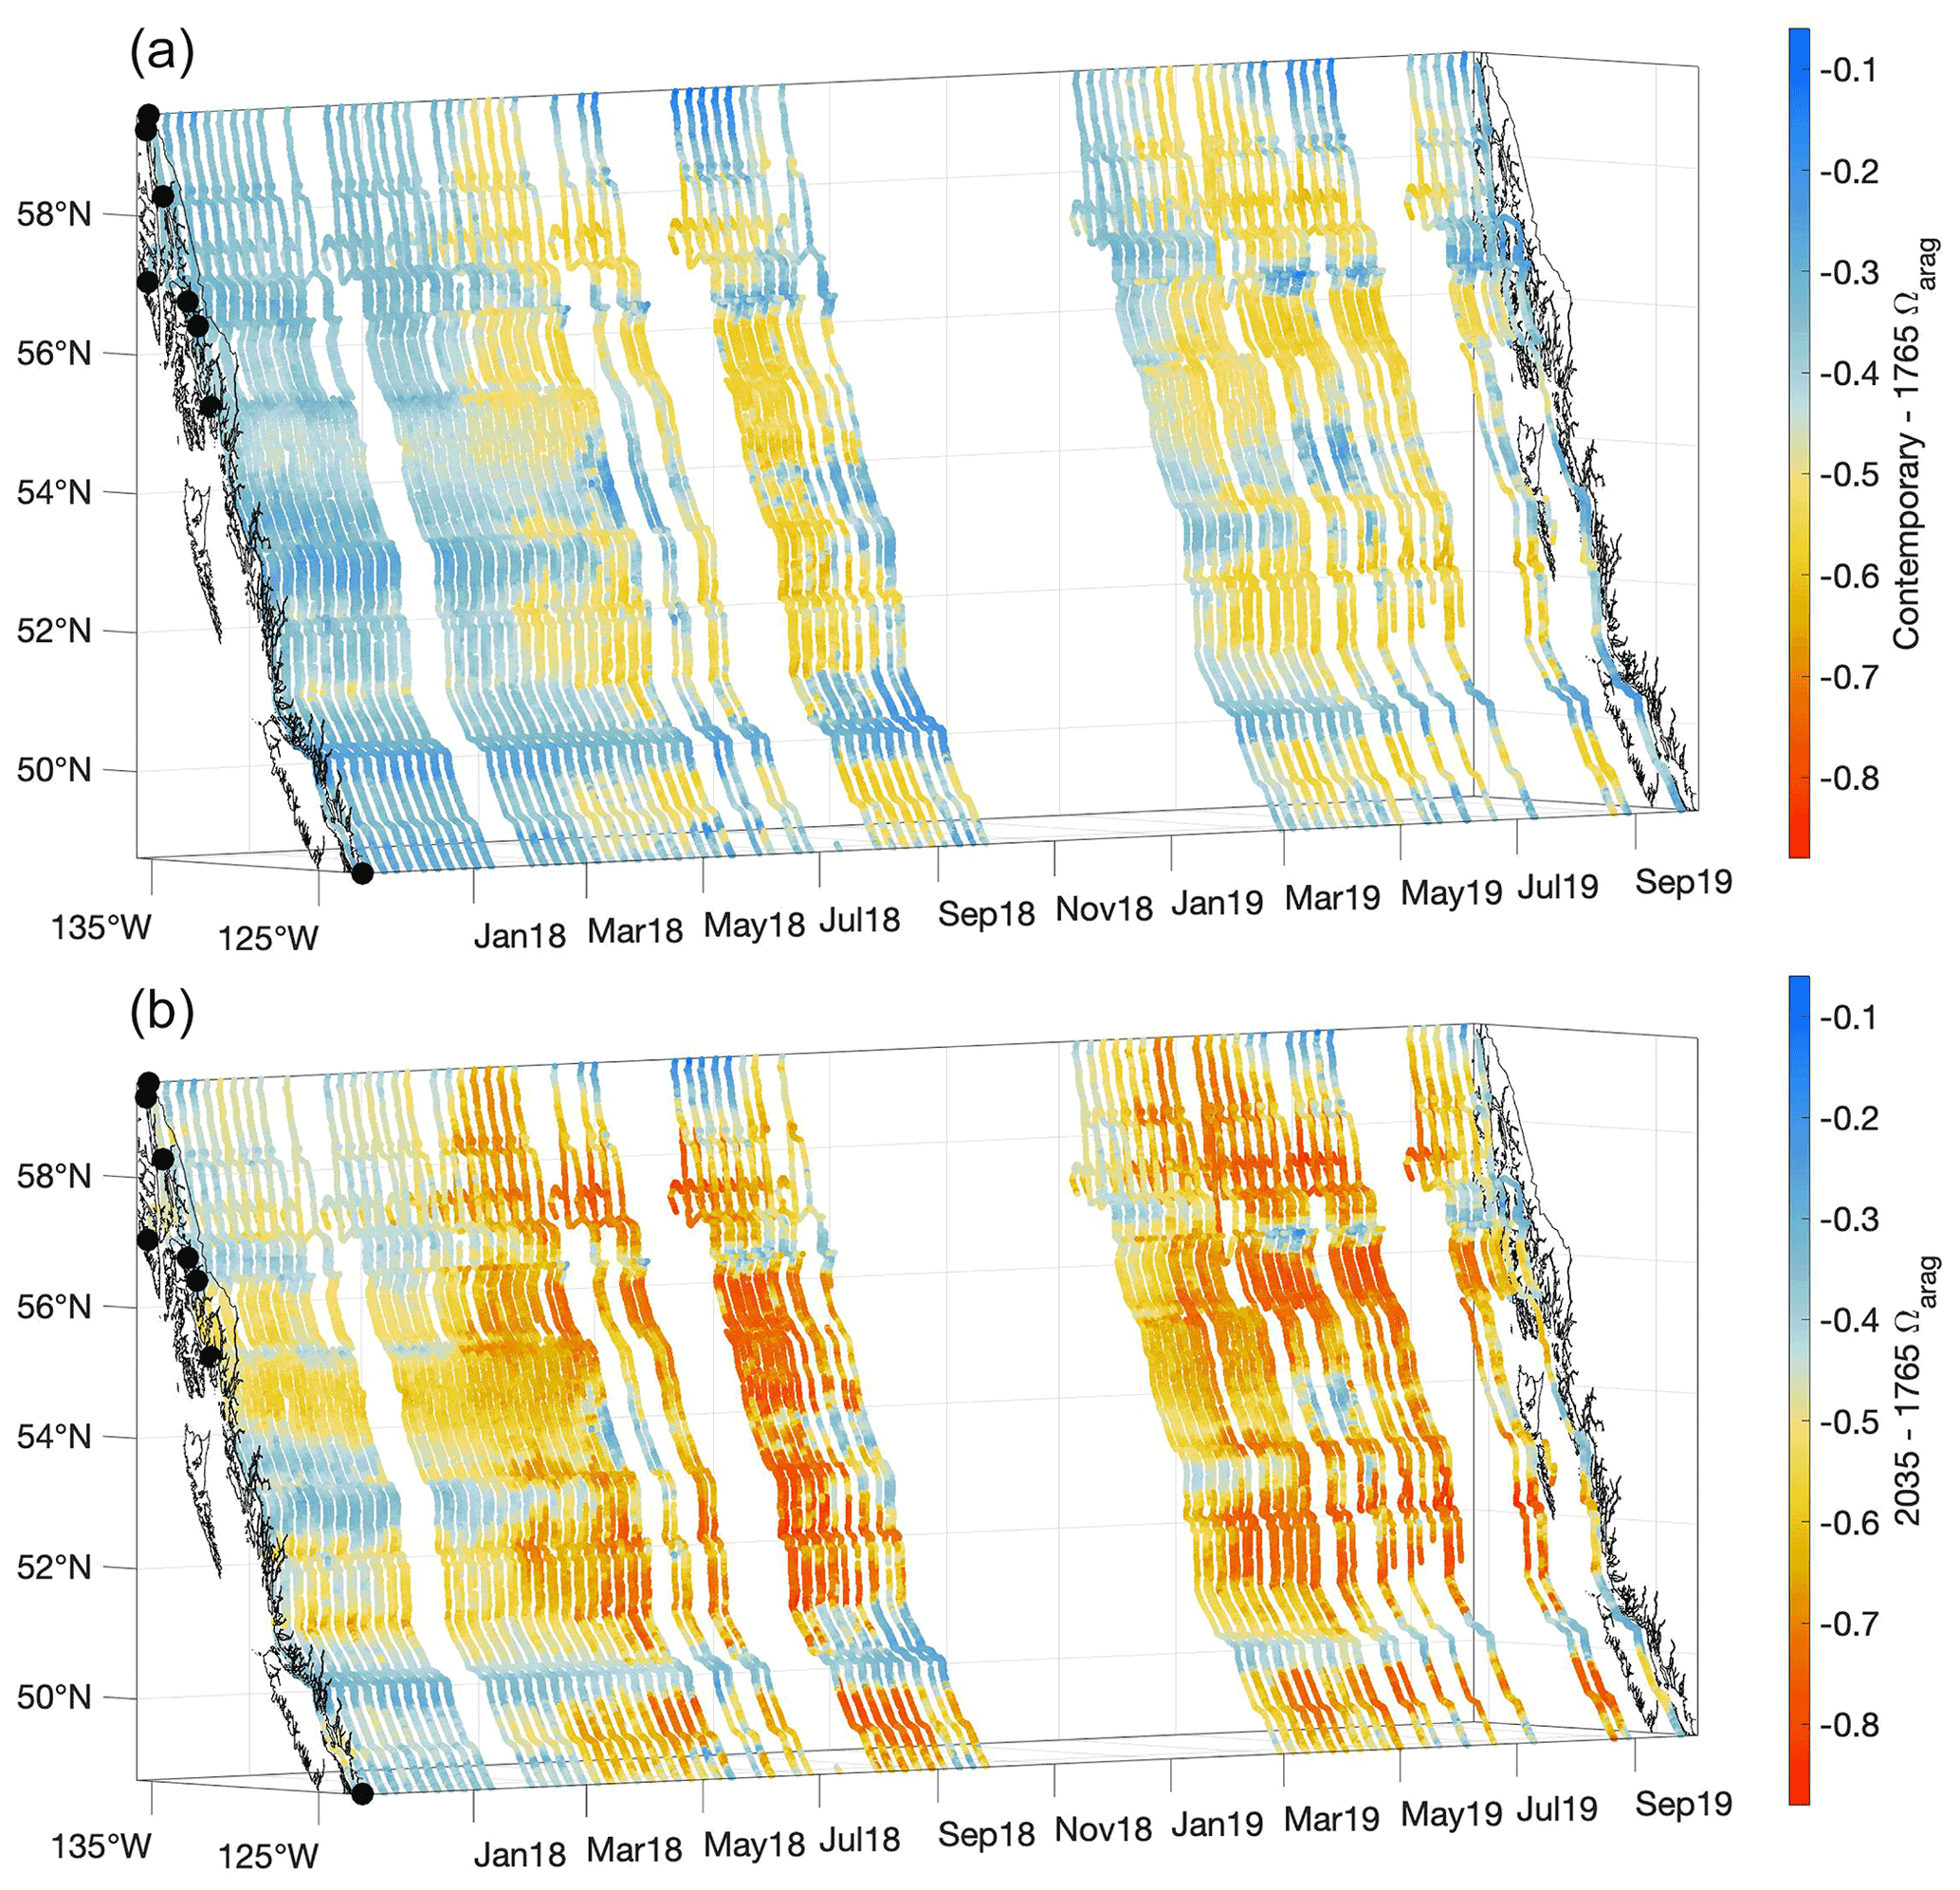
Figure 10The contemporary Ωarag values minus the estimated values for 1765 (a) and the estimated values for 2035 minus the 1765 values (b). The x and y axes represent longitude and latitude, respectively, and with the coastline and terminal positions shown as in Fig. 1 and time increasing along the z axis.
The estimated average percentage increase in [H+]T along the Inside Passage is 40 ± 18 % over the 254 years since the start of the industrial era, although important spatiotemporal variability in acidification was evident (Fig. 9). This average extent of acidification equates to a 0.14 ± 0.02 unit drop in pHT. The Inside Passage average pHT change exceeds the global average (Lauvset et al., 2020; Jiang et al., 2019); however, similar to [H+]T, pHT change varied spatially and temporally with values ranging from −0.06 to −0.20 (Fig. S10). Spatially, [H+]T and pHT change has been greatest in the more weakly buffered and moderately anthropogenic CO2-concentrated waters of the Salish Sea and Johnstone Strait. The largest [H+]T change was evident in Johnstone Strait (Fig. 9), with a maximum near 7 nmol kg−1, due to the inherently lower background pHT level (Fassbender et al., 2021). For comparison, open-ocean surface water has experienced an average [H+]T change of 1.6 nmol kg−1 (Fassbender et al., 2021). The pHT change within these two settings appeared only marginally different, being 0.17 versus 0.1, but with an over 4-fold increase in [H+]T in Johnstone Strait. On a seasonal basis over most of the Inside Passage, and despite a higher anthropogenic CO2 signal during summer (Fig. 8), the change in [H+]T and pHT appeared larger in winter. Note that seasonal variation in the acidification signal exceeded the 0.96 nmol kg−1 and 0.03 [H+]T and pHT uncertainties, respectively. This seasonality in acidification manifests because of seasonal differences in TCO2:Alk ratios (Fig. S11) that alter the CO2 system response to anthropogenic CO2 increase. During winter, the TCO2:Alk ratio is closer to unity such that seawater is more weakly buffered and the percent change in pH following a percentage change in TCO2 has a greater magnitude. Larger percent changes in pCO2 and Ωarag are also expected during this season, and this pattern follows the modeled (Fassbender et al., 2018b; Kwiatkowski and Orr, 2018) and observed (Landschützer et al., 2018) changes in the seasonality of surface marine CO2 parameters at the global scale.
At an atmospheric pCO2 of 468 µatm, an additional 17 ± 7 % increase in [H+]T, on average, would theoretically be expected for the 1.5 ∘C acidification level. This implies that nearly half of the acidification experienced thus far over the industrial era will likely occur over the coming 15 years if society maintains the current emissions trajectory. However, a change in emissions trajectory that follows a sustainable development pathway would enable this acidification signal to occur over a longer period of time. It is anticipated that acidification will be further amplified during winter along the Inside Passage and particularly within the semi-enclosed and more weakly buffered waterways (Fig. 8). Johnstone Strait and the Salish Sea will likely continue to experience the largest changes in [H+]T (Fig. 9), and these areas may serve as bellwethers for the emergence of biological OA impacts in a similar manner as how high-latitude settings are viewed (Fabry et al., 2009). Efforts to examine biological impacts in situ should target these regions where we estimate the largest contemporary and 1.5 ∘C acidification levels. In addition, studies challenging organisms to adverse [H+]T and pHT levels within experimental settings may benefit from our estimates of the 1.5 ∘C acidification level, as these could serve as a near-term treatment for diagnosing OA impacts.
Unlike for pHT, change in Ωarag over the industrial era has a seasonal maximum in summer (Fig. 10). This characteristic can also be explained by considering the seasonality in seawater TCO2 and Alk as well as relative versus absolute changes in Ωarag. Despite the TCO2:Alk ratio being closer to unity during winter, and the percent change in Ωarag following a percentage change in TCO2 being larger during that season (Fig. S11), summer Ωarag values are much higher than winter values (Fig. 4). A 14 % change in an Ωarag value near 1 is a smaller absolute change than a 9 % change in an Ωarag value of 3. Considering the 1.5 ∘C acidification level, the change in summer Ωarag values at times may exceed 0.8 units, consistent with an overall reduction in seasonality as anthropogenic CO2 content continues to increase (Kwiatkowski and Orr, 2018). To our knowledge, differences in the season during which maximum absolute changes in [H+]T and pHT versus Ωarag occur have not been widely acknowledged in the literature and point to the need for careful consideration of the specific marine CO2 system parameter an organism may be most sensitive to (Waldbusser et al., 2014). Seasonally specific changes in the most impactful marine CO2 system parameter for a sensitive species may or may not align with periods of maximal vulnerability (Hales et al., 2016). Considering how the marine CO2 system is being modified by increasing anthropogenic CO2 on a seasonal as well as long-term basis, and which specific variable is most impactful for an organism, are both essential elements for understanding the implications of OA.
Through partnership with the Alaska Marine Highway System, we have reduced the information gap on marine CO2 system variability along the northeast Pacific Inside Passage. This study has documented spatiotemporal variability in surface water along this 1600 km passageway and shown that the dominant mode of temporal variability is the seasonal cycle and that the amplitude of this signal varies spatially and is modulated by the relative influences of tidal mixing, net community production, and the magnitude and character of freshwater input. While this effort advanced our understanding of marine CO2 system variability in this region, winter observations were limited to a single year, and inter-annual variability was not adequately constrained. Enhancing winter observations and further evaluating the magnitude of inter-annual variations are both important next steps for marine CO2 system research in this region.
We have highlighted that within the northernmost area of the Inside Passage, deviations in freshwater end-members from the broader regional alkalinity–salinity relationship and the proportionality between salinity and calcium require further study given the potential for positive feedback with atmospheric CO2 uptake and for modifications in freshwater outflows that can alter the coastal OA signals. The impact of proton-binding organic molecules on the interpretation of alkalinity measurements in this region is also a large unknown. Analysis of seasonal drivers indicated that the biophysical component has a dominant role in shaping variability along most of the Inside Passage but that the combined influences of temperature and salinity balance the biophysical component in glacial-melt-impacted areas of southeast AK where these uncertainties are expected to be the largest. Further research along these lines will be valuable for the research community striving to understand marine CO2 system patterns in areas exhibiting large-amplitude variation in salinity.
We considered the characterization of pHT and Ωarag extremes and recognized that there are regional differences in the manifestation of extremes based on variability versus severity that likely have biological implications. Vulnerable organisms experiencing a sustained corrosive and moderately stable low-pHT environment may have a differing adaptation trajectory than organisms subjected to large swings in marine CO2 system parameters over the year. Our diagnosis of these locations should be useful for future studies examining organismal and ecosystem adaptation trajectories within the context of OA. We also used our variability assessment to determine the time of detection and point out that this information can help optimize coastal observing efforts aimed at establishing sentinel sites to resolve long-term secular trends or further evaluating the drivers of large-amplitude variability.
Finally, we estimated the anthropogenic CO2 content in surface water and considered change over the industrial era and to an atmospheric CO2 level that corresponds with the exhaustion of the remaining 1.5 ∘C carbon budget. It was shown that some areas, including the tidally mixed Johnstone Strait and within Lynn Canal, have likely experienced seasonal Ωarag values <1 over the entire industrial era. Other areas have transitioned to winter Ωarag values <1 more recently. Seasonal differences were also identified in the absolute changes in [H+]T, pHT, and Ωarag. Absolute [H+]T and pHT changes appeared larger during winter when conditions are more weakly buffered while Ωarag change was greater during summer. This difference should be a consideration when evaluating biological OA impacts. Looking to the future, the theoretical 1.5 ∘C acidification level suggests that significant marine CO2 system changes may develop over the coming 15 years if society continues on a fossil-fuel development emissions trajectory. These estimates of the 1.5 ∘C acidification level should be useful as a near-term treatment for regional challenge studies aiming to diagnose species responses to OA. Time series observations must be expanded and maintained along the Inside Passage to determine if the 1.5 ∘C acidification level is realized to the extent suggested by this study.
MATLAB routines developed as part of this study are available upon request to the corresponding author.
Three datasets were generated through this study: (1) the record of directly measured surface pCO2, (2) the gap-filled pCO2 record including measurements of pH from the BGC-SUMO, and (3) the measurements of TCO2 and pCO2 on discrete samples collected during the ferry ride-along cruises. The directly measured surface pCO2 record can be found within the Surface Ocean CO2 Atlas data holdings (https://www.socat.info/) as well as within the Ocean Carbon and Acidification Data Portal at the National Centers for Environmental Information (https://doi.org/10.25921/jq11-2268, Evans et al., 2020). The gap-filled pCO2 record including BGC-SUMO pH data can be found with the discrete sample dataset in the Hakai Institute's data portal (https://doi.org/10.21966/m0es-7520, Evans et al., 2021).
The supplement related to this article is available online at: https://doi.org/10.5194/bg-19-1277-2022-supplement.
WE and AB procured State of Alaska Department of Transportation approval for the equipment installation aboard the M/V Columbia and the funding for this project. WE, GTL, and CDH oversaw the installation and operation of the GO8050 pCO2 Monitoring System and ancillary sensors. YT, WE, and CDH oversaw the installation and operation of the BGC-SUMO. WE participated in ride-along cruises and collected discrete samples for validation. WE conducted the analysis and wrote the manuscript. All authors contributing to revising and editing the manuscript for submission.
The contact author has declared that neither they nor their co-authors have any competing interests.
Publisher’s note: Copernicus Publications remains neutral with regard to jurisdictional claims in published maps and institutional affiliations. Furthermore, nothing in this report is endorsed by or reflects the views of the State of Alaska Department of Transportation and Public Facilities.
We gratefully acknowledge funding support from the Alaska Ocean Observing System, the Alaska Coastal Rainforest Center at the University of Alaska Southeast, and the Tula Foundation. Yuichiro Takeshita, and work at the Monterey Bay Aquarium Research Institute, was supported by the David and Lucile Packard Foundation and NSF OCE-1736864. This project was made possible through partnership with the State of Alaska Department of Transportation, and we thank the crew of the M/V Columbia, who helped to maintain the integrity of the dataset. We also thank Katie Pocock and Carrie Weekes for processing the discrete samples used to assess the regional Alk–salinity relationship. We are grateful for the constructive comments from Andrea Fassbender and the two anonymous reviewers that have helped to improve this contribution. This is PMEL contribution number 5298 and CICOES contribution number 2021-1157.
This project was not supported by specific awards but by agency contributions. Specifically, funding contributions from the Tula Foundation, the Alaska Ocean Observing System, and the Alaska Coastal Rainforest Center allowed for infrastructure to be purchased and used for this project.
This paper was edited by Jack Middelburg and reviewed by two anonymous referees.
Amaya, D. J., Miller, A. J., Xie, S.-P., and Kosaka, Y.: Physical drivers of the summer 2019 North Pacific marine heatwave, Nat. Commun., 11, 1903, https://doi.org/10.1038/s41467-41020-15820-w, 2020.
Asplund, M. E., Baden, S. P., Russ, S., Ellis, R. P., Gong, N., and Hernroth, B. E.: Ocean acidification and host-pathogen interactions: blue mussels, Mytilus edulis, encountering Vibrio tubiashii, Environ. Microbiol., 16, 1029–1039, 2013.
Barton, A., Hales, B., Waldbusser, G., Langdon, C., and Feely, R. A.: The Pacific oyster, Crassostrea gigas, shows negative correlation to naturally elevated carbon dioxide levels: Implications for near-term ocean acidification effects, Limnol. Oceanogr., 57, 698–710, 2012.
Barton, A., Waldbusser, G. G., Feely, R. A., Weisberg, S. B., Newton, J. A., Hales, B., Cudd, S., Eudeline, B., Langdon, C. J., Jefferds, I., King, T., Suhrbier, A., and McLaughlin, K.: Impacts of coastal acidification on the Pacific Northwest shellfish industry and adaptation strategies implemented in response, Oceanography, 28, 146–159, 2015.
Bates, N. R., Astor, Y. M., Church, M. J., Currie, K., Dore, J. E., Gonzalez-Davila, M., Lorenzoni, L., Muller-Karger, F., Olafsson, J., and Santana-Casiano, J. M.: A time-series view of changing ocean chemistry due to ocean uptake of anthropogenic CO2 and ocean acidification, Oceanography, 27, 126–141, https://doi.org/10.5670/oceanog.2014.16, 2014.
Beamer, J. P., Hill, D. F., Arendt, A., and Liston, G. E.: High-resolution modeling of coastal freshwater discharge and glacier mass balance in the Gulf of Alaska watershed, Water Resour. Res., 52, 3888–3909, https://doi.org/10.1002/2015WR018457, 2016.
Beckwith, S. T., Byrne, R. H., and Hallock, P.: Riverine Calcium End-Members Improve Coastal Saturation State Calculations and Reveal Regionally Variable Calcification Potential, Front. Mar. Sci., 6, 169, https://doi.org/10.3389/fmars.2019.00169, 2019.
Bednarsek, N., Feely, R. A., Tolimieri, N., Hermann, A. J., Siedlecki, S. A., Waldbusser, G. G., McElhany, P., Alin, S. R., Klinger, T., Moore-Maley, B., and Pörtner, H. O.: Exposure history determines pteropod vulnerability to ocean acidification along the US West Coast, Sci. Rep., 7, 4526, https://doi.org/10.1038/s41598-41017-03934-z, 2017.
Bednarsek, N., Feely, R. A., Beck, M. W., Alin, S., Siedlecki, S., Calosi, P., Norton, E. C., Saenger, C., Štrus, J., Greeley, D., Nezlin, N. P., Roethler, M., and Spicer, J. I.: Exoskeleton dissolution with mechanoreceptor damage in larval Dungeness crab related to severity of present-day ocean acidification vertical gradients, Sci. Total Environ., 716, 136610, https://doi.org/10.1016/j.scitotenv.2020.136610, 2020.
Bednarsek, N., Newton, J. A., Beck, M. W., Alin, S. R., Feely, R. A., Christman, N. R., and Klinger, T.: Severe biological effects under present-day estuarine acidification in the seasonally variable Salish Sea, Sci. Total Environ., 765, 142689, https://doi.org/10.1016/j.scitotenv.2020.142689, 2021.
Berger, H. M., Siedlecki, S. A., Matassa, C. M., Alin, S. R., Kaplan, I. C., Hodgson, E. E., Pilcher, D. J., Norton, E. C., and Newton, J. A.: Seasonality and Life History Complexity Determine Vulnerability of Dungeness Crab to Multiple Climate Stressors, AGU Adv., 2, e2021AV000456, https://doi.org/10.1029/2021AV000456, 2021.
Bidlack, A. L., Bisbing, S. M., Buma, B. J., Diefenderfer, H. L., Fellman, J. B., Floyd, W. C., Giesbrecht, I., Lally, A., Lertzman, K. P., Perakis, S. S., Butman, D. E., D'Amore, D. V., Fleming, S. W., Hood, E. W., Hunt, B. P. V., Kiffney, P. M., McNicol, G., Menounos, B., and Tank, S. E.: Climate-Mediated Changes to Linked Terrestrial and Marine Ecosystems across the Northeast Pacific Coastal Temperatre Rainforest Margin, BioScience, 71, biaa171, doi.org/10.1093/biosci/biaa1171, 2021.
Bittig, H. C., Körtzinger, A., Neill, C., van Ooijen, E., Plant, J. N., Hahn, J., Johnson, K. S., Yang, B., and Emerson, S. R.: Oxygen Optode Sensors: Principle, Characterization, Calibration, and Application in the Ocean, Front. Mar. Sci., 4, 429, https://doi.org/10.3389/fmars.2017.00429, 2018.
Bond, N. A., Cronin, M. F., Freeland, H., and Mantua, N.: Causes and impacts of the 2014 warm anomaly in the NE Pacific, Geophys. Res. Lett., 42, 3414–3420, https://doi.org/10.1002/2015GL063306, 2015.
Cai, W. J., Xu, Y.-Y., Feely, R. A., Wanninkhof, R., Jönsson, B. F., Alin, S. R., Barbero, L., Cross, J. N., Azetsu-Scott, K., Fassbender, A. J., Carter, B. R., Jiang, L.-Q., Pepin, P., Chen, B., Hussain, N., Reimer, J. J., Xue, L., Salisbury, J. E., Martín Hernández-Ayón, J., Langdon, C., Li, Q., Sutton, A. J., Chen, C.-T. A., and Gledhill, D. K.: Controls on surface water carbonate chemistry along North American ocean margins, Nat. Commun., 11, 2691, https://doi.org/10.1038/s41467-41020-16530-z, 2020.
Cai, W. J., Feely, R. A., Testa, J. M., Li, M., Evans, W., Alin, S. R., Xu, Y.-Y., Pelletier, G., Ahmed, A., Greeley, D. J., Newton, J. A., and Bednarsek, N.: Natural and Anthropogenic Drivers of Acidification in Large Estuaries, Annu. Rev. Mar. Sci., 13, 11–33, 2021.
Caldeira, K. and Wickett, M. E.: Anthropogenic carbon and ocean pH, Nature, 425, 365, https://doi.org/10.1038/425365a, 2003.
Cantoni, C., Hopwood, M. J., Clarke, J. S., Chiggiato, J., Achterberg, E. P., and Cozzi, S.: Glacial drivers of marine biogeochemistry indicate a future shift to more corrosive conditions in an Arctic fjord, J. Geophys. Res.-Biogeo., 125, e2020JG005633, https://doi.org/10.1029/2020JG005633, 2020.
Carter, B. R., Feely, R. A., Wanninkhof, R., Kouketsu, S., Sonnerup, R. E., Pardo, P. C., Sabine, C. L., Johnson, G. C., Sloyan, B. M., Murata, A., Mecking, S., Tilbrook, B., Speer, K., Talley, L. D., Millero, F. J., Wijffels, S. E., Macdonald, A. M., Gruber, N., and Bullister, J. L.: Pacific Anthropogenic Carbon Between 1991 and 2017, Global Biogeochem. Cy., 33, 597–617, 2019a.
Carter, B. R., Williams, N. L., Evans, W., Fassbender, A. J., Barbero, L., Hauri, C., Feely, R. A., and Sutton, A. J.: Time-of-detection as a metric for prioritizing between climate observation quality, frequency, and duration, Geophys. Res. Lett., 46, 3853–3861, https://doi.org/10.1029/2018GL080773, 2019b.
Chan, F., Barth, J. A., Blanchette, C. A., Byrne, R. H., Chavez, F. P., Cheriton, O., Feely, R. A., Friederich, G., Gaylord, B., Gouchier, T., Hacker, S., Hill, T., Hofmann, G., McManus, M. A., Menge, B. A., Nielsen, K. J., Russell, A., Sanford, E., Sevadjian, J., and Washburn, L.: Persistent spatial structuring of coastal ocean acidification in the California Current System, Sci. Rep., 7, 2526, https://doi.org/10.1038/s41598-41017-02777-y, 2017.
Dai, A. and Trenberth, K. E.: Estimates of Freshwater Discharge from Continents: Latitudinal and Seasonal Variations, J. Hydrometeorol., 3, 660–687, 2002.
Dickson, A., Wesolowski, D. J., Palmer, D. A., and Mesmer, R. E.: Dissociation constant of bisulfate ion in aqueous sodium chloride solutions at 250 ∘C, J. Phys. Chem. 94, 7978–7985, https://doi.org/10.1021/j100383a042, 1990.
Doney, S. C., Fabry, V. J., Feely, R. A., and Kleypas, J. A.: Ocean Acidification: The Other CO2 Problem, Annu. Rev. Mar. Sci., 1, 169–192, 2009.
Doney, S. C., Busch, D. S., Cooley, S. R., and Kroeker, K. J.: The Impacts of Ocean Acidification on Marine Ecosystems and Relient Human Communities Annual Review of Environment and Resources, Annu. Rev., 45, 83–112, https://doi.org/10.1146/annurev-environ-012320-083019, 2020.
Dosser, H. V., Waterman, S., Jackson, J. M., Hannah, C. G., Evans, W., and Hunt, B. P. V.: Stark Physical and Biogeochemical Differences and Implications for Ecosystem Stressors in the Northeast Pacific Coastal Ocean, J. Geophys. Res.-Oceans, 126, e2020JC017033, 2021.
Edwards, R. T., D'Amore, D. V., Biles, F. E., Fellman, J. B., Hood, E., Trubilowicz, J. W., and Floyd, W. C.: Riverine Dissolved Organic Carbon and Freshwater Export in the Eastern Gulf of Alaska, J. Geophys. Res.-Biogeo., 126, e2020JG005725, https://doi.org/10.1029/2020JG005725, 2020.
Ekstrom, J. A., Suatoni, L., Cooley, S. R., Pendleton, L. H., Waldbusser, G. G., Cinner, J. E., Ritter, J., Langdon, C., van Hooidonk, R., Gledhill, D., Wellman, K., Beck, M. W., Brander, L. M., Rittschof, D., Doherty, C., Edwards, P. E. T., and Portela, R.: Vulnerability and adaptation of US shellfisheries to ocean acidification, Nat. Clim. Change, 5, 207–214, https://doi.org/10.1038/nclimate2508, 2015.
Ericson, Y., Falck, E., Chierici, M., Fransson, A., and Kristiansen, S.: Marine CO2 system variability in a high arctic tidewater-glacier fjord system, Tempeljorden, Svalbard, Cont. Shelf Res., 181, 1–13, 2019.
Evans, W., Hales, B., Strutton, P. G., and Ianson, D.: Sea-air CO2 fluxes in the western Canadian coastal ocean, Prog. Oceanogr., 101, 78–91, https://doi.org/10.1016/j.pocean.2012.1001.1003, 2012.
Evans, W. and Mathis, J. T.: The Gulf of Alaska coastal ocean as an atmospheric CO2 sink, Cont. Shelf Res., 65, 52–63, 2013.
Evans, W., Mathis, J. T., and Cross, J. N.: Calcium carbonate corrosivity in an Alaskan inland sea, Biogeosciences, 11, 365–379, https://doi.org/10.5194/bg-11-365-2014, 2014.
Evans, W., Mathis, J. T., Ramsay, J., and Hetrick, J.: On the Frontline: Tracking Ocean Acidification in an Alaskan Shellfish Hatchery, PLoS One, 10, e0130384, https://doi.org/10.1371/journal.pone.0130384, 2015.
Evans, W., Pocock, K., Hare, A., Weekes, C., Hales, B., Jackson, J., Gurney-Smith, H., Mathis, J. T., Alin, S. R., and Feely, R. A.: Marine CO2 Patterns in the Northern Salish Sea, Front. Mar. Sci., 5, 536, https://doi.org/10.3389/fmars.2018.00536, 2019.
Evans, W. and Lebon, G. T., Harrington, C. D., and Bidlack, A.: Surface underway measurements partial pressure of carbon dioxide (pCO2) in the water and atmosphere, sea surface salinity, sea surface temperature, oxygen and other parameters during the Alaska Marine Highway System M/V Columbia 135 service route transits along British Columbia coast, southeast Alaska coast, Gulf of Alaska and North Pacific Ocean from 2017-10-26 to 2019-10-04 (NCEI Accession 0209049), [indicate subset used], NOAA National Centers for Environmental Information, [data set] https://doi.org/10.25921/jq11-2268, 2020.
Evans, W., Lebon, G. T., Harrington, C. D., Takeshita, Y., and Bidlack, A.: Marine CO2 system variability along the Inside Passage of the Pacific Northwest coast of North America determined from an Alaskan ferry [data set], https://doi.org/10.21966/m0es-7520, 2021.
Fabry, V. J., McClintock, J. B., Mathis, J. T., and Grebmeier, J. M.: Ocean Acidification at High Latitudes: The Bellwether, Oceanography, 22, 160–171, 2009.
Fassbender, A. J., Sabine, C. L., and Palevsky, H. I.: Nonuniform ocean acidification and attenuation of the ocean carbon sink, Geophys. Res. Lett., 44, 8404–8413, https://doi.org/10.1002/2017GL074389, 2017.
Fassbender, A. J., Alin, S. R., Feely, R. A., Sutton, A. J., Newton, J. A., Krembs, C., Bos, J., Keyzers, M., Devol, A., Ruef, W., and Pelletier, G.: Seasonal carbonate chemistry variability in marine surface waters of the US Pacific Northwest, Earth Syst. Sci. Data, 10, 1367–1401, https://doi.org/10.5194/essd-10-1367-2018, 2018a.
Fassbender, A. J., Rodgers, K. B., Palevsky, H. I., and Sabine, C. L.: Seasonal Asymmetry in the Evolution of Surface Ocean pCO2 and pH Thermodynamic Drivers and the Influence of Sea-Air CO2 Flux, Global Biogeochem. Cy., 32, 1476–1497, 2018b.
Fassbender, A. J., Orr, J. C., and Dickson, A. G.: Technical note: Interpreting pH changes, Biogeosciences, 18, 1407–1415, https://doi.org/10.5194/bg-18-1407-2021, 2021.
Feely, R. A., Sabine, C. L., Lee, K., Berelson, W., Kleypas, J., Fabry, V. J., and Millero, F. J.: Impact of Anthropogenic CO2 on the CaCO3 System in the Oceans, Science, 305, 362–366, 2004a.
Feely, R. A., Sabine, C. L., Schlitzer, R., Bullister, J. L., Mecking, S., and Greeley, D.: Oxygen Utilization and Organic Carbon Remineralization in the Upper Water Column of the Pacific Ocean, J. Oceanogr., 60, 45–52, 2004b.
Feely, R. A., Sabine, C. L., Hernandez-Ayon, M., Ianson, D., and Hales, B.: Evidence for Upwelling of Corrosive “Acidified” Water onto the Continental Shelf, Science, 320, 1490–1492, 2008.
Feely, R. A., Doney, S. C., and Cooley, S. R.: Ocean Acidification: Present Conditions and Future Changes in a High-CO2 World, Oceanography, 22, 36–47, 2009.
Feely, R. A., Alin, S. R., Newton, J., Sabine, C. L., Warner, M., Devol, A., Krembs, C., and Maloy, C.: The combined effects of ocean acidification, mixing, and respiration on pH and carbonate saturation in an urbanized estuary, Eastuar. Coast. Shelf S., 88, 442–449, 2010.
Feely, R. A., Alin, S. R., Carter, B., Bednarsek, N., Hales, B., Chan, F., Hill, T. M., Gaylord, B., Sanford, E., Byrne, R. H., Sabine, C. L., Greeley, D., and Juranek, L.: Chemical and biological impacts of ocean acidification along the west coast of North America, Eastuar. Coast. Shelf S., 183, 260–270, 2016.
Feely, R. A., Okazaki, R. R., Cai, W. J., Bednarsek, N., Alin, S. R., Byrne, R. H., and Fassbender, A.: The combined effects of acidification and hypoxia on pH and aragonite saturation in the coastal waters of the California current ecosystem and the northern Gulf of Mexico, Cont. Shelf Res., 152, 50–60, https://doi.org/10/1016/j.csr.2017.11.002, 2018.
Franco, A. C., Ianson, D., Ross, T., Hamme, R. C., Monahan, A. H., Christian, J. R., Davelaar, M., Johnson, W. K., Miller, L. A., Robert, M., and Tortell, P. D.: Anthropogenic and Climatic Contributions to Observed Carbon System Trends in the Northeast Pacific, Global Biogeochem. Cy., 35, e2020GB006829, https://doi.org/10.1029/2020GB006829, 2021.
Friedlingstein, P., Jones, M. W., O'Sullivan, M., Andrew, R. M., Bakker, D. C. E., Hauck, J., Le Quéré, C., Peters, G. P., Peters, W., Pongratz, J., Sitch, S., Canadell, J. G., Ciais, P., Jackson, R. B., Alin, S. R., Anthoni, P., Bates, N. R., Becker, M., Bellouin, N., Bopp, L., Chau, T. T. T., Chevallier, F., Chini, L. P., Cronin, M., Currie, K. I., Decharme, B., Djeutchouang, L., Dou, X., Evans, W., Feely, R. A., Feng, L., Gasser, T., Gilfillan, D., Gkritzalis, T., Grassi, G., Gregor, L., Gruber, N., Gürses, Ö., Harris, I., Houghton, R. A., Hurtt, G. C., Iida, Y., Ilyina, T., Luijkx, I. T., Jain, A. K., Jones, S. D., Kato, E., Kennedy, D., Klein Goldewijk, K., Knauer, J., Korsbakken, J. I., Körtzinger, A., Landschützer, P., Lauvset, S. K., Lefèvre, N., Lienert, S., Liu, J., Marland, G., McGuire, P. C., Melton, J. R., Munro, D. R., Nabel, J. E. M. S., Nakaoka, S.-I., Niwa, Y., Ono, T., Pierrot, D., Poulter, B., Rehder, G., Resplandy, L., Robertson, E., Rödenbeck, C., Rosan, T. M., Schwinger, J., Schwingshackl, C., Séférian, R., Sutton, A. J., Sweeney, C., Tanhua, T., Tans, P. P., Tian, H., Tilbrook, B., Tubiello, F., van der Werf, G., Vuichard, N., Wada, C., Wanninkhof, R., Watson, A., Willis, D., Wiltshire, A. J., Yuan, W., Yue, C., Yue, X., Zaehle, S., and Zeng, J.: Global Carbon Budget 2021, Earth Syst. Sci. Data Discuss. [preprint], https://doi.org/10.5194/essd-2021-386, in review, 2021.
Gobler, C. J. and Baumann, H.: Hypoxia and acidification in ocean ecosystems: coupled dynamics and effects on marine life, Biol. Lett., 12, 20150976, https://doi.org/10.1098/rsbl.2015.0976, 2016.
Gruber, N., Sarmiento, J. L., and Stocker, T. F.: An improved method for detecting anthropogenic CO2 in the oceans, Global Biogeochem. Cy., 10, 809–837, 1996.
Haigh, R., Ianson, D., Holt, C. A., Neate, H. E., and Edwards, A. M.: Effects of Ocean Acidification on Temperature Coastal Marine Ecosystems and Fisheries in the Northeast Pacific, PLoS ONE, 10, e0117533, https://doi.org/10.1371/journal.pone.0117533, 2015.
Hales, B., Cai, W.-J., Mitchell, B. G., Sabine, C. L., and Schofield, O.: North American Continental Margins: A Synthesis and Planning Workshop, Report of the North American Continental Margins Working Group for the U.S. Carbon Cycle Scientific Steering Group and Interagency Working Group, edited by: Hales, B., Cai, W.-J., Mitchell, B. G., Sabine, C. L., and Schofield, O., U.S. Carbon Cycle Science Program, Washington DC, 110 pp., 2008.
Hales, B., Suhrbier, A., Waldbusser, G. G., Feely, R. A., and Newton, J. A.: The Carbonate Chemistry of the “Fattening Line”, Willapa Bay, 2011–2014, Estuar. Coast. Shelf S., 40, 173–186, https://doi.org/10.1007/s12237-12016-10136-12237, 2016.
Hare, A., Evans, W., Pocock, K., Weekes, C., and Gimenez, I.: Contrasting marine carbonate systems in two fjords in British Columbia, Canada: seawater buffering capacity and the response to anthropogenic CO2 invasion, PLoS ONE, 15, e0238432, https://doi.org/10.1371/journal.pone.0238432, 2020.
Hauri, C., Schultz, C., Hedstrom, K., Danielson, S., Irving, B., Doney, S. C., Dussin, R., Curchitser, E. N., Hill, D. F., and Stock, C. A.: A regional hindcast model simulating ecosystem dynamics, inorganic carbon chemistry, and ocean acidification in the Gulf of Alaska, Biogeosciences, 17, 3837–3857, https://doi.org/10.5194/bg-17-3837-2020, 2020.
Henson, S. A., Beaulieu, C., Ilyina, T., John, J. G., Long, M., Séférian, R., Tjiputra, J., and Sarmiento, J. L.: Rapid emergence of climate change in environmetal drivers of marine ecosystems, Nat. Commun., 8, 14682 ,https://doi.org/10.1038/ncomms14682, 2017.
Holdsworth, A. M., Zhai, L., Lu, Y., and Christian, J. R.: Future Changes in Oceanography and Biogeochemistry Along the Canadian Pacific Continental Margin, Front. Mar. Sci., 8, 602991, https://doi.org/10.3389/fmars.2021.602991, 2021.
Ianson, D., Allen, S. E., Moore-Maley, B. L., Johannessen, S. C., and Macdonald, R. W.: Vulnerability of a semienclosed estuarine sea to ocean acidification in contrast with hypoxia, Geophys. Res. Lett., 43, 5793–5801, https://doi.org/10.1002/2016GL068996, 2016.
IPCC, 2018: Summary for Policymakers, in: Global Warming of 1.5 ∘C. An IPCC Special Report on the impacts of global warming of 1.5 ∘C above pre-industrial levels and related global greenhouse gas emission pathways, in the context of strengthening the global response to the threat of climate change, sustainable development, and efforts to eradicate poverty, edited by: Masson-Delmotte, V., Zhai, P., Pörtner, H.-O., Roberts, D., Skea, J., Shukla, P. R., Pirani, A., Moufouma-Okia, W., Péan, C., Pidcock, R., Connors, S., Matthews, J. B. R., Chen, Y., Zhou, X., Gomis, M. I., Lonnoy, E., Maycock, T., Tignor, M., and Waterfield, T., World Meteorological Organization, Geneva, Switzerland, 32 pp., 2018.
Jackson, J., Thomson, R. E., Brown, L. N., Willis, P. G., and Borstad, G. A.: Satellite chlorophyll off the British Columbia Coast, 1997–2010, J. Geophys. Res.-Oceans, 120, 4709–4728, 2015.
Jackson, J., Johnson, G. C., Dosser, H. V., and Ross, T.: Warming From Recent Marine Heatwave Lingers in Deep British Columbia Fjord, Geophys. Res. Lett., 45, 9757–9764, https://doi.org/10.1029/2018GL078971, 2018.
Jiang, L.-Q., Feely, R. A., Carter, B. R., Greeley, D., Gledhill, D. K., and Arzayus, K. M.: Climatological distribution of aragonite saturation state in the global oceans, Global Biogeochem. Cy., 29, 1656–1673, 2015.
Jiang, L.-Q., Carter, B. R., Feely, R. A., Lauvset, S. K., and Olsen, A.: Surface ocean pH and buffer capacity: past, present and future, Sci. Rep., 9, 18624, https://doi.org/10.1038/s41598-019-55039-4, 2019.
Jin, P., Hutchins, D. A., and Gao, K.: The Impacts of Ocean Acidification on Marine Food Quality and Its Potential Food Chain Consequences, Front. Mar. Sci., 7, 543979, https://doi.org/10.3389/fmars.2020.543979, 2020.
Johannessen, S. C., Macdonald, R. W., and Paton, D. W.: A sediment and organic carbon budget for the greater Strait of Georgai, Estuar. Coast. Shelf S., 56, 845–860, 2003.
Johannessen, S. C., Masson, D., and Macdonald, R. W.: Oxygen in the deep Strait of Georgia, 1951–2009: The roles of mixing, deep-water renewal, and remineralization of organic carbon, Limnol. Oceanogr., 59, 211–222, 2014.
Johnson, K. S., Jannasch, H. W., Coletti, L. J., Elrod, V. A., Martz, T. R., Takeshita, Y., Carlson, R. J., and Connery, J. G.: Deep-Sea DuraFET: A Pressure Tolerant pH Sensor Designed for Global Sensor Networks, Anal. Chem., 88, 3249–3256, 2016.
Juranek, L., Takahashi, T., Mathis, J., and Pickart, R.: Significant Biologically Mediated CO2 Uptake in the Pacific Arctic During the Late Open Water Season, J. Geophys. Res.-Oceans, 124, 821–843, doi.org/10.1029/2018JC014568, 2019.
Kapsenberg, L. and Cyronak, T.: Ocean Acidification refugia in variable environments, Glob. Change Biol., 25, 3201–3214, https://doi.org/10.1111/gcb.14730, 2019.
Kroeker, K. J., Kordas, R., L., Crim, R., Hendriks, I. E., Ramajo, L., Singh, G. S., Duarte, C. M., and Gattuso, J. P.: Impacts of ocean acidification on marine organisms: quantifying sensitivities and interactions with warming, Glob. Change Biol., 19, 1884–1896, 2013.
Kroeker, K., Kindinger, T., Hirsh, H., Ward, M., Hill, T., Jellison, B., Koweek, D., Lummis, S., Rivest, E., Waldbusser, G., and Gaylord, B.: Reviews and Syntheses: Spatial and temporal patterns in metabolic fluxes inform potential for seagrass to locally mitigate ocean acidification, Biogeosciences Discuss. [preprint], https://doi.org/10.5194/bg-2021-137, in review, 2021.
Kwiatkowski, L. and Orr, J. C.: Diverging seasonal extremes for ocean acidification during the twenty-first century, Nat. Clim. Change, 8, 141–145, doi.org/10.1038/s41558-017-0054-0, 2018.
Landschützer, P., Gruber, N., Bakker, D. C. E., Stemmler, I., and Six, K. D.: Strengthening seasonal marine CO2 variations due to increasing atmospheric CO2, Nat. Clim. Change, 8, 146–150, https://doi.org/10.1038/s41558-017-0057-x, 2018.
Laruelle, G. G., Cai, W. J., Hu, X., Gruber, N., Mackenzie, F. T., and Regnier, P.: Continental shelves as a variable but increasing global sink for atmospheric carbon dioxide, Nat. Commun., 9, 454, https://doi.org/10.1038/s41467-41017-02738-z, 2018.
Lauvset, S. K., Carter, B. R., Perez, F. F., Jiang, L.-Q., Feely, R. A., Velo, A., and Olsen, A.: Processes Driving Global Interior Ocean pH Distribution, Global Biogeochem. Cy., 34, e2019GB006229, https://doi.org/10.1029/2019GB006229, 2020.
Lowe, A., Bos, J., and Ruesink, J.: Ecosystem metabolism drives pH variability and modulates long-term ocean acidification in the Northeast Pacific coastal ocean, Sci. Rep., 9, 963, https://doi.org/10.1038/s41598-41018-37764-41594, 2019.
Marshall, K. N., Kaplan, I. C., Hodgson, E. E., Hermann, A., Busch, D. S., McElhany, P., Essington, T. E., Harvey, C. J., and Fulton, E. A.: Risks of ocean acidification in the California Current food web and fisheries: ecosystem model projections, Glob. Change Biol., 23, 1525–1539, https://doi.org/10.1111/gcb.13594, 2017.
Mathis, J. T., Cooley, S. R., Lucey, N., Colt, S., Ekstrom, J., Hurst, T., Hauri, C., Evans, W., Cross, J. N., and Feely, R. A.: Ocean acidification risk assessment for Alaska's fishery sector, Prog. Oceanogr., 136, 71–91, https://doi.org/10.1016/j.pocean.2014.07.001, 2015.
Matsumoto, K. and Gruber, N.: How accurate is the estimation of anthropogenic carbon in the ocean?, An evaluation of the ΔC* method, Global Biogeochem. Cy., 19, GB3014, https://doi.org/10.1029/2004GB002397, 2005.
Matthews, H. D., Tokarska, K. B., Rogelj, J., Smith, C. J., MacDougall, A. H., Haustein, K., Mengis, N., Sippel, S., Forster, P. M., and Knutti, R.: An integrated approach to quantifying uncertainties in the remaining carbon budget, Commun. Earth Environ., 7, https://doi.org/10.1038/s43247-020-00064-9, 2021.
Meinshausen, M., Nicholls, Z. R. J., Lewis, J., Gidden, M. J., Vogel, E., Freund, M., Beyerle, U., Gessner, C., Nauels, A., Bauer, N., Canadell, J. G., Daniel, J. S., John, A., Krummel, P. B., Luderer, G., Meinshausen, N., Montzka, S. A., Rayner, P. J., Reimann, S., Smith, S. J., van den Berg, M., Velders, G. J. M., Vollmer, M. K., and Wang, R. H. J.: The shared socio-economic pathway (SSP) greenhouse gas concentrations and their extensions to 2500, Geosci. Model Dev., 13, 3571–3605, https://doi.org/10.5194/gmd-13-3571-2020, 2020.
Meire, L., Søgaard, D. H., Mortensen, J., Meysman, F. J. R., Soetaert, K., Arendt, K. E., Juul-Pedersen, T., Blicher, M. E., and Rysgaard, S.: Glacial meltwater and primary production are drivers of strong CO2 uptake in fjord and coastal waters adjacent to the Greenland Ice Sheet, Biogeosciences, 12, 2347–2363, https://doi.org/10.5194/bg-12-2347-2015, 2015.
Mekkes, L., Renema, W., Bednaršek, N., Alin, S. R., Feely, R. A., Huisman, J., Roessingh, P., and Peijnenburg, K. T. C. A.: Pteropods make thinner shellfs in the upwelling region of the California Current Ecosystem, Sci. Rep., 11, 1731, https://doi.org/10.1038/s41598-41021-81131-41599, 2021.
Morrison, J., Foreman, M. G. G., and Masson, D.: A Method for Estimating Monthly Freshwater Discharge Affecting British Columbia Coastal Waters, Atmos. Ocean, 50, 1–8, https://doi.org/10.1080/07055900.2011.637667, 2012.
Murray, J. W., Roberts, E., Howard, E., O'Donnell, M., Bantam, C., Carrington, E., Foy, M., Paul, B., and Fay, A.: An inland sea high nitrate-low chlorophyll (HNLC) region with naturally high pCO2, Limnol. Oceanogr., 60, 957–966, https://doi.org/10.1002/lno.10062, 2015.
Neal, E. G., Hood, E., and Smikrud, K.: Contribution of glacier runoff to freshwater discharge into the Gulf of Alaska, Geophys. Res. Lett., 37, L06404, https://doi.org/10.1029/2010GL042385, 2010.
Newton, J. A., Feely, R. A., Jewett, E. B., Williamson, P., and Mathis, J.: Global Ocean Acidification Observing Network: Requirements and Governance Plan, http://goa-on.org/docs/GOA-ON_2nd_edition_final.pdf (last access: May 2021), 2015.
O'Neel, S., Hood, E., Bidlack, A. L., Fleming, S. W., Arimitsu, M. L., Arendt, A., Burgess, E., Sergeant, C. J., Beaudreau, A. H., Timm, K., Hayward, G. D., Reynolds, J. H., and Pyare, S.: Icefield-to-Ocean Linkages across the Northern Pacific Coastal Temperate Rainforest Ecosystem, BioScience, 65, 499–512, 2015.
Oliver, A. A., Tank, S. E., Giesbrecht, I., Korver, M. C., Floyd, W. C., Sanborn, P., Bulmer, C., and Lertzman, K. P.: A global hotspot for dissolved organic carbon in hypermaritime watersheds of coastal British Columbia, Biogeosciences, 14, 3743–3762, https://doi.org/10.5194/bg-14-3743-2017, 2017.
Orr, J. C., Epitalon, J.-M., Dickson, A. G., and Gattuso, J.-P.: Routine uncertainty propagation for the marine carbon dioxide system, Mar. Chem., 207, 84–107, https://doi.org/10.1016/j.marchem.2018.10.006, 2018.
Osborne, E. B., Thunell, R. C., Gruber, N., Feely, R. A., and Benitez-Nelson, C. R.: Decadal variability in twentieth-century ocean acidification in the California Current Ecosystem, Nat. Geosci., 13, 43–49, https://doi.org/10.1038/s41561-41019-40499-z, 2020.
Pacella, S. R., Brown, C. A., Waldbusser, G. G., Labiosa, R. G., and Hales, B.: Seagrass habitat metabolism increases short-term extremes and long-term offset of CO2 under future ocean acidification, P. Natl. Acad. Sci. USA, 15, 3870–3875, https://doi.org/10.1073/pnas.1703445115, 2018.
Pawlowicz, R., Riche, O., and Halverson, M.: The Circulation and Residence Time of the Strait of Georgia using a Simple Mixing-box Approach, Atmos. Ocean, 45, 1730-193, 2007.
Peck, V. L., Oakes, R. L., Harper, E. M., Manno, C., and Tarling, G. A.: Pteropods counter mechanical damage and dissolution through extensive shell repair, Nat. Commun., 9, 264, https://doi.org/10.1038/s41467-41017-026692-w, 2018.
Perez, F. F. and Fraga, F.: Association constant of fluoride and hydrogen ions in seawater, Mar. Chem., 21, 161–168, 1987.
Pierrot, D., Neill, C., Sullivan, K., Castle, R., Wanninkhof, R., Lüger, H., Johannessen, T., Olsen, A., Feely, R. A., and Cosca, C. E.: Recommendations for autonomous underway pCO2 measuring systems and data-reduction routines, Deep Sea Res. Pt. II, 56, 512–522, https://doi.org/10.1016/j.dsr2.2008.12.005, 2009.
Pilcher, D. J., Siedlecki, S. A., Hermann, A. J., Coyle, K. O., Mathis, J. T., and Evans, W.: Simulated impact of high alkalinity glacial runoff on CO2 uptake in the coastal Gulf of Alaska, Geophys. Res. Lett., 45, Pages 880–890, https://doi.org/10.1002/2017GL075910, 2016.
Raven, J. A., Gobler, C. J., and Juel Hansen, P.: Dynamic CO2 and pH levels in coastal, estuarine, and inland waters: Theoretical and observed effects on harmful algal blooms, Harmful Algae, 91, 101594, doi/l10.1016/j.hal.2019.1003.1012, 2020.
Reisdorph, S. C. and Mathis, J. T.: The dynamic controls on carbonate mineral saturation states and ocean acidification in a glacially dominated estuary, Estuar. Coast. Shelf S., 144, 8–18, 2013.
Ricart, A. M., Ward, M., Hill, T. M., Sanford, E., Kroeker, K. J., Takeshita, Y., Merolla, S., Shukla, P., Ninokawa, A. T., Elsmore, K., and Gaylord, B.: Coast-wide evidence of low pH amelioration by seagrass ecosystems, Glob. Change Biol., 27, 2580–2591, https://doi.org/10.1111/gcb.15594, 2021.
Rogelj, J., Shindell, D., Jiang, K., Fifita, S., Foster, P., Ginzburg, V., Handa, C., Kheshgi, H., Kobayashi, S., Kriegler, E., Mundaca, L., Séférian, R., and Vilariño, M.: Mitigation pathways compatible with 1.5 ∘C in the context of sustainable development, in: Global Warming of 1.5 ∘C, An IPCC Special Report on the impacts of global warming of 1.5 ∘C above pre-industrial levels and related global greenhouse gas emission pathways, in the context of strengthening the global response to the threat of climate change, sustainable development, and efforts to eradicate poverty (93–174), edited by: Masson-Delmotte, V., Zhai, P., Pörtner, H.-O., Roberts, D., Skea, J., Shukla, P. R., Pirani, A., Moufouma-Okia, W., Péan, C., Pidcock, R., Connors, S., Matthews, J. B. R., Chen, Y., Zhou, X., Gomis, M. I., Lonnoy, E., Maycock, T., Tignor, M., and Waterfield, T., IPCC/WMO, https://www.ipcc.ch/site/assets/uploads/sites/2/2019/05/SR15_Chapter2_Low_Res.pdf (last acces: May 2021), 2018.
Sabine, C. L., Feely, R. A., Key, R. M., Bullister, J. L., Millero, F. J., Lee, K., Peng, T.-H., Tilbrook, B., Ono, T., and Wong, C. S.: Distribution of anthropogenic CO2 in the Pacific Ocean, Global Biogeochem. Cy., 16, 1083, https://doi.org/10.1029/2001GB001639, 2002.
Sabine, C. L., Feely, R. A., Gruber, N., Key, R. M., Lee, K., Bullister, J. L., Wanninkhof, R., Wong, C. S., Wallace, D. W. R., Tilbrook, B., Millero, F. J., Peng, T.-H., Kozyr, A., Ono, T., and Rios, A. F.: The Oceanic Sink for Anthropogenic CO2, Science, 305, 367–371, 2004.
Salisbury, J. E., and Jönsson, B. F.: Rapid warming and salinity changes in the Gulf of Maine alter surface ocean carbonate parameters and hide ocean acidification, Biogeochemistry, 141, 401–418, https://doi.org/10.1007/s10533-10018-10505-10533, 2018.
Sarmiento, J. L. and Gruber, N.: Ocean Biogeochemical Dynamics, Princeton University Press, Princeton, ISBN: 9780691017075, 2006.
Sharp, J. D. and Byrne, R. H.: Interpreting measurements of total alkalinity in marine and estuarine waters in the presence of proton-binding organic matter, Deep Sea Res. Pt. I, 165, 103338, https://doi.org/10.1016/j.dsr.2020.103338, 2020.
Sharp, J. D., Pierrot, D., Humphreys, M. P., Epitalon, J.-M., Orr, J. C., Lewis, E. R., and Wallace, D. W. R.: CO2SYSv3 for MATLAB (Version v3.2.0), Zenodo, https://doi.org/10.5281/zenodo.3950562, 2021.
Siedlecki, S. A., Pilcher, D. J., Hermann, A. J., Coyle, K., and Mathis, J.: The Importance of Freshwater to Spatial Variability of Aragonite Saturation State in the Gulf of Alaska, J. Geophys. Res.-Oceans, 122, 8482–8502, 2017.
St. Pierre, K. A., Oliver, A. A., Tank, S. E., Hunt, B. P. V., Giesbrecht, I., Kellogg, C. T. E., Jackson, J. M., Lertzman, K. P., Floyd, W. C., and Korver, M. C.: Terrestrial exports of dissolved and particulate organic carbon affect nearshore ecosystems of the Pacific coastal temperate rainforest, Limnol. Oceanogr., 65, 2657–2675, https://doi.org/10.1002/lno.11538, 2020.
St. Pierre, K. A., Hunt, B. P. V., Tank, S. E., Giesbrecht, I., Korver, M. C., Floyd, W. C., Oliver, A. A., and Lertzman, K. P.: Rain-fed streams dilute inorganic nutrients but subsidise organic-matter-associated nutrients in coastal waters of the northeast Pacific Ocean, Biogeosciences, 18, 3029–3052, https://doi.org/10.5194/bg-18-3029-2021, 2021.
Stabeno, P. J., Bond, N. A., Hermann, A. J., Kachel, N. B., Mordy, C. W., and Overland, J. E.: Meteorology and oceanography of the Northern Gulf of Alaska, Cont. Shelf Res., 24, 859–897, 2004.
Sutton, A. J., Feely, R. A., Maenner-Jones, S., Musielwicz, S., Osborne, J., Dietrich, C., Monacci, N., Cross, J., Bott, R., Kozyr, A., Andersson, A. J., Bates, N. R., Cai, W.-J., Cronin, M. F., De Carlo, E. H., Hales, B., Howden, S. D., Lee, C. M., Manzello, D. P., McPhaden, M. J., Meléndez, M., Mickett, J. B., Newton, J. A., Noakes, S. E., Noh, J. H., Olafsdottir, S. R., Salisbury, J. E., Send, U., Trull, T. W., Vandemark, D. C., and Weller, R. A.: Autonomous seawater pCO2 and pH time series from 40 surface buoys and the emergence of anthropogenic trends, Earth Syst. Sci. Data, 11, 421–439, https://doi.org/10.5194/essd-11-421-2019, 2019.
Takahashi, T., Sutherland, S. C., Sweeney, C., Poisson, A., Metzl, N., Tilbrook, B., Bates, N. R., Wanninkhof, R., Feely, R. A., Sabine, C. L., Olafsson, J., and Nojiri, Y.: Global sea-air CO2 flux based on climatological surface ocean pCO2, and seasonal biological and temperature effects, Deep-Sea Res. Pt. II, 49, 1601–1622, 2002.
Takeshita, Y., Frieder, C. A., Martz, T. R., Ballard, J. R., Feely, R. A., Kram, S., Nam, S., Navarro, M. O., Price, N. N., and Smith, J. E.: Including high-frequency variability in coastal ocean acidification projections, Biogeosciences, 12, 5853–5870, https://doi.org/10.5194/bg-12-5853-2015, 2015.
Takeshita, Y., Johnson, K. S., Martz, T., Plant, J. N., and Sarmiento, J. L.: Assessment of Autonomous pH Measurements for Determining Surface Seawater Partial Pressure of CO2, J. Geophys. Res.-Oceans, 123, 4003–4013, 2018.
Thomson, R. E.: Oceanography of the British Columbia coast, Canadian Special Publication of Fisheries and Aquatic Sciences 56, Department of Fisheries and Oceans, Ottawa, ISBN: 0-660-10978-6, 1981.
Tilbrook, B., Jewett, E. B., DeGrandpre, M. D., Hernandez-Ayon, J. M., Feely, R. A., Gledhill, D. K., Hansson, L., Isenee, K., Kurz, M. L., Newton, J. A., Siedlecki, S. A., Chai, F., Dupont, S., Graco, M., Calvo, E., Greeley, D., Kapsenberg, L., Lebrec, M., Pelejero, C., Schoo, K., and Telszewski, M.: An Enhanced Ocean Acidification Observing Network: From People to Technology to Data Synthesis and Information Exchange, Front. Mar. Sci., 6, 337, https://doi.org/10.3389/fmars.2019.00337, 2019.
Tortell, P. D., Merzouk, A., Ianson, D., Pawlowicz, R., and Yelland, D. R.: Influence of regional climate forcing on surface water pCO2, ΔO2/Ar and dimethylsulfide (DMS) along the southern British Columbia coast, Cont. Shelf Res., 47, 119–132, https://doi.org/10.1016/j.csr.2012.07.007, 2012.
Turk, D., Wang, H., Hu, X., Gledhill, D., Wang, Z. A., Jiang, L., and Cai, W. J.: Time of Emergence of Surface Ocean Carbon Dioxide Trends in the North American Coastal Margins in Support of Ocean Acidification Observing System Design, Front. Mar. Sci., 6, 91, https://doi.org/10.3389/fmars.2019.00091, 2019.
UNFCC: Adoption of the Paris Agreement FCCC/CP/2015/L.2019/Rev.2011. 2011–2032 (UNFCCC, Paris, France, 2015), https://unfccc.int/sites/default/files/resource/docs/2015/cop21/eng/l09r01.pdf (last access: May 2021), 2015.
Uppström, L. R.: The boron/chlorinity ratio of deep-sea water from the Pacific Ocean, Deep-Sea Res., 21, 161–162, https://doi.org/10.1016/0011-7471(74)90074-6, 1974.
Waldbusser, G. G., Hales, B., Langdon, C. J., Haley, B. A., Schrader, P., Brunner, E. L., Gray, M. W., Miller, C. A., and Gimenez, I.: Saturation-state sensitivity of marine bivalve larvae to ocean acidification, Nat. Clim. Change, 5, 273–280, https://doi.org/10.1038/nclimate2479, 2014.
Wanninkhof, R. and Thoning, K.: Measurement of fugacity of CO2 in surface water using continuous and discrete sampling methods, Mar. Chem., 44, 189–204, 1993.
Wanninkhof, R., Bakker, D., Bates, N., Olsen, A., Steinhoff, T., and Sutton, A.: Incorporation of Alternative Sensors in the SOCAT Database and Adjustments to Dataset Quality Control Flags, https://www.ncei.noaa.gov/access/ocean-carbon-data-system/oceans/Recommendationnewsensors.pdf (last access: May 2021), 2013.
Ward, N. D., Bianchi, T. S., Medeiros, P. M., Seidel, M., Richey, J. E., Keil, R. G., and Sawakuchi, H. O.: Where Carbon Goes When Water Flows: Carbon Cycling across the Aquatic Continuum, Front. Mar. Sci., 4, 7, https://doi.org/10.3389/fmars.2017.00007, 2017.
Ware, D. M. and Thomson, R. E.: Bottom-Up Ecosystem Trophic Dynamics Determine Fish Production in the Northeast Pacific, Science, 308, 1280–1284, 2005.
Waters, J., Millero, F. J., and Woosley, R. J.: Corrigendum to “The free proton concentration scale for seawater pH”, [MARCHE: 149(2013) 8-22], Mar. Chem., 165, 66–67, 2014.
Weingartner, T. J., Eisner, L., Eckert, G. L., and Danielson, S. L.: Southeast Alaska: oceanographic habitats and linkages, J. Biogeogr., 36, 387–400, 2009.
Whitney, F. A., Crawford, W. R., and Harrison, P. J.: Physical processes that enhance nutrient transport and primary productivity in the coastal and open ocean of the subartic NE Pacific, Deep-Sea Res. Pt. II, 52, 681–706, 2005.