the Creative Commons Attribution 4.0 License.
the Creative Commons Attribution 4.0 License.
 | 04 Mar 2022
Effects of peatland management on aquatic carbon concentrations and fluxes
Marcella Branagan
Mike F. Billett
Roxane Andersen
Kerry J. Dinsmore
Direct land-to-atmosphere carbon exchange has been the primary focus in previous studies of peatland disturbance and subsequent restoration. However, loss of carbon via the fluvial pathway is a significant term in peatland carbon budgets and requires consideration to assess the overall impact of restoration measures. This study aimed to determine the effect of peatland land management regime on aquatic carbon concentrations and fluxes in an area within the UK's largest tract of blanket bog, the Flow Country of northern Scotland. Three sub-catchments were selected to represent peatland land management types: non-drained, drained, and restoration (achieved through drain blocking and tree removal). Water samples were collected on a fortnightly basis from September 2008 to August 2010 at six sampling sites, one located upstream and one downstream within each sub-catchment. Concentrations of dissolved organic carbon (DOC) were significantly lower for the upstream non-drained sub-catchment compared to the drained sub-catchments, and there was considerable variation in the speciation of aquatic carbon (DOC, particulate organic carbon (POC), CO2, and CH4) across the monitoring sites, with dissolved gas concentrations inversely correlated with catchment area and thereby contributing considerably more to total aquatic carbon in the smaller headwater catchments. Significantly higher POC concentrations were observed in the restored sub-catchment most affected by tree removal. Aquatic carbon fluxes were highest from the drained catchments and lowest from the non-drained catchments at 23.5 and 7.9 g C m−2 yr−1, respectively, with variability between the upstream and downstream sites within each catchment being very low. It is clear from both the aquatic carbon concentration and flux data that drainage has had a profound impact on the hydrological and biogeochemical functioning of the peatland. In the restoration catchment, carbon export varied considerably, from 21.1 g C m−2 yr−1 at the upper site to 10.0 g C m−2 yr−1 at the lower site, largely due to differences in runoff generation. As a result of this hydrological variability, it is difficult to make definitive conclusions about the impact of restoration on carbon fluxes, and further monitoring is needed to corroborate the longer-term effects.
- Article
(325 KB) - Full-text XML
-
Supplement
(492 KB) - BibTeX
- EndNote


The ability of peatlands to store and sequester carbon is of major importance both nationally in terms of greenhouse gas (GHG) accounting and globally in understanding the carbon cycle and potential changes to atmospheric composition. Loss of carbon via the aquatic pathway constitutes a significant term within peatland carbon budgets, in some past studies accounting for between 34 % and 51 % of uptake from net ecosystem exchange (NEE) (Dinsmore et al., 2010; Nilsson et al., 2008; Roulet et al., 2007). Aquatic carbon fluxes include dissolved and particulate organic carbon (DOC and POC), dissolved inorganic carbon (DIC), and within this gaseous carbon in the form of carbon dioxide (CO2) and methane (CH4). Fluvial export of DOC is typically the largest aquatic flux, with losses from UK peatland catchments in the range from 19 to 27 g C m−2 yr−1 (Billett et al., 2010). Accordingly, DOC is also the most frequently reported of the aquatic carbon fluxes.
Whilst there is considerable inter-annual variability evident in many of the carbon flux pathways from peatlands (e.g. Dinsmore et al., 2013; Helfter et al., 2015), a significant increasing trend in DOC concentrations has been detected in the majority of monitored surface waters in Europe and North America since the 1980s (Monteith et al., 2007). On the regional scale this trend has largely been attributed to recovery of soils from acid deposition (Evans et al., 2012; Monteith et al., 2007); however on the catchment scale, anthropogenic disturbance of peatlands has been identified as a potential contributing factor to the observed DOC increases (Billett et al., 2010; Parry et al., 2014). Again, at the catchment scale, POC concentrations can indicate increases in erosion that can often be traced back to changing land use (i.e. drained peatland sites might display higher POC concentrations, and in some severely drained peatlands this can become the dominant C species contributing to total fluvial carbon losses; Pawson et al., 2012). Dissolved CO2 and CH4 have direct relevance for the greenhouse gas (GHG) budgets of the streams themselves, as these gases are quickly evaded from solution to the atmosphere and can also be affected by peatland disturbance (Huotari et al., 2013).
Anthropogenic disturbance covers a range of activities including burning, peat cutting, and afforestation, with peatland drainage by far the most prevalent form of disturbance. It is estimated that 447 637 km2 of peatlands is drained globally, releasing up to 1058 Mt CO2 annually (Joosten, 2010), with a shift in the global peatland biome from a net sink to a net source of C thought to have occurred in the 1960s (Leifeld et al., 2019). The UK alone is thought to produce approximately 9.6 Mt CO2 yr−1 from degraded, often drained peatlands (Bain et al., 2011). Drainage results in erosion and a lowering of the water table, which exposes greater peat depths to aerobic conditions. Although the exact response differs between peatland types and with time since disturbance (Laiho, 2006), artificially lowering the water table is generally understood to increase decomposition rates. This results in a larger pool of soluble carbon species that can be transported via soil throughflow to the surface drainage system, where increases in DOC concentrations are subsequently detected (Evans et al., 2016; Menberu et al., 2017; Strack et al., 2008; Worrall et al., 2004). Notably in Great Britain, upland conifer plantations including those on drained deep peat are estimated to have raised the overall DOC export by as much as 0.168 Tg C yr−1 (Williamson et al., 2021).
In recognition of the value of intact peatlands, there is now a significant national and international effort to reduce peatland drainage and focus on restoration activities (Parry et al., 2014). In most cases the primary goal of restoration is to return the hydrological functioning of the peatland to the assumed pre-management state as a precursor for re-establishing the lost ecosystem functioning. Drain blocks are a cost-effective means by which to raise the water table of human-impacted peatlands (Armstrong et al., 2009; Parry et al., 2014). Their implementation in previously drained catchments has in many cases resulted in successful re-wetting of peatlands (Strack and Zuback, 2013; Waddington and Price, 2000) and reductions in peak discharge (Shuttleworth et al., 2019). However the degree of their success has been shown to be spatially variable as a function of ditch direction across the slope and height of water table prior to intervention (Holden et al., 2017). Associated reductions in DOC concentrations and fluxes are often an assumed co-benefit of restoration via drain blocking, and, therefore, this practice has been funded by water companies that source water from peat catchments in an effort to reduce DOC concentrations in their pre-treatment raw water (Andersen et al., 2017).
Despite this assumed co-benefit, the reported effects of drain blocking on concentrations of DOC are not consistent and often show contradictory results depending on time since blocking. Increases in concentrations have been seen up to 2 years after restoration (Gibson et al., 2009; Worrall et al., 2007), while studies conducted 3 to 4 years after blocking report lower concentrations in soil and stream water (Wallage et al., 2006; Wilson et al., 2011). In a paired catchment study with an extended baseline data collection period (3 years pre-blocking), drain blocking showed no discernible impact on DOC or other measured carbon species in ditch waters and stream waters after 6 years (Evans et al., 2018). The balance of evidence suggests that different peatlands will display variable water quality responses to drain blocking controlled by factors such as slope, altitude, and rainfall, and further research is required to understand what drives different response mechanisms.
Determining the effect of drain blocking can be further complicated or masked by other simultaneous restoration works, for example, removal of trees from peat with heavy machinery, which has previously been shown to result in short-term increases in aquatic DOC concentrations (Zheng et al., 2018; Gaffney et al., 2020). The blanket bogs of the Flow Country have been subject to multiple and changing land management practices over the past half century. Afforestation of the Flow Country peatlands occurred during the 1970s and 1980s, and areas designated for planting were first drained to lower the water table and then planted with non-native conifers (Lindsay et al., 1988). Large-scale “forest-to-bog” restoration, whereby non-native conifers are extracted, drains are blocked, and further management takes place (e.g. brash crushing, shredding, peat reprofiling), has been on-going since the 1990s in an effort to restore the bog's ecosystem functioning (Andersen et al., 2017). This has resulted in a patchwork of land use over a relatively small spatial scale and a unique opportunity to carry out detailed management effects research on quasi-replicated catchments that fall within the most extensive area of continuous blanket peatland in Europe (Lindsay et al., 1988), which serves as a nationally important carbon store. Here we utilize the land-use mosaic the Flow Country provides, monitoring aquatic carbon concentrations and water flow in a nested catchment approach to quantify the effect of land management on aquatic carbon concentrations and export. Specifically, we compare concentrations of aquatic carbon from across three catchment types (non-drained, drained, and restoration) to test the following hypotheses.
-
H1. DOC concentrations will be lowest in the non-drained catchment, relative to the drained and restoration sites.
-
H2. POC concentrations will be highest in the drained catchment, as it is strongly linked with erosion.
-
H3. Dissolved gas concentrations will be highest in the non-drained catchments, consistent with a high water table linking the terrestrial and aquatic environments.
2.1 Site description
The study catchments are located ca. 5 km northwest of Forsinard, northern Scotland, UK. Three study catchments were identified within close proximity to represent three types of land management: non-drained, drained (>40 % of total catchment area affected by artificial drainage), and restoration (blocking of artificial drains). Within each catchment, two stream monitoring sites were selected, splitting the experimental design into six nested sub-catchments (Fig. 1).
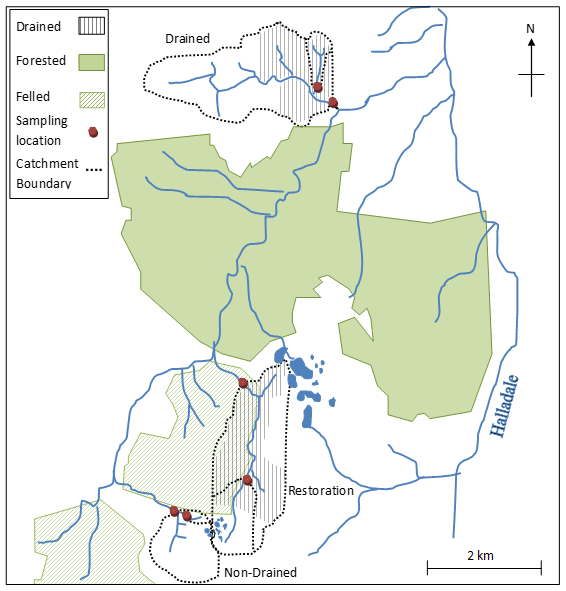
Figure 1Schematic of experimental catchments including three land management types (non-drained, drained and restoration) and two nested sub-catchments (upper and lower). The diagram centre point has the coordinates 58∘24.45′ N, 3∘56.80′ W.
Both the non-drained and restoration catchments are located in the Cross Lochs area of the Royal Society for the Protection of Birds (RSPB) Forsinard Flows National Nature Reserve, while the restoration catchment forms part of the Bighouse Estate. The area has a mean annual temperature of 7.5–8.0 ∘C with a mean annual precipitation range of 650–1000 mm. The geology consists of Moine granulites and schists overlaid with fluvioglacial material and blanket peat. Vegetation is dominated by mosses including Sphagnum spp. and Racomitrium lanuginosum (Hedw.) Brid., sedges such as Eriophorum spp., and shrubs Calluna vulgaris (L.) Hull and Erica tetralix L. Vegetation in the stream riparian zones is dominated by sedges and Juncus squarrous.
The drains in Cross Lochs are believed to have been created in the 1970s and 1980s when farm capital grants were made available. Areas of Cross Lochs were then planted in the early 1980s with non-native conifer species (Pinus contorta and Picea sitchensis) (Lindsay et al., 1988). The RSPB began restoration of the area in 2002 through the felling of trees and blocking of drains. At the time, given that the trees were still small, trees were felled to waste, i.e. cut at the base and rolled into adjacent furrows. Drains of open-ditch formation were created on the Bighouse Estate during the 1950s in response to agricultural subsidies and have been regularly maintained and free flowing since their installation. In the lower catchment, drains are spaced between 30–70 m apart; in the upper catchment, drains are spaced closer at approximately 30–40 m apart.
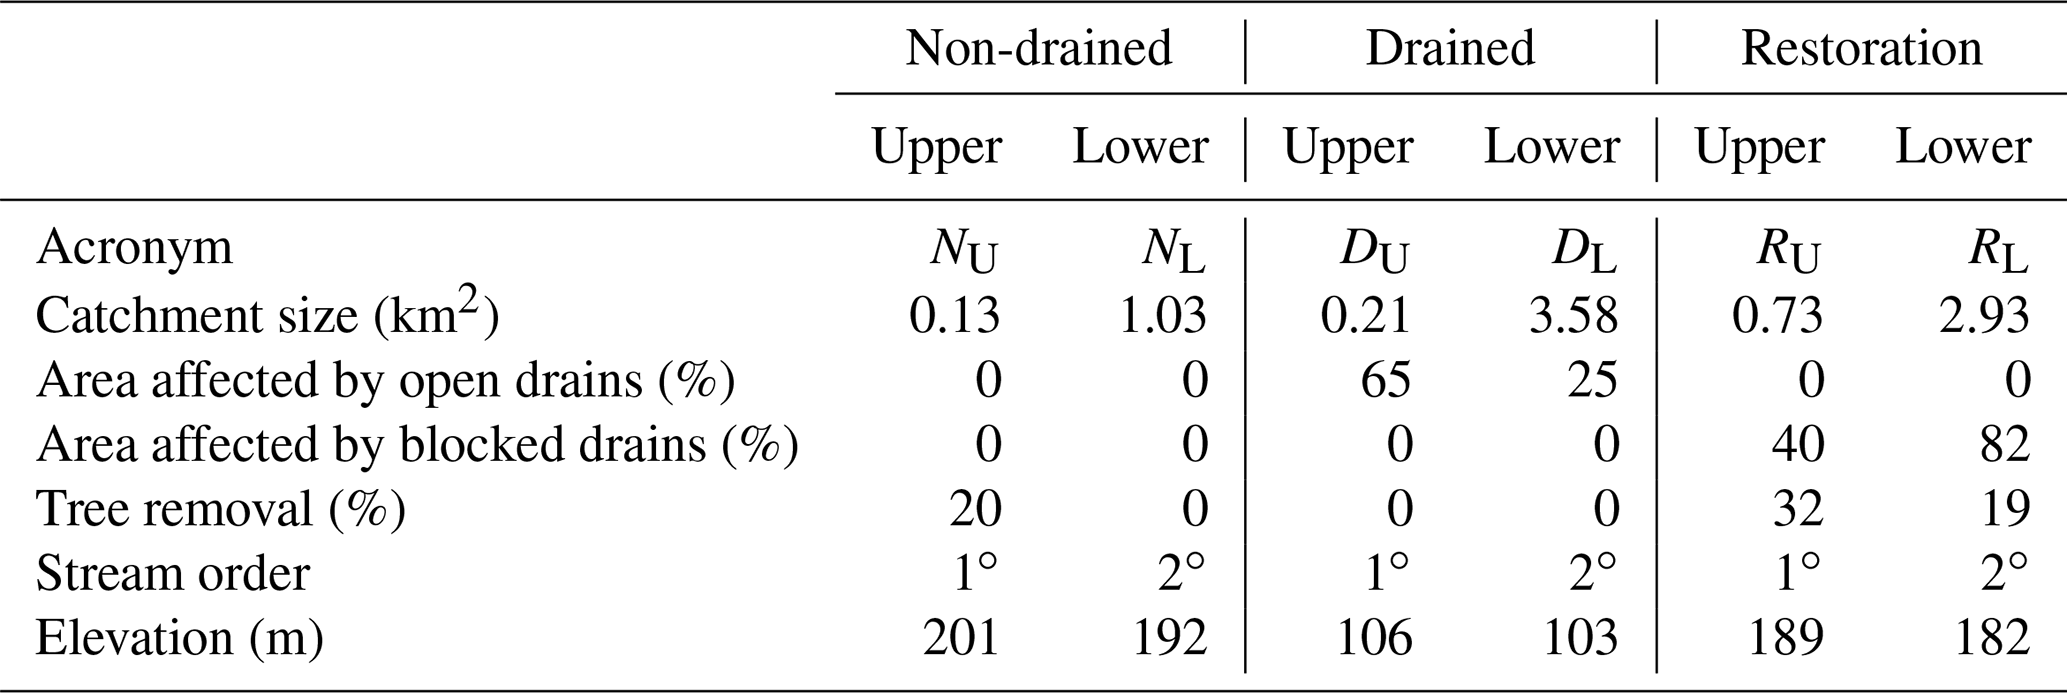
The study sites are small headwater streams of the order of 1 or 2, draining catchments ranging in size from 0.13 to 3.58 km2 (Table 1). Whilst neither of the non-drained sub-catchments were affected by artificial drainage alone, approximately 20 % of the upper sub-catchment area has been influenced by forest-to-bog restoration (where drainage would have occurred prior to tree planting). The two drained sub-catchments contain no forestry or forest-to-bog restoration influence but have 65 % and 25 % of their total area affected by active artificial drainage (upper and lower sub-catchments, respectively). The restoration sub-catchments contain both forest-to-bog restoration and drain-blocking activity, with 40 % and 82 % of the total area affected by blocked drains in the upper and lower restoration sub-catchments, respectively.
2.2 Field sampling
Stream water sampling was carried out approximately fortnightly over a 2-year period from September 2008 to August 2010. On each sampling occasion and at each sampling point, a water sample was collected in a 500 mL acid-washed glass bottle for analysis of POC, DOC, and DIC and a headspace and ambient air sample collected in gas-tight syringes for analysis of CO2 and CH4. Stream water temperature and electrical conductivity (EC) were also measured using hand-held devices in situ on each sampling occasion.
Stream height was continuously monitored throughout the full study period using pressure transducers (In-Situ® Level TROLL®) positioned at the non-drained lower (NL), drained lower (DL), and restored upper (RU) stream sampling sites. These locations were chosen for their natural and stable conditions. Continuous discharge was calculated using stage–discharge rating curves (r2 between 0.84 and 0.97; Fig. S1) created from dilution gauging measurements correlating discharge at each individual sampling site to the catchment-specific pressure transducer (Fig. S2).
2.3 Laboratory analyses
Stream water samples were filtered within 24 h of collection through pre-ashed (6 h at 500 ∘C), pre-weighed Whatman GF/F (0.7 µm pore size) filter papers. POC was calculated using loss on ignition, following the method of Ball (1964), which has been estimated to introduce an error of ∼15 % for water samples with low POC concentrations (Dinsmore et al., 2010). The filtrate was stored in the dark at 4 ∘C until analysis within 4 weeks of sampling. The filtrate was analysed for DOC concentration using a PPM LABTOC analyser with a detection range of 0.1 to 4000 mg L−1.
Dissolved CO2 and CH4 were calculated using the widely cited headspace technique (Billett et al., 2004; Dinsmore et al., 2013; Kling et al., 1991). A 40 mL water sample was equilibrated with 20 mL of ambient air at stream temperature by shaking vigorously under water for 1 min; the equilibrated headspace was then transferred to a gas-tight syringe until analysis. On each sampling occasion a separate sample of ambient air was also collected. Headspace samples were analysed on an HP5890 Series II gas chromatograph (Hewlett-Packard), with flame ionization detectors (with attached methanizer) for CH4 and CO2. Detection limits for CO2 and CH4 were 10 ppmv and 70 ppbv, respectively. Concentrations of CO2 and CH4 dissolved in the stream water were calculated from the headspace and ambient concentrations using Henry's law (e.g. Hope et al., 2001).
2.4 Data analysis
One-way analysis of variance (ANOVA) was used to test differences in species-specific carbon concentrations between sampling sites, and significant differences were detected using a 95 % confidence interval. To determine the differences between individual groups, a post hoc Tukey's test was applied to the ANOVA results. Honestly significant differences were then reported using letters, where common letters indicate statistically similar groups.
Carbon species concentration and discharge data were used to calculate the flow-weighted mean concentration (FWMC) following Eq. (1) (Dinsmore et al., 2013), where ci is the instantaneous concentration, qi is the instantaneous discharge, and ti is the time step between concentration measurements.
Drivers of variability in the carbon FWMC were explored in multiple linear regressions using a step-wise approach to construct a best-fit predictive model based on catchment land use data. Linear regression analyses of carbon species data by site against air temperature and the natural log of discharge produced r2 values and p values; these were then used to determine the strength and statistical significance of the relationships, respectively. These analyses were conducted in R v 3.5.3 (R Core Team, 2018).
In order to reconcile the approximately fortnightly carbon concentration measurements with the continuous discharge data to calculate annual carbon export, “Method 5” of Walling and Webb (1985) was used, also described in Dinsmore et al. (2013) and Hope et al. (1997). The method is shown in Eq. (2), where Ci is the instantaneous concentration for each carbon species, Qi is the instantaneous discharge, Qr is the mean discharge over the study period, and n is the number of instantaneous samples analysed.
Standard error of the load was derived using Eq. (3), where F is the annual discharge and CF is the flow-weighted mean concentration (Hope et al., 1997).
The variance of CF was estimated using Eq. (4), where Qn is the sum of all the individual Qi values (Hope et al., 1997).
Export values for each of the carbon species are reported in g m−2 yr−1 scaled to the catchment areas reported in Table 1.
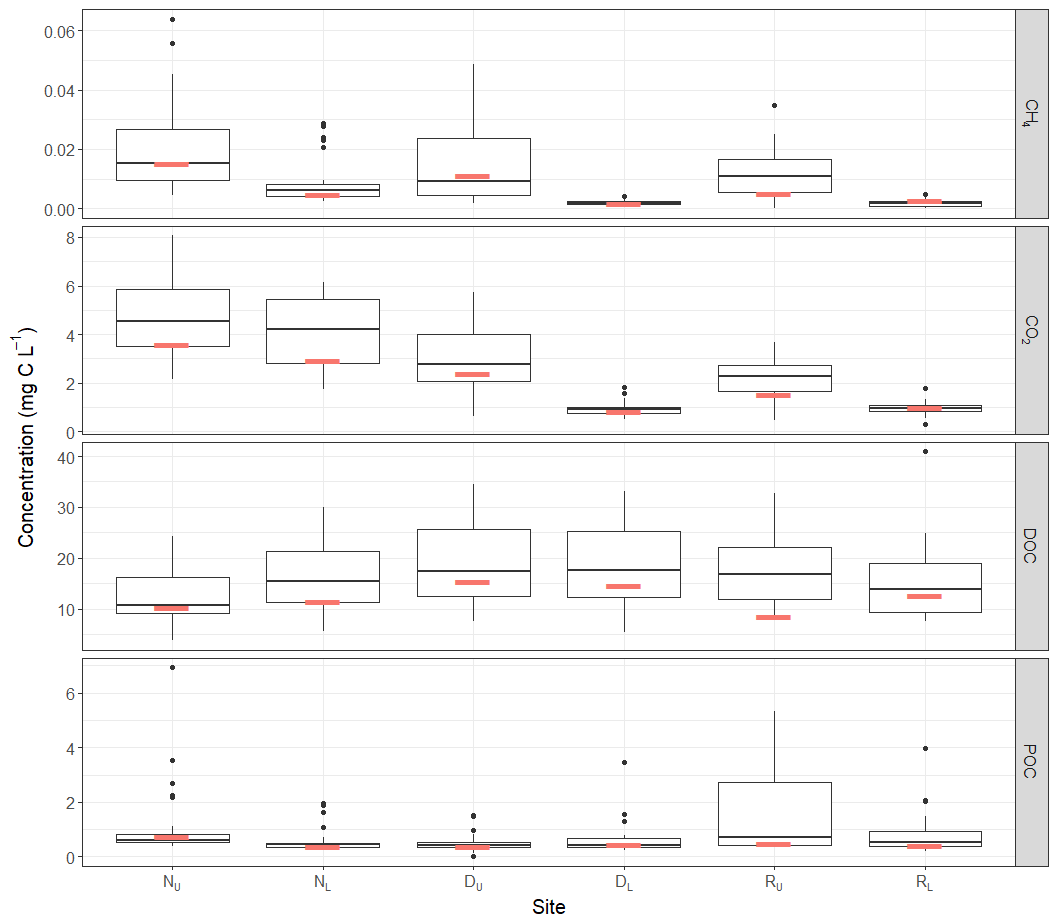
Figure 2Boxplots showing range of carbon concentrations by species at each site over the full measurement period, where the red line represents the flow-weighted mean concentration.
3.1 Carbon concentrations
The concentration of DOC represented the greatest proportion of the total aquatic carbon component at all sites, with mean concentrations ranging from a low of 12.8 mg C L−1 in the upper non-drained catchment to a high of 20.5 mg C L−1 in the upper drained catchment (Fig. 2). Significant differences in DOC concentrations across the sampling period were observed between the upper non-drained catchment compared to the upper restoration catchment and both drained catchments (Table 2).
Table 2Mean (range) stream water hydrochemical data.
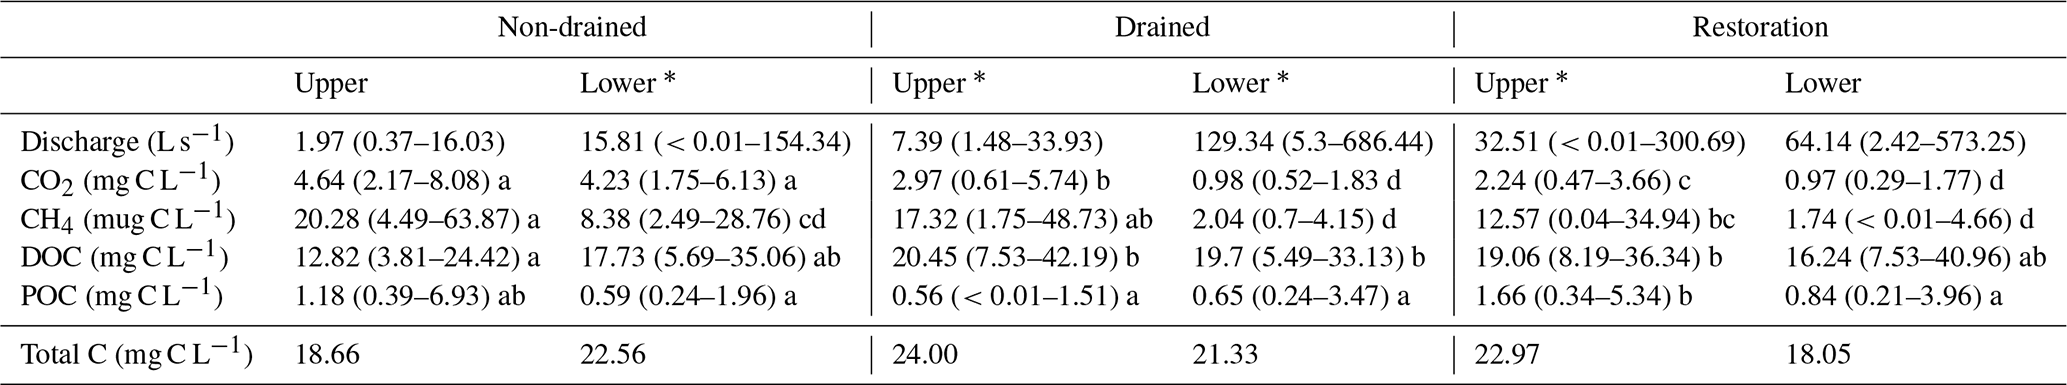
∗ Gauged water level monitoring sites. Letters in italics represent the results from Tukey's family test statistic, with common letters indicating statistically similar groups, as tested for each C species across sampling sites.
The non-drained catchment had the greatest mean concentration of CO2 at both the upper and lower sampling sites, reaching a maximum of 8.1 mg C L−1 (Table 2). Concentrations of CO2 in the drained and restored catchments were strongly dependent on sampling location, with concentrations at the upper sites greater than those downstream, and this difference was significant for drained and restored catchments (Table 2). A similar pattern was seen in the FWMCs, suggesting this is more than a simple dilution effect (Fig. 4). DIC concentrations were of a similar magnitude to CO2 at both the non-drained sub-catchments, but they were considerably higher than CO2 in the drained and lower restored catchments.
Mean site CH4 concentrations ranged from 1.7 µg C L−1 at the lower restoration site to 20.3 µg C L−1 in the outflow of the upper non-drained catchment (Table 2). Within each site ranges were extremely high with the maximum recorded concentration of 63.9 µg C L−1 at the upper non-drained catchment during autumn 2009 (Fig. 3). POC was also highly variable within catchments following a temporal pattern of low baseline concentrations with sporadic peaks (Fig. 3). Significantly higher POC concentrations were observed for the upper restoration catchment (Table 2).
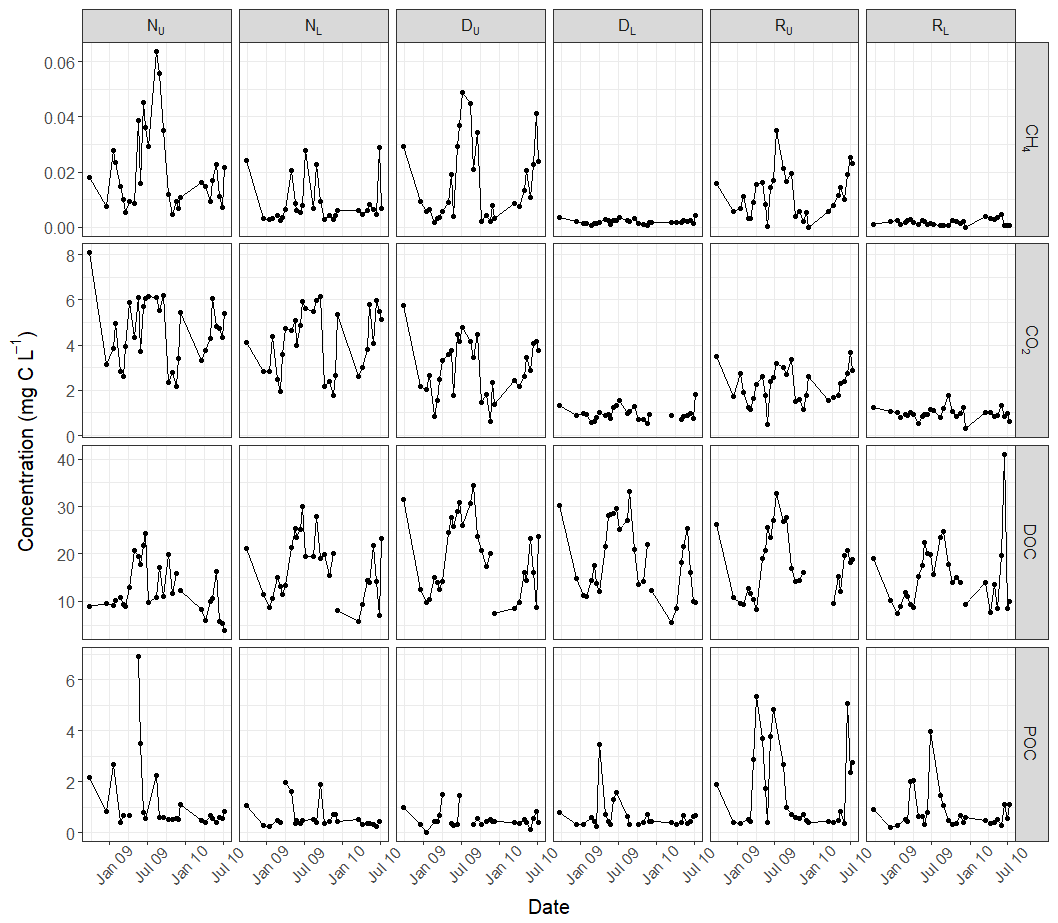
Whilst the speciation of carbon was highly variable between catchments (Fig. 3) with a number of between-site significant differences at the species level (Table 2), the site-specific mean total carbon concentrations were all within the narrow range of 18.05 mg C L−1 (RL) to 24.00 mg C L−1 (NL).
Linear regression models were constructed with the aim of explaining the described site-specific differences in carbon concentrations based on catchment characteristics including total area, percent of catchment drained, percent of catchment with blocked drains, and percent of catchment that had undergone tree removal. When single variables were included, only total catchment area correlated significantly with CO2 and CH4 FWMCs; no significant relationships existed for POC or DOC. Whilst not significant, the proportion of the catchment that had been drained explained 58 % of the site variation in CO2 FWMC (p=0.08, negative relationship), and the proportion of the catchment that contained blocked drains explained 54 % of the between-site variation in DOC FWMC (p=0.09, positive relationship). These were the only other variables that had p values of less than 0.10.
Table 3Best-fit model describing between-site variability in carbon FWMC based on stepwise multiple linear regressions. Log10 transformation was applied to CH4 FWMC before regressions were carried out.
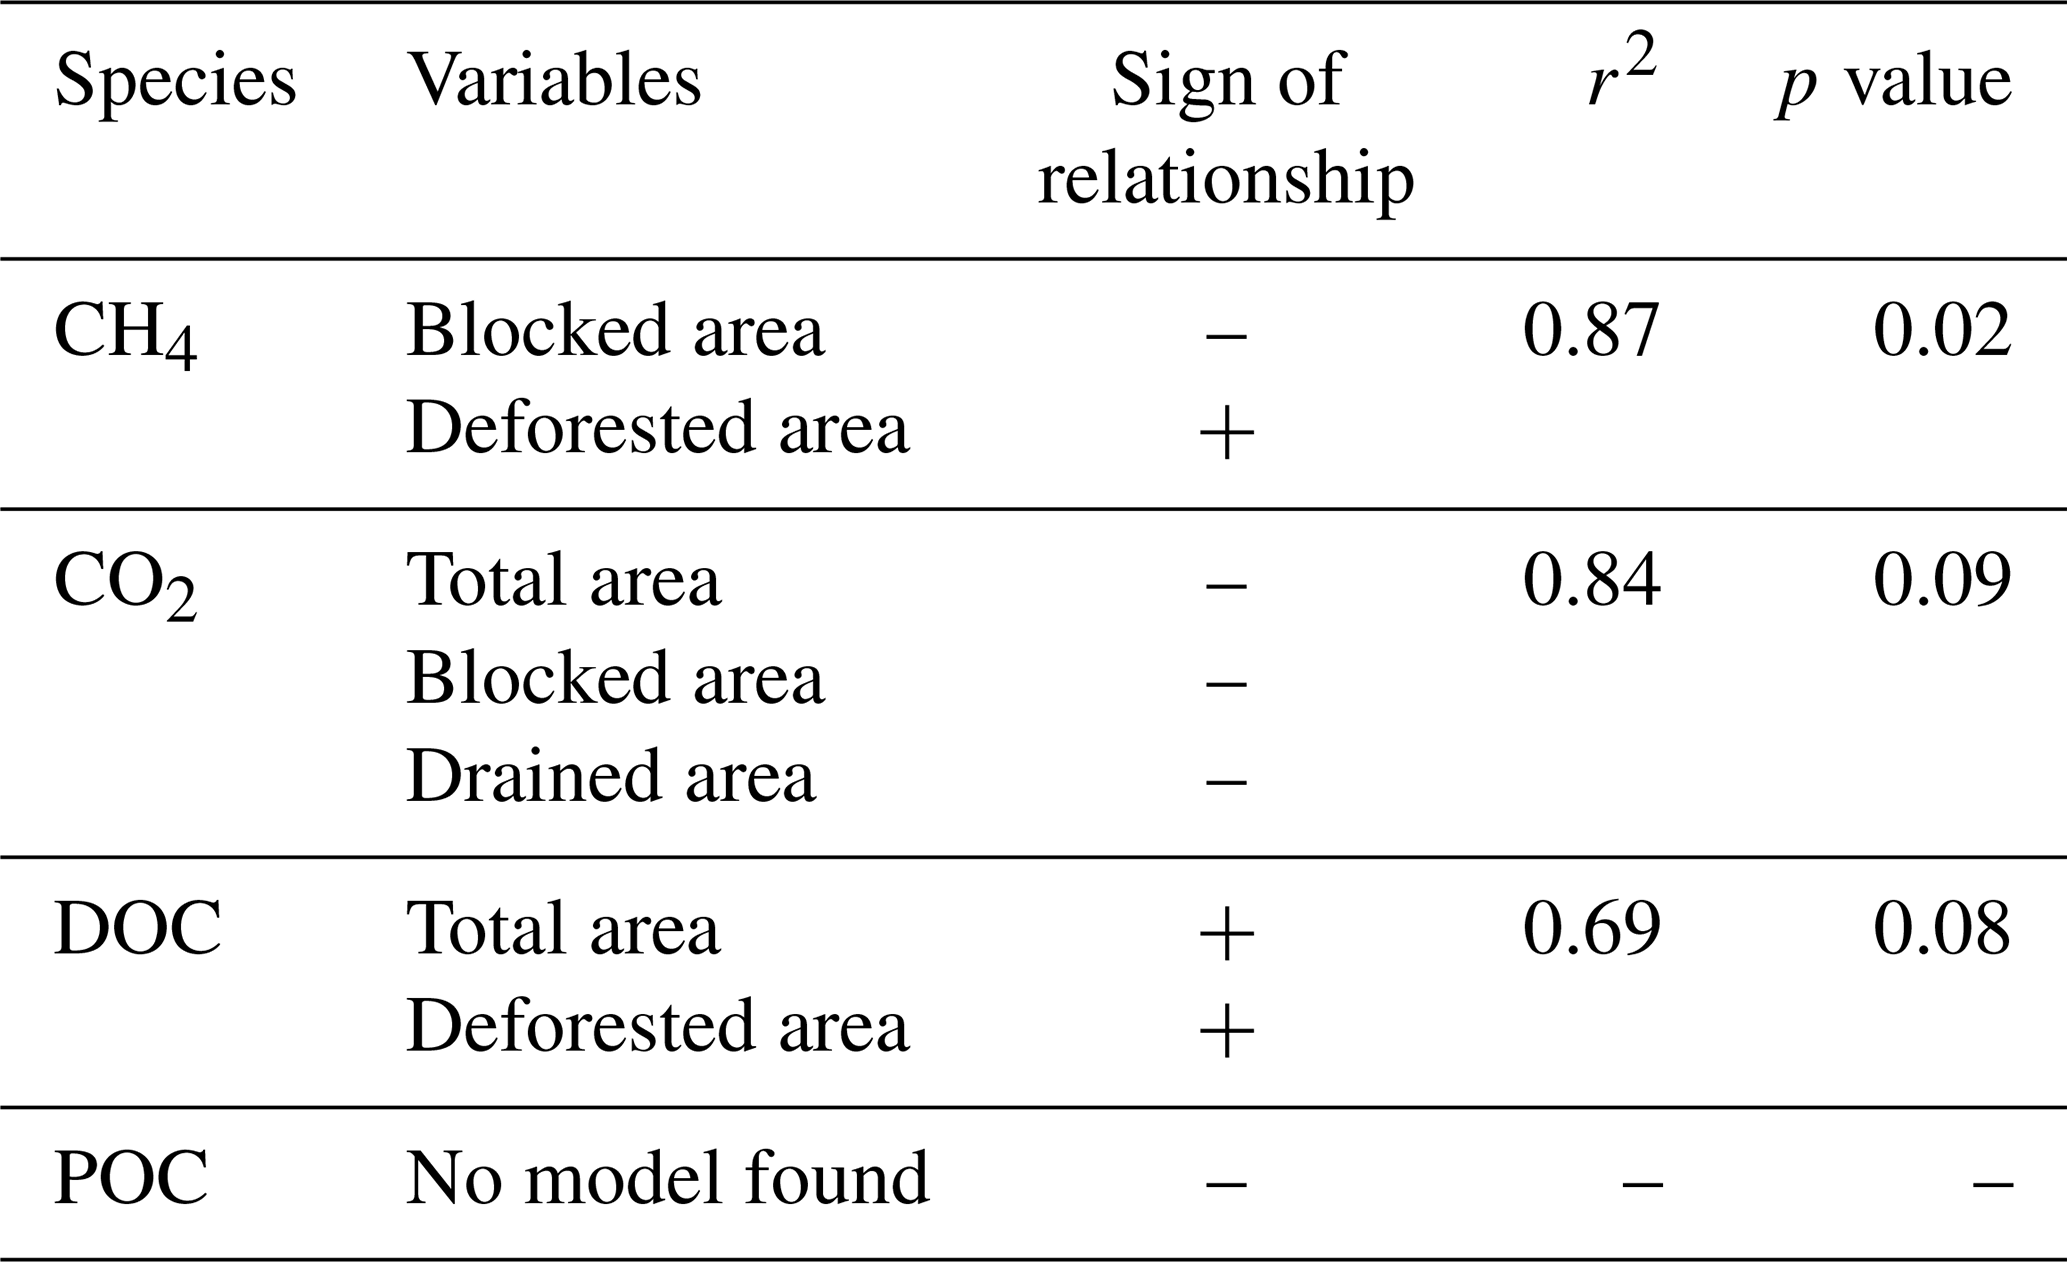
Multiple linear regressions were then applied using a step-wise selection process that produced explanatory models with p<0.10 for CH4, CO2, and DOC (Table 3). High FWMCs of CH4 were associated with sites that contained few blocked drains and areas of tree removal. However as these variables themselves are correlated, with blocked drains and tree removal occurring simultaneously, it is difficult to draw process-based conclusions from these results. The CO2 model suggests an increase in the drained area leads to lower stream water concentrations. Given the inter-correlation between drain blocking and tree removal at our test catchments, the positive relationship between CO2 concentrations and blocked area may be, in part, due to both drivers.
Table 4Results from linear regressions of concentration against log discharge and air temperature.
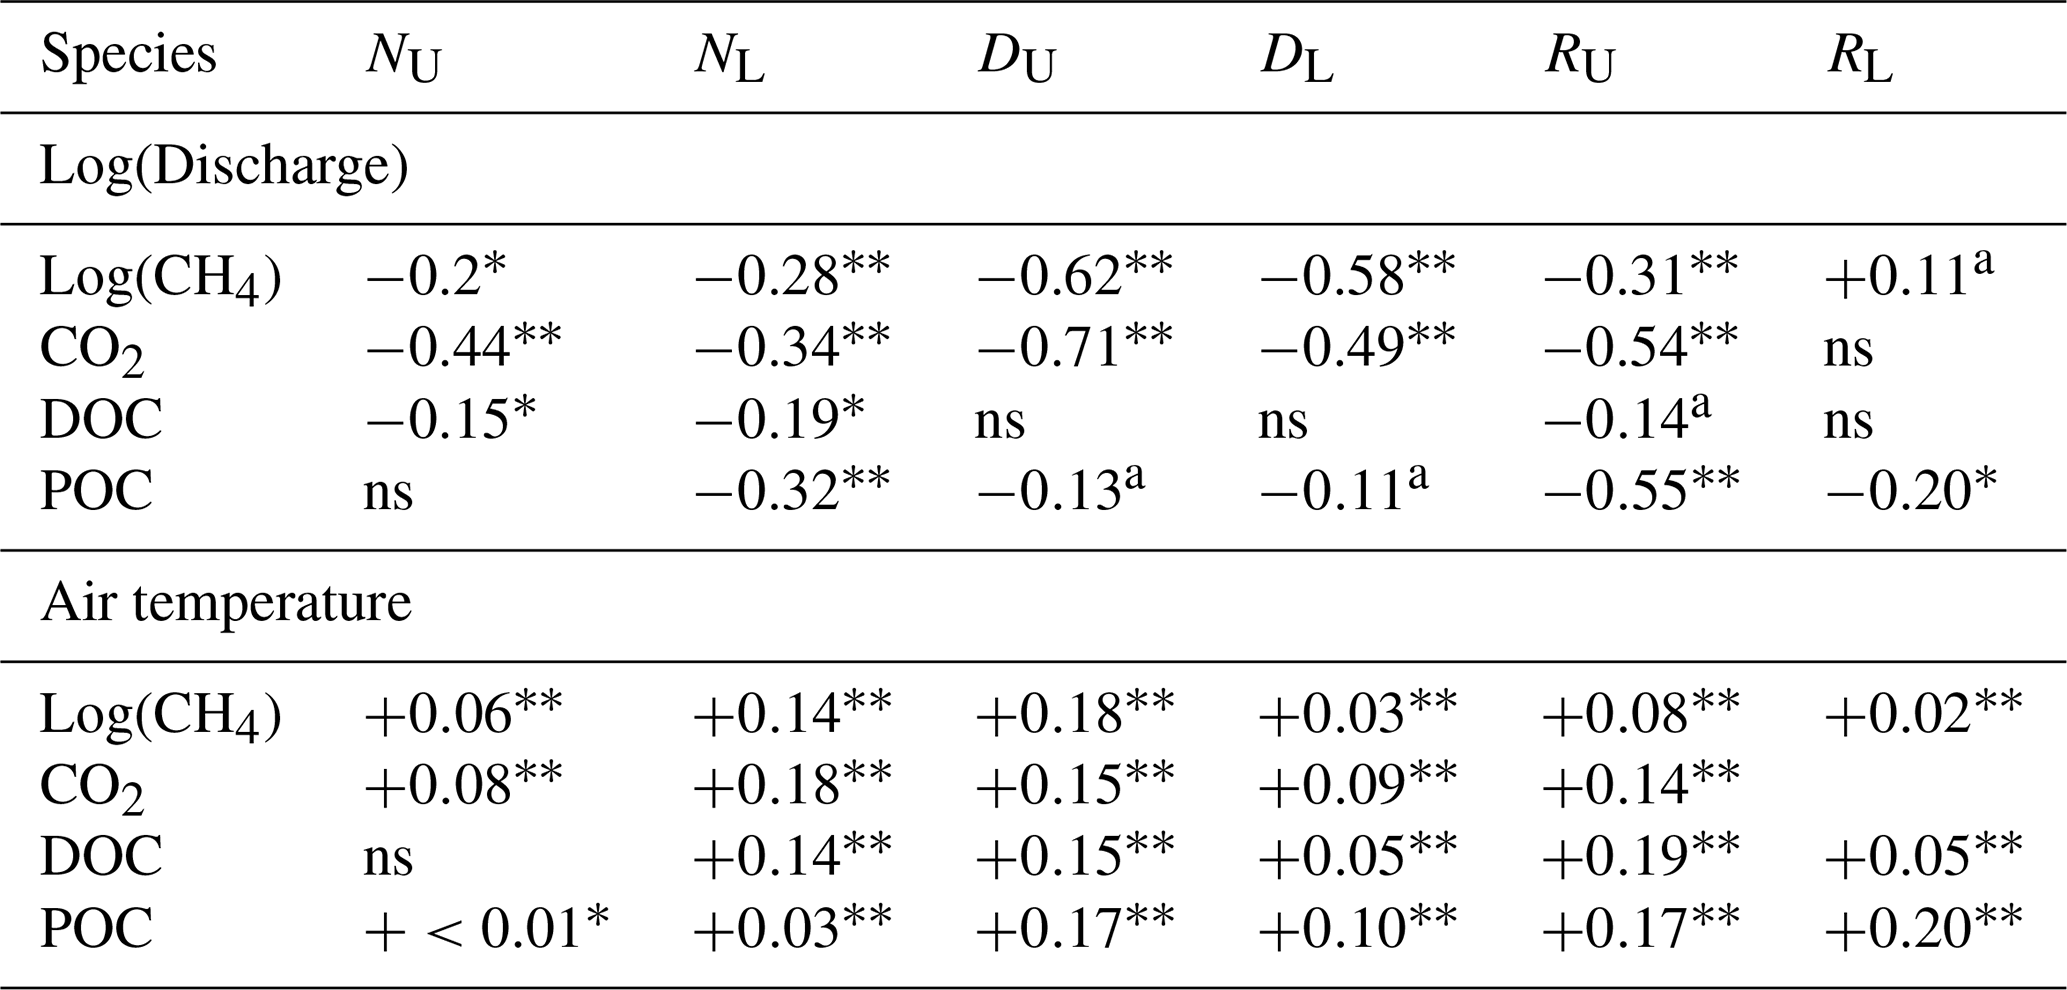
Values represent modelled r2 values, with a, ∗, and representing p values of <0.10, <0.05, and <0.01, respectively. “ns” denotes non-significance at p>0.10. represents the sign of the relationship where one exists.
Concentrations in all carbon species varied throughout the year (Fig. 3). The majority of species, across all sites, followed a seasonal pattern that positively correlated with air temperature (Table 4). Only DOC at the upper non-drained site and CO2 at the lower restoration site did not display a positive relationship with average daily air temperature. Temporal variability in carbon concentrations was also strongly linked to discharge, primarily with a negative concentration–discharge relationship (Table 4). Only CH4 concentrations in the lower restored catchment showed a positive concentration–discharge relationship, and this was not significant at the 0.05 confidence interval.

Figure 4Specific discharge time series from pressure transducers located at sites NL, RU, and DL representing the non-drained, restoration, and drained catchments, respectively.
3.2 Hydrology
Temporal hydrological regimes were similar among catchments, with multiple “flashy” storm peaks occurring across all seasons. Peak flows were concurrent in time at all gauged streams (Fig. 4). The drained site had the highest mean (129 L s−1) and peak discharge (686 L s−1), compared to non-drained or restoration sites that had discharge means of 15 and 32 L s−1, respectively. Since the gauged catchments cover a range of upstream catchment areas (Table 1), it is, therefore, potentially more useful to compare runoff values (Table 2). Of the gauged sites, annual runoff was greatest from the restoration site (1404 mm), followed by the drained (1139 mm) and the non-drained sites (475 mm). The annual runoff for both the upper and lower sites in the non-drained and drained catchments was very similar; however runoff at the upper site was more than double that at the lower site in the restoration catchment, with values of 1404 and 679 mm, respectively. The two restoration sub-catchments also differed significantly in the percent of the catchment that is affected by blocked drains (upper 40 %, lower 82 %).
The gauged site in the non-drained catchment displayed the steepest flow duration curve, indicating high flows lasting the shortest periods (Fig. 5); this is most likely a result of the small catchment size rather than an indication of the water holding capacity. Despite a much larger upstream catchment area, the drained site also displayed a steep curve, with the shallowest curve at the upper flow limit displayed by the restoration catchment. The base flow contributions follow the expected distribution based on catchment size (drained > non-drained > restoration).
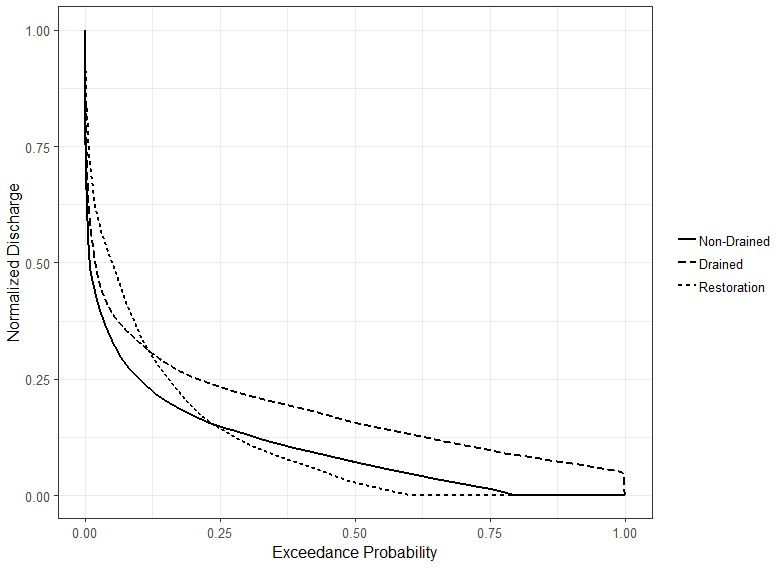
Figure 5Flow duration curve showing exceedance probability of normalized discharge across the three gauged sites.
3.3 Carbon export
Only downstream fluvial carbon export is calculated in this study; therefore, the results below do not take account of aquatic exports via the vertical evasion of dissolved gases from the water surface. The greatest total fluvial carbon exports were measured in the two drained sites (23.5 and 21.5 g C m−2 yr−1 for the upstream and downstream catchments, respectively); the smallest measured total exports were for the two non-drained sites (7.9 and 9.2 g C m−2 yr−1 for the upstream and downstream catchments, respectively; Table 5).
Table 5Downstream carbon export for each catchment ± SE over the full study period in g C m−2 yr −1.
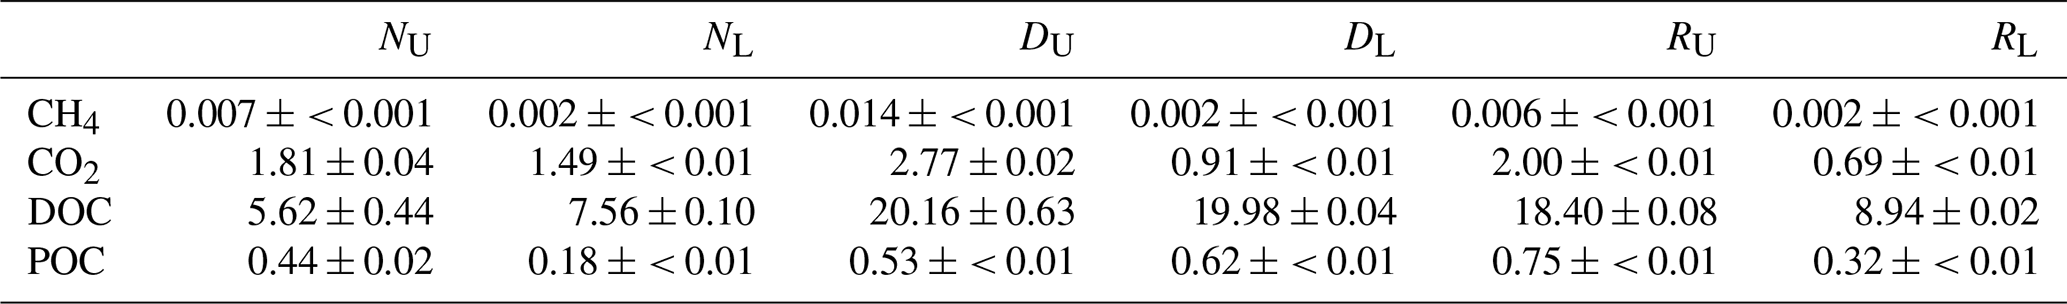
Whilst variability between the nested sub-catchments at the non-drained and drained sites was very low, the two sub-catchments in the restored area varied significantly from a total carbon export of 21.1 g C m−2 yr−1 at the upper site to 10.0 g C m−2 yr−1 at the lower site. The species which contributed most to the total fluvial carbon export was DOC across all catchments, with the second most important export component being CO2. POC fluxes were typically an order of magnitude lower than CO2 fluxes, and export of CH4 was minor across all catchments.
4.1 Carbon concentrations under different peatland land management
This study provides an assessment of concentrations of waterborne carbon species including dissolved CO2 and CH4 in small headwater catchments located in the Flow Country and will provide a reference point for future comparisons of these systems, particularly as they respond in the long term to management. Under all peatland land management types DOC was the largest component of total aquatic carbon. Concentrations were within the range measured in previous studies of blanket bogs (Evans et al., 2018; de Wit et al., 2016) and followed the typical seasonal cycle observed in peatlands, where concentrations tend to peak during late summer and early autumn (Fig. 3). Whilst significant differences were detected for specific sub-catchments (Table 2), and lowest mean concentrations were detected for the non-drained catchment, consistent with H1, the restoration effect on DOC concentration was unclear. Previous studies in the Flow Country have indicated that stream DOC concentrations increase in the short-term following peatland restoration interventions, in part due to the disturbance of the land (Shah and Nisbet, 2019; Gaffney et al., 2020), yet this effect was not detected here. Time since intervention may have subdued the effect of restoration on DOC concentration, as measurements were started approximately 6 years after restoration work began in the area. However in a 17-year-old forest-to-bog restoration site also located within the Flow Country, mean DOC concentrations remained ∼ 2-fold higher than non-drained bog sites in both surface water and pore-water (Gaffney et al., 2018), suggesting that these effects can be detected over the longer timescales. Our findings are consistent with noisy biogeochemical signals occurring over varying timescales and across catchments with varying land use, and they suggest that monitoring should ideally span the timescale required for peatlands to reset and reach a new equilibrium following catchment interventions.
POC concentrations were relatively low across all sites, and there was little evidence of drainage increasing concentrations, contrary to H2, as has been observed in highly degraded peatlands in the UK (Pawson et al., 2012; Yeloff et al., 2005). This suggests that the ditches in the drained catchment were not actively eroding at the time of this study or that our fortnightly sampling interval did not capture peak flows when increased POC export might be expected, although no positive POC–discharge relationships were observed at the sampling sites in this study (Table 4). Peatland disturbances other than drainage can also contribute to short-term increases in POC concentrations (Heal et al., 2020; Nieminen et al., 2017), and a significant difference was detected for concentrations in the upper restoration catchment, which, in percentage coverage terms, was most affected by forest-to-bog restoration (Table 1). The technique of fell to waste, whereby tree material is left on site post-restoration, was utilized in the Cross Lochs area, and this may have contributed to the observed POC effect. The degree to which sediment traps put in place as part of the drain blocking process during forest-to-bog restoration are effective at capturing POC (Andersen et al., 2018) requires further testing.
Concentrations of dissolved CO2 were highest in the non-drained catchments, although the degree to which this can be attributed to peatland land management is uncertain. Whilst increased CO2 partial pressures have similarly been found in undrained catchments compared to drained catchments in a Finnish peatland (Rantakari et al., 2010), a more likely explanation in this study is that total catchment area was the dominant driver of dissolved CO2 concentrations, as detected in multiple linear regression modelling (Table 3). Concentrations were consistently higher in the upper catchments of all land management types, with significant differences observed in the drained and restoration sub-catchments. Low-order streams in small catchments inherently have a higher degree of connectivity with the surrounding peatland soil, resulting in CO2 supersaturation (Wallin et al., 2010). Rapid evasion of supersaturated CO2 from headwater peatland streams has been widely observed (Billett et al., 2015; Hope et al., 2004; Kokic et al., 2015) and is suggestive that the differences detected in this study could, at least in part, be attributed to evasion during transit between first- and second-order streams. That the lowest difference in CO2 concentration was detected in the non-drained catchment where there was the smallest distance between upper and lower sampling points (Fig. 1) further supports this proposition. Evasion of CO2 in headwaters may be a significant component of peatland carbon budgets and should be quantified as a specific loss term, particularly when isotopic analyses have determined the evaded CO2 to be “young” and therefore intrinsically related to the peatland's contemporary net ecosystem carbon balance (Billett et al., 2015).
Dissolved CH4 concentrations followed the same trend as CO2: the highest concentrations were consistently detected in the upper catchments. Several studies have examined CH4 emissions in peatlands where water tables have been artificially raised through ditch blocking and suggest that infilled drains may be acting as “hot spots”, particularly when the presence of species with aerenchyma such as Eriophorum angustifolium allows CH4 to bypass oxidative pathways (Cooper et al., 2014; Günther et al., 2020; Waddington and Day, 2007), but comparatively fewer studies have looked at dissolved CH4 in streams receiving water from peatlands. However, in a study of dissolved CO2 and CH4 concentrations in blocked and open ditches in a blanket bog in northern Wales with a higher level of experimental replication than in this study, there was no evidence of systematic differences between the two ditch types (Evans et al., 2018). Similarly, there was no evidence of this effect in the catchments monitored in this study, and concentrations were similar to those detected by Evans et al. (2018). While the lack of detection of a land management effect is perhaps unsurprising as a consequence of the low experimental replication and time since intervention, it may also relate to multiple controls (organic matter, terminal electron acceptors, hydrology, geomorphology, etc.) that operate in relation to methane production and processing in streams, which remain poorly understood (Stanley et al., 2016).
4.2 Effects of peatland land management on flow regimes
Flow regimes varied considerably between the six monitoring sites included in this study. Increased annual runoff was detected in the drained catchments (mean: 1125 mm) relative to the non-drained catchments (mean: 471 mm), suggesting that peatland drainage has had a profound impact on catchment hydrological functioning. Drainage of blanket peatland has previously been shown to modify flow pathways, via a shift from overland flow to throughflow (Holden et al., 2006), and to increase peak flows (Ballard et al., 2012). Flow duration curves indicated that peak flows lasted longer in the drained catchment relative to the non-drained catchment, although it was in the restoration catchment where peak flows were sustained for the longest periods. This was a surprising result, although it should be noted that the restoration catchment was the only land management type where flow monitoring occurred at the upper rather than lower sampling point, and it was at this site that the highest catchment runoff was observed. Lack of pre-intervention data means that we are unable to assess inherent differences in hydrology between the study sites, although the occurrence of periods of dry-out at both the non-drained and restoration stream monitoring sites (Fig. 4) suggests that there may be significant movement of water out of the catchment via other flow paths (e.g. sub-surface or overland) which are not quantified here.
Annual runoff for the two restoration sites was markedly different (Table 2), with the lower site's runoff similar to the non-drained catchments and the upper site's runoff exceeding that of the drained catchments. There was a large difference in the percentage of catchment area affected by restoration activities, with the lower catchment affected by considerably more ditch blocking. It follows that water flux from the lower catchment would be reduced, as has been discerned in other ditch-focussed studies of peatland restoration (Evans et al., 2018). This has previously been attributed to an increase in evaporation relative to precipitation in restored catchments, which occurs because water is retained in the catchment for longer, partly due to the physical barrier that peatland ditch blocks create whereby water pools behind the peat or piling dams (Peacock et al., 2013) and is more susceptible to evaporative loss. However, whilst this process may have had a small role in contributing toward the observed runoff differences, its overall impact it likely to be limited in the northern, temperate climate of the Flow Country, where high cloud cover, low temperatures, and high contributions from occult precipitations reduce the potential for evaporation (Lapen et al., 2000).
Another potential explanation for the observed differences in runoff is that in areas affected by peatland restoration works a greater proportion of total runoff occurs as overland or near-surface flow (Holden et al., 2017). This flow can effectively bypass typical drainage networks and is therefore not necessarily represented in the stream discharge data presented in this study. Previous studies have found diversion to overland flow to explain the difference in runoff measured between restored and control peatland catchments (Holden et al., 2017; Turner et al., 2013). Although data were not collected here that can verify the contribution of different flow paths to total catchment runoff, it is feasible that flow path shifts have been initiated in the lower restoration catchment following ditch blocking. As clear differences in runoff are evident between the drained and non-drained catchments, this could be interpreted as a signal of the successful hydrological restoration of the lower catchment and its movement towards more natural functioning.
4.3 Impacts of restoration on carbon fluxes
Aquatic carbon fluxes from all catchments were within the same order of magnitude, although they were consistently lower than those detected in a previous study of all waterborne carbon species in a stream draining from a peatland in southern Scotland, where DOC alone contributed to a flux of 25.4 g C m2 yr−1 (Dinsmore et al., 2010). The fluxes were within the range measured for other temperate peatlands (Evans et al., 2016; Swenson et al., 2019) and for headwater streams in the Flow Country (Gaffney et al., 2020). Although the Gaffney et al. (2020) study did not measure CO2 and CH4, this did not lead to large differences in carbon export between the studies, as DOC was the dominant flux term in both overall budgets. This region of Scotland has been identified as an important contributor to the total carbon flux from land to sea on the GB scale (Williamson et al., 2021), and as such, it is important that the effects of land management on fluvial carbon exports are considered, as this may have disproportionately larger impacts than in other areas of the country. As to the end fate of this exported carbon, specifically DOC, the short residence time of the Halladale River into which the streams feed suggests that much of this carbon is delivered to the estuarine environment, which, for this particular system, has been shown to display conservative mixing behaviour (García-Martín et al., 2021).
The same catchment was employed as the non-drained lower catchment in this study (measurements from 2008 to 2010) and as the “bog control” in the Gaffney et al. (2020) study (measurements from 2013–2015), and carbon fluxes here were notably lower (10.8 vs. 18.4 g C m2 yr−1; mean of 2014 and 2015 C export). As there is only a small difference in carbon concentrations between the studies, the difference is likely to be due to inter-annual hydrological and climatic variation. This finding highlights the limitation of taking measurements over only a few years, as it is well established that carbon export can vary considerably as a function of inter-annual hydrological variation. The influence of varying hydrology, including precipitation and evaporation balances, catchment water storage, and flow path routing, may mask the potentially more subtle differences in biogeochemistry, and associated carbon fluxes, that arise due to land management practices.
Aquatic carbon export varied between the land management types, and the drained and non-drained sites were markedly different in their overall carbon flux, with average fluxes nearly 150 % greater from the drained catchments. This finding indicates the dramatic effect that drainage, particularly when maintained, can have on peatland aquatic carbon fluxes or, at the very least, the dominant flow paths within a catchment, for example open channel flow (as measured here) versus overland and sub-surface flow (not quantified here). There was large intra-site variability in carbon fluxes within the restoration sub-catchments, which means it is difficult to determine the impact of the restoration activities on aquatic carbon losses. Previous studies have determined successful recovery of peatland hydrology and water chemistry following restoration, yet they have referenced longer (∼10-year) data sets to determine this effect (Haapalehto et al., 2014).
The degree to which the nested experimental design employed here can determine a confident land management effect on stream carbon concentrations and fluxes is questionable. The nested design limited true replication between the land management types, and greater replication of all land types would be required to conclude that land management alone was the driver of the observed differences. Furthermore, assessment of restoration success without prior monitoring of stream carbon is not optimal, and a before–after–control intervention approach is a better experimental approach (e.g. Menberu et al., 2017). Turner et al., (2008) examined stream DOC concentrations pre- and post-restoration and demonstrated that without pre-restoration information a different conclusion regarding the success of restoration would have been reached. Thus, where practical, monitoring of pre-restoration conditions should be attempted to give a more accurate assessment of restoration success, and this requires active communication between researchers and land managers in order to ensure that monitoring is established ideally at least 1 year before restoration interventions occur.
Our study measured waterborne carbon species in streams draining from blanket bog in the Flow Country in order to assess the effects of varying peatland land management. Increased dissolved organic carbon concentrations were detected in areas of drained peatland relative to non-drained peatland, and there was considerable variation in speciation of carbon across the monitoring sites. Aquatic carbon fluxes were intrinsically linked to catchment hydrology, and large differences in runoff, particularly between the restoration sites, generated uncertainty regarding the impact of peatland restoration on fluvial carbon losses. We recommend that future studies combine detailed measurements of carbon speciation, as presented here, with rigorous hydrological monitoring to quantify carbon losses via different catchment flow paths, before and after peatland management interventions. With this approach the impact of peatland restoration on both aquatic carbon concentrations and fluxes can be fully quantified.
Carbon concentration data for all sites are available via the Environmental Information Data Centre (https://doi.org/10.5285/7525088d-e504-456a-bc55-e48d8ca85303, Pickard et al., 2021).
The supplement related to this article is available online at: https://doi.org/10.5194/bg-19-1321-2022-supplement.
MB collected field samples and undertook laboratory analyses. Data analysis was performed by KJD, AEP, and MB. MFB provided guidance on the scope and design of the project, and RA contributed land management data. AEP prepared the manuscript, with contributions from KJD, MFB, and RA.
The contact author has declared that neither they nor their co-authors have any competing interests.
Publisher's note: Copernicus Publications remains neutral with regard to jurisdictional claims in published maps and institutional affiliations.
Thanks to both the RSPB and the Bighouse Estate for facilitating access to the sampling sites across the project duration and to the RSPB for confirming the chronology of restoration activities within the Cross Lochs area.
Field and laboratory work for this study was undertaken during a PhD studentship awarded to Marcella Branagan and was funded via the “UHI Addressing Research Capacity” project, with financial contributions from the European Regional Development Fund, Highlands and Islands Enterprise, and Scottish Funding Council. Paper preparation time was funded by the Natural Environment Research Council, UK, as part of the Land Ocean Carbon Transfer (LOCATE; http://locate.ac.uk, last access: 5 November 2021) project, grant number NE/N018087/1. Roxane Andersen was funded by a Leverhulme Leadership Award (RL-2019-02), and access to land management data was made possible through the NERC “How does land management influence FIre REsilience in BLANKET bogs (FIRE BLANKET)” project, grant number NE/T006528/1.
This paper was edited by Edzo Veldkamp and reviewed by two anonymous referees.
Andersen, R., Farrell, C., Graf, M., Muller, F., Calvar, E., Frankard, P., Caporn, S., and Anderson, P.: An overview of the progress and challenges of peatland restoration in Western Europe, Restor. Ecol., 25, 271–282, https://doi.org/10.1111/rec.12415, 2017.
Andersen, R., Taylor, R., Cowie, N. R., Svobodova, D., and Youngson, A.: Assessing the effects of forest-to-bog restoration in the hyporheic zone at known Atlantic salmon (Salmo salar) spawning sites, Mires. Peat., 23, 1–11, https://doi.org/10.19189/MaP.2017.OMB.299, 2018.
Armstrong, A., Holden, J., Kay, P., Foulger, M., Gledhill, S., McDonald, A. T., and Walker, A.: Drain-blocking techniques on blanket peat: A framework for best practice, J. Environ. Manage., 90, 3512–3519, https://doi.org/10.1016/j.jenvman.2009.06.003, 2009.
Bain, C. G., Bonn, A., Stoneman, R., Chapman, S., Coupar, A., Evans, M., Gearey, B., Howat, M., Joosten, H., Keenleyside, C., Labadz, J., Lindsay, R., Littlewood, N., Lunt, P., Miller, C. J., Moxey, A., Orr, H., Reed, M., Smith, P., Swales, V., Thompson, D. B. A., Thompson, P. S., Van de Noort, R., Wilson, J. D., and Worrall, F.: IUCN UK Commission of Inquiry on Peatlands, Edinburgh, 2011.
Ball, D. F.: Loss-on-ignition as an estimate of organic matter and organic carbon in non-calcareous soils, J. Soil Sci., 15, 84–92, https://doi.org/10.1111/j.1365-2389.1964.tb00247.x, 1964.
Ballard, C. E., McIntyre, N., and Wheater, H. S.: Effects of peatland drainage management on peak flows, Hydrol. Earth Syst. Sci., 16, 2299–2310, https://doi.org/10.5194/hess-16-2299-2012, 2012.
Billett, M. F., Palmer, S. M., Hope, D., Deacon, C., Storeton-West, R., Hargreaves, K. J., Flechard, C., and Fowler, D.: Linking land-atmosphere-stream carbon fluxes in a lowland peatland system, Global Biogeochem. Cy., 18, https://doi.org/10.1029/2003GB002058, 2004.
Billett, M. F., Charman, D. J., Clark, J. M., Evans, C. D., Evans, M. G., Ostle, N. J., Worrall, F., Burden, A., Dinsmore, K. J., Jones, T., McNamara, N. P., Parry, L., Rowson, J. G., and Rose, R.: Carbon balance of UK peatlands: Current state of knowledge and future research challenges, Clim. Res., 45, 13–29, https://doi.org/10.3354/cr00903, 2010.
Billett, M. F., Garnett, M. H., and Dinsmore, K. J.: Should Aquatic CO2Evasion be Included in Contemporary Carbon Budgets for Peatland Ecosystems?, Ecosystems, 18, 471–480, https://doi.org/10.1007/s10021-014-9838-5, 2015.
de Wit, H. A., Ledesma, J. L. J., and Futter, M. N.: Aquatic DOC export from subarctic Atlantic blanket bog in Norway is controlled by seasalt deposition, temperature and precipitation, Biogeochemistry, 127, 305–321, https://doi.org/10.1007/s10533-016-0182-z, 2016.
Dinsmore, K. J., Billett, M. F., Skiba, U. M., Rees, R. M., Drewer, J., and Helfter, C.: Role of the aquatic pathway in the carbon and greenhouse gas budgets of a peatland catchment, Glob. Chang. Biol., 16, 2750–2762, https://doi.org/10.1111/j.1365-2486.2009.02119.x, 2010.
Dinsmore, K. J., Billett, M. F., and Dyson, K. E.: Temperature and precipitation drive temporal variability in aquatic carbon and GHG concentrations and fluxes in a peatland catchment, Glob. Chang. Biol., 19, 2133–2148, https://doi.org/10.1111/gcb.12209, 2013.
Evans, C. D., Jones, T. G., Burden, A., Ostle, N., Zieliński, P., Cooper, M. D. A., Peacock, M., Clark, J. M., Oulehle, F., Cooper, D., and Freeman, C.: Acidity controls on dissolved organic carbon mobility in organic soils, Glob. Chang. Biol., 18, 3317–3331, https://doi.org/10.1111/j.1365-2486.2012.02794.x, 2012.
Evans, C. D., Renou-Wilson, F., and Strack, M.: The role of waterborne carbon in the greenhouse gas balance of drained and re-wetted peatlands, Aquat. Sci., 78, 573–590, https://doi.org/10.1007/s00027-015-0447-y, 2016.
Evans, C. D., Peacock, M., Green, S. M., Holden, J., Chapman, P. J., Lebron, I., Callaghan, N., Grayson, R., and Baird, A. J.: The impact of ditch blocking on fluvial carbon export from a UK blanket bog, Hydrol. Process., 32, 2141–2154, https://doi.org/10.1002/hyp.13158, 2018.
Gaffney, P. P. J., Hancock, M. H., Taggart, M. A., and Andersen, R.: Measuring restoration progress using pore- and surface-water chemistry across a chronosequence of formerly afforested blanket bogs, J. Environ. Manage., 219, 239–251, https://doi.org/10.1016/j.jenvman.2018.04.106, 2018.
Gaffney, P. P. J., Hancock, M. H., Taggart, M. A., and Andersen, R.: Restoration of afforested peatland: Immediate effects on aquatic carbon loss, Sci. Total Environ., 742, 140594, https://doi.org/10.1016/j.scitotenv.2020.140594, 2020.
García-Martín, E. E., Sanders, R., Evans, C. D., Kitidis, V., Lapworth, D. J., Rees, A. P., Spears, B. M., Tye, A., Williamson, J. L., Balfour, C., Best, M., Bowes, M., Breimann, S., Brown, I. J., Burden, A., Callaghan, N., Felgate, S. L., Fishwick, J., Fraser, M., Gibb, S. W., Gilbert, P. J., Godsell, N., Gomez-Castillo, A. P., Hargreaves, G., Jones, O., Kennedy, P., Lichtschlag, A., Martin, A., May, R., Mawji, E., Mounteney, I., Nightingale, P. D., Olszewska, J. P., Painter, S. C., Pearce, C. R., Pereira, M. G., Peel, K., Pickard, A., Stephens, J. A., Stinchcombe, M., Williams, P., Woodward, E. M. S., Yarrow, D., and Mayor, D. J.: Contrasting Estuarine Processing of Dissolved Organic Matter Derived From Natural and Human-Impacted Landscapes, Global Biogeochem. Cy., 35, e2021GB007023, https://doi.org/10.1029/2021GB007023, 2021.
Gibson, H. S., Worrall, F., Burt, T. P., and Adamson, J. K.: DOC budgets of drained peat catchments: Implications for DOC production in peat soils, Hydrol. Process., 23, 1901–1911, https://doi.org/10.1002/hyp.7296, 2009.
Haapalehto, T., Kotiaho, J. S., Matilainen, R., and Tahvanainen, T.: The effects of long-term drainage and subsequent restoration on water table level and pore water chemistry in boreal peatlands, J. Hydrol., 519, 1493–1505, https://doi.org/10.1016/j.jhydrol.2014.09.013, 2014.
Heal, K., Phin, A., Waldron, S., Flowers, H., Bruneau, P., Coupar, A., and Cundill, A.: Wind farm development on peatlands increases fluvial macronutrient loading, Ambio, 49, 442–459, https://doi.org/10.1007/s13280-019-01200-2, 2020.
Helfter, C., Campbell, C., Dinsmore, K. J., Drewer, J., Coyle, M., Anderson, M., Skiba, U., Nemitz, E., Billett, M. F., and Sutton, M. A.: Drivers of long-term variability in CO2 net ecosystem exchange in a temperate peatland, Biogeosciences, 12, 1799–1811, https://doi.org/10.5194/bg-12-1799-2015, 2015.
Holden, J., Evans, M. G., Burt, T. P., and Horton, M.: Impact of Land Drainage on Peatland Hydrology, J. Environ. Qual., 35, 1764–1778, https://doi.org/10.2134/jeq2005.0477, 2006.
Holden, J., Green, S. M., Baird, A. J., Grayson, R. P., Dooling, G. P., Chapman, P. J., Evans, C. D., Peacock, M., and Swindles, G.: The impact of ditch blocking on the hydrological functioning of blanket peatlands, Hydrol. Process., 31, 525–539, https://doi.org/10.1002/hyp.11031, 2017.
Hope, D., Billett, M. F., Milne, R., and Brown, T. A. W.: Exports of organic carbon in British rivers, Hydrol. Process., 11, 325–344, https://doi.org/10.1002/(SICI)1099-1085(19970315)11:3<325::AID-HYP476>3.0.CO;2-I, 1997.
Hope, D., Palmer, S. M., Billett, M. F., and Dawson, J. J. C.: Carbon dioxide and methane evasion from a temperate peatland stream, Limnol. Oceanogr., 46, 847–857, https://doi.org/10.4319/lo.2001.46.4.0847, 2001.
Hope, D., Palmer, S. M., Billett, M. F., and Dawson, J. J. C.: Variations in dissolved CO2 and CH4 in a first-order stream and catchment: An investigation of soil-stream linkages, Hydrol. Process., 18, 3255–3275, https://doi.org/10.1002/hyp.5657, 2004.
Huotari, J., Nykänen, H., Forsius, M., and Arvola, L.: Effect of catchment characteristics on aquatic carbon export from a boreal catchment and its importance in regional carbon cycling, Glob. Chang. Biol., 19, 3607–3620, https://doi.org/10.1111/gcb.12333, 2013.
Joosten, H.: The Global Peatland CO2 picture Peatland status and drainage related emissions in all countries of the world, Wetl. Int., https://doi.org/10.1137/S1064827501399006, 2010.
Kling, G. W., Kipphut, G. W., and Miller, M. C.: Arctic lakes and streams as gas conduits to the atmosphere: Implications for tundra carbon budgets, Science, 251, 298–301, https://doi.org/10.1126/science.251.4991.298, 1991.
Kokic, J., Wallin, M. B., Chmiel, H. E., Denfeld, B. A., and Sobek, S.: Carbon dioxide evasion from headwater systems strongly contributes to the total export of carbon from a small boreal lake catchment, J. Geophys. Res.-Biogeo., 120, 13–28, https://doi.org/10.1002/2014JG002706, 2015.
Laiho, R.: Decomposition in peatlands: Reconciling seemingly contrasting results on the impacts of lowered water levels, Soil Biol. Biochem., 38, 2011–2024, https://doi.org/10.1016/j.soilbio.2006.02.017, 2006.
Lapen, D. R., Price, J. S., and Gilbert, R.: Soil water storage dynamics in peatlands with shallow water tables, Can. J. Soil Sci., 80, 43–52, 2000.
Leifeld, J., Wüst-Galley, C., and Page, S.: Intact and managed peatland soils as a source and sink of GHGs from 1850 to 2100, Nat. Clim. Change, 9, 945–947, https://doi.org/10.1038/s41558-019-0615-5, 2019.
Lindsay, R. A., Charman, D. J., Everingham, F., Reilly, R. M. O., Palmer, M. A., Rowell, T. A., Stroud, D. A., Ratcliffe, D. A., and Oswald, P. H.: The flow country; the peatlands of Caithness and Sutherland, Nat. Conserv. Counc. Peterbrgh., https://doi.org/10.1016/0006-3207(89)90043-8, 1988.
Menberu, M. W., Marttila, H., Tahvanainen, T., Kotiaho, J. S., Hokkanen, R., Kløve, B., and Ronkanen, A. K.: Changes in Pore Water Quality After Peatland Restoration: Assessment of a Large-Scale, Replicated Before-After-Control-Impact Study in Finland, Water Resour. Res., 53, 8327–8343, https://doi.org/10.1002/2017WR020630, 2017.
Monteith, D. T., Stoddard, J. L., Evans, C. D., De Wit, H. A., Forsius, M., Høgåsen, T., Wilander, A., Skjelkvåle, B. L., Jeffries, D. S., Vuorenmaa, J., Keller, B., Kopécek, J., and Vesely, J.: Dissolved organic carbon trends resulting from changes in atmospheric deposition chemistry, Nature, 450, 537–540, https://doi.org/10.1038/nature06316, 2007.
Nieminen, M., Sarkkola, S., and Laurén, A.: Impacts of forest harvesting on nutrient, sediment and dissolved organic carbon exports from drained peatlands: A literature review, synthesis and suggestions for the future, For. Ecol. Manage., 392, 13–20, https://doi.org/10.1016/j.foreco.2017.02.046, 2017.
Nilsson, M., Sagerfors, J., Buffam, I., Laudon, H., Eriksson, T., Grelle, A., Klemedtsson, L., Weslien, P., and Lindroth, A.: Contemporary carbon accumulation in a boreal oligotrophic minerogenic mire – A significant sink after accounting for all C-fluxes, Glob. Chang. Biol., 14, 2317–2332, https://doi.org/10.1111/j.1365-2486.2008.01654.x, 2008.
Parry, L. E., Holden, J., and Chapman, P. J.: Restoration of blanket peatlands, J. Environ. Manage., 133, 193–205, https://doi.org/10.1016/j.jenvman.2013.11.033, 2014.
Pawson, R. R., Evans, M. G., and Allott, T. E. H. A.: Fluvial carbon flux from headwater peatland streams: Significance of particulate carbon flux, Earth Surf. Proc. Land., 37, 1203–1212, https://doi.org/10.1002/esp.3257, 2012.
Peacock, M., Evans, C. D., Fenner, N., and Freeman, C.: Natural revegetation of bog pools after peatland restoration involving ditch blocking-The influence of pool depth and implications for carbon cycling, Ecol. Eng., 57, 297–301, https://doi.org/10.1016/j.ecoleng.2013.04.055, 2013.
Peacock, M., Jones, T. G., Futter, M. N., Freeman, C., Gough, R., Baird, A. J., Green, S. M., Chapman, P. J., Holden, J., and Evans, C. D.: Peatland ditch blocking has no effect on dissolved organic matter (DOM) quality, Hydrol. Process., 32, 3891–3906, https://doi.org/10.1002/hyp.13297, 2018.
Pickard, A., Dinsmore, K. J., Billett, M. F., and Branagan, M.: Aquatic carbon and greenhouse gas concentrations in headwater streams draining from natural, drained and restored peatland catchments in the Flow Country, Scotland, September 2008–August 2010, NERC Environmental Information Data Centre, [data set] https://doi.org/10.5285/7525088d-e504-456a-bc55-e48d8ca85303, 2021.
Rantakari, M., Mattsson, T., Kortelainen, P., Piirainen, S., Finér, L., and Ahtiainen, M.: Organic and inorganic carbon concentrations and fluxes from managed and unmanaged boreal first-order catchments, Sci. Total Environ., 302, 113981, https://doi.org/10.1016/j.scitotenv.2009.12.025, 2010.
Roulet, N. T., Lafleur, P. M., Richard, P. J. H., Moore, T. R., Humphreys, E. R., and Bubier, J.: Contemporary carbon balance and late Holocene carbon accumulation in a northern peatland, Glob. Chang. Biol., 13, 397–411, https://doi.org/10.1111/j.1365-2486.2006.01292.x, 2007.
Shah, N. W. and Nisbet, T. R.: The effects of forest clearance for peatland restoration on water quality, Sci. Total Environ., 693, 133617, https://doi.org/10.1016/j.scitotenv.2019.133617, 2019.
Shuttleworth, E. L., Evans, M. G., Pilkington, M., Spencer, T., Walker, J., Milledge, D., and Allott, T. E. H.: Restoration of blanket peat moorland delays stormflow from hillslopes and reduces peak discharge, J. Hydrol., 2, 100006, https://doi.org/10.1016/J.HYDROA.2018.100006, 2019.
Stanley, E. H., Casson, N. J., Christel, S. T., Crawford, J. T., Loken, L. C., and Oliver, S. K.: The ecology of methane in streams and rivers: Patterns, controls, and global significance, Ecol. Monogr., 86, 146–171, https://doi.org/10.1890/15-1027, 2016.
Strack, M. and Zuback, Y. C. A.: Annual carbon balance of a peatland 10 yr following restoration, Biogeosciences, 10, 2885–2896, https://doi.org/10.5194/bg-10-2885-2013, 2013.
Strack, M., Waddington, J. M., Bourbonniere, R. A., Buckton, E. L., Shaw, K., Whittington, P., and Price, J. S.: Effect of water table drawdown on peatland dissolved organic carbon export and dynamics, Hydrol. Process., 22, 4907–4920, https://doi.org/10.1002/hyp.6931, 2008.
Swenson, M. M., Regan, S., Bremmers, D. T. H., Lawless, J., Saunders, M., and Gill, L. W.: Carbon balance of a restored and cutover raised bog: implications for restoration and comparison to global trends, Biogeosciences, 16, 713–731, https://doi.org/10.5194/bg-16-713-2019, 2019.
Turner, E. K., Worrall, F., and Burt, T. P.: The effect of drain blocking on the dissolved organic carbon (DOC) budget of an upland peat catchment in the UK, J. Hydrol., 479, 169–179, https://doi.org/10.1016/j.jhydrol.2012.11.059, 2013.
Waddington, J. M. and Price, J. S.: Effect of peatland drainage, harvesting, and restoration on atmospheric water and carbon exchange, Phys. Geogr., 21, 433–451 https://doi.org/10.1080/02723646.2000.10642719, 2000.
Wallage, Z. E., Holden, J., and McDonald, A. T.: Drain blocking: An effective treatment for reducing dissolved organic carbon loss and water discolouration in a drained peatland, Sci. Total Environ., 367, 311–321, https://doi.org/10.1016/j.scitotenv.2006.02.010, 2006.
Wallin, M., Buffam, I., Öquist, M., Laudon, H., and Bishop, K.: Temporal and spatial variability of dissolved inorganic carbon in a boreal stream network: Concentrations and downstream fluxes, J. Geophys. Res.-Biogeo., 115, G02014 https://doi.org/10.1029/2009jg001100, 2010.
Walling, D. E. and Webb, B. W.: Estimating the discharge of contaminants to coastal waters by rivers: Some cautionary comments, Mar. Pollut. Bull., 16, 488–492, https://doi.org/10.1016/0025-326X(85)90382-0, 1985.
Williamson, J. L., Tye, A., Lapworth, D. J., Monteith, D., Sanders, R., Mayor, D. J., Barry, C., Bowes, M., Bowes, M., Burden, A., Callaghan, N., Farr, G., Felgate, S., Fitch, A., Gibb, S., Gilbert, P., Hargreaves, G., Keenan, P., Kitidis, V., Juergens, M., Martin, A., Mounteney, I., Nightingale, P. D., Pereira, M. G., Olszewska, J., Pickard, A., Rees, A. P., Spears, B., Stinchcombe, M., White, D., Williams, P., Worrall, F., and Evans, C.: Landscape controls on riverine export of dissolved organic carbon from Great Britain, Biogeochemistry, 2, https://doi.org/10.1007/s10533-021-00762-2, 2021.
Wilson, L., Wilson, J., Holden, J., Johnstone, I., Armstrong, A., and Morris, M.: Ditch blocking, water chemistry and organic carbon flux: Evidence that blanket bog restoration reduces erosion and fluvial carbon loss, Sci. Total Environ., 409, 2010–2018, https://doi.org/10.1016/j.scitotenv.2011.02.036, 2011.
Worrall, F., Reed, M., Warburton, J., and Burt, T.: Carbon budget for a British upland peat catchment, Sci. Total Environ., 312, 133–146, https://doi.org/10.1016/S0048-9697(03)00226-2, 2003.
Worrall, F., Burt, T., and Adamson, J.: Can climate change explain increases in DOC flux from upland peat catchments?, Sci. Total Environ., 326, 95–112, https://doi.org/10.1016/j.scitotenv.2003.11.022, 2004.
Worrall, F., Armstrong, A., and Holden, J.: Short-term impact of peat drain-blocking on water colour, dissolved organic carbon concentration, and water table depth, J. Hydrol., 337, 315–325, https://doi.org/10.1016/j.jhydrol.2007.01.046, 2007.
Yeloff, D. E., Labadz, J. C., Hunt, C. O., Higgitt, D. L., and Foster, I. D. L.: Blanket peat erosion and sediment yield in an upland reservoir catchment in the southern Pennines, UK, Earth Surf. Proc. Land., 30, 717–733, https://doi.org/10.1002/esp.1170, 2005.
Zheng, Y., Waldron, S., and Flowers, H.: Fluvial dissolved organic carbon composition varies spatially and seasonally in a small catchment draining a wind farm and felled forestry, Sci. Total Environ., 626, 785–794, https://doi.org/10.1016/j.scitotenv.2018.01.001, 2018.