the Creative Commons Attribution 4.0 License.
the Creative Commons Attribution 4.0 License.
 | 07 Mar 2022
Nitrite regeneration in the oligotrophic Atlantic Ocean
Darren R. Clark
Charissa M. Ferrera
Lisa Al-Moosawi
Paul J. Somerfield
Carolyn Harris
Graham D. Quartly
Stephen Goult
Glen Tarran
Gennadi Lessin
The recycling of scarce nutrient resources in the sunlit open ocean is crucial to ecosystem function. Nitrification directs ammonium () derived from organic matter decomposition towards the regeneration of nitrate (), an important resource for photosynthetic primary producers. However, the technical challenge of making nitrification rate measurements in oligotrophic conditions combined with the remote nature of these environments means that data availability, and the understanding that provides, is limited. This study reports nitrite () regeneration rate ( – the first product of nitrification derived from oxidation) over a 13 000 km transect within the photic zone of the Atlantic Ocean. These measurements, at relatively high resolution (order 300 km), permit the examination of interactions between and environmental conditions that may warrant explicit development in model descriptions. At all locations we report measurable with significant variability between and within Atlantic provinces. Statistical analysis indicated significant correlative structure between and ecosystem variables, explaining ∼65 % of the data variability. Differences between sampling depths were of the same magnitude as or greater than horizontally resolved differences, identifying distinct biogeochemical niches between depth horizons. The best overall match between and environmental variables combined chlorophyll-a concentration, light-phase duration, and silicate concentration (representing a short-term tracer of water column physical instability). On this basis we hypothesize that is related to the short-term autotrophic production and heterotrophic decomposition of dissolved organic nitrogen (DON), which regenerates and supports oxidation. However, this did not explain the observation that in the deep euphotic zone was significantly greater in the Southern Hemisphere compared to the Northern Hemisphere. We present the complimentary hypothesis that observations reflect the difference in DON concentration supplied by lateral transport into the gyre interior from the Atlantic's eastern boundary upwelling ecosystems.
- Article
(2134 KB) - Full-text XML
-
Supplement
(295 KB) - BibTeX
- EndNote


Oligotrophic gyres and their transition regions are the largest biome on Earth, covering approximately 60 % of its surface (Eppley and Peterson, 1979), and are expanding as a result of the warming climate (Polovina et al., 2008). Biogeochemical processes in these regions have the potential to influence global elemental cycles. Within the sunlit ocean, photosynthetic cells fix carbon dioxide (CO2) and assimilate inorganic nutrients to synthesize organic molecules and build biomass (Azam et al., 1983). Either directly or indirectly, this biomass supports the ecosystem and contributes over half of global organic carbon export (Emerson et al., 2001). Persistent stratification in these systems impedes nutrient inputs to the sunlit region from the deep ocean, constraining microbial growth (Eppley and Peterson, 1979; Moore et al., 2013). Consequently, efficient organic matter decomposition and inorganic nutrient regeneration are crucial to ecosystem function. Decomposition regenerates inorganic nitrogen in the form of ammonium (), which rarely accumulates in the open surface ocean as it is readily used in anabolic and chemotrophic microbial processes. Evidence demonstrates that nitrification, the two-stage oxidation of via nitrite () to nitrate (), takes place in the photic zone of open oceans (Santoro et al., 2013), where it directly competes with photosynthetic cells for the resource (Smith et al., 2014). The outcome of this competitive interaction is important; by moderating the composition and concentration of the dissolved inorganic nitrogen pool (, , ), nitrification influences nutrient limitation patterns for primary production at the basin scale (Fawcett et al., 2015; Moore et al., 2013; Palinska et al., 2002; Partensky et al., 1999). Biological processes within the ocean's upper mixed layer modify its chemistry and subsequently influence the composition of deep water masses through particle sedimentation, decomposition, and remineralization, with global implications for productivity and climate over a range of temporal scales (Rafter et al., 2013; Tuerena et al., 2015). In addition, nitrification is a source of the climatically active gas N2O within the surface ocean, which readily exchanges with the lower atmosphere. Characterizing the distribution of and constraints on nitrification is an important step towards fully assessing pelagic nitrogen transformations in the open ocean, although observations at the oceanic basin scale are limited (Clark et al., 2008; Shiozaki et al., 2016).
Within the open oceans, pelagic nitrification is distributed in a characteristic depth profile; low rates are measured in the well-lit near-surface waters, while the highest rates are reported at, or close to, the base of the photic zone in association with the primary nitrite maximum (PNM) and the deep chlorophyll maximum (DCM); rates drop rapidly below this depth into the twilight zone of the mesopelagic (Newell et al., 2013; Smith et al., 2016). Observational data have been crucial to the development of this understanding and indicate that environmental factors act simultaneously to structure the vertical distribution of nitrifying organisms and their activity. Evidence identifies roles for light (Olson, 1981; Shiozaki et al., 2016), concentration (Smith et al., 2016), organic matter flux (Benner and Amon, 2015; Newell et al., 2011), and competitive interactions with phytoplankton (Fawcett et al., 2015; Smith et al., 2014). However, the statistical analysis of nitrifying organism activity and diversity in relation to environmental factors explains only a fraction of the data variability, alluding to further complex and undefined interactions between the nitrifying activity of these organisms and their environment (Bouskill et al., 2012; Clark et al., 2014). A better appreciation of the factors that most significantly influence nitrifying activity is required to guide future fieldwork observations.
Here we present relatively high-resolution photic zone measurements of regeneration rate (, the product of oxidation, the first stage of nitrification) across a 13 000 km oligotrophic Atlantic Ocean transect to examine the process rate distribution and potential links to environmental conditions. Investigations were conducted during the Atlantic Meridional Transect programme (Rees et al., 2017), which, since 1995, has undertaken annual (or bi-annual) scientific observations of the Atlantic Ocean between the UK and Southern Hemisphere locations, including the Falkland Islands and Punta Arenas (Chile). The cruise track has historically navigated through marine provinces that include the Atlantic gyres, the equatorial upwelling convergence zone, mesotrophic fringing regions, and regions influenced by eastern boundary upwelling ecosystems (Mauritania, Benguela), sampling significant variability in biological, physical, and chemical conditions. By navigating between hemispheres, observations incorporate contrasting seasons, a signature that is evident in biogeochemical observations, despite persistent water column stability that typifies tropical and sub-tropical open oceans. Within this observational context, the overarching objective of the study was to highlight interactions between and environmental conditions that may warrant explicit development and inclusion in model descriptions.
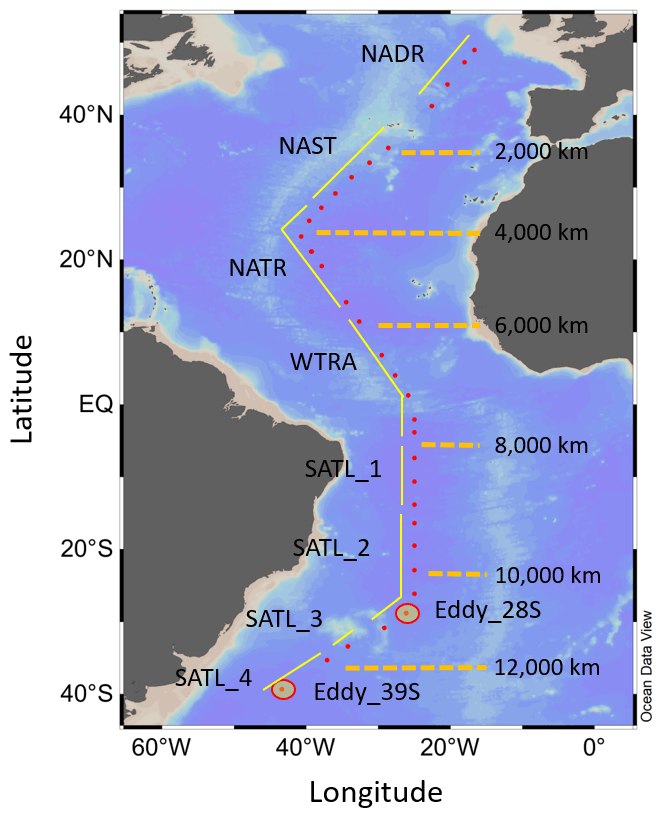
Figure 1Map of the study area, indicating the positions of sampling stations for N-cycle studies (red dots), the approximate transect distances, and the associated Longhurst provinces (Longhurst, 1998); North Atlantic Drift (NADR), North Atlantic sub-tropical gyre (NAST), North Atlantic tropical gyre (NATR), western tropical Atlantic (WTRA), South Atlantic gyre (SATL). The locations of two eddy features are also indicated.
2.1 Water column characterization
This study was undertaken during Atlantic Meridional Transect (AMT) cruise 19 (13 October to 1 December 2009) aboard the RRS James Cook between Falmouth (UK) and Punta Arenas (Chile; Fig. 1), passing through the following Atlantic provinces (Longhurst, 1998): North Atlantic Drift (NADR), North Atlantic sub-tropical gyre (NAST), North Atlantic tropical gyre (NATR), western tropical Atlantic (WTRA), South Atlantic gyre (SATL). Seawater was collected for biogeochemical observations from a total of 120 CTD (conductivity, temperature and depth) rosette casts, of which 33 were used for isotope studies to derive . An instrumented package was deployed during solar noon to derive semi-continuous vertical profiles of light, salinity, temperature, chlorophyll concentration, and dissolved oxygen. Light depth profiles were derived using photosynthetically active radiation (PAR) data recorded by a Chelsea Instruments PAR sensor. A stainless-steel rosette unit was deployed during dawn casts (typically 06:00 GMT), incorporating a Sea-Bird 9/11 plus Conductivity, Temperature, Depth system, a Chelsea MKIII Aquatracka fluorimeter, a Sea-Bird SBE 43 Dissolved Oxygen Sensor, and 20 L Niskin bottles for water collection from specific sampling depths.
2.2 Nutrient analysis
Inorganic nutrient samples collected from dawn casts at between 6 and 12 depths within the upper 250 m were immediately analysed. Nitrite (), nitrate (), phosphate (), and silicate (Si(OH)4) were measured colorimetrically with a five-channel segmented flow Bran and Luebbe AAIII autoanalyser using methods described previously (Woodward and Rees, 2001). The concentration of was not determined during this study.
2.3 Analytical flow cytometry
Microbial cells were enumerated based on their light scattering and auto-fluorescence properties using a BD FACSort™ flow cytometer. Photosynthetic cells were analysed live within 1–2 h of collection. Non-photosynthetic cells were fixed with paraformaldehyde for 1 h at 4 ∘C and then stained with SYBR Green I DNA stain (Life Technologies, Paisley, UK) in the dark at room temperature for 1 h. Live samples were analysed at a flow rate of 180 µL min−1 for 4 min. Fixed/stained samples were analysed at either 50 or 12 µL min−1 for 1–2 min, depending on concentration. Data acquisition for photosynthetic cells was triggered on red (chlorophyll) fluorescence, while the enumeration of SYBR Green I-stained bacteria and archaea was triggered on green fluorescence. Flow rates were calibrated daily using fluorospheres of known concentration.
2.4 determination using 15N isotope studies
Approximately 4 L of seawater collected from depths equivalent to 14 %, 1 %, and 0.1 % (the latter defining the base of the euphotic zone for the purposes of this investigation) of surface-measured PAR (sPAR) was used for studies. The isotope dilution approach (Clark et al., 2007, 2008, 2014) was used to derive by measuring the rate of product formation ( regeneration). These 4 L sample volumes were amended with 15 at <10 % of the ambient concentration. Following amendment, triplicate 500 mL sub-samples were taken. Within these triplicate sub-samples, pre-incubation NO2 concentration and 15N enrichment were determined by synthesizing Sudan-1 (see below) from sample . From the remaining volume, triplicate 500 mL incubation vessels were filled and placed in deck incubation units covered with neutral density filters to simulate sPAR depths according to Joint Global Ocean Flux Study protocols (IOC, 1994). Incubation boxes were flushed with recirculating depth-appropriate temperature-controlled seawater. Following approximately 10 h of daytime incubation, experiments were terminated by GF/F filtration. Sudan-1 was synthesized from within 500 mL samples, allowing post-incubation concentration and 15N enrichment to be measured. During these studies, a pre-incubation 15 enrichment of 5.41 ± 2.18 % was achieved, which was diluted by 0.92 ± 0.83 % on average due to biological activity during incubation.
Sudan-1 is synthesized for this purpose of measuring concentration and isotopic enrichment as it is readily formed and collected at room temperature and it is stable and amenable to both purification and isotopic analysis. For Sudan-1 synthesis, the first reagent (0.8 g of aniline sulfate in 200 mL 3 M HCl) was added to seawater samples in the proportion 0.5 mL per 100 mL sample volume. After mixing, samples were left for 5 min to homogenize, after which sample pH was verified to be approximately 2.0. Reagent 2 (24 g NaOH and 0.416 g 2-naphthol in 200 mL Milli-Q) was added in the proportion 0.5 mL per 100 mL sample volume. Samples were again mixed and left for 5 min before sample pH was verified to be approximately 8.0. The development of Sudan-1 was complete after 30 min of incubation at room temperature. Samples were acidified with citric acid (final pH 5.5) and an appropriate volume of deuterated Sudan-1 internal standard (100 ng µL−1) was added. Deuterated Sudan-1, which was used for sample quantification, was synthesized and purified according to methods described previously (Clark et al., 2006, 2007). Samples were collected by solid-phase extraction (SPE) using octadecyl (C18) 6 mL, 500 mg cartridges. SPE columns were stored at −20 ∘C until analysis.
At the land-based laboratory, samples eluted from SPE cartridges were purified by high-performance liquid chromatography (HPLC). Using a ramping methanol/Milli-Q water profile in combination with a Gemini-NX 5u C18 110A 250×4.6 mm column, sample peaks were resolved. The peak containing Sudan-1 internal standard was retained using a fraction collector, while the remaining sample volume was discarded. Fraction-collected samples were dried and stored over anhydrous silica gel until further analysis. Purified silylated samples were analysed by gas chromatography mass spectrometry (GCMS) using a HP-5ms column (30 m × 0.25 mm internal diameter), with the ramping profiles and extracted ions described in Clark et al. (2007). An analysis of recovery efficiency from SPE cartridges within a theoretical mass range of 200–1000 ng was >94 % on average, decreasing with increased sample size from 99 % to 92 %. Within this sample mass range, the standard deviation for the ratio of Sudan-1 ions used for isotopic analysis of 15N tracer ( 306.2 / 305.2) decreased from 7 ‰ to 1 ‰. Assuming a 200 ng sample of Sudan-1 (although samples as low as 50 ng can be analysed) derived from a 500 mL seawater sample, the associated ambient NO concentration would be 1.6 nmol L−1, significantly less than the average ambient concentration of approximately 5 nmol L−1 (see below).
Nitrite regeneration rates (; pmol L−1 h−1) were calculated according to the Blackburn–Caperon model (Blackburn, 1979; Caperon et al., 1979):
where Roa was the pre-incubation ratio of 306.2 / 305.2 for Sudan-1 derived from sample , Rta was the post-incubation ratio of 306.2 / 305.2 for Sudan-1 derived from sample , Soa was the pre-incubation concentration (nmol N L−1), and Sta was the post-incubation concentration (nmol N L−1) after ta hours of incubation.
2.5 Statistical analysis
data and associated explanatory variables were analysed using a range of multivariate statistical methods (Clarke et al., 2014). Most variables were skewed, so prior to analysis all variables except phosphate excess (P*; calculated as were log-transformed to reduce the influence of extreme values in subsequent analyses. Variables were normalized by subtracting the mean and dividing by the standard deviation to convert them all to a common dimensionless scale. Relationships among samples based on the explanatory variables were visualized using principal component analysis (PCA), and hypothesis testing for differences among groups of samples was undertaken using analysis of similarities (ANOSIM) with ordered factors (Somerfield et al., 2021). The generalized ANOSIM statistic is a scaled measure of effect size comparable across different tests.
To analyse relationships between and explanatory variables, the data for each sPAR band were analysed separately. To determine whether there was structure among variables that warranted further analysis, explanatory variables were subject to type-2 similarity profiles (SIMPROF) analysis (Somerfield and Clarke, 2013). A Euclidean distance matrix was calculated for . A stepwise search algorithm (BVSTEP) with forward-selection and backward-elimination steps (Clarke and Warwick, 1998) was used to search for the smallest subset of explanatory variables that, in combination, “best matched” the pattern of across samples, the best match being defined as maximizing the rank correlation between corresponding distance matrices. The algorithm was run with 20 restarts of six randomly selected variables. The significance of the maximum rank correlation was tested using an appropriate permutation test (Clarke et al., 2008).
2.6 Contemporaneous physical oceanography data
The ship, RRS James Cook, made routine physical measurements whilst underway using the thermosalinograph to give temperature and salinity of the water at ∼5 m depth and a depth profile of currents relative to the ship using the vessel-mounted 150 kHz acoustic Doppler current profiler (ADCP). The latter was corrected using the ship's navigation to give absolute instantaneous currents along the ship's track. To put these measurements in context, data were subsequently obtained from satellite altimeter and profiling floats that were in the area. These two sources of data were particularly useful in understanding anomalous observations at two of the CTD stations (28, 39∘ S).
The altimetry data were sourced from the Copernicus Marine Environment Monitoring Service (CMEMS), who combine the sea surface height measurements from available observations and interpolated these data onto a regular grid. Variations in sea level at the mesoscale (order 100–300 km) could be interpreted as eddies, with a local negative anomaly having cyclonic flow about it (clockwise in the Southern Hemisphere) and highs (anticyclones) having flow in the opposite direction. These flows were in geostrophic balance and thus represent stable current regimes not incorporating tides or the effect of short wind bursts. Because of the long and near-global altimetric record, these data can be used to identify regions of persistent variability and to track the evolution of features over periods ranging from weeks to years. However, satellites only give a near-surface view.
Profiles of temperature and salinity in the vicinity of the ship's track were provided by Argo floats, which are autonomous profilers typically recording 0–2000 m vertical sections every 10 d. As these instruments are freely drifting within the ocean, the location and timing of their measurements are not linked to those of the ship. Argo data for the required regions were obtained and the profiles analysed to give a measure of depth of the surface layer, defined as the depth at which temperature was more than 3 ∘C below that of the surface.

Figure 2Contour plots of water column temperature (a) and salinity (b) measured during CTD-rosette casts. The calculated daily light dose (PAR intensity × light-phase duration) received at sampling depths is presented (c) in addition to the duration of the light phase (in hours). The approximate position of Longhurst provinces (defined in Fig. 1) is indicated. Symbols represent 14 % sPAR (circle), 1 % sPAR (triangle), and 0.1 % sPAR (square). The locations of two eddy features are indicated by vertical dashed (28∘ S) and dotted (39∘ S) lines.
3.1 Temperature, salinity, and PAR
Characteristic physical features of oligotrophic oceans were demonstrated (Fig. 2a–c). The water column was thermally stratified, with sampling locations straddling a temperature range of approximately 12–29 ∘C. The deepest mixed-layer depths were associated with the central regions of the Atlantic gyres. Stratification weakened towards the northern and southern limits of the transect. In terms of salinity, sampling depths incorporated a range of 34.3–37.5. The most saline regions were associated with the ocean gyres and were highest in the northern gyre. A region of relatively low-salinity water was associated with the surface 30 m of the WTRA, defining the lower limit of the salinity range measured. In terms of the light field, 0.1 % sPAR defined the deepest sampling point and equated to a depth within the range 75–200 m. Light dose (defined as the light intensity multiplied by the daylight duration) across sampling depths spanned ∼2 orders of magnitude. Daylight duration increased progressively south, associated with the seasonal transition from boreal autumn to austral spring.
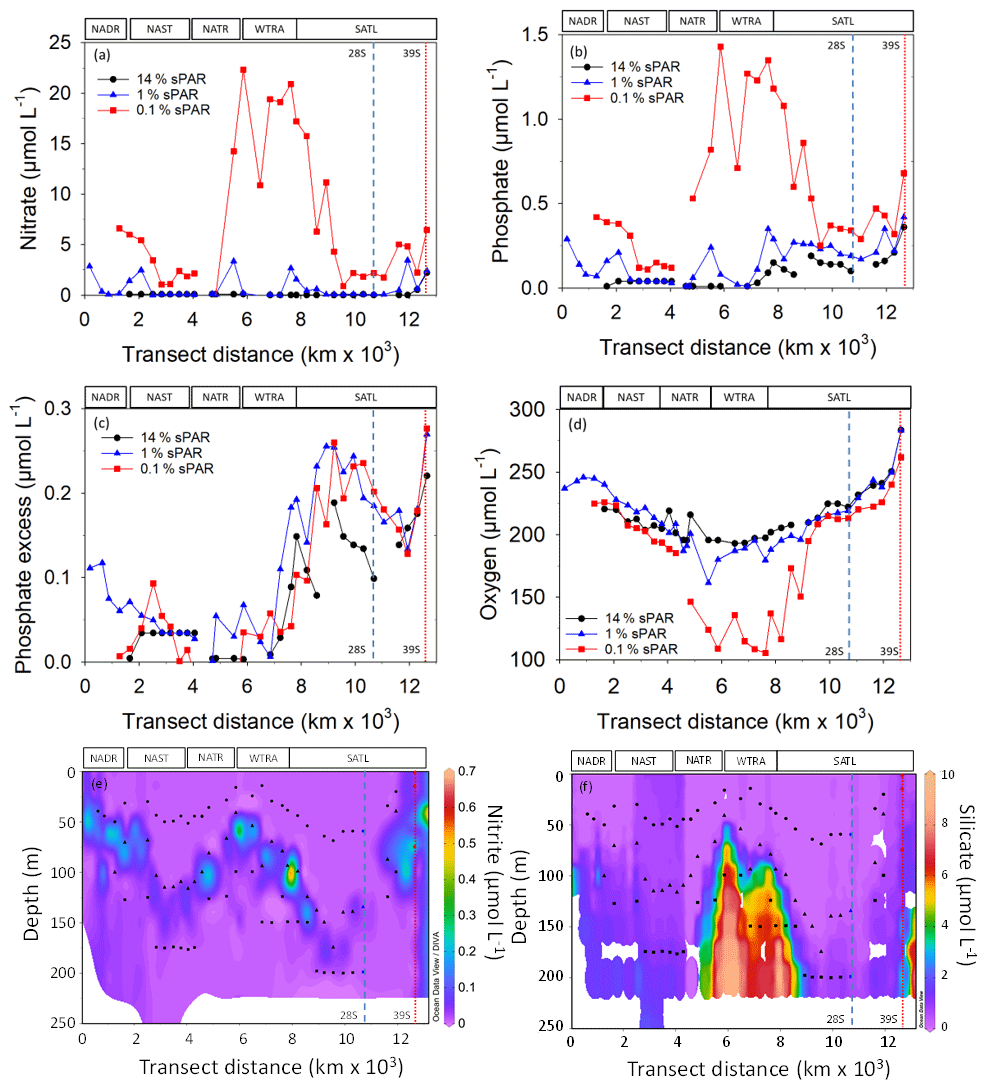
Figure 3The concentration of nitrate (a), phosphate (b), phosphate excess (P*; c), oxygen (d), nitrite (e), and silicate (f). The locations of two eddy features are indicated by vertical dashed (28∘ S) and dotted (39∘ S) lines. The approximate locations of Longhurst provinces (defined in Fig. 1) are indicated. Symbols represent 14 % sPAR (circle), 1 % sPAR (triangle), and 0.1 % sPAR (square). The locations of two eddy features are indicated by vertical dashed (28∘ S) and dotted (39∘ S) lines.
3.2 Inorganic nutrients and dissolved oxygen
Inorganic nutrient concentration measurements demonstrated oligotrophic (<100 nmol L−1 and , Fig. 3a and b) conditions throughout the transect at 14 % sPAR. At the 1 % sPAR depth, the concentration of and was generally low (<600 and <150 nmol L−1 respectively). The highest concentrations of and were measured at the 0.1 % sPAR depth, notably in the NATR/WTRA/SATL region. A P* of approximately 0.2 µmol L−1 was measured at South Atlantic stations (Fig. 3c). A concentration maximum was associated with the 1 % sPAR depth, where an average of 117 ± 112 nmol L−1 was measured (Fig. 3e). Extremely low concentrations of Si(OH)4 were measured in the well-lit surface ocean, progressively increasing at 1 % and 0.1 % sPAR depths (Fig. 3f).
The dissolved oxygen concentration was generally within the range 150–280 µmol L−1, with the exception of the 0.1 % sPAR depth in the NATR/WTRA/northern SATL, where concentrations approaching 100 µmol L−1 were measured (Fig. 3d).
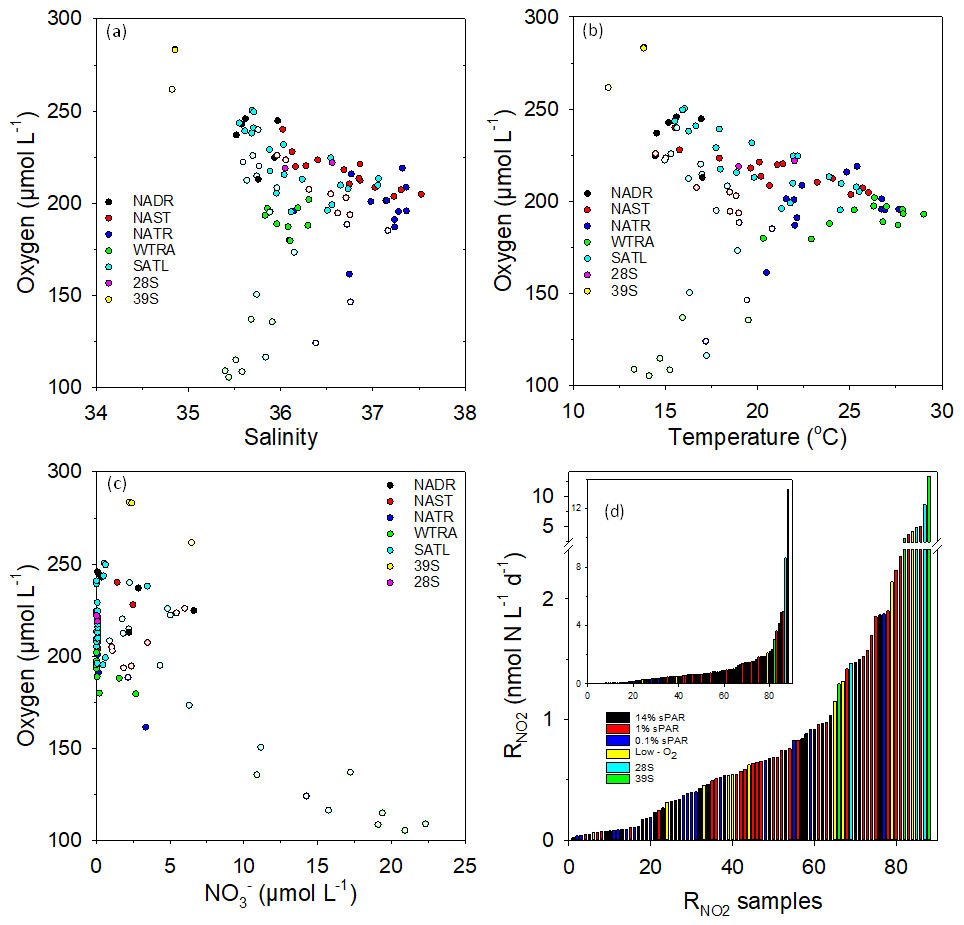
Figure 4Plots of dissolved oxygen concentration vs. salinity (a), temperature (b), and (c) within Longhurst provinces (defined in Fig. 1). Open circles represent 0.1 % sPAR data, highlighting distinct characteristics associated with specific NATR/WTRA/SATL sampling points. To represent the distribution of rate data, the 88 measurements were arranged in ascending order (d, insert has linear scale) with an indication of sampling depth or the association with a specific feature (low oxygen, defined as <150 µmol L−1 or mesoscale eddy). Measurements within eddy features tend towards the high end of the scale, as do measurements at 1 % sPAR. Low-oxygen measurements show no clear distributional trend, while 14 % and 0.1 % sPAR values tend towards the low end of the scale.
Plots of dissolved oxygen concentration against salinity (Fig. 4a), temperature (Fig. 4b), and (Fig. 4c) are presented. Low dissolved oxygen concentrations measured at 0.1 % sPAR within the NATR/WTRA/SATL provinces were associated with lower salinity, temperature, and relatively high . measurements associated with low-oxygen sampling depths were not anomalously elevated (Fig. 4d). In contrast, and physicochemical characteristics of the eddy station identified as 39∘ S distinguished it from the conditions associated with the majority of sampling stations within the transect.
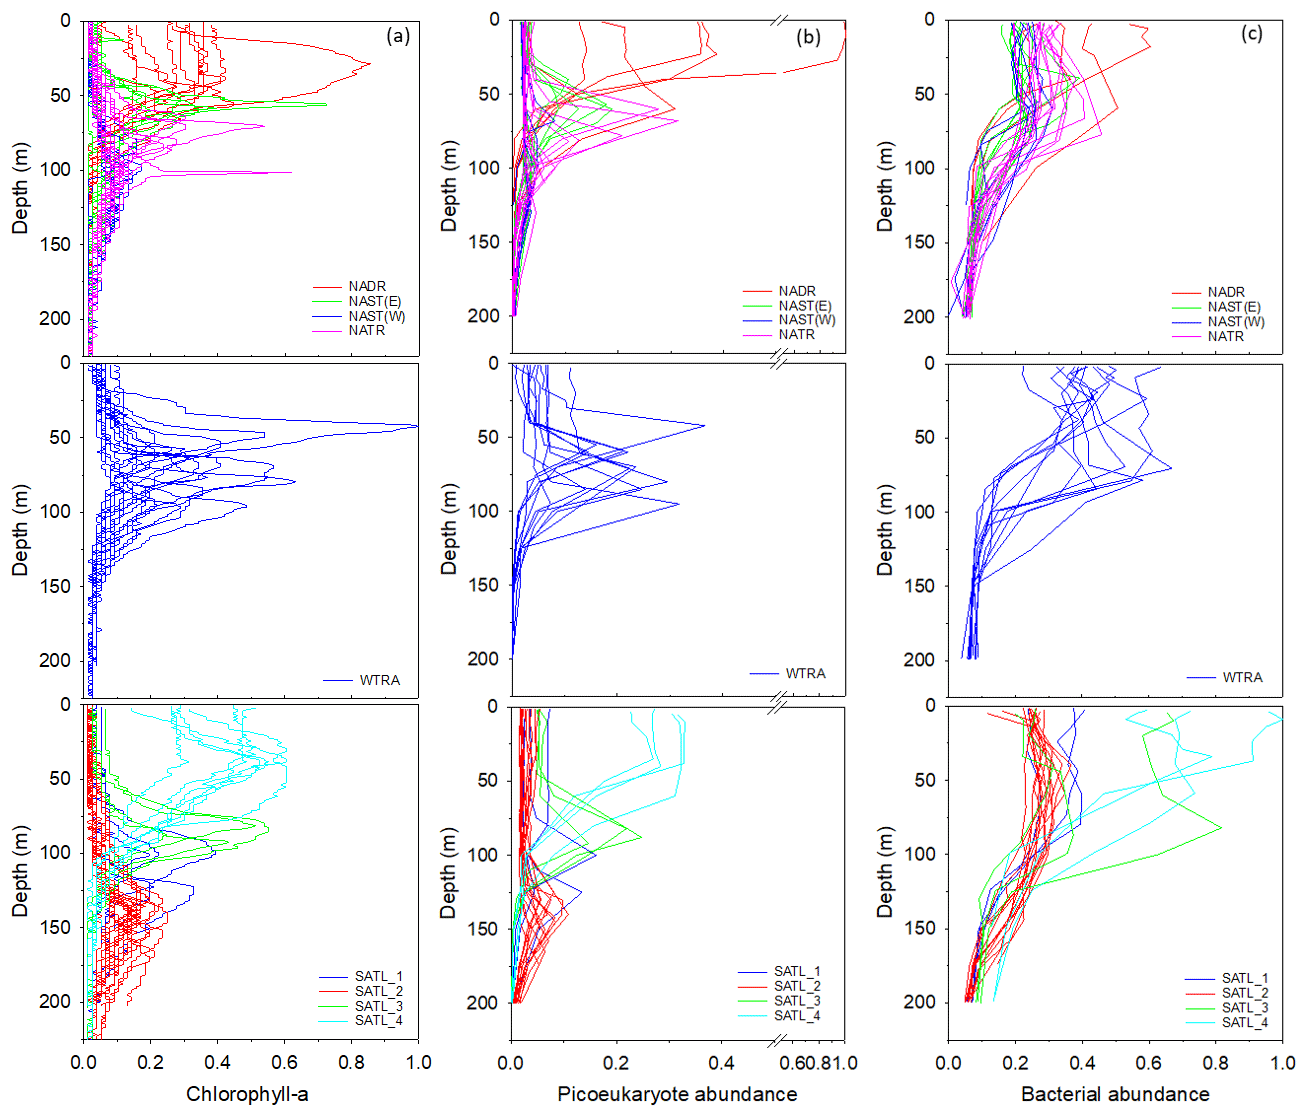
Figure 5Profiles of chlorophyll-a concentration (a), the abundance of picoeukaryotes (b), and bacteria (c) within Longhurst provinces (defined in Fig. 1). Data are presented as a ratio of the maximum value measured for each parameter throughout the transect. Profiles frequently describe comparable distributions within a defined province. However, data are sub-divided within the SATL province to illustrate apparent distinctions in vertical structure.
3.3 Microbial cell distribution and abundance
Profiles of chlorophyll-a concentration (Fig. 5a) indicated that, within provinces of the North Atlantic, the sub-surface maximum generally deepened progressively south. The highest chlorophyll-a concentration was measured within the WTRA, although there was considerable variability in the depth of the chlorophyll-a maximum within this province. Within the South Atlantic, although sampling stations were classified as the SATL province, chlorophyll-a profiles could be grouped into four illustrative sub-divisions characterized by a general shallowing of the chlorophyll-a maximum progressively south.
Picoeukaryotes (Fig. 5b) had a distribution that was similar to that of chlorophyll a, in contrast to the profiles of the photosynthetic cyanobacteria Synechococcus and Prochlorococcus (results presented in Supplement Fig. S1 and in Tarran and Zubkov, 2020). Bacterial cell distribution (Fig. 5c) was comparable between gyres though less defined within the WTRA and indicated that the highest bacterial abundance was measured within the relatively well-lit surface ocean.

Figure 6 measurements at 7∘ S within the context of selected physical, chemical, and biological measurements, illustrating relationships between water column characteristics.
3.4 Rates of
Within the physical, chemical, and biological context described above, was measured (Fig. 6). For all data (Fig. 7a–c and Clark et al., 2017), the range of volumetric rate measurements was 0.02–13.27 nmol N L−1 d−1, n=88 triplicated measurements. When integrated from the surface to the 0.1 % sPAR, the range of was 0.01–0.91 mmol N m−2 d−1 (average 0.11 ± 0.08 mmol m−2 d−1). By extrapolating the vertically integrated results of each station (excluding 28 and 39∘ S) from the Equator into each hemisphere across a comparable distance (Fig. 8), the concentration of regenerated was calculated to be 0.36 mol N d−1 (1×4457 km transect) and 0.72 mol N d−1 (1×4637 km transect) for the North Atlantic Gyre and South Atlantic Gyre respectively. The box plot presented in Fig. 7d highlights variability within discrete sPAR bands of each hemisphere, with mean values generally skewed towards the lower region of the data range. The distribution of rate measurements is presented in Fig. 7e, while provincial variability, which averaged 25-fold, is presented in Fig. 7f. Using a two-sample t test assuming unequal variance, at 1 % sPAR in the North Atlantic (M=0.76 nmol L−1 d−1, SD = 0.67 nmol L−1 d−1) was significantly lower than at 1 % sPAR in the South Atlantic (M=1.77 nmol L−1 d−1, SD = 1.52 nmol L−1 d−1); ; p=0.03 (no significant difference between hemispheres was found for 14 % and 0.1 % sPAR depths). Volumetric rates of equated to a NO2 turnover of 0.4–335 d (average 33 d).
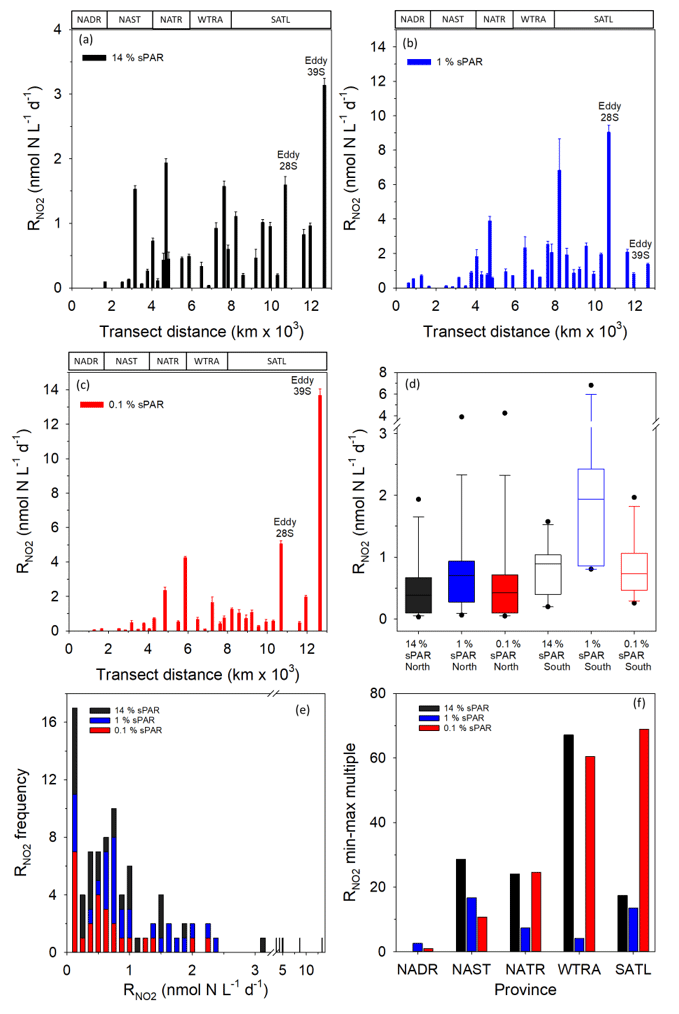
Figure 7Volumetric rates of regeneration at 14 % (a), 1 % (b), and 0.1 % (c) sPAR. Error bars represent 2 standard deviations of triplicate measurements. The approximate positions of Longhurst provinces (defined in Fig. 1) are identified in these plots. The box plot (d) presents data for each hemisphere (excluding 28/39∘ S) as sPAR depths. The 10th, 25th, 75th, and 90th data percentiles are presented with the data median (line within the box). A histogram of the rate distribution and frequency is presented in (e). An indication of variability is presented in (f) as the number of minimum-value multiples that equate to the largest value within each province.
Table 1Results of principle component analysis. Eigenvalues are presented in (a). (b) Eigenvectors are presented, the coefficients in linear combinations of variables making up principal components (PCs).

3.5 Multivariate analysis
PCA of the full set of 24 environmental variables considered (Table 1; Fig. 9) clearly demonstrated that differences between sPAR bands were of the same magnitude as or greater than differences along the transect length. Variation in PC1, accounting for 42.7 % of the total, was clearly associated with differences among sPAR bands. Differences among samples along the transect within sPAR bands were clearly associated with variation in PC2, accounting for 23.4 % of the total. This was supported by two-way ANOSIM with ordered factors, latitude, and sPAR band, where the test for differences among latitudes removing differences over sPAR bands (, p<0.001) gave a lower value for the statistic than the corresponding test for differences among sPAR bands removing latitudinal trends (, the maximum possible, p<0.001). It was thus decided to analyse relationships among and environmental variables within each sPAR band separately.
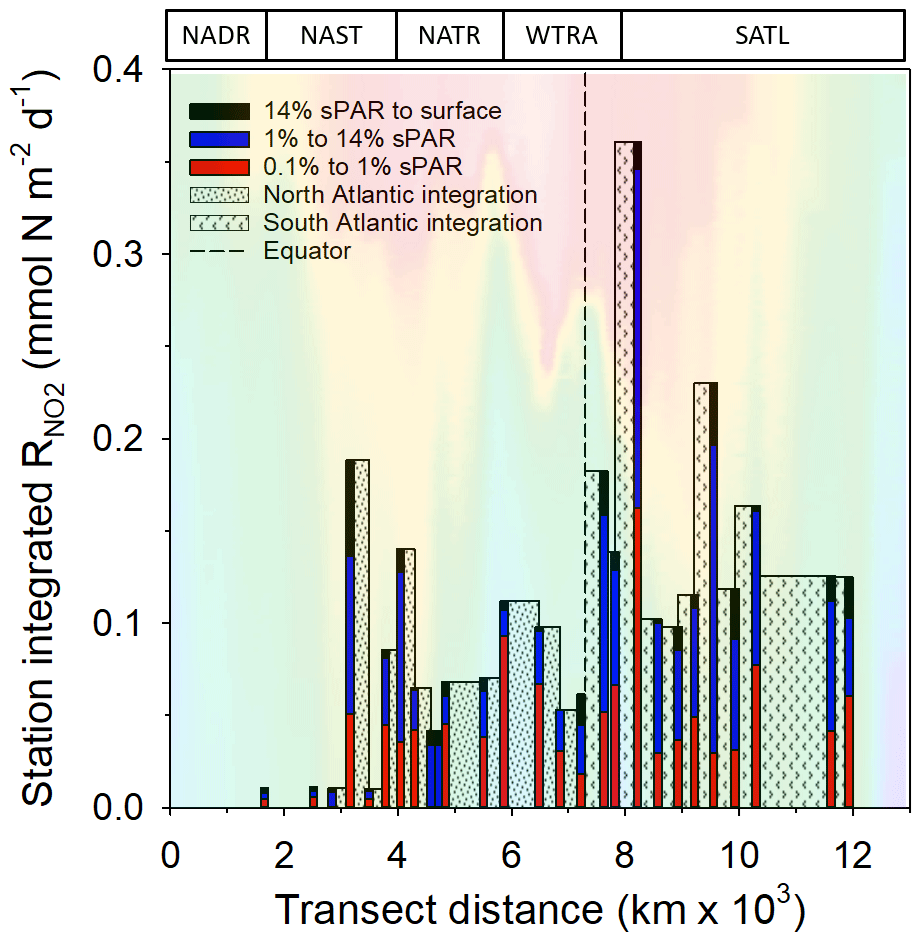
Figure 8 integrated to the 0.1 % sPAR depth at individual stations. These values (excluding stations 28 and 39∘ S) are extrapolated between stations extending from the Equator to a comparable distance north (33∘ N) and south (35∘ S) of the Equator. The concentration of ammonium-N oxidized was calculated to be 0.36 mol N d−1 over a 1 m × 4457 km distance north of the Equator and 0.72 mol N d−1 over a 1 m × 4637 km distance south of the Equator. Seawater temperature (as presented in Fig. 2) is included to provide illustrative context to the data. The approximate positions of Longhurst provinces (defined in Fig. 1) are indicated.
SIMPROF showed evidence of significant correlation structure among variables in all three sPAR bands (14 % sPAR band, π=0.296, p<0.001; 1 % sPAR band, π=0.205, p<0.001; 0.1 % sPAR band, π=0.157, p<0.001). In the 14 % sPAR band there was a significant relationship (ρ=0.313, p=0.025) between patterns in and a subset of three explanatory variables consisting of light hours, chlorophyll a, and silicate. In the 1 % sPAR band the best subset, also of three variables, contained light hours and chlorophyll a but instead of silicate. The overall relationship was not significant (ρ=0.170, p=0.474). In the 0.1 % sPAR band the best subset (ρ=0.415, p<0.001) contained six variables: light hours, chlorophyll a, temperature, , , and P*. A two-way search for the best overall match within sPAR bands removing any latitudinal effect selected light hours, chlorophyll a, and silicate, ρave=0.267, p<0.001.
3.6 Eddy features 28 and 39∘ S
The majority of the AMT ran through quiescent waters free of rapidly varying mesoscale features. The equatorial belt is a region of counter-flowing currents, but these did not lead to any unusual features during this particular AMT campaign. However, anomalous profiles were observed at 28 and 39∘ S (Fig. 1) in the form of conspicuously prominent (Fig. 7a–c). The spatial separation of CTD stations (∼300 km) was too great to resolve these physical features. Thus, altimeter and Argo data were obtained subsequent to the cruise in order to provide context to these observations.
Mapped fields of sea surface height (SSH) from CMEMS were used to calculate the mean sea surface topography and the variations about that (Fig. 10). A map of the root mean square variability (Fig. 10c) demonstrated the typical changes north of 35∘ S to be only ∼0.1 m; however, even in this region there were a number of highs in the SSH anomaly (deviation from the mean) at the time of sampling the 28∘ S station (Fig. 10a). The anticyclonic feature centred on station 28∘ S had anticlockwise geostrophic flow along the contours in the SSHA, while the total near-surface velocity recorded by the ADCP was mainly to the south-west. A series of SSHA composites a week apart showed a central anticyclonic feature to be moving westwards, while the contemporaneous Argo profiles showed that the thickest mixed layer was located close to the centre of this feature (Fig. 10b). A larger anticyclonic feature was seen 400 km further to the east. Examination of a time series of SSHA maps and Hovmöller diagrams (Figs. S2 and S3) confirmed that these features had travelled from the Agulhas Retroflection, taking 2.5 years to get to this location.
The feature around CTD station 39∘ S was very different. This is the region of the Brazil–Falklands Confluence, where two strong currents collide, generating significant mesoscale activity and locally generated eddies. These features also move westwards, but their associated water masses were not from the Agulhas region. In this region the total velocities from the ADCP agreed with the contour directions governing the geostrophic flow. As it is a much more active region, Argo floats do not remain in the region for long, so the examples found (Fig. 10d) were more dispersed than in the previous case. Using the previously stated definition of the depth of the surface layer produced much larger values than at 28∘ S but again supported the concept that the surface layer was much deeper over the highs in SSH than over the lows.
4.1 Overview and objectives
This study measured (Clark et al., 2017) within the photic zone across an extended spatial scale (13 000 km), reporting significant variability between and within provinces of the oligotrophic Atlantic Ocean between ∼49∘ N and ∼39 ∘ S. Insights add to evidence that surface ocean nitrification is an important component of pelagic nitrogen cycling that modifies the inorganic nitrogen inventory. Particular features of interest included a significant hemispheric difference in and elevated associated with mesoscale eddy features. Analysis of potential links between and routinely measured ecosystem variables indicated significant co-variability between , chlorophyll-a concentration, the duration of the light phase, and silicate concentration, alluding to an association between and product(s) of photosynthetic activity. However, a significant fraction (∼35 %) of variability in remained unexplained, indicating that additional factors were excluded from this analysis. We first consider the biogeochemical context to the study before presenting rate observations and insights from statistical analysis.
4.2 Physical context
A thermal range of ∼17 ∘C typically existed in vertical 250 m water column profiles. While temperature has a direct impact on rates of biological activity, the physical stability of the water column caused by thermal stratification establishes spatially distinct biogeochemical niches (Giovanoni and Vergin, 2012). Within the well-lit surface ocean that includes the 14 % sPAR, defined as the region between the sea surface and the deep chlorophyll-a maximum (DCM), turbulent mixing with nutrient-rich deep water is suppressed and biological activity maintains extremely low inorganic nutrient concentrations. Relatively sharp physicochemical gradients at depths similar to the 1 % sPAR create a niche where low light-adapted phototrophs access relatively high inorganic nutrient concentrations, forming the DCM. At greater depths, incorporating the 0.1 % sPAR and typically referred to as the twilight zone (approximately 100–1000 m), water continues to cool. While there is relatively little information for the temperature sensitivity of nitrification in the open ocean, Horak et al. (2017) demonstrated that a temperature effect on oxidation was observed at only two of four North Pacific stations. Horak et al. (2013) demonstrated a relative insensitivity to a temperature range of 8–20 ∘C in their study of a fjord-like basin, although low pH at the study site may have constrained any temperature response (Beman et al., 2011).
The range in salinity was ∼3.2, with limits defined by notably fresher water in the sub-tropical region (WTRA), a feature potentially related to intense rainfall within the inter-tropical convergence zone and relatively high salinity in the central Atlantic gyres. While a contributory role for salinity in shaping nitrifying community structure has been identified in studies of estuarine sediments (Bernhard et al., 2010), such gradients are considerably more extreme than those of the open oceans, where little if any information is available to describe its influence upon variability in nitrification rate.
The attenuation of light with depth leads to progressively decreasing daily light doses, ranging 2 orders of magnitude across the three sampling depths (Fig. 2c). Superimposed upon diel- and depth-related light variability was a seasonal increase in daylight duration progressively south associated with the transition from boreal autumn to austral spring. Seasonally variable characteristics are evident in the photic zone of sub-tropical Atlantic gyres driven by changes in solar insolation (McClain et al., 2004). Weaker solar insolation during winter suppresses DCM productivity, allowing higher nutrient concentrations to pass this “biological filter” into the well-lit surface ocean. This mechanism supports higher chlorophyll-a concentrations in the surface ocean (Taylor et al., 1986) and would presumably stimulate broader biological activity, including the decomposition of recently produced organic matter and the regeneration of nutrients. Seasonality in the rate of nitrification was not evident in the study of Yool et al. (2007), although such a signal may exist (Newell et al., 2013).
Evidence demonstrates that light structures the distribution of nitrifying organisms, whose activity may be suppressed within the photic zone (Olson et al., 1981; Shiozaki et al., 2016). Further, by poorly competing with photosynthetic plankton for resources, nitrifier distribution and activity are indirectly constrained by the light regime (Smith et al., 2014; Ward, 1985). While the light–dark cycle may lead to a diel variability in nitrifying activity (increasing at night with the recovery from light inhibition; Smith et al., 2014), resource competition with phytoplankton may persist in the dark due to the photosynthetic cells' capacity for dark N assimilation, especially of (Clark et al., 2002).
4.3 Chemical context
In terms of the chemical context to the study, characteristically low concentrations of , , and Si(OH)4 were evident within the well-lit surface ocean (14 % sPAR), progressively increasing at 1 % and 0.1 % sPAR (Fig. 3a and b and f). This distribution is consistent with biological drawdown, likely dominated by nutrient acquisition by phototrophs (Marañon et al., 2000; Poulton et al., 2006;). Extremely high concentrations were a prominent feature of nutrient profiles within the deep equatorial region.
In the mesopelagic ocean, nitrification maintains the accumulation of , while the diapycnal nutrient flux to the surface open ocean is relatively weak, especially during periods of low wind energy input. supplied via nitrification in the photic zone is either extremely low (Clark et al., 2008; Newell et al., 2013) or below detection (Lomas et al., 2009). Alternative and sources to the surface ocean include introduction as a component of atmospheric dust (Baker and Jickells, 2017; Gruber and Sarmiento, 1997), subsurface injections via the action of internal tides over mid-ocean ridges (Tuerena et al., 2019), or the passage of mesoscale eddies (McGillicudy et al., 1998; Oschlies and Garcon, 1998). No direct correlation between nitrification and concentration has been reported. A relationship with availability has been demonstrated in water treatment systems (de Vet et al., 2012), although there is no evidence to support this correlation in low-nutrient environments.
Analytical capacity for nanomolar measurements was unavailable for this study, creating a potentially significant shortfall in the data set, since concentration has been demonstrated to influence the activity, distribution, and composition of nitrifying communities (Bouskill et al., 2012; Smith, 2016). As the primary resource for nitrification, it is intuitive to expect a direct relationship between and concentration (Smith et al., 2016), evidence of which supports the representation of this process as the specific rate (d−1; Yool et al., 2007). However, this correlation is not consistently demonstrated (Bouskill et al., 2012), and the rate–resource relationship may not be linear, as implied by its representation as the specific rate (Martens-Habbena et al., 2009; Shiozaki et al., 2016).
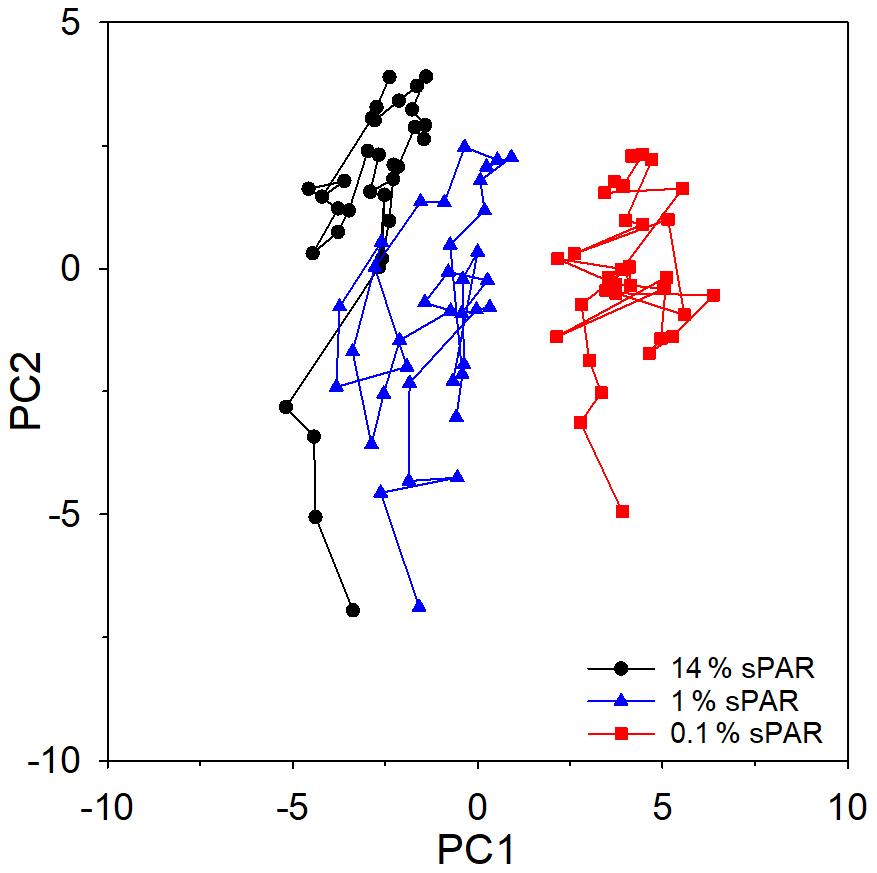
Figure 9Principle component analysis (PCA) ordination, highlighting the clustering of samples from specific light-equivalent depths. Inter-sample variation in PC1 is associated with differences among the sPAR bands and explained 42.7 % of the total. Inter-sample differences along PC2 reflect latitudinal variation along the transect and explained 23.4 %. In combination, ∼65 % of variability was explained, leaving ∼35 % unexplained.
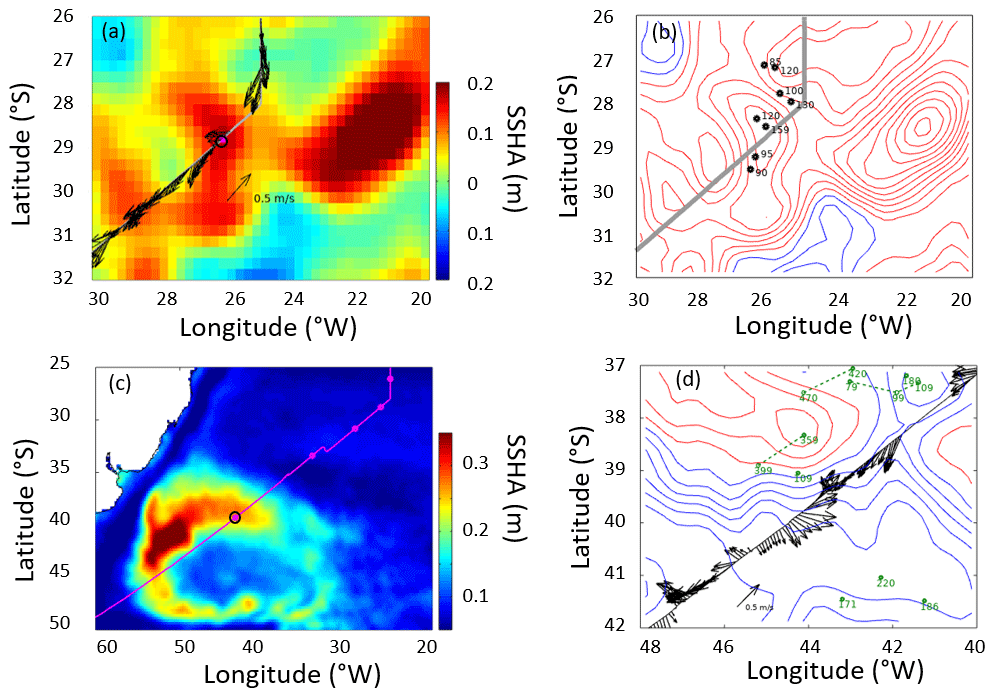
Figure 10Altimetry, ship, and Argo profiler data relating to the two anomalous stations, indicated by magenta dots with black boundaries. (a) Sea surface height anomaly (SSHA) at the time of the 28∘ S station. The altimetry shows a high (anticyclone) centred on the station, with a larger feature further east. The arrows provide the currents at 54 m depth from the shipborne ADCP. (b) The same altimetry data as contours (intervals of 0.03 m), with dots indicating Argo profiles within 5 d of ship passage and the numbers being the mixed-layer depth (depth at which temperature drops by more than 3 ∘C below the surface value). (c) The root mean square variability in SSHA showing the pattern of large signals associated with the Brazil–Falklands Confluence, and the position of the 39∘ S station. (d) Contours of SSH (0.10 m increment, with red for the zero and positive values, blue for the negative values). The arrows show currents from the shipborne ADCP at 54 m depth, and the dots and green numbers indicate Argo profiles and the depth of the surface layer within 10 d of ship transit. (Green dashed lines link successive profiles of the same float, with all three being advected eastward.)
A phosphate excess similar to 0.2 µmol L−1 was evident at all depths in the WTRA and SATL (Fig. 3c). This feature is related to both source waters (Sarmiento et al., 2004) and the interhemispheric difference in N fixation, supported by micro-nutrient inputs via atmospheric dust deposition (Baker and Jickells, 2017), leading to P* drawdown in the North Atlantic (Moore et al., 2009). There is no evidence of a direct relationship between P* and nitrification rate. However, in Atlantic regions of enhanced N-fixing activity, evidence suggests that organic material produced by diazotrophs is recycled within the surface ocean (Mulholland, 2007). Nitrification has rarely been measured simultaneously with N fixation. Both were measured by Raes et al. (2020) and no relationship was reported, although it has been implied that N fixation leads to an increase in the nitrate inventory (Mills et al., 2004). Nitrification likely has a role in redistributing newly fixed nitrogen, which is directly released as or regenerated as from the decomposition of released dissolved organic nitrogen (Newell et al., 2011). During this study, the seasonal low in dust deposition to the North Atlantic may have shifted resource constraints towards phosphate–Fe co-limitation, with implications for the extent and rate of N fixation and speculatively extending to the subsequent processes of N remineralization.
A PNM was evident over the entire transect (Fig. 3e). A range of 0.05–0.50 µmol L−1 was measured, although sampling resolution may have limited the extent to which this feature was resolved (Beman, 2012; Meeder et al., 2012). Evidence suggests that nitrification has an important role in the formation and maintenance of the PNM against diffusive forces (Beman et al., 2012; Buchwald and Casciotti, 2013; Meeder et al., 2012; Newell et al., 2013; Peng et al., 2018; Santoro et al., 2013), with potential contributions from release by phytoplankton (Beman et al., 2012; Santoro et al 2013). This study is unable to inform the debate surrounding PNM formation as the isotope dilution approach adopted here does not discriminate between the processes contributing to ( oxidation, algal release, and potentially a photolytic route which produces from – Zafiriou and True, 1979 – and humic substances – Kieber and Seaton, 1999), as discussed below. Across all depths, leads to an average turnover of 38.5 d (range 0.4–335 d) within the North Atlantic Gyre compared to an average of 37 d (range 2.9–160 d) for the South Atlantic Gyre. For the PNM, a range of 3–40 d was reported within the California Current system (Santoro et al., 2013) and 33–178 d in the Arabian Sea (Buchwald and Casciotti, 2013).
The dissolved oxygen concentration was generally observed to be ∼150–280 µmol L−1, with variability linked to seawater temperature (Fig. 4b). Dissolved oxygen concentration has been shown to structure the activity and distribution of nitrifying organisms (Beman et al., 2008, 2012; Ward, 2002), especially within low-oxygen environments (Beman et al., 2008; Bouskill et al., 2012). A low-oxygen feature of the 0.1 % sPAR equatorial upwelling water was distinguished in a series of correlation plots (Fig. 4a–c) linked to relatively low temperature and salinity in combination with a very high concentration. This well-documented oxygen minimum region is related to large-scale circulation causing weak ventilation (Kartensen et al., 2008). This relative extreme in a combination of physicochemical conditions did not result in distinct elevations of (Fig. 4d). Similar results were noted by Shiozaki et al. (2016) in the North Pacific Ocean, where dissolved oxygen concentrations approaching 50 µmol L−1 were not associated with an enhanced rate of nitrification. Nitrification within low-oxygen environments is of interest as it links N inputs to marine environments via N fixation to N losses via denitrification and anaerobic ammonium oxidation (anammox), processes which are characteristically associated with marine regions of extremely low oxygen concentration (Francis et al., 2007; Ward et al., 1989).
4.4 Biological context
Profiles of biological parameters (Figs. 5 and S1) demonstrated apparent vertical structure. The chlorophyll-a distribution indicated that photosynthetic cells were present throughout the depth range used for measurements. The presence of measurable chlorophyll a implied the potential production and release of dissolved organic matter in addition to organic matter released upon cell rupture (via grazing or viral attack). In contrast to the deep chlorophyll-a and picoplankton abundance maxima, bacterial cell profiles tended to describe higher abundance towards the well-lit region of the water column. Assuming that bacterial cell abundance reflected resource availability, the observed distribution implied the availability of photosynthetically derived labile dissolved organic nitrogen (DON) throughout the photic zone (noting that the DCM represents only a small fraction of water column productivity and biomass; Marañon et al., 2000) and consequently the regeneration of . While the subsequent fate of regenerated would relate to environmental factors that shape the open ocean ecosystem, molecular evidence supports the potential for nitrifying activity throughout the surface ocean (Church et al., 2010).
4.5 measurements within the study
Isotope studies of the marine N cycle are well established (Blackburn, 1979; Caperon et al., 1979; Ward, 2007, 2008), and the associated strategies each have benefits and risks. When applied to the pelagic oligotrophic ocean, the enrichment approach (detection of isotopic enrichment following 15 addition and bottle incubation) has the advantage that enrichment can only be achieved via oxidation. An associated risk is that addition relieves resource limitation, leading to the measurement of “potential” rates. Within open oceans, extremely low extant rates in combination with the need to achieve detectable enrichment of often leads to the addition of relatively high 15 concentrations, “carrier nitrogen”, and/or prolonged incubation. In the present study we adopted the dilution approach (detecting the dilution of 15 due to 14 regeneration following bottle incubation) for the following reasons: (i) the analytical sensitivity of GCMS systems enabling isotopic analysis of inorganic nitrogen at nanomolar concentrations using short incubations; (ii) the robust chemistry associated with Sudan-1 synthesis, as used for well-established colorimetric analysis; (iii) the synthetic nature of Sudan-1, which carries a low risk of sample contamination. The disadvantage of this approach is that by measuring net regeneration, the method does not discriminate between pelagic sources of , specifically oxidation by nitrifiers and release by photosynthetic plankton following intracellular reduction. An issue common to all tracer approaches is the potential for inorganic nitrogen depletion within incubations due to microbial assimilation. We address these issues in relation to the dilution method below.
At 14 % sPAR, represented 25 ± 19 % on average of the volumetric water column total at each station. Photosynthetic cells were measured throughout the photic zone (Fig. 5a), reflecting the distribution of primary productivity which is evenly dispersed within the sunlit ocean and not constrained to the DCM (Poulton et al., 2006). This implied the potential for release via incomplete assimilation. release from phytoplankton within the upper mixed layer has been reported in the California Current (Santoro et al., 2013), in the Red Sea during seasonal transitions in water column structure (Al-Qutob et al., 2002; Meeder et al., 2012), and in the North Pacific (Wan et al., 2021). Under environmental conditions similar to those observed during this study for the upper mixed layer of the Pacific Ocean, both Santoro et al. (2013) and Wan et al. (2021) determined a limited number of rates of reduction to which are of the same order as those rates of reported here. As described above, the method used to determine here does not differentiate between the two processes of ammonium oxidation and nitrate reduction, and so there is potential for both processes to have contributed to the regeneration of at this upper depth range. Wan et al. (2021) showed that reduction by phytoplankton may supply of the order of 78 ± 38 % of regenerated to the upper mixed layer (Wan et al., 2021).
With greater depth, the 1 % sPAR was associated with sharp biogeochemical gradients where represented 44 ± 23 % on average of the volumetric water column total. The PNM was identified in close proximity to the 1 % sPAR depth; the persistence of this feature implies that it is formed and maintained by an imbalance between net biological production and consumption processes that exceed simultaneous rates of physical dispersion. Previous studies using direct rate observations and natural abundance stable isotope measurements have indicated that oxidation is the major source of at the PNM, contributing approximately 70 % to 90 % of regenerated (e.g. Buchwald and Casciotti, 2013; Santoro et al., 2013; Chen et al., 2021; Wan et al., 2021). Following regeneration, the accumulation of likely reflects a combination of photo-inhibition of -oxidizing organisms in combination with light limitation of assimilation by photosynthetic organisms (Lomas and Lipschultz, 2006; Olson, 1981). release derived from incomplete assimilation contributes 7 % to 15 % of to the PNM in the oligotrophic ocean. Direct observations within the California Current suggested that approximately 7 % of net regeneration was derived from incomplete assimilation (Santoro et al., 2013), while Wan et al. (2021) reported 10 ± 6 % for the North Pacific and Mackay et al. (2011) indicated 10 %–15 % for the Gulf of Aqaba. It may change with depth relative to the PNM feature (Al-Qutob et al., 2002; Beman et al., 2012; Lomas and Lipschultz, 2006; Mackey et al., 2011; Meeder et al., 2012; Newell et al., 2013; Santoro et al., 2013; Ward, 2005) and could be a source of variability in this study, as the 1 % sampling depth was located either above, within, or below the PNM feature on 15, 10, and 1 occasion(s) respectively (the remaining seven stations could not be assigned due to a lack of PNM definition related to sampling resolution). Further, shoaling and deepening of the PNM by tens of metres over timescales of hours have been reported (Dore and Karl, 1996; French et al., 1983), linked to diel oscillation in the 1 % sPAR depth during the solar cycle as incident radiation intensity (and hence penetration) progressively increased towards solar noon and decreased towards sunset. Diel variability in the 1 % sPAR depth clearly takes place in tandem with the solar cycle in the Atlantic Ocean and is expected to influence biological processes associated with . However, the extent of this influence has not been measured. release by phytoplankton within the nitricline may be enhanced over relatively short temporal scales during such transitions (Lomas and Glibert, 1999, 2000).
The deepest samples were collected at 0.1 % sPAR, where was 31 ± 24 % on average of the volumetric water column total. oxidation activity at this depth is well documented; as depth increases below the DCM, the measurable yet substantial decrease in oxidation rate is argued to reflect the progressively diminishing availability of labile particulate material settling out of the productive surface ocean (Smith et al., 2016; Ward, 2008). However, C fixation by photosynthetic cells residing at the 0.1 % sPAR depth, via either photosynthetic or anaplerotic processes (Laws et al., 2014), has also been measured at an average rate of 35 ± 22 nmol C L−1 d−1 in the oligotrophic Atlantic Ocean (A. Poulton, personal communication, 2021 based on data in Poulton et al., 2006). Assuming Redfield stoichiometry, this would require a N-assimilation rate of 5.3 ± 3.4 nmol N L−1 d−1 (via inorganic or organic sources). The average rate of was 1.1 ± 2.5 nmol N L−1 d−1, implying that proceeded at a rate of comparable order to the phytoplankton N demand required to support concomitant C fixation. Photosynthetic cells utilize inorganic and organic forms of nitrogen to meet cellular demand; as inorganic forms require reduction to the level of prior to assimilation, it is likely that reduced inorganic nitrogen (i.e. NH and labile organic nitrogen would be utilized in preference to under energy (light) limitation (Mackey et al., 2011).
The culmination of this evidence across sampling depths indicated that oxidation likely dominated at 1 % and 0.1 % sPAR. release by phytoplankton is likely to have contributed to at 14 % sPAR, with direct observations by others suggesting that this could be as high as ∼78 % (Wan et al., 2021).
Considering the potential for assimilation by phytoplankton within incubation vessels, from the available data, ambient concentrations (directly measured by GCMS) during incubations were 5.7 ± 2.2 nmol L−1 at 14 % sPAR, 5.3 ± 2.5 nmol L−1 at 1 % sPAR, and 5.3 ± 2.0 nmol L−1 at 0.1 % sPAR. The associated change in concentration during these incubations was −0.1 ± 1.8 nmol L−1 at 14 % sPAR, 0.4 ± 1.7 nmol L−1 at 1 % sPAR, and 0.1 ± 1.7 nmol L−1 at 0.1 % sPAR. regeneration and consumption were approximately balanced in these incubations at all sPAR depths, and there was no evidence of depletion. During the balanced consumption of , sinks included oxidation by nitrifying organisms and assimilation by photosynthetic plankton. Data collected during the summer from the oligotrophic North Atlantic (Bay of Biscay, Clark et al., 2014) at 55 % sPAR indicated that at a concentration of 28.7 ± 1.7 nmol L−1 (i.e. sufficient and light), assimilation was 0.10 ± 0.01 nmol L−1 h−1, i.e. it was essentially insignificant. Consequently we do not anticipate that assimilation represented an important sink at any depth, suggesting that primarily continued through the nitrification pathway towards the regeneration of , a process that has been directly measured and found to be of similar order to rates presented here (Clark et al., 2008).
Within the physical, chemical, and biological context described above (Figs. 6 and 7a–c), was available to support in the range 0.02–13.27 nmol L−1 d−1. During a previous study of the Atlantic Ocean (Clark et al., 2008), 24 h incubations incorporating a light–dark cycle returned an average value of 2.9 ± 2.4 nmol L−1 d−1 (15 stations, two photic zone depths). During the present study using 9 h light-phase incubations (a logistical compromise to enable high-resolution sampling), an average value of 1.2 ± 1.9 nmol L−1 d−1 (32 stations, three photic zone depths) indicated broad agreement between the studies. The lower mean rates generated during this study (compared to Clark et al., 2008) may reflect either a recovery from light inhibition by nitrifiers during 24 h light–dark incubations or more likely a different geographical extent. The 2008 study covered upwelling-influenced waters in the east of the Atlantic basin and the current study transecting the open ocean at the centre of both gyres. The exclusion of a dark phase from the incubations used here is considered to offer only a minor effect due to the very low light environment experienced at both 1 % and 0.1 % sPAR.
The vertical distribution and magnitude of were consistent with previous observations, whereby low but detectable rates were measured within the well-lit ocean, a peak in was measured at 1 % sPAR, and a decline in rates was measured as depth increased below 1 % sPAR (Figs. 6 and 7d and e; Al-Qutob et al., 2002; Beman et al., 2012; Newell et al., 2013; Peng et al., 2018; Santoro et al., 2013; Shiozaki et al., 2016). The causes of this distribution are a continuing subject of debate but ultimately reflect a balance between multiple factors, including the provision of labile organic matter supporting the regeneration of , competition for this resource from other microbes including photosynthetic cells, and grazing pressure by mixotrophs and heterotrophic protists upon the nitrifying community.
A striking feature of the data set was the 1 % sPAR rate range associated with South Atlantic stations (Fig. 7d), the mean of which was significantly greater than that measured in the North Atlantic Gyre. To illustrate this difference, extrapolating vertically integrated values across a comparable distance into each hemisphere from the Equator, the amount of regenerated was 0.36 mol N d−1 over a 1 m × 4457 km distance north of the Equator and 0.72 mol N d−1 over a 1 m × 4637 km distance south of the Equator. While the use of three sampling depths for this comparison represented low vertical resolution and was thus a limitation of the analysis, the average value of 0.11 ± 0.08 mmol m−2 d−1 is comparable to the value of 0.31 ± 0.13 mmol m−2 d−1 reported by the six-integration depth study of Shiozaki et al. (2016) for the North Pacific Tropical Gyre.
We are unable to conclusively explain this novel distinction between hemispheres. However, it is recognized that the Atlantic gyres have persistent biogeochemical differences in dust deposition, the inorganic nutrient regime, and biological features such as N fixation (Baker and Jickells, 2017; Moore et al., 2009) that likely shape and influence broader biological activity within the surface ocean of each Atlantic gyre. Seasonality may be an additional component that contributed towards this hemispheric distinction. In their analysis of multiple AMT transects, Poulton et al. (2006) noted that high rates of carbon fixation at the sub-surface chlorophyll-a maximum characterizing SATL stations during October were potentially linked to the onset of spring conditions. At this time, nutrients supplied by winter mixing to the sub-surface chlorophyll-a maximum in combination with basin-scale changes in irradiance support the growth of larger eukaryotic phytoplankton (Letelier, 2004). The associated seasonal production of organic material would inevitably lead to an increase in decomposition and inorganic nutrient regeneration (including nitrification). Multivariate analysis, which identified significant co-variance between and chlorophyll a, light duration, and nutrients, provided support for this association, as discussed below.
Multivariate approaches were used to investigate potential structure within the data and to examine relationships between and environmental variables. However, it is first worth considering limitations of the data set used for this analysis. While there is strong evidence to suggest that reflected oxidation activity rather than alternative sources of , the measurement does not distinguish between archaeal or bacterial nitrifiers, which likely dominate separate niches within depth profiles (Beman et al., 2012), nor does it consider the influence of changes in nitrifier community composition along the extended transect. Microbial cell abundance is no indication of the activity of specific microbial groups or their importance to biological processes. Chlorophyll-a concentration does not reflect changes in species composition or necessarily biomass, which are known to change in response to environmental forcing within the Atlantic Ocean (Poulton et al., 2006). Within these limitations, the PCA ordination of the entire data set (Fig. 9) demonstrated greater similarity within a sampling depth, equating to horizontal scales of hundreds of kilometres, than between sampling depths equating to vertical scales of tens of metres. A similar result was previously observed (Poulton et al., 2017), implying that distinct niches existed between depth horizons.
Statistical analysis aimed to identify the subset of explanatory variables that, in combination, best matched the observed pattern of . This match was provided by a combination of chlorophyll-a concentration, light duration, and silicate concentration. A similar outcome was reported by Shiozaki et al. (2016) in their study of the oligotrophic North Pacific, in which a correlation between the activity of photosynthetic cells and oxidation rate was reported, although this relationship was not consistently observed. Chlorophyll a and light duration as explanatory variables were common to all three sampling depths, while depth-specific relationships incorporated additional variables. These results implied that, either directly or indirectly, responded to a product of actively photosynthesizing cells (as opposed to the activity of other microbes identified by AFC; see Fig. S1). The production and release of labile dissolved organic matter during photosynthetic activity and its subsequent decomposition to regenerate are an intuitive (and potentially spatially/temporally close) link between photosynthetic cells and nitrifying organisms that could be supported by this insight. However, a role for silicate has not previously been reported, potentially highlighting a link to diatoms. Diatoms are relatively large, mineralizing phytoplankton capable of rapid growth that contribute significantly to organic matter production and export in oligotrophic environments (Klass and Archer, 2006; Scharek et al., 1999). Alternatively, and perhaps more likely, silicate may be viewed as a tracer for sporadic nutrient inputs from below the nutricline (to include and ) that stimulate short-term growth of photosynthetic cells in oligotrophic environments (Poulton et al., 2006). In contrast to other resources supplied by vertical mixing (e.g. , ), silicate is only utilized by diatoms which represent a fraction of the microbial community. It is reasonable to expect that, following a localized mixing event, elevated silicate concentrations persist for longer than the simultaneously introduced and , which are drawn down due to localized increases in primary productivity. Silicate effectively becomes a tracer for water that hosts the products of active or recently enhanced productivity, with subsequent decomposition and nutrient regeneration.
The current view of low-nutrient environments sees a dominant role for the picoplankton community, which supports the microbial food web, with the sporadic growth of large phytoplankton following episodic nutrient inputs due to localized short-term physical instability (Dandonneau et al., 2003; Poulton et al., 2006; Scharek et al., 1999). Increased nutrient availability favours larger and faster growing cells that outcompete the picoplankton to transiently dominate the microbial community in open ocean environments (Kiørbe, 1993). Organic matter released during such transient events (directly from living cells or following cell lysis) would support a short-term localized increase in N-regenerating activity, including . Evidence indicates that archaea, which frequently dominate the euphotic zone nitrifying community, possess a high resource affinity and respond rapidly to pulses in culture (Beman et al., 2012; Martens-Habbena et al., 2009). Whether the statistically significant link between and a combination of chlorophyll a, light duration, and silicate relate to diatoms specifically (which have an absolute requirement for silicate and are obligate phototrophs; i.e. they do not express mixotrophy unlike most other photosynthetic plankton, a nutritional mode that affords flexibility in resource-limited environments and decreases dependence upon photosynthetic CO2 fixation; Mitra et al., 2014) or more likely relate to a broader stimulation of transient microplankton growth remains to be tested. Should nitrifying activity be responding to a chain of events in the very recent past, instantaneous rates of nitrification may not be fully explained by routine measurements of extant environmental conditions, such as those used in the present study. A detailed examination of labile DON production and decomposition leading to the regeneration of may be required in combination with studies of nitrification.
The prerequisite for to support implies the availability of a (semi-)labile source of DON. While this may be generated locally, as speculated above, an alternative (or potentially complementary) hypothesis would be that DON is supplied by Eastern Boundary Upwelling Ecosystems (EBUE; Mahaffey et al., 2004; Torres-Valdés et al., 2009). Letscher et al. (2013) measured a global average [DON] in surface waters (<50 m) of 4.4 µmol L−1, although elevated concentrations were measured adjacent to and downstream of major upwelling systems. Zonal westward gradients across the Atlantic gyres implied a sink for DON. A mechanism that potentially explained this distribution invoked seasonal mixing dynamics at the Atlantic's eastern flanks which subduct DON-enriched water from EBUE that subsequently penetrates the gyre over timescales of months to years. This water is encapsulated within a density horizon that constrains it to the deep euphotic zone. During simulated mixing experiments, the rate of DON decomposition in this water was reported to be 3-fold higher than for surface waters (Letscher et al., 2013), potentially reflecting differences in the microbial community composition (Treusch et al., 2009) and their associated ability to access semi-labile DON. We speculate that the enhanced values of associated with the 1 % sPAR of both Atlantic gyres (Fig. 7d) are supported, to some extent, by DON laterally advected from the upwelling systems of the Atlantic's eastern flank. We further speculate that the hemispheric distinction in values reflects the higher [DON] supplied by the Benguela compared to Mauritania upwelling system (Letscher et al., 2013). Should this be the case, it would imply that the remineralization of EBUE-derived DON represents a new N source to the gyre interior, potentially supporting primary and export production. The retrieval of DON-N leaves a relatively C-enriched organic molecule progressively more resilient to microbial decomposition in a region of large-scale downwelling (i.e. C export via the microbial carbon pump; Jiao et al., 2010). It remains to be tested whether EBUE-derived DON is remineralized across extended spatial scales within sub-tropical gyres, a mechanism that could operate in both the Atlantic and Pacific oceans, and what the broader implications are for pelagic biogeochemistry.
Conspicuously prominent was associated with stations 28 and 39∘ S, with measured ranges of 1.5–8.6 and 1.3–13.3 nmol L−1 d−1 respectively (Figs. 4d and 7a–c). Selected biogeochemical characteristics further distinguished station 39∘ S (high P*, O2 concentration, lower salinity and temperature; Figs. 3 and 4), although those of station 28∘ S were typical of the province. The use of Earth observation data (sea surface temperature, ocean colour) revealed no anomalous features coincident with these stations. However, sea surface height anomaly (SSHA) data evidenced that 28 and 39∘ S were associated with mesoscale eddy features at the point of sampling (Fig. 9). Analysis revealed that no other stations of this study coincided with discernible mesoscale eddy features at the point of sampling.
Eddy 39∘ S was locally generated. In contrast, eddy 28∘ S likely originated within the Agulhas Retroflection, traversing and potentially influencing South Atlantic Gyre biogeochemistry before dissipating on the Brazilian shelf some 3.5 years later (Figs. S2 and S3). Nencioli et al. (2018) tracked similar features, showing that they provided a coherent transport of water masses, preserving some of the physical and biological signals over more than 2 years. The vertical flux of inorganic nutrients induced by the dynamics of traversing eddies has been argued as balancing the Sargasso Sea nutrient budget (McGillicuddy et al., 1998). Similarly, the deficit observed between new production requirements and diffusive supplies in the Atlantic gyres may be reconciled to some extent by eddy dynamics (Planas et al., 1999). While the nutrient regime of 28∘ S was comparable to the provincial average, elevated (some 2–6 times higher than the provincial average) implied unusual biological activity. Such activity is not sustained in isolation but must couple (over appropriate scales of space or time) to the activity of other biological processes (e.g. nutrient acquisition by phototrophs, photosynthetic growth, DON production and release, decomposition and regeneration, oxidation), presumably supported by new nutrients and/or semi-labile EBUE-derived DON physically introduced to the well-lit water column by eddy dynamics. Unfortunately, given that only three observations were made at station 28∘ S, located at the edge of a feature which measured approximately 300 km in diameter, little can be said about how representative of the feature this activity is, the relevance to broader nitrogen cycling activity, or its significance as a source of atmospheric N2O (Dore and Karl, 1996).
Biogeochemical models typically apply a specific nitrification rate of 0.02 to 0.10 d−1 (Moore et al., 2002; Wang et al., 2006; Christian et al., 2002; Jiang et al., 2003), comparable to the value of 0.011–0.113 d−1 derived from the present study assuming 10–100 nmol L−1 , a range consistent with historical measurements (Clark et al., 2008; British Oceanographic Data Centre data archives; https://www.bodc.ac.uk/). Through statistical analysis we demonstrated that ∼65 % of variability within was explained through co-variability (not correlation) with environmental variables, identifying a role for chlorophyll-a concentration, light duration, and silicate. We speculate that silicate is a tracer for seawater that hosts the products of active or recently enhanced phytoplankton growth, with subsequent organic matter decomposition, regeneration, and hence nitrification. This leads us to conclude that a role for DON, and specifically the short-term production, release, and decomposition of labile material, is amongst the factors contributing to the unexplained variability in (notwithstanding the omission of concentration from this study). Such relationships may need further exploration in both observational and modelling studies.
A novel interhemispheric distinction in was observed but not adequately explained by our hypothesis based on statistical analysis. While seasonality may contribute towards this feature, we invoke the influence of the Atlantic's EBUE as a potential explanation, which deliver a higher concentration of DON to the southern compared to northern gyre interior. Such activity would reflect an influence of Atlantic EBUE at significantly extended spatial scales and simultaneously represent the delivery of new nitrogen to the photic zone and the transformation of dissolved organic matter towards recalcitrant forms.
All AMT 19 metadata can be downloaded from the British Oceanographic Data Centre website: https://www.bodc.ac.uk/data/hosted_data_systems/amt/, in addition to data (https://doi.org/10.5285/56df6379-5b2b-160b-e053-6c86abc01f07 with Clark et al., 2017) and flow cytometry data (https://doi.org/10.5285/a2104adc-e994-6789-e053-6c86abc0d557 with Tarran and Zubkov, 2020).
The supplement related to this article is available online at: https://doi.org/10.5194/bg-19-1355-2022-supplement.
DRC designed the experiments, undertook sample and data analysis and led the production of the paper. APR led the field program and conducted N-cycle investigations and contributed to writing of the manuscript. CMF conducted N-cycle fieldwork investigations. CH performed inorganic nutrient analysis of fieldwork samples LAM performed mass spectrometry analysis of collected samples. PJS led the statistical investigations and contributed to manuscript preparation. GDQ and SG performed satellite data analysis and contributed to manuscript preparation. GL helped with data analysis and contributed to manuscript preparation. GT performed flow cytometry analysis of fieldwork samples and contributed to manuscript preparation.
The contact author has declared that neither they nor their co-authors have any competing interests.
Publisher’s note: Copernicus Publications remains neutral with regard to jurisdictional claims in published maps and institutional affiliations.
We thank the crew of the AMT19 cruise. MSLA data were obtained and analysed through the NERC Earth Observation Data Acquisition and Analysis Service (NEODAAS), and further data were provided by the European Space Agency's Sea Level CCI. This is contribution number 320 of the AMT program supported by UKRI through the National Capability Long-term Single Centre Science Programme, Climate Linked Atlantic Sector Science program and further from the Natural Environment Research Council funded Microbial Carbon Pump project. We would like to thank Dennis Hansell and two anonymous reviewers for constructive and insightful comments.
This research has been supported by the Natural Environment Research Council (NE/R015953/1, and NE/R011087/1).
This paper was edited by Perran Cook and reviewed by two anonymous referees.
Al-Qutob, M., Hase, C., Tilzer, M. M., and Lazar, B.: Phytoplankton drives nitrite dynamics in the Gulf of Aqaba, Red Sea, Mar. Ecol. Prog. Ser., 239, 233–239, https://doi.org/10.3354/meps239233, 2002.
Azam, F., Fenchel, T., Field, G., Graf, J. S., Meyer-Reil, L. A., and Thingstad, F.: The ecological role of water-column microbes in the sea, Mar. Ecol. Prog. Ser., 10, 257–263, https://doi.org/10.3354/meps010257, 1983.
Baker, A. R. and Jickells, T. D.: Atmospheric deposition of soluble trace elements along the Atlantic Meridional Transect (AMT), Prog. Oceanogr., 158, 41–51, https://doi.org/10.1016/j.pocean.2016.10.002, 2017.
Beman, J. M., Popp, B. N., and Francis, C. A.: Molecular and biogeochemical evidence for ammonia oxidation by marine Crenarchaeota in the Gulf of California, ISME J., 2, 429–441, https://doi.org/10.1038/ismej.2007.118, 2008.
Beman, J. M., Chow, C.-E., King, A., Feng, Y., Fuhrman, J. A., Andersson, A., Bates, N. R., Popp, B. N., and Hutchins, D. A.: Global declines in oceanic nitrification rates as a consequence of ocean acidification, P. Natl. Acad. Sci. USA, 108, 208–213, https://doi.org/10.1073/pnas.1011053108 2011, 2011.
Beman, J. M., Popp, B. N., and Alford, S. E.: Quantification of ammonia oxidation rates and ammonia-oxidizing archaea and bacteria at high resolution in the Gulf of California and eastern tropical North Pacific Ocean, Limnol. Oceanogr., 57, 711–726, https://doi.org/10.4319/lo.2012.57.3.0711, 2012.
Benner, R. and Amon, R. M. W.: The size-reactivity of major bio-elements in the ocean, Ann. Rev. Sci. 7, 185–205, doi.org/10.1146/annurev-marine-010213-135126, 2015.
Bernhard, A. E., Landry, Z. C., Blevins, A., de la Torre, J. R., Giblin, A. E., and Stahl, D. A.: Abundance of ammonia-oxidizing Archaea and Bacteria along an estuarine salinity gradient in relationship to potential nitrification rates, Appl. Environ. Microbiol., 76, 1285–1289, https://doi.org/10.1128/AEM.02018-09, 2010.
Blackburn, T. H.: Method for measuring rates of turnover in anoxic marine sediments, using a 15N- dilution technique, Appl. Environ. Microbiol., 37, 760–765, 1979.
Bouskill, N. J., Eveillard, D., Chien, D., Jayakumar, A., and Ward, B. B.: Environmental factors determining ammonia-oxidizing organism distribution and diversity in marine environments, Environ. Microbiol., 14, 714–729, https://doi.org/10.1111/j.1462-2920.2011.02623.x, 2012.
Buchwald, C. and Casciotti, K. L.: Isotopic ratios of nitrite as tracers of the sources and age of oceanic nitrite, Nat. Geosci., 6, 308–313, https://doi.org/10.1038/ngeo1745, 2013.
Caperon, J., Schell, D., Hirota, J., and Laws, E.: Ammonium excretion rates in Kaneohe Bay, Hawaii, measured by a 15N isotope dilution technique, Mar. Biol., 54, 33–40, 1979.
Chen, Y. J., Bardhan, P., Zhao, X. F., Zheng, M. F., Qiu, Y. S., and Chen, M.: Nitrite Cycle Indicated by Dual Isotopes in the Northern South China Sea, J. Geophys. Res.-Biogeo., 126, e2020JG006129, https://doi.org/10.1029/2020JG006129. 2021.
Christian, J. R., Verschell, M. A., Murtugudde, R., Busalacchi, A. J., and McClain, C. R.: Biogeochemical modelling of the tropical Pacific Ocean. I: Seasonal and interannual variability, Deep-Sea Res. Pt. II, 49, 509–543, https://doi.org/10.1016/S0967-0645(01)00110-2, 2002.
Church, M. J., Karl, D. M., and DeLong, E. F.: Abundances of crenarchaeal amoA genes and transcripts in the Pacific Ocean, Environ. Microbiol., 12, 679–688, https://doi.org/10.1111/j.1462-2920.2009.02108.x, 2010.
Clark, D. R., Flynn, K. J., and Owens, N. J. P.: The large capacity for dark nitrate-assimilation in diatoms may overcome nitrate limitation of growth, New Phytol., 155, 101–108, https://doi.org/10.1046/j.1469-8137.2002.00435.x, 2002.
Clark, D. R., Fileman, T. W., and Joint, I.: Determination of ammonium regeneration rates in the oligotrophic ocean by gas chromatography/mass spectrometry, Mar. Chem., 98, 21–130, https://doi.org/10.1016/j.marchem.2005.08.006, 2006.
Clark, D. R., Rees, A. P., and Joint, I.: A method for the determination of nitrification rates in oligotrophic marine seawater by gas chromatography/mass spectrometry, Mar. Chem., 103, 84–96, https://doi.org/10.1016/j.marchem.2006.06.005, 2007.
Clark, D. R., Rees, A. P., and Joint, I.: Ammonium regeneration and nitrification rates in the oligotrophic Atlantic Ocean: Implications for new production estimates, Limnol. Oceanogr., 53, 52–62, https://doi.org/10.2307/40006149, 2008.
Clark, D. R., Brown, I. J., Rees, A. P., Somerfield, P. J., and Miller, P. I.: The influence of ocean acidification on nitrogen regeneration and nitrous oxide production in the northwest European shelf sea, Biogeosciences, 11, 4985–5005, https://doi.org/10.5194/bg-11-4985-2014, 2014.
Clark, D., Rees, A., and Ferrera, C.: oxidation rates in the oligotrophic Atlantic Ocean using 15N isotope dilution methods during the AMT programme cruise AMT19 (JC039),British Oceanographic Data Centre – Natural Environment Research Council, UK, [data set] https://doi.org/10.5285/56df6379-5b2b-160b-e053-6c86abc01f07, 2017.
Clarke, K. R. and Warwick, R. M.: Quantifying structural redundancy in ecological communities, Oecologia, 113, 278–289, https://doi.org/10.1007/s004420050379, 1998.
Clarke, K. R., Somerfield, P. J., and Gorley, R. N.: Testing of null hypotheses in exploratory community analyses: similarity profiles and biota-environment linkage, J. Exp. Mar. Biol. Ecol., 366, 56–69, https://doi.org/10.1016/j.jembe.2008.07.009, 2008.
Clarke, K. R., Gorley, R. N., Somerfield, P. J., and Warwick, R. M.: Change in marine communities: an approach to statistical analysis and interpretation, 3 Edn., PRIMER-E, Plymouth., 256 pp, 2014.
Dandonneau, Y., Vega, A., Loisel, H., du Penhoat, Y., and Menkes, C.: Oceanic Rossby waves acting as a hay rake for ecosystem floating by-products, Science, 302, 1548–1551, https://doi.org/10.1126/science.1090729, 2003.
de Vet, W. W. J. M., van Loosdrecht, M. C. M., and Rietveld, L. C.: Phosphorus limitation in nitrifying groundwater filters, Water Res., 46, 1061–1069, https://doi.org/10.1016/j.watres.2011.11.075, 2012.
Dore, J. E. and Karl, D. M.: Nitrification in the euphotic zone as a source for nitrite, nitrate and nitrous oxide at Station ALOHA, Limnol. Oceanogr., 41, 1619–1628, https://doi.org/10.4319/lo.1996.41.8.1619, 1996.
Emerson, S., Mecking, S., and Abell, J.: The biological pump in the subtropical North Pacific Ocean: Nutrient sources, Redfield ratios, and recent changes, Global Biogeochem. Cy., 15, 535–554, https://doi.org/10.1029/2000GB001320, 2001.
Eppley, R. W. and Peterson, B. J.: Particulate organic matter flux and planktonic new production in the deep ocean, Nature, 282, 677–680, 1979.
Fawcett, S. E., Ward, B. B., Lomas, M. W., and Sigman, D. M.: Vertical decoupling of nitrate assimilation and nitrification in the Sargasso Sea, Deep-Sea Res. Pt. I, 103, 64–72, https://doi.org/10.1016/j.dsr.2015.05.004, 2015.
Francis, C., A., Beman, J. M., and Kuypers, M. M. M.: New processes and players in the nitrogen cycle: The microbial ecology of anaerobic and archaeal ammonia oxidation, ISME J., 1, 19–27, https://doi.org/10.1038/ismej.2007.8, 2007.
French, D., Furnas, M., and Smayda, T.: Diel changes in nitrite concentration in the chlorophyll maximum in the Gulf of Mexico, Deep-Sea Res., 30, 707–722, https://doi.org/10.1016/0198-0149(83)90018-3, 1983.
Giovanoni, S. J. and Vergin, K. L.: Seasonality in ocean microbial communities, Science, 335, 671–676, https://doi.org/10.1126/science.1198078, 2012.
Gruber, N. and Sarmiento, J. L.: Global patterns of marine nitrogen fixation and denitrification, Global Biogeochem. Cy., 11, 235–266, https://doi.org/10.1029/97GB00077, 1997.
Horak, R. E. A., Qin, W., Schauer, A. J., Armbrust, E. V., Ingalls, A. E., Moffett, J. W., Stahl, D. A., and Devol, A. H.: Ammonia oxidation kinetics and temperature sensitivity of a natural marine community dominated by Archaea, ISME. 7, 2023–2033, https://doi.org/10.1038/ismej.2013.75, 2013.
Horak, R. E. A., Qin, W., Bertagnolli, A. D., et al.: Relative impacts of light, temperature, and reactive oxygen on thaumarchaeal ammonia oxidation in the North Pacific Ocean, Limnol. Oceanogr., 63, 741–757, https://doi.org/10.1002/lno.10665, 2017.
IOC: Intergovernmental Oceanographic Commission, Paris, Protocols for the Joint Global Flux Study (JGOFS) core measurements, Manuals Guides, 29 pp., 1994.
Jiang, M. S., Chai, F., Dugdale, R. C., Wilkerson, F. P., Peng, T. H., and Barber, R. T.: A nitrate and silicate budget in the equatorial Pacific Ocean: a coupled physical-biological model study, Deep-Sea Res. Pt. II, 50, 2971–2996, https://doi.org/10.1016/j.dsr2.2003.07.006, 2003.
Jiao, N., Herndl, G. J., Hansell, D. A., Benner, R., Kattner, G., Wilhelm, S. W., Kirchman, D. L., Weinbauer, M. G., Luo, T., Chen, F., and Azam, F.: Microbial production of recalcitrant dissolved organic matter: long-term carbon storage in the global ocean, Nat. Rev. Microbiol., 8, 593–599, https://doi.org/10.1038/nrmicro2386, 2010.
Karstensen, J., Stramma, L., and Visbeck, M.: Oxygen minimum zones in the eastern tropical Atlantic and Pacific oceans, Prog. Oceanogr., 77, 331–350, https://doi.org/10.1016/j.pocean.2007.05.009, 2008.
Kieber, R. J., Li, A., and Seaton, P. J.: Production of nitrite from the photodegradation of dissolved organic matter in natural waters, Environ. Sci. Technol., 33, 993–998, https://doi.org/10.1021/es980188a, 1999.
Kiørboe, T.: Turbulence, phytoplankton cell size, and the structure of pelagic food webs, Adv. Mar. Biol., 29, 2–72, https://doi.org/10.1016/S0065-2881(08)60129-7, 1993.
Klass, C. and Archer, D.: Association of sinking organic matter with various types of mineral ballast in the deep sea: Implications for the rain ratio, Global Biogeochem. Cy., 16, 1116, https://doi.org/10.1029/2001GB001765, 2002.
Laws, E. A., Letelier, R. M., and Karl, D. M.: Estimating the compensation irradiance in the ocean: The importance of accounting for non-photosynthetic uptake of inorganic carbon, Deep-Sea Res. Pt. I, 93, 35–40, https://doi.org/10.1016/j.dsr.2014.07.011 2014.
Legeais, J.-F., Ablain, M., Zawadzki, L., Zuo, H., Johannessen, J. A., Scharffenberg, M. G., Fenoglio-Marc, L., Fernandes, M. J., Andersen, O. B., Rudenko, S., Cipollini, P., Quartly, G. D., Passaro, M., Cazenave, A., and Benveniste, J.: An improved and homogeneous altimeter sea level record from the ESA Climate Change Initiative, Earth Syst. Sci. Data, 10, 281–301, https://doi.org/10.5194/essd-10-281-2018, 2018.
Letelier, R. M., Karl, D. M., Abbott, M. R., and Bidigare, R. R.: Light driven seasonal patterns of chlorophyll and nitrate in the lower euphotic zone of the North Pacific Subtropical Gyre, Limnol. Oceanogr., 49, 508–519, https://doi.org/10.4319/lo.2004.49.2.0508, 2004.
Letscher, R. T., Hansell, D. A., Carlson, C. A., Lumpkin, R., and Knapp, A. N.: Dissolved organic nitrogen in the global surface ocean: Distribution and fate, Global Biogeochem. Cy., 27, 141–153, https://doi.org/10.1029/2012GB004449, 2013.
Lomas, M. W. and Gilbert, P. M.: Temperature regulation of nitrate uptake: A novel hypothesis about nitrate uptake and reduction in cool-water diatoms, Limnol. Oceanogr., 44, 556–572, https://doi.org/10.4319/lo.1999.44.3.0556, 1999.
Lomas, M. W. and Gilbert, P. M.: Comparisons of nitrate uptake, storage and reduction in marine diatoms and dinoflagellates, J. Phycol., 36, 903–913, https://doi.org/10.1046/j.1529-8817.2000.99029.x, 2000.
Lomas, M. W. and Lipschultz, F.: Forming the primary nitrite maximum: Nitrifiers or phytoplankton?, Limnol. Oceanogr., 51, 2453–2467, https://doi.org/10.4319/lo.2006.51.5.2453, 2006.
Lomas, M. W., Lipschultz, F., Nelson, D. M., Krause, J. W., and Bates, N. R.: Biogeochemical responses to late-winter storms in the Sargasso Sea, I – Pulses of primary and new production, Deep-Sea Res. Pt. I, 56, 843–860, https://doi.org/10.1016/j.dsr.2009.01.002, 2009.
Longhurst, A.: Ecological geography of the sea, Academic Press, ISBN: 9780124555587, 1998.
Mackey, K. R. M., Bristow, L., Parks, D. R., Altabet, M. A., Post, A. F., and Paytan, A.: The influence of light on nitrogen cycling and the primary nitrite maximum in a seasonally stratified sea, Prog. Oceanogr., 91, 545–560, https://doi.org/10.1016/j.pocean.2011.09.001, 2011.
Mahaffey, C., Williams, R. G., Wolff, G. A., and Anderson, W. T.: Physical supply of nitrogen to phytoplankton in the Atlantic Ocean, Global Biogeochem. Cy., 18, GB1034, https://doi.org/10.1029/2003GB002129, 2004.
Maranñón, E., Holligan, P. M., Varela, M., Mourinõ, B., and Bale, A. J.: Basinscale variability of phytoplankton biomass, production and growth in the Atlantic Ocean, Deep-Sea Res. Pt. I, 47, 825–857, https://doi.org/10.1016/S0967-0637(99)00087-4, 2000.
Martens-Habbena, W., Berube, P. M., Urakawa, H., de la Torre, J. R., and Stahl, D. A.: Ammonia oxidation kinetics determine niche separation of nitrifying Archaea and Bacteria, Nature, 461, 976–979, https://doi.org/10.1038/nature08465, 2009.
McClain, C. R., Signorini, S. R., and Christian, J. R.: Subtropical gyre variability observed by ocean-color satellites, Deep-Sea Res. Pt. I, 51, 281–301, https://doi.org/10.1016/j.dsr2.2003.08.002, 2004.
McGillicuddy, D. J., Jr, Robinson, A. R., Siegel, D. A., Jannasch, H. W., Johnson, R., Dickey, T. D., McNeil, J., Michaels, A. F., and Knap, A. H.: Influence of mesoscale eddies on new production in the Sargasso Sea, Nature, 394, 263–266, https://doi.org/10.1038/28367, 1998.
Meeder, E., Mackey, K. R. M., Paytan, A., Shaked, Y., Iluz, D., Stambler, N., Rivlin, T., Post, A. F., and Lazar, B.: Nitrite dynamics in the open ocean–clues from seasonal and diurnal variations, Mar. Ecol. Prog. Ser., 453, 11–26, https://doi.org/10.3354/meps09525, 2012.
Mills, M. M., Ridame, C., Davey, M., La Roche, J., and Geider, R. J.: Iron and phosphorus co-limit nitrogen fixation in the eastern tropical North Atlantic, Nature, 429, 292–294, https://doi.org/10.1038/nature03632, 2004.
Mitra, A., Flynn, K. J., Burkholder, J. M., Berge, T., Calbet, A., Raven, J. A., Granéli, E., Glibert, P. M., Hansen, P. J., Stoecker, D. K., Thingstad, F., Tillmann, U., Våge, S., Wilken, S., and Zubkov, M. V.: The role of mixotrophic protists in the biological carbon pump, Biogeosciences, 11, 995–1005, https://doi.org/10.5194/bg-11-995-2014, 2014.
Moore, C. M., Mills, M. M., Achterberg, E. P., Geider, R. J., LaRoche, J., Lucas, M. I., McDonagh, E. L., Pan, X., Poulton, A. J., Rijkenberg, M. J. A., Suggett, D. J., Ussher, S. J., and Woodward, E. M. S.: Large-scale distribution of Atlantic nitrogen fixation controlled by iron availability, Nat. Geosci., 2, 867–871, https://doi.org/10.1038/NGEO667, 2009.
Moore, C. M., Mills, M. M., Arrigo, K. R., Berman-Frank, I., Bopp, L., Boyd, P. W., Galbraith, E. D., Geider, R. J., Guieu, C., Jaccard, S. L., Jickells, T. D., La Roche, J., Lenton, T. M., Mahowald, N. M., Marañón, E., Marinov, I., Moore, J. K., Nakatsuka, T., Oschlies, A., Saito, M. A., Thingstad, T. F., Tsudaand, A., and Ulloa, O.: Processes and patterns of oceanic nutrient limitation, Nat. Geosci., 6, 701–710, https://doi.org/10.1038/NGEO1765, 2013.
Moore, J. K., Doney, S. C., Kleypas, J. A., Glover, D. M., and Fung I. Y.: An intermediate complexity marine ecosystem model for the global domain, Deep-Sea Res. Pt. II, 49, 403–462, https://doi.org/10.1016/S0967-0645(01)00108-4, 2002.
Mulholland, M. R.: The fate of nitrogen fixed by diazotrophs in the ocean, Biogeosciences, 4, 37–51, https://doi.org/10.5194/bg-4-37-2007, 2007.
Nencioli, F., Dall'Olmo, G., and Quartly, G. D.: Agulhas ring transport efficiency from combined satellite altimetry and Argo profiles, J. Geophys. Res.-Oceans, 123, 5874–5888, https://doi.org/10.1029/2018JC013909, 2018.
Newell, S. E., Babbin, A. R., Jayakumar, A., and Ward, B. B.: Ammonia oxidation rates and nitrification in the Arabian Sea, Global Biogeochem. Cy., 25, GB4016, https://doi.org/10.1029/2010GB003940, 2011.
Newell, S. E., Fawcett, S. E., and Ward, B. B.: Depth distribution of ammonia oxidation rates and ammonia-oxidizer community composition in the Sargasso Sea, Limnol Oceanogr., 58, 491–1500, https://doi.org/10.4319/lo.2013.58.4.1491, 2013.
Olson, R. J.: Differential photoinhibition of marine nitrifying bacteria: A possible mechanism for the formation of the primary nitrite maximum, J. Mar. Res., 39, 227–238, https://doi.org/10.4319/lo.2006.51.5.2453, 1981.
Oschlies, A. and Garçon, V.: Eddy-induced enhancement of primary production in a model of the North Atlantic Ocean, Nature, 394, 266–269, https://doi.org/10.1038/28373, 1998.
Palinska, K. A., Laloui, W., Bédu, S., Goer, S. L., Castets, A. M., Rippka, R., and de Marsac, N. T.: The signal transducer P-II and bicarbonate acquisition in Prochlorococcus marinus PCC 9511, a marine cyanobacterium naturally deficient in nitrate and nitrite assimilation, Microbiology, 148, 2405–2412, https://doi.org/10.1099/00221287-148-8-2405, 2002.
Partensky, F., Hess, W. R., and Vaulot, D.: Prochlorococcus, a Marine Photosynthetic Prokaryote of Global Significance, Microbiol. Mol. Biol., 63, 6–127, https://doi.org/10.1016/j.procbio.2007.09.010, 1999.
Peng, X., Fawcett, S. E., van Oostende, N., Wolf, M. J., Marconi, D., Sigman, D. M., and Ward, B. B.: Nitrogen uptake and nitrification in the subarctic North Atlantic Ocean, Limnol. Oceanogr., 63, 1462–1487, https://doi.org/10.1002/lno.10784, 2018.
Planas. D., Agusti, S., Duarte, C. M., Granata, T. C., and Merino, M.: Nitrate uptake and diffusive nitrate supply in the Central Atlantic, Limnol. Oceanogr., 44, 116-126, https://doi.org/10.4319/lo.1999.44.1.011, 1999.
Polovina, J. J., Howell, E. A., and Abecassis, M.: Ocean's least productive waters are expanding, Geophys. Res. Lett., 35, L03618, https://doi.org/10.1029/2007GL031745, 2008.
Poulton, A. J., Holligan, P. M., Hickman, A., Kim, Y-N., Adey, T. R., Stinchcombe, M. C., Holeton, C., Root, S., and Woodward, E. M. S.: Phytoplankton carbon fixation, chlorophyll-biomass and diagnostic pigments in the Atlantic Ocean, Deep-Sea Res. Pt. II, 53, 1593–1610, https://doi.org/10.1016/j.dsr2.2006.05.007, 2006.
Poulton, A. J., Holligan, P. M., Charalampopoulou, A., and Adey, T. R.: Coccolithophore ecology in the tropical and subtropical Atlantic Ocean: new perspectives from the Atlantic meridional transect (AMT) programme, Prog. Oceanogr., 158, 150–170, https://doi.org/10.1016/j.pocean.2017.01.003, 2017.
Quartly, G. D., Legeais, J.-F., Ablain, M., Zawadzki, L., Fernandes, M. J., Rudenko, S., Carrère, L., García, P. N., Cipollini, P., Andersen, O. B., Poisson, J.-C., Mbajon Njiche, S., Cazenave, A., and Benveniste, J.: A new phase in the production of quality-controlled sea level data, Earth Syst. Sci. Data, 9, 557–572, https://doi.org/10.5194/essd-9-557-2017, 2017.
Rafter, P. A., DiFiore, P. J., and Sigman, D. M.: Coupled nitrate nitrogen and oxygen isotopes and organic matter remineralization in the Southern and Pacific Oceans, J. Geophys. Res., 118, 4781–4794, https://doi.org/10.1002/jgrc.20316, 2013.
Raes, E. J., van de Kamp, J., Bodrossy, L., Fong, A. A., Riekenberg, J., Holmes, B. H., Erler, D. V., Eyre, B. D., Weil, S.-S., and Waite, A. M.: N2 Fixation and New Insights Into Nitrification From the Ice-Edge to the Equator in the South Pacific Ocean, Front. Mar. Sci., 7, 389, https://doi.org/10.3389/fmars.2020.00389, 2020.
Rees, A. P., Nightingale, P. D., Poulton, A. J., Smyth, T., Tarran, G. A., and Tilstone, G. H.: The Atlantic Meridional Transect programme (1995–2016), Prog. Oceanogr., 158, 3–18, https://doi.org/10.1016/j.pocean.2017.05.004, 2017.
Santoro, A. E., Sakamoto, C. M., Smith, J. M., Plant, J. N., Gehman, A. L., Worden, A. Z., Johnson, K. S., Francis, C. A., and Casciotti, K. L.: Measurements of nitrite production in and around the primary nitrite maximum in the central California Current, Biogeosciences, 10, 7395–7410, https://doi.org/10.5194/bg-10-7395-2013, 2013.
Sarmiento, J. L., Gruber, N., Brzezinski, M. A., and Dunne, J. P.: High-latitude controls of thermocline nutrients and low latitude biological productivity, Nature, 427, 5660, https://doi.org/10.1038/nature10605, 2004.
Scharek, R., Tupas, L. M., and Karl, D. M.: Diatom fluxes to the deep sea in the oligotrophic North Pacific gyre at Station ALOHA, Mar. Ecol. Prog. Ser., 182, 55–67, https://doi.org/10.3354/meps182055, 1999.
Shiozaki, T., Ijichi, M., Isobe, K., Hashihama, F., Nakamura, K., Ehama, M., Hayashizaki, K., Takahashi, K., Hamasaki, K., and Furuya, K.: Nitrification and its influence on biogeochemical cycles from the equatorial Pacific to the Arctic Ocean, ISME J., 10, 2184–2197, https://doi.org/10.1038/ismej.2016.18, 2016.
Smith, J. M., Chavez, F. P., and Francis, C. A.: Ammonium Uptake by Phytoplankton Regulates Nitrification in the Sunlit Ocean, PLoS ONE, 9, e108173, https://doi.org/10.1371/journal.pone.0108173, 2014.
Smith, J. M., Damashek, J., Chavez, F. P., and Francis, C. A.: Factors influencing nitrification rates and the abundance and transcriptional activity of ammonia-oxidizing microorganisms in the dark northeast Pacific Ocean, Limnol. Oceanogr., 61, 596–609, https://doi.org/10.1002/lno.10235, 2016.
Somerfield, P. J. and Clarke, K. R.: Inverse analysis in non-parametric multivariate analyses: distinguishing groups of associated species which covary coherently across samples, J. Exp. Mar. Biol. Ecol., 449, 261–273, https://doi.org/10.1016/j.jembe.2013.10.002, 2013.
Somerfield, P. J., Clarke, K. R., and Gorley, R. N.: Analysis of Similarities (ANOSIM) for 2-way layouts using a generalised ANOSIM statistic, with comparative notes on Permutational Multivariate Analysis of Variance (PERMANOVA), Austr. Ecol., 46, 911–926, https://doi.org/10.1111/aec.13059, 2021.
Tarran, G. A. and Zubkov, M. V.: Abundance of microbial phytoplankton through the water column during the AMT19 (JC039) cruise in October-December 2009, British Oceanographic Data Centre, National Oceanography Centre, NERC, UK, [data set], https://doi.org/10.5285/a2104adc-e994-6789-e053-6c86abc0d557, 2020.
Taylor, A. H., Harris, J. R. W., and Aiken, J.: The interaction of physical and biological processes in a model of the vertical distribution of phytoplankton under stratification, in: Marine Interfaces Echohydrodynamics, edited by: Nihoul, J. C. J., Elsevier Science, Amsterdam, The Netherlands, 313–330, https://doi.org/10.1016/S0422-9894(08)71052-3, 1986.
Treusch, A. H., Vergin, K. L. Finlay, L. A., Donatz, M. G., Burton, R. M., Carlson, C. A., and Giovannoni, S. J.: Seasonality and vertical structure of microbial communities in an ocean gyre, ISME J., 3, 1148–1163, https://doi.org/10.1038/ismej.2009.60, 2009.
Torres-Valdés, S., Roussenov, V. M., Sanders, R., Reynolds, S., Pan, X., Mather, R., Landolfi, A., Wolff, G. A., Achterberg, E. P., and Williams, R. G.: Distribution of dissolved organic nutrients and their effect on export production over the Atlantic Ocean, Global. Biogeochem. Cy., 23, GB4019, https://doi.org/10.1029/2008GB003389, 2009.
Tuerena, R. E., Ganeshram, R .S., Geibert, W., Fallick, A. E., Dougans, J., Tait, A., Henley, S. F., and Woodward, E. M. S.: Nutrient cycling in the Atlantic basin: The evolution of nitrate isotope signatures in water masses, Global Biogeochem. Cy., 29, 1830–1844, https://doi.org/10.1002/2015GB005164, 2015.
Tuerena, R. E., Williams, R. G., Mahaffey, C., Vic, C., Green, J. A. M., Naveira-Garabato, A., Forryan, A., and Sharples, J.: Internal Tides Drive Nutrient Fluxes Into the Deep Chlorophyll Maximum Over Mid-ocean Ridges, Global Biogeochem. Cy., 33, 995–1009, https://doi.org/10.1029/2019GB006214, 2019.
Wan, X. S., Sheng, H.-X., Dai, M., Church, M. J., Zou, W., Li, X., Hutchins, D. A., Ward, B. B., and Kao, S.-J.: Phytoplankton-nitrifier interactions control the geographic distribution of nitrite in the upper ocean, Global Biogeochem. Cy., 35, e2021GB007072, https://doi.org/10.1029/2021GB007072, 2021.
Wang, X. J., Christian, J. R., Murtugudde, R., and Busalacchi, A. J.: Spatial and temporal variability in new production in the equatorial Pacific during 1980-2003: Physical and biogeochemical controls, Deep-Sea Res. Pt. II, 53, 677–697, https://doi.org/10.1016/j.dsr2.2006.01.023, 2006.
Ward, B. B.: Light and substrate concentration relationships with marine ammonium assimilation and oxidation rates, Mar. Chem., 16, 301–316, https://doi.org/10.1016/0304-4203(85)90052-0, 1985.
Ward, B. B.: Temporal variability in nitrification rates and related biogeochemical factors in Monterey Bay, California, USA, Mar. Ecol. Prog. Ser., 292, 97–109, https://doi.org/10.3354/meps292097, 2005.
Ward, B. B.: Measurement and distribution of nitrification rates in the oceans, Methods Enzym., 486, 307–323, doi.org/10.1016/B978-0-12-381294-0.00013-4, 2007.
Ward, B. B.: Nitrification in marine systems, in: Nitrogen in the Marine Environment, edited by: Capone, D., Bronk, D. A., Mulholland, M. R., and Carpenter, E. J., Elsevier Press, 199–261, 2008.
Ward, B. B., Glover, H. E., and Lipshultz, F.: Chemoauto-trophic activity and nitrification in the oxygen minimum zone off Peru, Deep-Sea Res., 36, 1031–1051, https://doi.org/10.1016/0198-0149(89)90076-9, 1989.
Ward, B. B.: Nitrification in aquatic systems, in: Encyclopaedia of Environmental Microbiology, edited by: Capone, D. A., Wiley, New York, NY, USA, 2144–2167, https://doi.org/10.1002/0471263397.env287, 2002.
Zafiriou, O. C. and True, M. B.: Nitrate photolysis in seawater by sunlight, Mar. Chem., 8, 33–42, https://doi.org/10.1016/0304-4203(79)90029-X, 1979.
Woodward, E. M. S. and Rees, A. P.: Nutrient distributions in an anticyclonic eddy in the North East Atlantic Ocean, with reference to nanomolar ammonium concentrations, Deep-Sea Res., 48, 775–794, https://doi.org/10.1016/S0967-0645(00)00097-7, 2001.
Yool, A., Martin, A. P., Fernández, C., and Clark, D. R.: The significance of nitrification for oceanic new production, Nature, 447, 999–1002, https://doi.org/10.1038/nature05885, 2007.