the Creative Commons Attribution 4.0 License.
the Creative Commons Attribution 4.0 License.
 | 07 Jan 2022
Partitioning carbon sources between wetland and well-drained ecosystems to a tropical first-order stream – implications for carbon cycling at the watershed scale (Nyong, Cameroon)
Moussa Moustapha
Loris Deirmendjian
David Sebag
Jean-Jacques Braun
Stéphane Audry
Henriette Ateba Bessa
Thierry Adatte
Carole Causserand
Ibrahima Adamou
Benjamin Ngounou Ngatcha
Tropical rivers emit large amounts of carbon dioxide (CO2) to the atmosphere, in particular due to large wetland-to-river carbon (C) inputs. Yet, tropical African rivers remain largely understudied, and little is known about the partitioning of C sources between wetland and well-drained ecosystems to rivers. In a first-order sub-catchment (0.6 km2) of the Nyong watershed (Cameroon 27 800 km2), we fortnightly measured C in all forms and ancillary parameters in groundwater in a well-drained forest (hereafter referred to as non-flooded forest groundwater) and in the stream. In the first-order catchment, the simple land use shared between wetland and well-drained forest, together with drainage data, allowed the partitioning of C sources between wetland and well-drained ecosystems to the stream. Also, we fortnightly measured dissolved and particulate C downstream of the first-order stream to the main stem of order 6, and we supplemented C measurements with measures of heterotrophic respiration in stream orders 1 and 5. In the first-order stream, dissolved organic and inorganic C and particulate organic C (POC) concentrations increased during rainy seasons when the hydrological connectivity with the riparian wetland increased, whereas the concentrations of the same parameters decreased during dry seasons when the wetland was shrinking. In larger streams (order > 1), the same seasonality was observed, showing that wetlands in headwaters were significant sources of organic and inorganic C for downstream rivers, even though higher POC concentration evidenced an additional source of POC in larger streams during rainy seasons that was most likely POC originating from floating macrophytes. During rainy seasons, the seasonal flush of organic matter from the wetland in the first-order catchment and from the macrophytes in higher-order rivers significantly affected downstream metabolism, as evidenced by higher respiration rates in stream order 5 (756 ± 333 gC-CO2 m−2 yr−1) compared to stream 1 (286 ± 228 gC-CO2 m−2 yr−1). In the first-order catchment, the sum of the C hydrologically exported from non-flooded forest groundwater (6.2 ± 3.0 MgC yr−1) and wetland (4.0 ± 1.5 MgC yr−1) to the stream represented 3 %–5 % of the local catchment net C sink. In the first-order catchment, non-flooded forest groundwater exported 1.6 times more C than wetland; however, when weighed by surface area, C inputs from non-flooded forest groundwater and wetland to the stream contributed to 27 % (13.0 ± 6.2 MgC yr−1) and 73 % (33.0 ± 12.4 MgC yr−1) of the total hydrological C inputs, respectively. At the Nyong watershed scale, the yearly integrated CO2 degassing from the entire river network was 652 ± 161 GgC-CO2 yr−1 (23.4 ± 5.8 MgC CO2 km−2 yr−1 when weighed by the Nyong watershed surface area), whereas average heterotrophic respiration in the river and CO2 degassing rates was 521 ± 403 and 5085 ± 2544 gC-CO2 m−2 yr−1, which implied that only ∼ 10 % of the CO2 degassing at the water–air interface was supported by heterotrophic respiration in the river. In addition, the total fluvial C export to the ocean of 191 ± 108 GgC yr−1 (10.3 ± 5.8 MgC km−2 yr−1 when weighed by the Nyong watershed surface area) plus the yearly integrated CO2 degassing from the entire river network represented ∼ 11 % of the net C sink estimated for the whole Nyong watershed. In tropical watersheds, we show that wetlands largely influence riverine C variations and budget. Thus, ignoring the river–wetland connectivity might lead to the misrepresentation of C dynamics in tropical watersheds.
- Article
(3686 KB) - Full-text XML
-
Supplement
(705 KB) - BibTeX
- EndNote


Despite their small surface area worldwide (Allen and Pavelsky, 2018), inland waters (rivers, lakes and reservoirs) have a critical role in the global carbon (C) cycle. Inland waters receive a large amount of C from the drainage of land, i.e. from well-drained ecosystems such as non-flooded soils and groundwater, and wetland, i.e. from flooded soils (Abril and Borges, 2019; Cole and Caraco, 2001). The C entering inland waters is processed and subsequently transferred to the atmosphere and the ocean (Cole et al., 2007; Ludwig et al., 1996; Meybeck, 1982; Tank et al., 2016). In addition, inland waters are significant hotspots of carbon dioxide (CO2) degassing (e.g. Raymond et al., 2013) as they are usually supersaturated with CO2 compared to the atmosphere. Since the seminal paper by Cole et al. (2007), who estimated that 0.75 PgC-CO2 was emitted annually to the atmosphere from global inland waters, global emissions estimates have increased substantially. In the most spatially explicit scaling study, the degassing estimate from global inland waters was 2.1 PgC-CO2 yr−1 (Raymond et al., 2013). Later, this estimate was updated with more accurate CO2 emissions estimates from African and Amazonian rivers and from small ponds, resulting in the latest estimate of 3.9 PgC-CO2 yr−1 to which 0.2–0.55 PgC-CO2 yr−1 might be still added as CO2 emissions estimates from rivers are usually not integrated over a full day (Borges et al., 2015a; Drake et al., 2018; Gómez-Gener et al., 2021; Holgerson and Raymond, 2016; Raymond et al., 2013; Sawakuchi et al., 2017). Globally, the latest estimate of CO2 degassing from inland waters was of the same order of magnitude as the net terrestrial C sink (3.4 PgC yr−1; Friedlingstein et al., 2020).
Raymond et al. (2013) showed that CO2 emissions from global rivers (1.8 PgC-CO2 yr−1) mainly depend on emissions in tropical rivers, since tropical rivers account for ∼ 80 % of the global emissions. However, the magnitude of CO2 emissions from tropical rivers was poorly constrained because its estimation was based on very few data from the tropics and probably biased by the overwhelming dominance of data from the Amazon basin over other tropical basins, resulting in uncertain interpolation and scaling. Indeed, based on CO2 emissions measurements in African and Amazonian rivers including the Amazon and the Congo, Borges et al. (2015a) estimated that tropical rivers alone could emit 1.8 ± 0.4 PgC-CO2 yr−1. This significant flux at the global scale, estimated from direct measurements, demonstrates the importance of CO2 emissions from tropical rivers, calling for attention to tropical systems, in particular to Africa, where very few data on C stock and C cycle are available. These data are crucial to refine the global CO2 budget since tropical rivers have been identified in global earth modelling approaches as systems exhibiting higher CO2 emission rates per unit area than those in the temperate and boreal regions (Lauerwald et al., 2015; Raymond et al., 2013). In addition, in these modelling studies the CO2 emission upscaling was done using the GLORICH dataset, in which the water CO2 partial pressure (pCO2) is actually estimated from pH and total alkalinity (TA). This calculation method leads to overestimation of pCO2 up to a factor of 75, notably in low-buffered and high-organic waters, that are representative for boreal and tropical rivers (Abril et al., 2015). In contrast, pCO2 estimated from pH and dissolved inorganic C (DIC) measurements is relatively robust (Åberg and Wallin, 2014). Thus, empirically measuring pCO2 and to a lesser extent DIC, rather than relying on pCO2 estimated from pH and TA that is prone to large error, is key to improving CO2 emissions estimates from inland waters.
In tropical watersheds, CO2-enriched wetland waters directly contribute to the CO2 dissolved in riverine waters, in particular during high water periods when wetland–river connectivity is increasing (Abril et al., 2014; Borges et al., 2015a, b, 2019). Indeed, tropical wetlands are productivity hotspots, and a large fraction of their biomass is released to the water through litter-fall and root exudation, which fuels heterotrophic respiration in the wetland and enriches the water in CO2 (Abril et al., 2014; Abril and Borges, 2019). In addition, during high-water periods, the drainage of tropical wetlands releases large amounts of C and organic matter (OM) to the rivers that might enhance heterotrophic respiration in downstream rivers, indirectly increasing CO2 concentration in tropical rivers (Borges et al., 2019; Engle et al., 2008; Lambert et al., 2016a; Richey et al., 2002). Nonetheless, in large tropical rivers, heterotrophic respiration in the river is usually a small component of the riverine CO2 budget because of the large dominance of the drainage of wetland in the overall budget (Abril et al., 2014; Borges et al., 2019). Large tropical rivers have the ability to transport CO2-enriched wetland waters far enough from the point source because of faster water movement relative to gas exchange (Abril et al., 2014). In the Amazon and the Congo watersheds, the intensity of the CO2 degassing from the rivers has thus been related to the percentage of the wetland cover (Abril et al., 2014; Borges et al., 2019, 2015b), showing that wetlands are the main source of OM fuelling CO2 production in tropical watersheds. However, as in temperate rivers, the CO2 dissolved in tropical rivers also originates from well-drained ecosystems (non-flooded soils and groundwater) in which CO2 comes from plant root and microbial respiration (Johnson et al., 2006, 2008).
In tropical watersheds, considering the importance of lateral inputs in sustaining riverine C fluxes, quantifying hydrological C fluxes resulting from the drainage of well-drained ecosystems and wetlands is thus fundamental to close the riverine C budget. Still, in tropical watersheds, questions remain about the quantification and partitioning of hydrological C fluxes resulting from the drainage of well-drained ecosystems and wetland and their significance in comparison to the local net terrestrial C sink (Duvert et al., 2020a). At the plot scale and in temperate climate, the very few studies that compare the local net terrestrial C sink with direct measurements of the hydrological export of C from well-drained ecosystems showed less than 3 % of the local net terrestrial C sink is actually exported to the aquatic environment (Deirmendjian et al., 2018; Kindler et al., 2011). In a small tropical catchment (140 km2) in Australia, in which the land use was shared between dry savanna and wetland, the contribution of the total hydrological export of C to the stream relative to the local net terrestrial C sink was 7 % (Duvert et al., 2020a). However, Duvert et al. (2020a) did not partition the hydrological export of C to the river between dry savanna and wetland. Furthermore, to the best of our knowledge, partitioning the hydrological export of C to rivers between well-drained ecosystems and wetland has never been done in tropical Africa. As the warmer and wetter conditions expected in tropical Africa in a near future will likely modify C fluxes at the watershed scale, integrative studies on C cycling in tropical watersheds are required to get a better grasp of the present drivers of riverine CO2 emissions and thus to better predict future changes (Duvert et al., 2020a).
The Nyong River basin (South Cameroon) belongs to the Critical Zone Observatories (CZOs; Gaillardet et al., 2018) network named Multiscale TROPIcal CatchmentS (M-TROPICS; Audry et al., 2021) and is a long-term monitoring programme of hydrological and environmental parameters in the tropics. In this study, we used rainfall, water table level and river discharges measured in the framework of the M-TROPICS observatory. The first objective of this study is to estimate the riverine C budget of a first-order catchment, the Mengong catchment, a nested sub-catchment of the Nyong watershed. The hydrological inputs of C from the drainage of land (i.e. from groundwater in a well-drained forest, hereafter referred to as non-flooded forest groundwater) and from wetland to the stream, the heterotrophic respiration in the river, the CO2 degassed to the atmosphere, and the C hydrologically exported at the stream outlet are estimated and compared with the local net terrestrial C sink and will be discussed. In line with recent studies in large tropical watersheds (Abril et al., 2014; Borges et al., 2015, 2019), we expect that lateral inputs of C from wetland to the stream are significant in comparison with lateral inputs of C from non-flooded forest groundwater. The second objective of this study is to evaluate the changes in organic and inorganic C concentration over the seasons in the riverine continuum, from non-flooded forest groundwater to the different stream orders (orders 1 to 6). In the Nyong watershed, downstream (order >1) riverine C concentrations throughout a water cycle will be compared with those observed upstream in the Mengong stream (order 1) in order to evaluate how the biogeochemical cycle of C and its resulting atmospheric CO2 emissions are affected by the connectivity with the wetland domain.
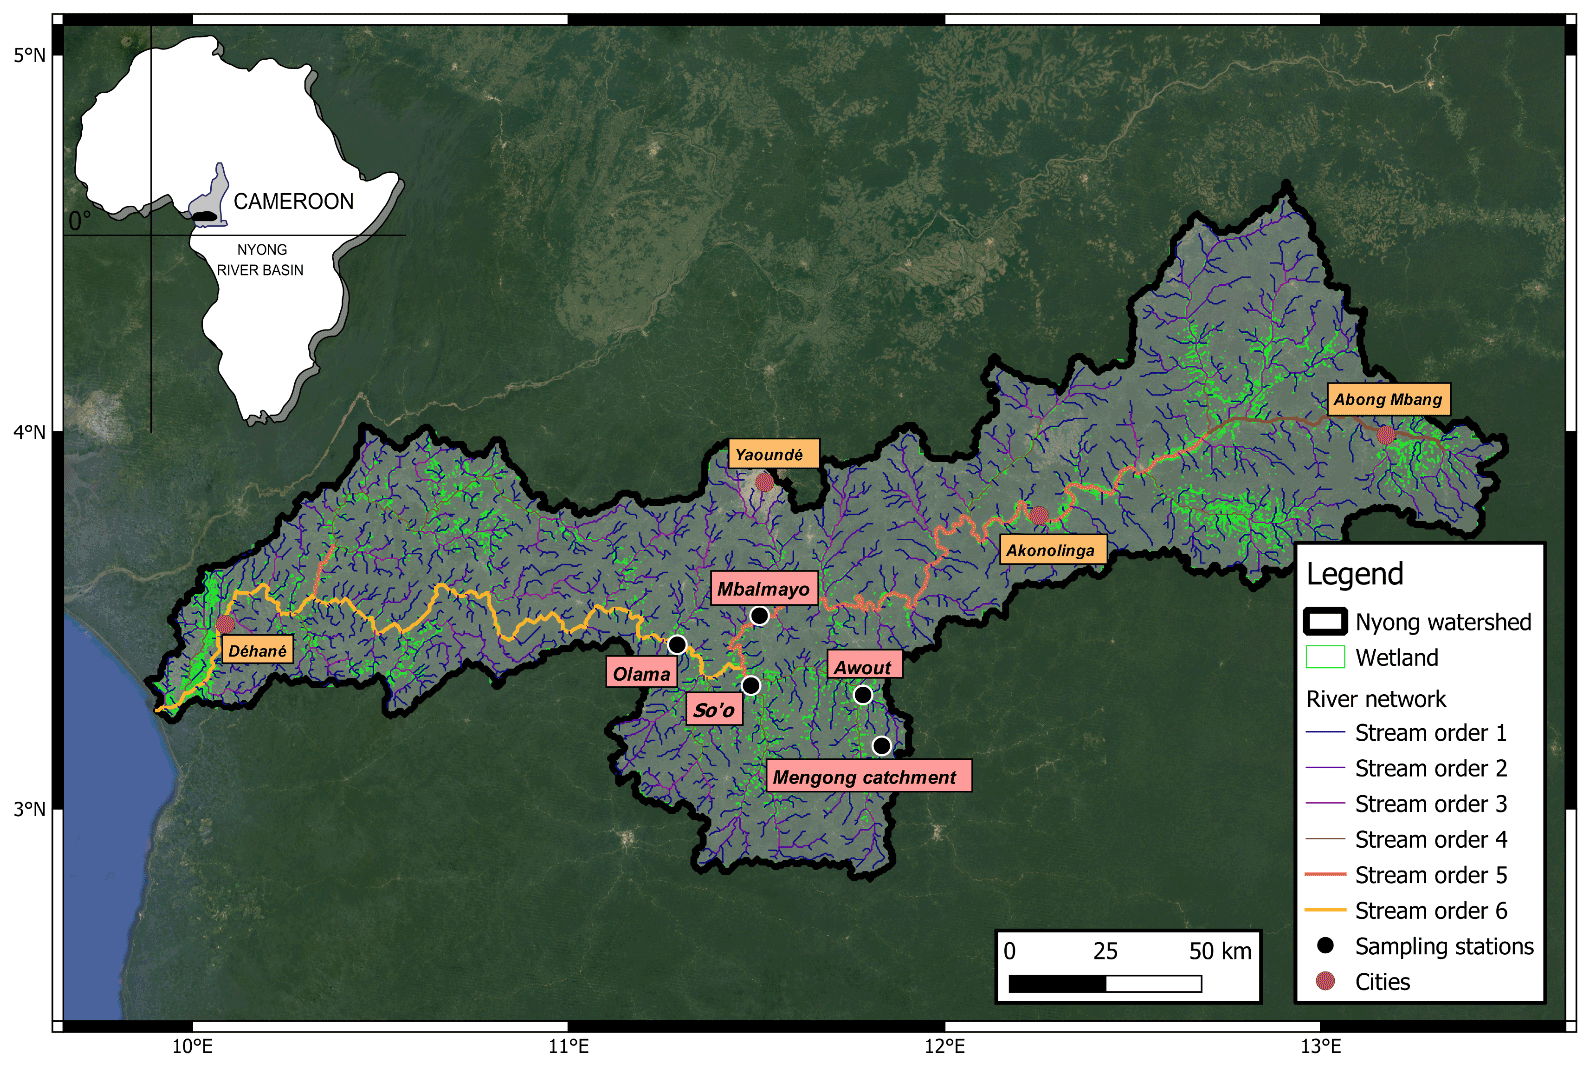
Figure 1Map of the Nyong watershed showing the river network, the wetland extent from Gumbricht et al. (2017) and the location of the sampling stations and some cities. Note, the Nyong River is displayed bolder than the other rivers. The background map is from Google Satellite®.
2.1 Study site
2.1.1 The Nyong watershed
The Nyong watershed (27 800 km2, Cameroon) is located between 2.8 and 4.5∘ N and 9.5 and 13.3∘ E, mainly in the Southern Cameroon Plateau (600–900 m high) (Fig. 1). The landscape of the Southern Cameroon Plateau mostly consists of a succession of convex rounded hills separated by flat wetlands of variable sizes (Olivry, 1986). We adopt the common definition of wetlands as habitats with continuous, seasonal or periodic standing water or saturated soils (Mitsch et al., 2012). The main stem (the Nyong River, stream order 6) is 690 km long and flows west to the Atlantic Ocean (Fig. 1). In the eastern part of the watershed (from Abong Mbang to Akonolinga; Fig. 1), the Nyong River flows through large riparian wetlands of variable size that laterally extended from the river up to 2–3 km according to season (Olivry, 1986). In the western part of the basin (downstream to Akonolinga; Fig. 1), riparian wetland extent is less pronounced, and the Nyong River flows through mature forest in a well-channelled riverbed (Olivry, 1986).
The Nyong watershed experiences an equatorial climate with four seasons with two maxima and minima: a short rainy season (SRS: April–June), a short dry season (SDS: July–August), a long rainy season (LRS: September–November) and a long dry season (LDS: December–March) (Suchel, 1987). The catchment lithology is composed of metamorphic and plutonic rocks with the absence of carbonate rocks and minerals (Viers et al., 2000). Slopes and hills are recovered by a thick lateritic profile (20–40 m) poor in C, whereas in the wetlands (i.e. in the depressions) the upper part of the hydromorphic soils shows an enrichment in OM (Boeglin et al., 2003; Nyeck et al., 1999). Ferrealitic soils cover about 80 % of the Nyong watershed, and this soil cover can reach 40 m thick (Braun et al., 2005). On hills and hillsides, the vegetation cover is dominated by semi-deciduous forest whereas in the wetlands raffia palm trees usually dominate.
Table 1Geographical and hydrological sub-catchments characteristics.
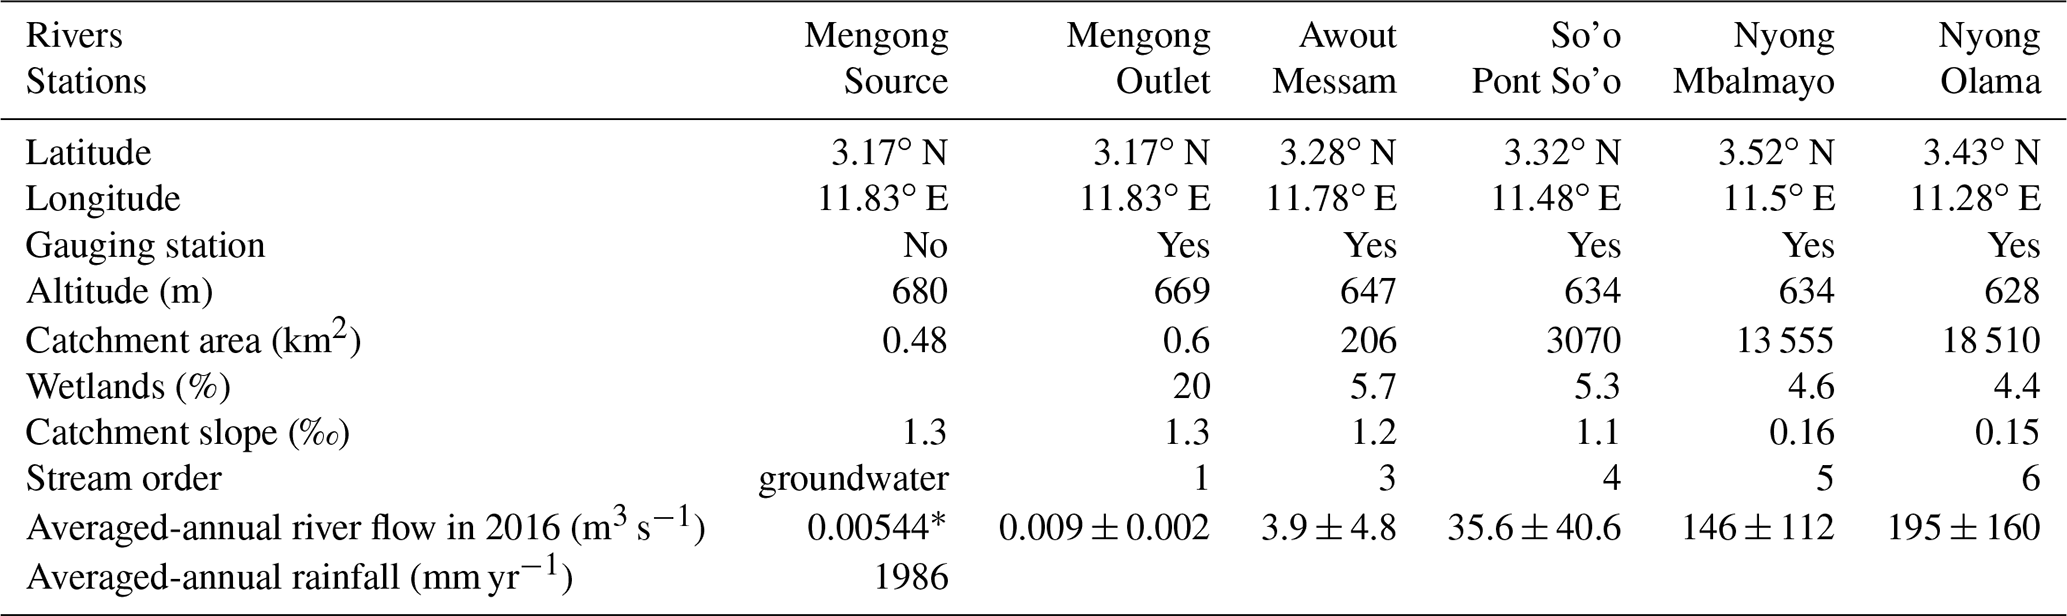
∗ Represents Qhill (Fig. 3) and is estimated from Eq. (1).
In the Nyong watershed, six sites were sampled fortnightly from January to December 2016 (22 times during the sampling period), namely from upstream to downstream: the small first-order Mengong catchment (at the source and the outlet of the catchment), the Awout River (order 3), the So'o River (order 4), and the Nyong River at Mbalmayo (order 5) and Olama (order 6); all sampling sites were located in the western part of the watershed (Table 1; Fig. 1). The Mengong catchment is described in detail in the next Sect. 2.1.2. The Awout River flows for about 30 km in a partially marshy riverbed. The So'o River is the southern forest extension of the Nyong watershed and is the main tributary on the left bank of the Nyong River. The Mbalmayo sampling station is located on the Nyong River upstream of the confluence with the So'o, while the Olama sampling station is located downstream of the confluence with the So'o. Each sampling site (except the Mengong source) is a gauging station calibrated for discharge measurements, monitored daily since 1998 and publicly available at https://doi.org/10.6096/BVET.CMR.HYDRO (Audry et al., 2021). The yearly average discharge of the Nyong River at Olama was ∼ 195 m3 s−1 for both the 1998–2020 period (long-term average) and the year of sampling, 2016 (Fig. 2). Also, the average monthly discharges during the year 2016 did not differ significantly from the average monthly discharges from the 1998–2020 period (Fig. 2). The annual rainfall in the Nyong watershed was 1986 mm in 2016, which is in the upper range of rainfall (1600 ± 290 mm) for the 1998–2020 period (Fig. 2). Altogether, this shows that hydrological fluxes occurring during the sampling year 2016 were typical of the hydrological fluxes usually occurring in the Nyong watershed.
In addition, the C exported at the most downstream station (Nyong River at Olama) is considered representative as the C exported to the Atlantic Ocean by the whole Nyong watershed because the contribution of the tributaries downstream from this station is negligible (Nkoue-ndondo, 2008). Indeed, Brunet et al. (2009) measured hydrological export of DIC and DOC from both the Nyong River at Olama and more downstream near Déhané (very close to the Nyong river outlet; Fig. 1), and they showed that these fluxes (in MgC km−2 yr−1, weighed by the catchment surface area drained at Olama or Edéa) were similar at Olama (4.2 ± 0.1 and 0.8 ± 0.1 MgC km−2 yr−1 for DOC and DIC, respectively) and Déhané (3.9 ± 0.2 and 1.1 ± 0.1 MgC km−2 yr−1).

Figure 2(a–b) River discharges of the different gauging stations during the sampling year 2016, associated with rainfall measured at the Mengong catchment. (c) The box plots represent the variability of monthly Nyong River discharges from 1998 to 2020, and extreme box plot values represent minimum and maximum monthly discharges during the same period. The green lines represent the average monthly discharges in 2016, and the red dashed line represents the yearly average discharge of 194.5 m3 s−1 for the 1998 to 2020 period (very close to the yearly average discharge of 195 m3 s−1 measured in 2016). (d) Yearly rainfall in the Nyong watershed (measured in the Mengong catchment): the blue line represents the mean rainfall over the 1998–2020 period (1600 ± 290 mm), and the red bar represents the yearly rainfall during the sampling year 2016. Hydrologic and rainfall data are from Audry et al. (2021).
2.1.2 The first-order Mengong catchment
The Mengong catchment is 0.6 km2 and consists of a convexo-concave landscape, ranging from 669 m at the river outlet to 703 m at the top of the hill, separated by a flat wetland that covers 0.12 km2 (Fig. 3). Semi-deciduous rainforest (Sterculiaceae–Ulmaceae, C3 plant) covers most of the hills and hillsides, whereas most of the wetland vegetation comprises semi-aquatic plants of the Araceae family (C4) and tree populations of Gilbertiodendron deweverei (Caesalpiniaceae, C3) and Raffia monbuttorum (raffia palm trees, C3) (Braun et al., 2005, 2012). The hillside soil cover is a thick lateritic soil that consists of a succession of four main horizons, namely, from the bottom to the top, the saprolitic horizon, the mottled clay horizon, the ferruginous horizon and the soft clayey topsoil; the thickness and distribution of these soil layers depend on the topographic position (Fig. S1). The groundwater floods the fractured bedrock, the entire saprolite and partly the mottled clay horizon (Braun et al., 2005; Fig. 3). The soil cover is 15 m thick at the top of the north hill (piezometer 1); the depth however decreases progressively towards the flat wetland (Fig. 3). The roots of the hillside vegetation are essentially located in the topsoil horizon, which has a depth of 5 to 6 m at the top of the hill (at piezometer 1) and has a depth of 3 to 4 m (at piezometer 2) at the mid-slope (Braun et al., 2005; Fig. 3). In the wetland, a dark-brown organic-rich sandy material with a thickness ranging from 0.1 to 1 m tops the hydromorphic soil. In this organic horizon, OM can reach up to 20 % by weight, and it is composed of a thick mat of dead and living roots and tubers originating from the wetland vegetation (Braun et al., 2005; Fig. 3). The first-order Mengong catchment is considered representative of the Southern Cameroon Plateau (and thus of the Nyong watershed) that also consists itself of multiconvex land developed on granitic terrains separated by flat wetland (Braun et al., 2012). Moreover, the same soil cover and plant species are observed in the Mengong catchment and in the Nyong watershed, but it should be noted that the wetland extent is larger in the Mengong catchment (20 %) than in the whole watershed (∼ 5 %) (Table 1). Note that wetland extent in the larger catchment was estimated from GIS analysis using the global wetland map by Gumbricht et al. (2017) (Table 1).
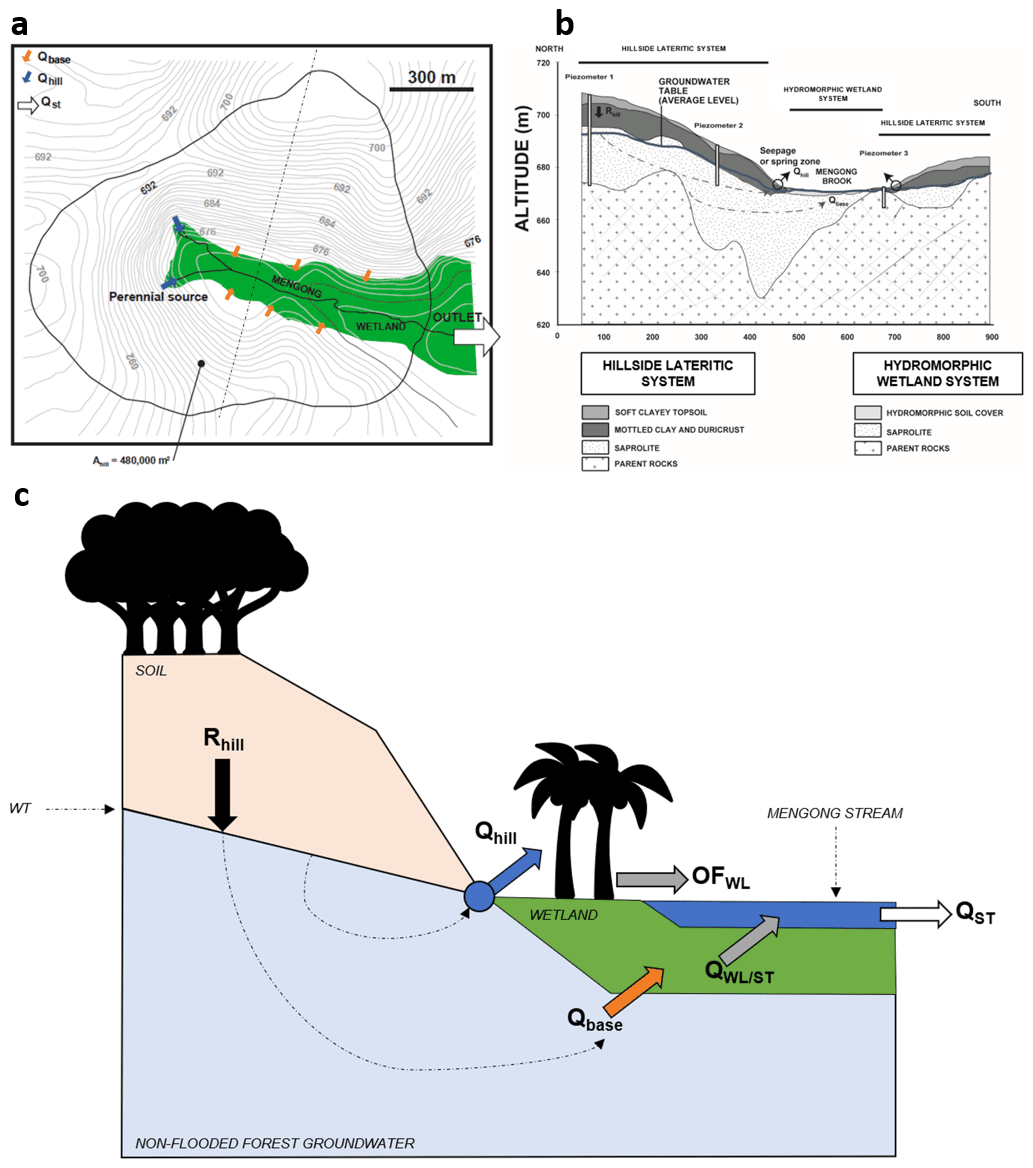
Figure 3(a) Map of the first-order Mengong catchment showing the wetland area and the hydrological fluxes that are partitioned between the main perennial source (Qhill, blue arrows) of the non-flooded forest groundwater, specific seepage points all around the hillside–wetland boundaries (Qbase, orange arrows) of the non-flooded forest groundwater, and the discharge at the stream outlet (Qst, white arrow). Note, Ahill is the surface area drained by the non-flooded forest groundwater. (b) Cross section of the dashed line from the map (a), showing the lithology of the hillside lateritic system and the hydromorphic wetland system and the recharge of the hillside system (Rhill); Qbase and Qhill are also indicated. (c) Hydrological functioning of the first-order Mengong catchment. Note, QWL/ST represents the groundwater flow exchanged between the wetland and the stream, and OFWL is the overland flow on the surface of the wetland. Figure 3 was adapted from Braun et al. (2005, 2012) and from Maréchal et al. (2011).
Groundwater draining the hillside emerges at two sources (Qhill) in the catchment head and at specific seepage points (Qbase) along the hillside–wetland boundaries (Fig. 3). Only one of these two sources is perennial; the other dries up during dry periods (Fig. 3; Braun et al., 2005; Maréchal et al., 2011). Note that groundwater that emerges at sources and at specific seepage points will be further referred to as non-flooded forest groundwater. Qhill is conveyed to the stream with negligible interaction with the wetland, while Qbase fed the wetland, which is flooded all year long (Maréchal et al., 2011). In addition, according to observations made in the Mengong catchment during most of the rainfall events by Maréchal et al. (2011), it is assumed that the overland flow can be neglected on the forested hillside as the porous soil has a high infiltration capacity. Therefore, the water budget of the hillside aquifer system, as shown in Fig. 3, is the following:
where Rhill is the recharge rate of the hillside by infiltration of rain water. Maréchal et al. (2011) estimated Rhill at 20 % of the yearly rainfall occurring in the Mengong catchment, based on a hydrological model related to chloride mass balance at the catchment scale. Qhill and Qbase represent 90 % and 10 % of Rhill, respectively.
The total streamflow at the outlet of the Mengong catchment (QST), as shown in Fig. 3, is the sum of the contributions of Qhill, the exchange flow between the wetland and the stream (QWL/ST), and the overland flow on the wetland surface (OFWL), as the following:
where OFWL represents 35 % of the yearly rainfall in the Mengong catchment (Maréchal et al., 2011). Note that both Qhill and OFWL can be estimated from the yearly rainfall over the Mengong catchment, and QST is measured. QWL/ST can thus be obtained by difference, but only on a yearly basis.
2.2 Sampling and laboratory work
The water samples in the Nyong, So'o and Awout rivers were collected from bridges using a Niskin bottle (3 L) attached to a rope. At the Mengong source, the water samples were taken directly from the source where non-flooded forest groundwater seeps out from a polyvinyl chloride pipe. Note that the pipe is only a few centimetres long, thus considerably limiting the contact time between water and atmospheric air. Additionally, each sampling bottle was left to overflow to avoid catching air bubbles. At the Mengong outlet, the shallow depth permitted retrieving water samples directly from the stream.
Dissolved inorganic C (DIC), TA, dissolved and particulate organic C (DOC and POC), total suspended matter (TSM), and the POC content of the TSM (POC %) were measured from single samples. At each sampling site, we measured the physico-chemical parameters (temperature, pH, oxygen saturation and specific conductivity). The water temperature, pH, oxygen saturation and specific conductivity were measured in situ using portable probes (WTW®) between January and March 2016 and using a YSI® ProDSS multiparameter digital water quality meter between April and December 2016. Calibration of sensors was carried out prior to sampling campaigns and regularly checked during the campaigns. For the WTW® probes, the conductivity cell was calibrated with a 1000 µS cm−1 (25 ∘C) standard, and the pH probe was calibrated using NBS buffer solutions (4 and 7). The YSI® ProDSS was calibrated using the protocols recommended by the manufacturer. The conditioning of water samples was done directly after the field trips in Cameroon at the Institut de Recherches Géologiques et Minières (IRGM) of Yaoundé, while chemical analyses were done in France at Toulouse in the laboratory of Géosciences Et Environnement (GET). For TSM, POC and POC %, a filtration (0.5–1.5 L) was carried out on pre-weighed and pre-combusted GF/F glass fibre filters (porosity of 0.7 µm). The filters were then dried at 60 ∘C and stored in the dark at room temperature for subsequent analysis. TSM was determined by gravimetry with a Sartorius scale (precision of the scale was ±0.1 mg). The filters were acidified in crucibles with 2 N HCl to remove carbonates and were then dried at 60 ∘C to remove inorganic C and the remaining acid and water and then analysed by the Rock-Eval pyrolysis method to measure POC and POC % (Lafargue et al., 1998). For DOC, a portion of the POC filtrate was kept in glass bottles (60 mL) pyrolyzed beforehand, in which three drops of phosphoric acid (85 % H3PO4) were added to convert all DIC species to CO2. The glass bottles were sealed with septa made of polytetrafluoroethylene (PTFE). DOC samples were stored at 3–5 ∘C, and DOC concentrations were measured by thermal oxidation after a DIC removal step with a SHIMADZU TOC 500 analyser in TOC-IC mode (Sharp, 1993).
We stored TA samples at 20 ∘C in polypropylene bottles after filtration using a syringe equipped with acetate cellulose filters (porosity of 0.22 µm). TA was then analysed by automated electro-titration (Titrino Metrohm®) on 50 mL samples with 0.1 N HCl as the titrant. The equivalence point was determined from pH between 4 and 3 with the Gran method (Gran, 1952). DIC samples were collected in 70 mL glass serum bottles sealed with a butyl stopper and treated with 0.3 mL of HgCl2 at 20 g L−1 to avoid microbial respiration during storage. Vials were carefully sealed such that no air remained in contact with samples and were stored in the dark to prevent photo-oxidation. DIC was measured with the headspace technique. The headspace was created with 15 mL of N2 gas, and 100 µL of 85 % H3PO4 was added in the serum bottles to convert all DIC species to CO2. After strong shaking and overnight equilibration at constant room temperature, a subsample of the headspace (1 mL) was injected with a gastight syringe into a gas chromatograph equipped with a flame ionization detector (SRI 8610C GC-FID). The gas chromatograph was calibrated with CO2 standards of 400, 1000 and 3000 ppm (Air Liquide® France). In addition, we estimated the water pCO2 from the CO2SYS software (Lewis and Wallace Upton, 1998), using DIC, pH, water temperature measurements and the carbonic acid dissociation constants of Millero (1979) and the CO2 solubility from Weiss (1974).
In addition, we carried out 14 measurements of heterotrophic respiration in the river at two sampling sites (in the Mengong stream and in the Nyong River at Mbalmayo). For each sampling, six 70 mL serum bottles collected similarly as for DIC samples were used for the determination of heterotrophic respiration in the river. Three serum bottles were directly poisoned in the field with 0.3 mL of HgCl2 at 20 g L−1. The three other serum bottles were incubated in a cool, dark box during 24 h. The cool, dark box was protected from light and filled with water from the river to maintain a water temperature inside the cool, dark box similar to the water temperature observed in the river. At the end of the incubations, the serum bottles were poisoned with 0.3 mL of HgCl2 and stored in the dark and at room temperature. To estimate volumetric rates of heterotrophic respiration in the river, we measured the increase in CO2 in the incubated serum bottles compared to those poisoned directly in the field. CO2 was measured similarly as for DIC, using the headspace technique but without a prior acidification with H3PO4. Subsequently, volumetric rates of heterotrophic respiration in the river were depth-integrated with the river depth at the day of sampling. The river depth was retrieved from the discharge–depth relationship established in the framework of the M-TROPICS observatory. Our method does not represent total heterotrophic respiration in the river since it does not include benthic respiration. A mean benthic respiration measured in various tropical rivers of 222 gC m−2 yr−1 by Cardoso et al. (2014) was therefore added to estimate total heterotrophic respiration in the river.
2.3 Determination of catchments surface area, water surface area, slope and gas transfer velocity (k600)
In the Nyong watershed, the sub-catchment surface areas and the determination of the different stream orders were estimated from the hydrological modelling tools available in QGIS3.16® and the digital elevation model (DEM, 15 s resolution) conditioned for hydrology (HydroSHEDS; Lehner et al., 2008). In the Nyong watershed, the HydroSHEDS flow line dataset (15 s resolution) enabled the precise determination of the total length of each stream order (1 to 6). To estimate the average monthly river width (W) in each stream order of the Nyong watershed, we used the average monthly discharges from the five gauging stations (located on stream orders 1, 3, 4, 5 and 6) and the hydraulic equation described by Raymond et al. (2012) as follows:
where Qmonthly is the average monthly discharge in 2016 in the stream orders 1, 3, 4, 5 or 6.
Since we did not measure discharge in stream order 2, the average width of stream order 2 was extrapolated from the best exponential regression curve from the relationship between stream order and average monthly river width, as indeed, river width within a basin scales exponentially with stream order for all river orders (Strahler, 1957). We used the average monthly river width and the total length per stream order to estimate the monthly water surface area per stream order. We fused the HydroSHEDS DEM and flow line dataset to assign an altitude to each river point and thus to determine the average slope (S) per stream order. To calculate the average monthly flow velocity (V) per stream order, we used the following hydraulic equation described by Raymond et al. (2012), as follows:
The average monthly flow velocity in stream order 2 was extrapolated from the best exponential regression curve from the relationship between stream order and monthly average flow velocity. In each stream order, the monthly gas transfer velocity normalized to a Schmidt number of 600 (k600 in m d−1) was derived from the parameterization as a function of S (unitless) and V (m s−1) as in Eq. (5) by Raymond et al. (2012):
As described by Borges et al. (2019), we chose this parameterization because it is based on the most comprehensive compilation of k values in streams which, in addition, was used in the global upscaling of CO2 emissions from rivers by both Raymond et al. (2013) and Lauerwald et al. (2015).
2.4 C fluxes at the Nyong watershed scale
2.4.1 CO2 degassing and heterotrophic respiration
In each stream order, monthly rate of CO2 degassing at the water–air interface (Fdegas; in gC-CO2 m−2 yr−1) was estimated as follows:
where K0 is the solubility coefficient of CO2 determined from the water temperature (Weiss, 1974), k600 is the monthly gas transfer velocity of CO2 (Sect. 3), and pCO2w and pCO2a are the monthly partial pressures of CO2 in the surface waters of the different stream orders and in the atmosphere (set to 400 ppmv), respectively.
In each stream order, we multiplied monthly Fdegas in gC-CO2 m−2 yr−1 by the respective monthly water surface area to estimate the monthly CO2 emissions (Fdegas in GgC-CO2 yr−1) integrated in each stream order. We summed Fdegas in GgC-CO2 yr−1 in each stream order to estimate the total quantity of CO2 degassed from the Nyong watershed from the entire river network and then normalized by the Nyong watershed surface area (MgC-CO2 km−2 yr−1). Note, we did not measure pCO2 in second-order streams but estimated the pCO2 by averaging the pCO2 measured in the first- and third-order streams.
At the watershed scale, volumetric rates of heterotrophic respiration in the river were estimated from the increase in CO2 in the incubated serum bottles over 24 h in stream orders 1 and 5. The volumetric respiration rates in stream orders 1 and 5 were depth-integrated and subsequently averaged to estimate an average rate of heterotrophic respiration from the entire river network of the Nyong watershed.
2.4.2 C export to the ocean
The C hydrologically exported to the ocean (Focean) was calculated monthly at the most downstream station (Nyong at Olama) as the following:
where Qolama and [C]olama are the monthly average discharges and concentrations of POC, DIC or DOC at Olama, respectively. Focean was estimated in GgC yr−1 and then normalized by the catchment surface area at Olama (MgC km−2 yr−1).
2.5 Stream C budget of the first-order Mengong catchment
2.5.1 The different C fluxes
At the Mengong catchment scale, as described above in Sect. 2.1.2, there are two sources fuelling the Mengong stream with C, namely non-flooded forest groundwater (FGW) and wetland (FWL). The C entering the Mengong stream has two outputs as this C is either degassed at the water–air interface in the form of CO2 (FD) or hydrologically exported at the stream outlet (FOUT). Heterotrophic respiration in the stream (FRH) is considered a C input for the DIC budget, while it is considered a C output for the DOC budget (assuming respiration occurs on DOC only). At the Mengong catchment scale, riverine DIC, DOC and POC budgets (DICbudget, DOCbudget, POCbudget) are thus the difference between C inputs and outputs, as follows.
DICbudget, DOCbudget and POCbudget cannot be estimated monthly as for Fdegas or Focean at the Nyong watershed scale, because water fluxes described in Eqs. (1) and (2), in particular Qhill and OFWL, which are needed to estimate FGW and FWL (see Sect. 2.5.2), can only be estimated yearly from yearly rainfall in the Mengong catchment (see Sect. 2.1.2).
2.5.2 Hydrological C inputs to the stream from non-flooded forest groundwater and wetland
According to Eqs. (1) and (2), the quantity of dissolved carbon leached from non-flooded forest groundwater to the Mengong stream (FGW) was estimated as the following:
where [C]GW is the yearly average concentration of DIC or DOC in the Mengong source. FGW (MgC yr−1) was normalized by the surface area of 0.48 km2 drained by the hillside (MgC km−2 yr−1). FGW represents hydrological input of C to the stream from the drainage of land (well-drained ecosystem).
A part of non-flooded forest groundwater fed the wetland (FGW-bis) and can be estimated as the following:
FGW-bis does not count in the stream C budget because Qbase is not feeding the stream, but it does count in the total quantity of C hydrologically leached from land. FGW-bis (MgC yr−1) was normalized by the surface area drained by the hillside (MgC km−2 yr−1).
According to Eqs. (1) and (2), the quantity of dissolved C leached from the wetland to the Mengong stream (FWL) was estimated as the following:
where [C]WL represents the concentrations of DOC or DIC in the topsoil solution (0.4 m) of the Mengong wetland, measured at 1420 ± 750 and 1430 ± 900 µmol L−1 by Braun et al. (2005) and Nkoue Ndondo et al. (2020), respectively. FWL (MgC yr−1) was normalized by the surface area of 0.12 km2 drained by the wetland (MgC km−2 yr−1).
In the Mengong catchment, as described in Sect. 2.1.2, overland flow on hillsides is negligible and there is no particulate C in non-flooded forest groundwater. Therefore, it can be safely assumed that POC at the Mengong outlet should originate mostly from the drainage and erosion of the wetland. Accordingly, it was assumed that the hydrological export of POC at the Mengong outlet is similar to the POC hydrologically exported from the wetland (FWL). For POC, FWL can thus be estimated as the following:
where Qoutlet and [POC]OUT are the yearly average discharge and POC concentration at the Mengong outlet, respectively. FWL (MgC yr−1) was normalized by the surface area of the wetland (MgC km−2 yr−1).
2.5.3 CO2 degassing and heterotrophic respiration in the stream
It has been shown that a large fraction of CO2 degassing in headwaters was actually missed by conventional stream sampling because a large fraction of the degassing occurs as hotspots in the vicinity of groundwater resurgences (e.g. Deirmendjian and Abril, 2018; Johnson et al., 2008). Therefore, FD (MgC-CO2 yr−1) was estimated from a mass balance that calculates the loss of the dissolved CO2 between non-flooded forest groundwater (FD-GW) (or wetland, FD-WL) and stream water, using CO2 concentrations and drainage data, a method similar to that of Deirmendjian and Abril (2018) and Duvert et al. (2020a), as the following:
where [CO2]GW, [CO2]WL and [CO2]OUT are the yearly average CO2 concentrations in non-flooded forest groundwater, wetland and stream outlet, respectively. FD, FD-GW and FD-WL (all three fluxes in MgC-CO2 yr−1) were then normalized by the surface area of the Mengong catchment (MgC-CO2 km−2 yr−1), the surface area drained by the hillside (MgC-CO2 km−2 yr−1) and the surface area drained by the wetland (MgC-CO2 km−2 yr−1), respectively.
Rates of heterotrophic respiration in the Mengong stream were estimated from the increase in CO2 in the incubated serum bottles over 24 h in the Mengong stream, which were subsequently depth-integrated. In the Mengong catchment, depth-integrated rates of heterotrophic respiration in the river were multiplied by the Mengong stream surface area to obtain the integrated contribution of heterotrophic respiration for the whole stream (FRH in MgC-CO2 yr−1). To estimate the Mengong stream surface area, stream width was estimated from Eq. (3) whereas stream length (750 m) was empirically determined from field measurement by Maréchal et al. (2011). FRH was then normalized by the surface area of the Mengong catchment (MgC-CO2 km−2 yr−1).
2.5.4 C hydrologically exported at the Mengong stream outlet
Based on Eq. (2), the quantity of C hydrologically exported at the outlet of the Mengong catchment (MgC yr−1) can be estimated as the following:
where [C]OUT is the concentration of POC, DOC or DIC at the Mengong stream outlet. FOUT (MgC yr−1) was then normalized by the surface area of the wetland (MgC km−2 yr−1).
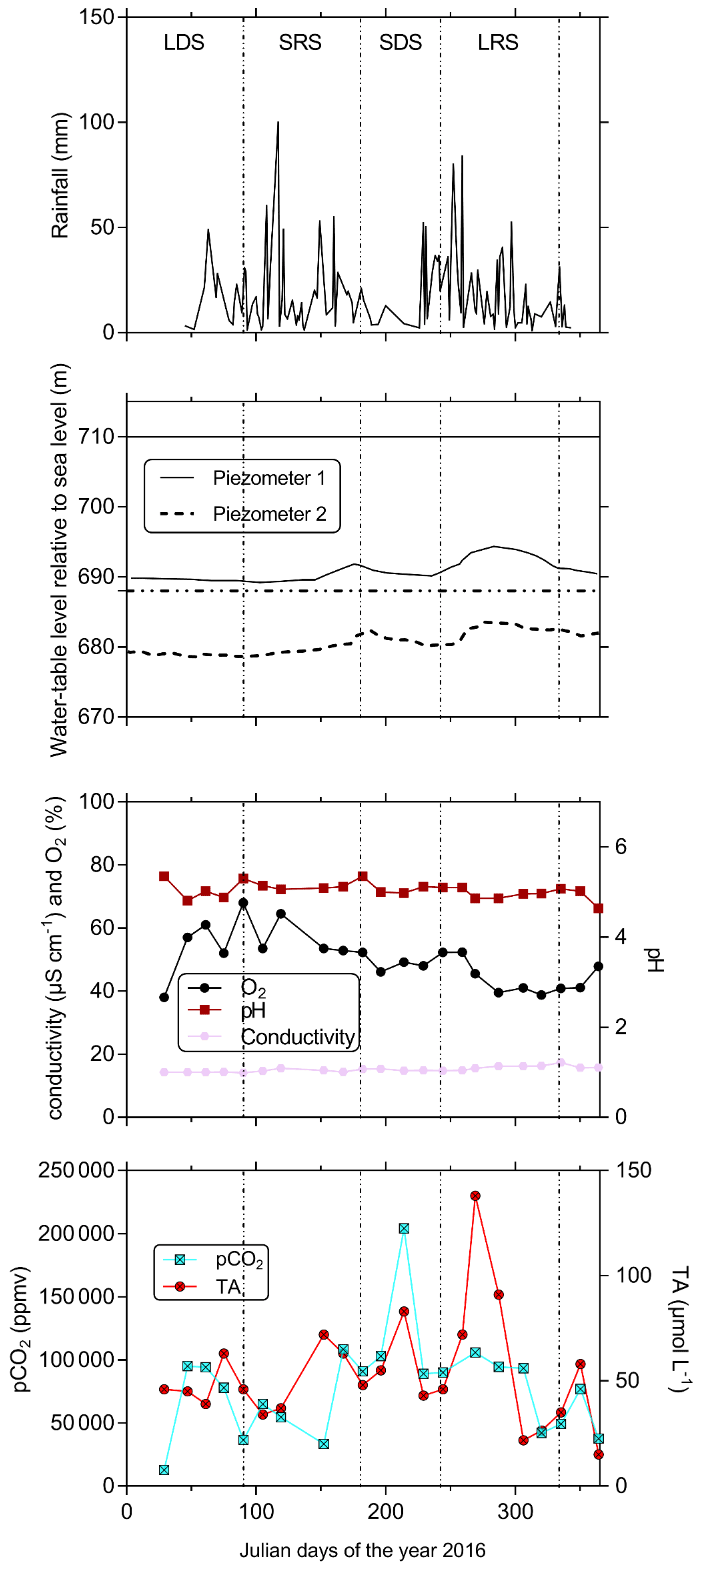
Figure 4In the first-order Mengong catchment temporal variations in rainfall; water-table level in piezometers 1 and 2 (see Fig. 3b) relative to sea level (elevation of the soil surface at piezometers 1 and 2 relative to sea level is also indicated by the horizontal lines); and pCO2, TA and ancillary parameters (oxygen saturation as O2, pH, conductivity as specific conductivity) in non-flooded forest groundwater (measured at the perennial source). The temporal variations are separated into the four seasons that occurs in the Nyong watershed: LDS – long dry season, SRS – short rainy season, SDS – short dry season and LRS – long rainy season. Note, groundwater table level was retrieved from Nkoue-ndondo et al. (2020).
3.1 Hydrology
In 2016, the discharges were 0.009 ± 0.002 (range was 0–0.35), 3.9 ± 4.8 (0–35), 35.6 ± 40.6 (3.4–175), 146 ± 112 (21–392) and 195 ± 160 (8–640) m3 s−1, in stream orders, 1, 3, 4, 5 and 6, respectively (Table 1, Fig. 2). All river discharges seasonally peaked twice a year during the two rainy seasons, both separated by dry seasons; the groundwater water table followed the same trend (Figs. 2, 4–5). Specifically, the beginning to middle of the rainy seasons corresponded to a period of increasing river discharge and groundwater water table level, while the end of the rainy seasons and the dry seasons corresponded to a period of decreasing river discharge and groundwater water table level (Figs. 2, 4–5). In each stream order, low-water period and the lowest discharges were observed during the long dry season (Fig. 2). The stream orders 1 and 3 were dried up during the long dry season (from 1 January to 15 March 2016 and to 28 April 2016, for stream orders 1 and 3, respectively) whereas the streams with orders higher than 3 were never dried up (Fig. 2).
Table 2Spatial distribution of physicochemical parameters (yearly average ± standard deviation) in waters of the Nyong watershed during the sampling year 2016. The range is shown in square brackets.
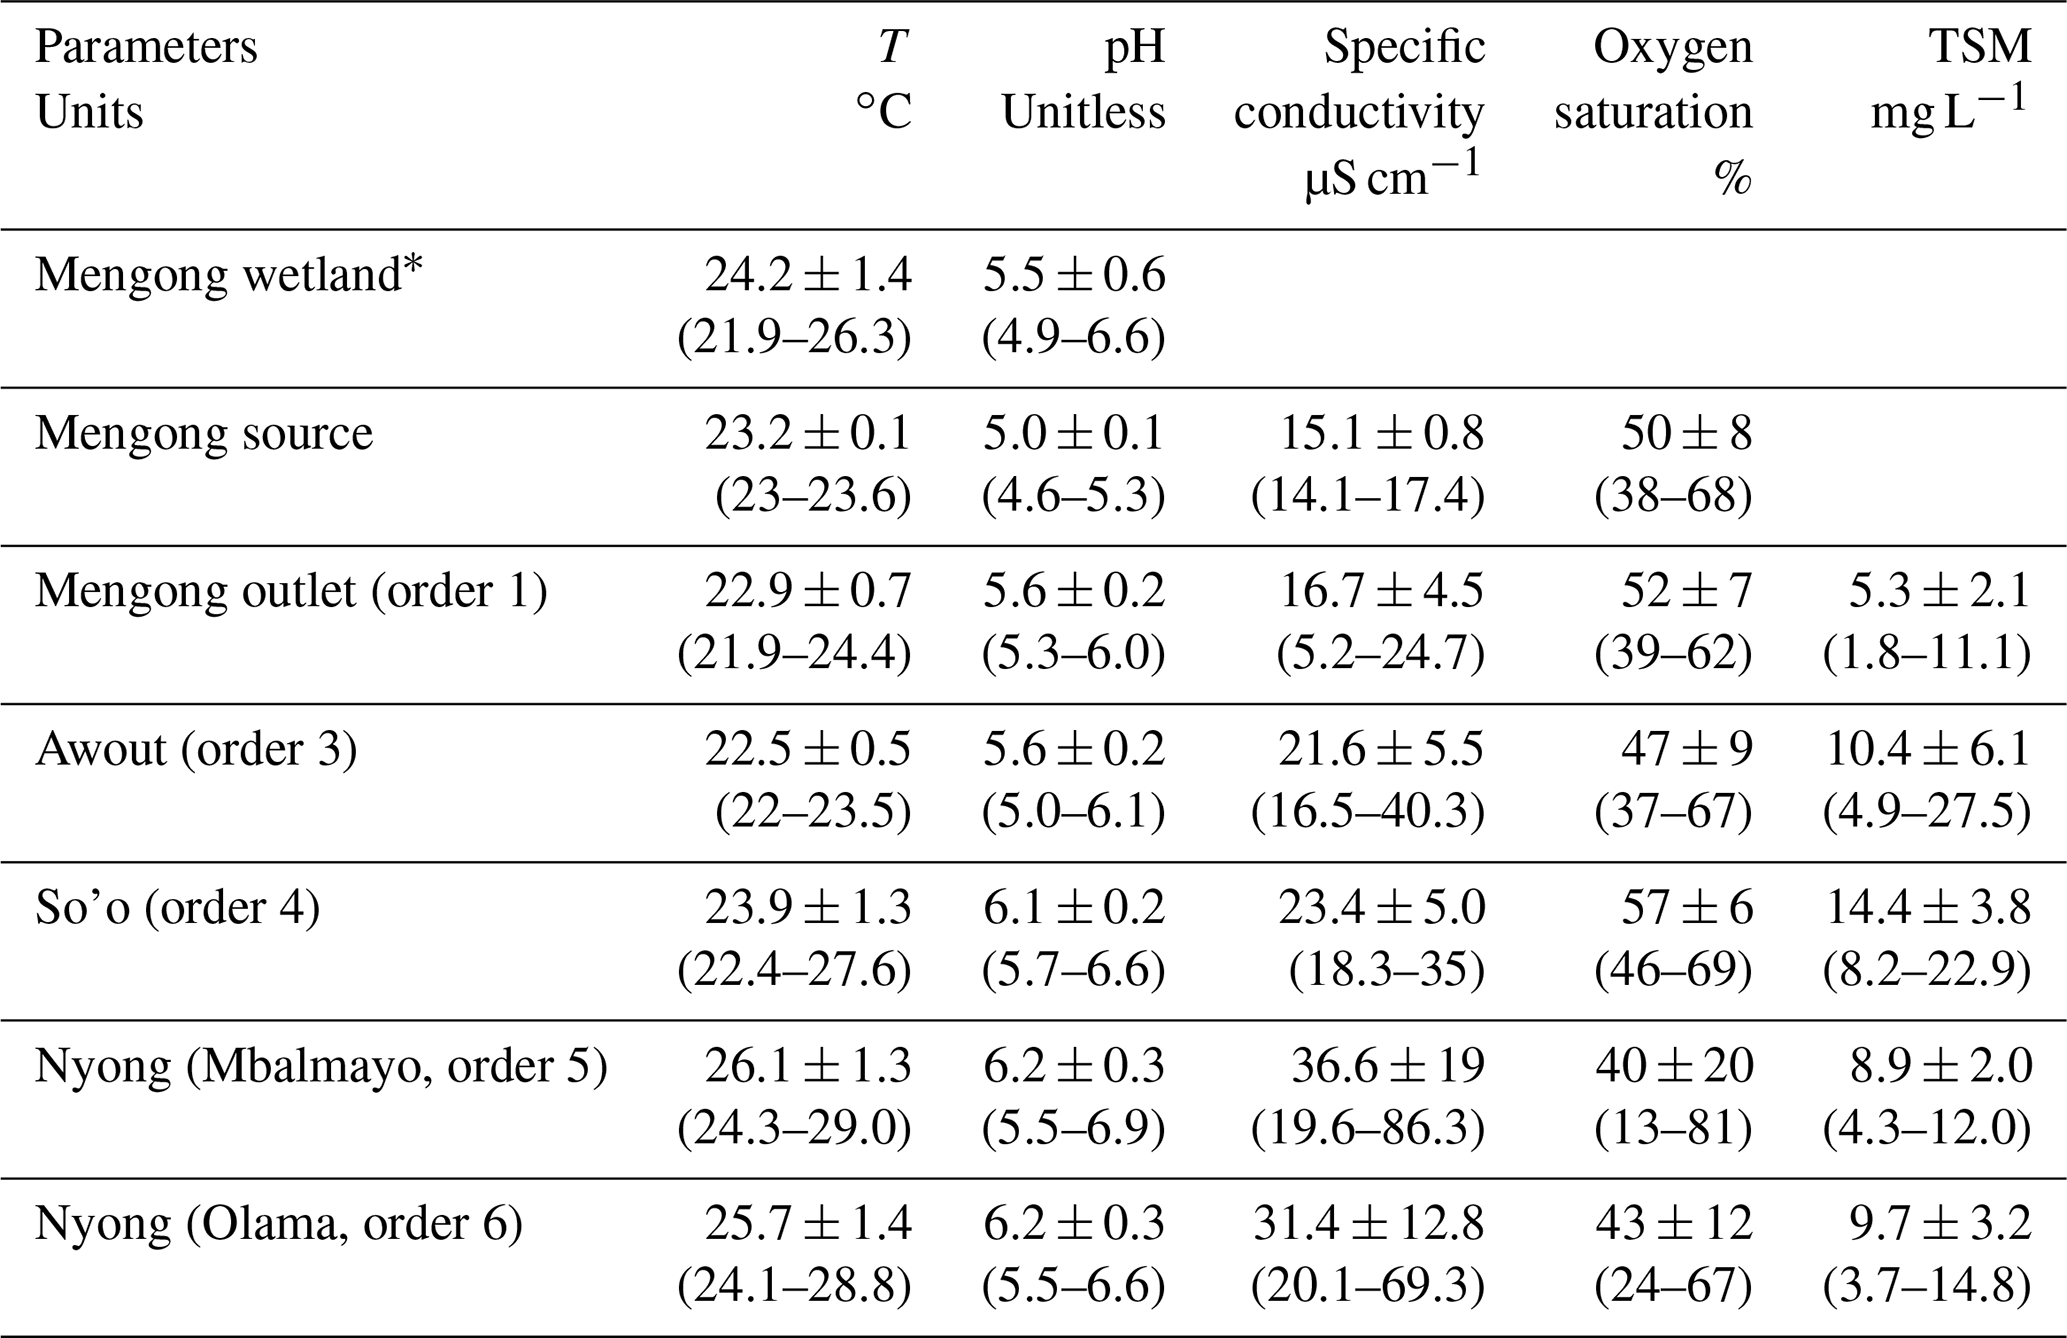
∗ Measured in the topsoil solution of the Mengong wetland at 0.4 m depth by Nkoue-Ndondo et al. (2020).
3.2 Seasonal variations in C and ancillary parameters in non-flooded forest groundwater
Yearly averages and ranges in C and ancillary parameters in non-flooded forest groundwater are detailed in Tables 2 and 3. The coefficients of variation in groundwater temperature, pH and specific conductivity were lower than 5 %, showing a strong stability for these parameters throughout the water cycle. Oxygen saturation in non-flooded forest groundwater increased during the long dry season and peaked at the end of the same season (up to 68 % on 30 March 2016), then slowly decreased towards the end of the long rainy season (down to 38 % the 15 November 2016) (Fig. 4). pCO2 in non-flooded forest groundwater concentration exhibited strong temporal variations (coefficient of variation was about 50 %) and peaked in the middle of the short (up to 100 000 ppmv on 16 February 2016) and long (up to 200 000 ppmv on 1 August 2016) dry seasons, while decreasing during the two wet seasons (Fig. 4). All year long, DOC in non-flooded forest groundwater was below the detection limit of 1 mg L−1 (< 83 µmol L−1); note we considered this threshold as the average DOC concentration in non-flooded forest groundwater. Despite one peak of TA that was up to 138 µmol L−1 on 29 September 2016, TA in non-flooded forest groundwater was relatively stable through the water cycle (Fig. 4).
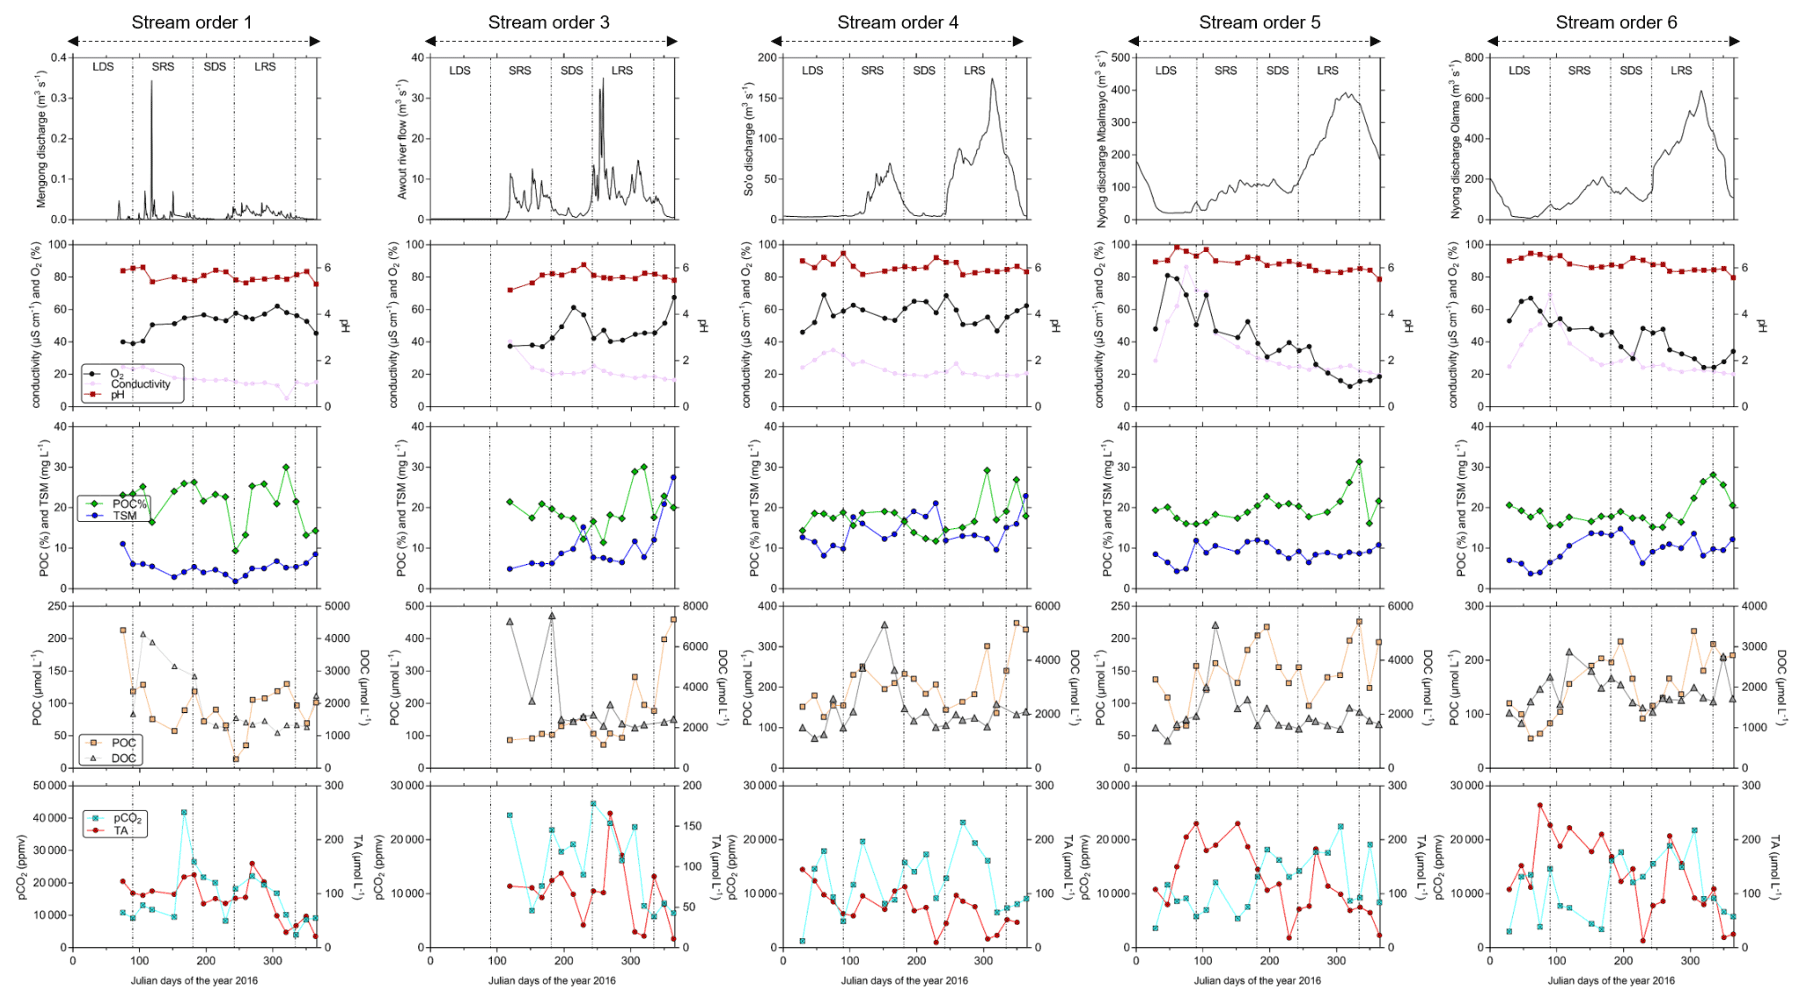
Figure 5Temporal variations in river discharge, carbon (pCO2, TA, DOC, POC) and ancillary parameters (oxygen saturation as O2, pH, conductivity as specific conductivity, TSM) in surface waters of the Nyong watershed. The temporal variations are separated into the four seasons that occur in the Nyong watershed: LDS – long dry season, SRS – short rainy season, SDS – short dry season and LRS – long rainy season.
3.3 Seasonal variations in C and ancillary parameters in surface waters
Yearly averages and ranges in C and ancillary parameters in surface waters are detailed in Tables 2 and 3. In stream orders 1 and 3 variations in specific conductivity and oxygen saturation were weakly affected by the discharge as indicated by non-correlations between these parameters and the discharge in these streams (Table 4, Fig. 5). Nonetheless, in the stream order 3, we observed an increase in oxygen saturation during dry periods (Fig. 5). On the contrary, in stream orders 4, 5 and 6, variations in pH, specific conductivity and oxygen saturation as a function of river discharge were more pronounced as these parameters peaked during dry seasons and decreased during rainy seasons as indicated by significant negative correlations between these parameters and the discharge in these streams (Table 4, Fig. 5).
Table 3Spatial distribution of C variables (yearly average ± standard deviation) in waters of the Nyong watershed during the sampling year 2016. The range is shown in square brackets.
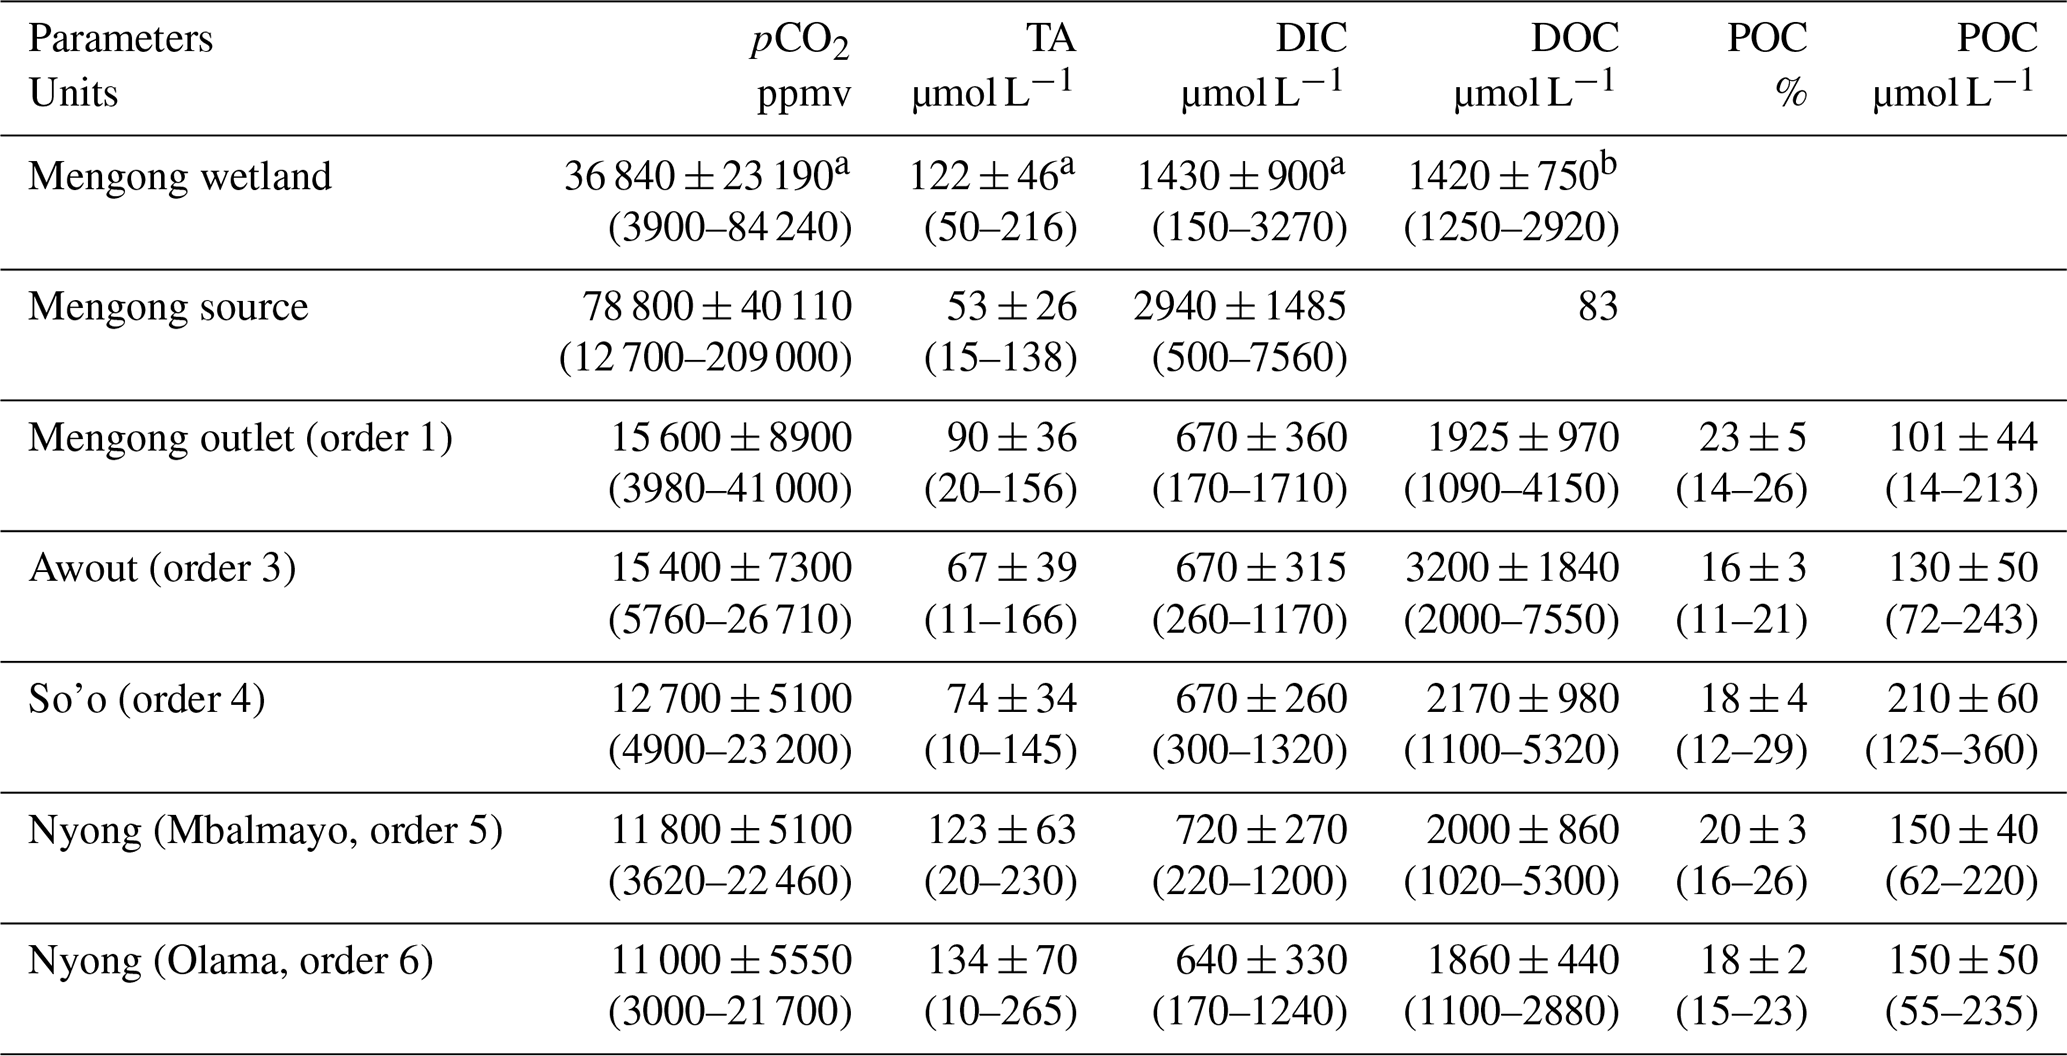
a Measured in the topsoil solution of the Mengong wetland at 0.4 m depth by Nkoue-Ndondo et al. (2020). b Measured in the topsoil solution of the Mengong wetland at 0.4 m depth by Braun et al. (2005).
DOC concentration in stream order 1 increased at the beginning of the re-flowing period (i.e. at the beginning of the short rainy season, up to 4 140 µmol L−1 on 14 April 2016) (Fig. 5). In larger streams (order > 1), a similar DOC trend occurred but with a slight delay of about a couple of weeks in comparison to the one observed in stream order 1 (Fig. 5). In all stream orders, after the seasonal peak of DOC at the beginning of the short rainy season, DOC concentration quickly decreased to reach minimum values during the following short dry season, and then DOC concentration was rather stable until the next short rainy season (Fig. 5). In stream order 1, POC and TSM concentrations also peaked significantly at the beginning of the re-flowing period, driving the negative correlation of these two parameters with the discharge in stream order 1; we did not observe a similar increase in higher-order streams (Table 4; Fig. 5). In addition, in stream order 1, POC %, POC and TSM concentrations increased during the two wet seasons, while decreasing during the short dry season; a similar trend was observed in stream orders 5 and 6 as indicated by positive correlations between POC and TSM and the discharge in stream orders 5 and 6 (Table 4; Fig. 5). In contrast, in stream orders 3 and 4, TSM concentration did not follow this trend as it peaked during the short dry season and at the beginning of the long dry season (Fig. 5).
In all stream orders, we observed an increase in TA concentration during the long rainy season followed by a quick decrease (Fig. 5). Overall, there was also a peak in TA concentration at the end of the long dry season followed by a decrease during the following short rainy and dry seasons, driving the significant negative correlations between discharge and TA concentration in stream orders 4, 5 and 6 (Table 4, Fig. 5). In stream order 1, pCO2 exhibited a similar trend to the POC, with values peaking during the two wet seasons (Fig. 5). In larger streams (order > 1), pCO2 also seasonally peaked during the long rainy season, but more significantly in stream orders 5 and 6 as indicated by the positive correlations between pCO2 and discharge in stream orders 5 and 6 (Table 4).
Table 4Correlations (Pearson's correlation test) between C or ancillary parameters and the discharge in the different stream orders.
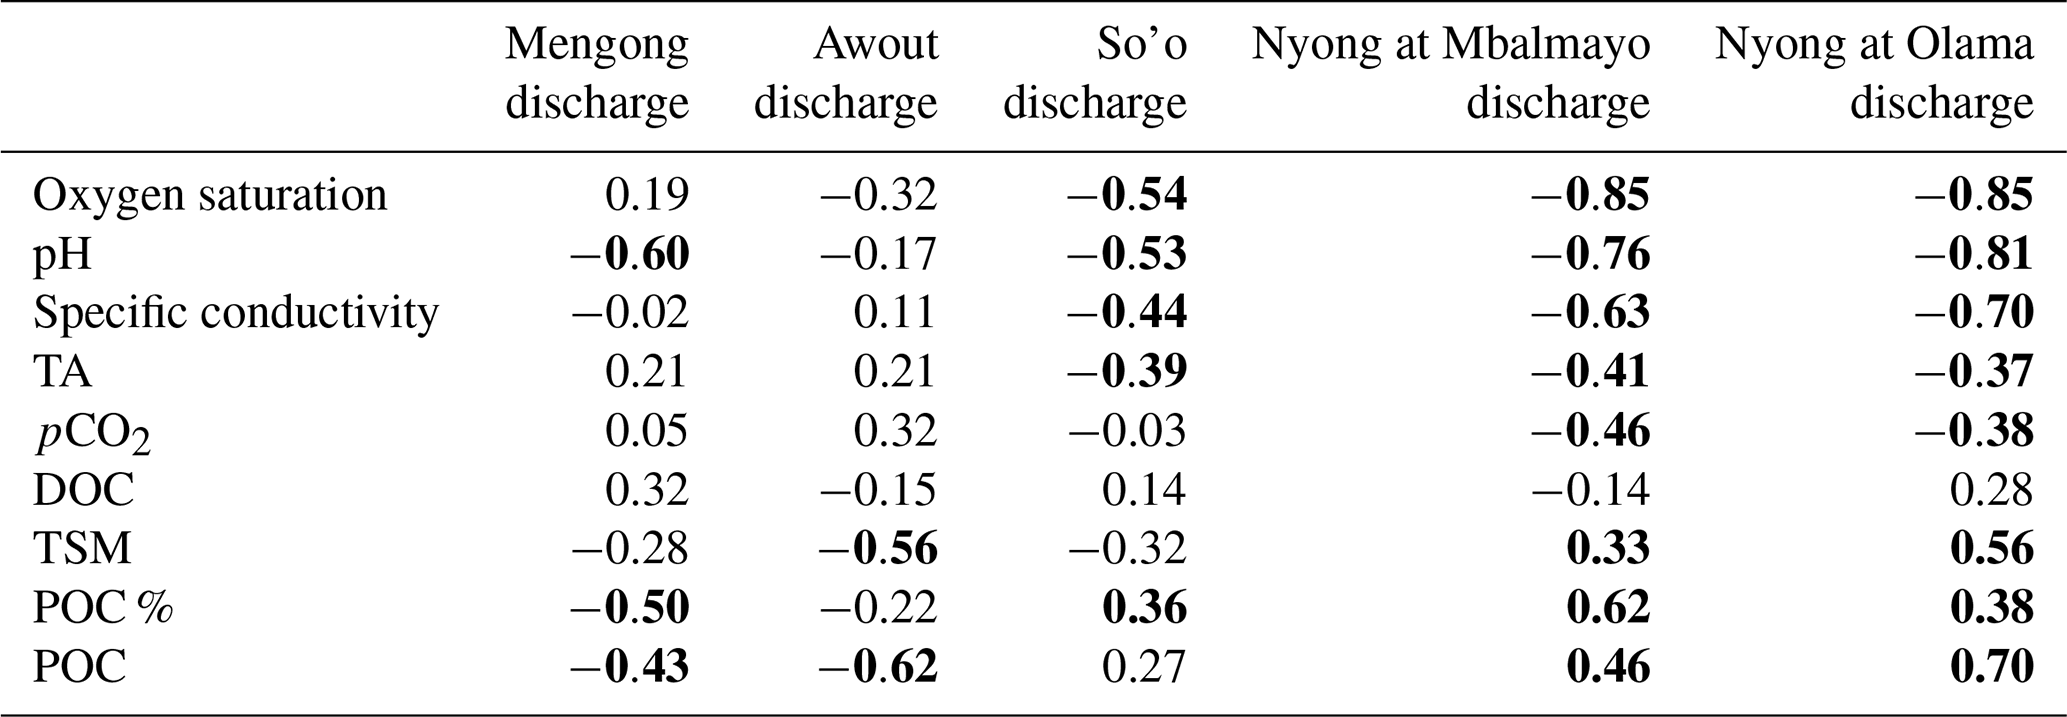
The Pearson correlation coefficient is indicated, and significant correlations (p<0.05) are in bold.
3.4 Spatial variations in C and ancillary parameters across non-flooded forest groundwater and increasing stream orders
TSM and POC concentrations were not significantly different in streams orders 3, 5 and 6, but they were significantly lower in stream order 1, while being significantly higher in stream order 4 (p<0.001, Kruskal–Wallis with Dunn's multiple comparison tests) (Fig. 6). POC content of the TSM was significantly higher in stream order 1 in comparison to all other stream orders, while not being significantly different between stream orders 3 and 6 (p<0.05, Kruskal–Wallis with Dunn's multiple-comparison tests) (Fig. 6). DOC concentration was not significantly different between stream orders 1, 4, 5 and 6, but it was significantly lower in non-flooded forest groundwater, while being significantly higher in stream order 3 (p<0.001, Kruskal–Wallis with Dunn's multiple-comparison tests) (Fig. 6).
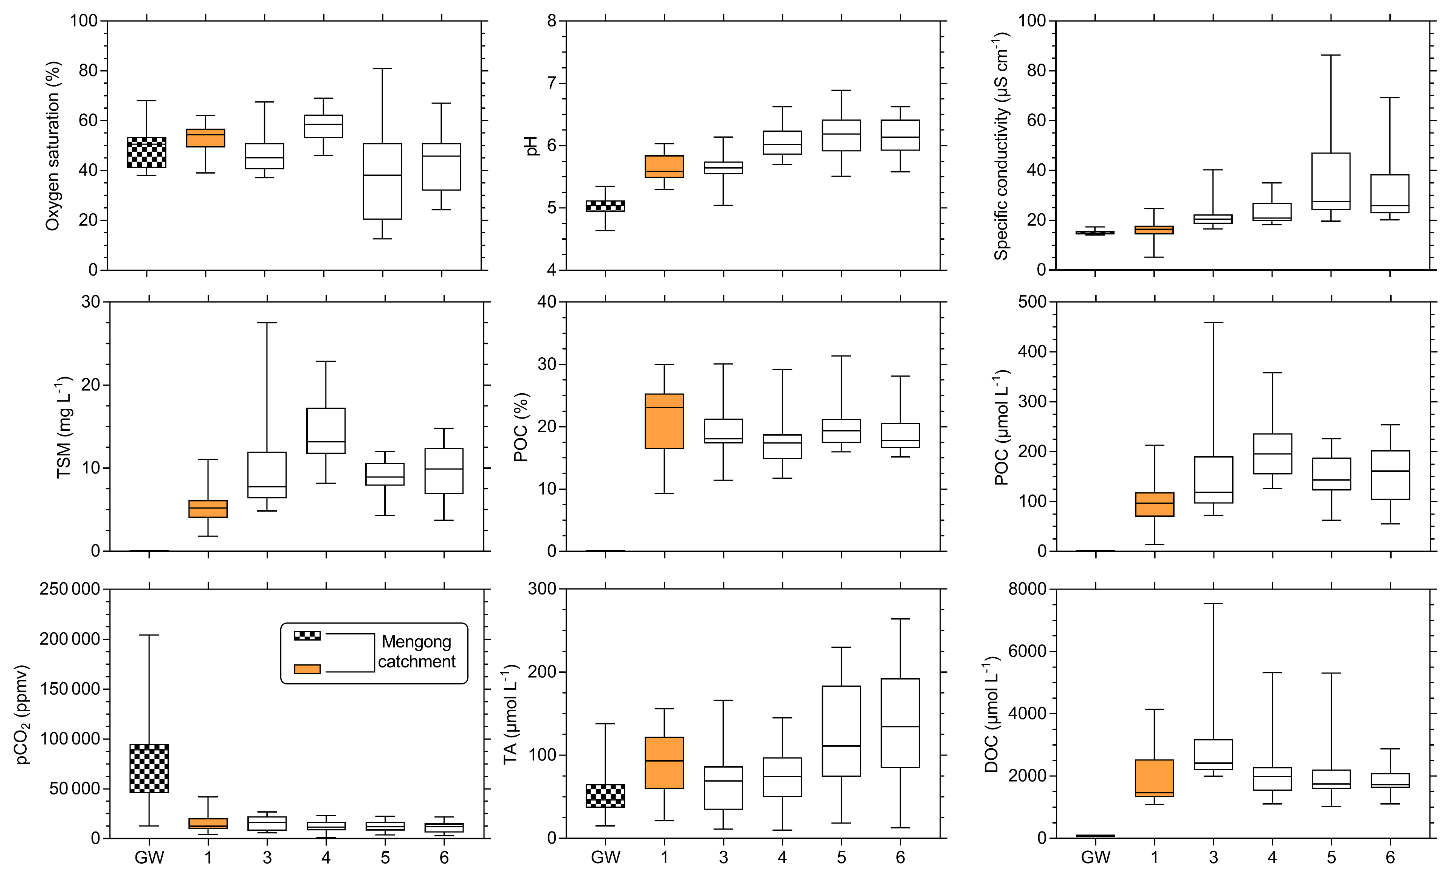
Figure 6Spatial variations in carbon parameters (pCO2, TA, DOC, POC) and ancillary parameters (oxygen saturation, pH, specific conductivity, TSM) across non-flooded forest groundwater (GW) and stream orders 1, 3, 4, 5 and 6 in the Nyong watershed. Note that the hashed and orange boxplots are for non-flooded forest groundwater and first-order streams, respectively. The boxplots represent the minimum, the first quartile, the median, the third quartile and the maximum.
The oxygen saturation was not significantly different between non-flooded forest groundwater and stream orders 1, 3 and 4, whereas it was significantly lower in the Nyong River (streams orders 5 and 6) (p<0.05, Kruskal–Wallis with Dunn's multiple-comparison tests) (Fig. 6). TA concentration was significantly higher in stream order 1 than in non-flooded forest groundwater (p>0.01, Mann–Whitney test) (Figs. 5, 6). In addition, TA concentration was significantly higher in stream orders 5 and 6 than in non-flooded forest groundwater and in stream orders 1, 3 and 4 (p<0.001, Kruskal–Wallis with Dunn's multiple-comparison tests) (Fig. 6). pCO2 was significantly higher in non-flooded forest groundwater, while it was similar in all other stream orders (p<0.001, Kruskal–Wallis with Dunn's multiple-comparison tests) (Fig. 6), even though pCO2 decreased overall from stream order 1 to 6 (Table 3).
Table 5DOC, DIC and POC budgets in the first-order Mengong stream (Eqs. 8–10). Fluxes are in MgC yr−1 and are described in detail in Sect. 2.5. Briefly, FGW is the quantity of dissolved carbon leached from non-flooded forest groundwater to the Mengong stream (Eq. 11), FWL is the quantity of carbon leached from the Mengong wetland to the Mengong stream (Eqs. 13–14), FD is the quantity of CO2 degassed from the Mengong stream to the atmosphere, FRH is the heterotrophic respiration in the Mengong stream and FOUT is the quantity of carbon hydrologically exported at the outlet of the Mengong stream.

3.5 C budget at the Mengong catchment scale
The DICbudget was well-balanced, showing input and output fluxes not statistically different (p>0.05; Mann-Whitney test) and differing only by 6 % (Table 5), indicating that all DIC fluxes have been considered and well constrained. In contrast, the DOCbudget was not balanced, showing statistically different input and output fluxes (p<0.001; Mann–Whitney test) by 240 % (Table 5), showing that unidentified DOC inputs were overlooked from the estimated budget. The quantity of hydrologically exported C from non-flooded forest groundwater (FGW+FGW-bis) was 6.8 ± 3.0 MgC yr−1 (14.1 ± 6.2 MgC km−2 yr−1), with DIC contributing 97 % (Fig. 7). A total of 10 % of the C hydrologically exported from non-flooded forest groundwater goes to the wetland (FGW-bis) rather than the stream (FGW) (Fig. 7). The quantity of hydrologically exported C from wetland to the stream (FWL) was 4.0 ± 1.5 MgC yr−1 (33.0 ± 12.4 MgC km−2 yr−1); DOC, DIC and POC contribute 45, 45 and 5 %, respectively (Fig. 7). The C degassed to the atmosphere as CO2 (FD) was 5.5 ± 2.3 MgC-CO2 yr−1, while the heterotrophic respiration in the stream (FRH) was 0.3 ± 0.3 MgC-CO2 yr−1 (Fig. 7).
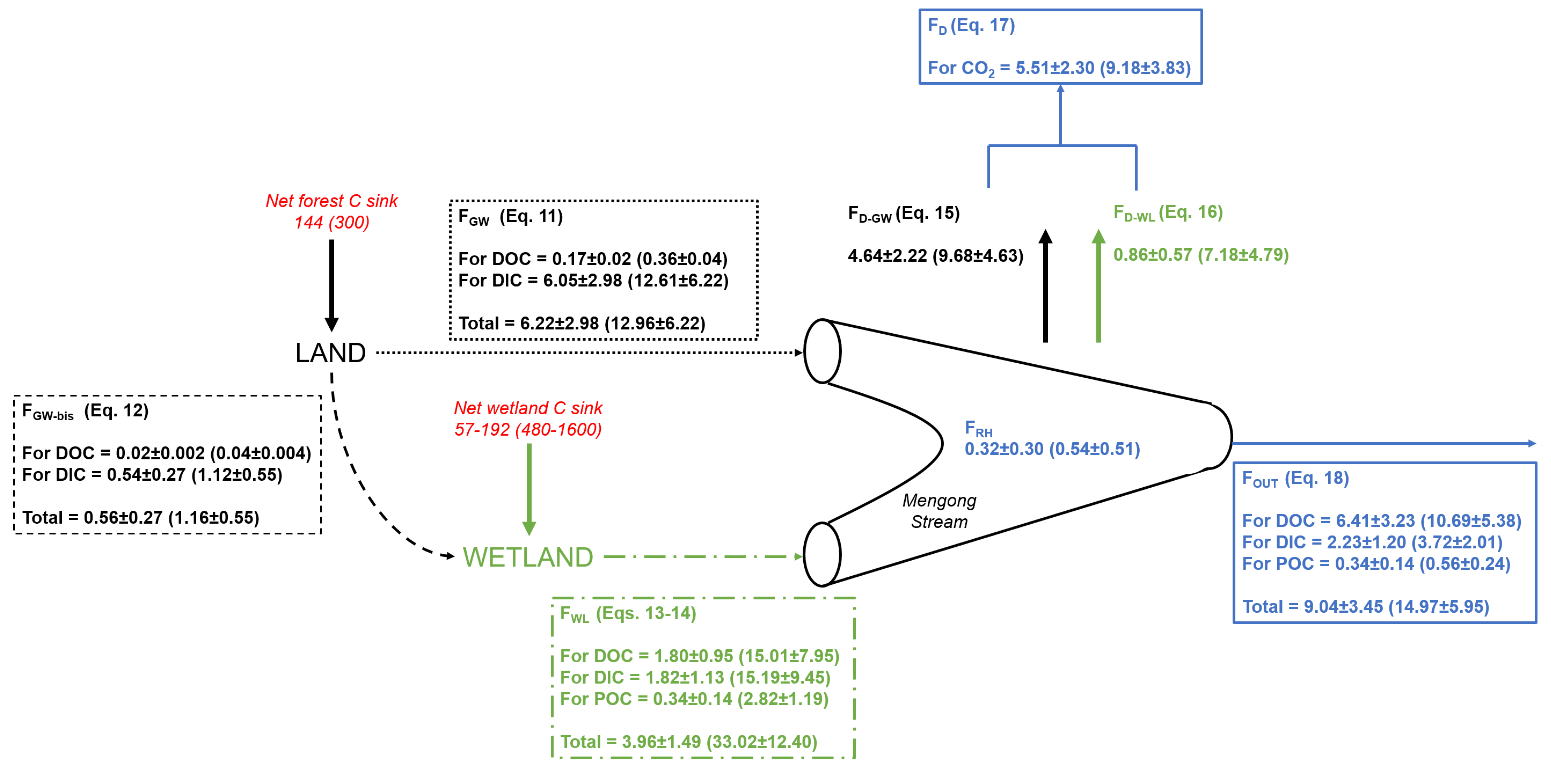
Figure 7Mass balance of C in the first-order Mengong catchment. All fluxes are in MgC yr−1, and in MgC km−2 yr−1 when between brackets (weighed by the surface area of 0.48 km2 drained by non-flooded forest groundwater for the net forest C sink, FGW, FGW-bis and FD-GW; by the wetland surface area of 0.12 km2 for the net wetland C sink, FWT and FD-W; and by the Mengong catchment area of 0.6 km2 for FOUT, FD and FRH), and they are associated with their corresponding equations as described in detail in the Sect. 2.5. Briefly, FGW is the quantity of dissolved carbon leached from non-flooded forest groundwater to the Mengong stream (Eq. 11), FGW-bis is the quantity of dissolved carbon leached from non-flooded forest groundwater to the Mengong wetland (Eq. 12), FWL is the quantity of carbon leached from the Mengong wetland to the Mengong stream (Eqs. 13–14), FD is the quantity of C degassed from the Mengong stream to the atmosphere, FRH is the heterotrophic respiration in the Mengong stream and FOUT is the quantity of carbon hydrologically exported at the outlet of the Mengong stream. In addition, net forest C sink of the Mengong catchment estimated by Brunet et al. (2009) and a range of typical net wetland C sink measured in wetlands in Africa by Saunders et al. (2007) and Jones and Humphries (2002) are both indicated.
Table 6At the Nyong watershed scale, yearly averages with standard deviations (based on averaging monthly values in each stream order) of CO2 degassing rates (Fdegas in gC-CO2 m−2 yr−1), k600 (m d−1), water surface area (m2) and integrated CO2 degassing flux (Fdegas in GgC-CO2 yr−1), estimated in the different stream orders. Range (based on monthly values) is shown between brackets. In addition, rates of heterotrophic respiration (gC-CO2 m−2 yr−1) in stream orders 1 and 5 are indicated.

a Considering an additional benthic respiration in tropical rivers of 222 gC m−2 yr−1 by Cardoso et al. (2014). b Calculated as the sum of the integrated CO2 degassing flux in each stream order, this represents the CO2 degassing flux from the entire river network (GgC-CO2 yr−1). c This represents the CO2 degassing flux from the entire river network weighed by the surface area of the Nyong watershed (MgC-CO2 km−2 yr−1). Note that measurements in second-order streams were extrapolated (see method).
3.6 CO2 degassing and C export to the ocean at the Nyong watershed scale
Spatially, yearly averages of monthly k600 increased from stream order 1 (2.2 ± 0.1 m d−1) to 4 (3.0 ± 0.3) and subsequently decreased downstream in stream orders 5 (2.3 ± 0.1) and 6 (2.5 ± 0.2) (Table 6). In contrast, monthly k600 did not exhibit much seasonal variation (Table 6; Fig. S2). Spatially, yearly averages of monthly CO2 degassing rates were similar in stream orders 1, 2, 3 and 4 but significantly lower in stream orders 5 and 6 (p<0.001, Kruskal–Wallis with Dunn's multiple-comparison tests) (Table 6). Rates of heterotrophic respiration were 286 ± 228 and 756 ± 333 gC-CO2 m−2 yr−1in stream orders 1 and 5, respectively, whereas CO2 degassing rates were 5344 ± 2773 and 3706 ± 1540 gC-CO2 m−2 yr−1in the same stream orders, respectively (Table 6). Seasonally, considering all stream orders, the monthly average CO2 degassing rate during rainy seasons was on average 20 % higher in comparison to the average CO2 degassing rate during dry seasons, explaining higher integrated CO2 degassing during rainy seasons at the Nyong watershed scale (Fig. 8). In addition, at the Nyong watershed scale, the yearly integrated CO2 degassing (Fdegas) was 652 ± 161 GgC-CO2 yr−1 (23.4 ± 5.8 MgC-CO2 km−2 yr−1 when weighed by the Nyong watershed surface area), and the yearly integrated hydrological C export to the ocean (Focean) was 12 ± 10 GgC yr−1 (0.6 ± 0.5 MgC km−2 yr−1) for POC, 134 ± 100 GgC yr−1 (7.2 ± 5.4 MgC km−2 yr−1) for DOC, and 46 ± 42 GgC yr−1 (2.5 ± 2.3 MgC km−2 yr−1) for DIC; more than 50 % of Focean occurred during the long rainy season (Tables 6–7; Fig. 8).
Table 7At the Nyong watershed scale, averages of monthly hydrological export of C to the ocean (Focean) and of monthly CO2 degassing to the atmosphere (Fdegas).

∗ The net C sink estimated by Brunet et al. (2009) for the entire Nyong watershed is also indicated.
4.1 Non-flooded forest groundwater and wetland as C sources in a first-order catchment
The drainage of non-flooded forest groundwater (i.e. groundwater from the hillside lateritic system) and wetland (i.e. hydromorphic system) fuels the Mengong stream with organic and inorganic C (Figs. 3, 7; Boeglin et al., 2005; Viers et al., 1997). In the hillside lateritic system, overland flow is negligible owing to limited soil erosion due to dense vegetation cover and high soil porosity facilitating rainfall infiltration (Braun et al., 2005; Maréchal et al., 2011). Consequently, hydrological export of soil C to the stream by overland flow from the hillside is considered negligible. In contrast to the hillside lateritic system, overland flow is a possible C pathway from the hydromorphic wetland system to the stream (Fig. 3; Maréchal et al., 2011). Thus, the stream POC should originate mostly from the overland flow over the wetland, as also suggested by similar δ13C values of total organic carbon (TOC) in the wetland soil and in the POC observed in the stream outlet (range was −28 ‰ to −31 ‰) of the Mengong catchment by Nkoue-Ndondo et al. (2020). The fact that POC and TSM concentrations in the Mengong stream increased during rainy seasons, when the hydrological connectivity with the surrounding wetland is enhanced, is also in good agreement with the identification of wetland as the main (if not exclusive) source of POC and TSM. Furthermore, Nkoue-Ndondo et al. (2020) did not observe seasonal variations in the δ13C-POC signature in the Mengong stream. This suggests that the additional POC source observed at the beginning of the reflowing period also originates from the erosion of the wetland even though this hydrological period was characterized by a weaker hydrological connectivity with the wetland compared to rainy seasons. In the Mengong wetland, litter-fall measurement by Nkoue-Ndondo (2008) was 116 t yr−1 of wet OM with a mean C content of 22.5 %, which is equivalent to 26 MgC yr−1, a flux 75 times higher than our conservative estimation of the POC leached from the wetland to the stream (0.3 t MgC yr−1, Fig. 7). This implies that most of the wetland litter-fall accumulates in the wetland soil rather than being hydrologically exported to the stream in the form of POC, in particular due to limited overland flow in the wetland due to flat topography (Maréchal et al., 2011). However, the in situ degradation of highly labile OM from litter-fall might contribute to the DOC and DIC fluxes from the wetland to the stream. Indeed, tropical wetlands are recognized as productivity hotspots, and a large fraction of the litter-fall is degraded in situ by heterotrophic respiration in the water and sediment, enriching wetland waters in DOC and DIC (Abril et al., 2014; Borges et al., 2015a).
In the Mengong catchment, waters originating from the drainage of non-flooded forest groundwater and wetland are considered clear and coloured waters, respectively, with the colour reflecting their DOC content (Boeglin et al., 2005; Viers et al., 1997). Indeed, DOC concentration was low in clear waters (< 83 µmol L−1) whereas DOC concentration was high in coloured waters (1420 ± 750 µmol L−1) (Table 3; Viers et al., 1997). The DOC in the soil solution has distinct sources that are litter leaching, root and microbial exudates; rainfall (throughfall and stemflow); and decaying fine roots (Bolan et al., 2011; Kalbitz et al., 2000). Once in the soil solution, DOC is however rapidly adsorbed onto soil minerals during its percolation through the soil column due to the soil capacity for DOC stabilization (Kothawala et al., 2009; Neff and Asner, 2001) by sorption on Fe (and Al) oxides and hydroxides and clay minerals (Kaiser et al., 1996; Kothawala et al., 2009; Sauer et al., 2007). DOC sorption in soils significantly reduces DOC mineralization rates in soils (Hagedorn et al., 2015; Kalbitz et al., 2005; Kalbitz and Kaiser, 2008) and DOC export from soils (Shen et al., 2015). DOC sorption in soils also partly explains the decreasing gradient of DOC concentration with depth commonly observed in boreal (e.g. Moore, 2003), temperate (e.g. Deirmendjian et al., 2018) and tropical (e.g. Johnson et al., 2006) soils. DOC sorption in soils is actually strongly related to the availability of Fe (and Al) oxides and hydroxides and clay minerals, which are present both in the hillside lateritic and in the hydromorphic wetland soils of the Mengong catchment (Fig. S1). In the hillside lateritic system, soil DOC is probably well stabilized in the iron-rich and clay horizons, preventing DOC from leaching to the non-flooded forest groundwater (Braun et al., 2005, 2012). Furthermore, DOC must be desorbed from soil minerals in order to be exported to groundwater (Sanderman and Amundson, 2008). Studies have shown that water saturation of the topsoil generates reducing conditions in the saturated soil (Camino-Serrano et al., 2014; Fang et al., 2016), which limits the retention of soil DOC and thus enhances its export to groundwater (Deirmendjian et al., 2018). In the hillside lateritic system, the non-flooded forest groundwater table never reaches the topsoil where soil DOC is high. Therefore, DOC adsorption in these soils might be enhanced. In the hydromorphic wetland system, the groundwater saturates the topsoil all year long (Fig. S1), which might reduce DOC adsorption in this compartment. In addition, hydromorphic conditions occurring in the Mengong wetland soil favour the solubilization of Fe (Oliva et al., 1999), which is supposed to reduce DOC sorption. Altogether, this explains the low and high DOC concentrations observed in the non-flooded groundwater and the wetland, respectively. In addition, the results showed that stream DOC increased during the first wet season only. In the Mengong catchment, Nkounde-Ndondo (2008) described the piston flow that occurs at the beginning of the short rainy season, which is caused by new infiltration of water on the hills and hillsides that pushes the older soil water downstream (e.g. Huang et al., 2019, and references therein), allowing pressure on the aquifer and thus exfiltration at the bottom of the slope (i.e. in the wetland; Fig. 3). Consequently, wetland DOC is quickly flushed during the first rains and originates from the subsurface horizons of the wetland soil. Later in the season, the decrease in stream DOC is due to dilution with non-flooded forest groundwater with low DOC content. Our stream DOC budget was not balanced (Table 5; Fig. 7), indicating that sources contributing to the DOC content of the Mengong stream were overlooked. An additional DOC source that was quantified by Braun et al. (2005) over 4 years in the Mengong catchment is DOC in the throughfall. These authors determined that the average DOC concentration in the throughfall was 3.6 ± 3.5 mg L−1. Applying average DOC concentration in the throughfall to the rainfall in 2016 and the catchment surface area gives an additional DOC input from precipitation of 4.3 ± 4.3 MgC yr−1, which allows us to close the DOC budget at the Mengong catchment scale.
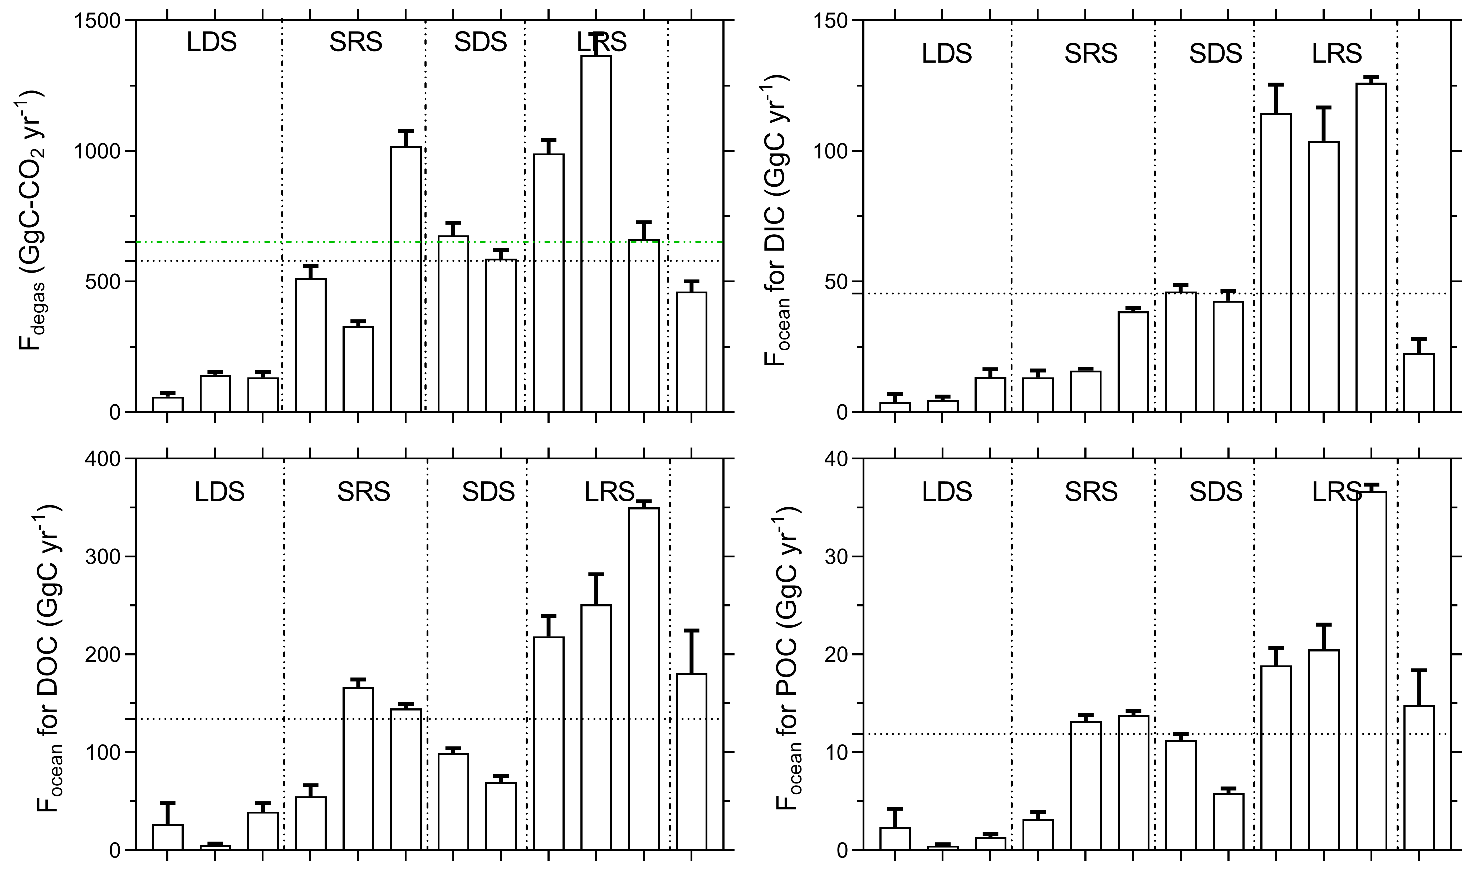
Figure 8Monthly C fluxes at the Nyong watershed scale described in Sect. 2.4. For Focean, the black dashed lines represent the yearly average of the different monthly C fluxes. For Fdegas, the green dashed line is obtained by summing yearly integrated CO2 degassing in each stream order, as in Table 6, which represents 651.9 ± 160.6 GgC yr−1. For Fdegas, the black dashed line represents the yearly average of the different monthly CO2 degassing fluxes from the entire river network, as in Fig. 8, which represents 578.9 ± 157.9 GgC yr−1. The figures are separated into the four seasons that occur in the Nyong watershed: LDS – long dry season, SRS – short rainy season, SDS – short dry season and LRS – long rainy season.
Non-flooded forest groundwater and wetland exhibited high DIC concentrations, 2940 ± 1485 and 1430 ± 900 µmol L−1, respectively, and, in both systems, DIC was mostly in the CO2 form (> 90 %) (Table 3). Microbial activity has been shown to be limited in many aquifers by the availability of DOC (e.g. Malard and Hervant, 1999, and references therein). Thus, as non-flooded forest groundwater was free of DOC, CO2 in non-flooded forest groundwater likely comes from soil respiration in the overlaying non-saturated soil – rather than respiration within the groundwater – and then is transported downward by diffusion rather than percolation with rain water. Indeed, the thickness of the lateritic cover on hills and slopes of the Mengong catchment considerably slows the water percolation in the bedrock (Boeglin et al., 2005). In the tropics, the soil respiration rate is mostly affected by soil moisture as soil temperature exhibits low seasonal variations (Davidson et al., 2000). Accordingly, soil respiration rates usually decrease from rainy to dry seasons in tropical ecosystems due to decreasing soil moisture (Davidson et al., 2000; Schewendenmann and Veldkamp, 2006). Nevertheless, in the Mengong catchment, pCO2 in non-flooded forest groundwater peaked during dry seasons and started to decrease later in the same season and then during the following rainy season (Fig. 4). In mature forest of Amazonia, Johnson et al. (2008) observed a similar trend in groundwater that they attributed to an increase in vegetation water uptake and root activity in deep soils during the onset of the dry seasons. Indeed, during dry seasons, tropical mature forest depends on the deep root system to extract water from the soil, and the deep root system also provide inorganic and organic C to the deep soil trough root respiration and exudation (Nepstad et al., 1994). Furthermore, during dry seasons, the diffusion of CO2 in the porous soil is facilitated in tropical forest (Adachi et al., 2006) because low soil water content increases air-filled pore space (Schewendenmann and Veldkamp, 2006), very likely favouring the downward diffusion of soil CO2 and its subsequent dissolution in groundwater, as also observed in temperate forests (Deirmendjian et al., 2018; Tsypin and Macpherson, 2012). In the non-flooded forest groundwater, oxygen saturation was about 40 % but increased during dry seasons whereas it decreased during rainy seasons (Fig. 4). Atmospheric air can thus penetrate the soil atmosphere deeply, in particular during dry seasons when the diffusion in the porous soil is facilitated, and can reach the non-flooded forest groundwater. In the wetland hydromorphic system, the soil is permanently saturated, which limits aerobic respiration of microbes in the soil and leads to the accumulation of OM in the soil profile, likely explaining the lower CO2 concentration observed in the wetland compared to non-flooded forest groundwater (Table 3). Nonetheless, it should be noted that wetland vegetation can actively transport oxygen to the root zone via their aerenchyma (Haase and Rätsch, 2010), creating a complex oxic–anoxic interface that promotes aerobic respiration but also supplies labile OM to anaerobic degradation (and methanogenesis), fuelling CO2 (and CH4) production (Piedade et al., 2010). This is in a good agreement with δ13C-DIC signatures of −16 ‰ measured by Nkoue Ndondo et al. (2020) in the wetland soil, which are indeed close to the C4 signature of aquatic grassland found in the Mengong wetland. In addition to drainages of non-flooded forest groundwater and wetland, stream DIC can also originate from in situ respiration of DOC. In situ respiration of DOC is corroborated by our results of incubations (Table 6), and by the δ13C-DIC at the Mengong stream outlet that was more depleted in 13C than in non-flooded forest groundwater and wetland (Nkoue Ndondo et al., 2020), which highlights in-stream respiration from an organic 13C-depleted source.
Non-flooded forest groundwater and wetland both exhibited low TA concentrations, 53 ± 26 and 122 ± 46 µmol L−1, respectively; nonetheless TA concentration was significantly higher in wetland (Table 3; Fig. 6). Considering the granitic lithology (i.e. absence of carbonate minerals) of the Nyong watershed, TA in non-flooded forest groundwater and wetland might originate from the weathering of silicate minerals as dissolved CO2 can react with silicate minerals to produce bicarbonates (Meybeck, 1987). Applying TA concentration in non-flooded forest groundwater in Eqs. 11 and 12 results in a silicate weathering rate in the overlaying lateritic soil of 0.2 ± 0.1 MgC km−2 yr−1, whereas applying TA concentration in wetland in Eq. (13) results in a silicate weathering rate in wetland of 1.3 ± 0.4 MgC km−2 yr−1. The silicate weathering rate in the wetland soil is thus 550 % higher than in the non-flooded lateritic soil. Even though these two rates remain low compared to weathering rates in carbonated environment, they are typical of silicate weathering rates which are in the range 0.1–5.2 MgC km−2 yr−1 as estimated from diverse worldwide basins by Amiotte Suchet et al. (2003). In non-flooded forest groundwater, the low TA concentrations and silicate weathering rates, along with the absence of significant seasonal variations in TA, are likely related to the relatively inert mineralogy of the lateritic soil cover (Braun et al., 2005, 2012). In the Nyong watershed, the low silicate weathering rates are in good agreement with the low mineral dissolved load in the aquifer (Braun et al., 2002) and by the dissolved silica fluxes in rivers that were significantly lower compared to the annual rainfall (White and Blum, 1995). In addition, silicate weathering rates in the wetland might be enhanced by the leaching of humic acids from the vegetation to the hydromorphic soils (Braun et al., 2005; Nkoue-ndondo, 2008).
4.2 Influence of wetland–river connectivity on riverine C cycling at the Nyong watershed scale
The role of wetland on riverine C cycling in tropical watersheds is commonly explored using empirical relationships between wetland extent and C concentrations in the stream water of the different sub-catchments of a given watershed. Establishing such empirical relationships in the Nyong watershed is extremely challenging owing to the similar wetland extent (about 5 % of the surface area; Table 1) in the sub-catchments, with the exception of the first-order Mengong catchment where the wetland extent represents 20 %. However, this role can be explored by comparing the seasonality of C concentrations in stream order 1 – in which the wetland dynamic as a riverine C source has been discussed in the above section – with respect to the larger streams (order > 1). Thus, for a given parameter, similar seasonality in stream order 1 and the larger streams might suggest that C sources and processes are similar in both (sub)systems.
Similarly to what we observed in the Mengong catchment, wetlands might also be considered the main source of POC for surface waters in the whole Nyong watershed based on (1) the low slopes in the watershed, (2) the high infiltration capacity of the soil, (3) the similar normalized export of POC from wetland to the Mengong stream (order 1) and from the Nyong watershed to the ocean (Tables 5 and 7), and (4) the probable low pelagic primary production in the surface waters of the Nyong watershed, as usually observed in tropical rivers with high DOC concentrations (> 1500 µmol L−1) where light attenuation caused by browning (coloured waters) strongly limits aquatic photosynthesis (Borges et al., 2019). Moreover, the seasonality of POC was similar in stream order 1 and in high-order streams, increasing during rainy seasons while decreasing during dry seasons (Fig. 5). Thus, the POC leached from wetlands from low-order catchments might acts as an important POC source to high-order streams. However, during rainy seasons, the higher POC concentration observed in high-order streams in comparison to stream order 1 (Figs. 5–6) might also suggest an additional POC source in high-order streams during rainy seasons. In high-order streams, given that POC % increased during rainy seasons, riverbed and bank erosion is not likely as this process would have exported more TSM than POC, as observed in the tropical Tana River in Kenya by Tamooh et al. (2012). As pelagic primary production is also unlikely, POC leached from riparian wetlands to high-order streams and POC leached from floating macrophytes that develops in the riverbed of high-order streams during the dry seasons anterior to the rainy seasons are more suitable hypotheses to explain the additional POC source observed in high-order streams during rainy seasons. Indeed, as in the Amazonian basin (e.g. Abril et al., 2014; Engle et al., 2008; Silva et al., 2013), in high-order streams we observed the development of floating macrophyte during dry seasons. In high-order streams, the development of these floating macrophytes was accompanied by peaks of oxygen saturation during dry seasons (Table 4; Fig. 5). This last feature is in line with the high photosynthesis capacity of macrophytes that results in oxygen-enriched water during daylight (Sabater et al., 2000). According to the flood pulse concept in tropical rivers by Junk et al. (1989), floating macrophytes might be hydrologically exported during rainy seasons when the river discharge increased sufficiently. In high-order streams of the Nyong watershed, the seasonal wetland and floating macrophytes flush of C and OM is also supported by other evidence such as higher pCO2 and POC % along with lower oxygen saturation observed in these streams. On the one hand, these features might be attributed to enhanced heterotrophic respiration in the river fuelled by export of freshly produced and young OM (Engle et al., 2008; Mayorga et al., 2005; Tamooh et al., 2014). Moreover, OM leached from tropical wetland can be photodegraded downstream into more labile lower-molecular-weight compounds that in turn also enhance heterotrophic respiration in the river, as observed in the Congo River by Lambert et al. (2016). On the other hand, the drainage of wetland can also directly account for CO2 emissions from surface waters since under flooded conditions roots and microbial respiration occurring in wetland directly release CO2 to the water (Abril et al., 2014; Moreira-Turcq et al., 2013). These two patterns usually explain the positive correlation between pCO2 and river discharge in tropical systems (Table 4; Borges et al., 2019). Conversely, during dry periods, the wetlands shrink, and the river becomes more hydrologically disconnected from wetlands, explaining the lower pCO2 in tropical rivers during dry seasons (Abril and Borges, 2019). The importance of river–wetland connectivity was also evidenced by the first POC increase at the beginning of the re-flowing period that was not observed downstream (Fig. 5). This suggests POC was quickly oxidized in situ or did not reach downstream due to weak hydrological connectivity with high-order streams during this period. Indeed, when the Mengong stream (order 1) was flowing again, the downstream Awout River (order 3) was still dry. This highlights the complex deposition and remobilization cycles of TSM and POC in tropical rivers (Geeraert et al., 2017; Moreira-Turcq et al., 2013). Finally, in stream orders 3 and 4, we observed an additional increase in TSM during dry seasons, while POC % decreased (Fig. 5). This suggests that more TSM than POC was leached into these streams during dry seasons. We assume that riverbed and bank erosion could drive this seasonal trend. In the tropical Tana River in Kenya, based on radionuclide's ratio reflecting the age of TSM, Tamooh et al. (2014) showed that TSM was old and increased during dry seasons. This was attributed to inputs of older sediments, with river bank erosion and/or resuspended sediments suggested as the main sources.
In surface waters, in contrast to pCO2 and POC data, we did not observe a positive correlation between DOC and the river discharge, in agreement with Brunet et al. (2009), who showed that DOC in the Nyong watershed was only flushed during a short period of time at the beginning of the short rainy season (Fig. 5). In contrast to POC, DOC did not peak a second time during the long rainy season (Fig. 5). We have no explanation for this, except the fact that this probable second flush of DOC was faster than our fortnightly sampling frequency. Nonetheless, DOC exhibited a similar seasonality in stream order 1 and high-order streams, but with a slight lag time due to the time the water needs to flow from upstream to downstream, showing that wetland from low-order streams are significant sources of DOC for downstream rivers. In addition, in the Awout River (order 3), a significant increase in DOC was observed at the beginning of the reflowing period, indicating an additional source of DOC (Fig. 5). Actually, before the reflowing period, the bed of the Awout River (order 3) was completely vegetated by large macrophytes (up to 2 m tall), and many small pockets of stagnating water remained. DOC could accumulate in these stagnating waters and be remobilized when the water flows again, as observed in temperate rivers (Deirmendjian et al., 2019; Sanders et al., 2007). The seasonal wetland flush in high-order streams can also be evidenced by peaks of TA during the long rainy seasons, while the increase in TA in stream orders 5 and 6 during the long dry season could not be explained by wetland inputs to river. In stream orders 5 and 6, during the long dry season, surface waters are likely fed by deeper groundwater, which is older and likely characterized by higher TA concentrations than shallower levels, as observed in temperate (Deirmendjian and Abril, 2018) and tropical (Duvert et al., 2020b) catchments. Duvert et al. (2020b) gave additional evidence of a shift from a biogenic (wetlands) to geogenic C source during dry seasons caused by changing water sources.
4.3 C fluxes at the plot (first-order) and the watershed scales
At the first-order Mengong catchment scale, each flux of the stream C budget was estimated independently. Hydrological C inputs from wetland (FWL) and non-flooded forest groundwater (FGW) to the stream contributed to 38 % (4.0 ± 1.5 MgC yr−1) and 62 % (6.2 ± 3.0 MgC yr−1) of the total hydrological C inputs, respectively (Table 5; Fig. 7). However, when FWL and FGW are weighed by respective surface area, FWL and FGW contributed to 73 % (33.0 ± 12.4 MgC yr−1) and 27 % (13.0 ± 6.2 MgC yr−1) of the total hydrological C inputs to the stream, respectively (Fig. 7). In the first-order Mengong catchment, 83 % and 17 % of the CO2 degassing (58 % and 42 % if weighed by surface area) from the stream is sustained by inputs of DIC from non-flooded forest groundwater and wetland, respectively (Fig. 7). At the Nyong watershed scale, our study design did not allow the estimation of the contributions of CO2 degassing from non-flooded forest groundwater and wetland. However, we might assume that the wetland contribution to CO2 degassing become greater with increasing stream order, particularly considering larger riparian wetlands in high-order streams and the development of floating macrophytes in riverbeds during dry seasons (Olivry, 1986). Nonetheless, our results are in line with the growing consensus that tropical wetlands contribute significantly to the C inputs in tropical rivers (Abril et al., 2014; Borges et al., 2015a, 2019, 2015b; Duvert et al., 2020a, b). In the Mengong catchment, an important fraction (∼ 50 %) of the C entering the stream directly returns to the atmosphere through CO2 degassing at the water–air interface (Fig. 7); the remaining C is transported, processed and further degassed downstream (Abril et al., 2014). In the Nyong watershed, our estimated k600 values are typical of lowland tropical rivers (e.g. Alin et al., 2011; Borges et al., 2019). The weak seasonality of our k600 shows that higher CO2 degassing rates during rainy seasons are rather a function of the increase in CO2 water–air gradient during rainy seasons – which is due to seasonal flush of wetland and macrophytes – rather than the increase in k600 usually observed during high water periods because of increasing water turbulence. In the Nyong watershed, the average heterotrophic respiration in the river (pelagic plus benthic) rate was 521 ± 403 gC-CO2 m−2 yr−1, whereas the average CO2 degassing rate was 5085 ± 2544 gC-CO2 m−2 yr−1 (Table 6). Consequently, only ∼ 10 % of the degassing at the water–air interface was supported by heterotrophic respiration in the river. These rates are consistent with measurements by Borges et al. (2019), who showed that, in the Congo basin, the heterotrophic respiration (pelagic only) in the river averaged 355 gC-CO2 m−2 yr−1 and represented ∼ 11 % of the average CO2 degassing rate of 3240 gC-CO2 m−2 yr−1. In the same way, heterotrophic respiration in the river accounts for less than 20 % of the CO2 degassing flux from the Amazon Basin (Abril et al., 2014). Moreover, in the Nyong watershed, the ratio between rates of CO2 degassing and heterotrophic respiration in the river decreased in stream order 5 (ratio of 4.9) compared to stream order 1 (ratio of 18.6) (Table 6). This is in line with the recent findings by Hotchkiss et al. (2015) in temperate rivers, where they showed that the contribution of internal metabolism to account for CO2 emissions increased from upstream to downstream, or with the more recent findings in the Congo basin by Borges et al. (2019), who found a ratio of CO2 degassing to heterotrophic respiration in the river rates of 29–137 and 3–17 in low-and high-order streams, respectively. Borges et al. (2019) attributed their observations to the prevalence of lateral CO2 inputs in sustaining CO2 emissions.
In the Nyong watershed, about 6 % (0.6 ± 0.5 MgC km−2 yr−1), 69 % (7.2 ± 5.4 MgC km−2 yr−1) and 24 % (2.5 ± 2.3 MgC km−2 yr−1) of the Focean occurs in the POC, DOC and DIC forms, respectively (Table 7). These C exports to the ocean are consistent but slightly different from those reported by Meybeck (1993) for rivers in tropical humid regions, as he estimated that 20 % (1.9 MgC km−2 yr−1), 53 % (5.1 MgC km−2 yr−1) and 27 % (2.6 MgC km−2 yr−1) occurs in the POC, DOC and DIC forms, respectively. Therefore, in the Nyong watershed, the export of DIC to the ocean was typical of humid tropical regions while the export of POC was lower and DOC was higher. In the Nyong watershed, lower POC export to the ocean might be explained by the low watershed slope and the negligible overland flow that limits soil erosion. In contrast, DOC concentration in the surface waters of the Nyong watershed was in the upper range of those reported for other African rivers (range is 50 to 4270 µmol L−1; Tamooh et al., 2014, and references therein), thereby driving the higher DOC export to the ocean, which might be explained by higher wetland extent than in the other African rivers. Huang et al. (2012) estimated the quantity of C exported to the ocean from African tropical rivers (30∘ N–30∘ S) to be 0.3, 1 and 0.6 MgC km−2 yr−1 for the POC, DOC and DIC forms, respectively, but they did not partition these tropical rivers into humid or dry climates; our estimations of C export to the ocean were significantly higher for the tropical Nyong watershed in the humid climate region. This shows the importance to upscale C fluxes for the same climatic regions, such as the widely used Köppen–Geiger climate classification system (Koppen, 1936) recently updated by Peel et al. (2007), otherwise upscaling might be strongly biased. In the Nyong watershed, the ratio between the C exported to the ocean and the CO2 emitted to the atmosphere is 1:0.3, in agreement with the ratio of 1:0.2 measured by Borges et al. (2015b) in the Congo River but contrasting with the global ratio of 1:1 estimated by Ciais et al. (2013) during the Fifth Assessment Report of the Intergovernmental Panel on Climate Change (IPCC), showing that at least African rivers but probably all tropical rivers are strong emitters of CO2. Therefore, biogeochemical data in African rivers are urgently required to improve accuracy of regional and global CO2 emission estimates from inland waters and understand how they will respond to climate change (warming, change in hydrological cycle).
The integration of the different C fluxes was done by comparing them with the terrestrial C budget. In the Mengong catchment, the total hydrological export of C from land and wetland (FGW, FGW-bis, FWL) represents ∼ 3 %–5 % of the catchment net C sink (range 201–336 MgC yr−1) (Fig. 7). This low hydrological C export to the aquatic environment relative to the catchment net C sink agrees with two plot studies in temperate ecosystems, which have shown that the hydrological export of C from forest ecosystems is ∼ 3 % (Deirmendjian et al., 2018; Kindler et al., 2011). In the Nyong watershed, the yearly CO2 degassed (Fdegas) from the river network and the C hydrologically exported to the ocean (Focean) together represented ∼ 10 % of the net terrestrial C sink estimated by Brunet et al. (2009) (Table 7). Similarly, Duvert et al. (2020a) estimated that the C degassed to the atmosphere and hydrologically exported at the river outlet represented ∼ 7 % of the local net terrestrial C sink in the small (140 km2) tropical Howard catchment in Australia, ∼ 20 % if counting C losses via fire. In contrast, from a modelling approach in the entire Amazon watershed, Hastie et al. (2019) found that C degassed and hydrologically exported might represent 78 % of the net terrestrial C sink. This is in line with findings of Abril et al. (2014) and Borges and al. (2019), who respectively found that CO2 degassed from the Amazon and Congo watersheds was greater than the local net terrestrial C sink. In addition, Abril et al. (2014) attributed CO2 degassing from rivers to wetland C inputs as they showed that tropical wetland may hydrologically export 36 %–80 % of their gross primary production (GPP) while terrestrial landscapes hydrologically export a few percent of their net C sink, between 3 % for forests and 13 % from grasslands (Kindler et al., 2011). Altogether, this shows that in large watersheds such as the Amazon or Congo rivers, fluvial C losses could more significantly offset the local net terrestrial C sink compared to relatively small tropical watersheds such as the Nyong or Howard rivers, which is likely due to both more extensive wetland and greater hydrological fluxes in the Amazon and the Congo.
In a first-order catchment, we showed, by determining all the terms of the C mass balance independently, that attributing the whole amount of the CO2 emitted to the atmosphere and C exported to the stream outlet to a unique terrestrial source and ignoring the river–wetland connectivity might lead to the misrepresentation of C dynamics in small tropical catchments and thus likely at larger scales. Indeed, in addition to the drainage of non-flooded forest groundwater to the stream, we highlighted the drainage and erosion of wetland as an important C source for the stream. Non-flooded forest groundwater was a significant source of C for surface waters, particularly for CO2, whereas in contrast, DOC and POC in surface waters were mainly provided by the drainage and erosion of wetlands. The flush of C from wetland to first-order streams is seasonally enhanced during rainy seasons when the connectivity with surface waters is greater, allowing the leaching of fresh and young OM to the stream, and thus increasing heterotrophic respiration in the river downstream. Nonetheless, at the Nyong watershed scale, the CO2 emissions from the entire river network remained largely sustained by direct inputs of CO2 from land and wetland, as heterotrophic respiration in the river represents only ∼ 10 % of the CO2 degassing at the water–air interface. Moreover, at the Nyong watershed scale, we showed that the CO2 degassed from the entire river network, and C hydrologically exported to the ocean might offset ∼ 11 % of the net terrestrial C sink estimated from the watershed. This study supports the view that African rivers are strong emitters of CO2 to the atmosphere, mostly sustained by wetland inputs, and this must be better considered in global models.
The dataset of C and ancillary parameters is publicly available at https://doi.org/10.5281/ZENODO.5625039 (Moustapha et al., 2021).
The supplement related to this article is available online at: https://doi.org/10.5194/bg-19-137-2022-supplement.
MM participated in the validation, formal analysis, investigation, data curation, writing of the original draft and visualization. LD participated in conceptualization, methodology, validation, formal analysis, data curation, writing of the original draft and visualization. DS participated in conceptualization; validation; visualization; writing, review and editing of the paper; supervision; funding acquisition; and project administration. JJB acquired funding. SA participated in investigation; acquisition of resources; data curation; funding acquisition; and writing, review and editing of the paper. HAB, TA and CC participated in investigation, acquisition of resources and data curation. IA and BNN participated in supervision, funding acquisition and project administration. FG participated in conceptualization; methodology; validation; visualization; writing, review and editing of the paper; supervision; funding acquisition; and project administration.
The contact author has declared that neither they nor their co-authors have any competing interests.
Publisher's note: Copernicus Publications remains neutral with regard to jurisdictional claims in published maps and institutional affiliations.
We thank our colleagues from IRGM (Yaoundé, Cameroon) involved in M-TROPICS for their help in the field and in the laboratory. Moussa Moustapha was funded by the French embassy in Cameroon (Mobility Fellowship) and Loris Deirmendjian by IRD (post-doctoral fellowship). This research was supported by IRD and by Strategic planning “PSIP Seq2C” (Interdisciplinary and Partnership Structuring Program on Continental Carbon Sequestration). We warmly thank the two anonymous reviewers and Scott Winton together with the editors Tina Treude and Ji-Hyung Park for their constructive comments that greatly improved the paper.
The Nyong Watershed is included in the CZO Multiscale TROPIcal CatchmentS (M-TROPICS, https://mtropics.obs-mip.fr, last access: 8 December 2021), LMI PICASS-EAU (https://picass-eau.ird.fr, last access: 8 December 2021), LMI DYCOFAC (https://lab.ird.fr/collaboration/37/show, last access: 8 December 2021) and OZCAR (Critical Zone Observatories: Research and Application) funded by IRD (Research Institute for Development – Institut de Recherche sur le Développement) and INSU/CNRS.
This paper was edited by Tina Treude and reviewed by Scott Winton and two anonymous referees.
Åberg, J. and Wallin, B.: Evaluating a fast headspace method for measuring DIC and subsequent calculation of pCO2 in freshwater systems, Inl. Waters, 4, 157–166, https://doi.org/10.5268/IW-4.2.694, 2014.
Abril, G. and Borges, A. V.: Ideas and perspectives: Carbon leaks from flooded land: do we need to replumb the inland water active pipe?, Biogeosciences, 16, 769–784, https://doi.org/10.5194/bg-16-769-2019, 2019.
Abril, G., Martinez, J. M., Artigas, L. F., Moreira-Turcq, P., Benedetti, M. F., Vidal, L., Meziane, T., Kim, J. H., Bernardes, M. C., Savoye, N., Deborde, J., Souza, E. L., Albéric, P., Landim De Souza, M. F., and Roland, F.: Amazon River carbon dioxide outgassing fuelled by wetlands, Nature, 505, 395–398, https://doi.org/10.1038/nature12797, 2014.
Abril, G., Bouillon, S., Darchambeau, F., Teodoru, C. R., Marwick, T. R., Tamooh, F., Ochieng Omengo, F., Geeraert, N., Deirmendjian, L., Polsenaere, P., and Borges, A. V.: Technical Note: Large overestimation of pCO2 calculated from pH and alkalinity in acidic, organic-rich freshwaters, Biogeosciences, 12, 67–78, https://doi.org/10.5194/bg-12-67-2015, 2015.
Alin, S. R., Rasera, M. D. F. F. L., Salimon, C. I., Richey, J. E., Holtgrieve, G. W., Krusche, A. V., and Snidvongs, A.: Physical controls on carbon dioxide transfer velocity and flux in low-gradient river systems and implications for regional carbon budgets, J. Geophys. Res.-Biogeo., 116, G01009, https://doi.org/10.1029/2010JG001398, 2011.
Allen, G. H. and Pavelsky, T. M.: Global extent of rivers and streams, Science, 361, 585–588, https://doi.org/10.1126/science.aat0636, 2018.
Amiotte Suchet, P., Probst, J., and Ludwig, W.: Worldwide distribution of continental rock lithology: Implications for the atmospheric/soil CO2 uptake by continental weathering and alkalinity river transport to the oceans, Global Biogeochem. Cy., 17, 1038, https://doi.org/10.1029/2002GB001891, 2003.
Audry, S., Bessa, H. A., Bedimo, J.-P. B., Boeglin, J.-L., Boithias, L., Braun, J.-J., Dupré, B., Faucheux, M., Lagane, C., Maréchal, J.-C., Ndam-Ngoupayou, J. R., Nnomo, B. N., Nlozoa, J., Ntonga, J.-C., Ribolzi, O., Riotte, J., Rochelle-Newall, E., and Ruiz, L.: The Multiscale TROPIcal CatchmentS critical zone observatory M-TROPICS dataset I: The Nyong River Basin, Cameroon, Hydrol. Process., 35, e14138, https://doi.org/10.1002/HYP.14138, 2021.
Boeglin, J.-L., Ndam, J.-R., and Braun, J.-J.: Composition of the different reservoir waters in a tropical humid area: example of the Nsimi catchment (Southern Cameroon), J. African Earth Sci., 37, 103–110, 2003.
Boeglin, J., Probst, J., Ndam-Ngoupayou, J., Nyeck, B., Etcheber, H., Mortatti, J., and Braun, J.: Soil carbon stock and river carbon fluxes in humid tropical environments: the Nyong river basin (south Cameroon), in: Soil Erosion and Carbon Dynamics, Adv. Soil Sci., CRC Press Boca Raton, Fla., 275–288, 2005.
Bolan, N. S., Adriano, D. C., Kunhikrishnan, A., James, T., Mcdowell, R., and Senesi, N.: Dissolved Organic Matter, 1 Edn., Elsevier Inc., 1–75, https://doi.org/10.1016/B978-0-12-385531-2.00001-3, 2011.
Borges, A. V., Abril, G., Darchambeau, F., Teodoru, C. R., Deborde, J., Vidal, L. O., Lambert, T., and Bouillon, S.: Divergent biophysical controls of aquatic CO2 and CH4 in the World's two largest rivers, Sci. Rep., 5, 15614, https://doi.org/10.1038/srep15614, 2015a.
Borges, A. V, Darchambeau, F., Teodoru, C. R., Marwick, T. R., Tamooh, F., Geeraert, N., Omengo, F. O., Guérin, F., Lambert, T., Morana, C., Okuku, E., and Bouillon, S.: Globally significant greenhouse-gas emissions from African inland waters, Nat. Geosci., 8, 637–642, https://doi.org/10.1038/NGEO2486, 2015b.
Borges, A. V., Darchambeau, F., Lambert, T., Morana, C., Allen, G. H., Tambwe, E., Toengaho Sembaito, A., Mambo, T., Nlandu Wabakhangazi, J., Descy, J.-P., Teodoru, C. R., and Bouillon, S.: Variations in dissolved greenhouse gases (CO2, CH4, N2O) in the Congo River network overwhelmingly driven by fluvial-wetland connectivity, Biogeosciences, 16, 3801–3834, https://doi.org/10.5194/bg-16-3801-2019, 2019.
Braun, J.-J., Dupré, B., Viers, J., Ngoupayou, J. R. N., Bedimo, J.-P. B., Sigha-Nkamdjou, L., Freydier, R., Robain, H., Nyeck, B., and Bodin, J.: Biogeohydrodynamic in the forested humid tropical environment: the case study of the Nsimi small experimental watershed (south Cameroon), Bull. la Société géologique Fr., 173, 347–357, 2002.
Braun, J.-J., Ngoupayou, J. R. N., Viers, J., Dupre, B., Bedimo, J.-P. B., Boeglin, J.-L., Robain, H., Nyeck, B., Freydier, R., and Nkamdjou, L. S.: Present weathering rates in a humid tropical watershed: Nsimi, South Cameroon, Geochim. Cosmochim. Ac., 69, 357–387, 2005.
Braun, J.-J., Marechal, J.-C., Riotte, J., Boeglin, J.-L., Bedimo, J.-P. B., Ngoupayou, J. R. N., Nyeck, B., Robain, H., Sekhar, M., and Audry, S.: Elemental weathering fluxes and saprolite production rate in a Central African lateritic terrain (Nsimi, South Cameroon), Geochim. Cosmochim. Ac., 99, 243–270, 2012.
Brunet, F., Dubois, K., Veizer, J., Ndondo, G. R. N., Ngoupayou, J. R. N., Boeglin, J. L., and Probst, J. L.: Terrestrial and fluvial carbon fluxes in a tropical watershed: Nyong basin, Cameroon, Chem. Geol., 265, 563–572, https://doi.org/10.1016/j.chemgeo.2009.05.020, 2009.
Camino-Serrano, M., Gielen, B., Luyssaert, S., Ciais, P., Vicca, S., Guenet, B., Vos, B. De, Cools, N., Ahrens, B., Altaf Arain, M., Borken, W., Clarke, N., Clarkson, B., Cummins, T., Don, A., Pannatier, E. G., Laudon, H., Moore, T., Nieminen, T. M., Nilsson, M. B., Peichl, M., Schwendenmann, L., Siemens, J., and Janssens, I.: Linking variability in soil solution dissolved organic carbon to climate, soil type, and vegetation type, Global Biogeochem. Cy., 28, 497–509, https://doi.org/10.1002/2013GB004726, 2014.
Cardoso, S. J., Enrich-Prast, A., Pace, M. L., and Roland, F.: Do models of organic carbon mineralization extrapolate to warmer tropical sediments?, Limnol. Oceanogr., 59, 48–54, 2014.
Ciais, P., Sabine, C., Bala, G., Bopp, L., Brovkin, V., Canadell, J. G., Chhabra, A., Defries, R., Galloway, J., Heimann, M., Jones, C., Le Quéré, C., Myeni, R., Piao, S., and Thornton, P.: Carbon and Other Biogeochemical Cycles, Cambridge University Press, 465–570, 2013.
Cole, J. J. and Caraco, N. F.: Carbon in catchments: connecting terrestrial carbon losses with aquatic metabolism, 52, 101–110, 2001.
Cole, J. J., Prairie, Y. T., Caraco, N. F., Mcdowell, W. H., Tranvik, L. J., Striegl, R. G., Duarte, C. M., Kortelainen, P., Downing, J. A., Middelburg, J. J., and Melack, J.: Plumbing the Global Carbon Cycle: Integrating Inland Waters into the Terrestrial Carbon Budget, Ecosystems, 10, 172–185, https://doi.org/10.1007/s10021-006-9013-8, 2007.
Davidson, E. A., Verchot, L. V, Cattânio, J. H., Ackerman, I. L., and Carvalho, J. E. M.: Effects of soil water content on soil respiration in forests and cattle pastures of eastern Amazonia, Biogeochemistry, 48, 53–69, 2000.
Deirmendjian, L. and Abril, G.: Carbon dioxide degassing at the groundwater-stream-atmosphere interface: isotopic equilibration and hydrological mass balance in a sandy watershed, J. Hydrol., 558, 129–143, https://doi.org/10.1016/j.jhydrol.2018.01.003, 2018.
Deirmendjian, L., Loustau, D., Augusto, L., Lafont, S., Chipeaux, C., Poirier, D., and Abril, G.: Hydro-ecological controls on dissolved carbon dynamics in groundwater and export to streams in a temperate pine forest, Biogeosciences, 15, 669–691, https://doi.org/10.5194/bg-15-669-2018, 2018.
Deirmendjian, L., Anschutz, P., Morel, C., Mollier, A., Augusto, L., Loustau, D., Cotovicz, L. C., Buquet, D., Lajaunie, K., Chaillou, G., Voltz, B., Charbonnier, C., Poirier, D., and Abril, G.: Importance of the vegetation-groundwater-stream continuum to understand transformation of biogenic carbon in aquatic systems – A case study based on a pine-maize comparison in a lowland sandy watershed (Landes de Gascogne, SW France), Sci. Total Environ., 661, 613–629, https://doi.org/10.1016/j.scitotenv.2019.01.152, 2019.
Drake, T. W., Raymond, P. A., and Spencer, R. G. M.: Terrestrial carbon inputs to inland waters: A current synthesis of estimates and uncertainty, Limnol. Oceanogr. Lett., 3, 132–142, https://doi.org/10.1002/lol2.10055, 2018.
Duvert, C., Hutley, L. B., Beringer, J., Bird, M. I., Birkel, C., Maher, D. T., Northwood, M., Rudge, M., Setterfield, S. A., and Wynn, J. G.: Net landscape carbon balance of a tropical savanna: Relative importance of fire and aquatic export in offsetting terrestrial production, Glob. Chang. Biol., 26, 5899–5913, https://doi.org/10.1111/GCB.15287, 2020a.
Duvert, C., Hutley, L. B., Birkel, C., Rudge, M., Munksgaard, N. C., Wynn, J. G., Setterfield, S. A., Cendón, D. I., and Bird, M. I.: Seasonal shift from biogenic to geogenic fluvial carbon caused by changing water sources in the wet-dry tropics, J. Geophys. Res.-Biogeo., 125, e2019JG005384, https://doi.org/10.1029/2019JG005384, 2020b.
Engle, D. L., Melack, J. M., Doyle, R. D., and Fisher, T. R: High rates of net primary production and turnover of floating grasses on the Amazon floodplain: implications for aquatic respiration and regional CO2 flux, Glob. Chang. Biol., 14, 369–381, https://doi.org/10.1111/J.1365-2486.2007.01481.X, 2008.
Fang, W., Wei, Y., Liu, J., Kosson, D. S., Management, H., van der Sloot, H. A., and Zhang, P.: Effects of aerobic and anaerobic biological processes on leaching of heavy metals from soil amended with sewage sludge compost, Elsevier, 58, 324–334, 2016.
Friedlingstein, P., O'Sullivan, M., Jones, M. W., Andrew, R. M., Hauck, J., Olsen, A., Peters, G. P., Peters, W., Pongratz, J., Sitch, S., Le Quéré, C., Canadell, J. G., Ciais, P., Jackson, R. B., Alin, S., Aragão, L. E. O. C., Arneth, A., Arora, V., Bates, N. R., Becker, M., Benoit-Cattin, A., Bittig, H. C., Bopp, L., Bultan, S., Chandra, N., Chevallier, F., Chini, L. P., Evans, W., Florentie, L., Forster, P. M., Gasser, T., Gehlen, M., Gilfillan, D., Gkritzalis, T., Gregor, L., Gruber, N., Harris, I., Hartung, K., Haverd, V., Houghton, R. A., Ilyina, T., Jain, A. K., Joetzjer, E., Kadono, K., Kato, E., Kitidis, V., Korsbakken, J. I., Landschützer, P., Lefèvre, N., Lenton, A., Lienert, S., Liu, Z., Lombardozzi, D., Marland, G., Metzl, N., Munro, D. R., Nabel, J. E. M. S., Nakaoka, S.-I., Niwa, Y., O'Brien, K., Ono, T., Palmer, P. I., Pierrot, D., Poulter, B., Resplandy, L., Robertson, E., Rödenbeck, C., Schwinger, J., Séférian, R., Skjelvan, I., Smith, A. J. P., Sutton, A. J., Tanhua, T., Tans, P. P., Tian, H., Tilbrook, B., van der Werf, G., Vuichard, N., Walker, A. P., Wanninkhof, R., Watson, A. J., Willis, D., Wiltshire, A. J., Yuan, W., Yue, X., and Zaehle, S.: Global Carbon Budget 2020, Earth Syst. Sci. Data, 12, 3269–3340, https://doi.org/10.5194/essd-12-3269-2020, 2020.
Gaillardet, J., Braud, I., Hankard, F., Anquetin, S., Bour, O., Dorfliger, N., de Dreuzy, J. R., Galle, S., Galy, C., Gogo, S., Gourcy, L., Habets, F., Laggoun, F., Longuevergne, L., Le Borgne, T., Naaim-Bouvet, F., Nord, G., Simonneaux, V., Six, D., Tallec, T., Valentin, C., Abril, G., Allemand, P., Arènes, A., Arfib, B., Arnaud, L., Arnaud, N., Arnaud, P., Audry, S., Comte, V. B., Batiot, C., Battais, A., Bellot, H., Bernard, E., Bertrand, C., Bessière, H., Binet, S., Bodin, J., Bodin, X., Boithias, L., Bouchez, J., Boudevillain, B., Moussa, I. B., Branger, F., Braun, J. J., Brunet, P., Caceres, B., Calmels, D., Cappelaere, B., Celle-Jeanton, H., Chabaux, F., Chalikakis, K., Champollion, C., Copard, Y., Cotel, C., Davy, P., Deline, P., Delrieu, G., Demarty, J., Dessert, C., Dumont, M., Emblanch, C., Ezzahar, J., Estèves, M., Favier, V., Faucheux, M., Filizola, N., Flammarion, P., Floury, P., Fovet, O., Fournier, M., Francez, A. J., Gandois, L., Gascuel, C., Gayer, E., Genthon, C., Gérard, M. F., Gilbert, D., Gouttevin, I., Grippa, M., Gruau, G., Jardani, A., Jeanneau, L., Join, J. L., Jourde, H., Karbou, F., Labat, D., Lagadeuc, Y., Lajeunesse, E., Lastennet, R., Lavado, W., Lawin, E., Lebel, T., Le Bouteiller, C., Legout, C., Lejeune, Y., Le Meur, E., Le Moigne, N., Lions, J., et al.: OZCAR: The French Network of Critical Zone Observatories, Vadose Zo. J., 17, 180067, https://doi.org/10.2136/VZJ2018.04.0067, 2018.
Geeraert, N., Omengo, F. O., Borges, A. V., Govers, G., and Bouillon, S.: Shifts in the carbon dynamics in a tropical lowland river system (Tana River, Kenya) during flooded and non-flooded conditions, Biogeochemistry, 132, 141–163, https://doi.org/10.1007/s10533-017-0292-2, 2017.
Gómez-Gener, L., Rocher-Ros, G., Battin, T., Cohen, M. J., Dalmagro, H. J., Dinsmore, K. J., Drake, T. W., Duvert, C., Enrich-Prast, A., Horgby, Å., Johnson, M. S., Kirk, L., Machado-Silva, F., Marzolf, N. S., McDowell, M. J., McDowell, W. H., Miettinen, H., Ojala, A. K., Peter, H., Pumpanen, J., Ran, L., Riveros-Iregui, D. A., Santos, I. R., Six, J., Stanley, E. H., Wallin, M. B., White, S. A., and Sponseller, R. A.: Global carbon dioxide efflux from rivers enhanced by high nocturnal emissions, Nat. Geosci., 14, 289–294, https://doi.org/10.1038/S41561-021-00722-3, 2021.
Gran, G.: Determination of the equivalence point in potentiometric titrations, Part II, Analyst, 77, 661–671, 1952.
Gumbricht, T., Román-Cuesta, R. M., Verchot, L. V., Herold, M., Wittmann, F., Householder, E., Herold, N., and Murdiyarso, D.: Tropical and Subtropical Wetlands Distribution version 2, https://doi.org/10.17528/CIFOR/DATA.00058, 2017.
Haase, K. and Rätsch, G.: The morphology and anatomy of tree roots and their aeration strategies, in Amazonian Floodplain Forests, Springer, 141–161, 2010.
Hagedorn, F., Bruderhofer, N., Ferrari, A., and Niklaus, P. A.: Tracking litter-derived dissolved organic matter along a soil chronosequence using 14C imaging: Biodegradation, physico-chemical retention or preferential flow?, Soil Biol. Biochem., 88, 333–343, https://doi.org/10.1016/J.SOILBIO.2015.06.014, 2015.
Hall, R. O., Tank, J. L., Baker, M. A. et al.: Metabolism, Gas Exchange, and Carbon Spiraling in Rivers. Ecosystems 19, 73–86, https://doi.org/10.1007/s10021-015-9918-1, 2016.
Hastie, A., Lauerwald, R., Ciais, P., and Regnier, P.: Aquatic carbon fluxes dampen the overall variation of net ecosystem productivity in the Amazon basin: An analysis of the interannual variability in the boundless, Wiley Online Libr., 25, 2094–2111, https://doi.org/10.1111/gcb.14620, 2019.
Holgerson, M. A. and Raymond, P. A.: Large contribution to inland water CO2 and CH4 emissions from very small ponds, 9, 222–226, https://doi.org/10.1038/NGEO2654, 2016.
Hotchkiss, E. R., Hall Jr, R. O., Sponseller, R. A., Butman, D., Klaminder, J., Laudon, H., Rosvall, M., and Information, S.: Sources of and processes controlling CO2 emissions change with the size of streams and rivers, Nat. Geosci., 8, 696–699, https://doi.org/10.1038/NGEO2507, 2015.
Huang, T., Fu, Y., Pan, P. and Chen, C.: Fluvial carbon fluxes in tropical rivers, Curr. Opin. Environ. Sustain., 4, 162–169, 2012.
Huang, Y., Evaristo, J., and Li, Z.: Multiple tracers reveal different groundwater recharge mechanisms in deep loess deposits, Elsevier, 353, 204–212, 2019.
Johnson, M. S., Lehmann, Æ. J., Couto, E., Filho, J., and Riha, S.: DOC and DIC in flowpaths of Amazonian headwater catchments with hydrologically contrasting soils, Biogeochemistry, 81, 45–57, https://doi.org/10.1007/s10533-006-9029-3, 2006.
Johnson, M. S., Lehmann, J., Riha, S. J., Krusche, A. V., Richey, J. E., Ometto, J. P. H. B., and Couto, E. G.: CO2 efflux from Amazonian headwater streams represents a significant fate for deep soil respiration, Geophys. Res. Lett., 35, https://doi.org/10.1029/2008GL034619, 2008.
Jones, M. B. and Humphries, S. W.: Impacts of the C4 sedge Cyperus papyrus L. on carbon and water fluxes in an African wetland, 107–113, 2002.
Junk, W., Bayley, P., and Sparks, R.: The flood pulse concept in river-floodplain system.pdf, Can. Spec. Publ. Fish. Aquat. Sci., 106, 110–127, 1989.
Kaiser, K., Guggenberger, G., and Zech, W.: Sorption of DOM and DOM fractions to forest soils, Geoderma, 74, 281–303, https://doi.org/10.1016/S0016-7061(96)00071-7, 1996.
Kalbitz, K. and Kaiser, K.: Contribution of dissolved organic matter to carbon storage in forest mineral soils, J. Plant Nutr. Soil Sci., 171, 52–60, https://doi.org/10.1002/JPLN.200700043, 2008.
Kalbitz, K., Solinger, S., Park, J., Michalzik, B., and Matzner, E.: Controls on the dynamics of dissolved organic matter in soils: a review, Soil Sci., 165, 277–304, 2000.
Kalbitz, K., Schwesig, D., Rethemeyer, J., and Matzner, E.: Stabilization of dissolved organic matter by sorption to the mineral soil, Soil Biol. Biochem., 37, 1319–1331, https://doi.org/10.1016/J.SOILBIO.2004.11.028, 2005.
Kindler, R., Siemens, J., Kaiser, K., Walmsley, D. C., Bernhofer, C., Buchmann, N., Cellier, P., Eugster, W., Gleixner, G., Grunwald, T., Heim, A., Ibrom, A., Jones, S. K., Jones, M., Klumpp, K., Kutsch, W., Larsen, K. S., Lehuger, S., Loubet, B., Mckenzie, R., Moors, E., Osborne, B., Pilegaard, K., Rebmann, C., Saunders, M., Schmidt, M. W. I., Schrumpf, M., Seyfferth, J., Skiba, U., Soussana, J. F., Sutton, M. A., Tefs, C., Vowinckel, B., Zeeman, M. J., and Kaupenjohann, M.: Dissolved carbon leaching from soil is a crucial component of the net ecosystem carbon balance, Wiley Online Libr., 17, 1167–1185, https://doi.org/10.1111/j.1365-2486.2010.02282.x, 2011.
Köppen, W.: Das geographisca System der Klimate, in: Handbuchder Klimatologie, edited by: Köppen, B. W. and Geiger, G., C.Gebr, Borntraeger, 1–44, 1936.
Kothawala, D. N., Moore, T. R., and Hendershot, W. H.: Soil Properties Controlling the Adsorption of Dissolved Organic Carbon to Mineral Soils, Soil Sci. Soc. Am. J., 73, 1831–1842, https://doi.org/10.2136/SSSAJ2008.0254, 2009.
Lambert, T., Teodoru, C. R., Nyoni, F. C., Bouillon, S., Darchambeau, F., Massicotte, P., and Borges, A. V.: Along-stream transport and transformation of dissolved organic matter in a large tropical river, Biogeosciences, 13, 2727–2741, https://doi.org/10.5194/bg-13-2727-2016, 2016a.
Lambert, T., Bouillon, S., Darchambeau, F., Massicotte, P., and Borges, A. V.: Shift in the chemical composition of dissolved organic matter in the Congo River network, Biogeosciences, 13, 5405–5420, https://doi.org/10.5194/bg-13-5405-2016, 2016b.
Lauerwald, R., Laruelle, G. G., Hartmann, J., Ciais, P., and Regnier, P. A. G.: Spatial patterns in CO2 evasion from the global river network, Global Biogeochem. Cy., 29, 534–554, https://doi.org/10.1002/2014GB004941, 2015.
Lehner, B., Verdin, K., Jarvis, A., and Systems, E.: New global hydrography derived from spaceborne elevation data, Eos, Trans. Am. Geophys. Union, 89, 93–94, 2008.
Lewis, E. and Wallace Upton, N.: Program developed for CO2 calculations, https://doi.org/10.2172/639712, 1998.
Ludwig, W., Probst, J., and Kempe, S.: Predicting the oceanic input of organic carbon by continental erosion, Global Biogeochem. Cy., 10, 23–41, 1996.
Malard, F. and Hervant, F.: Oxygen supply and the adaptations of animals in groundwater, Freshw. Biol., 41, 1–30, https://doi.org/10.1046/J.1365-2427.1999.00379.X, 1999.
Maréchal, J., Braun, J., Riotte, J., Bedimo, J. B., and Boeglin, J.: Hydrological processes of a rainforest headwater swamp from natural chemical tracing in Nsimi watershed, Cameroon, Hydrol. Process., 25, 2246–2260, 2011.
Mayorga, E., Aufdenkampe, A. K., Masiello, C. A., Krusche, A. V, Hedges, J. I., Quay, P. D., Richey, J. E., and Brown, T. A.: Young organic matter as a source of carbon dioxide outgassing from Amazonian rivers, Nature, 436, 538–541, https://doi.org/10.1038/nature03880, 2005.
Meybeck, M.: Carbon, nitrogen, and phosphorus transport by world rivers, Am. J. Sci., 282, 401–450, 1982.
Meybeck, M.: Global chemical weathering of surficial rocks estimated from river dissolved loads, Am. J. Sci., 287, 401–428, https://doi.org/10.2475/ajs.287.5.401, 1987.
Meybeck, M.: Riverine transport of atmospheric carbon: Sources, global typology and budget, Water, Air Soil Pollut., 70, 443–463, https://doi.org/10.1007/BF01105015, 1993.
Millero, F. J.: The thermodynamics of the carbonate system in seawater, Geochem. Cosmochem. Ac., 43, 1651–1661, 1979.
Mitsch, W. J., Zhang, L., Stefanik, K. C., Nahlik, A. M., Anderson, C. J., Bernal, B., Hernandez, M., and Song, K.: Creating Wetlands: Primary Succession, Water Quality Changes, and Self-Design over 15 Years, Bioscience, 62, 237–250, https://doi.org/10.1525/BIO.2012.62.3.5, 2012.
Moore, T. R.: Dissolved organic carbon in a northern boreal landscape, Global Biogeochem. Cy., 17, 1109, https://doi.org/10.1029/2003GB002050, 2003.
Moreira-Turcq, P., Bonnet, M. P., Amorim, M., Bernardes, M., Lagane, C., Maurice, L., Perez, M., and Seyler, P.: Seasonal variability in concentration, composition, age, and fluxes of particulate organic carbon exchanged between the floodplain and Amazon River, Global Biogeochem. Cy., 27, 119–130, https://doi.org/10.1002/gbc.20022, 2013.
Moustapha, M., Deirmendjian, L., Sebag, D., Braun, J.-J., Ateba Bessa, H., Adatte, T., Causserand, C., Adamou, I., Ngounou Ngatcha, B., and Guérin, F.: Data-base for: “Partitioning carbon sources between wetland and well-drained ecosystems to a tropical first-order stream – Implications to carbon cycling at the watershed scale (Nyong, Cameroon)”, Zenodo [data set], https://doi.org/10.5281/ZENODO.5625039, 2021.
Neff, J. and Asner, G.: Dissolved organic carbon in terrestrial ecosystems: synthesis and a model, Springer, 4, 29–48, https://doi.org/10.1007/s100210000058, 2001.
Nepstad, D. C., Carvalhot, C. R., Davidson, E. A., Jlpp, P. H., Lefebvre, P. A., Negrelros, G. H., Sllvat, E. D., Stone, T. A., and Trumbore, S. E.: and Pastures, Nature, 372, 666–669, 1994.
Nkoue-ndondo, G.-R.: Le cycle du carbone en domaine tropical humide: exemple du bassin versant forestier du Nyong au sud Cameroun, Université de Toulouse, Université Toulouse III-Paul Sabatier, 278 pp., 2008.
Nkoue Ndondo, G. R., Probst, J.-L. L., Ndjama, J., Ndam Ngoupayou, J. R., Boeglin, J.-L. L., Takem, G. E., Brunet, F., Mortatti, J., Gauthier-Lafaye, F., Braun, J.-J. J., Ekodeck, G. E., Nkoue-ndondo, G.-R., Probst, J.-L. L., Ndjama, J., Ngoupayou, J. R. N., Boeglin, J.-L. L., Takem, G. E., Brunet, F., Mortatti, J., Gauthier-Lafaye, F., and Braun, J.-J. J.: Stable Carbon Isotopes δ 13 C as a Proxy for Characterizing Carbon Sources and Processes in a Small Tropical Headwater Catchment: Nsimi, Cameroon, Aquat. Geochem., 27, 1–30, https://doi.org/10.1007/s10498-020-09386-8, 2020.
Nyeck, B., Bilong, P., Monkam, A., and Belinga, S. M. E.: Mise au point d'un modèle de cartographie et de classification des sols en zone forestières intertropicale au Cameroun, Cas du plateau forestier humide de Zoétélé, Géocam2, Press Uni. Yaoundé, 171–180, 1999.
Oliva, P., Viers, J., Dupré, B., Fortuné, J., Martin, F., Braun, J., Nahon, D., and Robain, H.: The effect of organic matter on chemical weathering: Study of a small tropical watershed: Nsimi-Zoetele site, Cameroon, Geochim. Cosmochim. Ac., 63, 4013–4055, 1999.
Olivry, J.: Fleuves et rivières du Cameroun, edited by ORSTOM, Paris, 733 pp., 1986.
Peel, M. C., Finlayson, B. L., and McMahon, T. A.: Updated world map of the Köppen-Geiger climate classification, Hydrol. Earth Syst. Sci., 11, 1633–1644, https://doi.org/10.5194/hess-11-1633-2007, 2007.
Piedade, M. T. F., Ferreira, C. S., de Oliveira Wittmann, A., Buckeridge, M., and Parolin, P.: Biochemistry of Amazonian floodplain trees, in: Amazonian floodplain forests, Springer, 127–139, 2010.
Raymond, P. A., Zappa, C. J., Butman, D., Bott, T. L., Potter, J., Mulholland, P., Laursen, A. E., Mcdowell, W. H., and Newbold, D.: Scaling the gas transfer velocity and hydraulic geometry in streams and small rivers, Limnol. Oceanogr. Fluids Environ., 2, 41–53, https://doi.org/10.1215/21573689-1597669, 2012.
Raymond, P. A., Hartmann, J., Lauerwald, R., Sobek, S., McDonald, C., Hoover, M., Butman, D., Striegl, R., Mayorga, E., Humborg, C., Kortelainen, P., Dürr, H., Meybeck, M., Ciais, P., and Guth, P.: Global carbon dioxide emissions from inland waters, Nature, 503, 355–359, https://doi.org/10.1038/nature12760, 2013.
Richey, J. E., Melack, J. M., Aufdenkampe, A. K., Ballester, V. M., and Hess, L. L.: Outgassing from Amazonian rivers and wetlands as a large tropical source of atmospheric CO2, 416, 617–620, 2002.
Sabater, S., Armengol, J., Comas, E., Sabater, F., Urrizalqui, I., and Urrutia, I.: Algal biomass in a disturbed Atlantic river: water quality relationships and environmental implications, Sci. Total Environ., 263, 185–195, https://doi.org/10.1016/S0048-9697(00)00702-6, 2000.
Sanderman, J. and Amundson, R.: A comparative study of dissolved organic carbon transport and stabilization in California forest and grassland soils, Biogeochemistry, 89, 309–327, https://doi.org/10.1007/S10533-008-9221-8, 2008.
Sanders, I. A., Cotton, J., Hildrew, A. G., and Trimmer, M.: Emission of Methane from Chalk Streams Has Potential Implications for Agricultural Practices, Freshw. Biol., 52, 1176–1186, https://doi.org/10.1111/j.1365-2427.2007.01745.x, 2007.
Sauer, D., Sommer, M., Jahn, R., Sauer, D., Sponagel, H., Sommer, M., Giani, L., Jahn, R., and Stahr, K.: Podzol: Soil of the Year 2007, A review on its genesis, occurrence, and functions A review on its genesis, occurrence, and functions, J. Plant Nutr. Soil Sci., 170, 581–597, https://doi.org/10.1002/jpln.200700135, 2007.
Saunders, M. J., Jones, M. B., and Kansiime, F.: Carbon and water cycles in tropical papyrus wetlands, Wetl. Ecol. Manag., 15, 489–498, https://doi.org/10.1007/s11273-007-9051-9, 2007.
Sawakuchi, H. O., Neu, V., Ward, N. D., Barros, M. D. L. C., Valerio, A. M., Gagne-Maynard, W., Cunha, A. C., Less, D. F. S. S., Diniz, J. E. M., Brito, D. C., Krusche, A. V., and Richey, J. E.: Carbon dioxide emissions along the lower Amazon River, Front. Mar. Sci., 4, 1–12, https://doi.org/10.3389/fmars.2017.00076, 2017.
Schewendenmann, L. and Veldkamp, E.: Long-term CO2 production from deeply weathered soils of a tropical rain forest: Evidence for a potential positive feedback to climate warming, Glob. Chang. Biol., 12, 1878–1893, https://doi.org/10.1111/j.1365-2486.2006.01235.x, 2006.
Shen, Y., Chapelle, F. H., Strom, E. W., and Benner, R.: Origins and bioavailability of dissolved organic matter in groundwater, Biogeochemistry, 122, 61–78, https://doi.org/10.1007/s10533-014-0029-4, 2015.
Silva, T. S. F., Melack, J. M., and Novo, E. M. L. M.: Responses of aquatic macrophyte cover and productivity to flooding variability on the Amazon floodplain, Glob. Chang. Biol., 19, 3379–3389, https://doi.org/10.1111/GCB.12308, 2013.
Strahler, A. N.: Mtm Quantitative Analysis of Watershed Geomorphology, Trans. Am. Geophys. Union, 38, 913–920, 1957.
Suchel, J.-B.: Les climats du Cameroun, Université de Bordeaux III, France, 1186 pp., 1987.
Tamooh, F., Van den Meersche, K., Meysman, F., Marwick, T. R., Borges, A. V., Merckx, R., Dehairs, F., Schmidt, S., Nyunja, J., and Bouillon, S.: Distribution and origin of suspended matter and organic carbon pools in the Tana River Basin, Kenya, Biogeosciences, 9, 2905–2920, https://doi.org/10.5194/bg-9-2905-2012, 2012.
Tamooh, F., Meysman, F. J. R., Borges, A. V, Marwick, T. R., Van, K., Meersche, D., Dehairs, F., Merckx, R., and Bouillon, S.: Sediment and carbon fluxes along a longitudinal gradient in the lower Tana River (Kenya), J. Geophys. Res.-Biogeo., 119, 1340–1353, https://doi.org/10.1002/2013JG002358, 2014.
Tsypin, M. and Macpherson, G. L.: The effect of precipitation events on inorganic carbon in soil and shallow groundwater, Konza Prairie LTER Site, NE Kansas, USA, Appl. Geochem., 27, 2356–2369, 2012.
Viers, J., Dupré, B., Polvé, M., Schott, J., Dandurand, J. L., and Braun, J. J.: Chemical weathering in the drainage basin of a tropical watershed (Nsimi-Zoetele site, Cameroon): comparison between organic-poor and organic-rich waters, Chem. Geol., 140, 181–206, https://doi.org/10.1016/S0009-2541(97)00048-X, 1997.
Viers, J., Dupré, B., Braun, J. J., Deberdt, S., Angeletti, B., Ngoupayou, J. N., and Michard, A.: Major and trace element abundances, and strontium isotopes in the Nyong basin rivers (Cameroon): constraints on chemical weathering processes and elements transport mechanisms in humid tropical environments, Chem. Geol., 169, 211–241, https://doi.org/10.1016/S0009-2541(00)00298-9, 2000.
Weiss, R. F.: Carbon dioxide in water and seawater: the solubility of a non-ideal gas, Mar. Chem., 2, 203–215, https://doi.org/10.1016/0304-4203(74)90015-2, 1974.
White, A. F. and Blum, A. E.: Effects of climate on chemical_weathering in watersheds, Geochim. Cosmochim. Ac., 59, 1729–1747, 1995.