the Creative Commons Attribution 4.0 License.
the Creative Commons Attribution 4.0 License.
 | 17 Mar 2022
Land Management Contributes significantly to observed Vegetation Browning in Syria during 2001–2018
Tiexi Chen
Renjie Guo
Qingyun Yan
Xin Chen
Shengjie Zhou
Chuanzhuang Liang
Xueqiong Wei
Han Dolman
Climate change and human activities have significant impacts on terrestrial vegetation. Syria is a typical arid region with a water-limited ecosystem and has experienced severe social unrest over the last decades. In this study, changes in vegetation and potential drivers in Syria are investigated. By using an enhanced vegetation index (EVI), a general browning trend is found in Syria during 2001–2018, with the EVI decreasing at a rate of −0.8 × 10⁻³ yr−1 (p<0.1). The decrease of the EVI is mainly found in the north region, whereas the west region still maintains an increasing trend. The residual analysis indicates that besides precipitation, human activities also contribute significantly to the EVI decrease, which is confirmed by the decrease in rainfall use efficiency. Moreover, a paired land-use experiment (PLUE) analysis is carried out in the Khabur River basin where croplands are widely distributed in adjacent regions of Syria and Turkey. The time series of the EVIs over these two regions are highly correlated (r=0.8027, p<0.001), indicating that both regions are affected by similar climate forcing. However, vegetation in Syria and Turkey illustrates contrary browning (−3 × 10⁻³ yr−1, p<0.01) and greening trends (4.5 × 10⁻³ yr−1, p<0.01), respectively. Relevant reports have noted that social unrest induced insufficient irrigation and lack of seeds, fertilizers, pesticides and field management. Therefore, we concluded that the decline in vegetation in the north Syria is driven by the change of land management.
- Article
(2856 KB) - Full-text XML
-
Supplement
(44 KB) - BibTeX
- EndNote


Vegetation is a key component of the Earth system and plays an important role in the water and energy cycle. It also comprises one of the basic natural requirements for human survival. Therefore, the variations, driving mechanisms and impacts of vegetation have been widely studied (Li et al., 2018; Piao et al., 2020; Zhu et al., 2016). Globally, observations have shown a general greening trend, although browning, i.e. loss of vegetation activity, have occurred in some regions (Jong et al., 2012; Zhang et al., 2017). Here, the greening (browning) usually refers to changes in vegetation conditions indicated by the positive (negative) long-term trend in the vegetation index (Piao et al., 2020).
Recent advances in remote sensing technology and the establishment of long-term vegetation indexes have greatly facilitated research on long-term monitoring of large-scale vegetation. Indexes such as the normalized difference vegetation index (NDVI) developed by the Global Inventory Monitoring and Modeling Studies (GIMMS), the enhanced vegetation index (EVI) product based on the Moderate Resolution Imaging Spectroradiometer (MODIS) and the leaf area index (LAI) derived from remote sensing data are widely used in the study of long-term vegetation changes (Forzieri et al., 2017; Ju and Masek, 2016). The main climatic factors restricting vegetation include temperature, precipitation, radiation and the fertilization effect of CO2 (Chen et al., 2020; Keenan and Riley, 2018; Schimel et al., 2015). At the global scale, the long-term trends of these driving factors manifest themselves as warming and increasing atmospheric CO2 concentration. Model results show that the CO2 fertilization effect contributes to over half of global-scale greening (Zhu et al., 2016). However, the vegetation index derived from remote sensing data shows that the proportion of global cropland greening is relatively high, which is different from model simulations of the CO2 fertilization effect. At the same time, agricultural modernization is also considered to have a great impact on vegetation growth (Chen et al., 2019).
At present, the influences of climate change on vegetation have been widely simulated by models, but the model performance regarding the variation of land-use types is relatively poor, and land management practices are not well represented (Pongratz et al., 2014; Prestele et al., 2017). There are two main reasons for these disadvantages. Firstly, land management data are not complete. Land management involves many aspects, including ecological engineering and economic management of natural vegetation, as well as the seed-selection, irrigation, fertilization and pesticides for croplands. This results in the lack of high-quality datasets with spatiotemporal continuity for land management. Secondly, it is more difficult to quantify the characteristics of various types of land management. Therefore, a common practice in previous studies has been to make a general distinction between natural and human drivers. As a result, it is rather difficult to study specific management processes in depth (d'Amour et al., 2017; Erb et al., 2017; Meyfroidt et al., 2013).
Social unrest is still a global problem, which is bound to affect regional development and land management activities. However, social unrest has been rarely mentioned in the study of land use and management. Based on Armed Conflict Location and Event Data Project (ACLED) records (Raleigh et al., 2010), in the past 20 years, about 20 countries have experienced more than 1000 battles. Several countries have been involved in national wars, such as (but not limited to) Syria, Libya, Afghanistan, Iraq and Yemen. The affected population and land area are at least in the order of 100 million and tens of millions of square kilometers, respectively.
From a land management perspective, Syria deserves great concern. Syria is a typical arid area, the social unrest in Syria is bound to lead to a series of changes in land management, especially the serious destruction to agricultural input caused by the war, which caused a severe food security problem (Li et al., 2022). So far, there have been relatively few studies on land management changes triggered by social unrest. A typical case in the past is the problem of cropland abandonment in eastern Europe caused by the collapse of the Soviet Union (Alcantara et al., 2013; Schierhorn et al., 2013). Therefore, it is necessary for Syria to carefully study the impact and mechanism of climate and human activities on vegetation changes. This is also the main research objective of this paper. Specifically, in this paper the basic characteristics of vegetation change in Syria are investigated. Furthermore, the impact of land management on vegetation changes is analyzed in multiple ways, so as to verify the hypothesis that social unrest will significantly affect vegetation. Although this mechanism is intuitively obvious, it is not easy to obtain effective and definite quantified conclusions. The remainder of this paper is organized as follows. Section 2 summarizes data and methods. Detailed results are presented in Sect. 3. Discussions and conclusions are presented in Sect. 4 and Sect. 5, respectively.
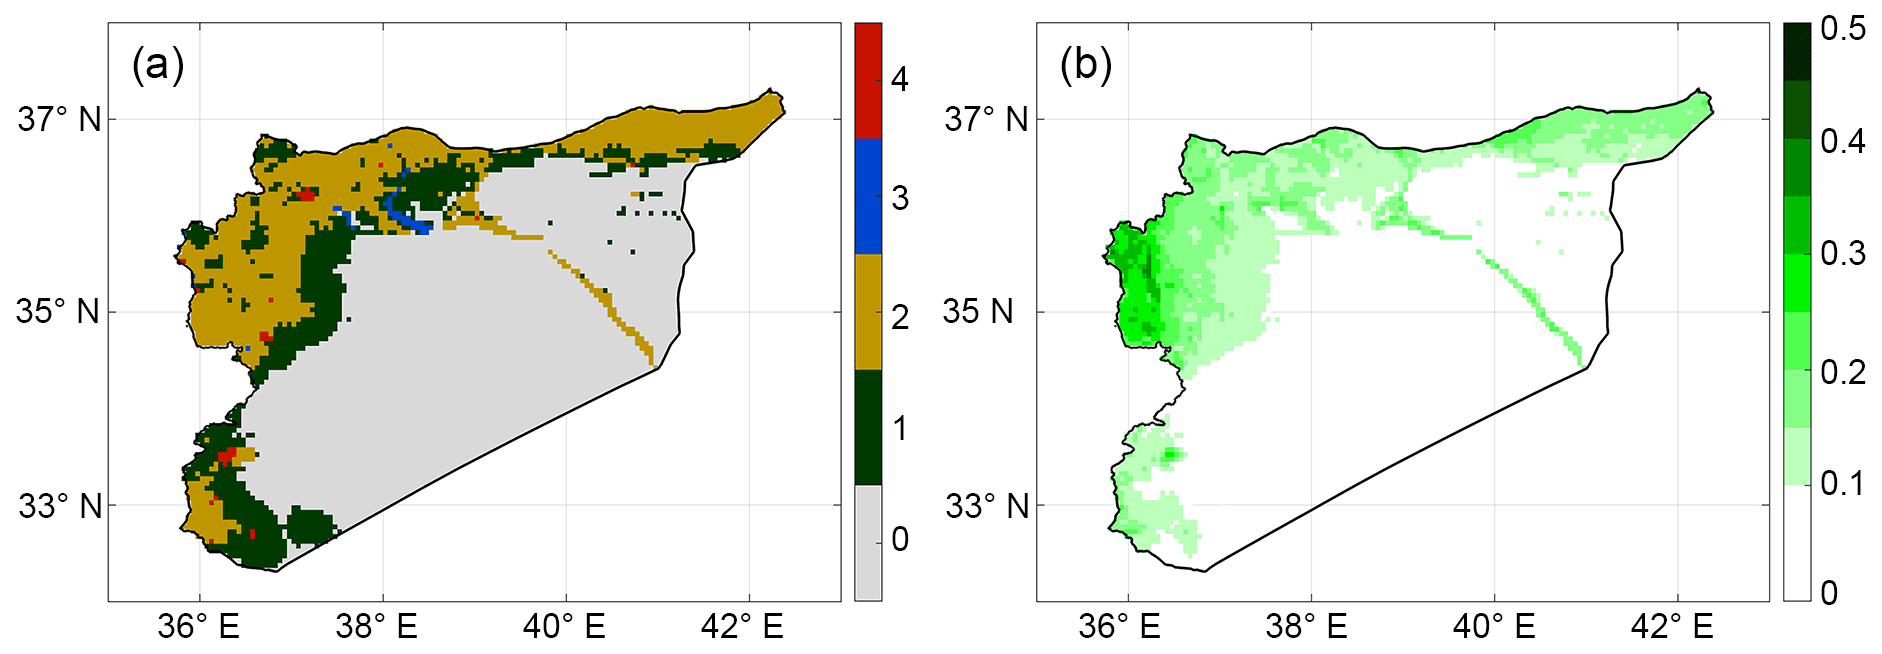
Figure 1Land cover and vegetation conditions in Syria. (a) Land cover types based on the MCD12C1 data of 2010. Color codes 1–4 indicate the natural vegetation, croplands, water bodies and built-up lands, respectively. 0 represents the unused land, which is colored in gray. (b) The spatial distribution of annual EVI in Syria.
2.1 Study area
Syria (Fig. 1) is located in western Asia, on the east bank of the Mediterranean Sea, bordering Turkey in the north, Iraq in the east, Jordan in the south and Lebanon and Palestine in the southwest. Syria has a dry climate, and precipitation is mainly concentrated in the winter half-year (November to the next April). The Mediterranean climate in its coastal and northern parts leads to hot, dry summers but mild, rainy winters. In contrast, the southern region of Syria belongs to tropical desert climate with high temperature and drought throughout the whole year with less precipitation. The main vegetation types in Syria are cropland and grassland, which are primarily distributed in the northern and western coastal areas. The main crop grown in Syria is wheat (Mohammed et al., 2020). Deserts are widely distributed in Syria with sparse vegetation; therefore, only vegetated land with cropland and natural vegetation are selected as the study area (land cover type 1 and 2 in Fig. 1a).
2.2 Land cover type data
In this paper, the land-use and land cover dataset of MCD12C1 product in 2010 from MODIS is used, with spatial and temporal resolutions of 0.05∘ × 0.05∘ and 1 year, respectively. This dataset has three different classification schemes. In this study, the IGBP scheme is selected and the data is re-grouped into five categories as shown in Fig. 1a. The natural vegetation includes evergreen needleleaf forests, evergreen broadleaf forests, deciduous needleleaf forests, deciduous broadleaf forests, mixed forests, open shrublands, woody savannas, savannas and grasslands. The second category is cropland and includes croplands and the mosaics of croplands and natural vegetation. The third category is water, which contains permanent wetlands and water bodies. Built-up lands remain consistent with the original classification. The rest is classified as the fifth category, unused land, including barren and non-vegetated lands.
2.3 Vegetation index
Optical vegetation indexes are widely used to study the vegetation state. In this paper, the EVI based on MODIS, which can be calculated according to Eq. (1), is selected to characterize the vegetation. Compared with the NDVI, the EVI includes information on the blue band, which can solve the saturation problem of NDVI in densely vegetated areas to a certain extent. The MOD13C2 product is selected, with its spatial resolution (0.05∘ × 0.05∘) consistent with that of the land-use data. The time period of 2001–2018 is selected for the EVI calculation. In October 2018, unusually heavy rain hit Syria and other Middle East regions and caused flooding, which also led to a very high EVI in the following year of 2019. Meanwhile, the heavy rainfall also contributed to the desert locust crisis in 2020 (Salih et al., 2020). Because the abnormal value in 2019 greatly interferes with the trend analysis, it is excluded in this paper. EVI can be calculated as follows:
where ρNIR, ρred, ρblue are the reflectance of the near-infrared, red and blue bands, respectively; G (=2.5) is the gain factor; C1 (=6), C2 (=7.5) and L (=1) are adopted coefficients, respectively.
2.4 Climatic factors
The main climatic factors affecting vegetation changes are radiation, precipitation and temperature. Due to the high temperature and drought in Syria, moisture content is the main restrictive factor. At the same time, temperature has a huge impact on soil water loss through evaporation. Therefore, precipitation and temperature are selected as environmental factors. The CRU TS4.03 (Brown et al., 2020) dataset with the temporal resolution of 1 month and spatial resolution of 0.5∘ × 0.5∘ is adopted in this paper. Comparatively, the spatial resolutions of temperature and precipitation are much lower than that of vegetation. Due to spatial consistencies of temperature and precipitation over small regions, it is assumed that the vegetation within the 0.5∘ interval has the same environmental condition.
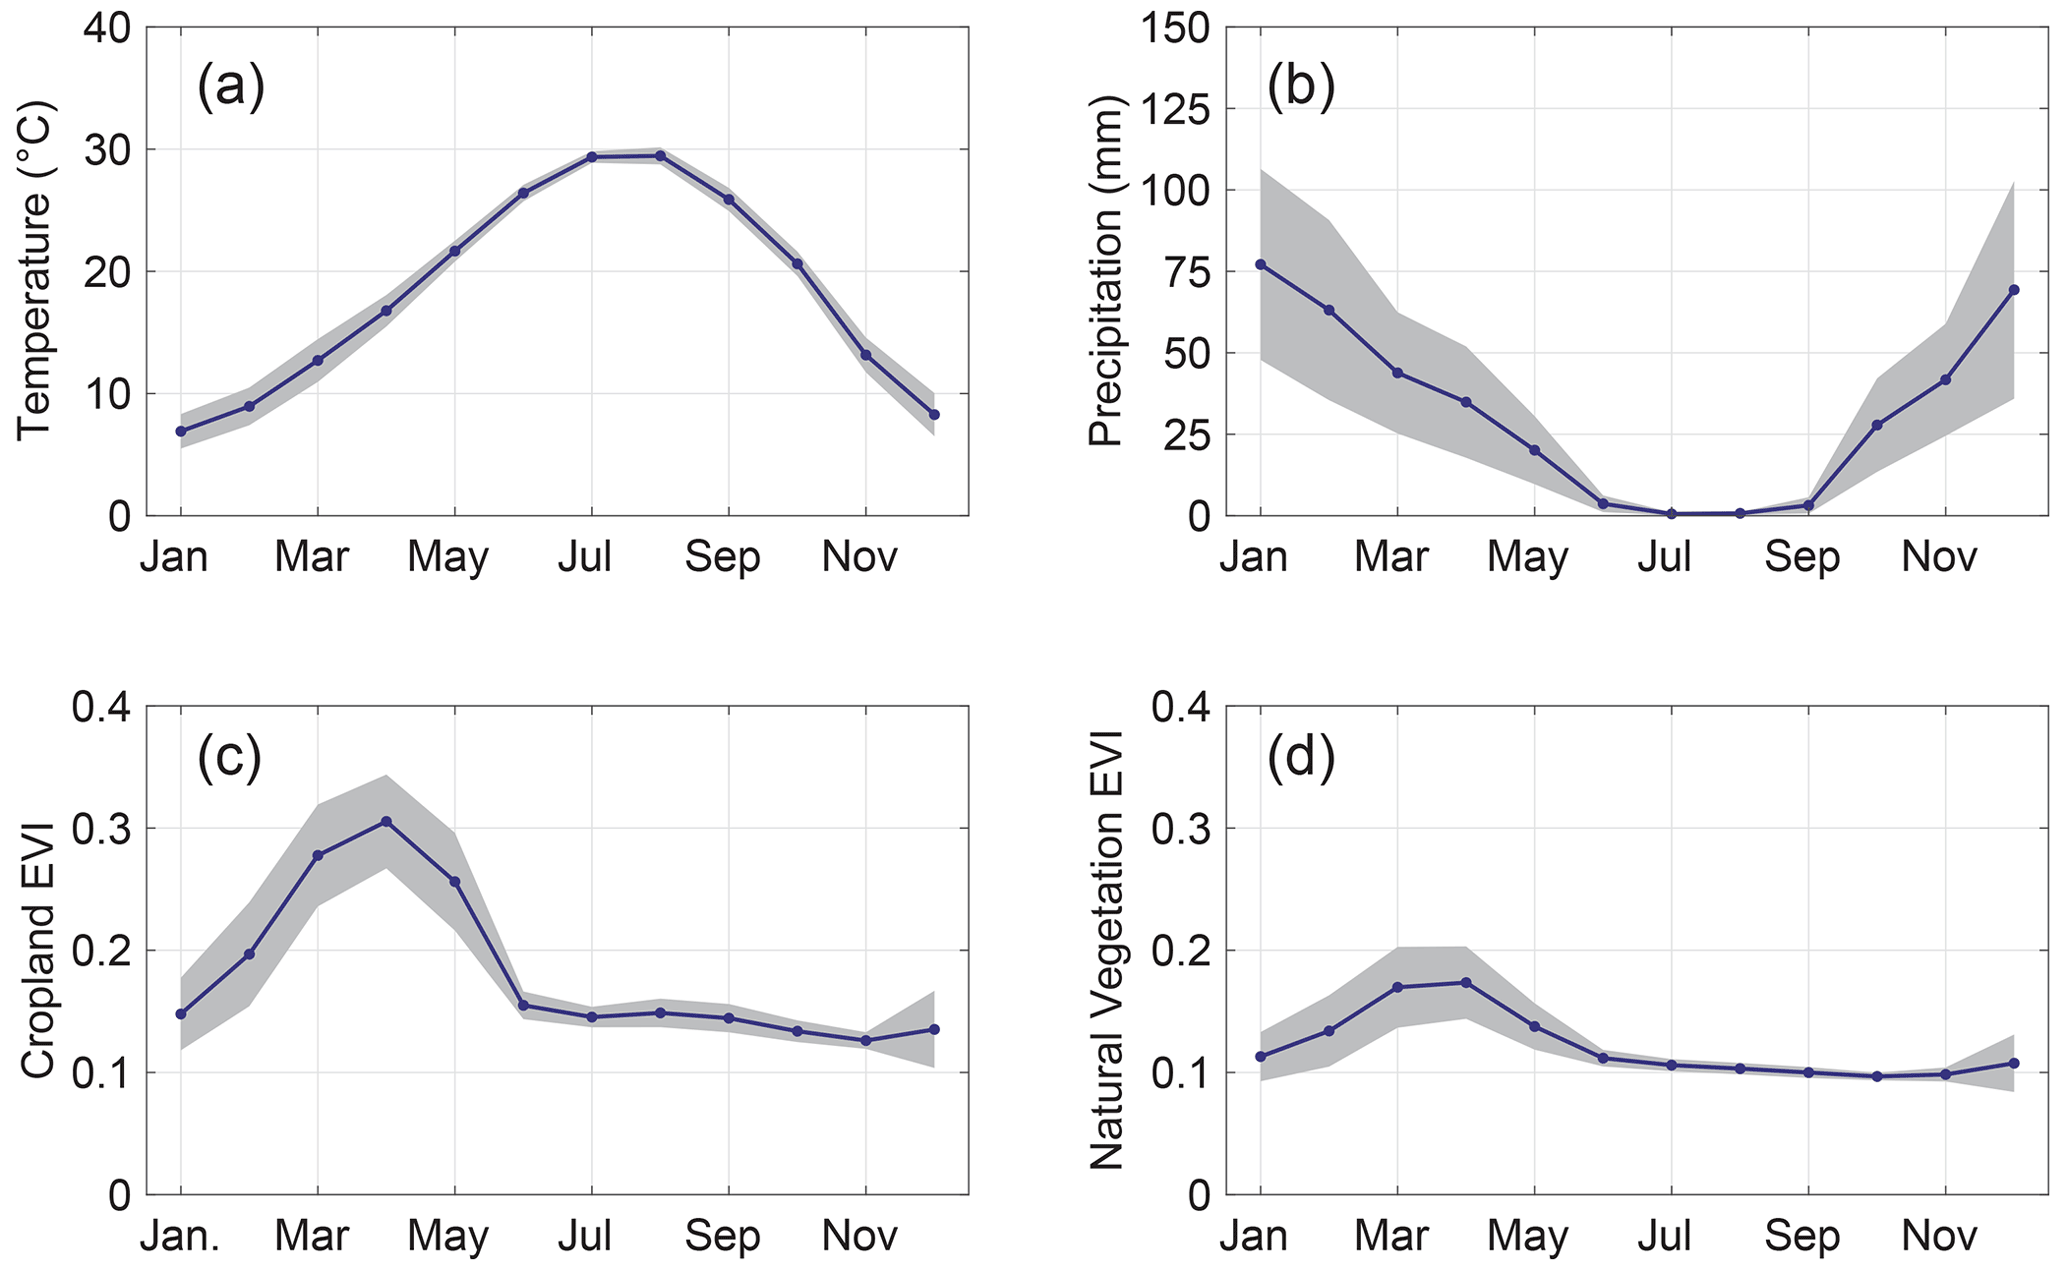
Figure 2Monthly variations of climatic factors and vegetation in Syria. (a–b) Precipitation (mm) and temperature (∘). (c–d) EVIs of natural vegetation and croplands. All the data are the averages during 2001–2018.
2.5 Cropland irrigation data
Irrigation is an important method for conducting farmland management and increasing production, especially for dryland. Irrigation facilities are also vulnerable to severe social stability and economic fluctuations. We selected the “Global Irrigation District Map” (latest version 5) from FAO (Food and Agriculture Organization of the United Nations), which shows the percentage of the total cropland area used for irrigation around a reference year 2005 with a resolution of 5 min (Stefan et al., 2013).
2.6 Statistical methods
In this paper, we applied statistical methods to observations rather than using models. Coherent results of these methods are expected to lead a more robust conclusion. The residual trend analysis (Burrell et al., 2017; Evans and Geerken, 2004) is widely used to deduce the impact of human activities by removing climatic factor contributions. Its basic assumption is as follows. Through the regression of vegetation and climatic factors, the trend of residuals is analyzed. For a significant trend of residuals, it is considered that this trend is caused by driving factors other than climatic factors, which is generally attributed to human activities.
The variation of rainfall use efficiency (RUE) is also analyzed, which is expressed by the ratio of EVI to precipitation (Fensholt and Rasmussen, 2011; Ibrahim et al., 2015). Previous studies have shown that there is a good linear relationship between above ground biomass and accumulated precipitation in semi-arid water-limited ecosystems (Dardel et al., 2014; Fensholt et al., 2013). At the same time, the accumulative remote sensing vegetation index can well represent aboveground net primary productivity (ANPP). Changes in the RUE may be attributed to factors other than water conditions, which can be generally considered to be the influence of human activities (Leroux et al., 2017). The growing season is defined as February to May (F–M) based on the vegetation phenology (Fig. 2).
A paired land-use experiment (PLUE) approach is also applied over two parts of a local region. Both parts have identical climate variations and the difference in vegetation changes of these two parts could be caused by human activities rather than climate drivers.
The Pearson correlation analysis and Mann–Kendall trend analysis are used to analyze the correlation and trends, respectively.

Figure 3Interannual variations of climatic factors and vegetation during 2001–2018. (a)–(d) are annual averages of temperature, precipitation, cropland EVI and natural vegetation EVI. (e)–(h) are growing season (F–M) averages of temperature, precipitation, cropland EVI and natural vegetation EVI.

Figure 4Interannual trends during 2001–2018 for each month of (a) temperature, (b) precipitation, (c) cropland EVI and (d) natural vegetation EVI.
3.1 Seasonal cycle and long-term trends
Figure 2 shows the monthly variations of the multi-year averaged hydrometeorological conditions (precipitation and temperature) and vegetation conditions in Syria. There is little precipitation from June to September during the hot, dry summer in this region: total precipitation is only about 8.2 mm during this period. Rainfall begins to increase in October, reaches its peak in January and then decreases again month by month. The monthly average temperature in winter is less than 10∘. Since October, although the dry season has gradually turned to the rainy season, the vegetation index is still very low, including both cropland vegetation and natural vegetation (Fig. 2c–d). The growing period of cropland and natural vegetation is concentrated in February to May, and the growth of cropland vegetation is obviously better than that of natural vegetation, which is reflected in higher EVI. Therefore, the period from February to May is generally selected as the growing period.
The interannual variations of precipitation, temperature and vegetation are further analyzed in Fig. 3. It is found that in the whole year or in the growing period, both the cropland vegetation and the natural vegetation show a decreasing trend. Meanwhile, there is an increasing trend of temperature and a decreasing trend of precipitation. Therefore, intuitively, increases in temperature and decreases in precipitation enhance water constraints, leading to further deterioration of hydrometeorological conditions in this region.
The monthly variation of climatic factors and vegetation are consistent is with interannual variation. In particular, the temperature only slightly decreases in October, while it increases in other months. The most obvious decrease of precipitation occurs in February (Fig. 4b), with a rate of −2.14 mm yr−1. However, vegetation in April and May decreases most significantly, including both cropland vegetation and natural vegetation. This can be most likely attributed to the precipitation decline in spring, especially February.

Figure 5Spatial patterns of interannual trends during 2001–2018 for (a) EVI in the growing period, (b) EVI of croplands, (c) EVI of natural vegetation, (d) precipitation and (e) temperature.
3.2 Spatial patterns of long-term trends
There are large differences in the spatial variation of vegetation in the study area. As shown in Fig. 5, the EVI in the growing period shows an increasing trend in the western area, while the decreasing trend is mainly concentrated in the north (northwest and northeast), especially for the cropland vegetation. The greening area in the south is also associated with decreases in precipitation and increases in temperature, which presents a problem in explaining this spatial distribution pattern through changes of temperature and water. Thus, it is necessary to further analyze this spatial pattern by residual analysis.
The vegetation change in the study area is mainly constrained by water availability. Therefore, the residual trend after removing the influence of precipitation is analyzed in this paper. Compared with overall precipitation, most of the water used by vegetation is soil moisture in the root layer, which experiences cumulative and hysteresis effects (Chen et al., 2014). It is found that the EVI in the growing period is most sensitive to the cumulative precipitation from November of the previous year to April of the current year (N–A precipitation for short). As shown in Fig. 6, for most regions there are significant positive correlations between the N–A precipitation and the EVI in the growing period. Figure 6b shows the corresponding trends of residual changes. The significantly decreasing trends of the EVI residuals are mainly concentrated in northern Syria. The RUE here is expressed by the ratio of the EVI in the growing period to the N–A precipitation, of which the interannual variations also could be used to induce human activity impacts. The result shows that the RUE decreases in the north and increases in the southwest (Fig. 6c), which is similar to that of the residual analysis of the spatial distribution. Therefore, based on this result we suggest that in addition to climatic factors, the most important reason for vegetation decline in this area is changes in human activities.

Figure 6(a) Correlations between the N–A precipitation and the EVI in the growing period; (b) trends of EVI residuals after removing the linear fitting by precipitation (10−3 yr−1); (c) rainfall use efficiency.
3.3 PLUE analysis
In order to illustrate the land management rather than climate impact on the vegetation trend, through the remote sensing data, a PLUE analysis has been further conducted in the agricultural area adjacent to Turkey (Fig. 7). A parallelogram-shaped region located in the Khabur River basin is selected, whose vertex coordinates are [37.5∘ N, 40.5∘ E], [36.75∘ N, 41∘ E], [37.25∘ N, 39.5∘ E] and [36.5∘ N, 40∘ E] (a keyhole markup language (KML) file is attached in the supplementary data file). This region includes parts of Turkey and Syria, where irrigated cropland is widely distributed (Hole, 2009).
As shown in Fig. 7, the correlation between EVI series from which the linear trends are removed is 0.8027 (p<0.001), suggesting both areas are affected by similar, consistent climate variations. However, the vegetation exhibits contrasting trends of greening and browning in these two regions. The interannual variation trends of the EVI on the Syrian and Turkish sides in this basin are −3 × 10⁻³ and 4.5 × 10⁻³, respectively. Similarly, the seasonal distributions of the variation trend also show significant differences. Therefore, it is likely that the effect of land management contributes to this difference. One possible reason is that with the increase in agriculture input in Turkey, land management has promoted the growth of cropland vegetation. The other reason maybe that the social unrest in Syria has had a serious negative impact on agricultural production, and thus land management has had a negative effect on the growth of cropland crops.
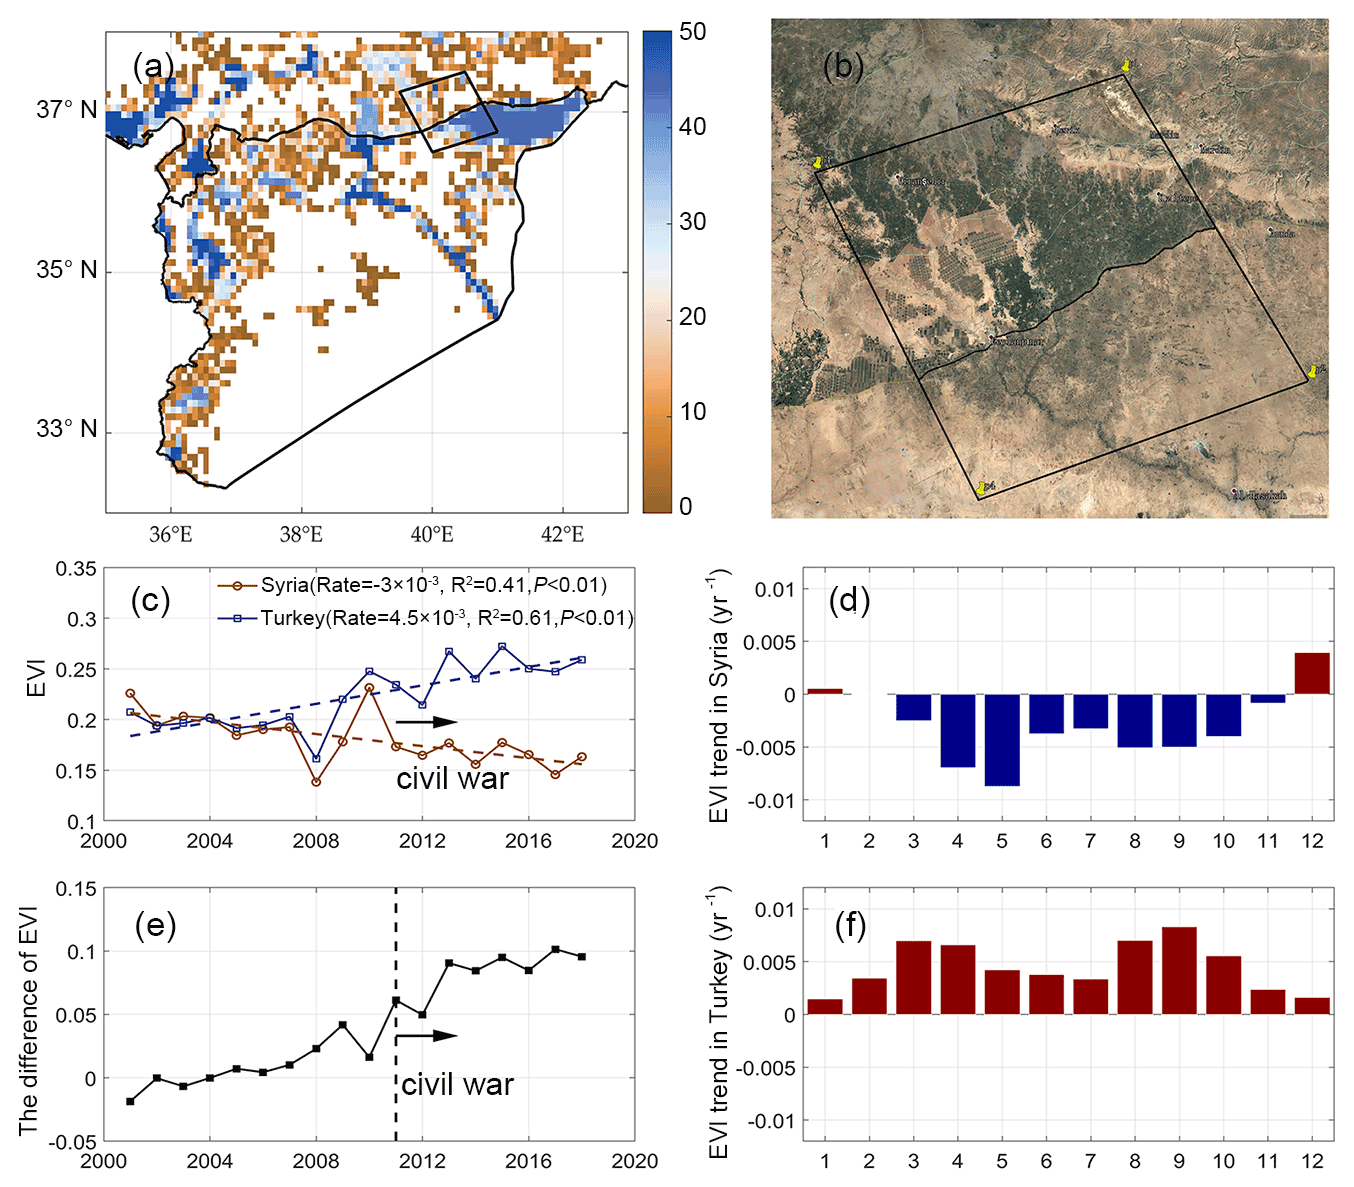
Figure 7(a) The percentage of the total cropland area used for irrigation for the reference year of 2005. (b) The Khabur River basin and cropland distribution (© Google Earth 2019, a KML file is attached). The vertex coordinates of the parallelogram are [37.5∘ N, 40.5∘ E], [36.75∘ N, 41∘ E], [37.25∘ N, 39.5∘ E] and [36.5∘ N, 40∘ E]. (c) Annual EVI series of cropland on the Syrian side and the Turkish side with linear fitting. (d) EVI trends of each month of cropland on the Syrian side. (e) EVI difference between the Turkish and Syrian sides of the basin (Turkey's EVI minus Syria's EVI). (f) EVI trends of each month of cropland on the Turkish side.
Recent vegetation changes have raised widespread concern. Firstly, vegetation is an important resource and ecological indicator. Secondly, it also has an important feedback effect on climate, affecting the energy and water cycle of the Earth–atmosphere system (Ryu et al., 2019; Xiao et al., 2019). Climatic driving factors for vegetation changes generally include temperature, precipitation and the fertilization effect of CO2. In addition, the land-use change could also cause a change in vegetation. However, there is a serious lack of the studies on land management other than land-use changes (Prestele et al., 2017).
For the study area in this paper, due to the typical arid and semi-arid climate in this region, the primary constraint for vegetation growth is water; therefore precipitation plays a dominant role here. However, the role of land management in this area is also worth attention. On one hand, irrigated agriculture is widely distributed in this area (Fig. 7a), indicating high-intensity land management in this area. On the other hand, economic fluctuation and social unrest in the study area are relatively great. Among them, the most typical case is the fluctuation of the investment in land management caused by social unrest, including irrigation facilities, seeds, fertilizers, pesticides, mechanization, effective field management and so on (Mason, 2019; Mohammed et al., 2020).
Therefore, it is necessary to study the interannual fluctuations and long-term variation trends of vegetation in this area. Because the study area is a typical water-limited ecosystem, the fluctuation of water conditions in this area still has a significant impact on cropland vegetation and natural vegetation despite the irrigation facilities. For example, severe droughts (Kelley et al., 2015) greatly affect the EVI during 2007–2009 (Fig. 3). The average EVI of cropland vegetation is 0.24 in 2001–2018, while it is 0.22 in 2007–2009. In contrast, the average EVI of natural vegetation is 0.15 in 2001–2018, while it is 0.12 in 2007–2009. Related research has reported that the vegetation damage caused by this drought was mainly due to the shortage of irrigation water resources (Kelley et al., 2015; Châtel, 2014). Previous studies (Eklund and Thompson, 2017; Gleick, 2014) have demonstrated that Syrian farmers depended heavily on dam reservoirs and the extraction of groundwater. However, as early as the end of the 20th century, Syria's groundwater resources were already severely inadequate and its land degraded. When drought occurred in 2006 and 2008, some mismanagement and the already bad situation had a serious social impacts. Crop failure triggered the migration of people from rural to urban areas. In the suburbs of major cities in Syria, including Aleppo, Damascus, Deir ez-Zor, Hama and Homs, more than 1.5 million people migrated from rural areas to cities and refugee camps, most of whom were agricultural workers and family farmers.
The long-term trend in vegetation, especially its spatial distribution, regardless of the residual analysis method or the rainfall use efficiency, indicates that the vegetation decline in northern Syria is caused by human activities. This is naturally linked to the devastating effects of the Syrian Civil War. After 2011, the EVI of the region continued to decline. In 2018, the EVI of the growing season was only 0.22, which was the lowest year except for 2008. According to the report of FAO (FAO, 2017), the survey data of field research revealed the comprehensive degradation of land management brought by war, including the insufficiency of irrigation facilities, the lack of seed, fertilizers and pesticides, as well as the inadequacy of field management. Therefore, since 2011, several research institutions have created maps of social unrest during the Syria Civil War. For instance, the Armed Conflict Location and Event Data Project (ACLED) records the time and location information of unrest events, including (but not limited to) the battle, protests and violence (Raleigh et al., 2010). The Carter Center documents the territorial changes of Syria at the community level since 2014 (Carter Center, 2020). Over a certain region, the number of armed groups could also reflect the handover frequency and the degree of social unrest. These maps also have demonstrated that the browning areas found here have experienced serious social unrest generally. Meanwhile, the social unrest reduced land management change could be ascertained from well-documented reports in Syria; however, a method of how to evaluate this issue on a global scale, including the area, severity and timing, is still a huge challenge.
In a local region where the climatic conditions (including average and variations) are quite similar, vegetation changes induced by natural factors should theoretically be similar. The difference in vegetation change of the two parts in such a region could be caused by human activities rather than natural factors. The paired analysis across the border between Syria and Turkey confirmed this hypothesis. After removing the linear trend in the EVI of both sides, the correlation coefficient reached 0.8. However, the annual and monthly trends of the two are completely opposite. This difference can only be attributed to human activities, which refer to land management in this case. In Turkey, since 1977, the government has built 22 dams, 19 hydropower stations and some irrigation networks, which have promoted the development of agriculture in the region (Eklund et al., 2017). For Syria, this can only be attributed to the adverse effects of cropland abandonment and insufficient planting caused by social unrest. Especially after the outbreak of the war in 2011, the gap between the annual average EVI values of these two regions gradually increased, reaching 0.1 at the end of 2018.
Regional browning issues have also been discovered in a generally greening world, which are mainly related to climate constraints; however, the influence of insufficient land management has not been well identified yet (Pan et al., 2018; Yuan et al., 2019). Although this article identifies the contribution of social unrest caused by land management to regional browning, it still cannot set a certain year as a turning point (such as 2011). Both data length and severe climate variations would limit the statistical significance in turning point identification. Furthermore, even before the war started in 2011, disaster prevention and mitigation capabilities were quite poor. Once natural disasters and social unrest are superimposed, a continuous decline in land management capacity can be seen.
A method to quantify the contributions of climate change and human activities in vegetation change is still a challenge. In this paper, we identify the driving factor of land management in browning based on coherent results from multiple statistical methods. However, there is still a gap between “identifying” and “quantifying” the contributions.
In this study, we investigated vegetation changes in Syria and their potential drivers. During 2001–2018, the EVIs of the whole year and the growing period in the whole country decrease at the rates of −0.8 × 10⁻³ yr−1 (p<0.1) and −1.9 × 10⁻³ yr−1 (p<0.05), respectively. Spatial patterns indicate that the EVI decline is mainly concentrated in the northern region. Both the residual analysis and the RUE analysis suggest that besides climate change, human activities play a significant role in vegetation decline. A paired analysis of the Khabur River basin across the border of Syria and Turkey demonstrates that both sides of the region have widely distributed croplands. EVIs for the two sides have similar trend-removed interannual (climatic) variations but contrary long-term trends, and the Syrian side is browning while the Turkish side is greening. The spatial patterns between the browning areas and social unrest of the civil war are generally coherent, and relevant reports have noted that social unrest induced insufficient irrigation and lack of seeds, fertilizers, pesticides and field management. These changes can be classified in the category of land management. Therefore, we conclude that the decline of vegetation condition (browning) in the north Syria is driven by the change of land management rather than climate change.
All data used in this article are available from open accessed scientific data resources. Land cover data (MCD12C1) and EVI data (MOD13C2) are available at the LAADS DAAC (Level–1and Atmosphere Archive & Distribution System Distributed Active Archive Center https://ladsweb.modaps.eosdis.nasa.gov, last access: May 2020, Friedl and Sulla-Menashe, 2015; Didan, 2015). Precipitation and temperature data from CRU TS4.03 are available at the Centre for Environmental Data Analysis (http://browse.ceda.ac.uk/, last access: May 2020, Harris and Jones, 2020). Cropland irrigation data (Global Irrigation District Map, version 5) are from FAO (https://www.fao.org/aquastat/en/, FAO, 2016). The post-processed results data corresponding to the plots/tables are available from the from the authors upon request (txchen@nuist.edu.cn).
The supplement related to this article is available online at: https://doi.org/10.5194/bg-19-1515-2022-supplement.
TC and HD conceptualized the study. TC, RG, XC, SZ and CL analyzed the data and drew the figures. TC, and QY wrote the original draft and all authors contributed to writing and responding to review comments.
The contact author has declared that neither they nor their co-authors have any competing interests.
Publisher's note: Copernicus Publications remains neutral with regard to jurisdictional claims in published maps and institutional affiliations.
We thank Nanjing Hurricane Translation for reviewing the English language quality of this paper, and thank Xiaogang He for discussion of this paper. We thank the reviewers and editors for their contributions during the review process, which significantly improved our paper.
This research is supported by the National Key R&D Program of China (grant no. 2017YFB0504000), the National Natural Science Foundation of China (grant nos. 42161144003, 42130506 and 31570464).
This paper was edited by Eyal Rotenberg and reviewed by one anonymous referee.
Alcantara, C., Kuemmerle, T., Baumann, M., Bragina, E. V., Griffiths, P., Hostert, P., Knorn, J., Müller, D., Prishchepov, A. V., and Schierhorn, F.: Mapping the extent of abandoned farmland in Central and Eastern Europe using MODIS time series satellite data, Environ. Res. Lett., 8, 035035, https://doi.org/10.1088/1748-9326/8/3/035035, 2013.
Brown, L. A., Meier, C., Morris, H., Pastor-Guzman, J., Bai, G., Lerebourg, C., Gobron, N., Lanconelli, C., Clerici, M., and Dash, J.: Evaluation of global leaf area index and fraction of absorbed photosynthetically active radiation products over North America using Copernicus Ground Based Observations for validation data, Remote Sens. Environ., 247, 218–230, https://doi.org/10.1016/J.RSE.2020.111935, 2020.
Burrell, A. L., Evans, J. P., and Liu, Y.: Detecting dryland degradation using time series segmentation and residual trend analysis (TSS-RESTREND), Remote Sens. Environ., 197, 43–57, https://doi.org/10.1016/J.RSE.2017.05.018, 2017.
Carter Center: Analyzing Shifts in Territorial Control within Syria Offers Glimpse of Future Challenges, https://www.cartercenter.org/news/features/p/conflict_resolution/syria-mapping-shifts-in-territorial-control.html, last access: 13 May 2020.
Châtel, F. D.: The Role of Drought and Climate Change in the Syrian Uprising: Untangling the Triggers of the Revolution, Middle Eastern Stud., 50, 521–535, doi10.1080/00263206.2013.850076, 2014.
Chen, C., Park, T., Wang, X., Piao, S., Xu, B., Chaturvedi, R. K., Fuchs, R., Brovkin, V., Ciais, P., and Fensholt, R.: China and India lead in greening of the world through land-use management, Nat. Sustain., 2, 122–129, https://doi.org/10.1038/S41893-019-0220-7, 2019.
Chen, T., Jeu, R. A. M. d., Liu, Y. Y., Werf, G. R. V. D., and Dolman, A. J.: Using satellite based soil moisture to quantify the water driven variability in NDVI: A case study over mainland Australia, Remote Sens. Environ., 140, 330–338, https://doi.org/10.1016/J.RSE.2013.08.022, 2014.
Chen, T., Zhou, S., Liang, C., Hagan, D. F. T., Zeng, N., Wang, J., Shi, T., Chen, X., and Dolman, A. J.: The greening and wetting of the Sahel have leveled off since about 1999 in relation to SST, Remote Sens., 12, 2723, https://doi.org/10.3390/RS12172723, 2020.
d'Amour, C. B., Reitsma, F., Baiocchi, G., Barthel, S., Güneralp, B., Erb, K.-H., Haberl, H., Creutzig, F., and Seto, K. C.: Future urban land expansion and implications for global croplands, P. Natl. Acad. Sci. USA, 114, 8939–8944, https://doi.org/10.1073/PNAS.1606036114, 2017.
Dardel, C. c., Kergoat, L., Hiernaux, P., Grippa, M., Mougin, E., Ciais, P., and Nguyen, C.-C.: Rain-Use-Efficiency: What it tells us about the Conflicting Sahel Greening and Sahelian Paradox, Remote Sens., 6, 3446-3474, https://doi.org/10.3390/RS6043446, 2014.
Didan, K.: MOD13C2 MODIS/Terra Vegetation Indices Monthly L3 Global 0.05P∘ CMG, NASA LP DAAC [data set], https://doi.org/10.5067/MODIS/MOD13C2.006, 2015 (https://ladsweb.modaps.eosdis.nasa.gov).
Eklund, L. and Thompson, D.: Differences in resource management affects drought vulnerability across the borders between Iraq, Syria, and Turkey, Ecol. Soc., 22, 9, https://doi.org/10.5751/ES-09179-220409, 2017.
Erb, K.-H., Luyssaert, S., Meyfroidt, P., Pongratz, J., Don, A., Kloster, S., Kuemmerle, T., Fetzel, T., Fuchs, R., Herold, M., Haberl, H., Jones, C. D., Marín-Spiotta, E., McCallum, I., Robertson, E., Seufert, V., Fritz, S., Valade, A., Wiltshire, A., and Dolman, A. J.: Land management: data availability and process understanding for global change studies, Glob. Change Biol., 23, 512–533, https://doi.org/10.1111/GCB.13443, 2017.
Evans, J. and Geerken, R.: Discrimination between climate and human-induced dryland degradation, J. Arid. Environ., 57, 535–554, https://doi.org/10.1016/S0140-1963(03)00121-6, 2004.
FAO: Food and Agriculture Organization of the United Nations (FAO) [data set], https://www.fao.org/aquastat/en/, 2016.
FAO: Counting the cost: Agriculture in Syria after six years of crisis, Rome, http://www.fao.org/fileadmin/user_upload/emergencies/docs/FAO_SYRIA-counting-the-cost.pdf, 2017 (https://www.fao.org/resilience/resources/resources-detail/en/c/878213/, last access: 4 November 2020).
Fensholt, R. and Rasmussen, K.: Analysis of trends in the Sahelian “rain-use efficiency” using GIMMS NDVI, RFE and GPCP rainfall data, Remote Sens. Environ, 115, 438–451, https://doi.org/10.1016/J.RSE.2010.09.014, 2011.
Fensholt, R., Rasmussen, K., Kaspersen, P. S., Huber, S., Horion, S., and Swinnen, E.: Assessing Land Degradation/Recovery in the African Sahel from Long-Term Earth Observation Based Primary Productivity and Precipitation Relationships, Remote Sens., 5, 664–686, https://doi.org/10.3390/RS5020664, 2013.
Forzieri, G., Alkama, R., Miralles, D. G., and Cescatti, A.: Satellites reveal contrasting responses of regional climate to the widespread greening of Earth, Science, 356, 1180–1184, https://doi.org/10.1126/SCIENCE.AAL1727, 2017.
Friedl, M. and Sulla-Menashe, D.: MCD12C1 MODIS/Terra+Aqua Land Cover Type Yearly L3 Global 0.05∘ CMG, NASA LP DAAC [data set], https://doi.org/10.5067/MODIS/MCD12C1.006, 2015 (https://ladsweb.modaps.eosdis.nasa.gov).
Gleick, P. H.: Water, drought, climate change, and conflict in Syria, Weather Clim. Soc., 6, 331–340, https://doi.org/10.1175/WCAS-D-13-00059.1, 2014.
Harris, I. C. and Jones, P. D.: CRU TS4.03: Climatic Research Unit (CRU) Time-Series (TS) version 4.03 of high-resolution gridded data of month-by-month variation in climate (Jan. 1901–Dec. 2018), Centre for Environmental Data Analysis [data set], 22 January 2020, https://doi.org/10.5285/10d3e3640f004c578403419aac167d82, 2020 (http://browse.ceda.ac.uk/).
Hole, F.: Drivers of unsustainable land use in the Semi-Arid Khabur River Basin, Syria, Geogr. Res., 47, 4–14, https://doi.org/10.1111/J.1745-5871.2008.00550.X, 2009.
Ibrahim, Y. Z., Balzter, H., Kaduk, J., and Tucker, C. J.: Land degradation assessment using residual trend analysis of GIMMS NDVI3g, soil moisture and rainfall in Sub-Saharan West Africa from 1982 to 2012, Remote Sens., 7, 5471–5494, https://doi.org/10.3390/RS70505471, 2015.
Jong, R. D., Verbesselt, J., Schaepman, M. E., and Bruin, S. D.: Trend changes in global greening and browning: contribution of short-term trends to longer-term change, Glob. Change Biol., 18, 642–655, https://doi.org/10.1111/J.1365-2486.2011.02578.X, 2012.
Ju, J. and Masek, J. G.: The vegetation greenness trend in Canada and US Alaska from 1984–2012 Landsat data, Remote Sens. Environ., 176, 1–16, https://doi.org/10.1016/J.RSE.2016.01.001, 2016.
Keenan, T. F. and Riley, W. J.: Greening of the land surface in the world's cold regions consistent with recent warming, Nat. Clim. Change, 8, 825–828, https://doi.org/10.1038/S41558-018-0258-Y, 2018.
Kelley, C. P., Mohtadi, S., Cane, M. A., Seager, R., and Kushnir, Y.: Climate change in the Fertile Crescent and implications of the recent Syrian drought, P. Natl. Acad. Sci. USA, 112, 3241–3246, https://doi.org/10.1073/PNAS.1421533112, 2015.
Leroux, L., Bégué, A., Seen, D. L., Jolivot, A., and Kayitakire, F.: Driving forces of recent vegetation changes in the Sahel: Lessons learned from regional and local level analyses, Remote Sens. Environ., 191, 38–54, https://doi.org/10.1016/J.RSE.2017.01.014, 2017.
Li, X. Y., Li, X., Fan, Z., Mi, L., Kandakji, T., Song, Z., Li, D., and Song, X. P.: Civil war hinders crop production and threatens food security in Syria, Nature Food, 3, 38–46, https://doi.org/10.1038/s43016-021-00432-4, 2022
Li, Y., Piao, S., Li, L. Z. X., Chen, A., Wang, X., Ciais, P., Huang, L., Lian, X., Peng, S., Zeng, Z., Wang, K., and Zhou, L.: Divergent hydrological response to large-scale afforestation and vegetation greening in China, Sci. Adv., 4, eaar4182, https://doi.org/10.1126/SCIADV.AAR4182, 2018.
Mason, M.: Climate change and conflict in the Middle East, Int. J. Middle East Stud., 51, 626–628, https://doi.org/10.1017/S0020743819000709, 2019.
Meyfroidt, P., Lambin, E. F., Erb, K.-H., and Hertel, T. W.: Globalization of land use: distant drivers of land change and geographic displacement of land use, Curr. Opin. Environ. Sustain., 5, 438–444, https://doi.org/10.1016/J.COSUST.2013.04.003, 2013.
Mohammed, S. A., Alkerdi, A., Nagy, J., and Harsányi, E.: Syrian crisis repercussions on the agricultural sector: Case study of wheat, cotton and olives, Reg. Sci. Pract., 12, 519–537, https://doi.org/10.1111/RSP3.12222, 2020.
Pan, N., Feng, X., Fu, B., Wang, S., Ji, F., and Pan, S.: Increasing global vegetation browning hidden in overall vegetation greening: Insights from time-varying trends, Remote Sens. Environ., 214, 59–72, 10.1016/j.rse.2018.05.018, 2018.
Piao, S., Wang, X., Park, T., Chen, C., Lian, X., He, Y., Bjerke, J. W., Chen, A., Ciais, P., and Tømmervik, H.: Characteristics, drivers and feedbacks of global greening, Nat. Rev. Earth Environ., 1, 14–27, https://doi.org/10.1038/S43017-019-0001-X, 2020.
Pongratz, J., Reick, C. H., Houghton, R. A., and House, J. I.: Terminology as a key uncertainty in net land use and land cover change carbon flux estimates, Earth Syst. Dynam., 5, 177–195, https://doi.org/10.5194/esd-5-177-2014, 2014.
Prestele, R., Arneth, A., Bondeau, A., de Noblet-Ducoudré, N., Pugh, T. A. M., Sitch, S., Stehfest, E., and Verburg, P. H.: Current challenges of implementing anthropogenic land-use and land-cover change in models contributing to climate change assessments, Earth Syst. Dynam., 8, 369–386, https://doi.org/10.5194/esd-8-369-2017, 2017.
Raleigh, C., Linke, A., Hegre, H., and Karlsen, J.: Introducing ACLED: An armed conflict location and event dataset, J. Peace Res., 47, 651–660, https://doi.org/10.1177/0022343310378914 2010, 2010.
Ryu, Y., Berry, J. A., and Baldocchi, D. D.: What is global photosynthesis? History, uncertainties and opportunities, Remote Sens. Environ., 223, 95–114, https://doi.org/10.1016/J.RSE.2019.01.016, 2019.
Salih, A. A. M., Baraibar, M., Mwangi, K. K., and Artan, G.: Climate change and locust outbreak in East Africa, Nat. Clim. Change, 10, 584–585, https://doi.org/10.1038/S41558-020-0835-8, 2020.
Schierhorn, F., Müller, D., Beringer, T., Prishchepov, A. V., Kuemmerle, T., and Balmann, A.: Post-Soviet cropland abandonment and carbon sequestration in European Russia, Ukraine, and Belarus, Global Biogeochem. Cy., 27, 1175–1185, https://doi.org/10.1002/2013GB004654, 2013.
Schimel, D., Stephens, B. B., and Fisher, J. B.: Effect of increasing CO2 on the terrestrial carbon cycle, P. Natl. Acad. Sci. USA, 112, 436–441, https://doi.org/10.1073/PNAS.1407302112, 2015.
Stefan, S., Verena, H., Karen, F., and Jacob, B.: Global Map of Irrigation Areas version 5. Rheinische Friedrich-Wilhelms-University, Bonn, Germany/Food and Agriculture Organization of the United Nations, Rome, Italy, 2013.
Xiao, J., Chevallier, F., Gomez, C., Guanter, L., Hicke, J. A., Huete, A. R., Ichii, K., Ni, W., Pang, Y., Rahman, A. F., Sun, G., Yuan, W., Zhang, L., and Zhang, X.: Remote sensing of the terrestrial carbon cycle: A review of advances over 50 years, Remote Sens. Environ., 233, 11383, https://doi.org/10.1016/J.RSE.2019.111383, 2019.
Yuan, W., Zheng, Y., Piao, S., Ciais, P., Lombardozzi, D., Wang, Y., Ryu, Y., Chen, G., Dong, W., Hu, Z., Jain, A. K., Jiang, C., Kato, E., Li, S., Lienert, S., Liu, S., Nabel, J. E. M. S., Qin, Z., Quine, T., Sitch, S., Smith, W. K., Wang, F., Wu, C., Xiao, Z., and Yang, S.: Increased atmospheric vapor pressure deficit reduces global vegetation growth, Sci. Adv., 5, eaax1396, https://doi.org/10.1126/SCIADV.AAX1396, 2019.
Zhang, Y., Song, C., Band, L. E., Sun, G., and Li, J.: Reanalysis of global terrestrial vegetation trends from MODIS products: Browning or greening?, Remote Sens. Environ., 191, 145–155, https://doi.org/10.1016/J.RSE.2016.12.018, 2017.
Zhu, Z., Piao, S., Myneni, R. B., Huang, M., Zeng, Z., Canadell, J. G., Ciais, P., Sitch, S., Friedlingstein, P., Arneth, A., Cao, C., Cheng, L., Kato, E., Koven, C., Li, Y., Lian, X., Liu, Y., Liu, R., Mao, J., Pan, Y., Peng, S., Peñuelas, J., Poulter, B., Pugh, T. A. M., Stocker, B. D., Viovy, N., Wang, X., Wang, Y., Xiao, Z., Yang, H., Zaehle, S., and Zeng, N.: Greening of the Earth and its drivers, Nat. Clim. Change, 6, 791–795, https://doi.org/10.1038/NCLIMATE3004, 2016.