the Creative Commons Attribution 4.0 License.
the Creative Commons Attribution 4.0 License.
 | 18 Mar 2022
Mangrove sediment organic carbon storage and sources in relation to forest age and position along a deltaic salinity gradient
Rey Harvey Suello
Simon Lucas Hernandez
Steven Bouillon
Jean-Philippe Belliard
Luis Dominguez-Granda
Marijn Van de Broek
Andrea Mishell Rosado Moncayo
John Ramos Veliz
Karem Pollette Ramirez
Gerard Govers
Stijn Temmerman
Mangroves are widely recognised as key ecosystems for climate change mitigation as they capture and store significant amounts of sediment organic carbon (SOC). Yet, there is incomplete knowledge on how sources of SOC and their differential preservation vary between mangrove sites in relation to environmental gradients. To address this, sediment depth profiles were sampled from mangrove sites ranging from river-dominated to marine-dominated sites and including old and young mangrove sites in the Guayas delta (Ecuador). The stable carbon isotope ratios (δ13C) and the elemental composition (OC %, C : N) of sediment profiles, local vegetation (i.e. autochthonous carbon) and externally supplied suspended particulate matter (i.e. allochthonous carbon) were obtained to assess variations in the amount and sources of SOC at different locations throughout the delta. In general, across all sites, we found that increasing SOC contents and stocks are associated with decreasing δ13C and increasing C : N ratios, indicating that SOC stocks and sources are intrinsically related. The SOC stocks (down to 0.64 m depth profiles) are significantly lower in young mangrove sites (46–55 Mg C ha−1) than in old sites (78–92 Mg C ha−1). The SOC in the young mangrove sites is mainly of allochthonous origin (estimated on average at 79 %), whereas in the old sites there is a slight dominance of autochthonous OC (on average 59 %). Moreover, from river- to marine-dominated sites, a pattern was found of increasing SOC stocks and increasing autochthonous SOC contribution. These observed differences along the two studied gradients are hypothesised to be mainly driven by (1) expected higher sedimentation rates in the river-dominated and lower-elevation younger sites, thereby `diluting' the SOC content and decreasing the relative autochthonous contribution, and (2) potential differences in preservation of the different SOC sources. Our finding of high contributions of allochthonous SOC, especially in young mangroves, implies that this carbon is not originating from CO2 sequestration by the mangrove ecosystem itself but is externally supplied from other terrestrial, marine or estuarine ecosystems. We argue that accounting for lower SOC stocks and higher contribution of allochthonous SOC in young and river-dominated mangrove sites, as compared to old and marine-dominated sites, is particularly relevant for designing and valuing nature-based climate mitigation programmes based on mangrove reforestation.
- Article
(2016 KB) - Full-text XML
-
Supplement
(667 KB) - BibTeX
- EndNote


Situated at the interface between terrestrial and marine environments, mangrove forests are unique wetland ecosystems occupying (sub-)tropical intertidal zones (Burkett and Kusler, 2000; Duke et al., 2007; Polidoro et al., 2010; Tue et al., 2012). They provide a myriad of ecosystem services, such as their ability to contribute to global climate regulation by effectively sequestering carbon (Donato et al., 2011; Mcleod et al., 2011; Taillardat et al., 2018). Mangroves accumulate organic carbon at an estimated rate of 20–949 g C m−2 yr−1, accounting for more than 10 % of the carbon sequestration by the global ocean (Mcleod et al., 2011; Alongi, 2014), while mangroves only cover ca. 2 % of the global ocean (Duarte et al., 2005). Compared to other ecosystem types, such as rain forests, peat swamps, salt marshes and seagrasses, mangroves store much higher carbon stocks which approximately range from 140–1023 Mg C ha−1 (Donato et al., 2011; Alongi, 2014; Schile et al., 2017). This demonstrates the importance of the carbon capture and storage capacity of mangrove ecosystems. Recent estimations by Atwood et al. (2017) equate to 2.6 billion Mg of C stored in mangrove sediments down to a 1 m depth worldwide.
This high capacity of mangroves to store carbon is to a large extent due to the accumulation of organic carbon into their sediments through a range of mechanisms. Generally, sediment organic carbon (SOC) originates from autochthonous inputs (i.e. from local biomass production) and allochthonous inputs (i.e. from particulate sediment deposition during tidal inundation) that are well-preserved by the mostly anoxic sediment conditions in mangroves (Kristensen et al., 2008). Above- and below-ground biomass accumulates in mangrove sediments through litterfall, vegetation die-off, root exudation, root growth and peat formation (Ezcurra et al., 2016), and this constitutes the autochthonous SOC in mangrove sediments. On the other hand, during regular tidal flooding events mangroves trap allochthonous carbon from tidal waters containing fine sediment particles of marine, estuarine and terrestrial origin (Alongi, 2014). These organic materials of both autochthonous and allochthonous origin are stored and buried in the mangrove sediments through sedimentation (during high tides and high-energy events like storm surges) and bioturbation (e.g. burrowing of crustaceans). The preservation of this buried SOC is dependent on, among other factors, organic matter sorption to mineral substrates, microbial decomposition activity (Kristensen et al., 2008; Adame et al., 2015) and tide-driven groundwater fluxes (Maher et al., 2013).
Unveiling environmental gradients that affect variations in the amount of allochthonous and autochthonous SOC in mangroves is highly relevant since the fate and long-term preservation of these two SOC sources may differ. Recent field studies in temperate-climate tidal marshes indicate that locally produced autochthonous SOC is abundantly present in the top 5–20 cm of sediment profiles but is largely lost with increasing depth beneath the sediment surface due to mineralisation and leaching. In contrast, long-term preserved SOC is to a large extent of external allochthonous origin, suggesting this SOC source is more protected against mineralisation (Van de Broek et al., 2018; Mueller et al., 2019). Furthermore, discriminating between autochthonous and allochthonous SOC sources is important, especially to properly assess the magnitude to which this ecosystem can help mitigate climate change. After all, it is only the autochthonous SOC that is assimilated from atmospheric CO2 within the mangrove ecosystem itself, while the allochthonous SOC originates from externally supplied organic C from other upstream (terrestrial), downstream (marine) or estuarine ecosystems. In that respect, double accounting of allochthonous OC (organic carbon) has to be avoided in carbon budgets (Van den Broek et al., 2018) as this SOC is originally sequestered in another environment. Yet the burial of allochthonous OC into mangrove SOC is relevant as that OC may have contributed otherwise to greenhouse gas emissions from estuarine waters (Barr et al., 2010; Borges and Abril, 2011; Sturm et al., 2017; Jacotot et al., 2018). Thus, making a distinction between allochthonous and autochthonous SOC is crucial. However, there is limited knowledge on the relative contribution of the autochthonous and allochthonous inputs to SOC in mangroves and specifically how this contribution may vary spatially in relation to environmental gradients.
The scarce number of studies on tidal marshes in temperate climate zones might provide hypotheses on which environmental gradients may be relevant for tropical mangroves. Here we focus on two gradients, for reasons argued below: (1) a deltaic or estuarine gradient from seaward sites (marine dominated) to landward sites (riverine dominated) and (2) young and old mangroves. Available studies from tidal marshes show a general pattern of decreasing SOC contents along estuarine salinity gradients from land to sea (Abril et al., 2002; Craft, 2007; Więski et al., 2010; Hansen et al., 2017; Van de Broek et al., 2016), and this may be associated with shifts in the allochthonous versus autochthonous contributions to marsh SOC. For example, in studies of tidal marshes in the US (Craft, 2007) and in Belgium and the Netherlands (Van de Broek et al., 2016), it was found that tidal marshes located more upstream along estuaries predominantly store SOC from allochthonous riverine inputs due to higher contents of suspended particulate matter (SPM) and particulate organic carbon (POC), hence leading to higher rates of allochthonous SOC accumulation and higher SOC stocks in more upstream marsh sites. Further, young low-elevation marshes that established more recently on mudflats are often characterised by higher rates of allochthonous sediment deposition, as compared to higher-elevation older marsh sites (Temmerman et al., 2004; Kirwan et al., 2016), and therefore it may be hypothesised that the SOC in young sites contains more allochthonous carbon as compared to old sites. However, it still remains to be investigated if such patterns of allochthonous versus autochthonous SOC sources and preservation – in relation to wetland age and position along an estuarine land-to-sea gradient, as found for temperate zone tidal marshes (Van de Broek et al., 2016, 2018; Mueller et al., 2019) – also occur in tropical mangroves, which obviously differ from marshes in many respects such as vegetation type, canopy density and climate, among others.
While it is widely accepted that mangroves act as major C sinks (Bouillon et al., 2008; Nellemann et al., 2009; Atwood et al., 2017; Marchand, 2017; Jennerjahn, 2020), at present, there are no studies that have specifically investigated the stocks and sources of SOC in relation to the age and position of mangroves along the land-to-sea gradient within a delta or estuary. Therefore, this study aims at quantifying and identifying first-order controls of SOC stocks and sources (allochthonous versus autochthonous) along an estuarine land-to-sea gradient and between old and young mangrove forest sites for a specific case study in the Guayas Delta, Ecuador.
2.1 Study site
Field sampling was conducted in the Guayas Delta (Ecuador) which borders the Gulf of Guayaquil (Fig. 1), together forming the largest estuarine system along the Pacific coast of South America (Cucalón, 1989; Reynaud et al., 2018). Its geomorphology is characterised by multiple branching river channels that intersect a large deltaic plain with approximately 4000 km2 of mangroves (Reynaud et al., 2018). Tidal gauge stations within the delta operated by the Instituto Oceanográfico de la Armada del Ecuador (INOCAR, Oceanographic Institute of the Navy, Fig. 1) recorded mean long-term (198–2016) tidal ranges of 2.12, 2.85 and 3.42 m and rising sea level rates of 1.7, 4.9 and 4.0 mm yr−1 for stations Puerto Bolivar, Puná and Rio Guayas, respectively.
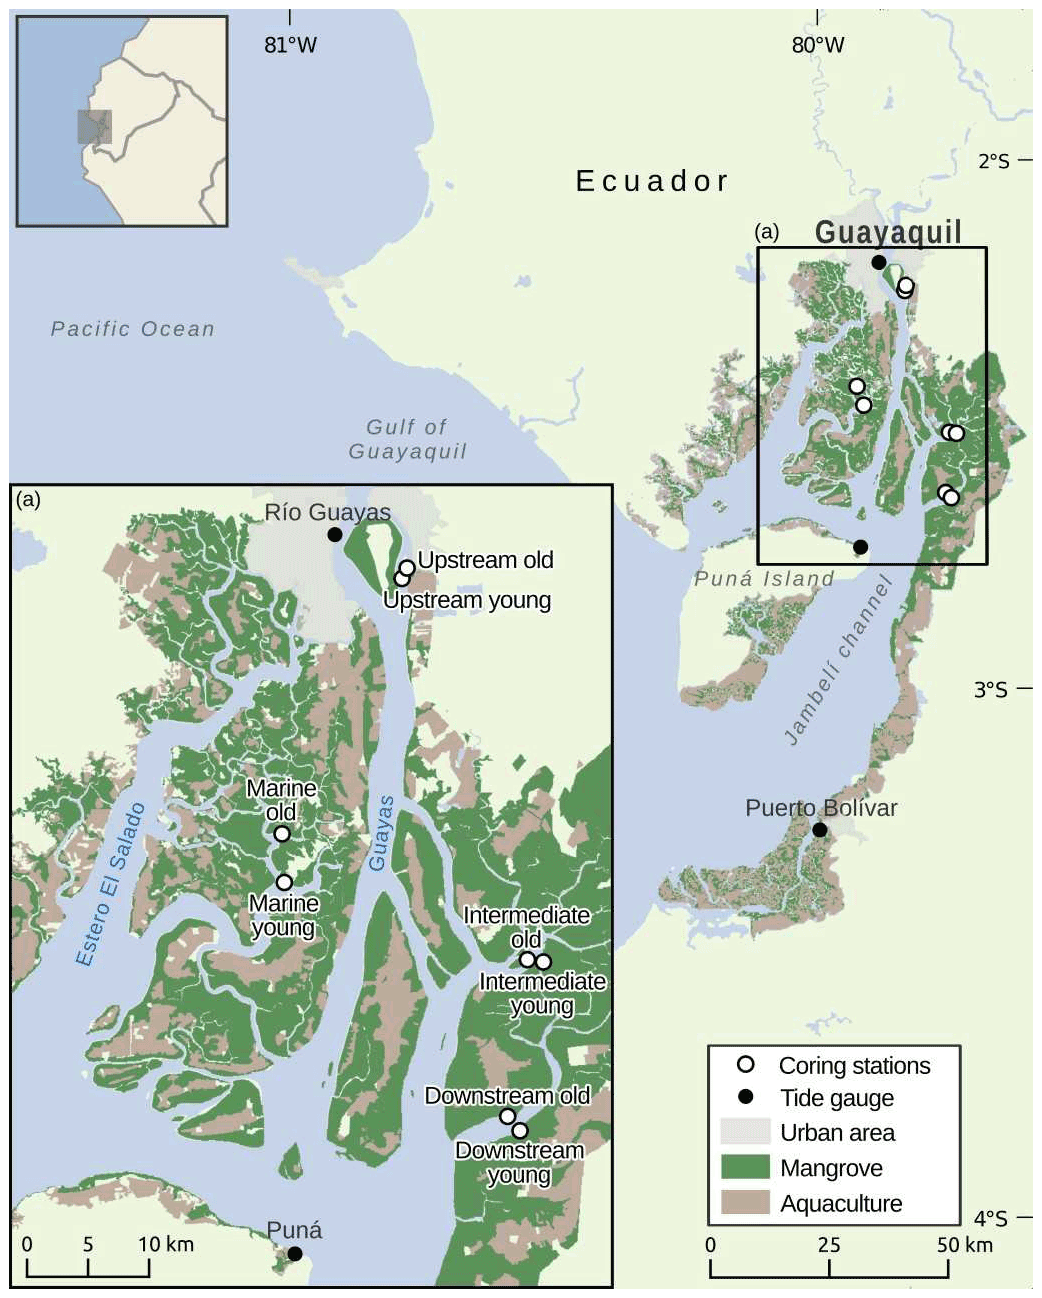
Figure 1Map of the Guayas Delta showing the locations of the sampled young and old mangrove systems along an estuarine land-to-sea gradient.
Two main estuarine sub-systems can be distinguished within the delta. To the east is the Guayas River estuary, which is a river-influenced estuary exhibiting a salinity gradient that ranges from 0–2 ppt at the landward side of the tidal influence to 30 ppt (parts per thousand) at the delta mouth during the yearly dry season (June to November), dropping down at the latter location to 15–20 ppt during the wet season (December to May) (Arreaga Vargas, 2000). To the west is the Estero El Salado estuary, which is a former tributary of the Guayas River that is now disconnected from freshwater river discharge at its northern limit, making it a marine-dominated estuarine system with salinity levels higher than in the Guayas River, ranging from 23.4–32.7 (Cifuentes et al., 1996; Twilley et al., 1998; Reynaud et al., 2018). Rainfall in the Guayas River catchment is seasonal, with 95 % of precipitation occurring in the rainy season. As a result, the Guayas River has an average monthly discharge of 1400 m3 s−1, ranging from 200 m3 s−1 in the dry season to 1600 m3 s−1 in the rainy season, during a year of average precipitation (Cifuentes et al., 1996; Twilley et al., 2001).
Eight sampling locations (see Table S1 for coordinates) were identified in these two subsystems, consisting of four paired sets of young and old mangrove sites that are located near each other (Fig. 1). These four pairs of young and old sites were situated in four sampling zones with different positions in the delta. Three different sampling zones were selected along the Guayas River estuary. These three sampling zones are referred to as the Upstream, Intermediate and Downstream zones (Fig. 1). A fourth sampling zone was selected in the marine-dominated El Salado estuary, which is referred to as the Marine zone. Based on an analysis of historical LANDSAT satellite images, we selected within each zone a young mangrove site (only emerging in satellite images at least after 1993 by mangrove establishment on initially bare mudflats) and an old mangrove site (visible as established mangroves in satellite images older than 1984). Although the selected young sites cannot be biologically categorised as young, for the purpose of this study, we will refer to these sites as “young” as they are still significantly younger than their older counterparts. There is a strong dominance of Rhizophora mangle in the old sites and Avicennia germinans in the young sites of the Intermediate, Downstream and Marine zones, whereas the young and old sites of the Upstream zone show high diversity of mangroves (Rhizophora and Avicennia) and an understory of freshwater plant species. Trees on the old sites have stem diameters mostly between 0.5 and 1 m, while on young sites this was mostly between 0.1 and 0.5 m, confirming we had selected contrasting old and young sites.
2.2 Sample collection
Sediment cores were collected in September 2018 using cylindrical PVC tubes (0.10 m diameter) inserted manually down to a minimum depth of 0.64 m. At each site, three replicate sediment cores were sampled with an approximate maximum distance of 3 m per coring location, resulting in a total of 24 sediment cores. Above-ground biomass samples (sun-shaded and sun-exposed green leaves, senescent leaves, leaf litter, live twigs, and branches) were collected in the field at all sampling locations, and below-ground biomass (light-coloured roots) was manually sampled from the sediment cores in the lab to represent autochthonous mangrove biomass. Surface water samples for determination of allochthonous suspended particulate organic carbon (POC) concentration were also collected from the river channels directly adjacent to each mangrove site with a 3 L Niskin bottle from just below the water surface and stored in 1 L opaque plastic bottles in a cool box filled with ice. Water samples were taken during a high-water and a low-water campaign, both during the dry season (September 2018) and wet season (March 2019).
All samples (sediment and biomass) were transported and immediately frozen at the laboratory. The frozen sediment cores were mechanically sliced per centimetre, thawed and then oven-dried at 60 ∘C for 48 h. Biomass samples were oven-dried using the same procedure. Total suspended matter (TSM) and POC content of the TSM were determined by filtering a known volume of water through pre-weighed and pre-combusted 47 and 25 mm Whatmann GF/F filters (nominal pore size 0.7 µm), respectively.
2.3 Sample analyses
From each core, subsamples (i.e. slices of 0.01 m depth increments) were taken every 0.04 m. To obtain the sediment bulk density the samples were oven-dried at 60 ∘C for 48 h and were desiccated for 30 min to constant weight. Large pieces of living macroscopic vegetation residues (i.e. light coloured roots) were then manually removed and kept as below-ground biomass samples, while the remaining sediment samples were homogenised. All samples were treated with 10 % HCl solution after weighing them in silver cups to remove carbonates and were left overnight in an oven at 50 ∘C. These were then analysed for OC content, C : N ratios and δ13C using an elemental analyser (Thermo EA 1110 coupled to a Thermo Delta V Advantage isotope ratio mass spectrometer). For the analysis of grain size distribution, subsamples were taken every 0.08 m for each core and were analysed using a LS I3 320 laser diffraction particle size analyser. The grain size was classified to fractions of clay (<2 µm), silt (<2–63 µm) and sand (>63 µm).
Before analysis of the plant materials, the samples were pulverised using a mortar and pestle. The remaining samples with harder composition were powdered using a mechanical ball mill or after treatment with liquid nitrogen. The ground samples were then weighed in tin cups. The filters used to collect POC in TSM samples, on the other hand, were exposed to HCl fumes for 4 h to remove inorganic carbon and dried at 50 ∘C overnight. Subsequently, filters were encapsulated in silver cups and stored in well plates. All plant materials and filters were analysed for OC, C : N and δ13C using the same EA-IRMS (elemental analysis isotope ratio mass spectrometer) set-up as for the sediment core samples.
2.4 Data analysis
2.4.1 OC stocks calculation
For the analysis of depth profiles of OC %, δ13C and C : N ratios, all replicate cores were analysed at 0.04 m depth intervals. As the replicate cores have varying sampling depths, depth profiles were analysed up to a maximum common depth of 0.64 m for the three replicates per location. For the determination of OC stocks, continuous depth profiles of SOC content and bulk density were first obtained by linear interpolation. The OC density (g cm−3) was then obtained by multiplying the interpolated OC (%) and bulk density (g cm−3) values. The total OC stocks (Mg OC ha−1) from each site were finally determined by summing up OC density at all depth intervals and then multiplying the values by the depth interval (cm). Compaction during sample collection was taken into account in the calculation of OC stocks.
2.4.2 Two-end-member mixing model
To identify the sources and examine the factors controlling the accumulation of OC in mangrove sediments, two end-member mixing curves were made describing the relationship between OC % and δ13C values, as well as between C : N and δ13C values. Organic carbon derived from local (autochthonous) and external (allochthonous) inputs is expected to exhibit different δ13C values. With this, two end-members, namely the δ13C ratio of the POC of the estuarine waters (allochthonous component) and of the above- and below-ground vegetation biomass (autochthonous component), were considered. The input parameter values were calculated using averages of the POC and vegetation data. The definition of these components was necessary to calculate the expected δ13C values of sediments for a given C : N or OC %. The latter calculation was done using the equations derived by Bouillon et al. (2003). First, the fraction of the bulk sediment which is of mangrove origin, Xmangrove, was calculated as follows:
where Csediment, Callocht and Cmangrove correspond to the OC content (%) of the sediment, of the allochthonous particulate organic carbon and of the autochthonous vegetation, respectively. The result obtained from the equation above was correspondingly used to calculate the fraction of OC in the sediment that is of autochthonous mangrove origin, Xmangrove C (%), as follows:
Finally, the expected δ13C of the sediment organic matter, δ13Csediment (‰), was calculated as follows:
where δ13Cmangrove (‰) and δ13Callocht (‰) correspond to the stable carbon isotopic composition of the autochthonous mangrove vegetation and allochthonous estuarine POC, respectively. For the relationship between the sediment δ13C values and C : N ratios, similar equations were derived.
2.4.3 Statistical analyses
To test whether the OC %, δ13C and C : N significantly differed between the young and old sites, paired T tests were performed. One-way analysis of variance (ANOVA) was used to test if the same parameters and the OC stocks were statistically significantly different between zones (Upstream, Intermediate, Downstream and Marine). All data were checked for normality (Shapiro–Wilk) and homogeneity of variances (Levene's test) with a level of significance of p<0.05. Appropriate transformations (log and Box–Cox) were performed for data that were not normally distributed, and corresponding non-parametric tests (Mann–Whitney and Kruskal–Wallis) were employed for data that remained non-normal after transformations. The data were analysed using R programming (R Core Team, 2017).
3.1 Sediment organic carbon (SOC) depth profiles
The SOC contents of the sampled mangrove sediments varied considerably from 1.10 % to 7.80 % (Fig. 2). The SOC contents of the old mangrove sites were significantly higher than for the young counterparts (Upstream: T test, T(5)=4.76; p<0.005; Intermediate: T test, T(5)=11.68; p<0.05; Downstream: T test, T(5)=12.01; p<0.005) (Fig. 2 and Table S2). On the other hand, the SOC contents of the young and old sites in the Marine zone were not significantly different (T test, T(5)=2.59; p>0.05). A general pattern of increasing SOC content was observed from Upstream to Downstream sites, and the values were found to significantly differ between these sites (Kruskal–Wallis, chi-square = 68.29; p<0.001) (Fig. 2 and Table S2). The SOC content for each site showed a relatively uniform distribution over depth (Fig. 2), with some minor variations with depth for certain sites (Intermediate Old, Downstream Old and Marine sites).
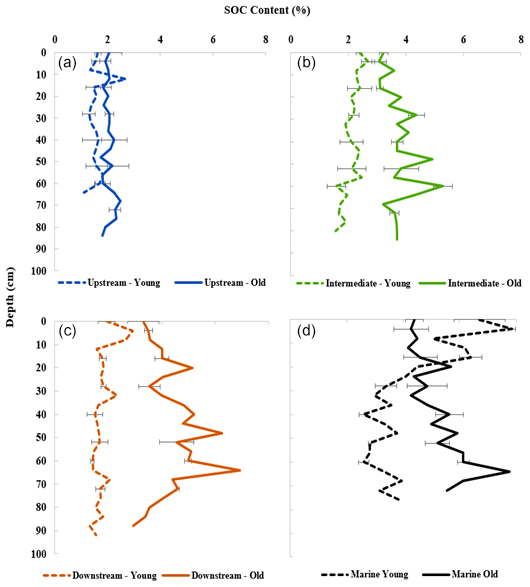
Figure 2Depth profiles of SOC content (%) for all sites. (a) Upstream zone. (b) Intermediate zone. (c) Downstream zone. (d) Marine zone. Data points show the average OC % of sediment samples from three replicate cores per site, and error bars for specific points represent the standard deviation.
3.2 Inventories of sediment organic carbon stocks
A direct comparison between sites was done after calculating the SOC stocks down to the maximum common depth of 0.64 m, showing SOC stocks varying between 46.6 ± 0.3 and 98.3 ± 1.9 Mg C ha−1 (Fig. 3 and Table S3 and Fig. S1). First, the SOC stocks were significantly higher at old sites as compared to young sites (T test, T(5)=2.80; p<0.005). Secondly, the SOC stocks were found to significantly increase (ANOVA, F6, 14 = 12.39; p<0.001) from upstream to downstream, at least for the old sites (Fig. 3 and Table S2). The young and old sites of the Marine zone had SOC stocks (97.74 ± 1.52 and 92.7 ± 0.93 Mg C ha−1, respectively) that are comparable to the Intermediate and Downstream old mangrove sites.
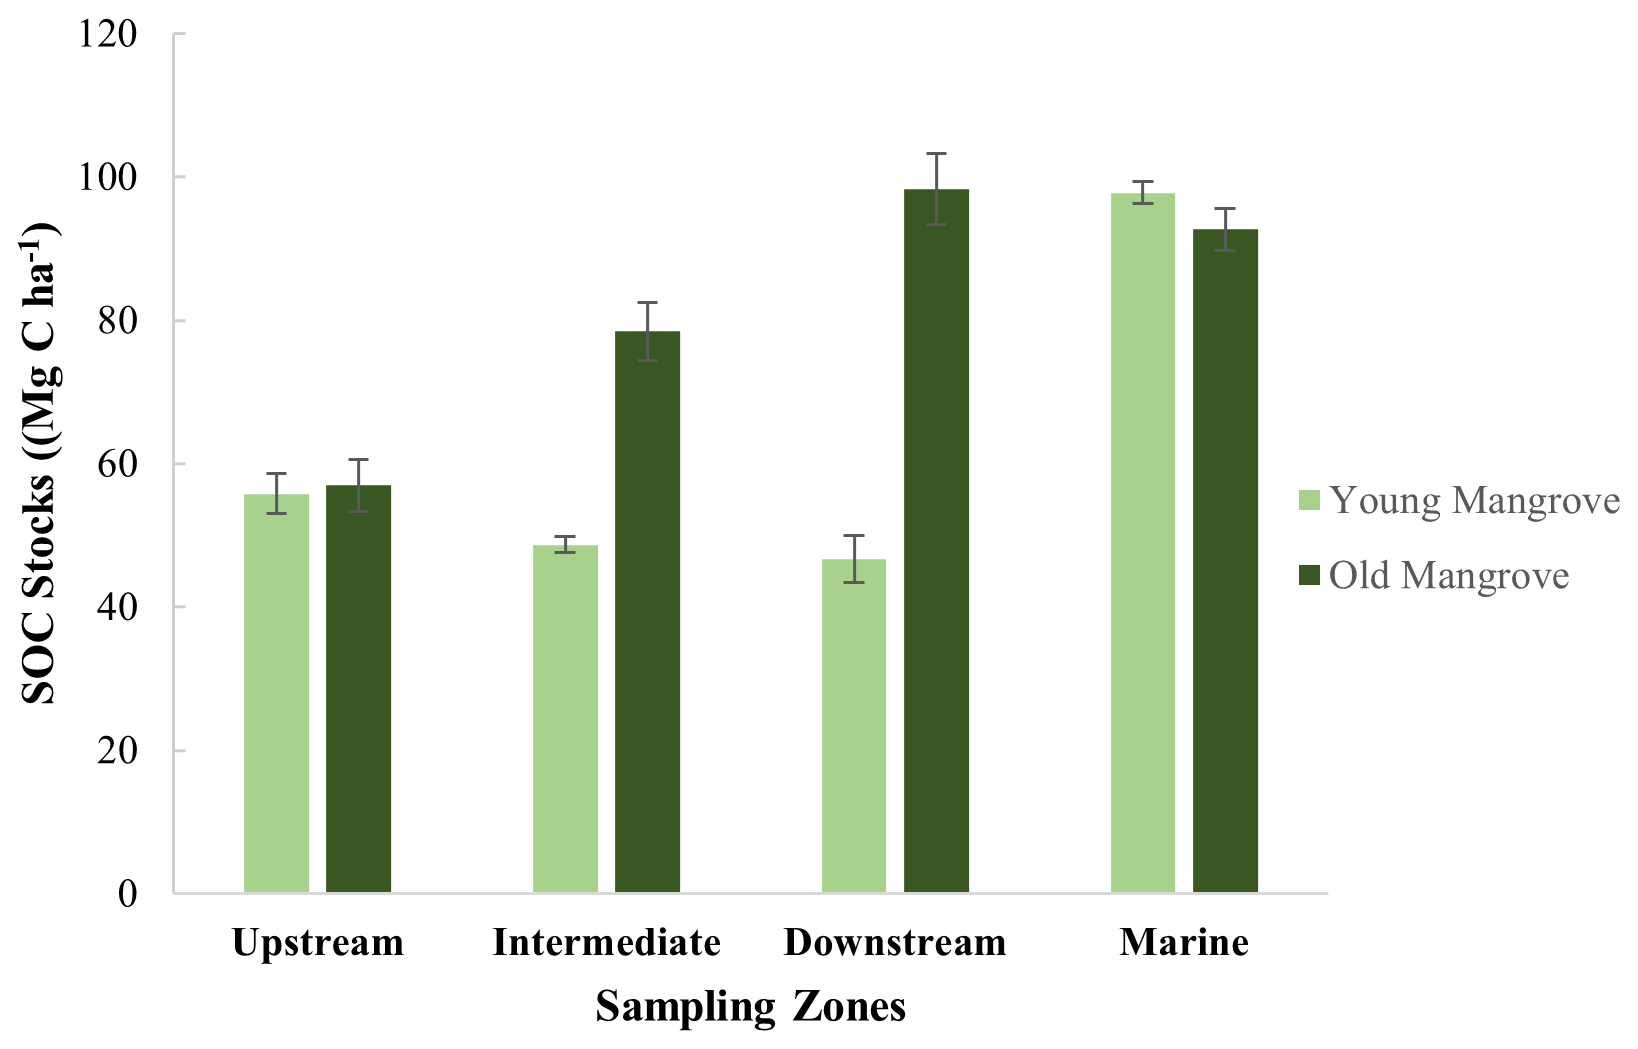
Figure 3Total sediment organic carbon (SOC) stocks (Mg C ha−1) for the upper 0.64 m of the vertical sampling profiles. Standard deviation was calculated based on the SOC stocks of three replicate cores per site.
3.3 Stable carbon isotope ratios in sediments and potential sources
Figure 4a–d show the δ13C values of SOC along the sediment depth profiles, together with the δ13C values of the above- and below-ground vegetation and POC of the adjacent water bodies. The sediment δ13C values of the sediment cores are 6 ‰–10 ‰ higher relative to the vegetation of the sites (Tables S2, S4 and S8) and varied between −28.1 ‰ and −24.4 ‰. In contrast, the average δ13C values of the POC of the adjacent water bodies (circles) in the Upstream, Intermediate and Downstream sites were found to correspond closer to the sediment δ13C values, with the δ13C value of sedimentary OC being lower compared to values for riverine POC (Table S5). Furthermore, δ13C values of the older sites (at the Intermediate, Downstream and Marine sites) are more negative than the younger sites (Fig. 4, Table S2 and Fig. S2). A comparison between the young and old sites revealed that these differences were statistically significant at the Upstream, Intermediate and Downstream zones (T test, T(5)=2.78, T(5)=41.25, and T(5)=89.48; p<0.005, respectively). A generally homogeneous pattern of δ13C values with depth was observed in all the sites, except the Upstream old site (Fig. 4a–d).

Figure 4Depth profiles of δ13C of sediment cores and δ13C of autochthonous above- and below-ground vegetation (triangles) and allochthonous POC (circles) of adjacent water bodies for the sites (values are provided in Tables S2, S4 and S5). (a) Upstream zone. (b) Intermediate zone. (c) Downstream zone. (d) Marine zone. Average POC data in dry and wet seasons (both high and low tides) were used. POC data are considered representative for the water flooding both the adjacent young and old sites in each zone. Vegetation data represent average values for roots, sun-shaded and sun-exposed green leaves, senescent leaves, leaf litter, live twigs, and branches per young and old site in each zone. No data on POC and vegetation were obtained for the Marine site. Error bars represent the standard deviation of sediment subsamples taken at 0.04 m depth increments for the three replicate cores and eight types of vegetation samples (see Sect. 2.2.) taken per site and eight POC samples taken per sampling zone.
3.4 Two-end-member mixing model
The δ13C was plotted against the elemental ratios (C : N) and SOC content (%) of the sediments from all sites (Fig. 5a and b). Figure 5a shows a negative correlation () between the δ13C values and the SOC content of the sediment samples. An inverse relationship () was also observed between C : N ratios and δ13C values (Fig. 5b). The SOC content and C : N of the POC from the suspended particulate matter of the adjacent estuarine waters were particularly low (1.45 %–3.24 % and 7.3–9.5, respectively) and corresponded to less negative δ13C values (−25.1 ‰ to −27.2 ‰). On the other hand, the SOC content and C : N of the vegetation samples were found to be higher (26.5 %–47.6 % and 27.1–47.2, respectively) and were matched with lower δ13C values (−33.7 ‰ to −29.0 ‰).
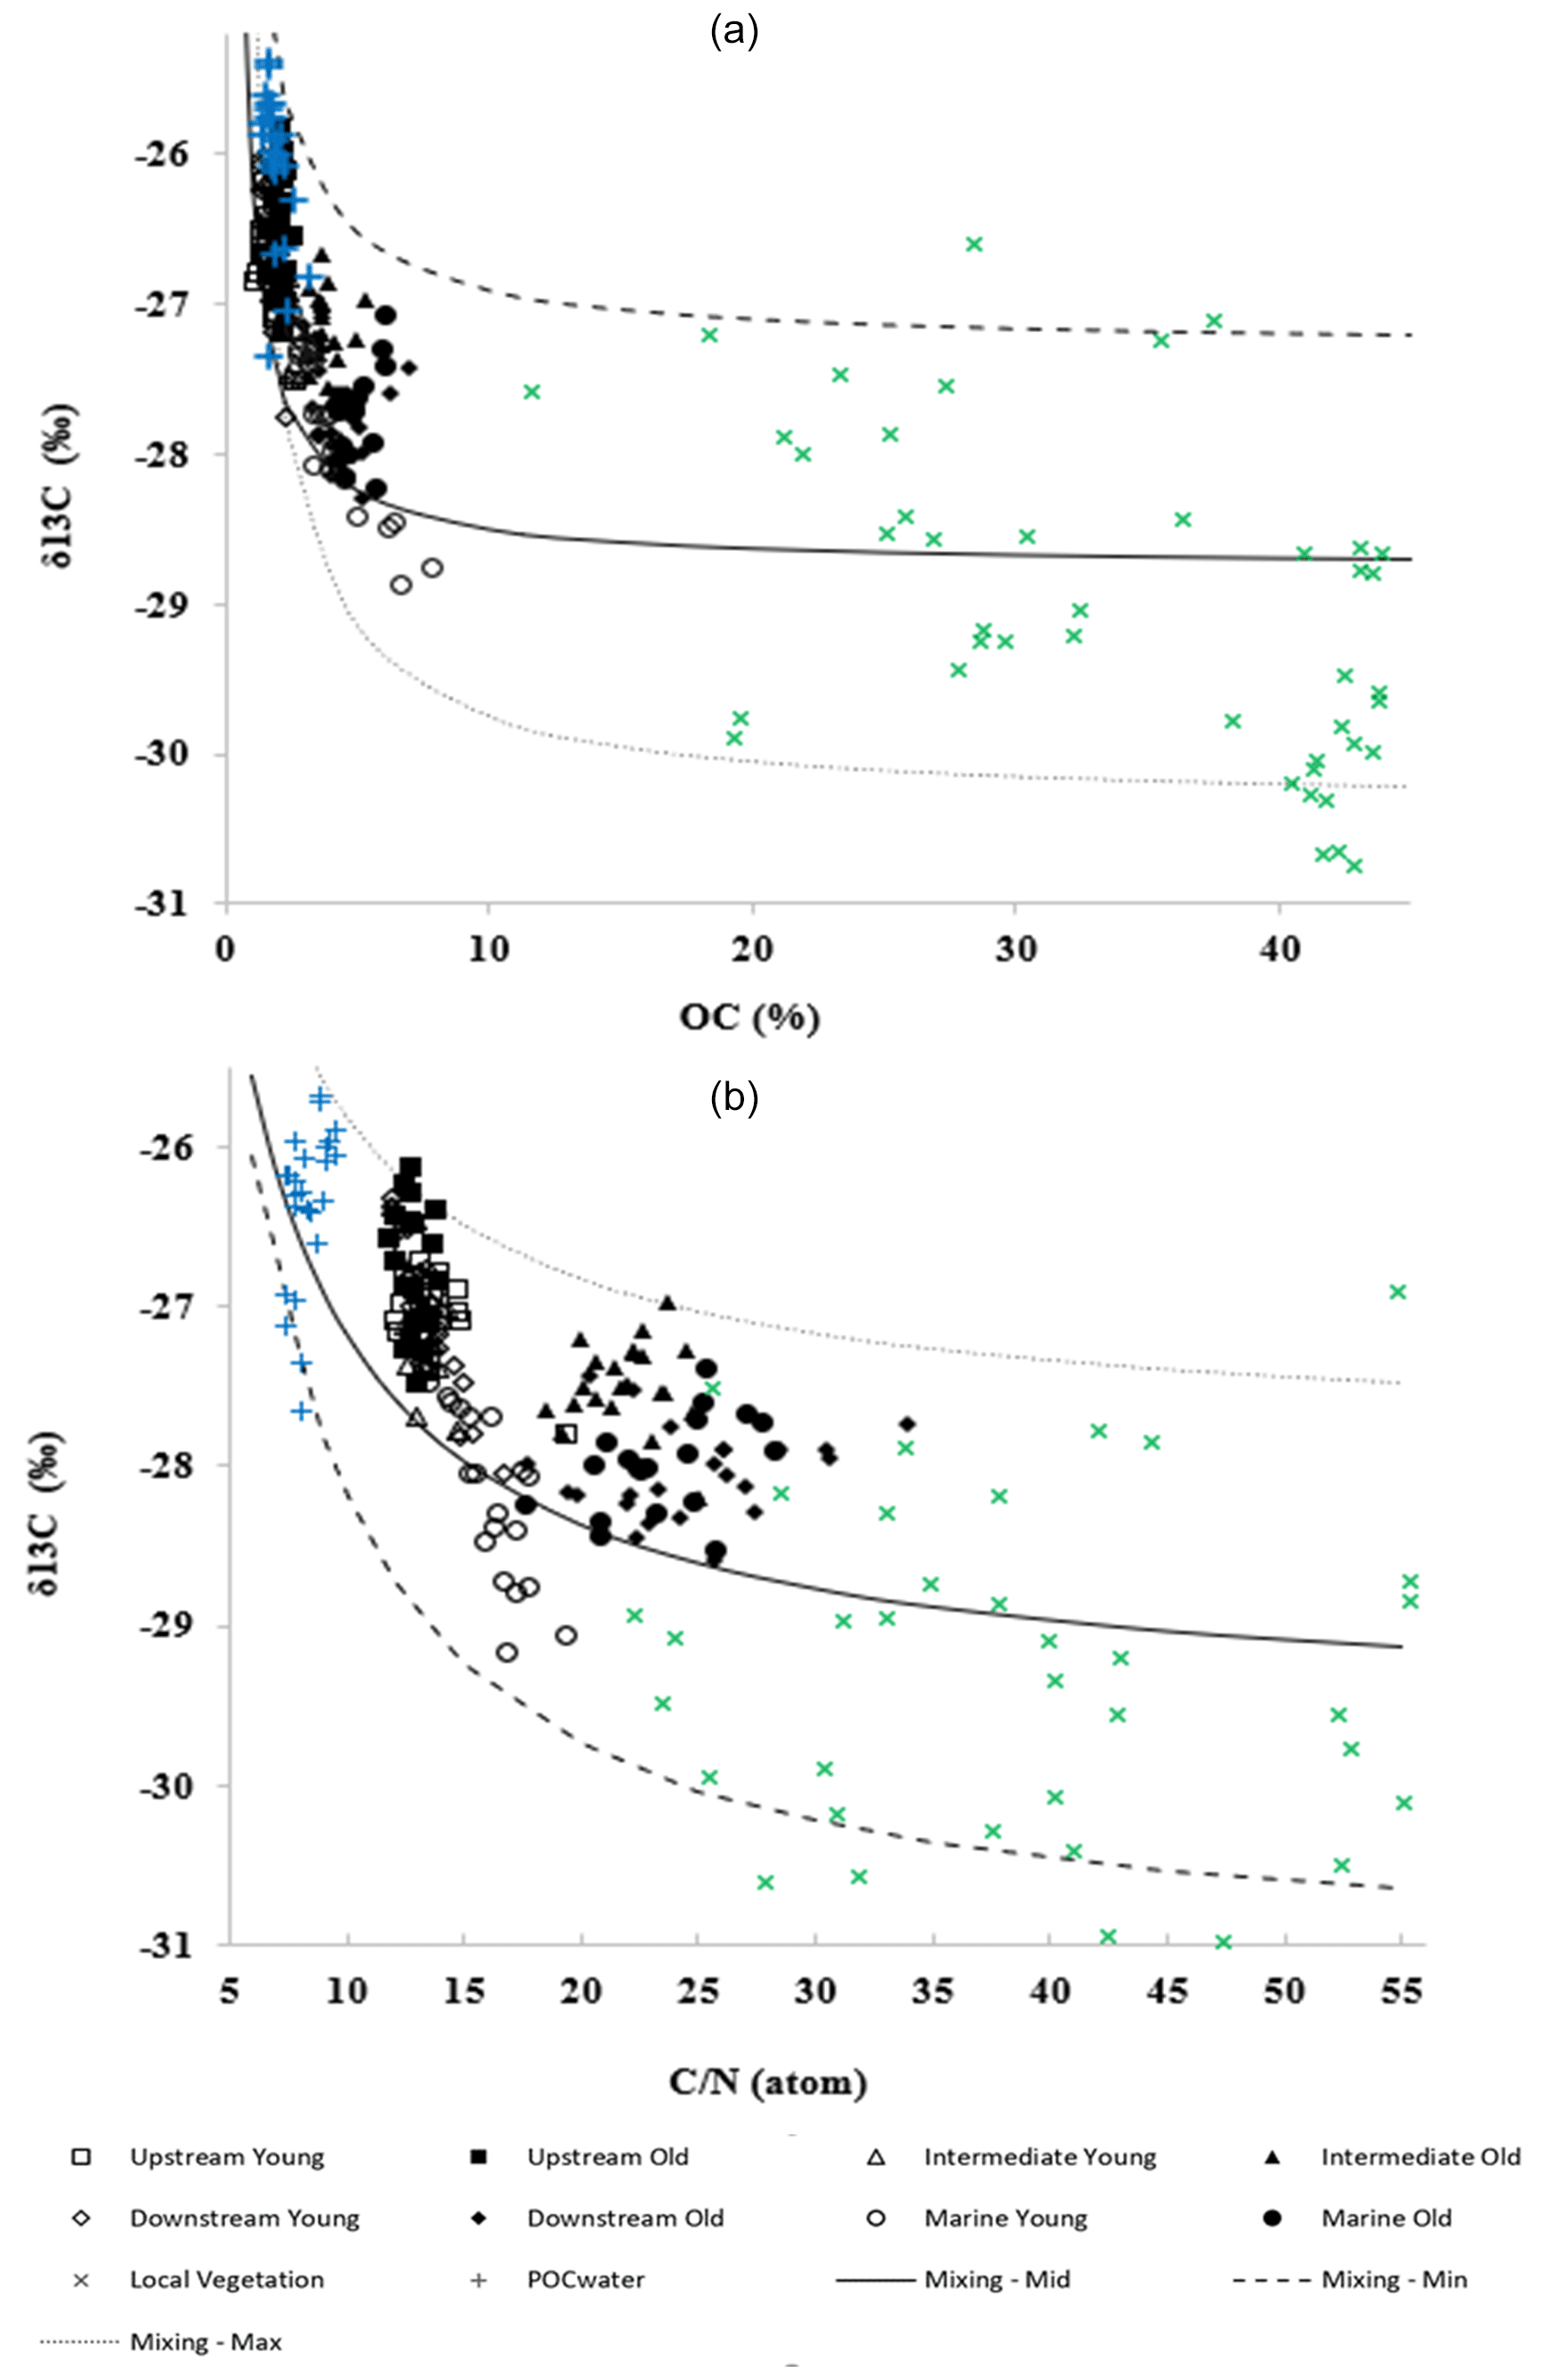
Figure 5(a) Stable carbon isotope ratios δ13C (‰) versus SOC content (%) and (b) δ13C (‰) values versus C : N (atom) ratios of all sampled sites. Different curves correspond to different end-member values for the sources (see text for details).
Mixing model curves were calculated then from the data (Fig. 5). The average mixing curves (referred to as “mixing mid” in Fig. 5a and b) were obtained using the average observed POC and vegetation data as input values for the model parameters in Eqs. (1)–(3). To account for the uncertainty of the parameter values, they were also varied to obtain minimum and maximum mixing curves (“mixing min” and “mixing max” in Fig. 6a and b). After checking the degree of sensitivity of the resulting mixing curves to the variations in input values, a slight variation in values was applied (δ13Callocht between −27.0 ‰ and −25.2 ‰, δ13Cmangrove between −33.0 ‰ and −27 ‰, OCsediment between 0.6 % and 1.5 %, C : Nmangrove between 42 and 60), resulting in the minimum and maximum mixing curves in Fig. 5a and b.
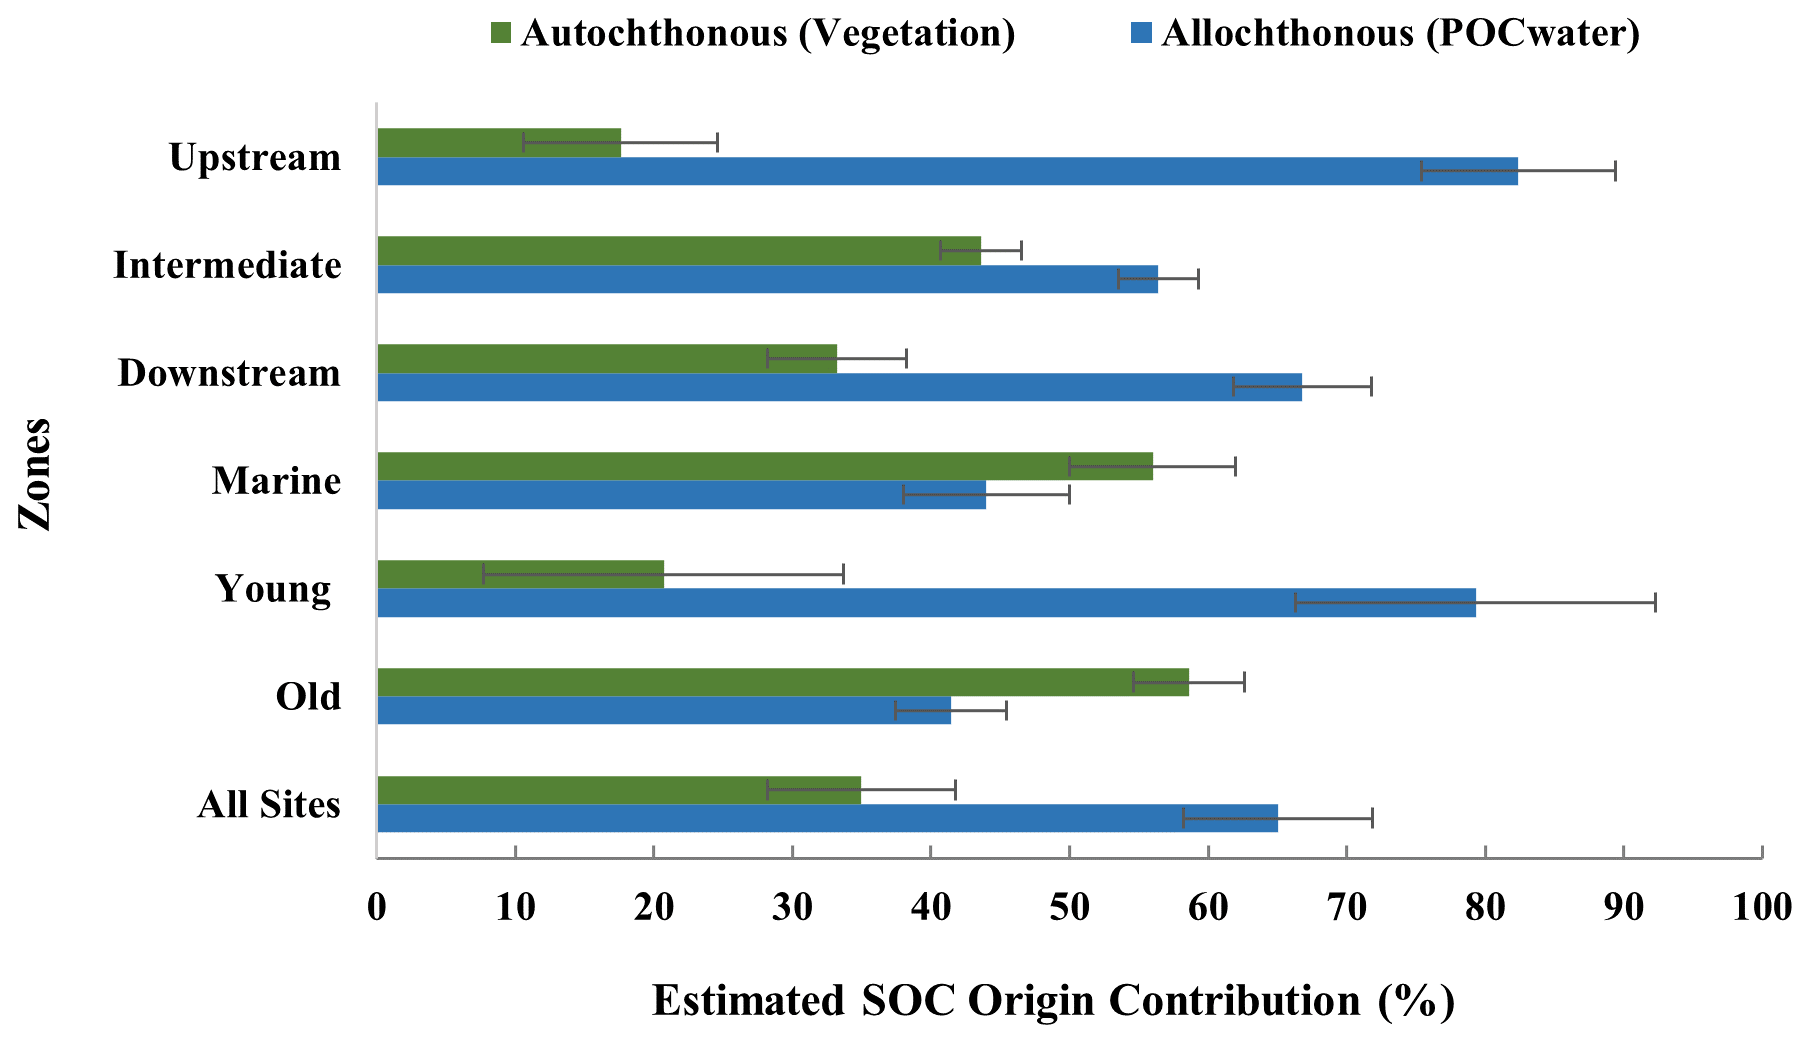
Figure 6Estimated contribution (%) of allochthonous and autochthonous origins to the SOC of the study sites. Averages and standard deviations were calculated from three replicate cores per site.
To account for the variability in the δ13C values of the different above- and below-ground plant materials (roots, leaves, branches, live, senescent and surface litter; see Supplement Table S8) used as the vegetation end-member, a one-factor-at-a-time (OAT) sensitivity analysis was performed, and no significant changes in the mixing model results after linear regression were observed (Figs. S4, S5, S6 and S7). Overall the obtained mixing curves encompass the observed data reasonably well.
3.5 Stable carbon isotope ratios in sediments and potential sources
Estimations of the relative contribution (%) of allochthonous and autochthonous origin to the SOC (Fig. 6, see Table S4 and S8 for specific values of all sites) show that overall, the sampled mangrove sediments predominantly contain externally supplied allochthonous carbon (estimated at 65 %) rather than locally produced autochthonous carbon. Younger sites also have more allochthonous carbon (79 ± 17 %), whereas older sites have slightly more autochthonous carbon (59 ± 8 %) stored in the sediments. While the contribution of allochthonous carbon was consistently higher for all sites, a general pattern of increasing contribution of autochthonous carbon from the Upstream to the Downstream and Marine zones was observed (Fig. 6).
Despite widespread recognition of mangroves as key ecosystems for climate change mitigation through C capture and storage (Mcleod et al., 2011; Pendleton et al., 2012; Siikamäki et al., 2012; Murdiyarso et al., 2015), relatively limited knowledge is available on the variability in amounts and sources of sediment organic carbon in relation to environmental gradients within a system, such as mangrove age and position along an estuarine land-to-sea gradient. Our study on the Guayas delta (Ecuador) shows that SOC stocks and contents at old sites increase from river-dominated to marine-dominated sites and are generally lower in young sites as compared to old sites. Across all sites, increasing SOC contents are associated with decreasing δ13C and increasing C : N ratios. This suggests that the sources of SOC are predominantly of allochthonous origin for younger sites (on average 79 %), while for older sites there is a slight dominance of autochthonous SOC origin (on average 59 %). In the following section we explore potential mechanisms and hypotheses that may explain these observations, and we discuss implications for managing mangroves for carbon capture and storage.
4.1 SOC variability between young and old mangrove sites
The majority of the old mangrove sites along the Guayas Delta had a significantly higher SOC stock and content than the young sites (Figs. 2 and 3). As a first potential explanation, we hypothesise this is due to a SOC “dilution effect” that is, as explained below, related to differences in suspended sediment accretion rates between old and young mangrove sites. Several authors (Pethick, 1981; Allen, 1990; French, 1993; Temmerman et al., 2003; Kirwan et al., 2016) have shown that more recently formed (young) tidal marshes experience higher sediment accretion rates than their older counterparts. This is because new (young) marsh formation, through the establishment of pioneer vegetation on initially unvegetated intertidal flats, starts at a lower elevation relative to mean sea level as compared to the higher elevation of established old marshes. Hence younger, lower-elevation marshes are subject to a higher tidal inundation frequency, depth and duration and therefore a higher rate of suspended sediment supply and deposition. Applying this analogy to mangroves, it is therefore reasonable to assume that the sampled sediment profiles in our young mangrove sites (formed after 1984 by mangrove establishment on originally unvegetated intertidal flats) have accreted at higher rates than at the adjacent old mangrove sites (already established, based on analysis of remote sensing images, at least before 1984). We expect that the higher volume of tidally supplied sediment input in young sites largely consists of mineral suspended sediments that are relatively low in POC content (Duarte et al., 2005; Saintilan et al., 2013; Alongi, 2014). This is confirmed by our SPM samples, which showed a low POC content of 1.45 %–3.24 %. Higher suspended sediment accretion rates on young mangroves would result then in a “dilution effect” of the locally produced mangrove organic matter which typically has higher OC content. In line with our findings, other studies have also suggested that the OC stock in mangrove sediments increases linearly with the mangrove forest age as autochthonous C significantly increased in older compared to younger forests (Lovelock et al., 2010; Marchand, 2017).
Additionally, the higher frequency and duration of tidal inundation in the lower-elevated young mangrove sites is expected to promote more tidal currents that could cause export of POC from macroscopic origin (litter of leaves, twigs and barks) that could otherwise have been buried in the system. Furthermore, older mangrove sites generally have a denser tree canopy and root structure than young mangrove sites, which was shown by Alongi (2012) to hinder tidal export of litter from the forest sediment surface. It has also been proposed that the sediments of younger mangroves, with lower surface elevations and more frequent tidal inundations, are more often in less reducing conditions due to daily renewal of electron acceptors (e.g. manganese and iron) with tides and oxygen diffusion by the Avicennia root systems (Marchand et al., 2004, 2006). These conditions may have also contributed to a faster rate of SOC decomposition in young sites as compared to more prevalent anoxic conditions in older mangrove stands, which may lead to a higher degree of SOC preservation and thus higher SOC stock in older mangrove sediments.
For all the young sites and Upstream old site, where SOC stocks are lower than the other old sites, the autochthonous contribution of local vegetation to the SOC was estimated to be very low (i.e. 20.7 ± 13 % of the SOC). The allochthonous OC coming from the water column as suspended matter can be considered as the main source of OC found in sediments of these sites. This is supported by the less negative δ13C values of the SOC in these areas that ranged between −27.5 ‰ and −24.4 ‰ (Fig. 4A-D) and lower C : N ratios of 11.5–14.9 (Table S2) compared to the other older sites. Generally lower C : N ratios and higher freshwater input of organic matter could indicate faster decomposition, hence resulting in lower SOC contents and stocks (Leopold et al., 2015). Therefore, our data suggest that the majority of the SOC in these sites is not produced from newly fixed CO2 by the local mangrove vegetation but rather from tidal deposition of material originating from terrestrial, marine or estuarine reservoirs. We observed comparable SOC stocks and contents at the young and old sites of the Upstream zone, as opposed to the lower SOC stocks in young sites compared to old sites of the Intermediate and Downstream zones. This may be to some extent attributed to differences in the successional stages of the vegetation in these different sites: in the Intermediate and Downstream zones (with higher salinity), the young sites are dominated by smaller trees of Avicennia germinans (known as an earlier successional species), and the old sites are comprised of high stands of Rhizophora mangle (known as a later successional species), while in the Upstream zone (with lower salinity), the vegetation was similar in old and young sites, with mixtures of both Avicennia and Rhizophora and an understory of freshwater marsh species. Hence this may suggest that young and old sites in the Upstream zone are in a similar vegetation successional stage and therefore may have reached similar SOC stock levels, while in the Intermediate and Downstream zones, the young sites are in an earlier successional stage, in which the SOC has reached lower levels as compared to the nearby old sites.
Furthermore, the old mangrove sites of the Intermediate, Downstream and Marine sites have lower δ13C values (−28.1 ‰ to −26.5 ‰) and higher C : N ratios (17.7–33.9) compared to the young sites and the Upstream old site. In these sites, it is estimated that more than half (59 ± 8 %) of the SOC is of autochthonous origin, indicating that a significant portion of locally produced organic matter is preserved in these areas. Other mangrove forests where δ13C and C : N values of sediments closely match those of the mangrove roots and above-ground vegetation also reported a similar portion of mangrove-derived SOC of 58 % (Kristensen et al., 2008). This relatively higher contribution of locally produced carbon to the mangrove SOC could explain why these sites have higher SOC contents and stocks than the young mangrove sites as the OC content in organic material derived from mangrove vegetation is normally higher than that of the suspended sediments (Fig. 5a).
Finally, it is important to note the comparable SOC stocks and contents of the young and old sites of the Marine zone. This is clearly due to the high SOC content in the upper 0.20 m of the younger sites which compensates for the lower SOC content deeper than 0.20 m and which results in similar depth-averaged SOC content as in the older sites (Fig. 2). Analyses of the cores showed that a high amount of macroscopic vegetation remains were found in the upper 0.20 m of the young Marine site cores.
4.2 SOC variability along the estuarine land-to-sea gradient
We observed SOC contents and stocks to generally increase from zones with low to high salinity (Figs. 2 and 3). Similar patterns were found in river-influenced estuarine mangrove forests in the Ganges–Brahmaputra Delta in the Indian Sundarbans (Donato et al., 2011), the Pichavaram mangrove forest in southeast India (Ranjan et al., 2011) and the Mui Ca Mau National Park in the Mekong Delta, Vietnam (Tue et al., 2014). A potential reason could be the higher input of riverine mineral-rich sediments in the more upstream locations of the delta, resulting in higher mineral sediment accretion rates in the lower salinity zones, as well as diluting the organic matter content in the mangrove sediments. In addition, we found a strong positive correlation (Pearson's r=0.96) between the SOC content and C : N ratios (see Figs. S3 and S4) of the mangrove sediments. This may suggest that the higher N contents in the more upstream and younger sites may contribute to higher mineral-associated carbon and hence lower SOC contents and stocks.
From Upstream to Downstream, the mangrove sediment δ13C values closely match those of the POC from the estuarine waters, while δ13C values of the local vegetation biomass differ significantly from the sediment δ13C values (Figs. 4a–d, 5a and b). This suggests that the SOC in the studied mangroves along the land-to-sea gradient mainly consists of allochthonous sources (estimated at 65 ± 22 %), while preservation of locally produced autochthonous OC into SOC is limited. Fairly similar ranges of δ13C (−29.5 ‰ to −23.9 ‰) and C : N (9–26.6) were obtained in the estuarine mangrove of Segara Anakan lagoon in southern Java, Indonesia (Kusumaningtyas et al., 2019; Jennerjahn, 2021), where the majority of the organic matter in the mangrove sediment was also concluded to be externally derived. Additionally, a study of Weiss et al. (2016) in the Berau estuary in eastern Kalimantan, Indonesia, also found silt loam sediments (similar to the sediment texture found in the Guayas mangroves, Table S6) mainly composed of externally derived OC which had a bulk density (0.4–0.7 g cm−3) and δ13C values (−29.5 ‰ to −25.6 ‰) close to those found in our study (see Table S2).
A potential explanation for this observed predominance of externally derived SOC is the tidal range and the quality of the allochthonous and autochthonous organic matter that comes in the Guayas mangrove ecosystems. A study of the contribution of both internal and external inputs of OC in marsh sediments in the Scheldt Estuary, in the Netherlands and Belgium (Van de Broek et al., 2016, 2018), proposed that the burial efficiencies of the different sources of POC are related to their decomposability. For this study area, they suggest that allochthonous POC is composed largely of terrestrial, recalcitrant POC. Consequently, allochthonous POC is expected to decompose relatively slower after burial and remain in sediments for a longer time. In contrast, they argue that the autochthonous POC, derived from local vegetation, is fresh and labile and thus expected to decompose more rapidly than allochthonous recalcitrant POC. Such a difference in the quality of OC sources may potentially explain why there is a lower contribution of autochthonous OC in mangrove sediments of our study sites. As the Guayas system has a high tidal range of 3–5 m, this specific environmental condition may allow better drainage of the mangrove sediments during low tides, enabling deeper aeration of sediment profiles and hence resulting in higher decomposition rates and less preservation of more labile OC from the local vegetation. In addition, we could visually observe that our study site is heavily bioturbated by red crabs (Ucides occidentalis) which may aerate the soil, potentially leading to less preservation of autochthonous organic matter.
4.3 Downcore variations of organic matter composition
In general, the individual SOC content, δ13C and C : N depth profiles (Figs. 2 and 4 and S2 and S3) of each site are relatively uniform. This can be potentially explained by the bioturbation effect of red crabs that were abundantly present in the mangrove sampling areas (visible as burrowing holes and small mounds of burrowed material on top of the sediment surface). The active digging and maintenance of burrows by crabs, to escape from predation and from extreme environmental settings (Kristensen, 2007), may be expected to mix the upper column of the mangrove sediments, making the profile almost vertically homogenous.
The old mangrove sites in the Intermediate, Downstream and Marine zones showed a limited but gradual increase in SOC content (Fig. 2b–d) from the top layer down to 60 cm, which is accompanied by downcore increases in OC density (Fig. S2). According to Kusumaningtyas et al. (2019), such pattern may be an indication of the predominance of autochthonous mangrove organic matter in sediments originating from below-ground OC input (i.e. root material). The fact that we find such a pattern in old sites, and not in young ones, could further support the finding of a higher contribution of autochthonous sources to SOC in our old mangrove sites.
4.4 Implications for the management of mangrove forests as carbon sinks
This study estimates that large fractions of the mangrove SOC come from allochthonous sources which are originating from CO2 that has been sequestered in other ecosystems (terrestrial, estuarine and/or marine) and transported and deposited in the mangroves. Additionally, these could also be old-aged carbon, already sequestered for a significant amount of time (Van de Broek et al., 2018). This would imply that contemporary carbon capture by the mangrove ecosystem itself contributes only partly and relatively little to long-term SOC storage. This finding is particularly relevant for budgeting the potential of mangrove ecosystems to mitigate climate change under nature-based mitigation programmes such as Payments for Ecosystem Services (PES) and Reducing Emissions from Deforestation and Forest Degradation (REDD+; Yee, 2010; Locatelli et al., 2014). As a consequence, relying on estimates of total SOC stocks in mangroves may seriously overestimate the contribution of mangroves to contemporary CO2 sequestration by the mangrove ecosystem itself.
We found that older mangroves store larger amounts of SOC than younger mangroves. This may suggest the importance of conservation of especially old-growth mangroves, and, while measures to promote the formation of new young mangroves are still useful, it may provide less carbon storage in the short-term as compared to old mangroves. How long it takes before young mangroves reach SOC contents and stocks similar to old mangroves remains unknown. However, it is important to mention that sediment accretion rates may be higher on young than old mangroves, for reasons discussed above (see Sect. 4.1), which could partly compensate for the lower SOC contents of young mangroves, and therefore SOC accumulation rates may be more similar between young and old mangroves.
Our results also show that SOC contents and stocks in old mangroves increase from river- to marine-dominated sites. This suggests that conservation and expansion of mangroves in the marine-dominated part of estuaries may be most effective for carbon storage policies. However, sediment accretion rates may be higher in river-dominated sites which could lead to similar SOC accumulation rates as marine-dominated sites. Hence further research on linking sediment accretion and SOC accumulation rates, which were not measured in this study, is imperative to shed light on these uncertainties.
Our findings show strong indications that the age of the mangrove stand as well as its position along the land-to-sea gradient play a vital role in the amount and sources of carbon stored in the mangrove sediments in the Guayas delta (Ecuador). Young mangroves are found to have lower SOC contents and stocks than old mangroves. This may be potentially due to higher mineral-rich sediment inputs to initially lower-elevated, younger mangroves which dilute the SOC content in the mangrove sediments. A pattern of increasing SOC stocks (and corresponding SOC content) from river- to marine-dominated sites was also found, which may be attributed to a similar dilution effect, in which higher riverine mineral-rich sediment inputs lead to lower SOC contents at more river-dominated, lower-salinity sites. Based on δ13C values and elemental C : N ratios, we identified that the SOC of the young mangrove sites is predominantly of allochthonous composition (79 ± 13 %), whereas the old sites had only a slight dominance of autochthonous SOC (59 ± 8 %). Finally, our study highlights that only a portion of the SOC stored in mangrove ecosystems is originating from contemporary CO2 sequestration by the ecosystem itself, which is particularly relevant to consider when designing and valuing nature-based climate mitigation programmes based on mangrove reforestation.
Dataset and codes associated with this paper can be digitally accessed with the following https://doi.org/10.17632/fv8sx6kfzf (Suello, 2022).
The supplement related to this article is available online at: https://doi.org/10.5194/bg-19-1571-2022-supplement.
The project was designed by JPB, ST, SB, LDG and RHS. The manuscript was prepared by RHS and ST with contributions from SB, MVdB, LDG, JPB and GG. The samples were collected by SLH, JPB, AMRM, JRV, KPR, ST and RHS. The samples were analysed by RHS with preparation assistance by SB and JRV. RHS analysed the data with assistance from ST, JPB, MVdB and SB.
The contact author has declared that neither they nor their co-authors have any competing interests.
Publisher’s note: Copernicus Publications remains neutral with regard to jurisdictional claims in published maps and institutional affiliations.
The authors would like to thank Lore Fondu and Yannick Stroobandt of the Department of Earth and Environmental Sciences of Katholieke Universiteit Leuven for helping in the analysis of samples. We also thank Ignace Pelckmans of the ECOSPHERE of University of Antwerp with the invaluable contribution in the remote sensing analysis. Additionally, we appreciate the insightful comments of the reviewers and editors.
This research has been supported by the Fonds Wetenschappelijk Onderzoek – Vlaanderen (FWO, Research Foundation Flanders, PhD (FWO R.H.S. (grant no. 1168520N) and FWO project (grant no. G060018N)), the Vlaamse Interuniversitaire Raad – Universitaire Ontwikkelingssamenwerking (VLIR-UOS) and the ActUA Prijs – University of Antwerp.
This paper was edited by Aninda Mazumdar and reviewed by Peter Mueller, G. N Nayak, and one anonymous referee.
Abril, G., Nogueira, M., Etcheber, H., Cabeçadas, G., Lemaire, E., and Brogueira, M. J : Behaviour of organic carbon in nine contrasting European estuaries, Estuar. Coast. Shelf Sci., 54, 241–262, https://doi.org/10.1007/s10533-004-3362-1, 2011.
Adame, M. F., Santini, N. S., Tovilla, C., Vázquez-Lule, A., Castro, L., and Guevara, M.: Carbon stocks and soil sequestration rates of tropical riverine wetlands, Biogeosciences, 12, 3805–3818, https://doi.org/10.5194/bg-12-3805-2015, 2015.
Allen, J. R. L.: Salt-marsh growth and stratification: a numerical model with special reference to the Severn Estuary, southwest Britain, Mar. Geol., 95, 77–96, https://doi.org/10.1016/0025-3227(90)90042-I, 1990.
Alongi, D. M.: Carbon sequestration in mangrove forests, Carbon Manag., 3, 313–322, https://doi.org/10.4155/cmt.12.20, 2012.
Alongi, D. M.: Carbon cycling and storage in mangrove forests, Ann. Rev. Mar. Sci., 6, 195–219, https://doi.org/10.1146/annurev-marine-010213-135020, 2014.
Arreaga Vargas, P: Análisis del comportamiento de la salinidad (intrusión salina) en el sistema Río Guayas Canal de Jambelí como parte del cambio climático, Vol. 10, Acta Oceanografico del Pacifco, 2000.
Atwood, T. B., Connolly, R. M., Almahasheer, H., Carnell, P. E., Duarte, C. M., Lewis, C. J. E., Irigoien, X., Kelleway, J.J., Lavery, P. S., Macreadie, P. I., Serrano, O., Sanders, C. J., Santos, I., Andrew, D. L., and Lovelock C. E.: Global patterns in mangrove soil carbon stocks and losses, Nat. Clim. Change, 7, 523–528, https://doi.org/10.4236/as.2015.63031, 2017.
Barr, J. G., Engel, V., Fuentes, J. D., Zieman, J. C., O'Halloran, T. L., Smith, T. J., and Anderson, G. H.: Controls on mangrove forest-atmosphere carbon dioxide exchanges in western Everglades National Park, J. Geophys. Res.-Biogeo., 115, G02020, https://doi.org/10.1029/2009JG001186, 2010.
Borges, A. V. and Abril, G.: Carbon Dioxide and Methane Dynamics in Estuaries, in: Treatise on Estuarine and Coastal Science, edited by: Wolanski, E. and McLusky, D. S., Vol. 5, Academic Press, Waltham, 119–161, https://doi.org/10.1007/s00027-018-0617-9, 2011
Bouillon, S., Borges, A. V., Castañeda-Moya, E., Diele, K., Dittmar, T., Duke, N. C., Kristensen, E., Lee, S., Marchand, C., Middelburg, J. J., Rivera-Monroy, V. H, Smith, T., and Twilley, R. R.: Mangrove production and carbon sinks: a revision of global budget estimates, Global Biogeochem. Cy., 22, GB2013, https://doi.org/10.1029/2007GB003052, 2008.
Burkett, V. and Kusler, J.: Climate change: potential impacts and interactions in wetlands of the untted states 1, J. Am. Water Resour. As., 36, 313–320, https://doi.org/10.1111/j.1752-1688.2000.tb04270.x, 2000.
Cifuentes, L. A., Coffin, R. B., Solorzano, L., Cardenas, W., Espinoza, J., and Twilley, R. R.: Isotopic and elemental variations of carbon and nitrogen in a mangrove estuary, Estuar. Coast. Shelf Sci., 43, 781–800, https://doi.org/10.1006/ecss.1996.0103, 1996.
Craft, C.: Freshwater input structures soil properties, vertical accretion, and nutrient accumulation of Georgia and US tidal marshes, Limnol. Oceanogr., 52, 1220–1230, https://doi.org/10.4319/lo.2007.52.3.1220, 2007.
Cucalón, E.: Oceanographic characteristics off the coast of Ecuador, A sustainable shrimp mariculture industry for Ecuador, University of Rhode Island, Narragansett, RI, Coastal Resources Center, 1989.
Donato, D. C., Kauffman, J. B., Murdiyarso, D., Kurnianto, S., Stidham, M., and Kanninen, M.: Mangroves among the most carbon-rich forests in the tropics, Nat. Geosci., 4, 293–297, https://doi.org/10.1038/ngeo1123, 2011.
Duarte, C. M., Middelburg, J. J., and Caraco, N.: Major role of marine vegetation on the oceanic carbon cycle, Biogeosciences, 2, 1–8, https://doi.org/10.5194/bg-2-1-2005, 2005.
Duke, N. C., Meynecke, J. O., Dittmann, S., Ellison, A. M., and Anger, K.: A world without mangroves, Science, 317, 41–42, https://doi.org/10.1126/science.317.5834.41b, 2007.
Ezcurra, P., Ezcurra, E., Garcillán, P. P., Costa, M. T., and Aburto-Oropeza, O.: Coastal landforms and accumulation of mangrove peat increase carbon sequestration and storage, P. Natl. Acad. Sci. USA, 113, 4404–4409, https://doi.org/10.1073/pnas.1519774113, 2016.
French, J. R.: Numerical simulation of vertical marsh growth and adjustment to accelerated sea-level rise, north Norfolk, UK, Earth Surf. Proc. Land., 18, 63–81, https://doi.org/10.1002/esp.3290180105, 1993.
Hansen, K., Butzeck, C., Eschenbach, A., Gröngröft, A., Jensen, K., and Pfeiffer, E. M.: Factors influencing the organic carbon pools in tidal marsh soils of the Elbe estuary (Germany), J. Soil. Sediment., 17, 47–60, https://doi.org/10.1007/s11368-016-1500-8, 2017.
Jacotot, A., Marchand, C., and Allenbach, M.: Tidal variability of CO2 and CH4 emissions from the water column within a Rhizophora mangrove forest (New Caledonia), Sci. Total Environ., 631, 334–340, https://doi.org/10.1016/j.scitotenv.2018.03.006, 2018
Jennerjahn, T. C.: Relevance and magnitude of “Blue Carbon” storage in mangrove sediments: Carbon accumulation rates vs. stocks, sources vs. sinks, Estuar. Coast. Shelf Sci., 247, 107027, https://doi.org/10.1016/J.ECSS.2020.107027, 2020.
Jennerjahn, T. C.: Relevance of allochthonous input from an agriculture-dominated hinterland for “Blue Carbon” storage in mangrove sediments in Java, Indonesia, in: Dynamic Sedimentary Environments of Mangrove Coasts, Elsevier, 393–414, https://doi.org/10.1016/B978-0-12-816437-2.00017-3, 2021.
Kirwan, M. L., Temmerman, S., Skeehan, E. E., Guntenspergen, G. R., and Fagherazzi, S.: Overestimation of marsh vulnerability to sea level rise, Nat. Clim. Change, 6, 253–260, https://doi.org/10.1038/nclimate2909, 2016.
Kristensen, E.: Mangrove crabs as ecosystem engineers; with emphasis on sediment processes, J. Sea Res., 59, 30–43, https://doi.org/10.1016/j.seares.2007.05.004, 2007.
Kristensen, E., Bouillon, S., Dittmar, T., and Marchand, C.: Organic carbon dynamics in mangrove ecosystems: a review, Aquat. Bot., 89, 201–219, https://doi.org/10.1016/j.aquabot.2007.12.005, 2008.
Kusumaningtyas, M. A., Hutahaean, A. A., Fischer, H. W., Pérez-Mayo, M., Ransby, D., and Jennerjahn, T. C.: Variability in the organic carbon stocks, sources, and accumulation rates of Indonesian mangrove ecosystems, Estuar. Coast. Shelf Sci., 218, 310–323, https://doi.org/10.1016/j.ecss.2018.12.007, 2019.
Leopold, A., Marchand, C., Deborde, J., and Allenbach, M.: Temporal variability of CO2 fluxes at the sediment-air interface in mangroves (New Caledonia), Sci. Total Environ., 502, 617–626, https://doi.org/10.1016/j.scitotenv.2014.09.066, 2015.
Locatelli, T., Binet, T., Kairo, J. G., King, L., Madden, S., Patenaude, G., Upton, C., and Huxham, M.: Turning the tide: how blue carbon and payments for ecosystem services (PES) might help save mangrove forests, Ambio, 43, 981–995, https://doi.org/10.1007/s13280-014-0530-y, 2014.
Lovelock, C. E., Sorrell, B. K., Hancock, N., Hua, Q., and Swales, A.: Mangrove forest and soil development on a rapidly accreting shore in New Zealand, Ecosystems, 13, 437–451, https://doi.org/10.1007/s10021-010-9329-2, 2010.
Maher, D. T., Santos, I. R., Golsby-Smith, L., Gleeson, J., and Eyre, B. D.: Groundwater-derived dissolved inorganic and organic carbon exports from a mangrove tidal creek: The missing mangrove carbon sink?, Limnol.d Oceanogr., 58, 475–488, https://doi.org/10.4319/lo.2013.58.2.0475, 2013.
Marchand, C.: Soil carbon stocks and burial rates along a mangrove forest chronosequence (French Guiana), Forest Ecol. Manag., 384, 92–99, https://doi.org/10.1016/j.foreco.2016.10.030, 2017.
Marchand, C., Baltzer, F., Lallier-Vergès, E., and Albéric, P.: Pore-water chemistry in mangrove sediments: relationship with species composition and developmental stages (French Guiana), Mar. Geol., 208, 361–381, https://doi.org/10.1016/j.margeo.2004.04.015, 2004.
Marchand, C., Lallier-Vergès, E., Baltzer, F., Albéric, P., Cossa, D., and Baillif, P.: Heavy metals distribution in mangrove sediments along the mobile coastline of French Guiana, Mar. Chem., 98, 1–17, https://doi.org/10.1016/j.marchem.2005.06.001, 2006.
Mcleod, E., Chmura, G. L., Bouillon, S., Salm, R., Björk, M., Duarte, C. M., Lovelock, C., Schlesinger, W., and Silliman, B. R.: A blueprint for blue carbon: toward an improved understanding of the role of vegetated coastal habitats in sequestering CO2, Front. Ecol. Environ., 9, 552–560, https://doi.org/10.1890/110004, 2011.
Mueller, P., Ladiges, N., Jack, A., Schmiedl, G., Kutzbach, L., Jensen, K., and Nolte, S.: Assessing the long-term carbon-sequestration potential of the semi-natural salt marshes in the European Wadden Sea, Ecosphere, 10, e02556, https://doi.org/10.1002/ecs2.2556, 2019.
Murdiyarso, D., Purbopuspito, J., Kauffman, J. B., Warren, M. W., Sasmito, S. D., Donato, D. C., Manuri, S., Krisnawati, H., Taberima, S., and Kurnianto, S.: The potential of Indonesian mangrove forests for global climate change mitigation, Nat. Clim. Change, 5, 1089, https://doi.org/10.1038/nclimate2734, 2015.
Nellemann, C., Corcoran, E., Duarte, C. M., Valdes, L., De Young, C., Fonseca, L. E., and Grimsdith, G.: Blue carbon: the role of healthy oceans in binding carbon. United Nations Environment Program, GRID-Ardenal, 78, 35–44, ISBN 978-82-7701-060-1, 2009.
Pendleton, L., Donato, D. C., Murray, B. C., Crooks, S., Jenkins, W. A., Sifleet, S., Craft, C., Fourqurean, J. W., Kauffman, J. B., Marba, N., Megonigal, P., Pidgeon, E., Herr, D., Gordon, D., and Baldera, A.: Estimating global “blue carbon” emissions from conversion and degradation of vegetated coastal ecosystems, PloS One, 7, e43542, https://doi.org/10.1371/journal.pone.0043542, 2012.
Pethick, J. S.: Long-term accretion rates on tidal salt marshes, J. Sediment. Res., 51, 571–577, https://doi.org/10.1306/212F7CDE-2B24-11D7-8648000102C1865D, 1981.
Polidoro, B. A., Carpenter, K. E., Collins, L., Duke, N. C., Ellison, A. M., Ellison, J. C., Farnsworth, E. J., Fernando, E. S., Kathiresan, K., Koedam, N. E., Livingstone, S. R., Miyagi, T., Moore, G. E., Nam, V. N., Ong, J. E., Primavera, J. H., Salmo, S. G., Sanciangco, J. C., Sukardjo, S., Wang, Y., and Yong, J. W. H.: The Loss of Species: Mangrove Extinction Risk and Geographic Areas of Global Concern, PLoS ONE, 5, e10095, https://doi.org/10.1371/journal.pone.0010095, 2010
R Core Team: A language and environment for statistical computing, R Foundation for Statistical Computing, Vienna, Austria2014, https://www.R-project.org (last access: 21 March 2021), 2017.
Ranjan, R. K., Routh, J., Ramanathan, A. L., and Klump, J. V.: Elemental and stable isotope records of organic matter input and its fate in the Pichavaram mangrove–estuarine sediments (Tamil Nadu, India), Mar. Chem., 126, 163–172, https://doi.org/10.1016/j.marchem.2011.05.005, 2011.
Reynaud, J. Y., Witt, C., Pazmiño, A., and Gilces, S.: Tide-dominated deltas in active margin basins: Insights from the Guayas estuary, Gulf of Guayaquil, Ecuador, Mar. Geol., 403, 165–178, https://doi.org/10.1016/j.margeo.2018.06.002, 2018.
Saintilan, N., Rogers, K., Mazumder, D., and Woodroffe, C.: Allochthonous and autochthonous contributions to carbon accumulation and carbon store in southeastern Australian coastal wetlands, Estuar. Coast. Shelf Sci., 128, 84–92, https://doi.org/10.1016/j.ecss.2013.05.010, 2013.
Schile, L. M., Kauffman, J. B., Crooks, S., Fourqurean, J. W., Glavan, J., and Megonigal, J. P.: Limits on carbon sequestration in arid blue carbon ecosystems, Ecol. Appl., 27, 859–874, https://doi.org/10.1002/eap.1489, 2017.
Siikamäki, J., Sanchirico, J. N., and Jardine, S. L. Global economic potential for reducing carbon dioxide emissions from mangrove loss, P. Natl. Acad. Sci., 109, 14369–14374, https://doi.org/10.1073/pnas.1200519109, 2012.
Sturm, K., Werner, U., Grinham, A., and Yuan, Z.: Tidal variability in methane and nitrous oxide emissions along a subtropical estuarine gradient, Estuar. Coast. Shelf Sci., 192, 159–169, https://doi.org/10.1016/j.ecss.2017.04.027, 2017.
Suello, R. H.: Suello et al. 2022, Biogeosciences, Data and Codes, Mendeley Data [data set], https://doi.org/10.17632/fv8sx6kfzf, 2022.
Taillardat, P., Friess, D. A., and Lupascu, M.: Mangrove blue carbon strategies for climate change mitigation are most effective at the national scale, Biol. Lett., 14, 20180251, https://doi.org/10.1098/rsbl.2018.0251, 2018.
Temmerman, S., Govers, G., Meire, P., and Wartel, S.: Modelling long-term tidal marsh growth under changing tidal conditions and suspended sediment concentrations, Scheldt estuary, Belgium, Mar. Geol., 193, 151–169, 2003.
Temmerman, S., Govers, G., Wartel, S., and Meire, P.: Modelling estuarine variations in tidal marsh sedimentation: response to changing sea level and suspended sediment concentrations, Mar. Geol., 212, 1–19, 2004.
Tue, N. T., Quy, T. D., Hamaoka, H., Nhuan, M. T., and Omori, K.: Sources and Exchange of Particulate Organic Matter in an Estuarine Mangrove Ecosystem of Xuan Thuy National, 1060–1068, http://www.jstor.org/stable/23257618 (last access: 7 July 2021), 2012.
Tue, N. T., Dung, L. V., Nhuan, M. T., and Omori, K.: Carbon storage of a tropical mangrove forest in Mui Ca Mau National Park, Vietnam, Catena, 121, 119–126, https://doi.org/10.1016/J.CATENA.2014.05.008, 2014.
Twilley, R. R., Gottfried, R. R., Rivera-Monroy, V. H., Zhang, W., Armijos, M. M., and Bodero, A.: An approach and preliminary model of integrating ecological and economic constraints of environmental quality in the Guayas River estuary, Ecuador, Environ. Sci. Pol., 1, 271–288, 1998.
Twilley, R. R., Cárdenas, W., Rivera-Monroy, V. H., Espinoza, J., Suescum, R., Armijos, M. M., and Solórzano, L : The Gulf of Guayaquil and the Guayas river estuary, Ecuador, in: Coastal marine ecosystems of Latin America, Springer, Berlin, Heidelberg, 245–263, https://doi.org/10.1007/978-3-662-04482-7_18, 2001.
Van de Broek, M., Temmerman, S., Merckx, R., and Govers, G.: Controls on soil organic carbon stocks in tidal marshes along an estuarine salinity gradient, Biogeosciences, 13, 6611–6624, https://doi.org/10.5194/bg-13-6611-2016, 2016.
Van de Broek, M., Vandendriessche, C., Poppelmonde, D., Merckx, R., Temmerman, S., andGovers, G.: Long-term organic carbon sequestration in tidal marsh sediments is dominated by old-aged allochthonous inputs in a macrotidal estuary, Glob. Change Biol., 24, 2498–2512, https://doi.org/10.1111/GCB.14089, 2018.
Weiss, C., Weiss, J., Boy, J., Iskandar, I., Mikutta, R., and Guggenberger, G.: Soil organic carbon stocks in estuarine and marine mangrove ecosystems are driven by nutrient colimitation of P and N, Ecol. Evol., 6, 5043–5056, https://doi.org/10.15488/302, 2016.
Więski, K., Guo, H., Craft, C. B., and Pennings, S. C. Ecosystem functions of tidal fresh, brackish, and salt marshes on the Georgia coast, Estuar. Coast., 33, 161–169, https://doi.org/10.1007/s12237-009-9230-4, 2010.
Yee, S.: REDD and BLUE carbon: carbon payments for mangrove conservation, UC San Diego: Center for Marine Biodiversity and Conservation, https://escholarship.org/uc/item/2bc6j8pz, last access: 19 January 2021, 2010.