the Creative Commons Attribution 4.0 License.
the Creative Commons Attribution 4.0 License.
 | 06 Apr 2022
Peat macropore networks – new insights into episodic and hotspot methane emission
Marjo Palviainen
Tiia Grönholm
Maarit Raivonen
Lukas Kohl
Vincent Gauci
Iñaki Urzainki
Annamari Laurén
Peatlands are important natural sources of atmospheric methane (CH4) emissions. The production and emission of CH4 are strongly influenced by the diffusion of oxygen into the soil and of CH4 from the soil to the atmosphere, respectively. This diffusion, in turn, is controlled by the structure of macropore networks. The characterization of peat pore structure and connectivity through complex network theory approaches can give conceptual insight into how the relationship between the microscale pore space properties and CH4 emissions on a macroscopic scale is shaped. The evolution of the pore space that is connected to the atmosphere can also be conceptualized through a pore network modeling approach. Pore regions isolated from the atmosphere may further develop into anaerobic pockets, which are local hotspots of CH4 production in unsaturated peat. In this study, we extracted interconnecting macropore networks from three-dimensional X-ray micro-computed tomography (µCT) images of peat samples and evaluated local and global connectivity metrics for the networks. We also simulated the water retention characteristics of the peat samples using a pore network modeling approach and compared the simulation results with measured water retention characteristics. The results showed large differences in peat macropore structure and pore network connectivity between vertical soil layers. The macropore space was more connected and the flow paths through the peat matrix were less tortuous near the soil surface than at deeper depths. In addition, macroporosity, structural anisotropy, and average pore throat diameter decreased with depth. Narrower and more winding air-filled diffusion channels may reduce the rate of gas transport as the distance from the peat layer to the soil–air interface increases. The network analysis also suggests that both local and global network connectivity metrics, such as the network average clustering coefficient and closeness centrality, might serve as proxies for assessing the efficiency of gas diffusion in air-filled pore networks. However, the applicability of the network metrics was restricted to the high-porosity near-surface layer. The spatial extent and continuity of the pore network and the spatial distribution of the pores may be reflected in different network metrics in contrasting ways. The hysteresis of peat water content between wetting and drying was found to affect the evolution of the volume of connected air-filled pore space in unsaturated peat. Thus, the formation of anaerobic pockets may occur in a smaller soil volume and methanogenesis may be slower when the peat is wetting compared to in drying conditions. This hysteretic behavior might explain the hotspots and episodic spikes of CH4 emissions, and therefore, it should be taken into account in biogeochemical models.
- Article
(3387 KB) - Full-text XML
- BibTeX
- EndNote


Peatlands are globally important modulators of hydrological and biogeochemical cycles (Gorham, 1991; Limpens et al., 2008). Peatlands store vast quantities of water, and they may affect flooding patterns in watersheds (Holden, 2005). A large proportion of dissolved organic carbon in freshwater ecosystems originates from watersheds with peatlands (Kang et al., 2018; Asmala et al., 2019). Globally, approximately 400 Pg of carbon is stored as peat, which corresponds to half of the carbon currently present in the atmosphere and a quarter or more of the total soil carbon stock (Rydin and Jeglum, 2013). Peatlands are major sources of carbon dioxide (CO2) and methane (CH4), thereby contributing to global warming (Frolking et al., 2011; Abdalla et al., 2016; Leifeld et al., 2019). Management practices such as drainage and restoration affect the water table (WT) dynamics (Menberu et al., 2016; Evans et al., 2021) and therefore the air-filled porosity and the availability of oxygen (O2) in peat (Waddington et al., 2015; McCarter et al., 2020). This, in turn, influences CO2 and CH4 emissions, as the oxidation of organic matter to CO2 is stimulated under oxic conditions, whereas its reduction to CH4 requires anoxic conditions.
Such anoxic conditions prevail below the WT but also in microniches – anaerobic pockets – in unsaturated soil above the WT (Silins and Rothwell, 1999; Deppe et al., 2010). These pockets form when the consumption of O2 exceeds the transport, mainly diffusion of O2. If readily degradable organic carbon is also available, the anaerobic pockets may become microscale hotspots of CH4 production (Wachinger et al., 2000; Hagedorn and Bellamy, 2011). As the peat CH4 concentration increases above the atmospheric concentration, CH4 may diffuse through the aerobic peat layer into the atmosphere if it is not oxidized by methanotrophic bacteria before reaching the peat surface (Whalen, 2005). Because the diffusion coefficient of CH4 in air is 4 orders of magnitude higher than in water (Ball and Smith, 2001), the air-filled porosity of the unsaturated zone largely regulates the diffusional CH4 transfer in peat and therefore determines how much CH4 is oxidized before reaching the peat surface.
The water retention characteristic is a fundamental soil property that links soil structure to water dynamics, gas transport, redox conditions, and many accompanying biogeochemical processes (Bachmann and van der Ploeg, 2002; Lepilin et al., 2019). Hysteresis, the difference in soil water content at a specific suction between drying and wetting conditions, also affects the water and aeration dynamics (Poulovassilis, 1962). Soil water retention in the low-suction range (0–10 kPa), which represents the filling and emptying of macropores (Perret et al., 1999), is strongly influenced by soil structure and pore size distribution (Hayward and Clymo, 1982; Weber et al., 2017). The pore size distribution is often derived from the water retention characteristic (Laine-Kaulio, 2011; Weber et al., 2017; Lepilin et al., 2019). Soil macropores are defined as pores having an effective diameter of the order of 100 µm or greater (Beven and Germann, 1982). Such low-suction-range conditions dominate in peatlands, where the WT is generally between 1 m and the soil surface (Sarkkola et al., 2010). This highlights the importance of macropores in peat soil functions (Reddy and DeLaune, 2008; McCarter et al., 2020). The total volume of macropores generally decreases with depth because of a higher degree of decomposition in the deeper peat layers (Päivänen, 1973). Pore size distribution or the water retention characteristic alone does not provide information about the arrangement, connections, or topology of the pores. Macropores form a complex network, where the individual macropores can be open and connected, dead-ended, or isolated (Rezanezhad et al., 2016). The topology and structure of the network therefore regulate water, solute, and gas transport and, ultimately, biogeochemical processes in peat (see McCarter et al., 2020). Dead-ended and disconnected pores can block the gas transfer between peat and the atmosphere and promote the formation of anaerobic pockets above the WT (Knorr et al., 2009; Estop-Aragonés et al., 2012). Thus far, the role of anaerobic pockets in the CH4 processes has been neglected in simulation models (e.g., Fan et al., 2014), mainly because the pore network is difficult to characterize experimentally.
When pore characteristics are described by the pore size distribution or by tortuosity indices derived from air permeability measurements (Laurén, 1997), soil structure is assumed to be homogeneous and isotropic (Beckwith et al., 2003). However, the CH4 production and transport cannot be fully understood without considering the three-dimensional (3D) pore network structures in peat. X-ray imagery and complex network theory provide a very promising yet unstudied approach for describing these structures and their effect on soil gas transport properties and mechanisms. X-ray micro-computed tomography (µCT) allows an explicit description of pore structure with resolution extending to the micrometer scale (Perret et al., 1999; Blunt et al., 2013; Rezanezhad et al., 2016). Total porosity and pore size distributions can be determined directly from 3D images (Larsbo et al., 2014), and when the extracted pore space is represented as a 3D network of pores and pore throats, more detailed information about pore connections and topology can be obtained (Gostick, 2017). Methods of complex network theory are widely used for quantifying multiscale connectivity and transport processes in real-world networks (Newman, 2003). Network concepts such as clustering, centrality, tortuosity, isolation, and path lengths can be used to characterize the macropore network from the viewpoint of anaerobic pocket formation. This may be a key in explaining the observed hotspots and episodic spikes of CH4 flux, which are particularly difficult to explain in the current CH4 models (e.g., Xu et al., 2016).
The aims of this study were (1) to introduce the µCT and complex network theory methods to analyze the characteristics of macropores and their networks in peat; (2) to evaluate the network structure and characteristics from the viewpoint of the formation of isolated pore space; (3) to assess the capability of complex network theory metrics to describe the physical structure of peat pore space; and (4) to qualitatively evaluate the potential to utilize the characteristics and metrics for characterizing gas transfer, CH4 processes, and anaerobic pocket formation in peat.
2.1 Field sampling
Peat samples were collected from Lettosuo, which is a drained forested peatland site in southern Finland. The site was drained in 1969 with open ditch drains arranged in 40 m spacing. The study site belongs to the Integrated Carbon Observation System (ICOS), and it is located in Tammela, southern Finland (60∘ 38′ N, 23∘ 57′ E). The mean annual temperature and precipitation are 4.6 ∘C and 627 mm, respectively (Pirinen et al., 2012). The soil type is Histosol dominated by Carex peat. The site was originally a mesotrophic fen classified as a herb-rich tall-sedge birch–pine fen (Laine and Vasander, 1996). The dominating tree species, with a mean height of 20 m, are Scots pine (Pinus sylvestris L.) and downy birch (Betula pubescens Ehrh.) with an understory composed of Norway spruce (Picea abies Karst.). The stand volume is 230 m3 ha−1 with a density of 2200 stems ha−1. The ground vegetation is composed of dwarf shrubs with a coverage of 4 % (Vaccinium myrtillus L., V. vitis-idaea L.) and herbs (coverage 10.6 %) such as Dryopteris carthusiana (Vill.) H.P. Fuchs and Trientalis europaea L. The moss layer is patchy and dominated by Pleurozium schreberi (Brid.) Mitt., Dicranum majus Turner, and D. polysetum Sw. In addition, Sphagnum girgensohnii Russow, S. russowii Warnst., and S. angustifolium (C.E.O. Jensen ex Russow) C.E.O. Jensen are present in moist patches. A detailed site description is available in Koskinen et al. (2014) and Bhuiyan et al. (2017).
Undisturbed peat samples were extracted into acrylic cylinders (diameter 50 mm, height 50 mm) using a sharp knife and scissors. The samples were collected from seven randomly located pits and three different depths (0–5, 20–25, and 40–45 cm, hereinafter referred to as the top, middle, and bottom layer, respectively). First, a 50–60 cm deep pit, with an undisturbed vertical face, was dug, and then the profile depth was measured with a ruler. Vertically oriented peat samples were extracted along the pit face paying attention to maintaining the undisturbed peat structure. The peat samples were placed into plastic bags and transported to the laboratory, where the water retention measurement was started immediately.
2.2 Measurement of water retention and air-filled porosity
The water retention characteristics of the cylindrical peat samples were measured in the laboratory using a pressure plate apparatus (Hillel, 1998). The samples were saturated with water, weighed, and placed into the pressure plate apparatus. The volumetric water content (θ, m3 m−3) was then allowed to stabilize in the pressure plate apparatus under external pressures of 1, 3, 6, and 10 kPa for 1 week at each pressure level. These pressure levels are equivalent to soil matric potentials (Ψ) of −1, −3, −6, and −10 kPa. The sample mass (MΨ, kg) was determined after each pressure level. At the end of the experiment, the height and diameter of the sample were measured to determine the shrinkage, and then the samples were sent to µCT imaging (see Sect. 2.3). After the imaging, the peat samples were dried at 105 ∘C for 72 h to obtain the dry mass (Ms) of the sample.
The bulk density (ρb, kg m−3) of the sample was determined from the dry mass and the volume of the sample in the saturated state (Vsat, m3). The volumetric water content θ was calculated at each matric potential in relation to the saturated volume of the sample as
where ρw (kg m−3) is water density. Total porosity f (m3 m−3) was calculated as
where the particle density ρs was assumed to have the value of 1500 kg m−3 (Redding and Devito, 2006). Air-filled porosity fa was determined at each matric potential as the difference in total porosity and the respective volumetric water content.
Many empirical models have been constructed to describe the functional form of the water retention characteristic (Hillel, 1998). For comparison purposes, water retention properties were also characterized using the widely used van Genuchten model (van Genuchten, 1980):
where θr is the residual water content, θs is the saturated water content, and α and n are empirical fitting parameters. The fitting was performed for the average values of θ of the seven samples from each depth by applying the Levenberg–Marquardt algorithm in SciPy (Virtanen et al., 2020). Because the pressure range used in the water retention measurements was rather narrow and therefore inadequate for a proper fit, the fitting procedure was simplified by setting the saturated water content to equal the total porosity and setting the residual water content to zero as suggested by Weiss et al. (1998).
2.3 Three-dimensional µCT imaging
X-ray micro-computed tomography involves taking two-dimensional X-ray photographs of an object from multiple angles and then using a filtered back-projection algorithm to reconstruct the 3D volume of the sample. With this method it is possible to obtain information about the internal structure of the sample noninvasively, to visualize the sample, and to assess its structural characteristics quantitatively. For example in soil studies, it is possible to determine the pore characteristics (porosity and pore size distribution), grain size distribution, and moisture distribution inside the sample (Taina et al., 2008; Helliwell et al., 2013).
After the water retention experiment, the soil samples (see Sect. 2.1) were scanned in the micro-CT laboratory in the University of Helsinki with the GE Phoenix Nanotom system. The samples were at −10 kPa matric potential during the imaging. The conversion of the radiographs to grayscale images was performed with the GE image reconstruction software Phoenix datos|x 2. The final voxel (cubic 3D image element) size after reconstruction was 50 µm, and the data were stored in an unsigned 16 bit integer representation. The size of the resulting 3D images was 1142 by 1142 by 1152 voxels. Some darkening was observed in many of the images near the top and bottom of the cylindrical samples, which may have resulted from defects in µCT image reconstruction.
2.4 Image processing
In the µCT image preprocessing stage, the 16 bit 3D grayscale images were converted to 3D binary images that represent the void and solid volumes of the samples. In this context, solid volume stands for the volume occupied by water or organic matter. The conversion was done using the Python image processing packages SciPy ndimage (Virtanen et al., 2020) and scikit-image (van der Walt et al., 2014) and the image analysis toolkit PoreSpy (Gostick et al., 2019).
First, the 3D grayscale images were straightened through rotation and cropped to a size of 1000 by 1000 by 1000 voxels. A cylindrical peat volume (height 1000 voxels, diameter 1000 voxels) excluding the acrylic cylinder was selected using PoreSpy. Before noise filtering and binary segmentation, the 16 bit images were linearly mapped to an unsigned 8 bit representation. The 16 to 8 bit mapping interval was selected for each image by visual inspection of the grayscale histogram so that the long, shallow tails of the intensity distribution, which were mainly generated by noise, were removed. The resulting 8 bit grayscale images were then filtered for noise reduction with a 3D median filter with a radius of 2 voxels (Fig. 1a). The intensity contrast between air-filled regions and the regions containing water or organic matter in the images was often rather low (Fig. 1b). Furthermore, not all the grayscale histograms were bimodal, so the intensity values for void and solid regions could not be readily distinguished from the intensity distributions. The segmentation of images into void and solid volumes was performed using Otsu's widely utilized global thresholding method (Otsu, 1979) (Fig. 1c). Finally, isolated solid volumes were removed from the binary images using a method for finding disconnected voxels in PoreSpy.

Figure 1(a) Vertical slice of a 6003-voxel section of the noise-filtered X-ray micro-computed tomography image of one of the 40–45 cm peat samples. (b) Histogram of the grayscale intensities of the corresponding noise-filtered cylindrical 8 bit image with a height and diameter of 1000 voxels. (c) Vertical slice of the binary image resulting from solid–void segmentation. The white region denotes solid material (water and organic matter), and black regions denote void space (air). (d) Division of void space into individual pore regions.
2.5 Pore network extraction
Pore networks were extracted from the binarized 10003-voxel images using a marker-based watershed segmentation method (Gostick, 2017) available in PoreSpy (Figs. 1d and 2). The extraction method has been designed to also have good performance for materials with a high porosity. It generates the topology of the pore network by dividing the void space into individual pore regions and determining the locations of pore throats, that is, the two-dimensional interfaces between adjacent pores, and the connections between the pores. The method facilitates the subsequent determination of pore network geometry, which includes, for example, pore volumes, pore-to-pore distances, and throat diameters. The feature resolution is generally about twice the voxel size in µCT imaging (Stock, 2008), implying that the size of the smallest distinguishable feature was 100 µm.
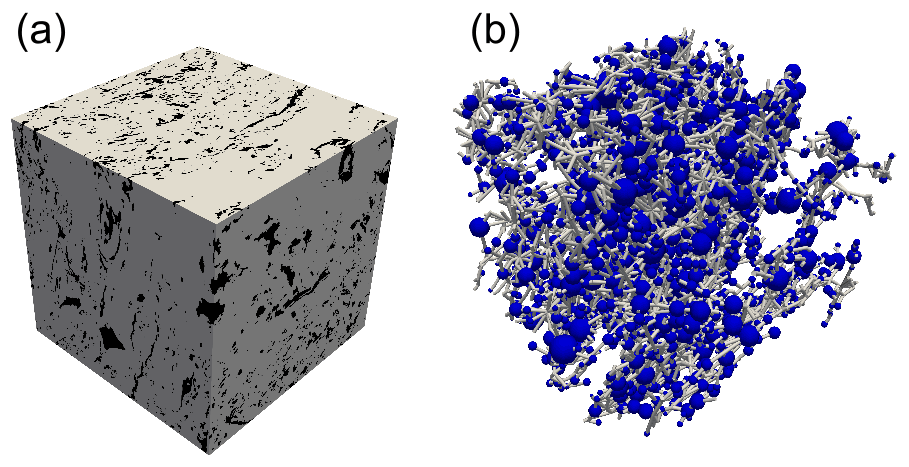
Figure 2(a) A 6003-voxel (27 cm3) cubic central region of the binary image generated from the X-ray micro-computed tomography image of one of the peat samples from the depth of 40–45 cm. The gray region denotes solid material (water and organic matter), and black regions denote void space (air). (b) The largest cluster of interconnected pores, or a pore network, extracted from the cubic image. The presentation of the network follows stick-and-ball geometry: pores are depicted as blue spheres, and throats are straight gray cylinders between connected pores.
2.6 Pore geometry
The size of a pore was characterized by its volume, which was determined by counting the number of voxels in an individual pore region. The diameter of a pore was defined as the diameter of the largest sphere that fits inside the pore region. Similarly, the throat diameter was defined as the diameter of the largest circle that fits inside the throat region. Further, the equivalent pore diameter, defined as the diameter of a sphere with the same volume as the pore, was used in pore size classification in the study. Because the centroids of adjacent pores and the centroid of the throat between them were usually not collinear, the distance d between adjacent pores was determined as the sum of the distances between the centroids of each pore (p1 and p2) and the centroid of the throat (t): .
2.7 Image and network analyses
2.7.1 Image and network porosity
The porosities of the binary images were calculated using the cylindrical sections of the 10003-voxel binary images. In the calculations, it was assumed that the sample surfaces had been totally smooth and level with the ends of the acrylic cylinder in the initial saturated state. The image porosities were determined as the ratios of the number of void voxels to the number of total voxels in the cropped image section covering the inner space of the cylinder. It was thus assumed that the shrinkage of the peat sample resulted in the displacement of air-filled void space within the sample into the space between the sample and the walls of the cylinder at −10 kPa matric potential, which ensured that the effect of shrinkage was included in the calculation.
The extracted pore system can be partitioned into clusters of interconnected pores and a set of isolated individual pores. The largest of these clusters, which is assumed to be the only one that extends through the applied sample domain, is defined as the pore network. The total pore system, also including smaller pore clusters and isolated pores, is thereafter referred to as the total pore space. Network porosity is defined as the ratio of the sum of the volumes of individual pores in the network to the total volume of the applied sample domain. The volume of the total pore space was slightly smaller than the volume of the void space of the corresponding section of the binary image because the network extraction algorithm tends to discard some of the smallest isolated pores, especially adjacent to the borders of the image domain.
2.7.2 Water retention simulation
We used pore network modeling to assess the performance of the pore network approach against the measured water retention properties and to perform further simulations in the peat pore networks. Water retention simulation was performed employing the algorithm for drainage percolation in the open-source pore network modeling package OpenPNM (Gostick et al., 2016). In the algorithm, a pore network is initially filled with a defending fluid (water). An invading fluid (air) enters the network through inlets located in a specified boundary region of the network and gradually replaces the defending fluid under increasing external pressure as in a porosimetry experiment. Fluid invasion is access-limited, which means that the invading fluid can only enter the throats that are directly connected to the inlet. The pressure P needed to force the invading fluid to penetrate a throat and enter the adjoining pore is determined by the Washburn equation as
where γ is the interfacial tension between the invading and defending phases (0.72 mN m−1 for an air–water interface), β is the contact angle of the invading fluid, and D is the diameter of the throat. The contact angle was assumed to be 180∘ in the simulations, which gave the maximum limit of the throat entry pressure. The entry pressures corresponding to different contact angles can be readily estimated because the Washburn equation is linear with respect to cos (β). The air-filled porosity at each external pressure can be calculated as the volume fraction of air-filled pores. Water imbibition was simulated with the percolation algorithm by using site percolation, in which fluid invasion pressure is controlled by pore diameters instead of throat diameters.
The network domain size used in the water retention simulations had to be as close to the total sample size as possible so that comparison with the measured retention curves would be reasonable. Thus, only 100 voxels, representing 5 mm slices, was excluded from the top and bottom of the sample images in order to exclude the roughness of the sample surfaces and the influence of decreased grayscale intensity near the horizontal image boundaries on solid–void classification. The network domain was determined to be 40 mm in height, and it included the whole cylindrical region in the horizontal direction. Because of a slight vertical shrinkage in some of the top-layer samples, the height of the network domain was decreased to 30 or 35 mm as needed. The resulting image was then divided into four regions of similar shape with horizontal dimensions of 500 by 500 voxels. A separate pore network was extracted for each of these image regions with PoreSpy. Water retention simulations for the four subnetworks were performed using the same pressure steps in each simulation. The combined air-filled porosities at each pressure step were then calculated to represent the water retention characteristic in the total cylindrical network domain with a height of 800 voxels and a diameter of 1000 voxels. The maximum external pressure applied in the simulations, 2.88 kPa, was determined by the minimum throat diameter, which was 100 µm.
2.7.3 Network metrics
In addition to the effects of the vertical shrinkage, horizontal shrinkage created continuous void space between the sample and the cylinder walls in most of the sample images. In order to exclude those excess void regions, a centered cubic subregion with a side length of 600 voxels (30 mm), hereafter referred to as a subsample, was selected from each sample image for the analysis of pore size distribution and connectivity. Hence, the results characterized the actual inner structure of a sample. The largest connected pore cluster, or the pore network, extracted from the cubic subregion was used in the network connectivity analyses. The selection of only the largest cluster was justifiable because it contained on average more than 80 % of the total pore system volume and was the only cluster that extended through the network domain from top to bottom in each pore system. In order to determine the air-filled volume fraction of a pore network at different external pressures, we also performed drainage and imbibition percolation simulations for the cubic-domain networks.
We used the network analysis package NetworkX (Hagberg et al., 2008) for the estimation of network connectivity metrics. The pore coordination number (the degree of a node in graph theory) gives the number of connections to an individual pore or, in other words, the number of throats emanating from a pore. The local clustering coefficient of a pore A is defined as the probability that two pores that are connected to A are also connected to each other. The network average clustering coefficient, the average of all local clustering coefficients (Watts and Strogatz, 1998), can be considered the probability that two adjacent pores of a random pore are connected to each other. The closeness centrality of a pore is defined as the reciprocal of the average of the shortest path lengths from the pore to every other pore in the network (Freeman, 1978). The calculated pore-to-pore distances were used as the edge weights in the calculation of the path lengths. The closeness centrality of the pore network was calculated as the average value of the closeness centralities of all the pores. A high network closeness centrality indicates that the overall global connectivity of the pore network is fairly high (van der Linden et al., 2019).
Geometrical tortuosity and betweenness centrality are network measures related to the transport properties of a spatial network in a certain direction and as a whole, respectively. To characterize properties related to the connectivity through the peat pore network between the opposite surfaces of the network domain, artificial boundary pores were added to the pore network to represent the interfaces at the surfaces of the samples using PoreSpy. The geometrical tortuosity or path length tortuosity of a pore network is defined as the average value of the ratio of the lengths of the shortest paths between each pair of pores located at the opposite boundaries of the network domain to the straight-line distance between the opposite boundary planes (Lindquist et al., 1996; Clennell, 1997). In the calculation of geometrical tortuosity, the shortest paths between boundary pores were determined using Dijkstra's algorithm. Geometrical tortuosity was determined separately for the vertical and for the horizontal direction. Both perpendicular horizontal directions were included in the calculation of horizontal geometrical tortuosity.
The betweenness centrality of a pore A is generally defined as the ratio of the number of shortest paths between all the pairs of pores in the network that traverse A to the total number of the pairs of pores that do not include A (Freeman, 1977). In this study, we also defined and quantified the top–bottom betweenness centrality by including only the shortest paths that connected the top boundary pores with the bottom boundary pores. As with closeness centrality, the betweenness centrality of a pore network was determined as the average value over the pores. A high network betweenness centrality suggests that the shortest paths through a network tend to be governed by a relatively small number of different routes (van der Linden et al., 2019). In order to save calculation time, every 10th pore was used in the estimation of the network average closeness centrality, betweenness centrality, and geometrical tortuosity in networks with more than 8000 pores.
2.8 Statistics
We applied a one-way analysis of variance (ANOVA) followed by Tukey's pairwise multiple comparison test to determine the possible influence of depth on the water retention characteristics, pore sizes, and calculated network metrics. If residual normality or variance homogeneity could not be assumed, a nonparametric Kruskal–Wallis test followed by Dunn's pairwise multiple comparison test or Welch's ANOVA followed by Games–Howell pairwise multiple comparison test, respectively, were applied instead. A paired sample t test was applied to analyze the difference between vertical and horizontal geometrical tortuosity. The statistical analyses were conducted with the statistical function module in SciPy and the Python packages statsmodels (Seabold and Perktold, 2010), scikit_posthocs (Terpilowski, 2019), and hypothetical (Schlegel, 2020).
3.1 Air-filled porosity
The void fractions of the µCT images were generally somewhat smaller than the measured air-filled porosities of the samples obtained from Eqs. (1) and (2) (Fig. 3). The discrepancy was highest in the middle-layer samples. The measured vertical shrinkage of the samples at −10 kPa matric potential decreased with depth, being on average 6.3 % in the top-layer samples, 3.7 % in the middle-layer samples, and 2.3 % in the bottom-layer samples.
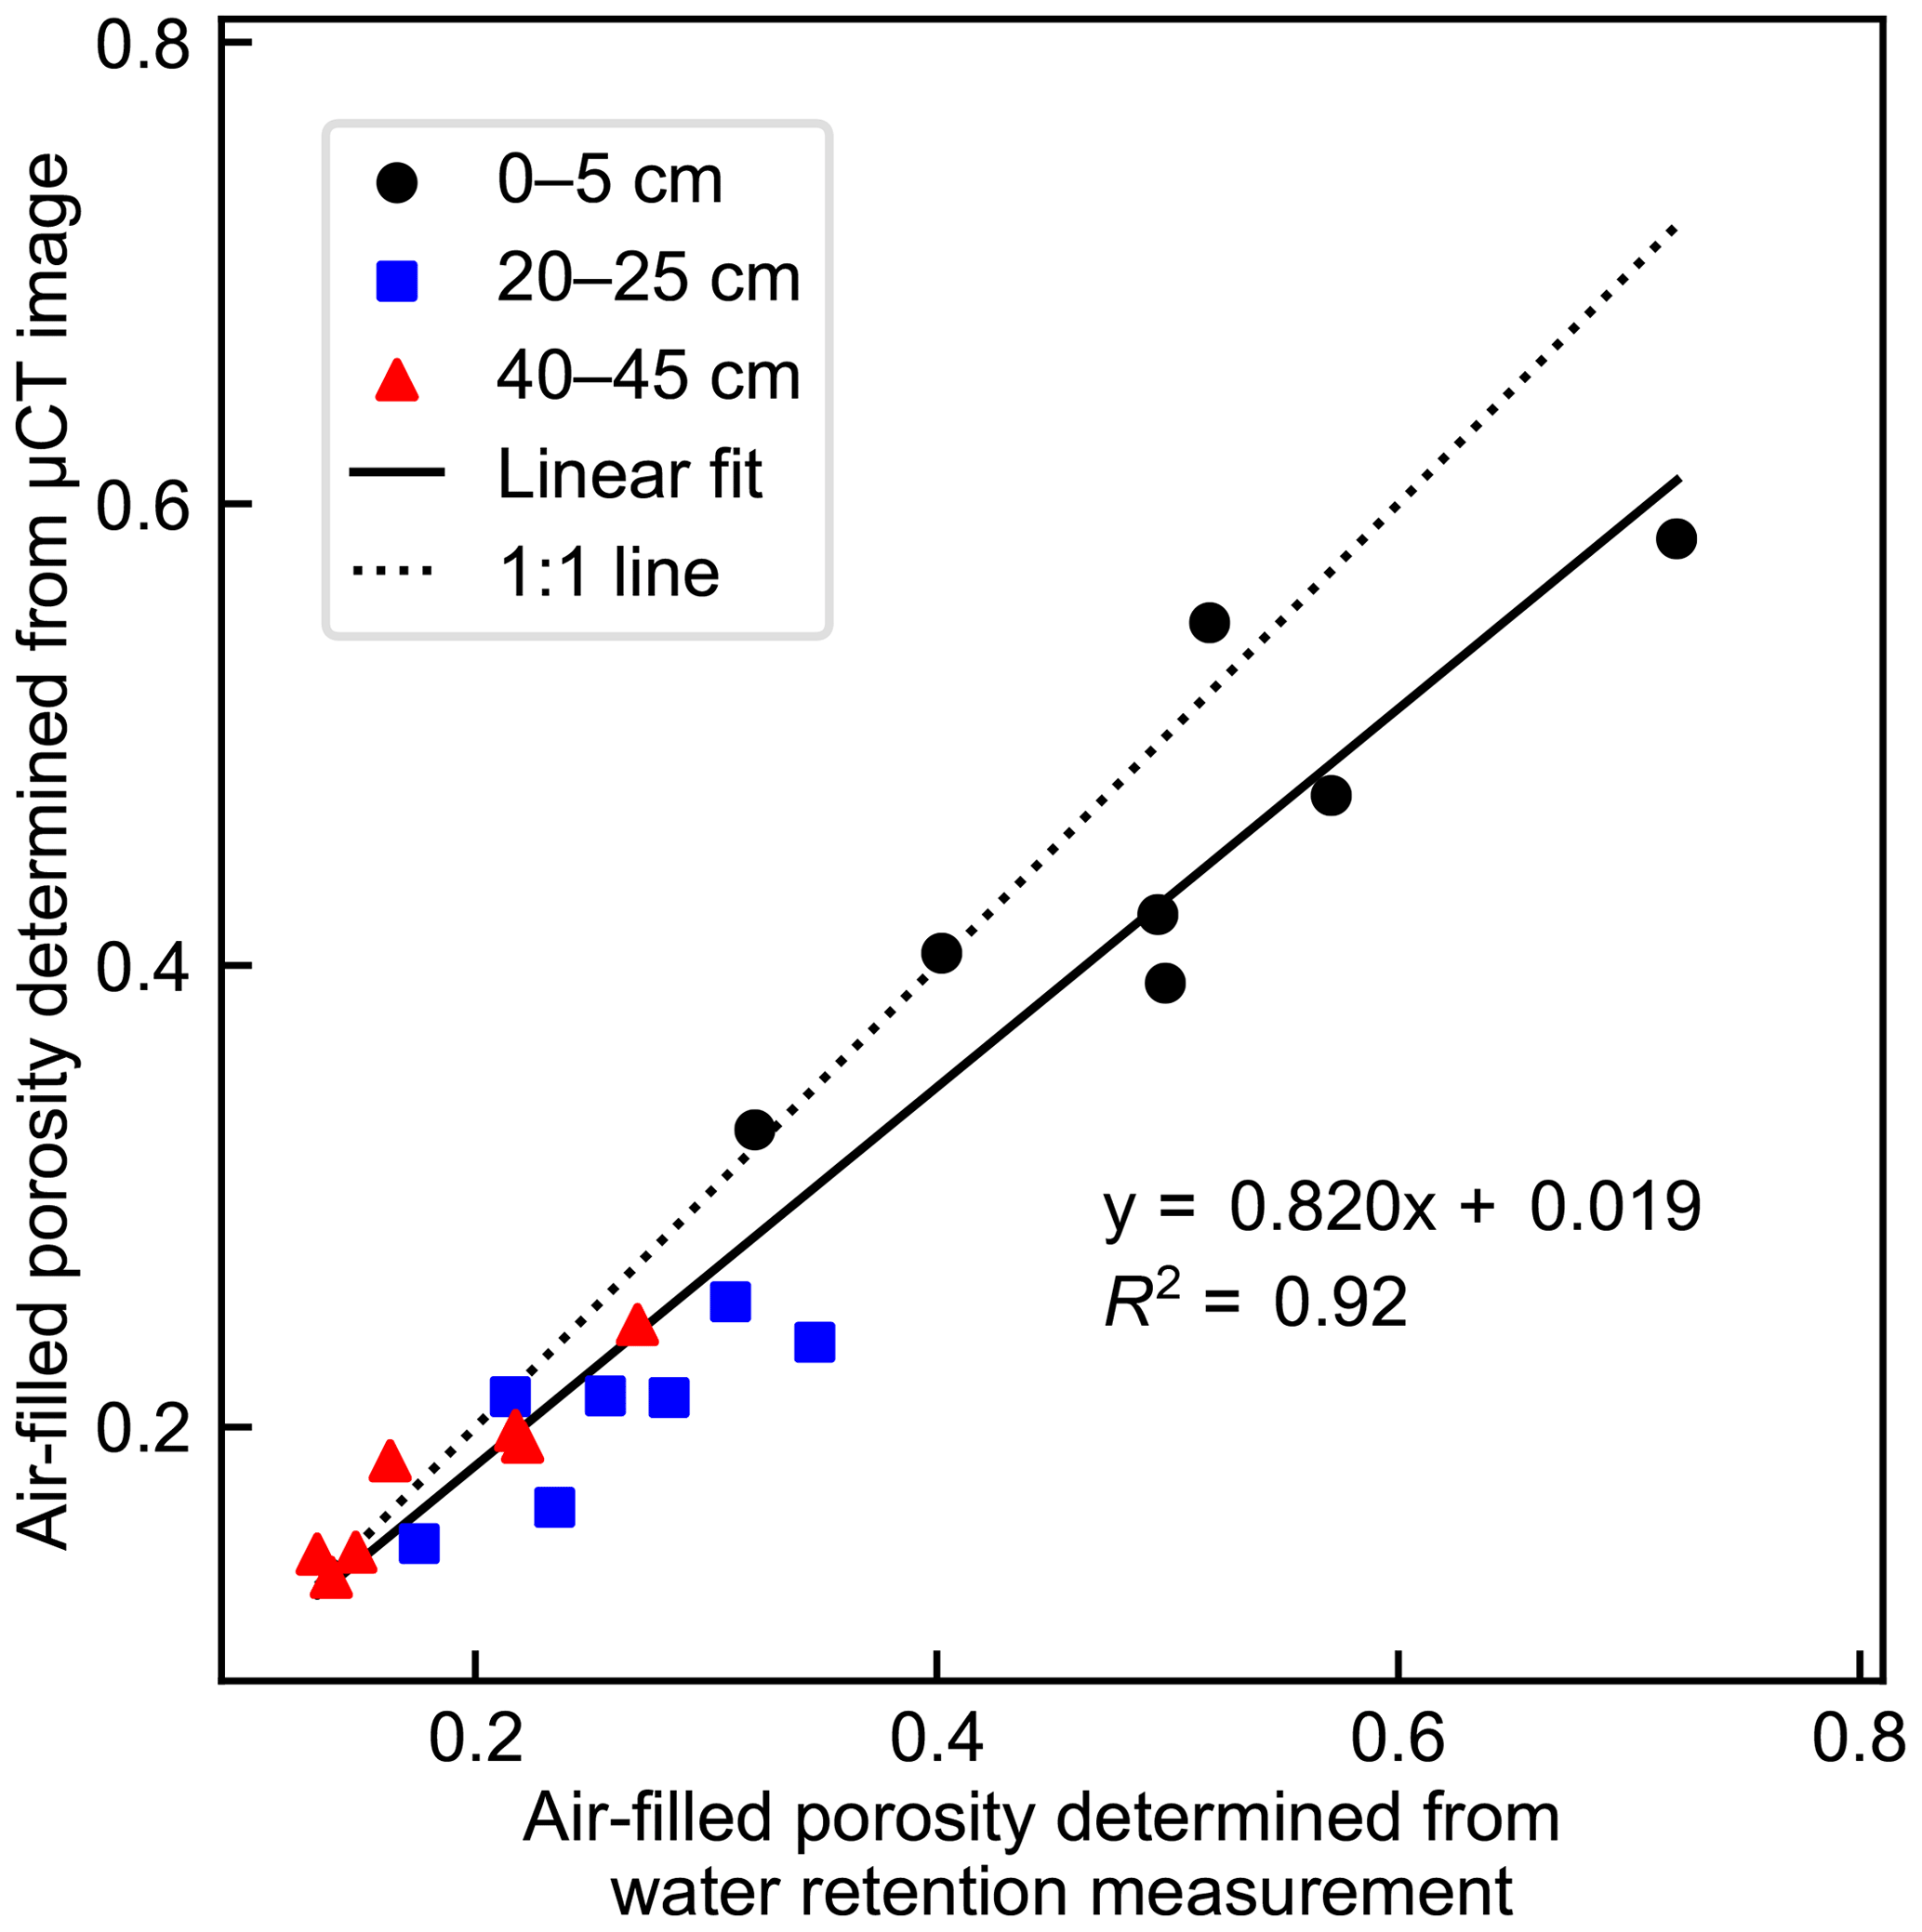
Figure 3Measurement-derived (determined by subtracting the volumetric water content, Eq. 1, from total porosity, Eq. 2) and image-derived (determined as the fraction of void voxels in the binarized µCT image) air-filled porosities of all the cylindrical peat samples from different depths at −10 kPa matric potential.
The pore network generation process reduced the volumes of the pore networks in comparison to the void volumes of the corresponding image sections, which was reflected as a further source of discrepancy in the water retention simulations. The total pore space volumes within the cylindrical network domains were 0.4 %–2.4 %, 1.4 %–9.7 %, and 1.9 %–6.6 % smaller than the calculated void space volumes in the corresponding image sections of the top-, middle-, and bottom-layer samples, respectively. The network volumes, on the other hand, were 0.2 %–3.0 %, 6.3 %–35.1 %, and 6.6 %–27.8 % smaller than the total pore space volumes, as some of the void space consisting of small, isolated void regions was omitted during network extraction. The pore networks were the only connected pore clusters that extended vertically through the network domain in each pore system, and therefore, it was justified to use them in the water retention simulations.
3.2 Water retention and air invasion dynamics
The total porosity of the peat samples calculated using Eq. (2) differed significantly between sampling depths (Welch's ANOVA, and p=0.008), but the differences were generally rather small (Table 1). The between-sample variation in porosity was highest in the top layer. Also, the water retention characteristics calculated with Eq. (1) differed significantly between depths (ANOVA or Kruskal–Wallis test, p<0.05, Table 1). Water content in all studied matric potentials was clearly lowest in the top layer and highest in the deepest studied peat layer.
Table 1Means and standard deviations for the bulk density (ρs, kg m−3), total porosity (f), and volumetric water content (θ) of the peat samples at different matric potentials and the fitted van Genuchten water retention parameters α (cm−1) and n.
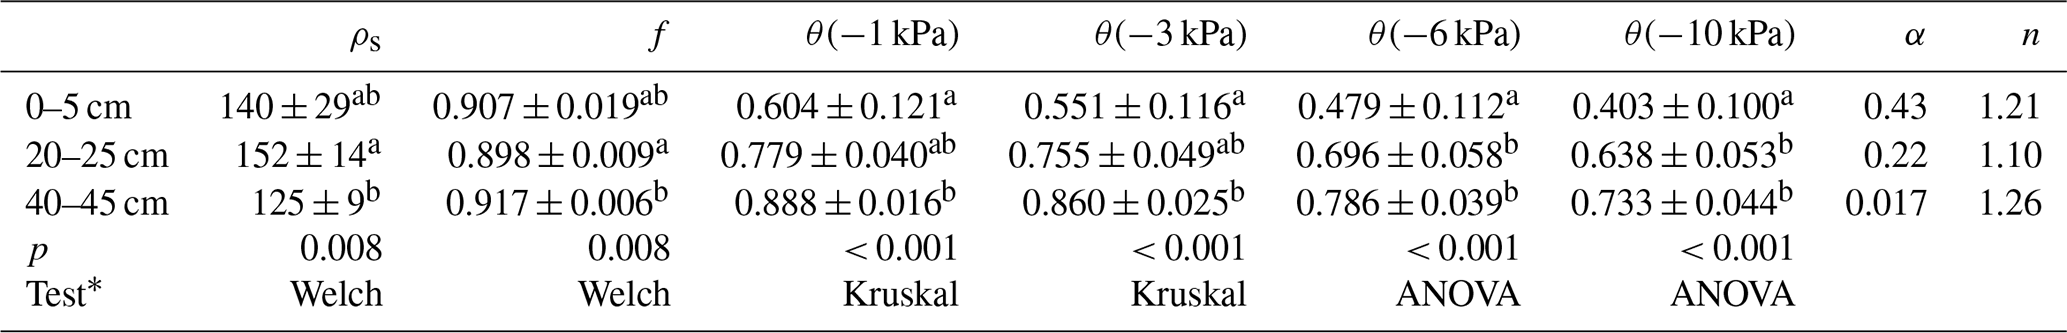
* ANOVA: F test and Tukey's test; Welch: Welch's F test and Games–Howell test; Kruskal: Kruskal–Wallis test and Dunn's test. Different letters indicate significant difference between depths (p<0.05).
The variation in air-filled porosity between samples was largest in the top layer and smallest in the bottom layer (Fig. 4). The difference in the between-sample variation between depths was most pronounced under −1 and −3 kPa matric-potential conditions. The air-filled porosities derived from measurements and pore network simulations were rather coherent at different matric potentials for some of the samples, but considerable variation existed in the difference between measurement-based and simulated values in many samples at all depths. In the pore network simulations, the external pressure range extended only to about 3 kPa, which corresponds to the minimum throat diameter of 100 µm detected in the µCT imaging. In the samples with no notable shrinkage in any direction, such as top-layer samples 3, 6, and 7 and the middle-layer sample 7, the percolation simulation matched the measured air-filled porosity values well at both −1 and −3 kPa matric potentials. The hysteresis effect is clearly seen in the drainage–imbibition simulations (Fig. 5). The air-filled porosity at a certain matric potential was higher during water imbibition than during drainage.
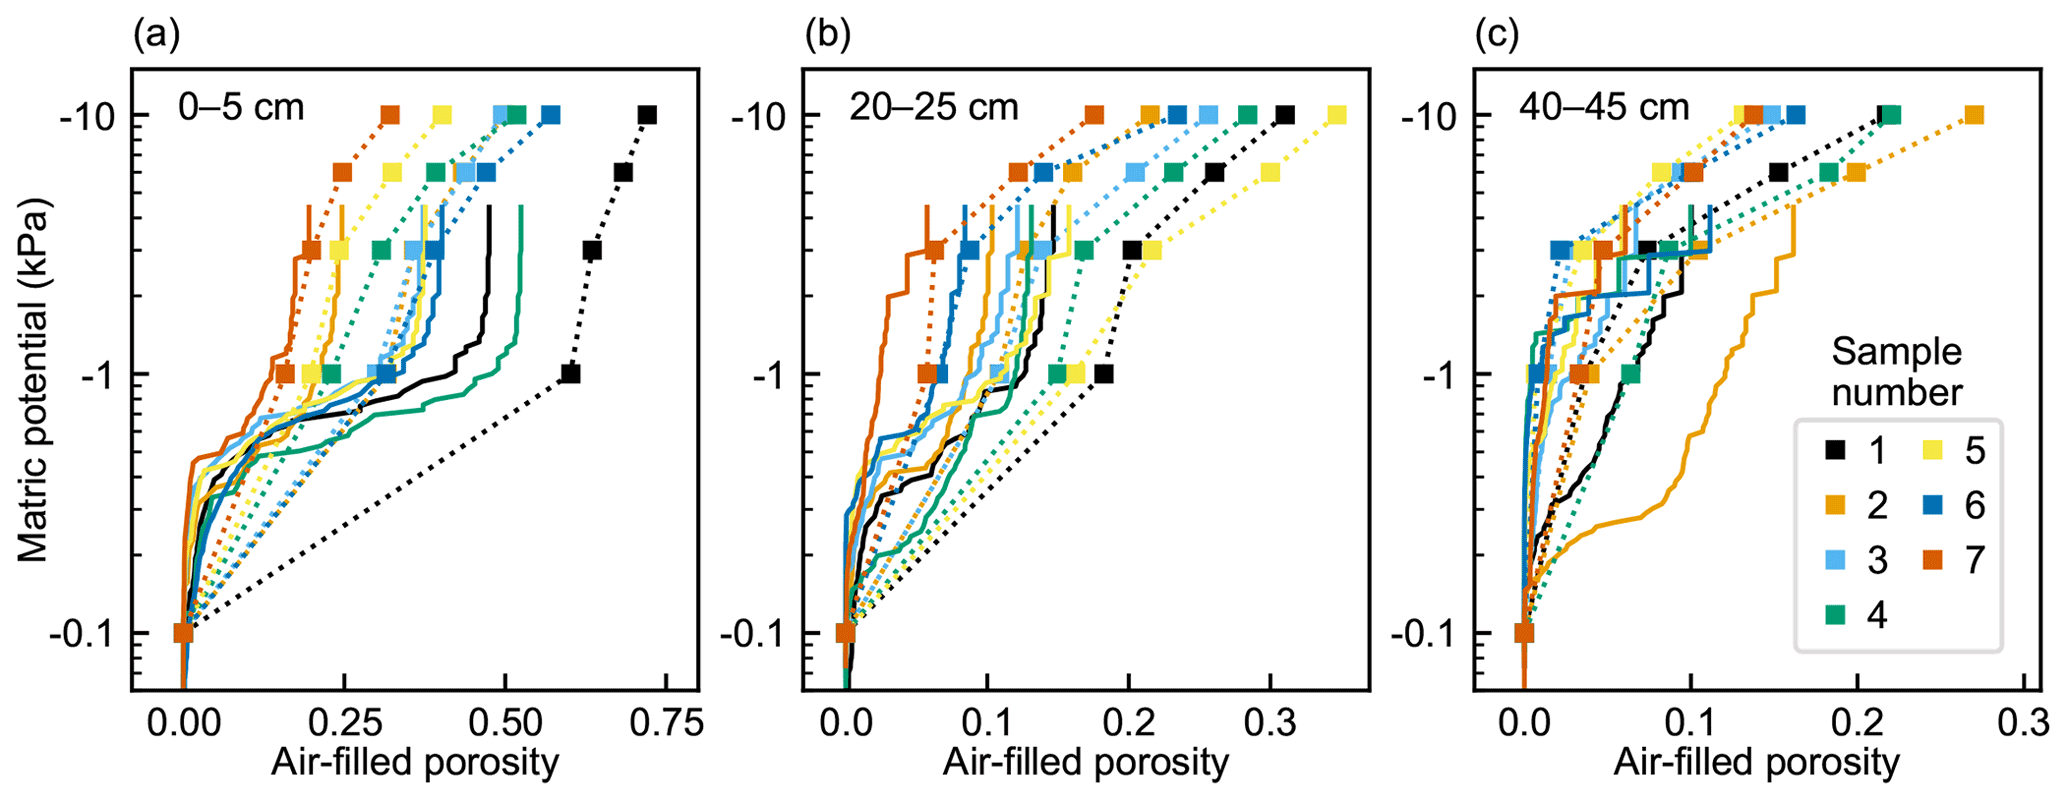
Figure 4Measurement-derived (square markers with dotted connecting lines) air-filled porosities of peat samples from (a) 0–5 cm, (b) 20–25 cm, and (c) 40–45 cm depths at different matric potentials and the corresponding simulated air invasion curves (solid lines). Air-filled porosity was determined by subtracting the measured volumetric water content (Eq. 1) from total porosity (Eq. 2). The measurement-derived air-filled porosities at −0.1 kPa are set to 0 in the plots, which corresponds to the initial state of the water retention simulation.

3.3 Pore and throat size distributions
The pore sizes of the connected pore networks obtained from the subsamples ranged from to 75 mm3, which corresponds to an equivalent diameter range of 0.09 to 5.2 mm (Fig. 6a). The median pore size of the top-layer networks (median equivalent diameter 0.66±0.06 mm) was significantly larger than that of the middle-layer (0.58±0.01 mm) and bottom-layer (0.59±0.02 mm) networks (Kruskal–Wallis test, H(2)=9.67 and p=0.008). Also, the between-sample variation in pore size distribution was substantially higher in the top layer (the medians of the equivalent diameters 0.579–0.765 mm) than in the deeper layers (medians 0.573–0.589 and 0.565–0.617 mm in the middle and bottom layers, respectively). The maximum pore sizes were generally highest in the top-layer networks, but large pores also existed in some of the bottom-layer networks (Fig. 6c–e). A larger total volume of a pore network was related to a larger average pore size in the top-layer networks but not in the deeper-layer networks.
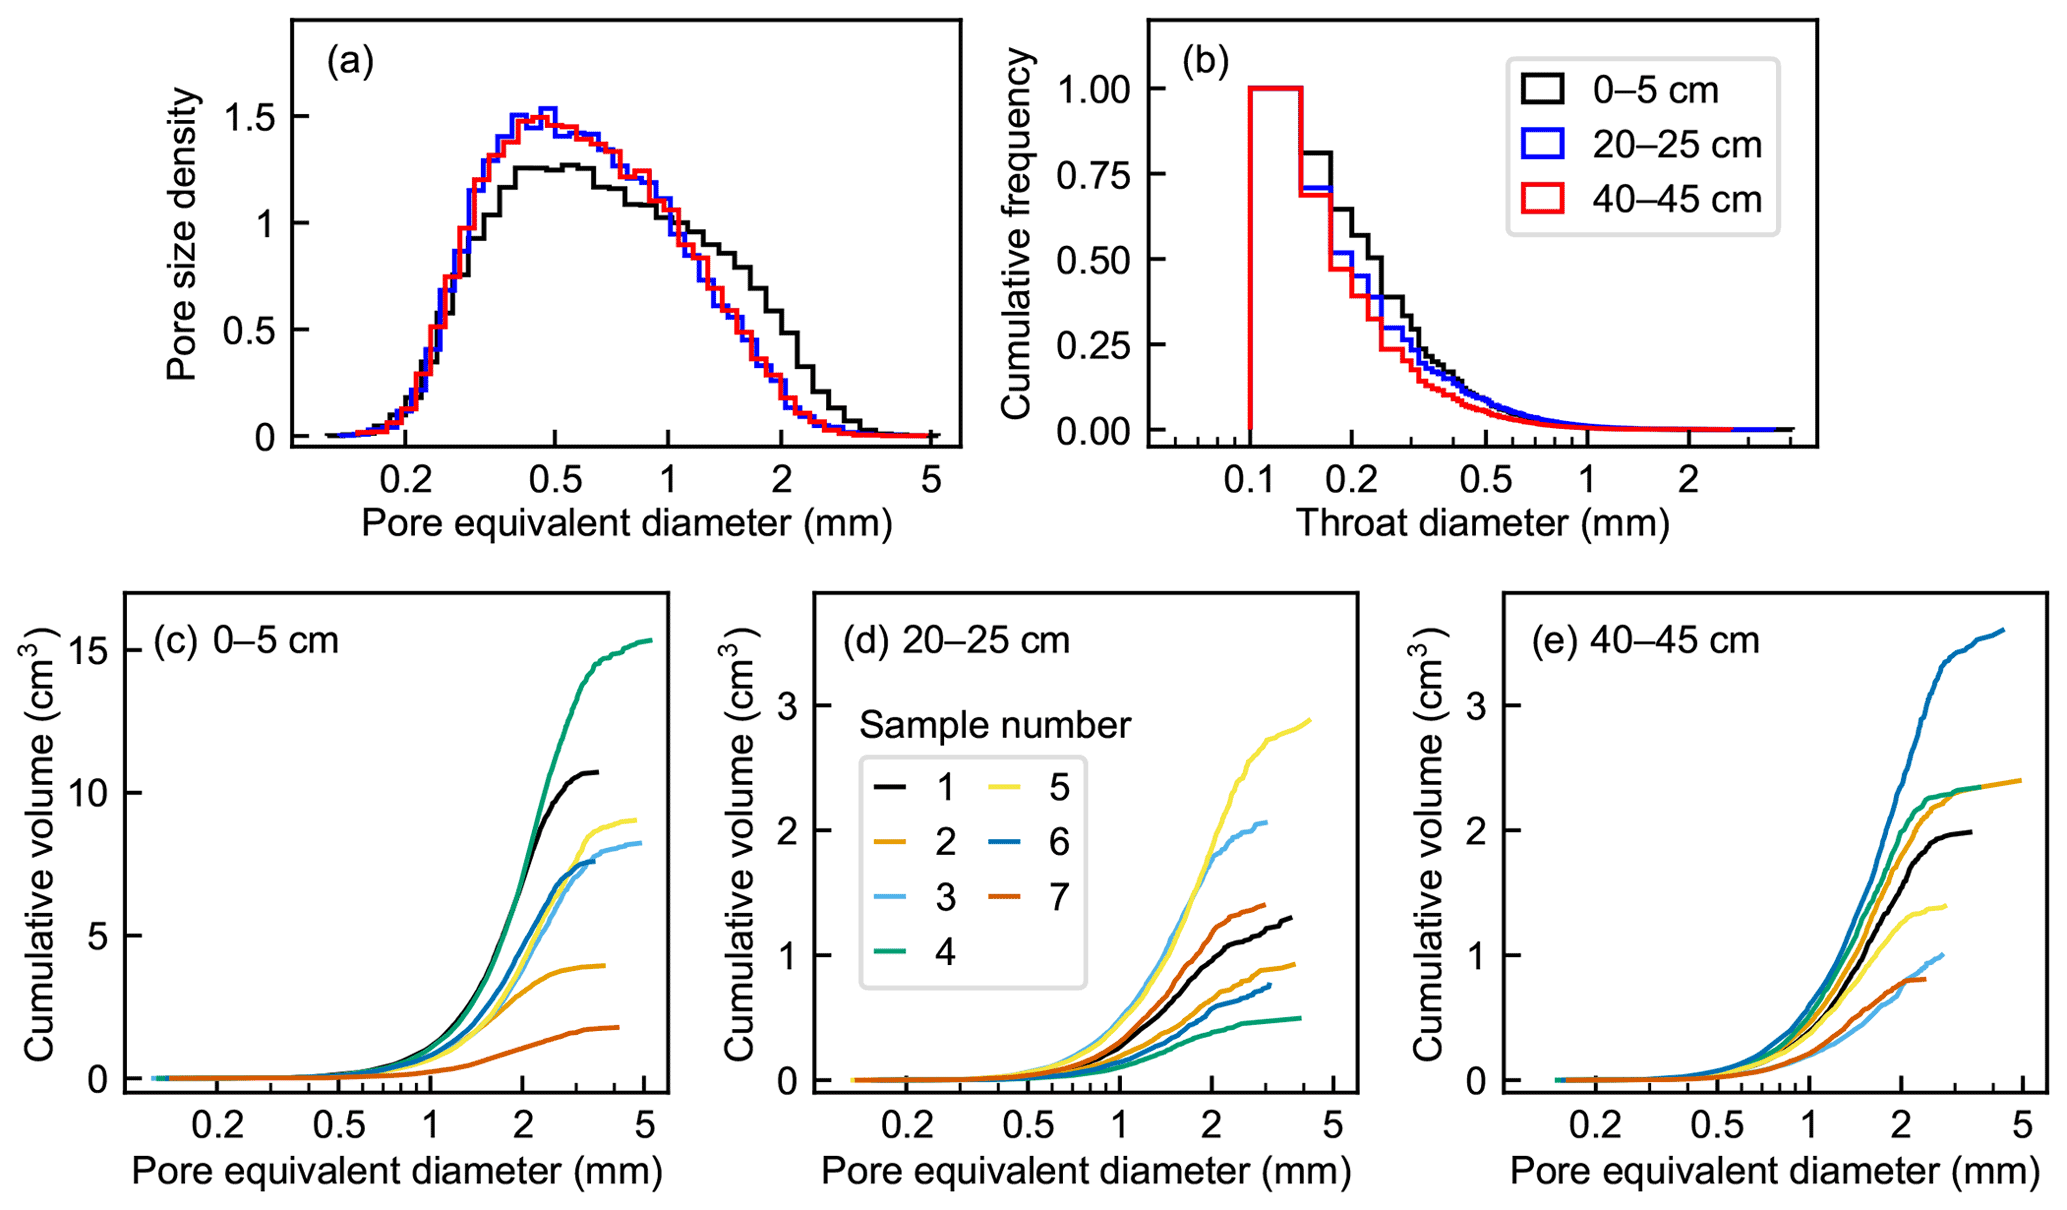
Figure 6Pore size characteristics of the 6003-voxel domain pore networks from the sampling depths of 0–5, 20–25, and 40–45 cm. (a) Combined histograms of the probability density functions of pore size. (b) Combined cumulative relative frequency histograms of throat diameters. (c–e) Cumulative volume distribution of each pore network in relation to pore equivalent diameter.
The throats with the smallest detectable diameter (100 µm) were the most abundant at all depths, and the fraction of wider throats decreased with depth (Fig. 6b). However, the difference between the mean throat diameters at different depths was marginally nonsignificant (ANOVA, and p=0.09).
3.4 Network porosity and connectivity metrics
The porosity of the pore network and all the pore network metrics differed significantly with depth (ANOVA or Kruskal–Wallis test, p<0.05, Fig. 7). Network porosity and connectivity were clearly highest in the top layer. The connected pore networks did not extend over the whole cubic network domain in most of the middle- and bottom-layer subsamples and in one of the top-layer subsamples, which decreased the network porosity obtained. All the network metrics of the top layer differed significantly from those of the deeper layers (p<0.05), whereas no significant difference was observed between the middle- and bottom-layer subsamples.
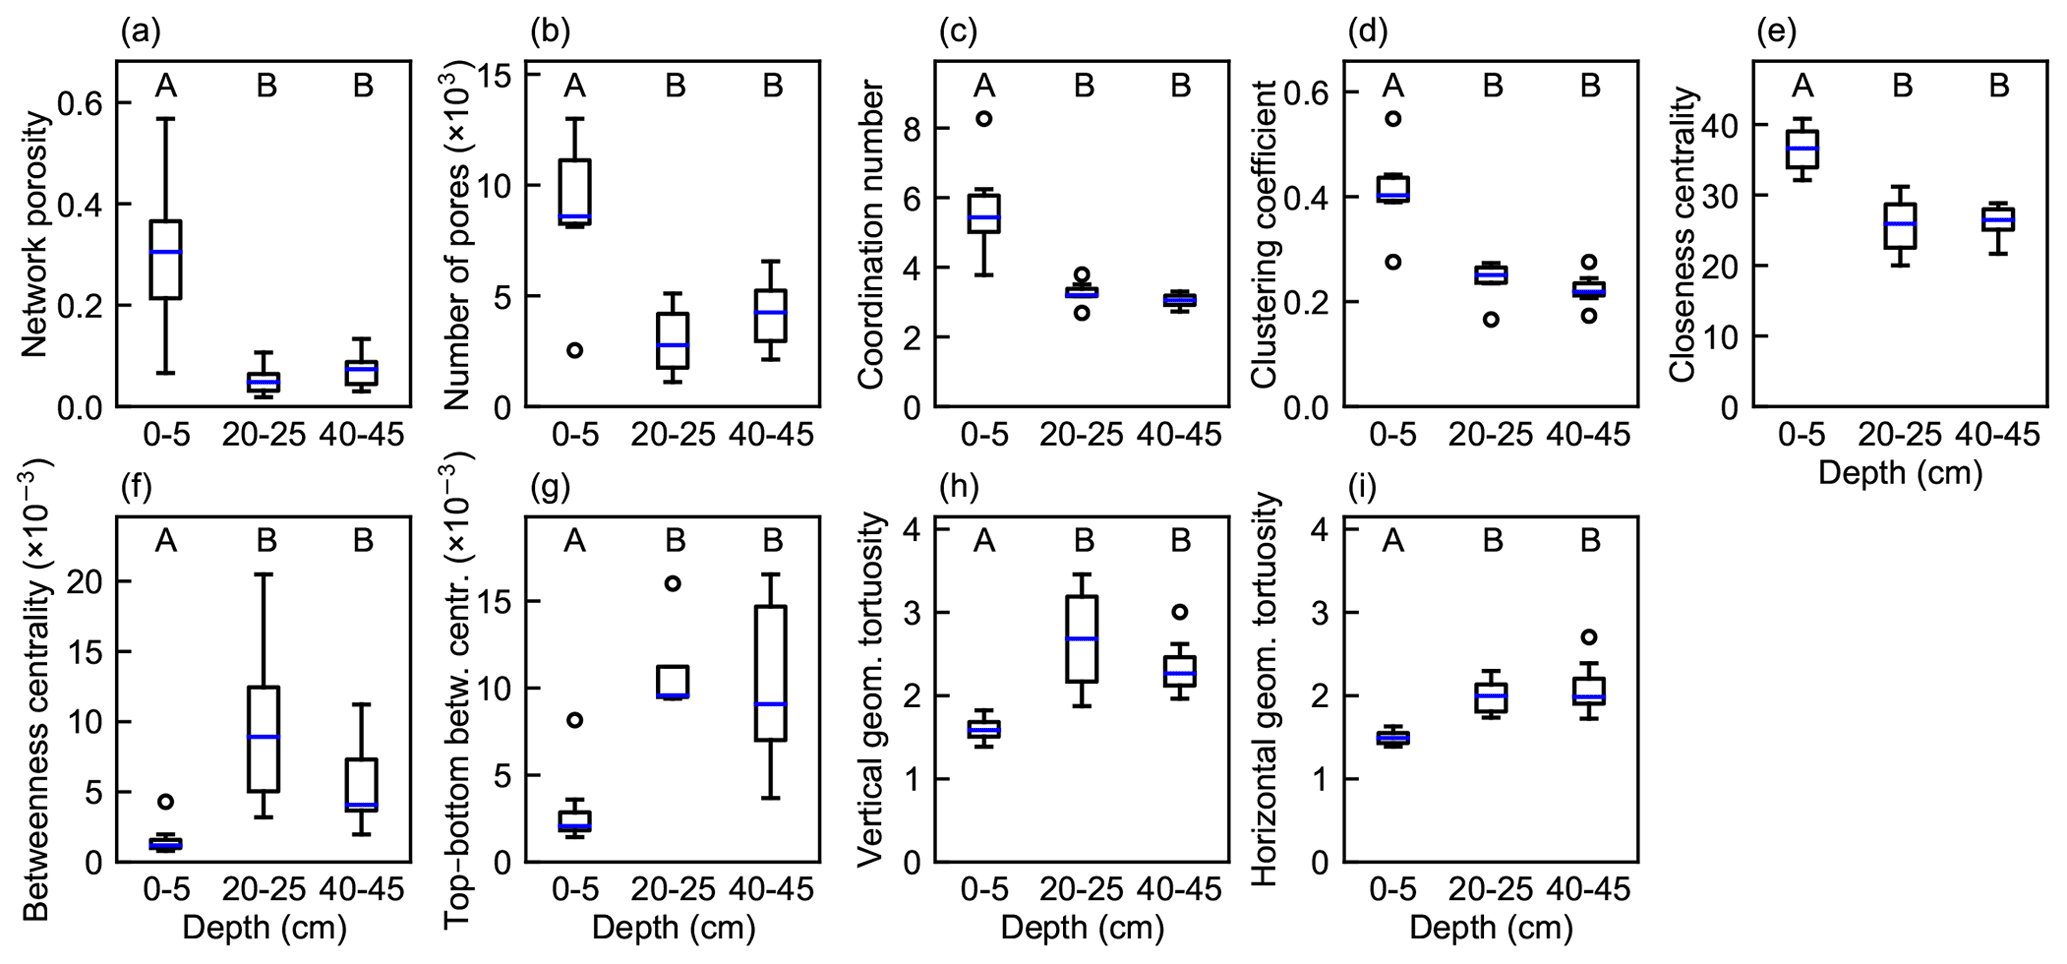
Figure 7Boxplots of properties and metrics of pore networks generated from peat samples from different depths (n=4 for vertical geometrical tortuosity and top–bottom betweenness centrality at 20–25 cm; otherwise n=7). (a) Porosity of the pore networks; (b) number of pores in the networks; (c) network average coordination number; (d) network average clustering coefficient; (e) network average closeness centrality; (f) network average betweenness centrality; (g) average betweenness centrality for paths between top and bottom boundary pores; (h) average geometrical tortuosity of the network in the vertical direction; (i) average geometrical tortuosity of the network in the horizontal direction. Boxes indicate the interquartile range; whiskers extend at most to 1.5 times the interquartile range from the first and from the third quartile, and the blue line shows the median. Letters not shared across depths represent significantly different means via the pairwise comparison tests (p<0.05). The Kruskal–Wallis test and Dunn's post hoc test were used for the coordination number and clustering coefficient; otherwise ANOVA and Tukey's post hoc test were applied.
The vertical geometrical tortuosity was significantly higher than the horizontal geometrical tortuosity in the top-layer networks (mean difference 0.10; two-tailed paired sample t test, t(6)=3.67 and p=0.01), but no significant difference was found at the deeper layers. Furthermore, the variation in geometrical tortuosity in the vertical direction was slightly higher than in the horizontal direction (Fig. 7h, i). In the top layer, vertical geometrical tortuosity decreased with an increasing network average coordination number, clustering coefficient, and closeness centrality and increased with an increasing network average betweenness centrality, but the behavior was very different and inconsistent in deeper layers (Table 2).
Table 2Correlation coefficients between vertical geometrical tortuosity and different network connectivity metrics for pore networks at different depths. The coefficients are shown in italics if the relationship is not significant (p>0.05).

The total volume of the connected pore space increased as a function of the number of pores in the network, but the variation was higher in the top-layer subsamples than in the middle- and bottom-layer subsamples (Fig. 8a). Pore sizes tended to increase with increasing porosity in the top-layer subsamples, whereas this connection was not found for the deeper layers. The network average coordination number, characterizing local network connectivity, increased with increasing porosity in the top-layer subsamples, in which the connected pore space was rather evenly distributed in the network domain (Fig. 8b). In the middle- and bottom-layer networks, the correlation between the coordination number and porosity was slightly weaker. The network average clustering coefficient also increased with an increasing coordination number in all the studied layers (Fig. 8c).
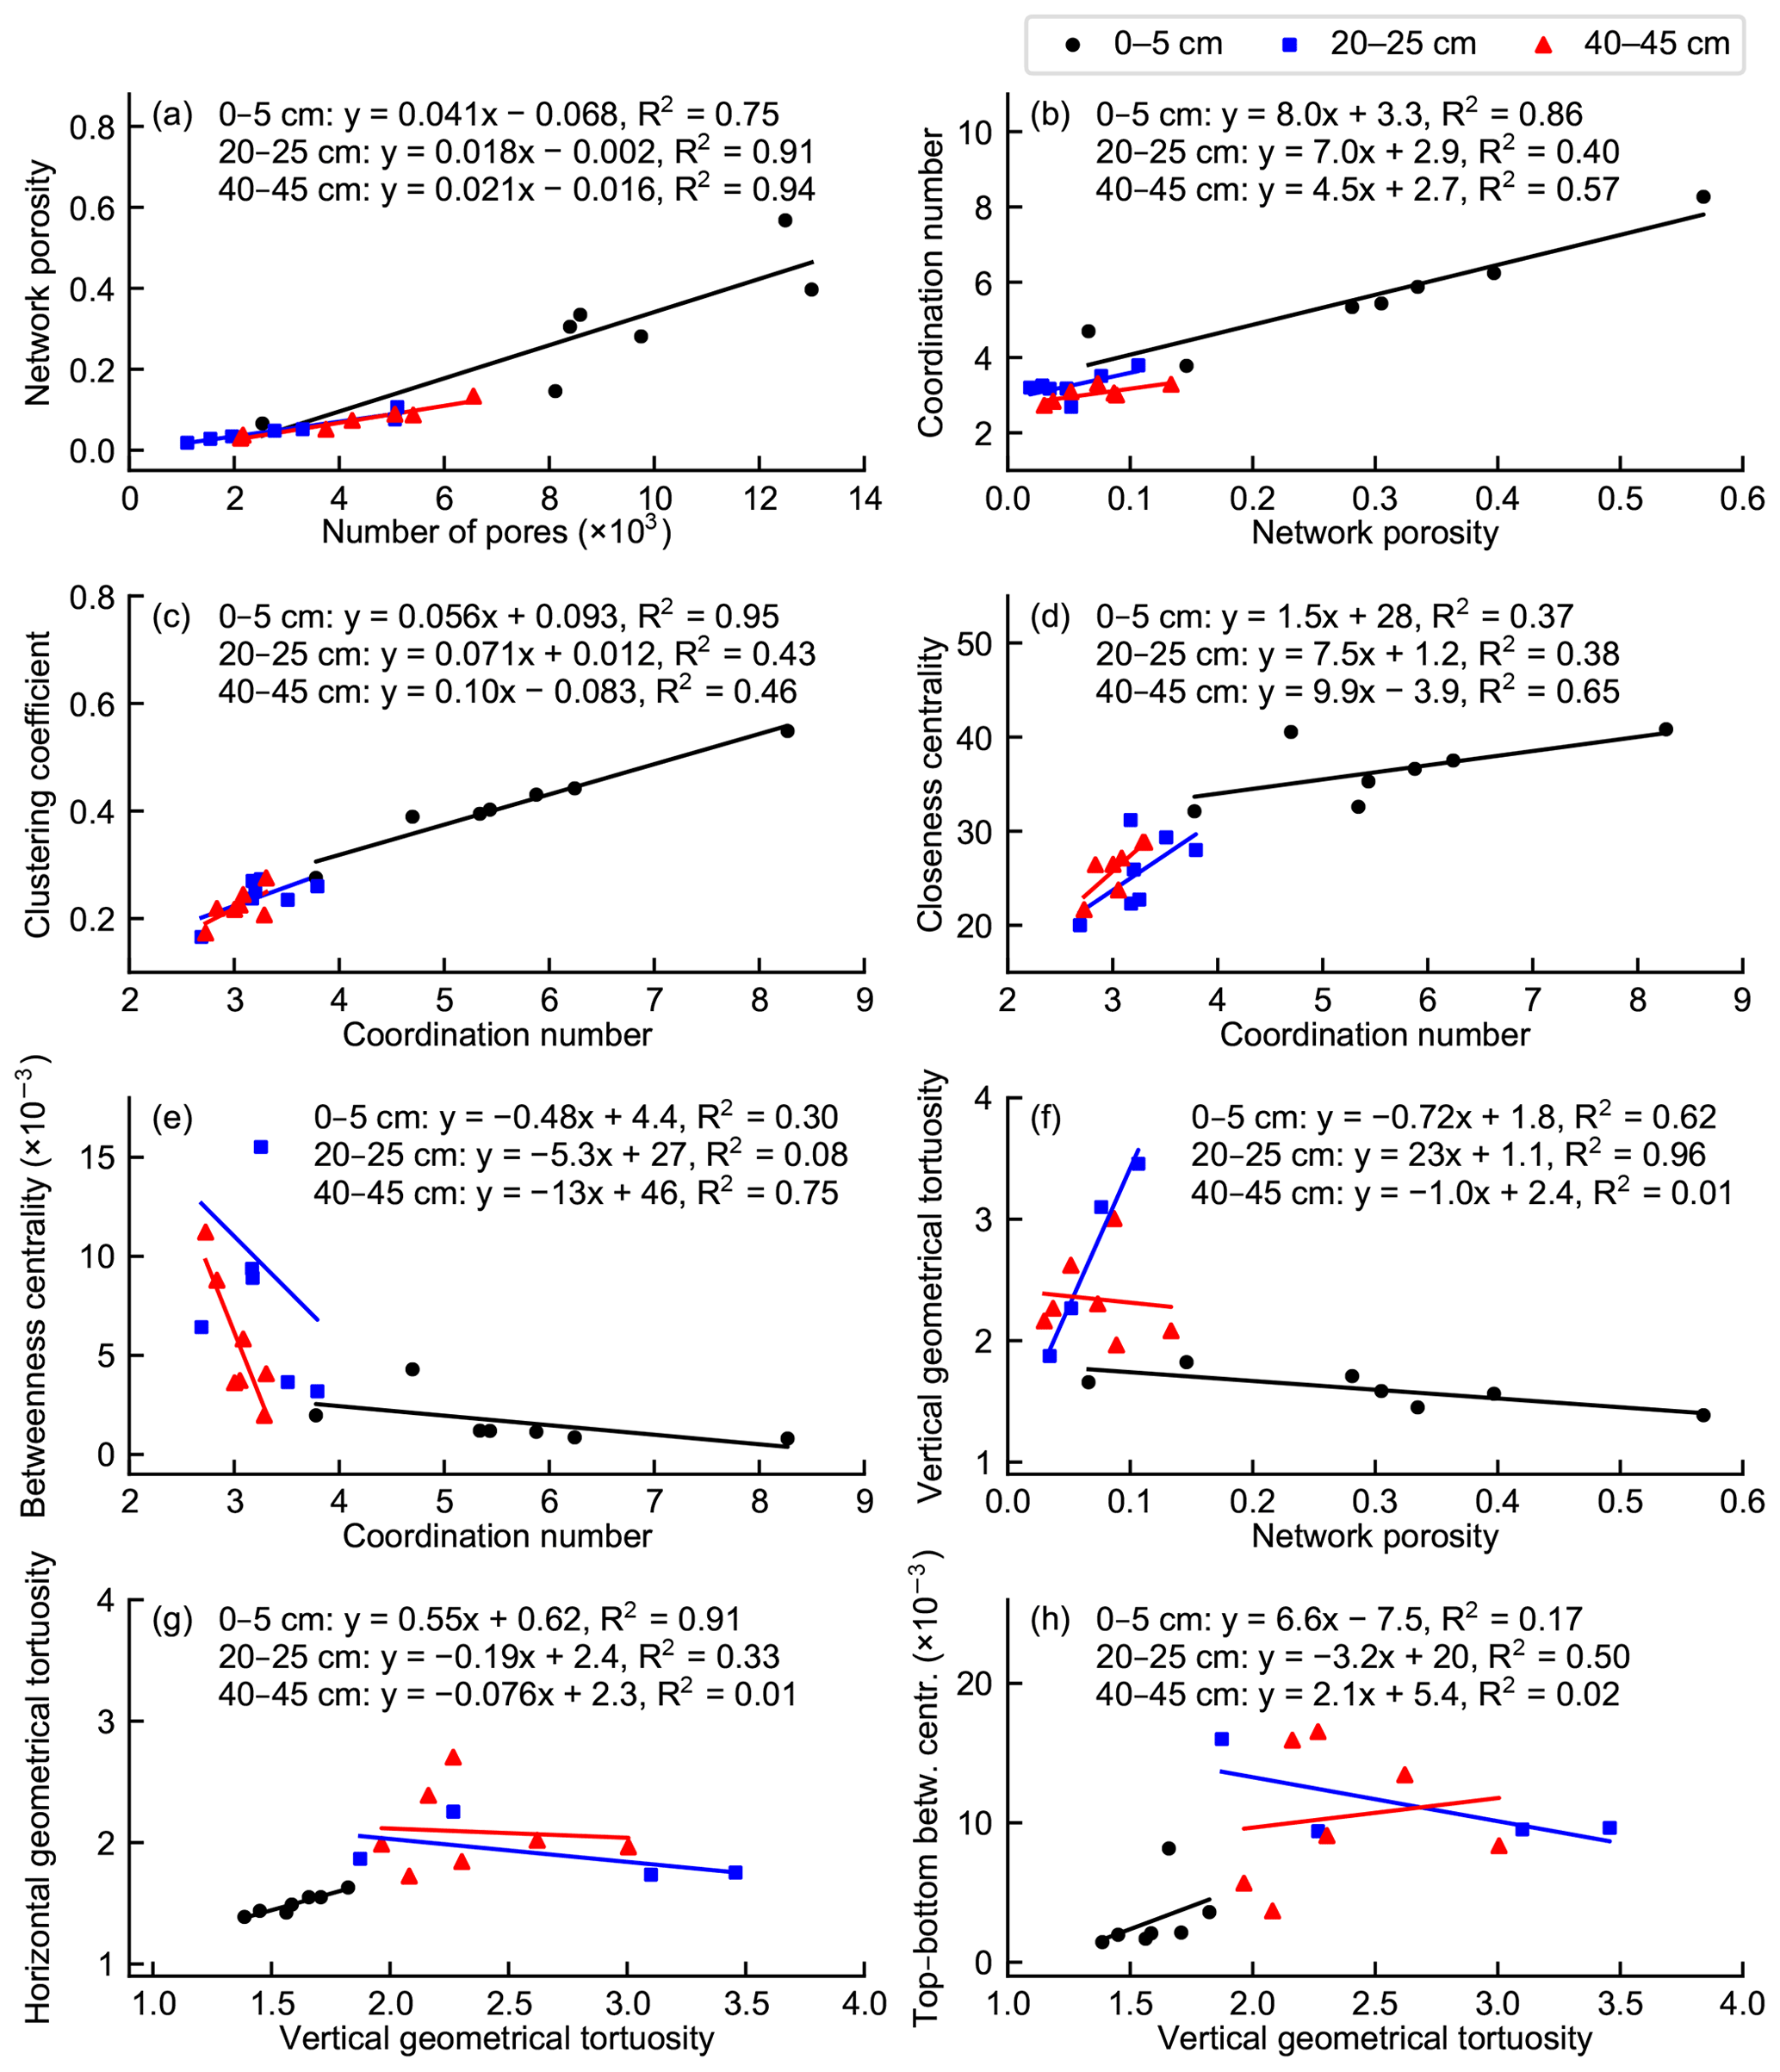
Figure 8Linear relationships among selected pore network properties and average pore network connectivity metrics.
The network average closeness centrality increased with an increasing coordination number in the top layer except for the subsample with smaller network dimensions and largely also in deeper layers (Fig. 8d). By contrast, high local network connectivity indicated a low betweenness centrality especially in the top and bottom layers (Fig. 8e). The connected pore cluster extended from the top to the bottom face of the network domain only in four out of the seven middle-layer subsamples. Vertical geometrical tortuosity and top–bottom betweenness centrality could thus not be determined for the remaining three networks. A higher network porosity indicated a lower vertical tortuosity in the top-layer networks (Fig. 8f). By contrast, the middle- and bottom-layer networks showed high variation in vertical tortuosity in relation to network porosity. Horizontal and vertical geometrical tortuosity were strongly correlated in the top-layer networks, in which the spatial distributions of the pores within the networks were rather uniform (Fig. 8g). In the deeper layers, horizontal and vertical tortuosity were unrelated. Also, vertical geometrical tortuosity and top–bottom betweenness centrality were rather well correlated in the top layer but not in deeper layers (Fig. 8h).
3.5 Air-filled volume fraction
Figure 9 describes the volume fraction of the connected, air-filled pore network of the total pore space at different external pressures. Values less than 1 indicate that a part of the pore space has been isolated from the surrounding volume and O2 supply has ceased. Eventually, the isolation can lead to the formation of an anaerobic pocket. To illustrate the effect of hysteresis, the volume fraction of the connected network was calculated for both imbibition (wetting) and drainage (drying). In imbibition, half of the network remained connected at 0.5 kPa in all layers, whereas in the drainage simulation this required 1 kPa in the top layer and 3 kPa in the middle and bottom layers. The layers behaved rather similarly in imbibition, but in drainage there were clear differences between the layers.

Figure 9Volume fractions of air-filled pore networks of total peat macropore space at external pressures of (a) 0.2 kPa, (b) 0.3 kPa, (c) 0.4 kPa, (d) 0.5 kPa, (e) 0.75 kPa, (f) 1.0 kPa, (g) 2.0 kPa, and (h) 3.0 kPa in drainage and imbibition simulations (n=7 in 0–5 and 40–45 cm, n=5 in drainage and n=6 in imbibition in 20–25 cm). Boxes indicate the interquartile range; whiskers extend at most to 1.5 times the interquartile range from the first and from the third quartile, and the black line shows the median.
The fraction of the total pore network volume of the total pore space volume, which corresponds to the volume fraction at an external pressure of 3 kPa (Fig. 9h), was largest in the top-layer subsamples, extending from 93.6 % to 99.9 %. In the deeper subsamples, 7.4 % to 51.9 % of the total pore space was disconnected from the largest pore cluster. Thus, a significant fraction of macropore space was inactive in the drainage and imbibition simulations in the deeper-layer subsamples, which indicates an even larger pore volume available for anaerobic pocket formation.
4.1 Evaluation of image and network analysis in macropore characterization
The combination of X-ray tomography, image analysis, and network analysis provides detailed information on pore structures, connections, and topology that cannot be obtained through traditional laboratory methods. These properties determine gas exchange in peat and are therefore essential in regulating biological activity. One of the aims of our study was to evaluate the applicability of image analysis and network extraction methods to peat structure characterization. Overall, the image-derived porosities and the simulated water retention characteristics corresponded well with the laboratory measurements given the limitations imposed by the applied imaging resolution. The smallest pore diameter detectable in the µCT imaging was 100 µm, corresponding to a matric suction of approximately 3 kPa. This resolution is sufficient for accurately describing diffusional gas transport in peat soils, where matric suction typically remains low and pores smaller than 100 µm are generally water-filled. By comparison, macropores have been found to dominate water and solute transport in peat (McCarter et al., 2020), and a similar resolution is also considered adequate for simulating hydrological transport processes in water-saturated peat (Gharedaghloo et al., 2018).
Good performance of image segmentation is a crucial prerequisite for a successful application of µCT image analysis and subsequent quantitative analysis tools (Iassonov et al., 2009). The binary segmentation stage succeeded fairly well in our study. The sample void fractions obtained through µCT image analysis were in good agreement with the respective air-filled porosities derived from laboratory measurements (Fig. 3). The slightly lower values obtained from µCT image analysis likely resulted from the limited feature resolution of the images. The matric potential of the soil during µCT imaging (−10 kPa) corresponds to the pressure needed to penetrate a pore with a diameter of approximately 30 µm, whereas the minimum dimension of a detectable void in the images was 100 µm. The number of air-filled pores with diameters between 30 and 100 µm may have been largest in the middle-layer samples, which showed the largest offset between the two measurement methods. In addition, the low intensity contrast between air and water or organic matter in the µCT images obscured the determination of the boundaries of the air-filled regions. Generally, this may have had either an increasing or a decreasing effect on the determined air-filled volume. For example, the global solid–void classification method seems to have overestimated the void volume in some of the images of the top-layer samples. Further, the darkening of the µCT images due to image reconstruction defects near the top and bottom of the sample increased the void fraction slightly in all binary images because the darkened areas were falsely classified as void space at the binary segmentation stage. However, the darkening only affected the image-derived air-filled porosity of the peat samples presented in Fig. 3.
The pore network extraction stage introduced another level of complication into macropore volume characterization. The porosities of the networks used in the water retention simulations were further diminished with respect to the corresponding image porosities, especially in deeper layers. The main reason for this was that a considerable fraction of pore space was disconnected from the active pore network, especially in some of the middle- and bottom-layer samples. This was because narrower void connections may have not been detectable in the images, which may have resulted in some pore clusters or individual pores becoming isolated from the main connected cluster. In addition, some of the reduction in pore space connectivity and in the total combined volume of connected pore space resulted from the division of the total network domain into four discrete regions.
The shrinkage behavior of peat further obscured the determination of network porosity. In the networks with a centered cubic domain, the average porosity was slightly lower in the middle-layer subsamples than in the bottom-layer subsamples (Fig. 7a), while the opposite was the case in the larger-domain cylindrical networks (Fig. 4). In addition to the spatial heterogeneity of air-filled porosity within the samples, the difference can be explained by the variation in horizontal shrinkage between depths. Higher shrinkage in the middle-layer samples decreased the air-filled porosity of the samples, which was reflected in the air-filled porosity of the cubic network domain, which did not include the void region between the shrunk sample and the cylinder walls.
Peat shrinkage during the water retention experiment also affected the results of the water retention simulations. Ideally, the simulated air-filled porosity at the maximum external pressure should have been close to the corresponding measured air-filled porosity at −3 kPa matric potential, which corresponds to the minimum detectable pore throat dimension in the images (Fig. 4). However, because of the limited image resolution, the constructed pore geometry may not totally represent the actual void space geometry under the conditions of −3 kPa or higher matric potentials because the shrinking of the samples may have resulted in a decrease in void space. Thus, a fraction of the pore throats that were air-filled in the samples at −3 kPa matric potential may have shrunk, so they were not detectable in the µCT images constructed at −10 kPa matric potential. This may have generated disconnected pore space in the images and decreased the total volume of the extracted pore network. Also, the shrinkage of the samples may have decreased the dimensions of the pore space so that a higher external pressure was needed for air invasion in the simulations. Conversely, the horizontal shrinkage of some of the samples created continuous void space near the cylinder wall at −10 kPa matric potential, and thus the extracted pore network contained pore space that had presumably not been present in the samples at higher-matric-potential conditions.
4.2 Network connectivity metrics related to peat structure and gas transport
The work of van der Linden et al. (2016) highlights the need for multiscale measures of pore space topology and connectivity and the relationship of these descriptors to macroscopic transport processes in a porous medium, such as peat. Geometrical tortuosity is a structural characteristic of a porous medium (Clennell, 1997). It gives an estimate of the average path length through a pore network in a specified direction, which is a direct proxy for network transport efficiency. Therefore, it can be used as a benchmark measure of the applicability of different network metrics to characterize the transport properties of a network and to estimate the efficiency of macroscopic transfer processes in a network. We compared several kinds of network metrics with the gas transfer capacity estimated by geometrical tortuosity. The pore coordination number and the clustering coefficient were used to characterize the local connectivity of a pore network, whereas closeness centrality and betweenness centrality were used to describe connectivity on the network scale. Furthermore, top–bottom betweenness centrality characterizes the positioning and shape of gas transport routes through the porous medium in a certain direction, thus also describing the efficiency of gas transfer through the medium. It is essential to determine how the local and global network connectivity measures are related to the network gas transfer capability estimated by vertical geometrical tortuosity. According to our results, high average local pore connectivity is not always reflected as high global connectivity or gas transfer capability of the pore space (Fig. 8). The reason for this was that the distribution and spatial coverage of the connected pore space within the porous medium were found to regulate the applicability and comparability of the local and global measures and also their relationship to porosity and tortuosity.
Generally, a higher network porosity implied higher local pore connectivity characterized by the coordination number and the clustering coefficient (Fig. 8b, c). However, if the connected pore space was concentrated in a smaller region in the network domain, which was the case in most of the deeper-layer subsamples, local connectivity was rather high even though the porosity of the network was relatively low. Likewise, the relationship between local and global connectivity measures was largely dictated by the shape and topology of the network. In general, higher local network connectivity was reflected as a higher average closeness centrality (Fig. 8d), which means that the path lengths between pores shortened when more alternative paths were available. The average betweenness centrality mainly decreased with an increasing average coordination number at all depths, which indicates that the shortest routes between pairs of pores were spread out more widely when the number of pores and their connectivity were higher (Fig. 8e). However, some variation existed especially at deeper layers, where the porosity was lower and the spatial extent of the network was typically smaller.
The location of a pore largely determines its centrality in a spatial network because the probability of a pore being part of the shortest route between two other pores is highest near the centroid of the network (Barthélemy, 2011). A high abundance of dead-end pores or pores located near the extremities of the network decreases the average betweenness centrality because these pores do not belong to the shortest paths between other regions. In addition, the closeness centrality of a pore (the reciprocal of the average of the shortest path lengths from a pore to every other pore) is related to the dimensions of a network within its domain. If a network covers only a fraction of its domain or if it contains dense local clusters with narrow pore channels between them, the average closeness centrality may become relatively high even if the average coordination number is rather low.
The ratio between the two local connectivity measures may reflect the structure of a pore network in regard to gas transfer efficiency. A high ratio of the network average clustering coefficient to the network average coordination number indicates that the number of three-pore loops is relatively high and may also imply that even larger clusters of interconnected nearby pores are abundant in the network. This may be reflected as a high gas transfer capacity and good resilience to disturbances. By contrast, a low ratio may result from a high abundance of long nonbranching pore conduits in the network, which may diminish the number of alternative transport routes within the network and lead to a rapid suppression of gas transport if pores become clogged.
The geometrical tortuosity of a pore network in a certain direction is strongly dependent on the geometry of the connected cluster within the network domain and on the localization of the boundary pores. If the boundary pores are spread evenly on the opposite surfaces of the domain and the internal pores are also uniformly distributed in the network domain, the geometrical tortuosity is relatively low even if the network porosity is low. By contrast, if the number of boundary pores is low and these pores are located in a small area or if there are constrictions in the pore space, the average length of the shortest paths between the boundary pores may be high even if the total number of the pores is high and the network is otherwise well connected.
Top–bottom betweenness centrality is a network measure defined in this study to characterize the distribution of transport paths through a network. A high network average top–bottom betweenness centrality may imply that the optimal flow routes between the top and bottom of the network domain are governed by a small number of different paths and that transport through the network may therefore be sensitive to individual disturbances within the flow routes. Our results showed a correspondence between geometrical tortuosity and top–bottom betweenness centrality in the top-layer networks, most of which had a spatially rather even pore distribution (Fig. 8h). If the average shortest path length between the top and bottom boundary pores is low (the vertical geometrical tortuosity is low) and the boundary pores are located evenly on the top and bottom surfaces of the domain, the shortest paths between different pairs of boundary pores are also located more evenly throughout the network (the average top–bottom betweenness centrality is low). Because of a smaller number and more localized spatial distribution of boundary pores and more variable network topology and geometrical structure, there was evidently no correspondence between vertical geometrical tortuosity and top–bottom betweenness centrality in the deeper layers.
A low geometrical tortuosity of a pore network suggests that gas transfer through the network is efficient in a specified direction. In the top-layer subsamples with a higher network porosity and a stronger correlation between vertical tortuosity and network porosity (Fig. 8f), a lower vertical geometrical tortuosity was strongly related to network metric values that indicated higher network connectivity (Table 2). By contrast, such a correlation was not found for any local or global connectivity metrics in other layers. Thus, the applicability of network connectivity metrics to the description of network transport properties seems to be highly sensitive to the spatial distribution of the network within its domain. The average closeness centrality of a pore network has been found to be a proxy for the efficiency of fluid flow in porous media (van der Linden et al., 2019). The simulation of diffusion through a peat pore network and the comparison of different network metrics with effective diffusivity could give further insight into the relation of network theory measures to macroscale gas transfer processes in peat. In addition to network average connectivity metrics, analysis of the distributions of different connectivity measures of individual pores within a network could further illustrate the properties of peat pore structure.
The structural anisotropy of peat, characterized by the difference between vertical and horizontal geometrical tortuosity, can be used to characterize the diffusion capability of a gas in different directions through peat. In this study, the pore structure was slightly anisotropic in the top layer, but no anisotropy was found in deeper layers. Thus, structural anisotropy decreased with lower network porosity and pore connectivity. However, the geometrical tortuosity was highly variable between samples in deeper layers because of the very heterogeneous spatial distribution of the pores in the middle- and bottom-layer networks. The variation in anisotropy between depths suggests that chains of pores existed between horizontally oriented, less degraded plant residues, giving rise to a low horizontal geometrical tortuosity. In deeper levels with more degraded and compacted peat, the horizontally oriented pore chains had fractured and collapsed and the structural anisotropy had diminished. These findings are in line with Kruse et al. (2008) and Liu et al. (2016), who found that the anisotropy of the hydraulic conductivity of fen peat decreased with increasing degradation. According to our results, the orientation of diffusion paths in pore networks is such that it does not restrain gas transfer towards the atmosphere in deeper, more degraded peat layers. In less degraded peat near the surface, the impact of the orientation of plant litter on the primary diffusion direction may be more pronounced. However, higher pore connectivity and porosity in the less degraded peat may outweigh the hindering effect of structural anisotropy on the rate of gas diffusion from the peat to the atmosphere.
4.3 Conceptual implications for anaerobic pocket formation and methane dynamics
Emissions of CH4 from northern peatlands are characterized by large spatiotemporal variation (Abdalla et al., 2016; Rinne et al., 2018). The CH4 efflux usually occurs episodically and in hotspots (Lai, 2009), and the supply of O2 and gas diffusion conditions in the soil profile are the main abiotic factors affecting CH4 emissions (Xu et al., 2016). We argue that the structure, topology, and behavior of peat macropore networks above the WT can make these networks a good candidate for explaining the spatiotemporal variation in peatland CH4 emissions. The following conceptualization describes the pore network, anaerobic pocket formation, and CH4 production and transport: when the pore network is internally connected and open to the atmosphere, the supply of O2 to the soil is adequate and facilitates aerobic decomposition. When some of the pores become blocked by water, the O2 supply to the soil gradually decreases as the number of air-conducting pores decreases and the airflow paths become longer and more tortuous. With increasing water content, part of the pore network becomes isolated and the O2 supply is prevented. Next, microbial activity consumes the trapped O2, and the microbial metabolism changes to alternative electron acceptors. In the final stage, the production of CH4 starts. An anaerobic pocket has formed. When soil water content decreases again, the network becomes connected, and the CH4 trapped in the pocket is released and can be detected as a burst of CH4 emission at the soil surface.
The existence of isolated anaerobic macropore clusters above the WT may also enable CH4 production in newly aerated layers during a drying period (Knorr et al., 2008; Estop-Aragonés and Blodau, 2012). Large macropores are drained and exposed to O2 as the WT declines, but pore clusters with narrower throats adjacent to the air-filled regions remain anoxic if diffusional O2 supply to these water-filled pores is inadequate. If the isolated macropores are formed close to the peat surface, the time span that a substance needs to diffuse to the atmosphere is relatively short, and, consequently, there is limited exposure to oxidation in the aerated layer. Thus, methanogenesis in isolated near-surface macropores may significantly increase the atmospheric emission of CH4 (Estop-Aragonés et al., 2013). In addition, anaerobic pore clusters may be the regions where anaerobic microbes may survive above the WT and facilitate the onset of CH4 production when the WT rises again (Kettunen et al., 1999).
Our drainage and imbibition simulations indicated that hysteresis may affect the evolution of the fraction of peat pore space that is isolated from the atmosphere. The volume fraction of the air-filled pore space connected to the atmosphere at a specific matric potential was considerably smaller during drying than during wetting. This may further provide support for the conception that hysteresis may also affect the formation and destruction of anaerobic pockets and the temporal CH4 dynamics in the unsaturated layer. Figure 9 indicates conditions under which the anaerobic pockets are likely to occur. When the peat is drying, the macropore network remains largely water-filled until a matric potential of −2 to −3 kPa, which under hydrostatic equilibrium corresponds to a distance of 20–30 cm from the WT. This promotes a high abundance of anaerobic pockets in the unsaturated layer close to the WT. The thickness of this layer is greater at deeper depths, where the average pore throat dimensions are smaller. On a hectare scale, this suggests that 2000–3000 m3 of unsaturated peat is potentially active in CH4 production. Under wetting conditions, the macropore network remains largely air-filled until the matric potential is higher than −1 kPa or the distance to the WT is less than 10 cm. This means that the thickness of the layer where anaerobic pockets can be formed when the WT is rising is less than 10 cm. The large difference between the thickness of the pocketing layer under drying and wetting conditions is likely to cause a short-term mismatch between peatland CH4 emissions and WT observations. For example, the hysteresis effect may contribute to the lagged response of CH4 flux to a rising WT that has been observed in peatland ecosystems (Kettunen et al., 1996; Goodrich et al., 2015).
The average pore volumes and pore throat diameters were smaller at deeper depths than in the near-surface peat (Fig. 6). The higher volume fraction of large pores in the top layer compared to deeper layers is also seen in the air invasion curves as a higher relative air-filled porosity at −1 kPa matric potential (Fig. 4). The reduction in pore space volume and pore dimensions with depth, which is due to an increasing degree of decomposition of peat and higher compression by overlying matter (Rezanezhad et al., 2016), is a typical feature of peat soil (Rezanezhad et al., 2010; Weber et al., 2017; Gharedaghloo et al., 2018). Thus, the macropore network is drained at lower matric potentials in deeper peat than near the soil surface. In addition, the variation in porosity and the variation in average pore volume between the samples were largest in the top layer (Fig. 8a). An increasing degree of decomposition deeper in the peat profile also results in the homogenization of peat and smaller spatial variability in the pore size distribution (Weber et al., 2017). In our samples, virtually all macropores were connected at −3 kPa matric potential in the top layer, whereas roughly one-quarter of the macropore volume was still isolated in deeper layers (Fig. 9). As a result, the width of the layer favorable for anaerobic pocket formation is greater in deeper, more decomposed peat. However, the lower macroporosity and smaller average volume of pores may reduce the total volume of anaerobic pockets and limit the capacity for methanogenesis in the pocketing layer at deeper depths.
In our study, the peat samples originated from a drained forested peatland site. The total porosity range of the studied peat layers was well in line with the values and the vertical variation reported for the near-surface layers of drained peatlands in the literature (Päivänen, 1973; Minkkinen and Laine, 1998). However, the peat soil of a drained peatland differs in physical characteristics and pore size distribution from that of an undisturbed peatland (Liu et al., 2020). Pore deformation due to peat shrinkage induced by drainage is partly irreversible (Price, 2003), and the pressure of a growing tree stand may further compact the peat layer and increase its bulk density in deeper layers (Minkkinen and Laine, 1998). Also, the saturated peat layer below the WT may be further compressed due to the weight of overlying peat that has become drier and lost the support by buoyancy (Hooijer et al., 2012; Sloan et al., 2019). These processes decrease the macroporosity of the peat profile in drained peatlands in comparison to undisturbed peatlands (Liu et al., 2020). Therefore, conditions for methanogenesis may be even more favorable in undisturbed peatlands because of a potentially larger volume of macropore space available for anaerobic pocket formation.
The network analysis of the peat pore system enabled by µCT imaging and a network representation of peat macropores demonstrated fundamental differences in peat pore structure and macropore characteristics between topsoil and deeper soil layers. Pore space was more connected and routes through the peat matrix were less tortuous in the top layer than in deeper layers. Decreasing pore connectivity with depth was accompanied by a lower number of macropores, smaller macropore volumes, and narrower pore throats. This may indicate that the rate of gas diffusion in the air-filled pore space is reduced in deeper peat layers. The results also suggest that local and global network connectivity metrics might be used to estimate the efficiency of diffusional gas transfer in the air-filled pore space of peat. However, we highlight that connectivity metrics should be evaluated with caution because not only pore connectivity but also the extent and spatial distribution of connected air-filled pore space regulate the gas transfer capabilities.
Pore network analysis may also provide new insights into the impact of pore structure and pore space connectivity on conditions regulating CH4 production and transfer in peat. As the WT is generally close to the surface and low-suction conditions prevail in peatlands, small pores remain continuously water-filled and diffusional gas transfer occurs in the air-filled macropore network above the WT. We argue that the complex pore structure and the vertical variation in the pore characteristics of peat may promote the formation of anaerobic pockets above the WT during fluctuations in soil water content. When the WT finally declines and soil water content decreases, CH4 produced in these pockets can be released rapidly via air-filled macropores. In addition, hysteresis was found to regulate the thickness of the zone favorable for anaerobic pocket formation. Under the same WT, the pocketing can be distinctively different depending on whether the peat is wetting or drying. This may provide an explanation for the observed hotspots and episodic spikes of CH4 emissions in peatlands. Most importantly, a pore network representation of peat macropore structure enables the application of pore network modeling, which is a useful method for the pore-scale description of CH4 production and transfer processes in peat and for the investigation of relations between peat pore structure and CH4 dynamics.
The data that support the findings of this study, the Python scripts used in the calculations, and the simulation output are available at https://doi.org/10.5281/zenodo.6327112 (Kiuru et al., 2022). The µCT image, binary image, and pore network data are available from the corresponding author upon reasonable request. The image processing and simulation parts of this study used the publicly available packages PoreSpy and OpenPNM.
AL, TG, and IU developed the idea and designed the study. AL and MP collected the samples and performed the water retention measurements. TG and MR organized the µCT imaging and 3D reconstruction. PK processed the images, designed and conducted the computations and simulations, and analyzed the data. PK and LK performed the statistical analysis. PK, AL, and MP wrote the manuscript with significant contributions from TG, VG, and IU. All other authors provided edits and comments on the paper. AL and MR are responsible for the funding acquisition.
The contact author has declared that neither they nor their co-authors have any competing interests.
Publisher’s note: Copernicus Publications remains neutral with regard to jurisdictional claims in published maps and institutional affiliations.
The authors would like to thank the referees for their thorough and insightful comments on the paper.
This research has been supported by the Academy of Finland (grant nos. 325168 and 325169). Lukas Kohl holds a Marie Skłodowska-Curie Actions fellowship under the European Commission's Horizon 2020 program (grant no. 843511). Annamari Laurén was supported by funding from the Academy of Finland to strengthen university research profiles in Finland for the years 2017–2021 (funding decision 311925). Maarit Raivonen was supported by SRC at the Academy of Finland (SOMPA, no. 312932) and EU Horizon 2020 (VERIFY, no. 776810). This work used services of the Helsinki University X-Ray Micro-CT Laboratory, also funded by the Helsinki Institute of Life Science (HiLIFE) under the HAIP platform.
This paper was edited by Ben Bond-Lamberty and reviewed by two anonymous referees.
Abdalla, M., Hastings, A., Truu, J., Espenberg, M., Mander, Ü., and Smith, P.: Emissions of methane from northern peatlands: a review of management impacts and implications for future management options, Ecol. Evol., 6, 7080–7102, https://doi.org/10.1002/ece3.2469, 2016. a, b
Asmala, E., Carstensen, J., and Räike, A.: Multiple anthropogenic drivers behind upward trends in organic carbon concentrations in boreal rivers, Environ. Res. Lett., 14, 124018, https://doi.org/10.1088/1748-9326/ab4fa9, 2019. a
Bachmann, J. and van der Ploeg, R. R.: A review on recent developments in soil water retention theory: interfacial tension and temperature effects, J. Plant Nutr. Soil Sc., 165, 468–478, https://doi.org/10.1002/1522-2624(200208)165:4<468::AID-JPLN468>3.0.CO;2-G, 2002. a
Ball, B. C. and Smith, K. A.: Gas movement and air-filled porosity, in: Soil and Environmental Analysis: Physical Methods, edited by: Smith, K. A. and Mullins, C. E., 499–538, Marcel Dekker, New York, NY, 2001. a
Barthélemy, M.: Spatial networks, Phys. Rep., 499, 1–101, https://doi.org/10.1016/j.physrep.2010.11.002, 2011. a
Beckwith, C. W., Baird, A. J., and Heathwaite, A. L.: Anisotropy and depth-related heterogeneity of hydraulic conductivity in a bog peat. I: laboratory measurements, Hydrol. Process., 17, 89–101, https://doi.org/10.1002/hyp.1116, 2003. a
Beven, K. and Germann, P.: Macropores and water flow in soils, Water Resour. Res., 18, 1311–1325, https://doi.org/10.1029/WR018i005p01311, 1982. a
Bhuiyan, R., Minkkinen, K., Helmisaari, H.-S., Ojanen, P., Penttilä, T., and Laiho, R.: Estimating fine-root production by tree species and understorey functional groups in two contrasting peatland forests, Plant Soil, 412, 299–316, https://doi.org/10.1007/s11104-016-3070-3, 2017. a
Blunt, M. J., Bijeljic, B., Dong, H., Gharbi, O., Iglauer, S., Mostaghimi, P., Paluszny, A., and Pentland, C.: Pore-scale imaging and modelling, Adv. Water Resour., 51, 197–216, https://doi.org/10.1016/j.advwatres.2012.03.003, 2013. a
Clennell, M. B.: Tortuosity: a guide through the maze, Geol. Soc. Lond. Spec. Publ., 122, 299–344, https://doi.org/10.1144/GSL.SP.1997.122.01.18, 1997. a, b
Deppe, M., Knorr, K.-H., McKnight, D. M., and Blodau, C.: Effects of short-term drying and irrigation on CO2 and CH4 production and emission from mesocosms of a northern bog and an alpine fen, Biogeochemistry, 100, 89–103, https://doi.org/10.1007/s10533-010-9406-9, 2010. a
Estop-Aragonés, C. and Blodau, C.: Effects of experimental drying intensity and duration on respiration and methane production recovery in fen peat incubations, Soil Biol. Biochem., 47, 1–9, https://doi.org/10.1016/j.soilbio.2011.12.008, 2012. a
Estop-Aragonés, C., Knorr, K.-H., and Blodau, C.: Controls on in situ oxygen and dissolved inorganic carbon dynamics in peats of a temperate fen, J. Geophys. Res., 117, G02002, https://doi.org/10.1029/2011JG001888, 2012. a
Estop-Aragonés, C., Knorr, K.-H., and Blodau, C.: Belowground in situ redox dynamics and methanogenesis recovery in a degraded fen during dry-wet cycles and flooding, Biogeosciences, 10, 421–436, https://doi.org/10.5194/bg-10-421-2013, 2013. a
Evans, C. D., Peacock, M., Baird, A. J., Artz, R. R. E., Burden, A., Callaghan, N., Chapman, P. J., Cooper, H. M., Coyle, M., Craig, E., Cumming, A., Dixon, S., Gauci, V., Grayson, R. P., Helfter, C., Heppell, C. M., Holden, J., Jones, D. L., Kaduk, J., Levy, P., Matthews, R., McNamara, N. P., Misselbrook, T., Oakley, S., Page, S. E., Rayment, M., Ridley, L. M., Stanley, K. M., Williamson, J. L., Worrall, F., and Morrison, R.: Overriding water table control on managed peatland greenhouse gas emissions, Nature, 593, 548–552, https://doi.org/10.1038/s41586-021-03523-1, 2021. a
Fan, Z., Neff, J. C., Waldrop, M. P., Ballantyne, A. P., and Turetsky, M. R.: Transport of oxygen in soil pore-water systems: implications for modeling emissions of carbon dioxide and methane from peatlands, Biogeochemistry, 121, 455–470, https://doi.org/10.1007/s10533-014-0012-0, 2014. a
Freeman, L. C.: A set of measures of centrality based on betweenness, Sociometry, 40, 35–41, https://doi.org/10.2307/3033543, 1977. a
Freeman, L. C.: Centrality in social networks conceptual clarification, Soc. Networks, 1, 215–239, https://doi.org/10.1016/0378-8733(78)90021-7, 1978. a
Frolking, S., Talbot, J., Jones, M. C., Treat, C. C., Kauffman, J. B., Tuittila, E.-S., and Roulet, N.: Peatlands in the Earth’s 21st century climate system, Environ. Rev., 19, 371–396, https://doi.org/10.1139/a11-014, 2011. a
Gharedaghloo, B., Price, J. S., Rezanezhad, F., and Quinton, W. L.: Evaluating the hydraulic and transport properties of peat soil using pore network modeling and X-ray micro computed tomography, J. Hydrol., 561, 494–508, https://doi.org/10.1016/j.jhydrol.2018.04.007, 2018. a, b
Goodrich, J. P., Campbell, D. I., Roulet, N. T., Clearwater, M. J., and Schipper, L. A.: Overriding control of methane flux temporal variability by water table dynamics in a Southern Hemisphere, raised bog, J. Geophys. Res.-Biogeosci., 120, 819–831, https://doi.org/10.1002/2014JG002844, 2015. a
Gorham, E.: Northern peatlands: role in the carbon cycle and probable responses to climatic warming, Ecol. Appl., 1, 182–195, https://doi.org/10.2307/1941811, 1991. a
Gostick, J., Aghighi, M., Hinebaugh, J., Tranter, T., Hoeh, M. A., Day, H., Spellacy, B., Sharqawy, M. H., Bazylak, A., Burns, A., Lehnert, W., and Putz, A.: OpenPNM: A pore network modeling package, Comput. Sci. Eng., 18, 60–74, https://doi.org/10.1109/MCSE.2016.49, 2016. a
Gostick, J. T.: Versatile and efficient pore network extraction method using marker-based watershed segmentation, Phys. Rev. E, 96, 023307, https://doi.org/10.1103/PhysRevE.96.023307, 2017. a, b
Gostick, J. T., Khan, Z. A., Tranter, T. G., Kok, M. D. R., Agnaou, M., Sadeghi, M., and Jervis, R.: PoreSpy: A Python toolkit for quantitative analysis of porous media images, J. Open Source Softw., 4, 1296, https://doi.org/10.21105/joss.01296, 2019. a
Hagberg, A. A., Schult, D. A., and Swart, P. J.: Exploring network structure, dynamics, and function using NetworkX, in: Proceedings of the 7th Python in Science Conference (SciPy2008), edited by: Varoquaux, G., Vaught, T., and Millman, J., Pasadena, California, 19–24 August 2008, 11–15, https://doi.org/10.25080/issn.2575-9752, 2008. a
Hagedorn, F. and Bellamy, P.: Hot spots and hot moments for greenhouse gas emissions from soils, in: Soil Carbon in Sensitive European Ecosystems: From Science to Land Management, edited by: Jandl, R., Rodeghiero, M., and Olsson, M., 13–32, Wiley-Blackwell, Chichester, UK, https://doi.org/10.1002/9781119970255.ch2, 2011. a
Hayward, P. M. and Clymo, R. S.: Profiles of water content and pore size in Sphagnum and peat, and their relation to peat bog ecology, P. Roy. Soc. Lond. B Bio., 215, 299–325, https://doi.org/10.1098/rspb.1982.0044, 1982. a
Helliwell, J. R., Sturrock, C. J., Grayling, K. M., Tracy, S. R., Flavel, R. J., Young, I. M., Whalley, W. R., and Mooney, S. J.: Applications of X-ray computed tomography for examining biophysical interactions and structural development in soil systems: a review, Eur. J. Soil Sci., 64, 279–297, https://doi.org/10.1111/ejss.12028, 2013. a
Hillel, D.: Introduction to Environmental Soil Physics, Academic Press, San Diego, California, ISBN: 978-0-12-348525-0, 1998. a, b
Holden, J.: Peatland hydrology and carbon release: why small-scale process matters, Philos. T. R. Soc. A, 363, 2891–2913, https://doi.org/10.1098/rsta.2005.1671, 2005. a
Hooijer, A., Page, S., Jauhiainen, J., Lee, W. A., Lu, X. X., Idris, A., and Anshari, G.: Subsidence and carbon loss in drained tropical peatlands, Biogeosciences, 9, 1053–1071, https://doi.org/10.5194/bg-9-1053-2012, 2012. a
Iassonov, P., Gebrenegus, T., and Tuller, M.: Segmentation of X-ray computed tomography images of porous materials: A crucial step for characterization and quantitative analysis of pore structures, Water Resour. Res., 45, W09415, https://doi.org/10.1029/2009WR008087, 2009. a
Kang, H., Kwon, M. J., Kim, S., Lee, S., Jones, T. G., Johncock, A. C., Haraguchi, A., and Freeman, C.: Biologically driven DOC release from peatlands during recovery from acidification, Nat. Commun., 9, 3807, https://doi.org/10.1038/s41467-018-06259-1, 2018. a
Kettunen, A., Kaitala, V., Alm, J., Silvola, J., Nykänen, H., and Martikainen, P. J.: Cross-correlation analysis of the dynamics of methane emissions from a boreal peatland, Glob. Biogeochem. Cy., 10, 457–471, https://doi.org/10.1029/96GB01609, 1996. a
Kettunen, A., Kaitala, V., Lehtinen, A., Lohila, A., Alm, J., Silvola, J., and Martikainen, P. J.: Methane production and oxidation potentials in relation to water table fluctuations in two boreal mires, Soil Biol. Biochem., 31, 1741–1749, https://doi.org/10.1016/S0038-0717(99)00093-0, 1999. a
Kiuru, P., Palviainen, M., and Laurén, A.: Peat macropore networks – new insights into episodic and hotspot methane emission, Zenodo [data set], https://doi.org/10.5281/zenodo.6327112, 2022. a
Knorr, K.-H., Oosterwoud, M. R., and Blodau, C.: Experimental drought alters rates of soil respiration and methanogenesis but not carbon exchange in soil of a temperate fen, Soil Biol. Biochem., 40, 1781–1791, https://doi.org/10.1016/j.soilbio.2008.03.019, 2008. a
Knorr, K.-H., Lischeid, G., and Blodau, C.: Dynamics of redox processes in a minerotrophic fen exposed to a water table manipulation, Geoderma, 153, 379–392, https://doi.org/10.1016/j.geoderma.2009.08.023, 2009. a
Koskinen, M., Minkkinen, K., Ojanen, P., Kämäräinen, M., Laurila, T., and Lohila, A.: Measurements of CO2 exchange with an automated chamber system throughout the year: challenges in measuring night-time respiration on porous peat soil, Biogeosciences, 11, 347–363, https://doi.org/10.5194/bg-11-347-2014, 2014. a
Kruse, J., Lennartz, B., and Leinweber, P.: A modified method for measuring saturated hydraulic conductivity and anisotropy of fen peat samples, Wetlands, 28, 527–531, https://doi.org/10.1672/07-153.1, 2008. a
Lai, D. Y. F.: Methane dynamics in northern peatlands: A review, Pedosphere, 19, 409–421, https://doi.org/10.1016/S1002-0160(09)00003-4, 2009. a
Laine, J. and Vasander, H.: Ecology and vegetation gradients in peatlands, in: Peatlands in Finland, edited by: Vasander, H., 10–19, Finnish Peatland Society, Helsinki, Finland, ISBN: 952-90-7971-0, 1996. a
Laine-Kaulio, H.: Development and analysis of dual-permeability model for subsurface stormflow and solute transport in a forested hillslope, PhD thesis, Department of Civil and Environmental Engineering, Aalto University School of Engineering, Espoo, Finland, ISBN: 978-952-60-4245-9, 2011. a
Larsbo, M., Koestel, J., and Jarvis, N.: Relations between macropore network characteristics and the degree of preferential solute transport, Hydrol. Earth Syst. Sci., 18, 5255–5269, https://doi.org/10.5194/hess-18-5255-2014, 2014. a
Laurén, A.: Physical properties of the mor layer in a Scots pine stand II. Air permeability, Can. J. Soil Sci., 77, 635–642, https://doi.org/10.4141/S95-003, 1997. a
Leifeld, J., Wüst-Galley, C., and Page, S.: Intact and managed peatland soils as a source and sink of GHGs from 1850 to 2100, Nat. Clim. Change, 9, 945–947, https://doi.org/10.1038/s41558-019-0615-5, 2019. a
Lepilin, D., Laurén, A., Uusitalo, J., and Tuittila, E.-S.: Soil deformation and its recovery in logging trails of drained boreal peatlands, Can. J. Forest Res., 49, 743–751, https://doi.org/10.1139/cjfr-2018-0385, 2019. a, b
Limpens, J., Berendse, F., Blodau, C., Canadell, J. G., Freeman, C., Holden, J., Roulet, N., Rydin, H., and Schaepman-Strub, G.: Peatlands and the carbon cycle: from local processes to global implications – a synthesis, Biogeosciences, 5, 1475–1491, https://doi.org/10.5194/bg-5-1475-2008, 2008. a
Lindquist, W. B., Lee, S.-M., Coker, D. A., Jones, K. W., and Spanne, P.: Medial axis analysis of void structure in three-dimensional tomographic images of porous media, J. Geophys. Res., 101, 8297–8310, https://doi.org/10.1029/95JB03039, 1996. a
Liu, H., Janssen, M., and Lennartz, B.: Changes in flow and transport patterns in fen peat following soil degradation, Eur. J. Soil Sci., 67, 763–772, https://doi.org/10.1111/ejss.12380, 2016. a
Liu, H., Price, J., Rezanezhad, F., and Lennartz, B.: Centennial-scale shifts in hydrophysical properties of peat induced by drainage, Water Resour. Res., 56, e2020WR027538, https://doi.org/10.1029/2020WR027538, 2020. a, b
McCarter, C. P. R., Rezanezhad, F., Quinton, W. L., Gharedaghloo, B., Lennartz, B., Price, J., Connon, R., and Van Cappellen, P.: Pore-scale controls on hydrological and geochemical processes in peat: Implications on interacting processes, Earth-Sci. Rev., 207, 103227, https://doi.org/10.1016/j.earscirev.2020.103227, 2020. a, b, c, d
Menberu, M. W., Tahvanainen, T., Marttila, H., Irannezhad, M., Ronkanen, A.-K., Penttinen, J., and Kløve, B.: Water-table-dependent hydrological changes following peatland forestry drainage and restoration: Analysis of restoration success, Water Resour. Res., 52, 3742–3760, https://doi.org/10.1002/2015WR018578, 2016. a
Minkkinen, K. and Laine, J.: Effect of forest drainage on the peat bulk density of pine mires in Finland, Can. J. Forest Res., 28, 178–186, https://doi.org/10.1139/x97-206, 1998. a, b
Newman, M. E. J.: The structure and function of complex networks, SIAM Rev., 45, 167–256, https://doi.org/10.1137/s003614450342480, 2003. a
Otsu, N.: A threshold selection method from gray-level histograms, IEEE T. Syst. Man Cyb., 9, 62–66, https://doi.org/10.1109/TSMC.1979.4310076, 1979. a
Päivänen, J.: Hydraulic conductivity and water retention in peat soils, Acta For. Fenn., 129, 1–70, https://doi.org/10.14214/aff.7563, 1973. a, b
Perret, J., Prasher, S. O., Kantzas, A., and Langford, C.: Three-dimensional quantification of macropore networks in undisturbed soil cores, Soil Sci. Soc. Am. J., 63, 1530–1543, https://doi.org/10.2136/sssaj1999.6361530x, 1999. a, b
Pirinen, P., Simola, H., Aalto, J., Kaukoranta, J.-P., Karlsson, P., and Ruuhela, R.: Climatological statistics of Finland 1981–2010, Reports 2012:1, Finnish Meteorological Institute, Helsinki, Finland, ISBN: 978-951-697-766-2, 2012. a
Poulovassilis, A.: Hysteresis of pore water, an application of the concept of independent domains, Soil Sci., 93, 405–412, 1962. a
Price, J. S.: Role and character of seasonal peat soil deformation on the hydrology of undisturbed and cutover peatlands, Water Resour. Res., 39, 1241, https://doi.org/10.1029/2002WR001302, 2003. a
Redding, T. E. and Devito, K. J.: Particle densities of wetland soils in northern Alberta, Canada, Can. J. Soil Sci., 86, 57–60, https://doi.org/10.4141/S05-061, 2006. a
Reddy, K. R. and DeLaune, R. D.: Biogeochemistry of Wetlands: Science and Applications, CRC Press, Boca Raton, Florida, ISBN: 978-1-56670-678-0, 2008. a
Rezanezhad, F., Quinton, W. L., Price, J. S., Elliot, T. R., Elrick, D., and Shook, K. R.: Influence of pore size and geometry on peat unsaturated hydraulic conductivity computed from 3D computed tomography image analysis, Hydrol. Process., 24, 2983–2994, https://doi.org/10.1002/hyp.7709, 2010. a
Rezanezhad, F., Price, J. S., Quinton, W. L., Lennartz, B., Milojevic, T., and Van Cappellen, P.: Structure of peat soils and implications for water storage, flow and solute transport: A review update for geochemists, Chem. Geol., 429, 75–84, https://doi.org/10.1016/j.chemgeo.2016.03.010, 2016. a, b, c
Rinne, J., Tuittila, E.-S., Peltola, O., Li, X., Raivonen, M., Alekseychik, P., Haapanala, S., Pihlatie, M., Aurela, M., Mammarella, I., and Vesala, T.: Temporal variation of ecosystem scale methane emission from a boreal fen in relation to temperature, water table position, and carbon dioxide fluxes, Global Biogeochem. Cy., 32, 1087–1106, https://doi.org/10.1029/2017GB005747, 2018. a
Rydin, H. and Jeglum, J. K.: The Biology of Peatlands, 2nd Edn., Oxford University Press, Oxford, UK, ISBN: 978-0-19-960299-5, 2013. a
Sarkkola, S., Hökkä, H., Koivusalo, H., Nieminen, M., Ahti, E., Päivänen, J., and Laine, J.: Role of tree stand evapotranspiration in maintaining satisfactory drainage conditions in drained peatlands, Can. J. Forest Res., 40, 1485–1496, https://doi.org/10.1139/X10-084, 2010. a
Schlegel, A.: hypothetical – Hypothesis and statistical testing in Python, Github, https://github.com/aschleg/hypothetical (last access: 4 March 2022), 2020. a
Seabold, S. and Perktold, J.: Statsmodels: Econometric and statistical modeling with Python, in: Proceedings of the 9th Python in Science Conference, Austin, Texas, 28 June–3 July 2010, 92–96, https://doi.org/10.25080/Majora-92bf1922-011, 2010. a
Silins, U. and Rothwell, R. L.: Spatial patterns of aerobic limit depth and oxygen diffusion rate at two peatlands drained for forestry in Alberta, Can. J. Forest Res., 29, 53–61, https://doi.org/10.1139/x98-179, 1999. a
Sloan, T. J., Payne, R. J., Anderson, A. R., Gilbert, P., Mauquoy, D., Newton, A. J., and Andersen, R.: Ground surface subsidence in an afforested peatland fifty years after drainage and planting, Mires Peat, 23, 1–12, https://doi.org/10.19189/MaP.2018.OMB.348, 2019. a
Stock, S. R.: Recent advances in X-ray microtomography applied to materials, Int. Mater. Rev., 53, 129–181, https://doi.org/10.1179/174328008X277803, 2008. a
Taina, I. A., Heck, R. J., and Elliot, T. R.: Application of X-ray computed tomography to soil science: A literature review, Can. J. Soil Sci., 88, 1–19, https://doi.org/10.4141/CJSS06027, 2008. a
Terpilowski, M.: scikit-posthocs: Pairwise multiple comparison tests in Python, J. Open Source Softw., 4, 1169, https://doi.org/10.21105/joss.01169, 2019. a
van der Linden, J. H., Narsilio, G. A., and Tordesillas, A.: Machine learning framework for analysis of transport through complex networks in porous, granular media: A focus on permeability, Phys. Rev. E, 94, 022904, https://doi.org/10.1103/PhysRevE.94.022904, 2016. a
van der Linden, J. H., Tordesillas, A., and Narsilio, G. A.: Preferential flow pathways in a deforming granular material: self-organization into functional groups for optimized global transport, Sci. Rep.-UK, 9, 18231, https://doi.org/10.1038/s41598-019-54699-6, 2019. a, b, c
van der Walt, S., Schönberger, J. L., Nunez-Iglesias, J., Boulogne, F., Warner, J. D., Yager, N., Gouillart, E., Yu, T., and the scikit-image contributors: scikit-image: image processing in Python, PeerJ, 2, e453, https://doi.org/10.7717/peerj.453, 2014. a
van Genuchten, M. T.: A closed-form equation for predicting the hydraulic conductivity of unsaturated soils, Soil Sci. Soc. Am. J., 44, 892–898, https://doi.org/10.2136/sssaj1980.03615995004400050002x, 1980. a
Virtanen, P., Gommers, R., Oliphant, T. E., Haberland, M., Reddy, T., Cournapeau, D., Burovski, E., Peterson, P., Weckesser, W., Bright, J., van der Walt, S. J., Brett, M., Wilson, J., Millman, K. J., Mayorov, N., Nelson, A. R. J., Jones, E., Kern, R., Larson, E., Carey, C. J., Polat, İ., Feng, Y., Moore, E. W., VanderPlas, J., Laxalde, D., Perktold, J., Cimrman, R., Henriksen, I., Quintero, E. A., Harris, C. R., Archibald, A. M., Ribeiro, A. H., Pedregosa, F., van Mulbregt, P., and SciPy 1.0 Contributors: SciPy 1.0: fundamental algorithms for scientific computing in Python, Nat. Methods, 17, 261–272, https://doi.org/10.1038/s41592-019-0686-2, 2020. a, b
Wachinger, G., Fiedler, S., Zepp, K., Gattinger, A., Sommer, M., and Roth, K.: Variability of soil methane production on the micro-scale: spatial association with hot spots of organic material and Archaeal populations, Soil Biol. Biochem., 32, 1121–1130, https://doi.org/10.1016/S0038-0717(00)00024-9, 2000. a
Waddington, J. M., Morris, P. J., Kettridge, N., Granath, G., Thompson, D. K., and Moore, P. A.: Hydrological feedbacks in northern peatlands, Ecohydrology, 8, 113–127, https://doi.org/10.1002/eco.1493, 2015. a
Watts, D. J. and Strogatz, S. H.: Collective dynamics of `small-world' networks, Nature, 393, 440–442, https://doi.org/10.1038/30918, 1998. a
Weber, T. K. D., Iden, S. C., and Durner, W.: A pore-size classification for peat bogs derived from unsaturated hydraulic properties, Hydrol. Earth Syst. Sci., 21, 6185–6200, https://doi.org/10.5194/hess-21-6185-2017, 2017. a, b, c, d
Weiss, R., Alm, J., Laiho, R., and Laine, J.: Modeling moisture retention in peat soils, Soil Sci. Soc. Am. J., 62, 305–313, https://doi.org/10.2136/sssaj1998.03615995006200020002x, 1998. a
Whalen, S. C.: Biogeochemistry of methane exchange between natural wetlands and the atmosphere, Environ. Eng. Sci., 22, 73–94, https://doi.org/10.1089/ees.2005.22.73, 2005. a
Xu, X., Yuan, F., Hanson, P. J., Wullschleger, S. D., Thornton, P. E., Riley, W. J., Song, X., Graham, D. E., Song, C., and Tian, H.: Reviews and syntheses: Four decades of modeling methane cycling in terrestrial ecosystems, Biogeosciences, 13, 3735–3755, https://doi.org/10.5194/bg-13-3735-2016, 2016. a, b