the Creative Commons Attribution 4.0 License.
the Creative Commons Attribution 4.0 License.
 | 06 Apr 2022
The effects of varying drought-heat signatures on terrestrial carbon dynamics and vegetation composition
Elisabeth Tschumi
Sebastian Lienert
Karin van der Wiel
Fortunat Joos
Jakob Zscheischler
The frequency and severity of droughts and heatwaves are projected to increase under global warming. However, the differential impacts of climate extremes on the terrestrial biosphere and anthropogenic CO2 sink remain poorly understood. In this study, we analyse the effects of six hypothetical climate scenarios with differing drought-heat signatures, sampled from a long stationary climate model simulation, on vegetation distribution and land carbon dynamics, as modelled by a dynamic global vegetation model (LPX-Bern v1.4). The six forcing scenarios consist of a Control scenario representing a natural climate, a Noextremes scenario featuring few droughts and heatwaves, a Nocompound scenario which allows univariate hot or dry extremes but no co-occurring extremes, a Hot scenario with frequent heatwaves, a Dry scenario with frequent droughts, and a Hotdry scenario featuring frequent concurrent hot and dry extremes. We find that a climate with no extreme events increases tree coverage by up to 10 % compared to the Control scenario and also increases ecosystem productivity as well as the terrestrial carbon pools. A climate with many heatwaves leads to an overall increase in tree coverage primarily in higher latitudes, while the ecosystem productivity remains similar to the Control scenario. In the Dry and even more so in the Hotdry scenario, tree cover and ecosystem productivity are reduced by up to −4 % compared to the Control scenario. Regionally, this value can be much larger, for example up to −80 % in mid-western USA or up to −50 % in mid-Eurasia for Hotdry tree ecosystem productivity. Depending on the vegetation type, the effects of the Hotdry scenario are stronger than the effects of the Hot and Dry scenarios combined, illustrating the importance of correctly simulating compound extremes for future impact assessment. Overall, our study illustrates how factorial model experiments can be employed to disentangle the effects of single and compound extremes.
- Article
(5322 KB) - Full-text XML
- BibTeX
- EndNote


The terrestrial biosphere sequesters about 30 % of anthropogenic CO2 emissions (Friedlingstein et al., 2020). Different factors such as increasing atmospheric CO2 concentrations; higher temperatures; or, on a more regional scale, water or nutrient availability can increase or decrease the terrestrial carbon sink. Different biomes may also react differently. While warmer temperatures are likely to increase productivity in high latitudes and altitudes due to an increase in the growing season length, productivity may be reduced in warmer regions because of higher evaporation and stomatal closure (Friend et al., 2014). Overall, there is evidence that the vulnerability of trees to hotter droughts may increase, but this may also be compensated for by higher CO2 concentrations and associated increased water use efficiency (De Kauwe et al., 2013). However, future projections of the terrestrial carbon sink remain highly uncertain (Friedlingstein et al., 2014).
A potentially large contribution to the uncertainty in the carbon cycle response to climate change may stem from the impacts of climate extremes. Climate extremes can have devastating impacts on the natural environment (IPCC, 2012; Reichstein et al., 2013; Frank et al., 2015; von Buttlar et al., 2018; Senf et al., 2020). At the same time, extreme impacts are often not linked to single climate extremes but to a combination of anomalous drivers (Zscheischler et al., 2016; Flach et al., 2017; Pan et al., 2020; Tschumi and Zscheischler, 2020; Van der Wiel et al., 2020; Vogel et al., 2021), also called compound events (Zscheischler et al., 2018, 2020).
Arguably, drought and heat are among the most damaging hazards to terrestrial vegetation (Allen et al., 2010; Reichstein et al., 2013; Zscheischler et al., 2014b; Frank et al., 2015; Sippel et al., 2018; von Buttlar et al., 2018; Senf et al., 2020). In many cases, drought and heat predispose or interact with other hazards and disturbances such as forest fires and insect outbreaks (Seidl et al., 2017). In particular, an increasing occurrence of warm droughts has already led to increased vegetation impacts on northern hemispheric ecosystems over the observational period (1982–2016; Gampe et al., 2021). However, differentiating impacts between drought and heat alone and compound drought and heat remains a challenging task. Disentangling these impacts is important, as co-occurring droughts and heatwaves tend to have larger impacts compared to the sum of impacts from droughts and heatwaves separately (Zscheischler et al., 2014b; Ribeiro et al., 2020), for example because a drought exacerbates the impacts of a heatwave through reduced evaporative cooling (Yuan et al., 2016). Furthermore, projections of droughts and heatwaves can differ strongly across different climate models (Herrera-Estrada and Sheffield, 2017; Zscheischler and Seneviratne, 2017).
The impacts of climate extremes on vegetation and the terrestrial carbon cycle can be studied using different approaches including (i) lab or field experiments (De Boeck et al., 2011; Beier et al., 2012; Song et al., 2019), (ii) observational data such as long-term forest observations (Anderegg et al., 2013) and local measurements of carbon exchange (Ciais et al., 2005; von Buttlar et al., 2018; Pastorello et al., 2020), (iii) indirect estimates from satellite observations (Ciais et al., 2005; Zhao and Running, 2010; Zscheischler et al., 2013; Stocker et al., 2019), and (iv) dynamical vegetation models (Ciais et al., 2005; Zscheischler et al., 2014a, b, c, d; Rammig et al., 2015; Xu et al., 2019; Bastos et al., 2020; Pan et al., 2020). Vegetation models offer the benefit of being able to analyse new hypotheses in a strictly controlled environment at the global scale.
Despite considerable uncertainties in climate models, it is widely acknowledged that drought and heat extremes will increase in frequency and severity in many land regions in the future (Seneviratne et al., 2012). Though it is still uncertain exactly how these increases will affect the terrestrial biosphere, there are concerns they might substantially reduce the current terrestrial carbon sink (Reichstein et al., 2013). While coupled models of the land and atmosphere allow for a more complete representation of the feedback processes (Humphrey et al., 2021) than stand-alone land biosphere models, the analysis of results is more complicated for coupled models, since the coupling is different for different models and uncertainties depend not only on the land but also on the atmosphere module.
In this study, we aim to disentangle the differential effects of different frequencies of hot conditions, dry conditions, and compound hot–dry events on vegetation composition, carbon pools, and carbon dynamics. Our main motivation is to test the sensitivity of a commonly used vegetation model to differences in the climatology of the occurrence of hot and dry extremes and how these changes in drought and heat occurrence affect vegetation distribution and carbon dynamics. To this end, we force a dynamic global vegetation model, LPX-Bern v1.4, with six 100-year-long climate scenarios featuring varying drought-heat signatures, i.e. different occurrence probabilities of dry events, hot events, and concurrent dry and hot events. These scenarios were sampled from 2000 years of present-day climate data from the EC-Earth climate model, as described in Sect. 2.1. They have a constant CO2 concentration and do not contain long-term trends. The controlled environment of a model setup allows us to attribute changes in vegetation composition and carbon dynamics to differences in drought-heat occurrence.
2.1 Forcing scenarios
Six forcing scenarios featuring different dry and hot signatures were used to run the vegetation model LPX-Bern. These scenarios, each 100 years long, were constructed from a large-ensemble climate modelling experiment (Tschumi et al., 2021). A total of 2000 years of simulated present-day climate data were created with the fully coupled global climate model EC-Earth (v2.3; Hazeleger et al., 2012). The large ensemble was built out of 400 short 5-year runs, which were unique in their initial conditions and/or stochastic physics seed. EC-Earth combines atmospheric, oceanic, land, and sea-ice model components and simulates the global climate including feedbacks between land and atmosphere. Within the ensemble the influence of forced climate change is small. We, therefore, assume all variability in the data set is due to natural variability in the climate system. While the global mean surface temperature in EC-Earth shows no significant bias, there can be biases at the regional and seasonal scale. In particular, there is a mean temperature difference of −0.5 ∘C and a precipitation difference of 7 % over land, with regional biases being relatively large (up to −1.8 ∘C in the tropics and 0.2 ∘C in the extratropics, mostly in the very high latitudes). Many land regions show a wet bias in EC-Earth (43.5 % in the extratropics). A more detailed description of the biases can be found in Tschumi et al. (2021). The biases in the climate forcing compared to observational data sets imply that simulated vegetation cover based on this forcing may differ from observed vegetation cover.
The selection of the different scenarios from this data set was based on temperature and precipitation values during the time of the year where the vegetation is most active. Arguably, the vegetation is most vulnerable to climate extremes during the growing season. Therefore, for the scenario creation, we focused on the 3 months around the most productive month in the climatology. We identified the most productive month at each pixel, that is, the month with the highest climatological-mean net primary production (NPP) as simulated by LPX-Bern.
We selected the six different scenarios for each pixel separately based on mean temperature and precipitation over the 3 months around the month of highest NPP: Control, Noextremes, Nocompound, Hot, Dry, and Hotdry. Years contributing to the scenarios were sampled based on quantiles of the 3-month temperature and precipitation averages, where the quantiles were computed based on the full 2000-year EC-Earth output. If more than the required number of years fell into the quantiles in question, a random selection was performed. If fewer years than necessary were available, some randomly chosen years were selected multiple times. For each of the Hot, Dry, and Hotdry scenarios, 50 years was sampled from the extreme quantiles and 50 years was randomly sampled from the rest. The reason for this is twofold. Firstly, for many pixels, not many years fall into the extreme quantiles. Sampling only 50 years from there reduces the number of times a year is re-sampled. Secondly, the mean climatology is kept more similar to the other scenarios if only half the years were sampled with extreme conditions and the other half from the rest.
This method of scenario creation, for each pixel separately, destroys any spatial coherence so that the climate in a pixel is not correlated to the climate in nearby pixels. Furthermore, due to the sampling of individual years, there are always slight discontinuities between 31 December and 1 January in the climate forcing. The same is true for leap years since all leap days (29 February) were removed. We assume that these small discontinuities in the atmospheric forcing do not significantly affect our findings. The scenarios have a daily temporal and a 1∘ × 1∘ spatial resolution. The scenarios were sampled from the percentiles of the EC-Earth data at each location separately as described in Tschumi et al. (2021) and summarized in Table 1.
Table 1Sampling design for the six climate scenarios (see Tschumi et al., 2021).
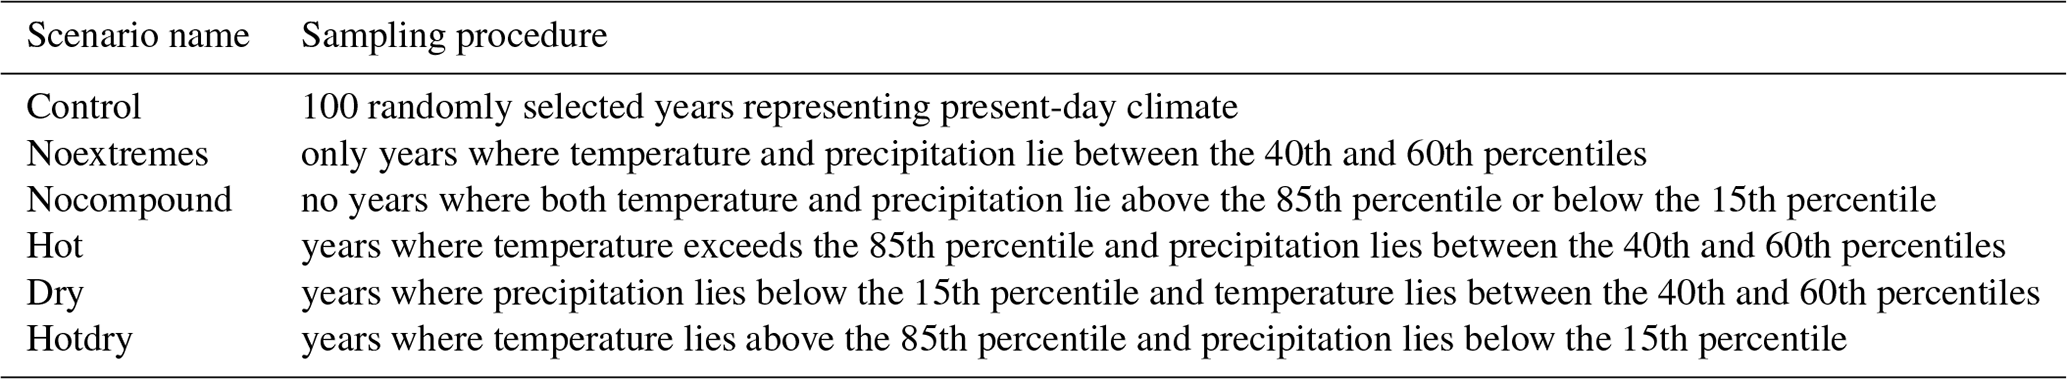
The scenarios differ little in their mean climatic conditions but strongly in the occurrence of dry events, hot events, and concurrent dry and hot events. More specifically, the difference in global mean temperature and precipitation between the scenarios is about 0.3 ∘C and 6 %, respectively. The Hot and Hotdry scenarios show an increase in heatwaves (based on cooling degree days, which is the sum of all exceedances over the 90th percentile of the Control scenario at each pixel) by up to 160 % compared to the Control scenario. Dry event occurrences (based on the standardized precipitation index (SPI), which is used to identify severe meteorological droughts, defined as SPI ) are strongly increased for the Dry and Hotdry scenario, by up to 200 % compared to the Control scenario. In the Noextremes and Nocompound scenarios, there is an overall decrease in dry events of up to −80 % and in heatwaves of up to −50 %. The pattern of concurrent dry and hot events is even more pronounced. There are no or very few concurrent dry and hot events in the Noextremes and the Nocompound scenarios. Compound extremes are possible for the Hot and Dry scenarios but occur overall less often than in the Control scenario. In the Hotdry scenario, however, concurrent dry and hot events occur up to 50 times more often than in the Control scenario. A more in-depth description and analysis of these scenarios including the definition of dry and hot events are given in Tschumi et al. (2021).
2.2 LPX-Bern
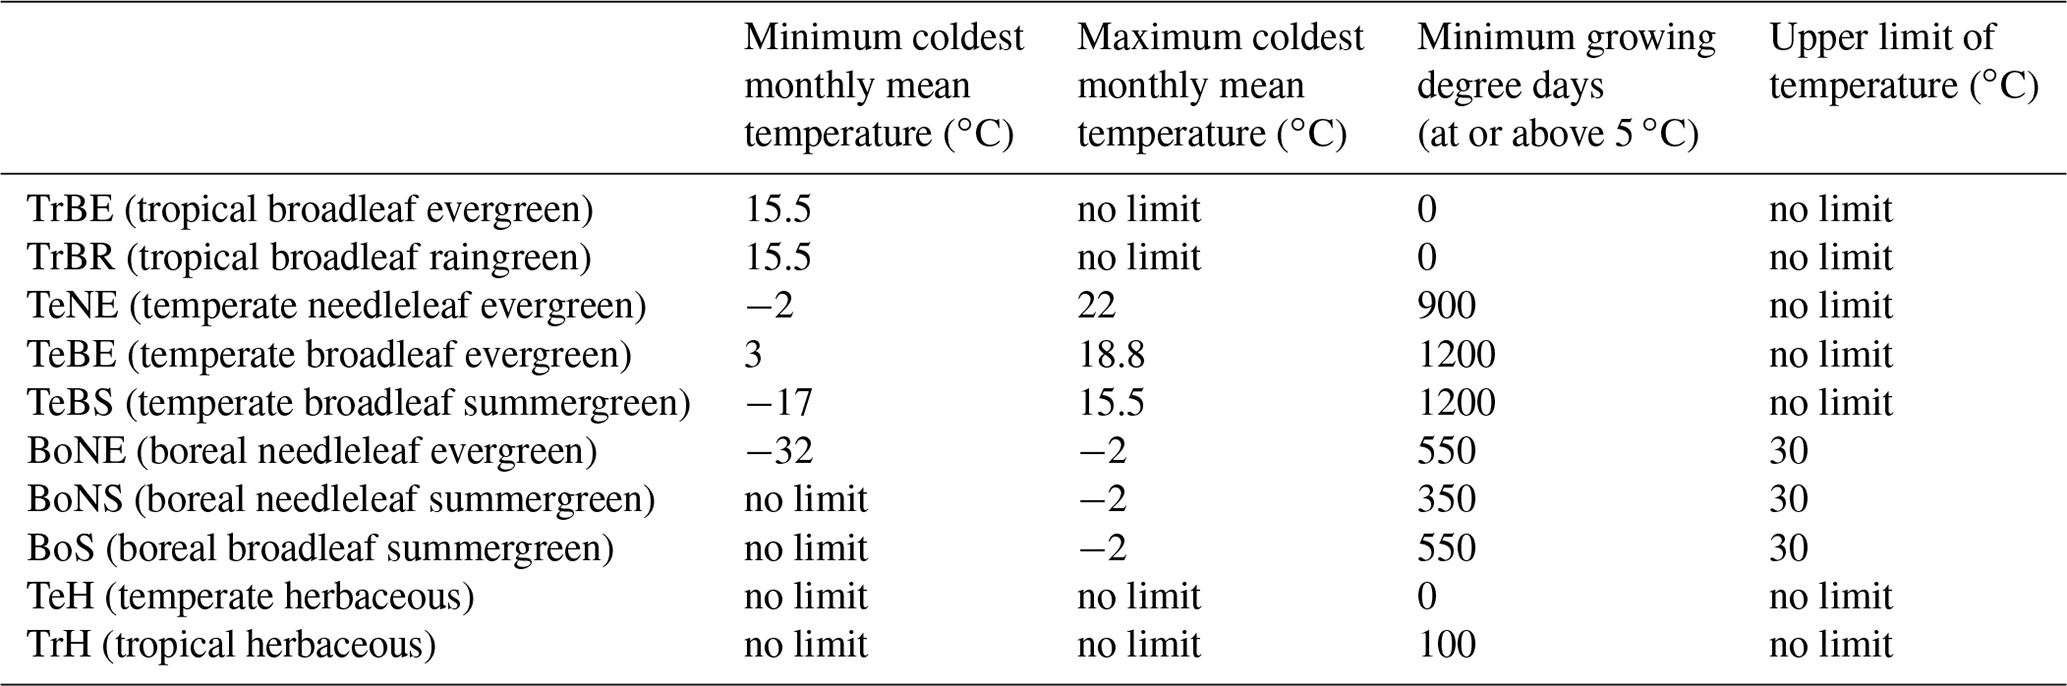
LPX-Bern v1.4 (Lienert and Joos, 2018) is a dynamic global vegetation model based on the Lund–Potsdam–Jena (LPJ) model (Sitch et al., 2008). The model features coupled water, nitrogen, and carbon cycles and represents different types of vegetation using plant functional types (PFTs). Here, only natural vegetation is considered, which is internally represented by eight tree PFTs and two herbaceous PFTs competing for resources and adhering to bioclimatic limits, which are listed in Table A1, as well as other process parameterizations (e.g. temperature dependence of photosynthesis or water balance). These bioclimatic limits and other parameters as well as process representation can differ from model to model, leading to a different response of the vegetation to extreme climatic events. In LPX-Bern, tree coverage is restricted to 95 % of the grid cell. If the total fraction summed over all PFTs exceeds 1, the plants that were the least productive are killed, representing self-thinning. Mortality can also occur if a PFT's bioclimatic limits are reached due to heat stress, negative NPP, or depressed growth efficiency (Sitch et al., 2003). As an example, the bioclimatic parameter governing the upper limit of temperature is implemented in LPX-Bern by inducing mortality proportional to the number of days in the year where this threshold is exceeded. Other models may use not only different values for the threshold and a different relationship between mortality and exceedance but an altogether different parameterization. This will in turn influence the response to the heat stress in the model.
In this study, daily temperature, precipitation, and incoming short-wave radiation are provided to the model. Additionally, the model uses information on the soil type (Wieder et al., 2014), CO2 concentration in the atmosphere at the 2011 level (389.78 ppm), and nitrogen deposition also at the 2011 level (Tian et al., 2018). Each scenario simulation was preceded by a 1500-year-long spin-up, which was forced with climate data of the same scenario (“individual spin-up”). To test how fast vegetation composition and net ecosystem exchange reach a new equilibrium under an altered frequency of dry and hot events, we also performed simulations in which the spin-up was based on climate from the Control scenario (“shared spin-up”). By running the model with two different spin-ups per scenario, we explore the model equilibrium and how fast the model reacts after a step change in the frequency of extreme events.
LPX-Bern represents natural vegetation with 10 PFTs, as described above. For the following analysis, we aggregate them into four broader classes, namely tropical trees (including tropical broad-leafed evergreen and tropical broad-leafed raingreen trees), temperate trees (including temperate needle-leafed evergreen, temperate broad-leafed evergreen, and temperate broad-leafed summergreen trees), boreal trees (including boreal needle-leafed evergreen, boreal needle-leafed summergreen, and boreal broad-leafed summergreen trees), and grasses (including temperate and tropical herbaceous). The dominant vegetation class in the Control simulation for each pixel, including its fractional cover (the fraction of a grid cell covered with a certain vegetation class), is shown in Fig. 1. Pixels where the total fractional coverage is smaller than 0.1, corresponding to desert regions, are masked in white.
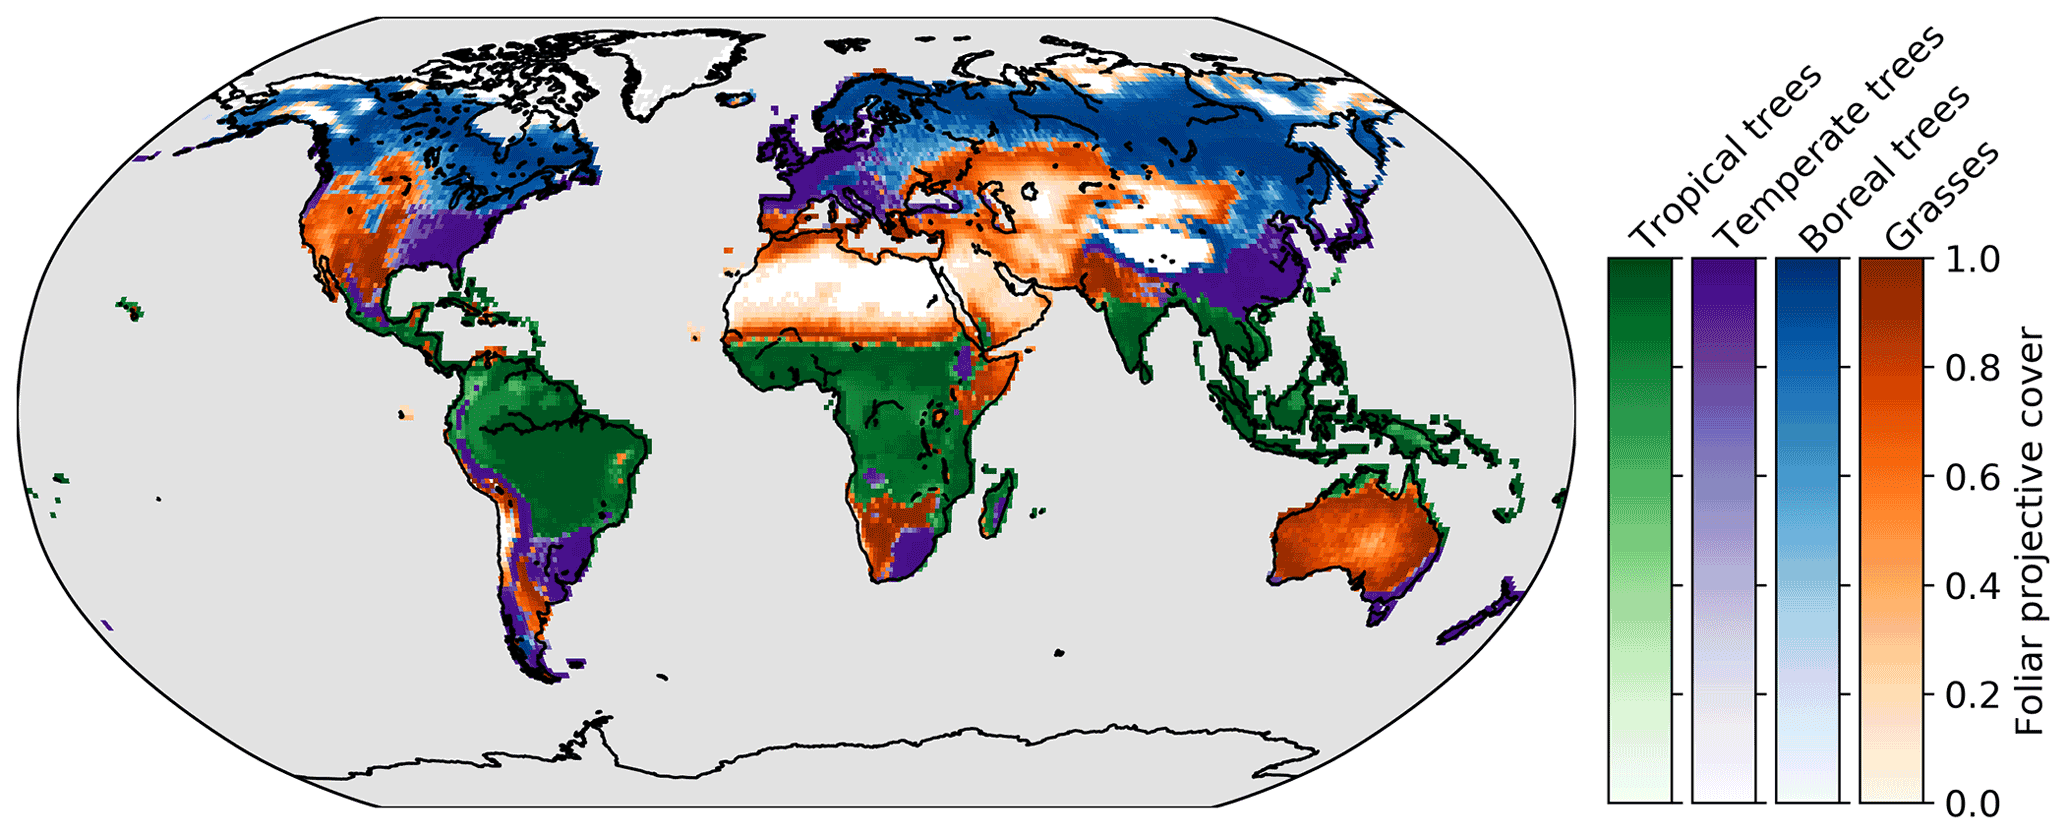
Figure 1Dominant vegetation class (mean over time) in the Control simulation. The intensity (colour bars) shows the fractional coverage of each dominant class.
We report how different stationary climate conditions (i.e. without long-term trends) with varying intensities of dry events, hot events, and compound dry–hot events affect vegetation coverage (Sect. 3.1) as well as carbon pools and carbon fluxes (Sect. 3.2). These results are based on the simulations using the individual spin-up. In Sect. 3.3 we report how quickly LPX-Bern reaches a new equilibrium by running simulations for each scenario that use the climate of the Control scenario during spin-up (shared spin-up).
3.1 Changes in vegetation coverage and associated NPP changes
The different dry and hot scenarios lead to a change in fractional vegetation coverage (Fig. 2a). Trees generally benefit from a climate with no dry and hot events. The increase in tree cover is stronger for higher latitudes. While the relative difference in global mean tropical tree cover is 1.2 %, it is 9.4 % for boreal trees for the Noextremes scenario (green bars in Fig. 2a). Regionally, this increase can be much larger. Total tree cover for the mid-west of the USA, for example, is increased by up to 400 %, and there is a similarly large increase in South Africa (results not shown). These are regions with nearly no trees in the Control scenario (Fig. 1). A smaller but still large increase of up to 100 % is observed in South America, southern Africa, and large parts of Eurasia. Grass coverage in turn decreases to make room for the trees. To a lesser extent, the same pattern also holds for a climate with no compound extremes, which however does feature univariate extremes (blue bars in Fig. 2a). The increase in tree coverage towards higher latitudes is also evident for the Hot scenario, while for this scenario grass cover does not change compared to the Control scenario (red bars in Fig. 2a). The Dry and, even more strongly, the Hotdry scenarios lead to an overall decrease in tree coverage (orange and purple bars in Fig. 2a, respectively). The decrease is particularly strong for temperate tree coverage in the Hotdry scenario (−5.6 %), while there is little change in boreal tree cover. At the regional scale, the decrease is largest in the mid-west of the USA with up to −80 % as well as up to −50 % in mid-Eurasia. For the Hotdry scenario, the overall decrease in tree cover is compensated for by an increase in grass cover, mainly in the USA, Europe, mid-Eurasia, and southern South America, in contrast to the Dry scenario, in which grass cover also decreases. While it is generally true that grasses seem to compensate for declining tree coverage, the compensation is not necessarily complete. As an effect, the total sum of fractional plant cover may change as well. However, at the global scale, there is hardly any change in fractional coverage between the scenarios (not shown). Overall, the differences in vegetation cover between the scenarios are smallest for tropical trees and tend to be similarly ordered but larger in magnitude for the other vegetation classes.
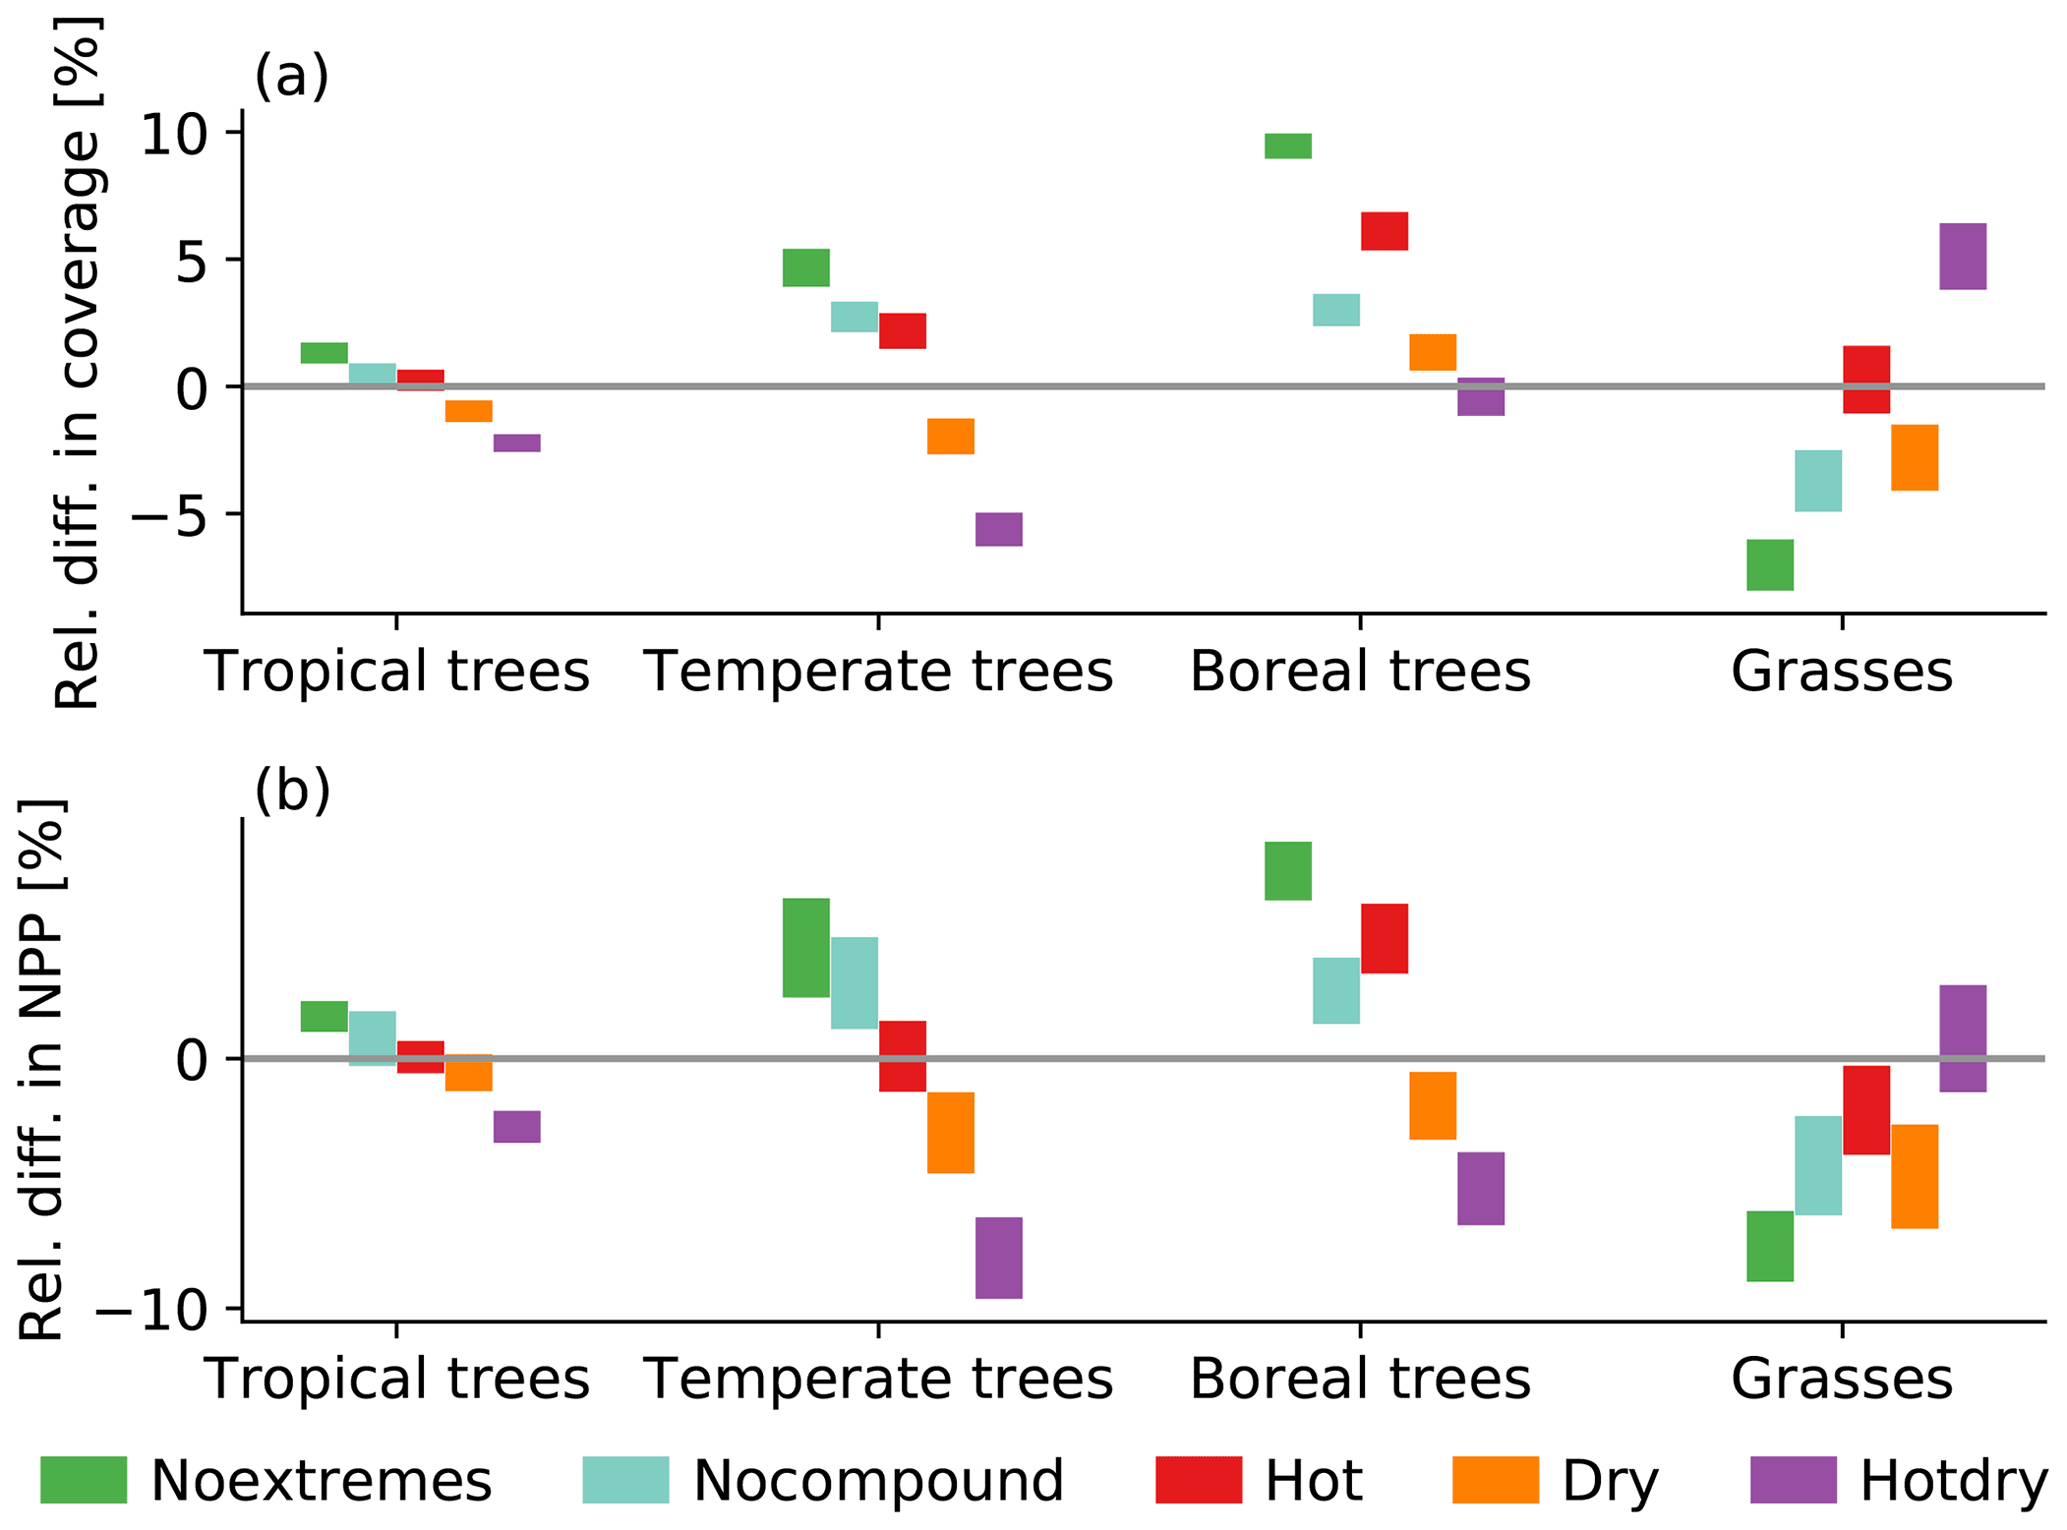
Figure 2Relative difference in the scenarios from the Control scenario for (a) coverage and (b) annual NPP. The bars show the minimum-to-maximum range over the 100-year-long simulations.
The above-described relative differences in coverage directly translate into changes in annual NPP (Fig. 2b). In particular, if tree or grass coverage increases, so does NPP, and if coverage decreases, we find an associated decrease in NPP. Overall, at the global scale, the variability in the relative differences in NPP is larger than the variability in the relative differences in vegetation cover (compare lengths of bars in Fig. 2a, b).
We compare the spatial patterns of the differences in tree (all tree types aggregated) and grass cover between the two scenarios with the strongest effect and the Control scenario, i.e. Noextremes − Control and Hotdry − Control, in Fig. 3. In the Noextremes scenario, tree cover increases on all land pixels compared to the Control scenario, especially in western North America and mid-Eurasia (Fig. 3a). In contrast, grass cover decreases everywhere except in very dry regions such as the Sahara, the Arabian Peninsula, and Australia, where a constant climate without extremes leads to a slight increase in grass cover (Fig. 3b). For Hotdry, tree cover decreases in most regions except the very high latitudes, compared to the Control scenario (Fig. 3c), while grass coverage increases except for very dry regions (Fig. 3d).
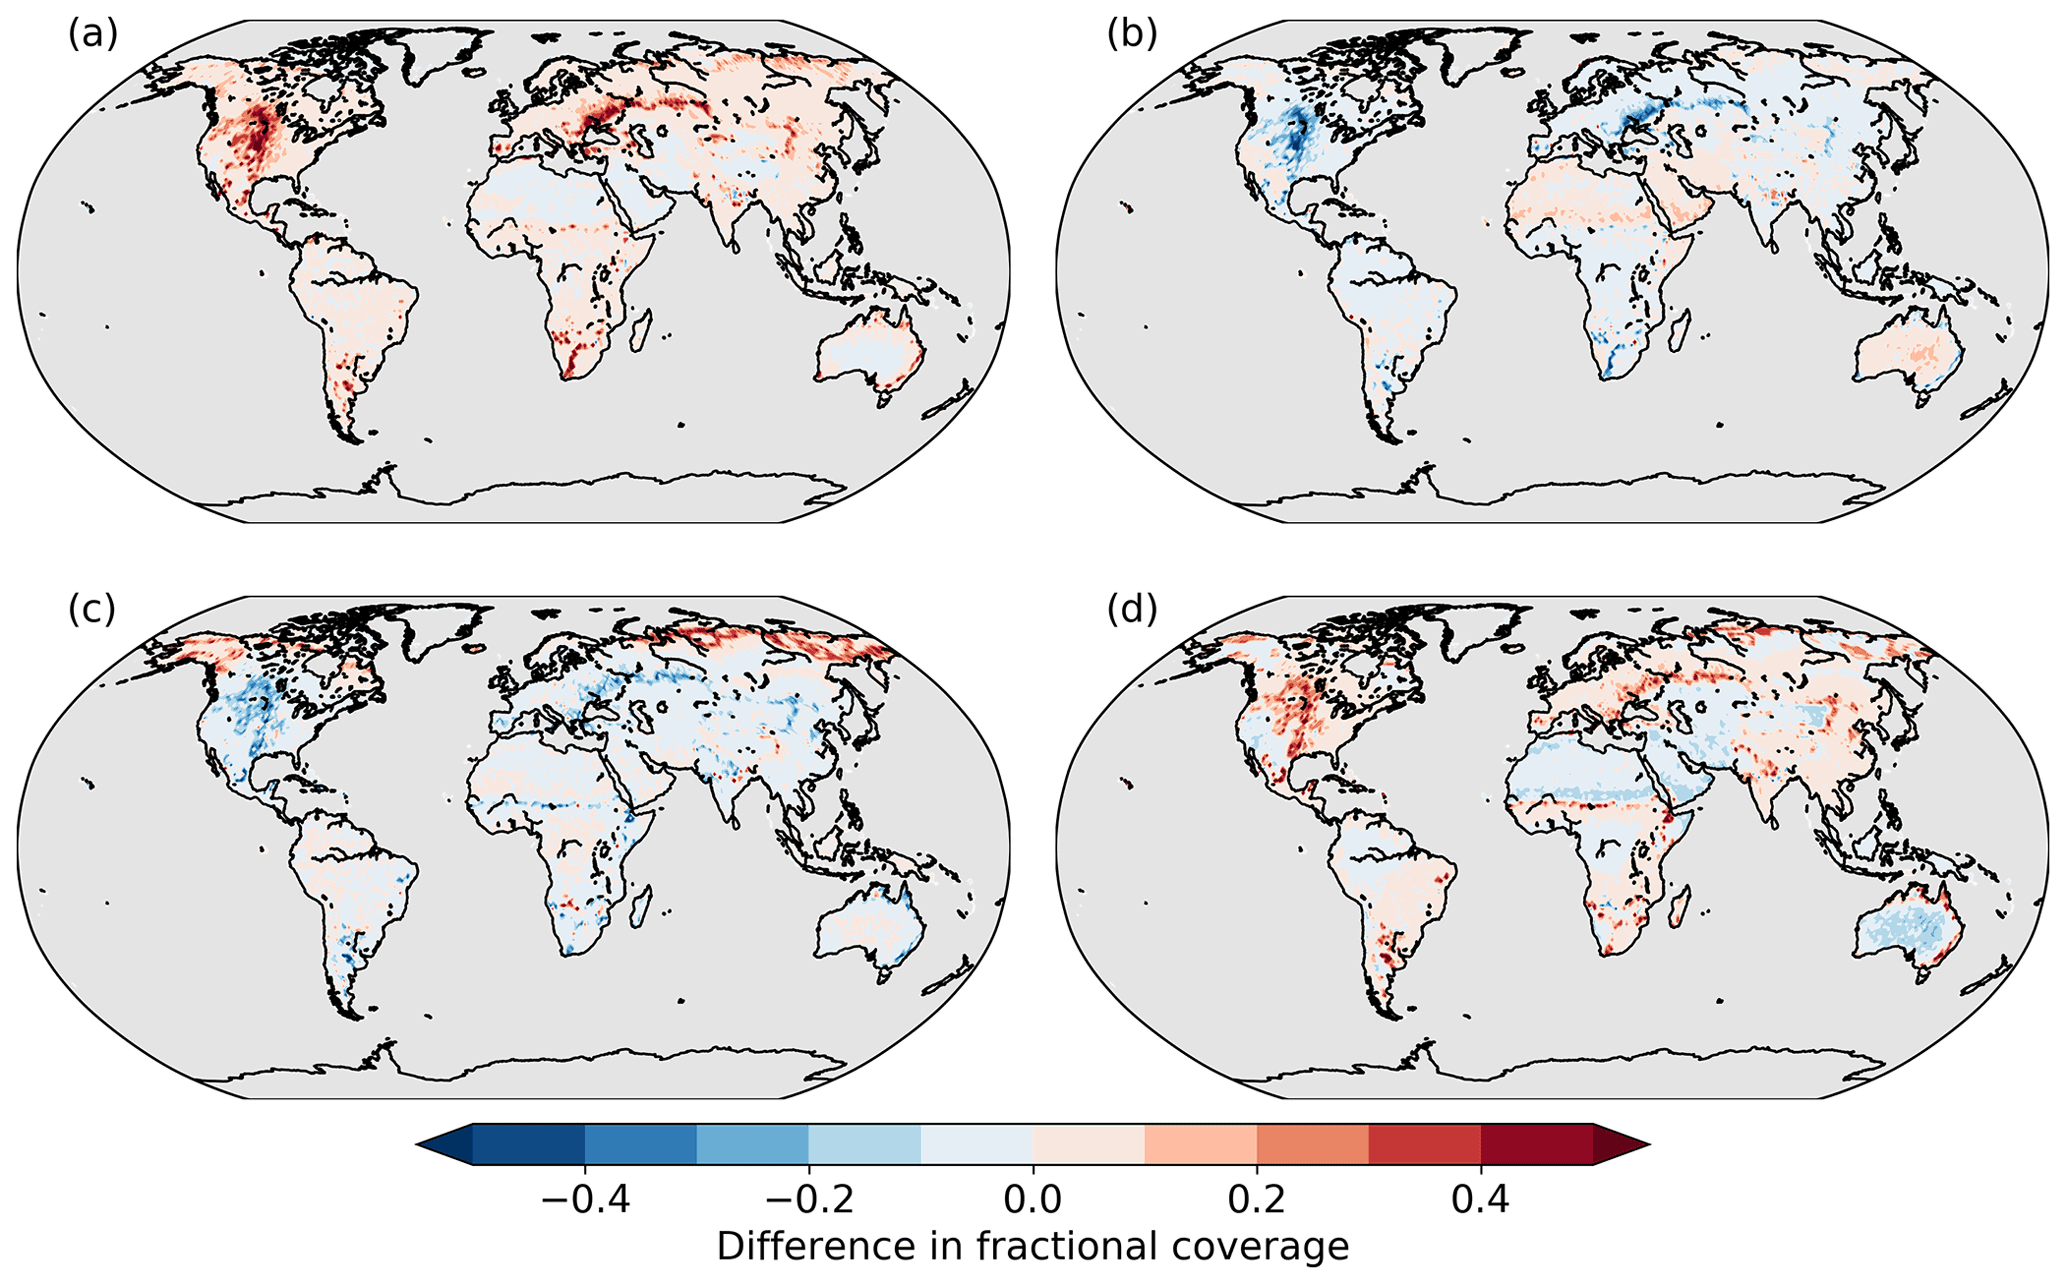
Figure 3Difference in fractional coverage of (a) Noextremes trees, (b) Noextremes grasses, (c) Hotdry trees, and (d) Hotdry grasses compared to the Control scenario.
3.2 Changes in carbon dynamics
The effects of the scenarios on vegetation coverage (Sect. 3.1) are reflected by the globally aggregated carbon fluxes and pools (Fig. 4). The response of NPP to the replacement of trees with grasses and vice versa is varied, as it strongly depends on environmental conditions and vegetation composition. Generally, NPP is greater for trees than for grasses, which implies that global NPP is larger in a world with more trees and smaller if more forest area is replaced by grassland. Consequently, Noextremes, Nocompound, and Hot generally show higher or similar flux magnitudes compared to the Control scenario, whereas fluxes are strongly decreased for Dry and Hotdry, by up to more than −4 % for global gross primary production (GPP) in Hotdry (Fig. 4a). Interestingly, although grass cover is increased in the Hot scenario (Fig. 2a), NPP in grasslands is reduced (Fig. 2b), explaining the lack of change in global NPP for the Hot scenario (Fig. 4a). Relative carbon flux reductions can be very large for some regions, for example up to −80 % in the mid-west of the USA, mirroring the decrease in tree cover. Similar patterns are evident for changes in global vegetation carbon (Fig. 4b). Overall, relative differences are much smaller for global soil carbon.
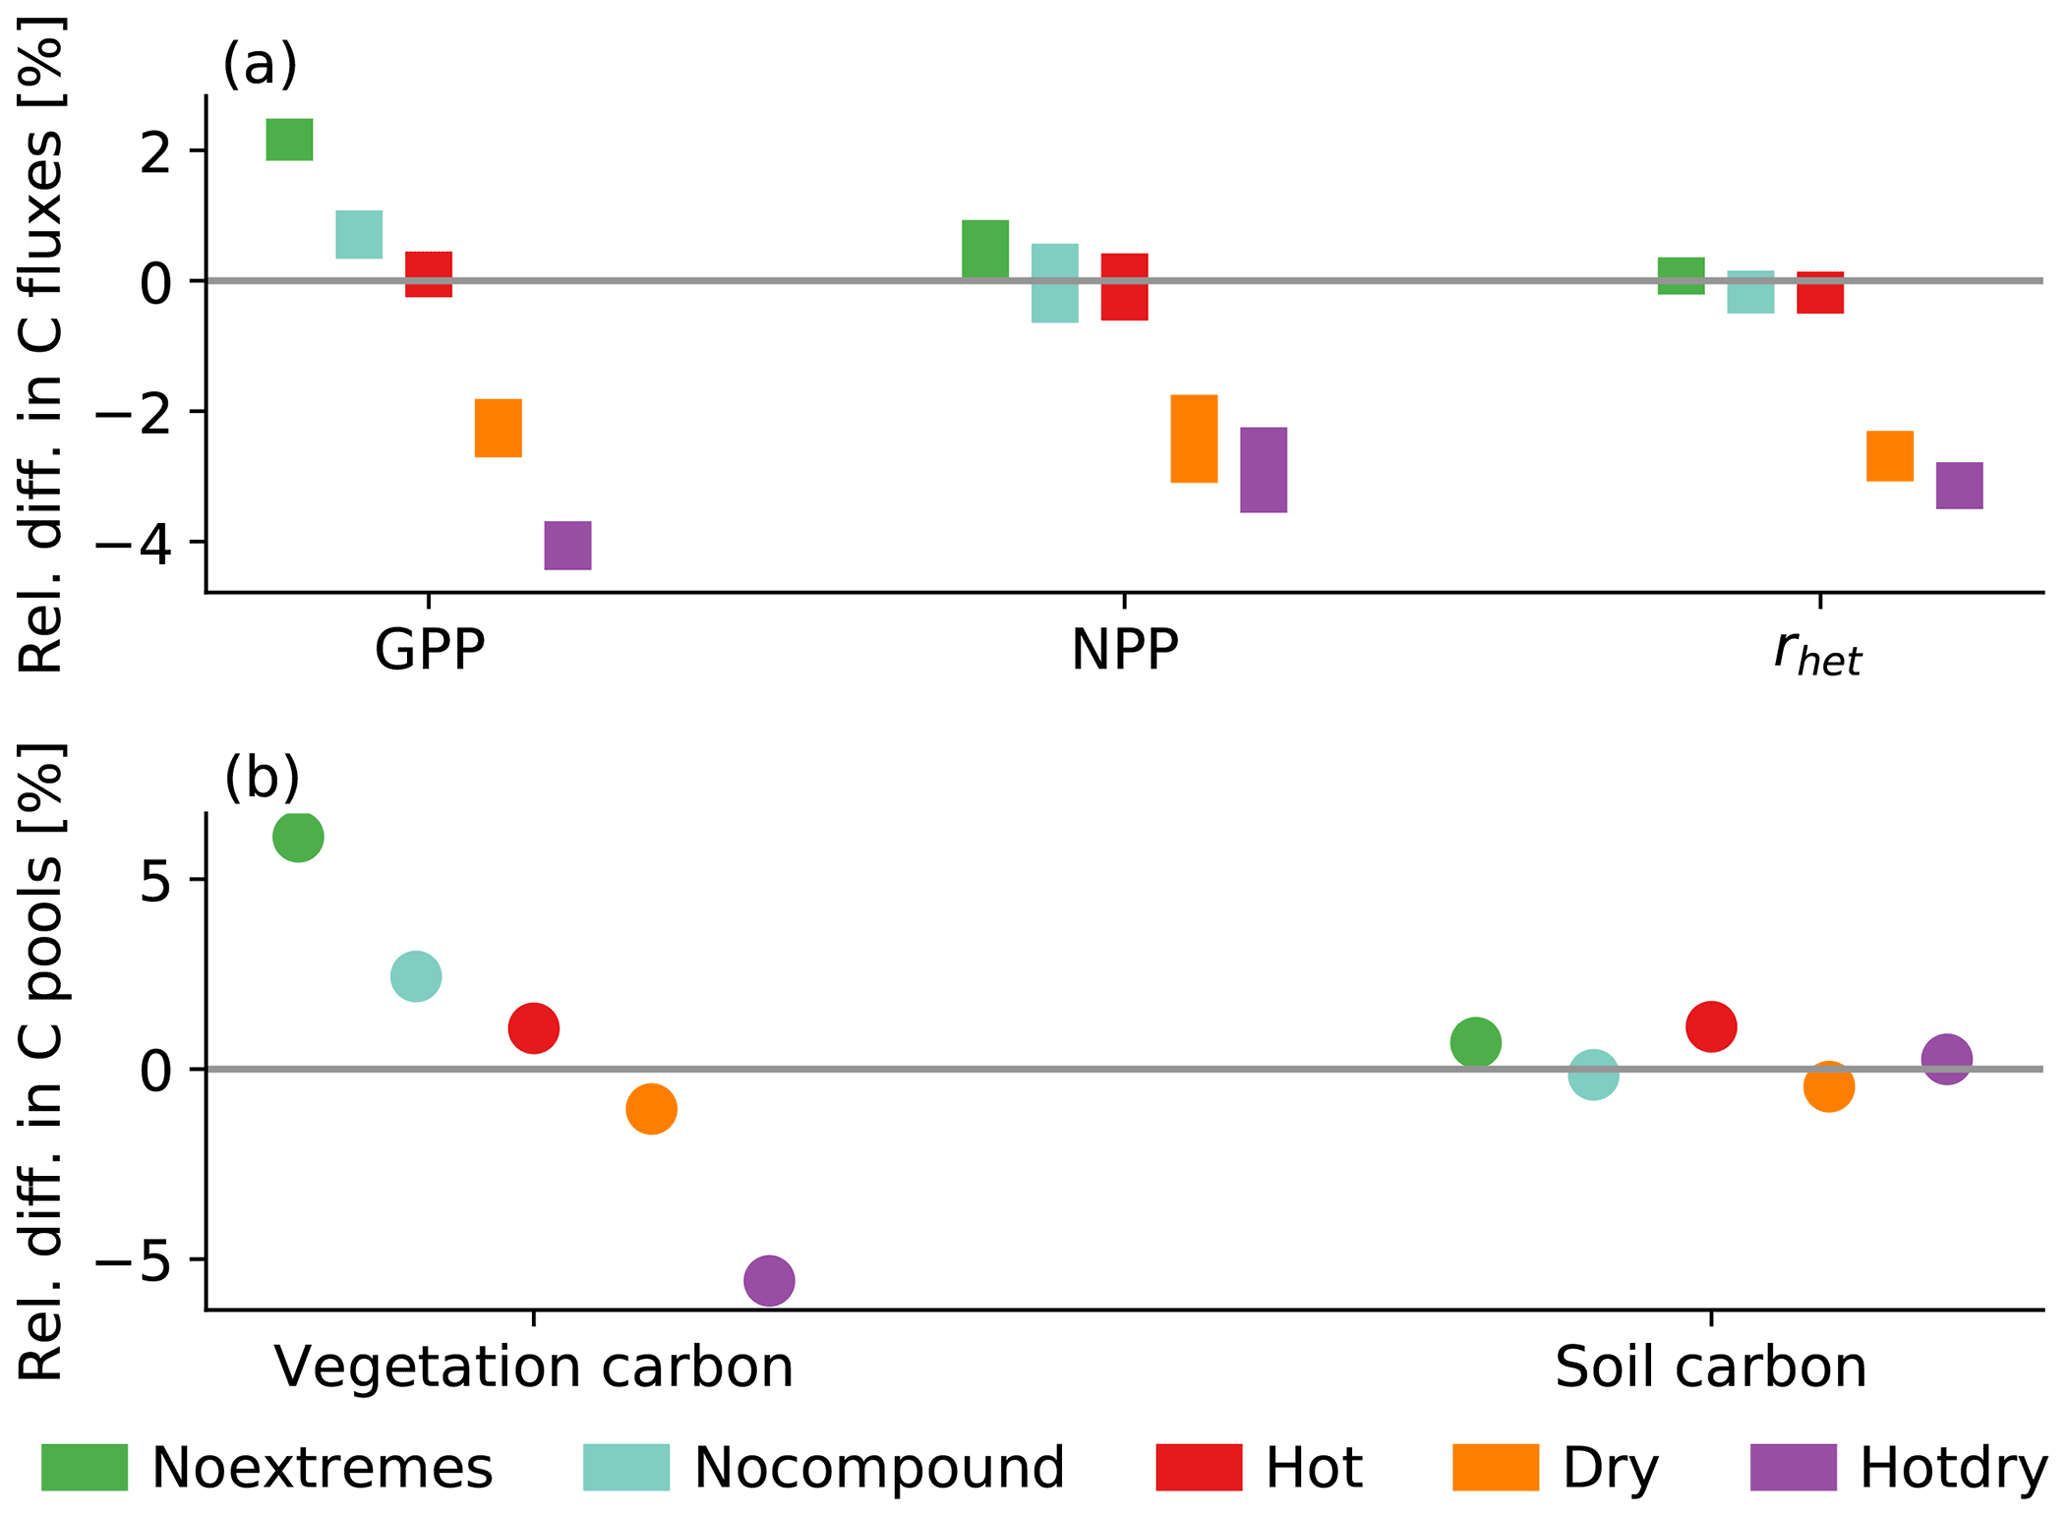
Figure 4Relative difference in the scenarios from the Control scenario for (a) the global annual GPP, NPP, and heterotrophic respiration (rhet) as well as (b) vegetation carbon and soil carbon. The bars in (a) show the minimum-to-maximum range of the 100-year-long simulations. Because the interannual range for carbon pools in (b) is very small, we only show the mean over the 100 years.
We further explore the spatial patterns in the differences in NPP separately for trees (all tree types aggregated) and grasses between the two scenarios with the strongest effect, i.e. by looking at Noextremes − Control and Hotdry − Control (Fig. 5). NPP of trees increases nearly everywhere in Noextremes compared to the Control scenario, by up to 200 gC m2 yr−1 in some regions in the mid-west of the USA (Fig. 5a). NPP of grasses shows slight increases in the lower latitudes but strong decreases in the higher latitudes, which are of similar magnitude to the increases in tree NPP (Fig. 5b). The pattern is more diverse for Hotdry, where NPP of trees generally decreases in the low-to-middle latitudes by up to −150 gC m2 yr−1 but increases in the very high latitudes (Fig. 5c). NPP of grasses tends to increase in most regions except some very dry regions in the Sahara and Middle East, Australia, Namibia, and the southwest of the USA (Fig. 5d).

Figure 5Difference in NPP for (a) Noextremes trees, (b) Noextremes grasses, (c) Hotdry trees, and (d) Hotdry grasses compared to the Control scenario.
Finally we investigate whether the interannual variability in NPP for four vegetation classes changes between the Control scenario and the different scenarios. Overall, interannual variability in NPP is smallest in tropical and temperate trees and largest in boreal trees (Fig. 6). Most scenarios tend to decrease variability in particular for trees, with Noextremes leading to significant decreases in all vegetation classes. In contrast, Hotdry tends to increase variability, though the difference from the Control scenario is only significant for boreal trees and grasses. For grasses, the Hot and the Dry scenarios also lead to a significant increase in NPP variability.
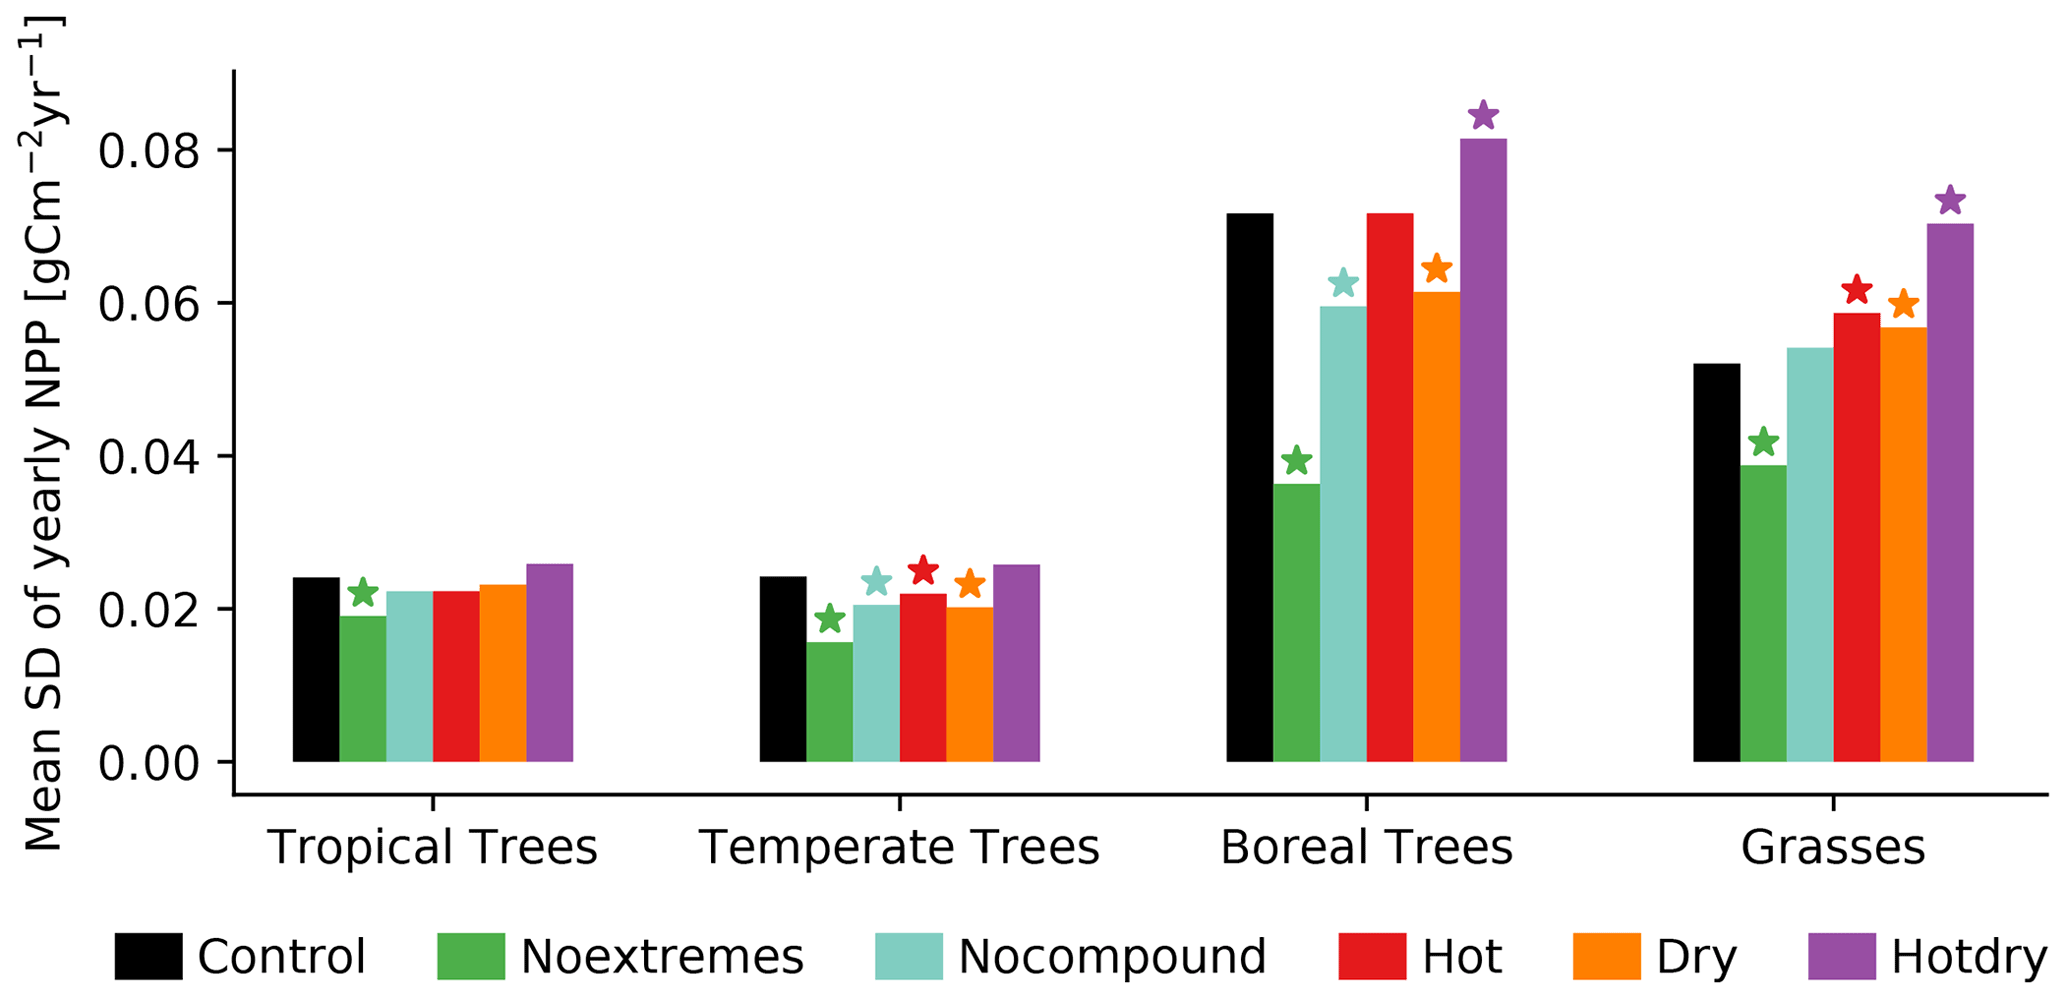
Figure 6Variability in NPP (calculated as interannual standard deviation across years for the four vegetation classes with the mean taken over all grid cells). The stars show the scenarios that are significantly different from the Control scenario at a 5 % significance level (based on a t test).
3.3 Path to model equilibrium
We explore how fast vegetation composition and net ecosystem production adjust towards a new equilibrium after a step-like change in extreme statistics, in this case a change in the frequency of hot and/or dry extremes. To this end, we analyse the 100-year-scenario simulations that started from the shared model spin-up forced by the Control climate. At the start of each scenario simulation, frequencies of dry and hot events suddenly change from those in the Control climate to those in the scenario.
Using the simulations based on the shared spin-up, we explore whether LPX-Bern reaches a new equilibrium (measured in terms of stable vegetation composition and neutral net ecosystem production) within the 100-year simulations after frequencies of dry and hot events suddenly change from the Control scenario to the different scenarios. Overall, the Noextremes and the Hotdry scenarios cause the largest disturbance in vegetation cover (Fig. 7). For most vegetation classes and most scenarios, the scenario simulations starting from the shared spin-up are within the range of variability in the scenario simulation starting from an individual spin-up at the end of the simulation. Exceptions are tropical trees in the Noextremes and the Hot scenarios, temperate trees in the Hot and the Hotdry scenarios, and grasses in the Hotdry scenario. The strongest response in vegetation cover occurs in the first 20 years. Grasses show a particularly fast response in the Hotdry scenario, where there is an initial decrease in coverage followed by a rapid increase. The reason for this seems to be that (predominantly temperate) grasses that are adapted to the climate in the Control scenario quickly die due to the frequent hot and dry conditions but then a regrowth of (predominantly tropical) grasses that can tolerate such conditions occurs. Overall, the above results suggest that, for the more extreme scenarios, 100 years may not be enough to fully reach equilibrium after a sudden change in dry and hot event occurrences.

Figure 7Time series of the fractional coverage (foliar projective cover) from the simulations that use the shared spin-up (black line). Scenarios are shown in dashed coloured lines for (a) tropical trees, (b) temperate trees, (c) boreal trees, and (d) grasses. The first 20 years (−20 to 0) represents the last 20 years of the shared spin-up. The variability (minimum to maximum) in vegetation cover in the individual-spin-up simulation (spin-up uses data from the respective scenarios) is indicated by the bars on the right-hand side. Note the different ranges of the y axes.
The findings based on vegetation cover are confirmed when investigating the temporal evolution of global annual net ecosystem production (NEP) in the simulations with shared spin-up (Fig. 8). Again, the disturbance is largest for the Noextremes (about 1 PgC yr−1 more uptake at the beginning of the simulation) and the Hotdry scenario (about 3 PgC yr−1 less uptake at the beginning). In all scenarios, global annual NEP converges towards 0 at the end of the 100-year simulations and varies within the range of interannual variability in the individual-spin-up simulations. Nevertheless, NEP is slightly larger than 0 in the Noextremes scenario and slightly smaller than 0 in the Hotdry scenario even at the end of the simulation, indicating that not all carbon pools are in full equilibrium after 100 years.

Figure 8Time series of global annual NEP from the simulations that use the shared spin-up (black line). Scenarios are shown in dashed coloured lines. The first 20 years (−20 to 0) represents the last 20 years of the shared spin-up. The variability (minimum to maximum) in global NEP in the individual-spin-up simulation (spin-up uses data from the respective scenarios) is indicated by the bars on the right hand side. A 5-year moving average was applied to smooth the time series.
Using stationary climate scenarios with varying drought-heat signatures and a dynamic vegetation model, we show that different occurrence frequencies of dry, hot, and compound dry–hot events lead to differences in vegetation coverage and related differences in global NPP (Fig. 2). The fraction of land area covered with vegetation is similar in all scenarios. However, there are shifts in coverage and NPP between vegetation classes. A key finding is that the climate, as represented by the Noextremes scenario, which features no extreme droughts or heatwaves and relatively little interannual variability, favours tree coverage (Fig. 2). This is evident in the tropical biomes to some extent but even more evident at higher latitudes. For trees to grow well, typically more stable environmental conditions are needed as compared to grasses (Sitch et al., 2003). For example, the biomass of grasses, with their fast biomass turnover and short life cycle, recovers much faster after an increase in mortality, e.g. due to a drought-heat event, than tree biomass.
Hence, overall, a more stable climate with few extremes is very beneficial for trees. In models such as LPX-Bern, trees are favoured over grasses. In particular, they receive priority for foliar coverage if conditions are suitable for tree growth. This explains why, in a more stable (i.e. less variable) climate, tree cover increases and grass cover decreases and vice versa.
While a climate with more heatwaves has little influence on tree coverage in the tropics, it tends to increase coverage in higher latitudes (Fig. 2). Trees in higher latitudes are typically temperature limited (Way and Oren, 2010). So a climate with more heatwaves alleviates some of these temperature constraints. While overall more heatwaves increase tree coverage globally, there are strong regional variations, meaning that higher temperatures do not lead to more growth everywhere (Ruiz-Pérez and Vico, 2020). In higher latitudes, more frequent heatwaves mean overall warmer temperatures during the growing season without necessarily exceeding the temperature limit of boreal trees, while in other regions such a limit might be reached more quickly, leading to a decrease in tree cover. Grass coverage does not significantly change for the Hot scenario compared to the Control scenario.
If water is restricted, as it is for the Dry scenario, tree coverage is slightly reduced overall. However, unlike in the other scenarios, grasses in a dry climate do not compensate for changes in tree coverage. Rather, grass coverage is decreased as well. This likely happens because grasses tend to grow in already dry regions, where tree coverage is unlikely. If these regions become drier, it might even become too dry for grasses to grow. When comparing the Hot and Dry scenarios, we see that the effects on global NPP as well as the vegetation carbon pool are more negative for the Dry than Hot scenario (Fig. 4). A drought event, therefore, does not have to be as extreme as a heat event to have a comparable impact, which is also supported by findings of Ribeiro et al. (2020).
The scenario with frequent compound hot and dry extremes clearly causes the strongest response and leads to a reduction in tree coverage across all climate zones. Hence, here even the warmer conditions in the northern latitudes that generally promote tree growth are superseded by the negative impacts of droughts (Belyazid and Giuliana, 2019; Ruiz-Pérez and Vico, 2020), though the effect is less pronounced for boreal trees than for temperate trees. Grass coverage, on the other hand, increases because it can fill the areas that were previously covered by trees. In dry regions, however, grass coverage is reduced for the Hotdry scenario as well, likely because here dryness thresholds under which vegetation cannot grow any more are frequently exceeded. Global NPP as well as vegetation coverage is overall reduced for this scenario compared to the Control scenario (Fig. 4).
Generally, trees grow nearly everywhere if the climate is favourable and features few extremes, leading to a reduction in grass cover. Only in dry regions do we observe an increase in grass coverage. There, conditions might still be unfavourable for trees to grow, but grasses benefit from the stable climate. In contrast, in a climate with frequent droughts and heatwaves, tree coverage is generally reduced, leaving room for grasses to grow, except in already dry regions, which become too dry even for grasses.
Globally, the effects of extremes are larger in the extratropics than they are in the tropics. The effects on tropical trees are small for all scenarios compared to the Control scenario, including the Hot and Dry extreme scenarios. One reason for this might be that strong evaporative cooling is maintained in tropical forests, even in a drier climate (Bonan, 2008) since the tropics (in particular tropical forest) are not so much water limited but rather energy limited. However, case studies on recent droughts in the Amazon forest show how tropical forests can be negatively affected by drought conditions (Doughty et al., 2015; Feldpausch et al., 2016; Machado-Silva et al., 2021). The variability between the scenarios is small for tropical trees and larger for temperate and boreal trees. The latter biomes are more water and/or temperature limited than the tropics and therefore react more strongly to variations in these variables. Grasses also show quite a large variability between scenarios owing to the fact that grasses react more quickly to climate variations, meaning they die and regrow faster than trees (Ahlström et al., 2015).
While vegetation carbon displays a pattern that correlates with the changes in coverage, the same is not true for soil carbon. Rather, the changes in soil carbon (Fig. 9) resemble the changes in grasses (Fig. 3).
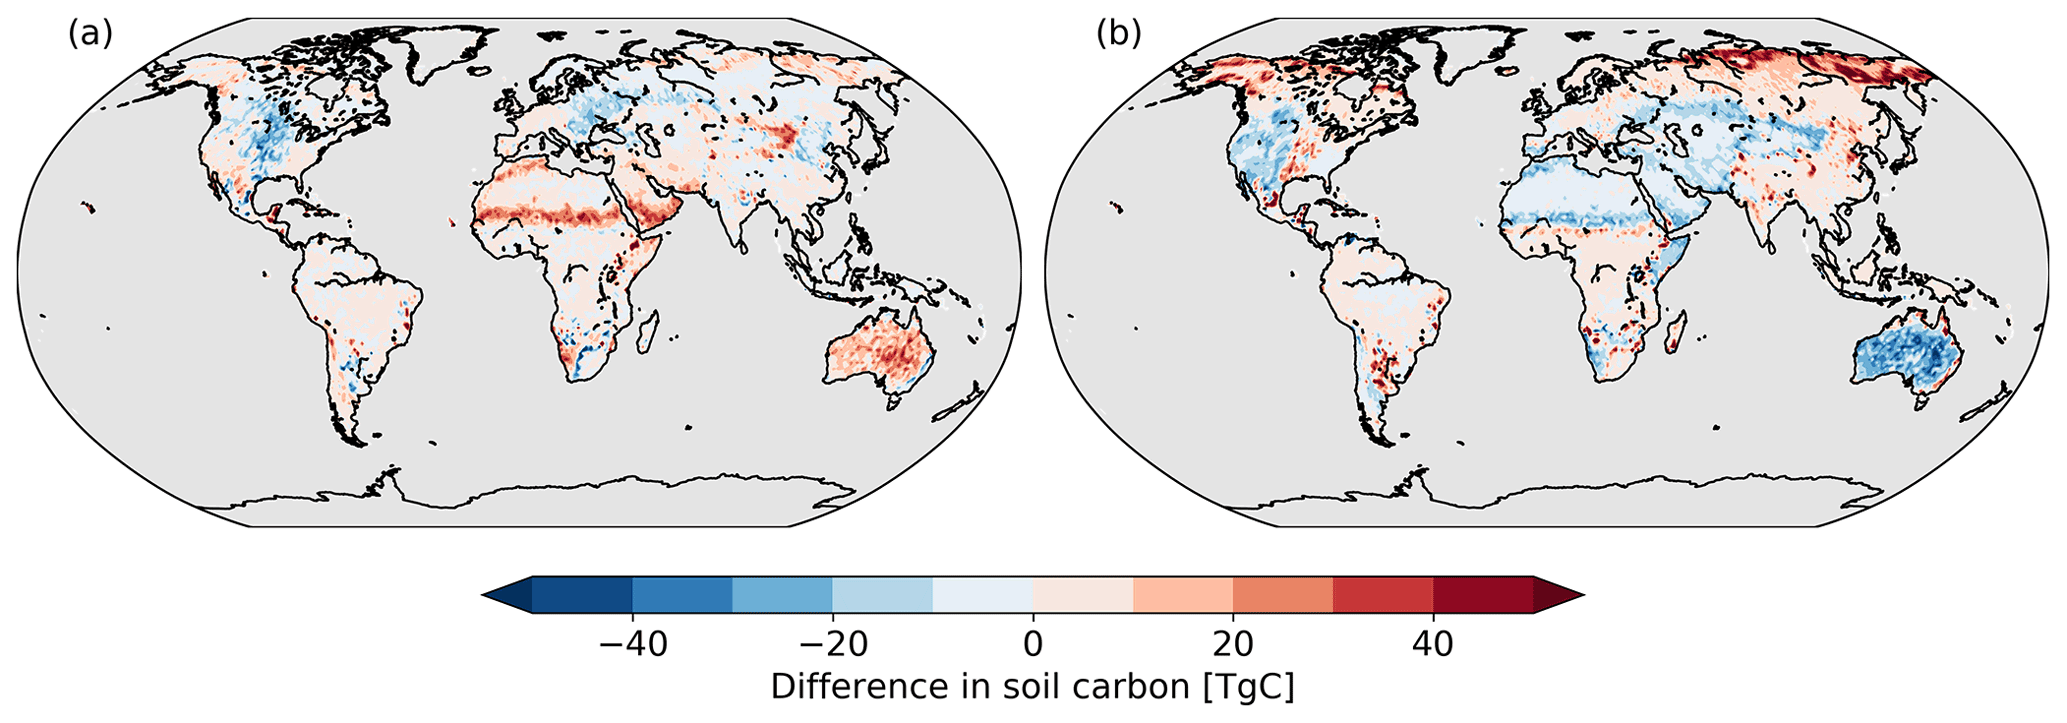
Figure 9Difference in soil carbon for (a) Noextremes vegetation (b) and Hotdry vegetation from the Control scenario.
Choosing an appropriate spin-up when modelling vegetation and the carbon cycle is important to make sure the model is in equilibrium. In our case, 1500 years seems appropriate, since the constant runs are stable over the 100 years. Starting with the same spin-up (based on the Control scenario) and a step change in extreme-event occurrence, most but not all scenarios converge to the equilibrium that is reached when doing the spin-up with the scenario forcing within 100 years (Fig. 7). Given the trajectories, we do not expect the runs with shared spin-up to reach the same end point as the runs with individual spin-up, even if the simulations are prolonged. Other vegetation models might have other response times to such a step change in extreme-event characteristics. For the main analysis, we used the individual-spin-up runs since these are the runs where the model had time to reach full equilibrium.
Scenarios where the occurrence of heatwaves, droughts, and drought-heat events is changed in a step-like manner reveal the characteristic timescales and magnitudes of the adjustment of a system, here the land biosphere, to the change. Our simulations reveal that plant coverage and NPP adjust on decadal timescales (Fig. 7) to altered extreme-event statistics, while, in addition, multi-decadal-to-century response timescales are evident for global NEP (Fig. 8). The response timescales and magnitudes of change are likely model specific to some extent. It would be illustrative to probe the response to step changes using other models. Though the setup of the step change in the occurrence of droughts and heatwaves is somewhat unrealistic, long-term trends in the dependence between temperature and precipitation have been detected in climate model projections (Zscheischler and Seneviratne, 2017). Such changes in the dependence structure can be quite relevant; for instance they may exacerbate climate change impacts on crops (Lesk et al., 2021).
We run the vegetation model offline, that is, with no feedback from the land surface to the climate, and keeping the atmospheric CO2 level constant. Processes in the real world might be more complex. Especially CO2 fertilization, where higher CO2 concentrations lead to a more efficient uptake of CO2 by the plants and thus less chance of losing water through open stomata, may modulate how hot and dry conditions affect vegetation and carbon dynamics in the future (Domec et al., 2017; De Kauwe et al., 2021).
All results, such as the exact changes in vegetation distribution and carbon uptake, are somewhat sensitive to the choice of the dynamic global vegetation model and the employed climate model. Every model has biases and limitations which could be discussed at length, but for argument's sake we will only discuss some of them briefly. One important component in LPX-Bern is the bioclimatic limits, as already mentioned in Sect. 2.2. Mortality induced by maximum temperature only affects tropical trees. One could imagine a different extreme response if this parameter also applied for grasses. As it is, C4 grasses are very water efficient in LPX-Bern, which leads to Australia being a bit too green in our simulations compared to observations, as an example. This could also explain why grasses thrive in the Hotdry scenario. A potential increase in atmospheric CO2 conditions as is predicted by socio-economic scenarios would further alleviate drought stress and thus benefit C4 grasses. The parameterization of the water balance is another possible factor that greatly influences the response to dry conditions. LPX-Bern has a relatively simple supply-and-demand-driven water limitation and for instance does not consider effects of xylem damage (Arend et al., 2021). Overall, models may differ strongly depending on model parameterizations and process representations (Paschalis et al., 2020). Furthermore, some uncertainties also arise from the model setup. For example, land–atmosphere feedbacks may play an important role (Humphrey et al., 2021), which are not considered in such an offline model setup as we have conducted in this study. Considering the number of uncertainties that may govern the vegetation and carbon cycle response to varying drought-heat signatures, a model intercomparison project using our scenarios as forcings for different vegetation models has already been set up and may reveal insights into how model differences affect the results.
It is widely acknowledged that extreme climate events can have large impacts on ecosystems and society. This study investigates the effects of different drought-heat occurrences in six hypothetical climate scenarios on vegetation distribution and terrestrial carbon dynamics, as simulated by the LPX-Bern dynamic global vegetation model. Generally, effects of changes in extreme-event frequency are more pronounced in the extratropics than in the tropics. We found that global carbon cycle variability is most stable in a climate without any extreme events, which favours more tree cover and a higher global terrestrial carbon stock. The effects on vegetation cover and carbon stocks and fluxes of a climate with many heatwaves are generally smaller than the effects of a climate with many droughts. The largest effect, however, is with a climate with frequent concurrent droughts and heatwaves. Here, forest cover and global vegetation carbon are strongly reduced. Grasses, in contrast, are more abundant. These effects surpass the simple linear combination of the effects of single droughts and single heatwaves.
Overall, our results highlight the importance of considering compound events when analysing impacts of climate extremes. Impacts may potentially be underestimated when only looking at single-event extremes instead of compounding extremes. Furthermore, the results suggest that uncertainties in projections of vegetation distribution and carbon dynamics in Earth system models may stem from different drought-heat signatures in the atmospheric module (Zscheischler and Seneviratne, 2017), in addition to structural model differences in the vegetation component. It is important to investigate and understand these issues in order to improve models as well as our knowledge about extreme events and their impacts.
Table A1Bioclimatic limits of the 10 available plant functional types in LPX-Bern.
The forcing scenarios are described in Tschumi et al. (2020) and can be accessed via Zenodo (https://doi.org/10.5281/zenodo.4385445). The LPX-Bern simulations are very large and are available from Elisabeth Tschumi (elisabeth.tschumi@unibe.ch). The soil data used to run LPX-Bern can be accessed via ORNL DAAC (https://doi.org/10.3334/ORNLDAAC/1247, Wieder et al., 2014).
JZ conceived the study. ET performed all analysis, performed model simulations with LPX-Bern, created all figures, and wrote the first draft. KvdW performed the model simulations with EC-Earth. SL and FJ helped with the setup of LPX-Bern and interpretation of the results. All authors contributed substantially to the writing and revisions of the manuscript.
At least one of the (co-)authors is a member of the editorial board of Biogeosciences. The peer-review process was guided by an independent editor, and the authors also have no other competing interests to declare.
The work reflects only the authors’ view; the European Commission and their executive agency are not responsible for any use that may be made of the information the work contains.
Publisher’s note: Copernicus Publications remains neutral with regard to jurisdictional claims in published maps and institutional affiliations.
This article is part of the special issue “Understanding compound weather and climate events and related impacts (BG/ESD/HESS/NHESS inter-journal SI)”. It is not associated with a conference.
The authors acknowledge the European COST Action DAMOCLES (CA17109).
This research has been supported by the Schweizerischer Nationalfonds zur Förderung der Wissenschaftlichen Forschung (Ambizione (grant no. 179876) and grant no. 200511), the Helmholtz-Fonds (Young Investigator Group COMPOUNDX (grant no. VH-NG-1537)), the National Natural Science Foundation of China (grant nos. NWO ALWCL.2 016.2 and NSFC 41661144006), and Horizon 2020 (project 4C (grant no. 821003)).
This paper was edited by Bart van den Hurk and reviewed by Martin De Kauwe and Christopher Reyer.
Ahlström, A., Raupach, M. R., Schurgers, G., Smith, B., Arneth, A., Jung, M., Reichstein, M., Canadell, J. G., Friedlingstein, P., Jain, A. K., Kato, E., Poulter, B., Sitch, S., Stocker, B. D., Viovy, N., Wang, Y. P., Wiltshire, A., Zaehle, S., and Zeng, N.: The dominant role of semi-arid ecosystems in the trend and variability of the land CO2 sink, Science, 348, 895–899, 2015. a
Allen, C. D., Macalady, A. K., Chenchouni, H., Bachelet, D., McDowell, N., Vennetier, M., Kitzberger, T., Rigling, A., Breshears, D. D., Hogg, E. T., Gonzalez, P., Fensham, R., Zhang, Z., Castro, J., Demidova, N., Lim, J.-H., Allard, G., Running, S. W., Semerci, A., and Cobb, N.: A global overview of drought and heat-induced tree mortality reveals emerging climate change risks for forests, Forest Ecol. Manag., 259, 660–684, https://doi.org/10.1016/j.foreco.2009.09.001, 2010. a
Anderegg, W. R., Kane, J. M., and Anderegg, L. D.: Consequences of widespread tree mortality triggered by drought and temperature stress, Nat. Clim. Change, 3, 30–36, 2013. a
Arend, M., Link, R. M., Patthey, R., Hoch, G., Schuldt, B., and Kahmen, A.: Rapid hydraulic collapse as cause of drought-induced mortality in conifers, P. Natl. Acad. Sci. USA, 118, 16, https://doi.org/10.1073/pnas.2025251118, 2021. a
Bastos, A., Ciais, P., Friedlingstein, P., Sitch, S., Pongratz, J., Fan, L., Wigneron, J. P., Weber, U., Reichstein, M., Fu, Z., Anthoni, P., Arneth, A., Haverd, V., Jain, A. K., Joetzjer, E., Knauer, J., Lienert, S., Loughran, T., McGuire, P. C., Tian, H., Viovy, N., and Zaehle, S.: Direct and seasonal legacy effects of the 2018 heat wave and drought on European ecosystem productivity, Science Advances, 6, eaba2724, https://doi.org/10.1126/sciadv.aba2724, 2020. a
Beier, C., Beierkuhnlein, C., Wohlgemuth, T., Penuelas, J., Emmett, B., Körner, C., de Boeck, H., Christensen, J. H., Leuzinger, S., Janssens, I. A., and Hansen, K.: Precipitation manipulation experiments–challenges and recommendations for the future, Ecol. Lett., 15, 899–911, 2012. a
Belyazid, S. and Giuliana, Z.: Water limitation can negate the effect of higher temperatures on forest carbon sequestration, Eur. J. For. Res., 138, 287–297, 2019. a
Bonan, G. B.: Forests and climate change: forcings, feedbacks, and the climate benefits of forests, Science, 320, 1444–1449, 2008. a
Ciais, P., Reichstein, M., Viovy, N., Granier, A., Ogée, J., Allard, V., Aubinet, M., Buchmann, N., Bernhofer, C., Carrara, A., Chevallier, F., De Noblet, N., Friend, A. D., Friedlingstein, P., Grünwald, T., Heinesch, B., Keronen, P., Knohl, A., Krinner, G., Loustau, D., Manca, G., Matteucci, G., Miglietta, F., Ourcival, J. M., Papale, D., Pilegaard, K., Rambal, S., Seufert, G., Soussana, J. F., Sanz, M. J., Schulze, E. D., Vesala, T., Valentini, R., Grüunwald, T., Heinesch, B., Keronen, P., Knohl, A., Krinner, G., Loustau, D., Manca, G., Matteucci, G., Miglietta, F., Ourcival, J. M., Papale, D., Pilegaard, K., Rambal, S., Seufert, G., Soussana, J. F., Sanz, M. J., Schulze, E. D., Vesala, T., and Valentini, R.: Europe-wide reduction in primary productivity caused by the heat and drought in 2003, Nature, 437, 529–33, https://doi.org/10.1038/nature03972, 2005. a, b, c
De Boeck, H. J., Dreesen, F. E., Janssens, I. A., and Nijs, I.: Whole-system responses of experimental plant communities to climate extremes imposed in different seasons, New Phytol., 189, 806–817, 2011. a
De Kauwe, M. G., Medlyn, B. E., Zaehle, S., Walker, A. P., Dietze, M. C., Hickler, T., Jain, A. K., Luo, Y., Parton, W. J., Prentice, I. C., Smith, B., Thornton, P. E., Wang, S., Wang, Y.-P., Wårlind, D., Weng, E., Crous, K. Y., Ellsworth, D. S., Hanson, P. J., Kim, H.-S., Warren, J. M., Oren, R., and Norby, R. J.: Forest water use and water use efficiency at elevated CO2: a model-data intercomparison at two contrasting temperate forest FACE sites, Global Change Biol., 19, 1759–1779, 2013. a
De Kauwe, M. G., Medlyn, B. E., and Tissue, D. T.: To what extent can rising [CO2] ameliorate plant drought stress?, New Phytol., 231, 2118–2124, 2021. a
Domec, J.-C., Smith, D. D., and McCulloh, K. A.: A synthesis of the effects of atmospheric carbon dioxide enrichment on plant hydraulics: implications for whole-plant water use efficiency and resistance to drought, Plant Cell Environ., 40, 921–937, 2017. a
Doughty, C. E., Metcalfe, D. B., Girardin, C. A. J., Farfán Amézquita, F., Galiano Cabrera, D., Huaraca Huasco, W., Silva-Espejo, J. E., Araujo-Murakami, A., da Costa, M. C., Rocha, W., Feldpausch, T. R., Mendoza, A. L. M., da Costa, A. C. L., Meir, P., Phillips, O. L., and Malhi, Y.: Drought impact on forest carbon dynamics and fluxes in Amazonia, Nature, 519, 78–82, 2015. a
Feldpausch, T. R., Phillips, O. L., Brienen, R. J. W., Gloor, E., Lloyd, J., Lopez-Gonzalez, G., Monteagudo-Mendoza, A., Malhi, Y., Alarcón, A., Álvarez Dávila, E., Alvarez-Loayza, P., Andrade, A., Aragao, L. E. O. C., Arroyo, L., Aymand, C., G. A., Baker, T. R., Baraloto, C., Barroso, J., Bonal, D., Castro, W., Chama, V., Chave, J., Domingues, T. F., Fauset, S., Groot, N., Honorio Coronado, E., Laurance, S., Laurance, W. F., Lewis, S. L., Licona, J. C., Marimon, B. S., Marimon-Junior, B. H., Mendoza Bautista, C., Neill, D. A., Oliveira, E. A., Oliveira dos Santos, C., Pallqui Camacho, N. C., Pardo-Molina, G., Prieto, A., Quesada, C. A., Ramírez, F., Ramírez-Angulo, H., Réjou-Méchain, M., Rudas, A., Saiz, G., Salomão, R. P., Silva-Espejo, J. E., Silveira, M., ter Steege, H., Stropp, J., Terborgh, J., Thomas-Caesar, R., van der Heijden, G. M. F., Vásquez Martinez, R., Vilanova, E., and Vos, V. A.: Amazon forest response to repeated droughts, Global Biogeochem. Cy., 30, 964–982, 2016. a
Flach, M., Gans, F., Brenning, A., Denzler, J., Reichstein, M., Rodner, E., Bathiany, S., Bodesheim, P., Guanche, Y., Sippel, S., and Mahecha, M. D.: Multivariate anomaly detection for Earth observations: a comparison of algorithms and feature extraction techniques, Earth Syst. Dynam., 8, 677–696, https://doi.org/10.5194/esd-8-677-2017, 2017. a
Frank, D., Reichstein, M., Bahn, M., Thonicke, K., Frank, D., Mahecha, M. D., Smith, P., Van der Velde, M., Vicca, S., Babst, F., Beer, C., Buchmann, N., Canadell, J. G., Ciais, P., Cramer, W., Ibrom, A., Miglietta, F., Poulter, B., Rammig, A., Seneviratne, S. I., Walz, A., Wattenbach, M., Zavala, M. A., and Zscheischler, J.: Effects of climate extremes on the terrestrial carbon cycle: concepts, processes and potential future impacts, Glob. Change Biol., 21, 2861–2880, 2015. a, b
Friedlingstein, P., Meinshausen, M., Arora, V. K., Jones, C. D., Anav, A., Liddicoat, S. K., and Knutti, R.: Uncertainties in CMIP5 climate projections due to carbon cycle feedbacks, J. Climate, 27, 511–526, 2014. a
Friedlingstein, P., O'Sullivan, M., Jones, M. W., Andrew, R. M., Hauck, J., Olsen, A., Peters, G. P., Peters, W., Pongratz, J., Sitch, S., Le Quéré, C., Canadell, J. G., Ciais, P., Jackson, R. B., Alin, S., Aragão, L. E. O. C., Arneth, A., Arora, V., Bates, N. R., Becker, M., Benoit-Cattin, A., Bittig, H. C., Bopp, L., Bultan, S., Chandra, N., Chevallier, F., Chini, L. P., Evans, W., Florentie, L., Forster, P. M., Gasser, T., Gehlen, M., Gilfillan, D., Gkritzalis, T., Gregor, L., Gruber, N., Harris, I., Hartung, K., Haverd, V., Houghton, R. A., Ilyina, T., Jain, A. K., Joetzjer, E., Kadono, K., Kato, E., Kitidis, V., Korsbakken, J. I., Landschützer, P., Lefèvre, N., Lenton, A., Lienert, S., Liu, Z., Lombardozzi, D., Marland, G., Metzl, N., Munro, D. R., Nabel, J. E. M. S., Nakaoka, S.-I., Niwa, Y., O'Brien, K., Ono, T., Palmer, P. I., Pierrot, D., Poulter, B., Resplandy, L., Robertson, E., Rödenbeck, C., Schwinger, J., Séférian, R., Skjelvan, I., Smith, A. J. P., Sutton, A. J., Tanhua, T., Tans, P. P., Tian, H., Tilbrook, B., van der Werf, G., Vuichard, N., Walker, A. P., Wanninkhof, R., Watson, A. J., Willis, D., Wiltshire, A. J., Yuan, W., Yue, X., and Zaehle, S.: Global Carbon Budget 2020, Earth Syst. Sci. Data, 12, 3269–3340, https://doi.org/10.5194/essd-12-3269-2020, 2020. a
Friend, A. D., Lucht, W., Rademacher, T. T., Keribin, R., Betts, R., Cadule, P., Ciais, P., Clark, D. B., Dankers, R., Falloon, P. D., Ito, A., Kahana, R., Kleidon, A., Lomas, M. R., Nishina, K., Ostberg, S., Pavlick, R., Peylin, P., Schaphoff, S., Vuichard, N., Warszawski, L., Wiltshire, A., and Woodward, F. I.: Carbon residence time dominates uncertainty in terrestrial vegetation responses to future climate and atmospheric CO2, P. Natl. Acad. Sci. USA, 111, 3280–3285, 2014. a
Gampe, D., Zscheischler, J., Reichstein, M., O’Sullivan, M., Smith, W. K., Sitch, S., and Buermann, W.: Increasing impact of warm droughts on northern ecosystem productivity over recent decades, Nat. Clim. Change, 11, 772–779, https://doi.org/10.1038/s41558-021-01112-8, 2021. a
Hazeleger, W., Wang, X., Severijns, C., Ştefănescu, S., Bintanja, R., Sterl, A., Wyser, K., Semmler, T., Yang, S., Van den Hurk, B., van Noije, T., van der Linden, E., and van der Wiel, K.: EC-Earth V2.2: description and validation of a new seamless earth system prediction model, Clim. Dynam., 39, 2611–2629, 2012. a
Herrera-Estrada, J. E. and Sheffield, J.: Uncertainties in Future Projections of Summer Droughts and Heat Waves over the Contiguous United States, J. Climate, 30, 6225–6246, https://doi.org/10.1175/JCLI-D-16-0491.1, 2017. a
Humphrey, V., Berg, A., Ciais, P., Gentine, P., Jung, M., Reichstein, M., Seneviratne, S. I., and Frankenberg, C.: Soil moisture–atmosphere feedback dominates land carbon uptake variability, Nature, 592, 65–69, 2021. a, b
IPCC: Managing the Risks of Extreme Events and Disasters to Advance Climate Change Adaptation: Special Report of the Intergovernmental Panel on Climate Change, Cambridge University Press, https://doi.org/10.1017/CBO9781139177245, 2012. a
Lesk, C., Coffel, E., Winter, J., Ray, D., Zscheischler, J., Seneviratne, S., and Horton, R.: Stronger temperature-moisture couplings exacerbate the impact of climate warming on global crop yields, Nature Food, 2, 683–691, 2021. a
Lienert, S. and Joos, F.: A Bayesian ensemble data assimilation to constrain model parameters and land-use carbon emissions, Biogeosciences, 15, 2909–2930, https://doi.org/10.5194/bg-15-2909-2018, 2018. a
Machado-Silva, F., Peres, L. F., Gouveia, C. M., Enrich-Prast, A., Peixoto, R. B., Pereira, J. M., Marotta, H., Fernandes, P. J., and Libonati, R.: Drought resilience debt drives NPP decline in the Amazon Forest, Global Biogeochem. Cy., 35, e2021GB007004, https://doi.org/10.1029/2021GB007004, 2021. a
Pan, S., Yang, J., Tian, H., Shi, H., Chang, J., Ciais, P., Francois, L., Frieler, K., Fu, B., Hickler, T., Ito, A., Nishina, K., Ostberg, S., Reyer, C. P., Schaphoff, S., Steinkamp, J., and Zhao, F.: Climate Extreme Versus Carbon Extreme: Responses of Terrestrial Carbon Fluxes to Temperature and Precipitation, J. Geophys. Res.-Biogeo., 125, e2019JG005252, https://doi.org/10.1029/2019JG005252, 2020. a, b
Paschalis, A., Fatichi, S., Zscheischler, J., Ciais, P., Bahn, M., Boysen, L., Chang, J., De Kauwe, M., Estiarte, M., Goll, D., Hanson, P. J., Harper, A. B., Hou, E., Kigel, J., Knapp, A. K., Larse, K. S., Li, W., Lienert, S., Luo, Y., Meir, P., Nabel, J. E. M. S., Ogaya, R., Parolari, A. J., Peng, C., Peñuelas, J., Pongratz, J., Rambal, S., Schmidt, I. K., Shi, H., Sternberg, M., Tian, H., Tschumi, E., Ukkola, A., Vicca, S., Viovy, N., Wang, Y.-P., Wang, Z., Williams, K., Wu, D., and Zhu, Q.: Rainfall manipulation experiments as simulated by terrestrial biosphere models: Where do we stand?, Glob. Change Biol., 26, 3336–3355, 2020. a
Pastorello, G., Trotta, C., Canfora, E., Chu, H., Christianson, D., Cheah, Y.-W., Poindexter, C., Chen, J., Elbashandy, A., Humphrey, M., Isaac, P., Polidori, D., Ribeca, A., van Ingen, C., Zhang, L., Amiro, B., Ammann, C., Arain, M. A., Ardö, J., Arkebauer, T., Arndt, S. K., Arriga, N., Aubinet, M., Aurelia, M., Baldocchi, D., Barr, A., Beamesderfer, E., Belelli Marchesini, L., Bergeron, O., Beringer, J., Bernhofer, C., Berveiller, D., Billesbach, D., Andrew Black, T., Blanken, P. D., Bohrer, G., Boike, J., Bolstad, P. V., Bonal, D., Bonnefond, J.-M., Bowling, D. R., Bracho, R., Brodeur, J., Brümmer, C., Buchmann, N., Burban, B., Burns, S. P., Buysse, P., Cale, P., Cavagna, M., Cellier, P., Chen, S., Chini, I., Christensen, T. R., Cleverly, J., Collalti, A., Consalvo, C., Cook, B. D., Cook, D., Coursolle, C., Cremonese, E., Curtis, P. S., D'Andrea, E., da Rocha, H., Dai, X., Davis, K. J., De Cinti, B., de Grandcourt, A., De Ligne, A., De Oliveira, R. C., Delpierre, N., Desai, A. R., Marcelo Di Bella, C., di Tommasi, P., Dolman, H., Domingo, F., Dong, G., Dore, S., Duce, P., Dufrêne, E., Dunn, A., Dušek, J., Eamus, D., Eichelmann, U., Abdalla M ElKhidir, H., Eugster, W., Ewenz, C. M., Ewers, B., Famulari, D., Fares, S., Feigenwinter, I., Feitz, A., Fensholt, R., Filippa, G., Fischer, M., Frank, J., Galvagno, M., Gharun, M., Gianelle, D., Gielen, B., Gioli, B., Gitelson, A., Goded, I., Goeckede, M., Goldstein, A. H., Gough, C. M., Goulden, M. L., Graf, A., Griebel, A., Gruening, C., Grünwald, T., Hammerle, A., Han, S., Han, X., Hansen, B. U., Hanson, C., Hatakka, J., He, Y., Hehn, M., Heinesch, B., Hinko-Najera, N., Hörtnagl, L., Hutley, L., Ibrom, A., Ikawa, H., Jackowicz-Korczynski, M., Janouš, D., Jans, W., Jassal, R., Jiang, S., Kato, T., Khomik, M., Klatt, J., Knohl, A., Knox, S., Kobayashi, H., Koerber, G., Kolle, O., Kosugi, Y., Kotami, A., Kowalski, A., Kruijt, B., Kurbatova, J., Kutsch, W. L., Kwon, H., Launiainen, S., Laurila, T., Law, B., Leuning, R., Li, Y., Liddell, M., Limousin, J.-M., Lion, M., Liska, A. J., Lohila, A., López-Ballesteros, A., López-Blanco, E., Loubet, B., Loustau, D., Lucas-Moffat, A., Lüers, J., Ma, S., Macfarlane, C., Magliulo, V., Maier, R., Mammarella, I., Manca, G., Marcolla, B., Margolis, H. A., Marras, S., Massman, W., Mastepanov, M., Matamala, R., Hatala Matthes, J., Mazzenga, F., McCaughey, Harry McHugh, I., McMillan, A. M. S., Merbold, L., Meyer, W., Meyers, T., Miller, S. D., Minerbi, S., Moderow, U., Monson, R. K., Montagnani, L., Moore, C. E., Moors, E., Moreaux, V., Moureaux, C., Munger, J. W., Nakai, T., Neirynck, J., Nesic, Z., Nicolini, G., Noormets, A., Northwood, M., Nosetto, M., Nouvellon, Y., Novick, K., Oechel, W., Olesen, J. E., Ourcival, J.-M., Papuga, S. A., Parmentier, F.-J., Paul-Limoges, E., Pavelka, M., Peichl, M., Pendall, E., Phillips, R. P., Pilegaard, K., Pirk, N., Posse, G., Powell, T., Prasse, H., Prober, S. M., Rambal, S., Rannik, Ü., Raz-Yaseef, N., Reed, D., Resco de Dios, V., Restrepo-Coupe, N., Reverter, B. R., Roland, M., Sabbatini, S., Sachs, T., Saleska, S. R., Sánches-Cañete, E. P., Sanches-Mejia, Z. M., Schmid, H. P., Schmidt, M., Schneider, K., Schrader, F., Schroder, I., Scott, R. L., Sedlák, P., Serrano-Ortíz, P., Shao, C., Shi, P., Shironya, I., Siebicke, L., Šigut, L., Silberstein, R., Sirca, C., Spano, D., Steinbrecher, R., Stevens, R. M., Sturtevant, C., Suyker, A., Tagesson, T., Satoru, T., Tang, Y., Tapper, N., Thom, J., Tiedemann, F., Tomassucci, M., Tuovinen, J.-P., Urbanski, S., Valentini, R., van der Molen, M., van Gorsel, E., van Huissteden, K., Varlagin, A., Verfaillie, J., Vesala, T., Vincke, C., Vitale, D., Vygodskaya, N., Walker, J. P., Walter-Shea, E., Wang, H., Weber, R., Westermann, S., Wille, C., Wofsky, S., Wohlfahrt, G., Wolf, S., Woodgate, W., Li, Y., Zampedri, R., Zhang, J., Zhou, G., Zona, D., Agarwal, D., Biraud, S., Torn, M., and Papale, D.: The FLUXNET2015 dataset and the ONEFlux processing pipeline for eddy covariance data, Scientific Data, 7, 1–27, 2020. a
Rammig, A., Wiedermann, M., Donges, J. F., Babst, F., von Bloh, W., Frank, D., Thonicke, K., and Mahecha, M. D.: Coincidences of climate extremes and anomalous vegetation responses: comparing tree ring patterns to simulated productivity, Biogeosciences, 12, 373–385, https://doi.org/10.5194/bg-12-373-2015, 2015. a
Reichstein, M., Bahn, M., Ciais, P., Frank, D., Mahecha, M. D., Seneviratne, S. I., Zscheischler, J., Beer, C., Buchmann, N., Frank, D. C., Papale, D., Rammig, A., Smith, P., Thonicke, K., van der Welde, M., Vicca, S., Walz, A., and Wattenbach, M.: Climate extremes and the carbon cycle, Nature, 500, 287–295, 2013. a, b, c
Ribeiro, A. F. S., Russo, A., Gouveia, C. M., Páscoa, P., and Zscheischler, J.: Risk of crop failure due to compound dry and hot extremes estimated with nested copulas, Biogeosciences, 17, 4815–4830, https://doi.org/10.5194/bg-17-4815-2020, 2020. a, b
Ruiz-Pérez, G. and Vico, G.: Effects of temperature and water availability on Northern European boreal forests, Frontiers in Forests and Global Change, 3, 34, https://doi.org/10.3389/ffgc.2020.00034, 2020. a, b
Seidl, R., Thom, D., Kautz, M., Martin-Benito, D., Peltoniemi, M., Vacchiano, G., Wild, J., Ascoli, D., Petr, M., Honkaniemi, J., Lexer, M. J., Trotsiuk, V., Mairota, P., Svoboda, M., Ffabrika, M., Nagel, T. A., and Reyer, C. P. O.: Forest disturbances under climate change, Nat. Clim. Change, 7, 395–402, 2017. a
Seneviratne, S. I., Nicholls, N., Easterling, D., Goodess, C., Kanae, S., Kossin, J., Luo, Y., Marengo, J., McInnes, K., Rahimi, M., Reichstein, M., Sorteberg, A., Vera, C., and Zhang, X.: Changes in Climate Extremes and their Impacts on the Natural Physical Environment, in: Managing the Risks of Extreme Events and Disasters to Advance Climate Change Adaptation, edited by: Field, C., Barros, V., Stocker, T., Qin, D., Dokken, D., Ebi, K., Mastrandrea, M., Mach, K., Plattner, G.-K., Allen, S., Tignor, M., and Midgley, P., Cambridge University Press, Cambridge, UK, and New York, NY, USA, 109–230, https://doi.org/10.7916/d8-6nbt-s431, 2012. a
Senf, C., Buras, A., Zang, C. S., Rammig, A., and Seidl, R.: Excess forest mortality is consistently linked to drought across Europe, Nat. Commun., 11, 1–8, https://doi.org/10.1038/s41467-020-19924-1, 2020. a, b
Sippel, S., Reichstein, M., Ma, X., Mahecha, M. D., Lange, H., Flach, M., and Frank, D.: Drought, heat, and the carbon cycle: a review, Current Climate Change Reports, 4, 266–286, 2018. a
Sitch, S., Smith, B., Prentice, I. C., Arneth, A., Bondeau, A., Cramer, W., Kaplan, J. O., Levis, S., Lucht, W., Sykes, M. T., Thonicke, K., and Venevsky, S.: Evaluation of ecosystem dynamics, plant geography and terrestrial carbon cycling in the LPJ dynamic global vegetation model, Global Change Biol., 9, 161–185, 2003. a, b
Sitch, S., Huntingford, C., Gedney, N., Levy, P., Lomas, M., Piao, S., Betts, R., Ciais, P., Cox, P., Friedlingstein, P., Jones, C. D., Prentice, I. C., and Woodward, F. I.: Evaluation of the terrestrial carbon cycle, future plant geography and climate-carbon cycle feedbacks using five Dynamic Global Vegetation Models (DGVMs), Global Change Biol., 14, 2015–2039, 2008. a
Song, J., Wan, S., Piao, S., Knapp, A. K., Classen, A. T., Vicca, S., Ciais, P., Hovenden, M. J., Leuzinger, S., Beier, C., Kardol, P., Xia, J., Liu, Q., Ru, J., Zhou, Z., Luo, Y., Guo, D., Langley, A. J., Zscheischler, J., Dukes, J. S., Tang, J., Chen, J., Hofmockel, K. S., Kueppers, L. M., Rustad, L., Liu, L., Smith, M. D., Templer, P. H., Quinn Thomas, R., Norby, R. J., Phillips, R. P., Niu, S., Fatichi, S., Wang, Y., Shao, P., Han, H., Wang, D., Lei, L., Wang, J., Li, X., Zhang, Q., Li, X., Su, F., Liu, B., Yang, F., Ma, G., Li, G., Liu, Y., Liu, Y., Yang, Z., Zhang, K., Miao, Y., Hu, M., Yan, C., Zhang, A., Zhong, M., Hui, Y., Li, Y., and Zheng, M.: A meta-analysis of 1,119 manipulative experiments on terrestrial carbon-cycling responses to global change, Nature Ecology & Evolution, 3, 1309–1320, https://doi.org/10.1038/s41559-019-0958-3, 2019. a
Stocker, B. D., Zscheischler, J., Keenan, T. F., Prentice, I. C., Seneviratne, S. I., and Peñuelas, J.: Drought impacts on terrestrial primary production underestimated by satellite monitoring, Nat. Geosci., 12, 264–270, 2019. a
Tian, H., Yang, J., Lu, C., Xu, R., Canadell, J. G., Jackson, R. B., Arneth, A., Chang, J., Chen, G., Ciais, P., Gerber, S., Ito, A., Huang, Y., Joos, F., Lienert, S., Messina, P., Olin, S., Pan, S., Peng, C., Saikawa, E., Thompson, R. L., Vuichard, N., Winiwarter, W., Zaehle, S., Zhang, B., Zhang, K., and Zhu, Q.: The global N2O Model Intercomparison Project, B. Am. Meteorol. Soc., 99, 1231–1251, 2018. a
Tschumi, E. and Zscheischler, J.: Countrywide climate features during recorded climate-related disasters, Climatic Change, 158, 593–609, https://doi.org/10.1007/s10584-019-02556-w, 2020. a
Tschumi, E., Lienert, S., van der Wiel, K., Joos, F., and Zscheischler, J.: A climate database with varying drought-heat signatures for climate impact modelling (version1.0), Zenodo [data set], https://doi.org/10.5281/zenodo.4385445, 2020. a
Tschumi, E., Lienert, S., van der Wiel, K., Joos, F., and Zscheischler, J.: A climate database with varying drought-heat signatures for climate impact modelling, Geosci. Data J., 00, 1–13, https://doi.org/10.1002/gdj3.129, 2021. a, b, c, d, e
Van der Wiel, K., Selten, F. M., Bintanja, R., Blackport, R., and Screen, J. A.: Ensemble climate-impact modelling: extreme impacts from moderate meteorological conditions, Environ. Res. Lett., 15, 034050, https://doi.org/10.1088/1748-9326/ab7668, 2020. a
Vogel, J., Rivoire, P., Deidda, C., Rahimi, L., Sauter, C. A., Tschumi, E., van der Wiel, K., Zhang, T., and Zscheischler, J.: Identifying meteorological drivers of extreme impacts: an application to simulated crop yields, Earth Syst. Dynam., 12, 151–172, https://doi.org/10.5194/esd-12-151-2021, 2021. a
von Buttlar, J., Zscheischler, J., Rammig, A., Sippel, S., Reichstein, M., Knohl, A., Jung, M., Menzer, O., Arain, M. A., Buchmann, N., Cescatti, A., Gianelle, D., Kiely, G., Law, B. E., Magliulo, V., Margolis, H., McCaughey, H., Merbold, L., Migliavacca, M., Montagnani, L., Oechel, W., Pavelka, M., Peichl, M., Rambal, S., Raschi, A., Scott, R. L., Vaccari, F. P., van Gorsel, E., Varlagin, A., Wohlfahrt, G., and Mahecha, M. D.: Impacts of droughts and extreme-temperature events on gross primary production and ecosystem respiration: a systematic assessment across ecosystems and climate zones, Biogeosciences, 15, 1293–1318, https://doi.org/10.5194/bg-15-1293-2018, 2018. a, b, c
Way, D. A. and Oren, R.: Differential responses to changes in growth temperature between trees from different functional groups and biomes: a review and synthesis of data, Tree Physiol., 30, 669–688, 2010. a
Wieder, W. R., Boehnert, J., Bonan, G. B., and Langseth, M.: Regridded Harmonized World Soil Database V1.2. ORNL DAAC, Oak Ridge, Tenessee, USA, Earth data [data set], https://doi.org/10.3334/ORNLDAAC/1247, 2014. a
Xu, C., McDowell, N. G., Fisher, R. A., Wei, L., Sevanto, S., Christoffersen, B. O., Weng, E., and Middleton, R. S.: Increasing impacts of extreme droughts on vegetation productivity under climate change, Nat. Clim. Change, 9, 948–953, 2019. a
Yuan, W., Cai, W., Chen, Y., Liu, S., Dong, W., Zhang, H., Yu, G., Chen, Z., He, H., Guo, W., Liu, D., Liu, S., Xiang, W., Xie, Z., Zhao, Z., and Zhou, G.: Severe summer heatwave and drought strongly reduced carbon uptake in Southern China, Sci. Rep., 6, 1–12, 2016. a
Zhao, M. and Running, S. W.: Drought-induced reduction in global terrestrial net primary production from 2000 through 2009, Science, 329, 940–943, https://doi.org/10.1126/science.1192666, 2010. a
Zscheischler, J. and Seneviratne, S. I.: Dependence of drivers affects risks associated with compound events, Science Advances, 3, e1700263, https://doi.org/10.1126/sciadv.1700263, 2017. a, b, c
Zscheischler, J., Mahecha, M. D., Harmeling, S., and Reichstein, M.: Detection and attribution of large spatiotemporal extreme events in Earth observation data, Ecol. Inform., 15, 66–73, https://doi.org/10.1016/j.ecoinf.2013.03.004, 2013. a
Zscheischler, J., Mahecha, M. D., Von Buttlar, J., Harmeling, S., Jung, M., Rammig, A., Randerson, J. T., Schölkopf, B., Seneviratne, S. I., Tomelleri, E., Zaehle, S., and Reichstein, M.: A few extreme events dominate global interannual variability in gross primary production, Environ. Res. Lett., 9, 035001, https://doi.org/10.1088/1748-9326/9/3/035001, 2014a. a
Zscheischler, J., Michalak, A. M., Schwalm, C., Mahecha, M. D., Huntzinger, D. N., Reichstein, M., Berthier, G., Ciais, P., Cook, R. B., El-Masri, B., Huang, M., Ito, A., Jain, A., King, A., Lei, H., Lu, C., Mao, J., Peng, S., Poulter, B., Ricciuto, D., Shi, X., Tao, B., Tian, H., Viovy, N., Wang, W., Wei, Y., Yang, J., and Zeng, N.: Impact of large-scale climate extremes on biospheric carbon fluxes: An intercomparison based on MsTMIP data, Global Biogeochem. Cy., 28, 585–600, https://doi.org/10.1002/2014GB004826, 2014b. a, b, c
Zscheischler, J., Reichstein, M., Harmeling, S., Rammig, A., Tomelleri, E., and Mahecha, M. D.: Extreme events in gross primary production: a characterization across continents, Biogeosciences, 11, 2909–2924, https://doi.org/10.5194/bg-11-2909-2014, 2014c. a
Zscheischler, J., Reichstein, M., Von Buttlar, J., Mu, M., Randerson, J. T., and Mahecha, M. D.: Carbon cycle extremes during the 21st century in CMIP5 models: Future evolution and attribution to climatic drivers, Geophys. Res. Lett., 41, 8853–8861, 2014d. a
Zscheischler, J., Fatichi, S., Wolf, S., Blanken, P. D., Bohrer, G., Clark, K., Desai, A. R., Hollinger, D., Keenan, T., Novick, K. A., and Seneviratne, S. I.: Short-term favorable weather conditions are an important control of interannual variability in carbon and water fluxes, J. Geophys. Res.-Biogeo., 121, 2186–2198, 2016. a
Zscheischler, J., Westra, S., Van Den Hurk, B. J., Seneviratne, S. I., Ward, P. J., Pitman, A., AghaKouchak, A., Bresch, D. N., Leonard, M., Wahl, T., and Zhang, X.: Future climate risk from compound events, Nat. Clim. Change, 8, 469–477, 2018. a
Zscheischler, J., Martius, O., Westra, S., Bevacqua, E., R., C., Horton, R. M., van den Hurk, B., AghaKouchak, A., Jézéquel, A., Mahecha, M. D., Maraun, D., Ramos, A. M., Ridder, N., Thiery, W., and Vignotto, E.: A typology of compound weather and climate events, Nature Reviews Earth and Environment, 1, 333–347, https://doi.org/10.1038/s43017-020-0060-z, 2020. a