the Creative Commons Attribution 4.0 License.
the Creative Commons Attribution 4.0 License.
 | 11 Apr 2022
Suspended particulate matter drives the spatial segregation of nitrogen turnover along the hyper-turbid Ems estuary
Tina Sanders
Justus E. E. van Beusekom
Yoana G. Voynova
Andreas Schöl
Kirstin Dähnke
Estuaries are nutrient filters and change riverine nutrient loads before they reach coastal oceans. Their morphology have been extensively changed by anthropogenic activities like draining, deepening and dredging to meet economic and social demand, causing significant regime changes like tidal amplifications and in some cases to hyper-turbid conditions. Furthermore, increased nutrient loads, especially nitrogen, mainly by agriculture cause coastal eutrophication. Estuaries can either act as a sink or as a source of nitrate, depending on environmental and geomorphological conditions. These factors vary along an estuary, and change nitrogen turnover in the system. Here, we investigate the factors controlling nitrogen turnover in the hyper-turbid Ems estuary (Northern Germany), which has been strongly impacted by human activities. During two research cruises in August 2014 and June 2020, we measured water column properties, dissolved inorganic nitrogen, dual stable isotopes of nitrate and dissolved nitrous oxide concentration along the estuary. We found that three distinct biogeochemical zones exist along the estuary. A strong fractionation (∼26 ‰) of nitrate stable isotopes points towards nitrate removal via water column denitrification in the hyper-turbid tidal river, driven by anoxic conditions in deeper water layers. In the middle reaches of the estuary nitrification gains importance, turning this section into a net nitrate source. The outer reaches are dominated by mixing, with nitrate uptake in 2020.
We find that the overarching control on biogeochemical nitrogen cycling, zonation and nitrous oxide production in the Ems estuary is exerted by suspended particulate matter concentrations and the linked oxygen deficits.
- Article
(7637 KB) - Full-text XML
-
Supplement
(1373 KB) - BibTeX
- EndNote


Estuaries can significantly alter riverine nutrient loads before they reach adjacent coastal oceans (Bouwman et al., 2013; Crossland et al., 2005). The morphology of estuaries has been extensively altered by humans and anthropogenic activities to meet economic and social demands. Land draining, damming, diking, channel deepening and dredging lead to significant regime changes including tidal amplification, hyper-turbid conditions and loss of habitats (e.g., Kennish, 2005; Winterwerp et al., 2013; De Jonge et al., 2014). High nutrient loads from agriculture, waste water and urban runoff have induced eutrophication (Galloway et al., 2003; Howarth, 2008; Van Beusekom et al., 2019), one of the greatest threats to coastal ecosystems worldwide (e.g., Howarth and Marino, 2006; Voss et al., 2011).
Depending on the predominant microbial processes, environmental conditions and geomorphological characteristics, estuaries can either act as a sink or as an additional source of nitrate (Dähnke et al., 2008; Middelburg and Nieuwenhuize, 2001). In particular, the balance between remineralization, nitrification and denitrification determines the net role of a specific estuary. Previous studies found that biogeochemical changes of dissolved oxygen saturation, residence time or light penetration affect this balance of nutrient uptake and removal (Thornton et al., 2007; Diaz and Rosenberg, 2008; Voss et al., 2011; Carstensen et al., 2014).
To disentangle the role of nitrate production and removal processes, stable isotopes are a frequently used tool, because nitrogen turnover processes discriminate heavier isotopes, leading to an enrichment in the pool of remaining substrate. The magnitude of enrichment, the so-called isotope effect, is process specific (e.g., Granger et al., 2004; Deutsch et al., 2006; Sigman et al., 2009).
Nitrification and denitrification also produce nitrous oxide (N2O) (Knowles, 1982; Tiedje, 1988; Wrage et al., 2001; Francis et al., 2007), a potent greenhouse gas that contributes to global warming (IPCC, 2007). Estuaries are potential sources of nitrous oxide (Bange, 2006) and, together with coastal wetlands, contribute approximately 0.17 to 0.95 Tg N2O-N yr−1 to the global nitrous oxide budget of 16.9 Tg N2O-N yr−1 (Murray et al., 2015; Tian et al., 2020). Numerous factors control estuarine nitrous oxide emissions. Oxygen depletion, nutrient levels and possibly organic matter composition trigger nitrous oxide production. Therefore, nitrous oxide emissions are linked to eutrophication (e.g., de Wilde and de Bie, 2000; Galloway et al., 2003; Murray et al., 2015; Quick et al., 2019). The role of nitrous oxide production can vary along an estuary, depending on the environmental and geomorphological properties.
Although the individual nitrogen turnover processes are well understood, the interplay of multiple stressors on the nitrogen cycle needs further investigation (e.g., Billen et al., 2011; Giblin et al., 2013; Sanders and Laanbroek, 2018). Therefore, we investigate how biogeochemical water column properties can change the nitrogen turnover, emerging eutrophication and nitrous oxide production along an estuary.
We performed two summer research cruises along the Ems estuary, a heavily managed estuary in Germany that undergoes anthropogenic pressures from fertilizer input, dredging and channel deepening (De Jonge, 1983; Talke and de Swart, 2006; Johannsen et al., 2008). This has led to a significant increase of suspended particulate matter concentration in the inner estuary since the 1950s (De Jonge et al., 2014). We studied water column nutrient and stable isotope composition, as well as suspended particulate matter concentration, in the Ems estuary to investigate spatial dynamics in nitrogen removal, nitrogen turnover processes and their relation to nitrous oxide production. We have (1) evaluated the biogeochemical zonation of nitrogen turnover along the estuary, (2) identified the dominating nitrogen turnover pathways in individual zones and (3) discussed the controlling factors of nitrogen cycling and emerging nitrous oxide production. Ultimately, with this study, we provide a better insight into the effects of biogeochemical water column properties and biogeochemistry on estuarine nutrient turnover.
2.1 Study site
The Ems estuary is situated on the Dutch–German border (Fig.1). The estuary is approximately 100 km long and stretches from the weir at Herbrum to the island Borkum. The Ems discharges into the Wadden Sea, a part of the southern North Sea (Van Beusekom and de Jonge, 1994). The catchment of the Ems is 17 934 km2 (Krebs and Weilbeer, 2008). Agricultural land use is dominant in the catchment (80 %), and urban land use makes up 8 % of the catchment (FGG Ems, 2015a), with a population density of ∼200 km−2 (FGG Ems, 2015b). The Ems is also an important waterway with ports in Delfzijl and Emden, and is used for transport of large vessels from the shipyard in Papenburg to the North Sea (Talke and de Swart, 2006).
The Ems is characterized by steep gradients in salinity and tides (Compton et al., 2017). It has an average discharge of 80.8 m3 s−1, with low fresh water discharge in summer and highest discharge between January and April. The Ems is a hyper-turbid estuary with high suspended sediment concentrations (De Jonge et al., 2014; Van Maren et al., 2015b), reaching values of 30–40 g L−1 and more in fluid mud layers (Winterwerp et al., 2013). Channel deepening has led to tidal amplification and an increased upstream sediment transport in the tidal Ems (De Jonge et al., 2014). The increase of suspended matter has lowered light penetration, and has led to decreasing oxygen concentration (Bos et al., 2012). Bos et al. (2012) classified the Ems estuary as a degraded ecological system with high nutrient loads.
Based on geomorphological characteristics, the Ems can be divided into four sections: the tidal river (kilometer 14–35), Dollard reach (kilometer 35–43), middle reaches (kilometer 43–75) and outer reaches (downstream from kilometer 75) (Fig. 1).

Figure 1Map of the Ems estuary displaying the sampling stations during two summer periods. Red triangles mark cruise stations in 2014, green circles mark cruise stations in 2020 and crosses mark stations with oxygen measurements. The gray numbers show the stream kilometers calculated according to German federal waterways (https://www.gdws.wsv.bund.de/DE/startseite/startseite_node.html, last access: 6 April 2022). Background map: © OpenStreetMap contributors 2021. Distributed under the Open Data Commons Open Database License (ODbL) v1.0.
2.2 Sampling
Water samples were taken during two research cruises with the research vessel Ludwig Prandtl in August 2014 and June 2020. Nutrient concentration and suspended particulate matter concentration from the cruise in 2014 have been published in Sanders and Laanbroek (2018). An onboard membrane pump provided the on-line in-situ FerryBox system with water from 2 m below the surface. The FerryBox system continuously measures dissolved oxygen, water temperature, pH, salinity, fluorescence and turbidity (Petersen et al., 2011). In 2014, the dissolved oxygen measurements from the FerryBox were about 32 µmol L−1 lower than the Winkler titrations of two discrete samples collected in July 2014. This offset was used to correct the FerryBox optode measurements. Salinity measurements were checked using Optimare Precision Salinometer (Bremerhaven, Germany), and the error of the FerryBox measurements was within 0.01 salinity units.
Discrete water samples were taken from a bypass of the FerryBox system. The samples for nutrient and isotope analysis were filtered immediately through combusted, pre-weighted GF/F Filters (4 h, 450 ∘C), and stored frozen in acid-washed (10 % HCl, overnight) PE bottles at −20 ∘C until analyses. The filters were stored at −20 ∘C for later analysis of suspended particulate matter (SPM) (Röttgers et al., 2014), δ15N-SPM and ratios. ratios were measured with an Elemental Analyzer (Eurovector EA 3000) calibrated against a certified acetanilide standard (IVA Analysentechnik, Germany). The standard deviation was 0.05 % and 0.005 % for carbon and nitrogen respectively. During the 2020 cruise, nitrous oxide gas phase mole fractions were continuously measured in unfiltered water.
2.3 Dissolved oxygen measurements
During the cruises in 2014 and 2020, we measured dissolved oxygen concentration in surface water using the FerryBox system (see above). For a more detailed view on oxygen dynamics, we also used data provided by the German Federal Institute of Hydrology (Bundesanstalt für Gewässerkunde – BfG, unpublished) at the stations in Fig. 1. Vertical profiles of oxygen concentration were taken at four monitoring stations along the Ems estuary (Fig. 1) in August 2014 and June 2020 using an YSI 6660 probe. At these stations, oxygen and temperature were also continuously measured with optodes of miniDot™ (PME, Precision Measurement Engineering) loggers at 0.5 m above the bottom at Ems kilometers 11.8 and 24.5 in 2014 and additionally at 18.2 and 33.0 in 2020.
2.4 Nutrient measurements
Nutrient concentrations (nitrate, nitrite, ammonium, silicate and phosphate) were measured with a continuous flow auto analyzer (AA3, SEAL Analytics) using standard colorimetric and fluorometric techniques (Hansen and Koroleff, 2007). Measurement ranges were 0–400 µmol-N L−1 for combined nitrate and nitrite, 0–17.8 µmol-N L−1 for nitrite, 0.07–25 µmol-N L−1 for ammonium, 0–1000 µmol-Si L−1 for silicate and 0–16.1 µmol-P L−1 for phosphate.
2.5 Isotopic analysis
The stable isotope composition of nitrate (δ15N-NO3−, δ18O-NO3−) was measured using the denitrifier method (Sigman et al., 2001; Casciotti et al., 2002), which is based on the isotopic analysis of nitrous oxide. In brief, Pseudomonas aureofaciens (ATCC#13985) reduces nitrate and nitrite in the filtered water samples to nitrous oxide. Nitrous oxide was measured by a GasBench II coupled with an isotope ratio mass spectrometer (Delta Plus XP, Thermo Fisher Scientific). Two international standards (USGS34, δ15N-NO3− −1.8 ‰, δ18O-NO3− −27.9 ‰; IAEA, δ15N-NO3− +4.7 ‰, δ18O-NO3− +25.6 ‰) and one internal standard (δ15N-NO3− +7.6 ‰, δ18O-NO3− +24.4 ‰) were used to calibrate the samples. The standard deviation for standards and samples was <0.2 ‰ (n=4) and <0.5 ‰ (n=4) for δ15N-NO3− and δ18O-NO3− respectively. Nitrite concentration of the samples was usually <5 %. When nitrite exceeded 5 %, it was removed prior to analysis using sulfamic acid (Granger and Sigman, 2009).
An elemental analyzer (Carlo Erba NA 2500) coupled with an isotope ratio mass spectrometer (Finnigan MAT 252) was used to measure δ15N-SPM values. IAEA N1 ( ‰), IAEA N2 ( ‰) and a certified sediment standard (IVA Analysetechnik, Germany) were used as reference materials.
2.6 Equilibrator based nitrous oxide measurements and calculations
An nitrous oxide analyzer (Model 914-0022, Los Gatos Res. Inc.) coupled with a seawater/gas equilibrator measured the dry mole fraction of nitrous oxide and water vapor in the water column using off-axis integrated cavity output spectroscopy. The set-up and instrument precision is described in detail in Brase et al. (2017). The equilibration time of nitrous oxide of approximately 7 min was taken into account for data processing.
For validation of the measurements, we measured two standard gas mixtures of nitrous oxide in synthetic air regularly (500.5 ppb ±5 % and 321.2 ppb ±3 %). No drift was detected. For further data processing, we calculated 1 min averages of nitrous oxide detected dry mole fraction (ppm). We calculated the dissolved nitrous oxide concentration in water (N2Ocw) using the Bunsen solubility function of Weiss and Price (1980) taking temperature differences between sample inlet and equilibrator into account (Rhee et al., 2009). Nitrous oxide saturation (s) was calculated using Eq. (1), based on nitrous oxide concentration in water (N2Ocw) and atmospheric nitrous oxide (N2Oair).
Atmospheric nitrous oxide was measured regularly during our cruise and was on average 0.33 ppm during our cruise in 2020. The gas transfer coefficient (k) was calculated based on Borges et al. (2004), where u10 is wind speed 10 m above surface, and Sc is the Schmidt number (Eq. 2). Sea-to-air flux densities (f) were calculated using Eq. (3).
2.7 Nitrate mixing calculations
Nitrate concentration from conservative mixing (CMix) between two endmembers was calculated for each sample using the classical mixing model of Liss (1976).
Where CR and CM stand for the concentration of the riverine and marine end-members, respectively, and f denotes freshwater fractionation in each sample calculated as follows:
SMix, SM, SR denote the salinity of the sample, marine and riverine endmembers, respectively. We used the concentration-weighted mean of the isotopic values of the marine (δM) and riverine (δR) end-members to calculate the theoretical isotope value of samples following conservative mixing (δMix) (Fry, 2002):
2.8 Isotope effect
During turnover processes, nitrogen isotopes ratios change along a specific isotope effect that helps to identify individual process pathways (e.g., Kendall et al., 2007). Isotope effects were calculated with an open-system approach where the reactant nitrate is continuously supplied and partially consumed, and steady state is assumed. This leads to a linear relationship between isotope values of nitrogen and fraction f, where . The isotope effect ε corresponds to the slope of the regression line (Sigman et al., 2009),
where denote δ15N values of the substrate and product at the time of sampling and the initial value. The remaining fraction of substrate at the time of sampling is described by f. In the present study, the mixing line determines initial concentrations and isotope values.
2.9 Statistical analysis
All statistical analyses were done using R packages. Pearson correlation matrices were calculated with ggcorr from the R-package GGally v.2.0.0 (GGally, 2021). From the R-package stats v4.0.2 (The R Stats Package, Version 4.0.2, 2021), we used the function prcomp for the principal component analysis (PCA). Salinity was not taken into account for the multivariate analysis.
3.1 Hydrographic properties and dissolved nutrients in surface water
To evaluate controls on nutrient cycling, we first look at the hydrochemical properties that were measured in 2014 and 2020 in surface waters, alongside with nutrient concentrations and nitrogen stable isotope composition (Fig. 2).
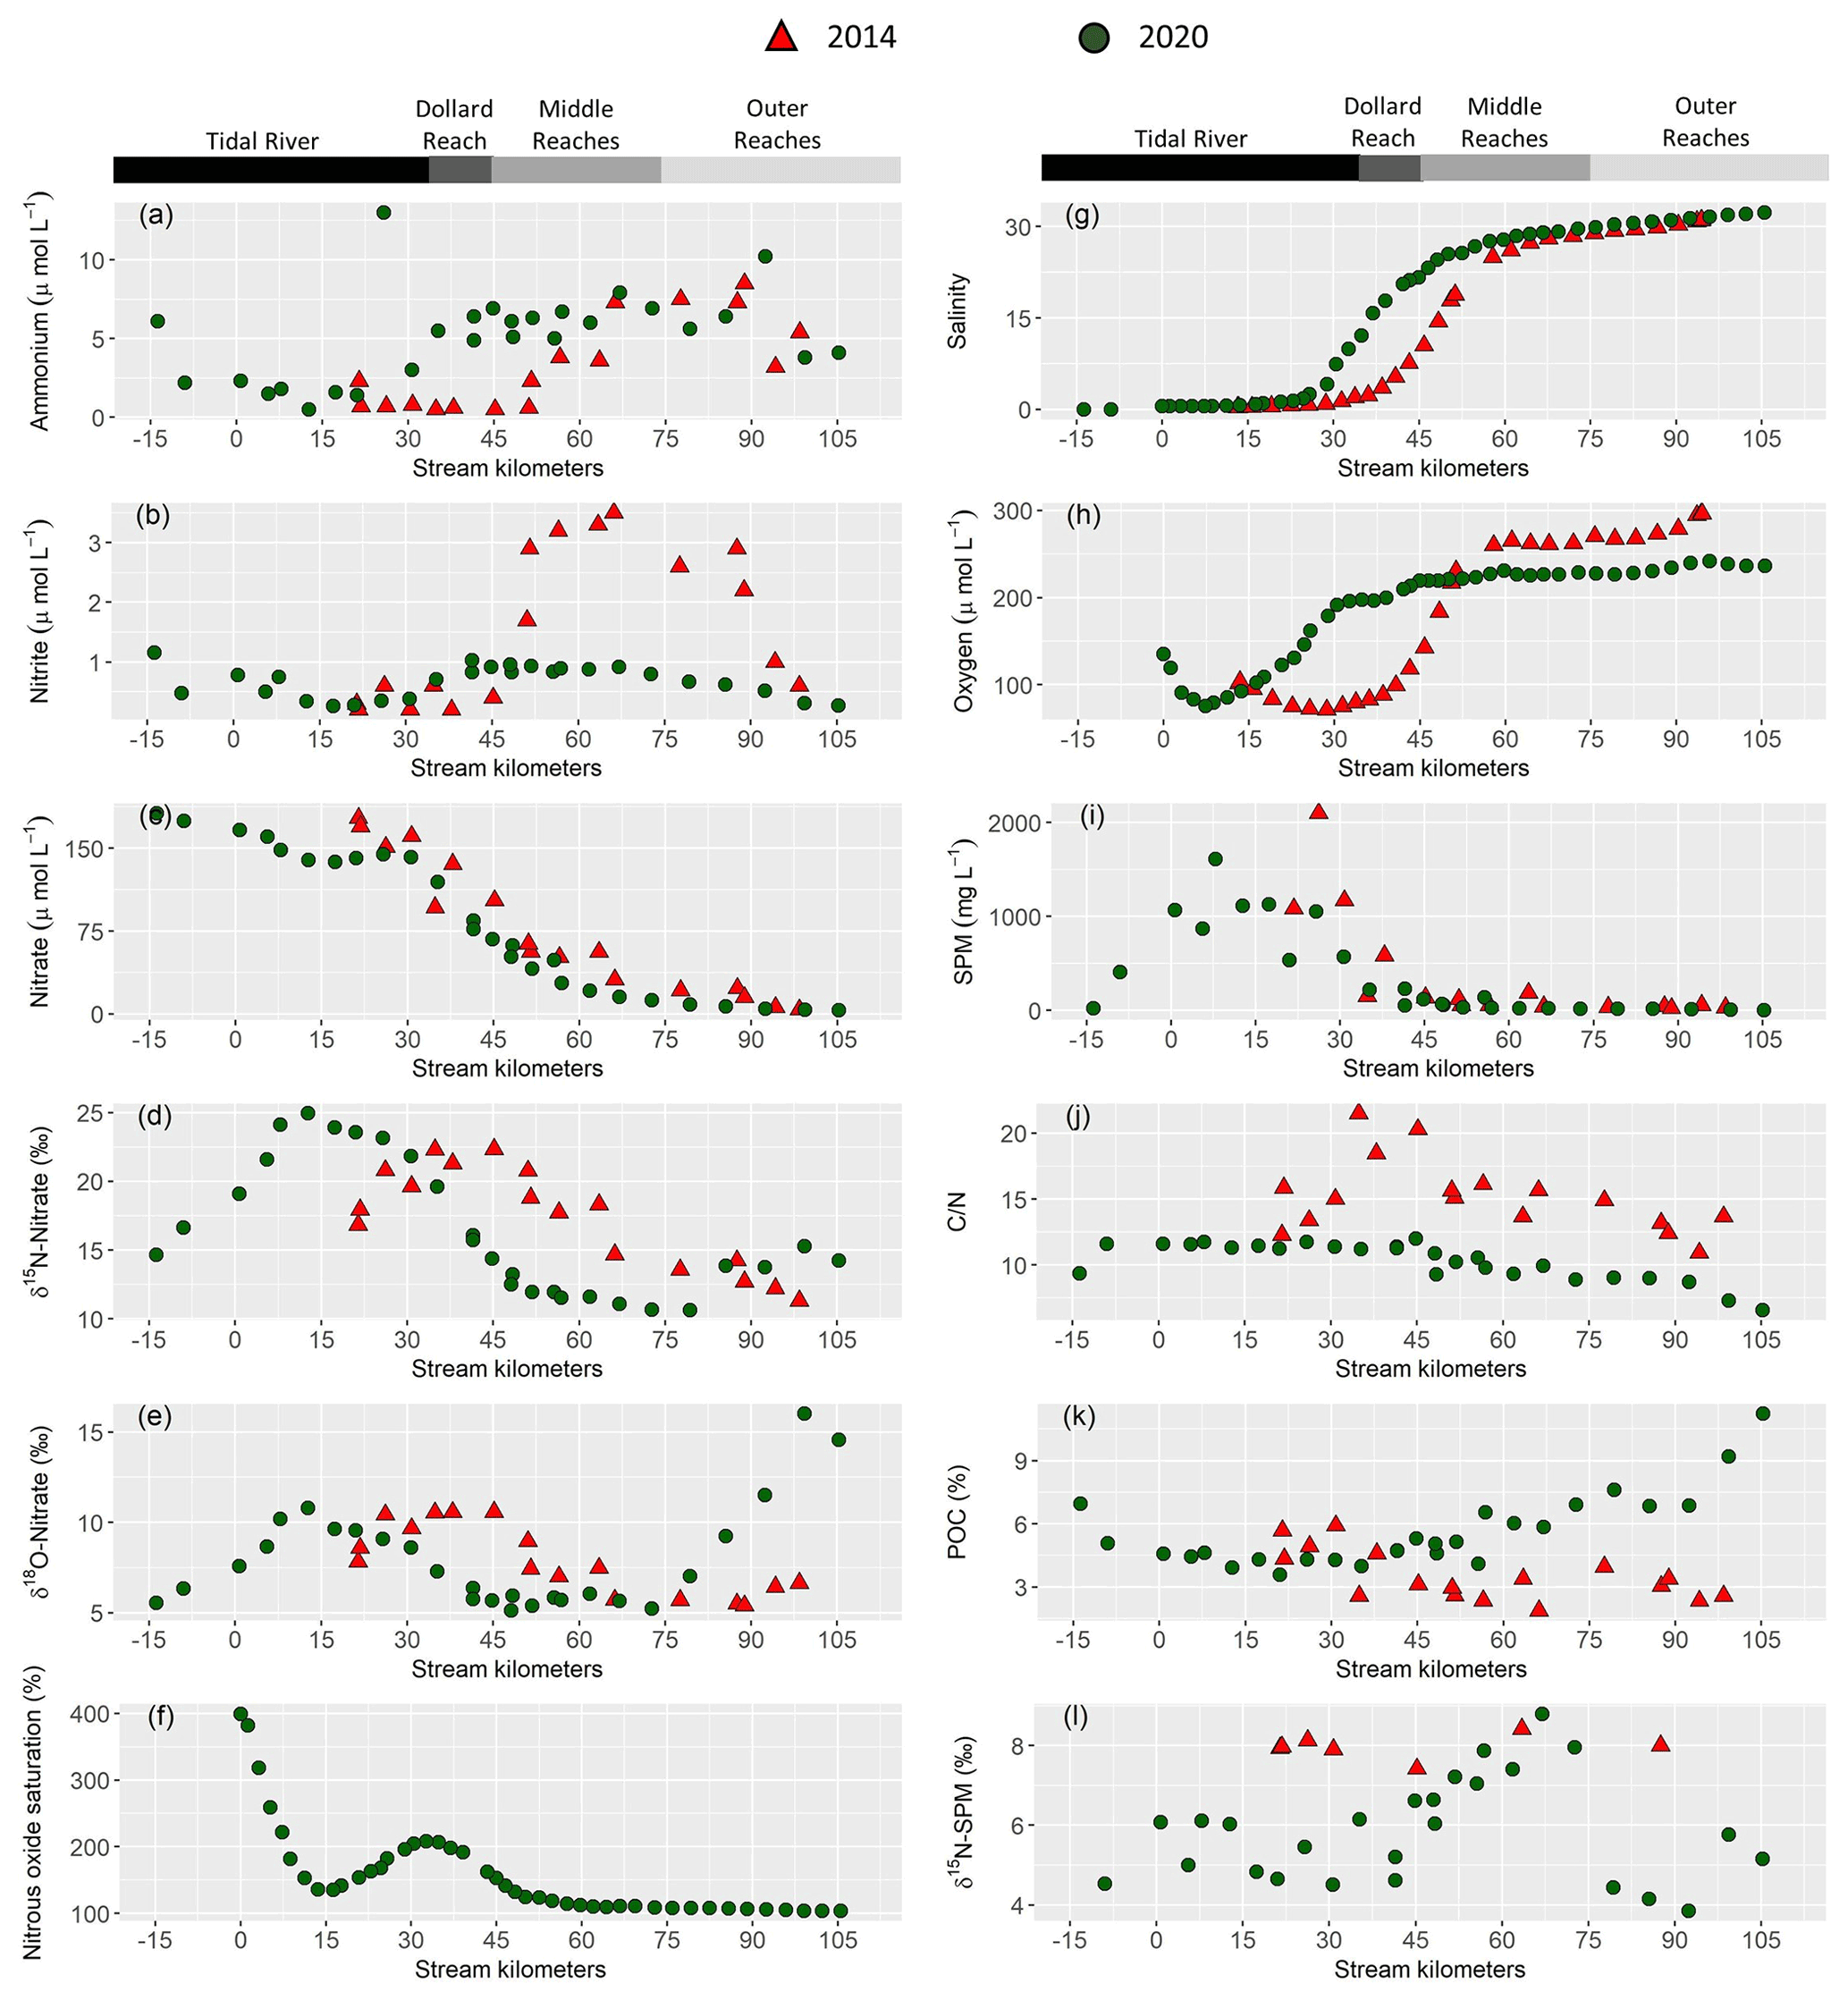
Figure 2Near surface water column properties along the Ems estuary: (a) ammonium concentration in (µmol L−1), (b) nitrite concentration in (µmol L−1), (c) nitrate concentration in (µmol L−1), (d) δ15N-Nitrate in (‰), (e) δ18O-Nitrate in (‰), (f) nitrous oxide saturation in (%), (g) salinity, (h) dissolved oxygen concentration in (µmol L−1), (i) suspended particulate matter concentration (SPM) in (mg L−1), (j) ratios, (k) particulate organic carbon fraction (POC) in (%), (l) δ15N-suspended particulate matter in (‰). For clarity, only 10 min means are plotted for the continuous measurements of nitrous oxide (f), oxygen (h) and salinity (g). Red triangles mark stations sampled in 2014 and green circles represent stations in 2020.
Discharge ranged from 59.7 to 67.5 m3 s−1 in 2014 and was ∼30 m3 s−1 in 2020. The long-term average discharge is 30–40 m3 s−1 in June and August (Andreas Engels, NLWKN Bst. Aurich, personal communication, 2021). The mean water temperature was 23 ∘C in 2014 and 17 ∘C in 2020. Salinity ranged from ∼0.5 to ∼32 in both years. In 2014, the sampling section started with the onset of the salinity gradient (kilometer 20), whereas the most upstream sample in 2020 was taken near Herbrum (kilometer −14) (Fig. 2g). This sample and the sample at stream kilometer −9 were taken with a bucket from shore. The research vessel transect started in Papenburg (kilometer 0).
Nitrate was the major form of dissolved inorganic nitrogen (DIN) and decreased with increasing salinity. Nitrate concentration decreased from 177 to 3.9 µmol L−1 in 2014 and from 166 to 4.9 µmol L−1 in 2020 (Fig. 2c).
Ammonium (Fig. 2a) and nitrite (Fig. 2b) concentration were generally low in the tidal river, with average concentrations of ∼3 and 1 µmol L−1, respectively. One sample (June 2020, stream kilometer 25) had an unusually high ammonium concentration of 13 µmol L−1. In the Dollard reach, ammonium and nitrite concentration increased with salinity in 2020, whereas this increase occurred further downstream, i.e., in the middle reaches, in 2014. The highest ammonium concentration was similar in 2014 and 2020, with 8.5 µmol L−1 and 10.2 µmol L−1 respectively. Whereas in 2020 nitrite concentration reached 1 µmol L−1, with little variability along the transect, in 2014, it reached a maximum of 3.5 µmol L−1, with a distinct peak in the middle and outer reaches.
Incoming nitrate isotope values were elevated in the most upstream regions of the tidal river with values of 15 ‰ for δ15N-NO3− and 6 ‰ for δ18O-NO3− in 2020, and 17 ‰ and 8 ‰ for δ15N-NO3− and δ18O-NO3− in 2014. Isotope values increased further to a local maximum of 25 ‰ and 11 ‰ for δ15N-NO3− and δ18O-NO3− around kilometer 13 in 2020. In 2014, the respective local maxima (22 ‰ and 10 ‰ for δ15N-NO3− and δ18O-NO3−) were shifted to kilometer 35. Further downstream, isotope values decreased, except for a slight increase in the outermost marine samples (Fig. 2d and e).
In 2020, we also measured dissolved nitrous oxide concentration. Measured values ranged between equilibrium concentrations (∼9 nmol L−1) and supersaturation of up to 40 nmol L−1 at kilometer 0, which corresponded to a saturation of 400 %. Nitrous oxide then decreased downstream to ∼14 nmol L−1 (140 %) at kilometer 30 and then increased to a local maximum of 21 µmol L−1 (210 %) in the tidal river/Dollard reach transition at stream kilometer 35. Further downstream, nitrous oxide decreased to near equilibrium concentration towards the North Sea (Fig. 2f).
3.2 Suspended particulate matter properties
Near surface SPM concentration was highest in the tidal river, reaching values of 2100 mg L−1 in 2014 and 1600 mg L−1 in 2020. SPM concentration decreased at the beginning of the Dollard reach region (Fig. 2i). The δ15N-SPM values showed considerable scatter (Fig. 2l): around 5 ‰ in the tidal river/Dollard reach, and 9 ‰ in the middle reaches. In the outer reaches, δ15N-SPM dropped again to ∼5 ‰. In 2014, δ15N-SPM were elevated (8 ‰), but the database during this cruise is relatively sparse (Fig. 2l).
In 2020, ratios of SPM (Fig. 2j) were relatively stable in the tidal river (∼11) and Dollard reach, with a slightly lower value of 9 in the most upstream sample. In the middle reaches, ratios decreased, reaching the lowest value of 6.5 in the most offshore sample. In 2014, values were 11–15 in the tidal river, increasing to values as high as 20 in the Dollard reach and decreasing to ∼11 approaching the North Sea (Fig. 2j).
Particular organic carbon fraction (% POC) was high in the most upstream samples in 2020 (Fig. 2k), decreased to 4.5 % and remained relatively stable in the tidal river and Dollard before it increased in the middle and outer reaches up to 11 %. In 2014, the values in tidal river and Dollard were comparable, but we found a decreasing trend downstream, with a low POC fraction of ∼3 in the outermost sample (Fig. 2k).
3.3 Dissolved oxygen concentration in the Ems estuary
In surface water, oxygen concentrations in the tidal river section were low during both cruises, and increased downstream with rising salinity. The lowest values were measured in the tidal river, where the minimum oxygen concentration was ∼72 µmol L−1 in 2014 and 76 µmol L−1 in 2020 (Fig. 2h), corresponding to a saturation of 27 % and 26 %, respectively.
Oxygen profiles showed strong vertical gradients with decreasing concentration in deeper water layers. The extent of hypoxia in the water column depended on the tidal cycle and location, with lowest bottom water oxygen concentration measured at the most upstream station at stream kilometer 7.2 during low tide in 2020. Detailed profiles can be found in Fig. S1 in the Supplement.
During the continuous near-bottom oxygen measurements, we found anoxic conditions during both of our cruises that lasted for several hours over a tidal cycle (Fig. 3). Oxygen concentration was generally low at low tide, and elevated at high tide. In 2014, anoxia developed at stream kilometer 11.8 and 18.5, and highest oxygen concentration in bottom water was only 60 µmol L−1 (kilometer 24.5) and 70 µmol L−1 (kilometer 11.8). At the beginning of August, oxygen concentration at kilometer 11.8 frequently exceeded measured values at kilometer 24.5.
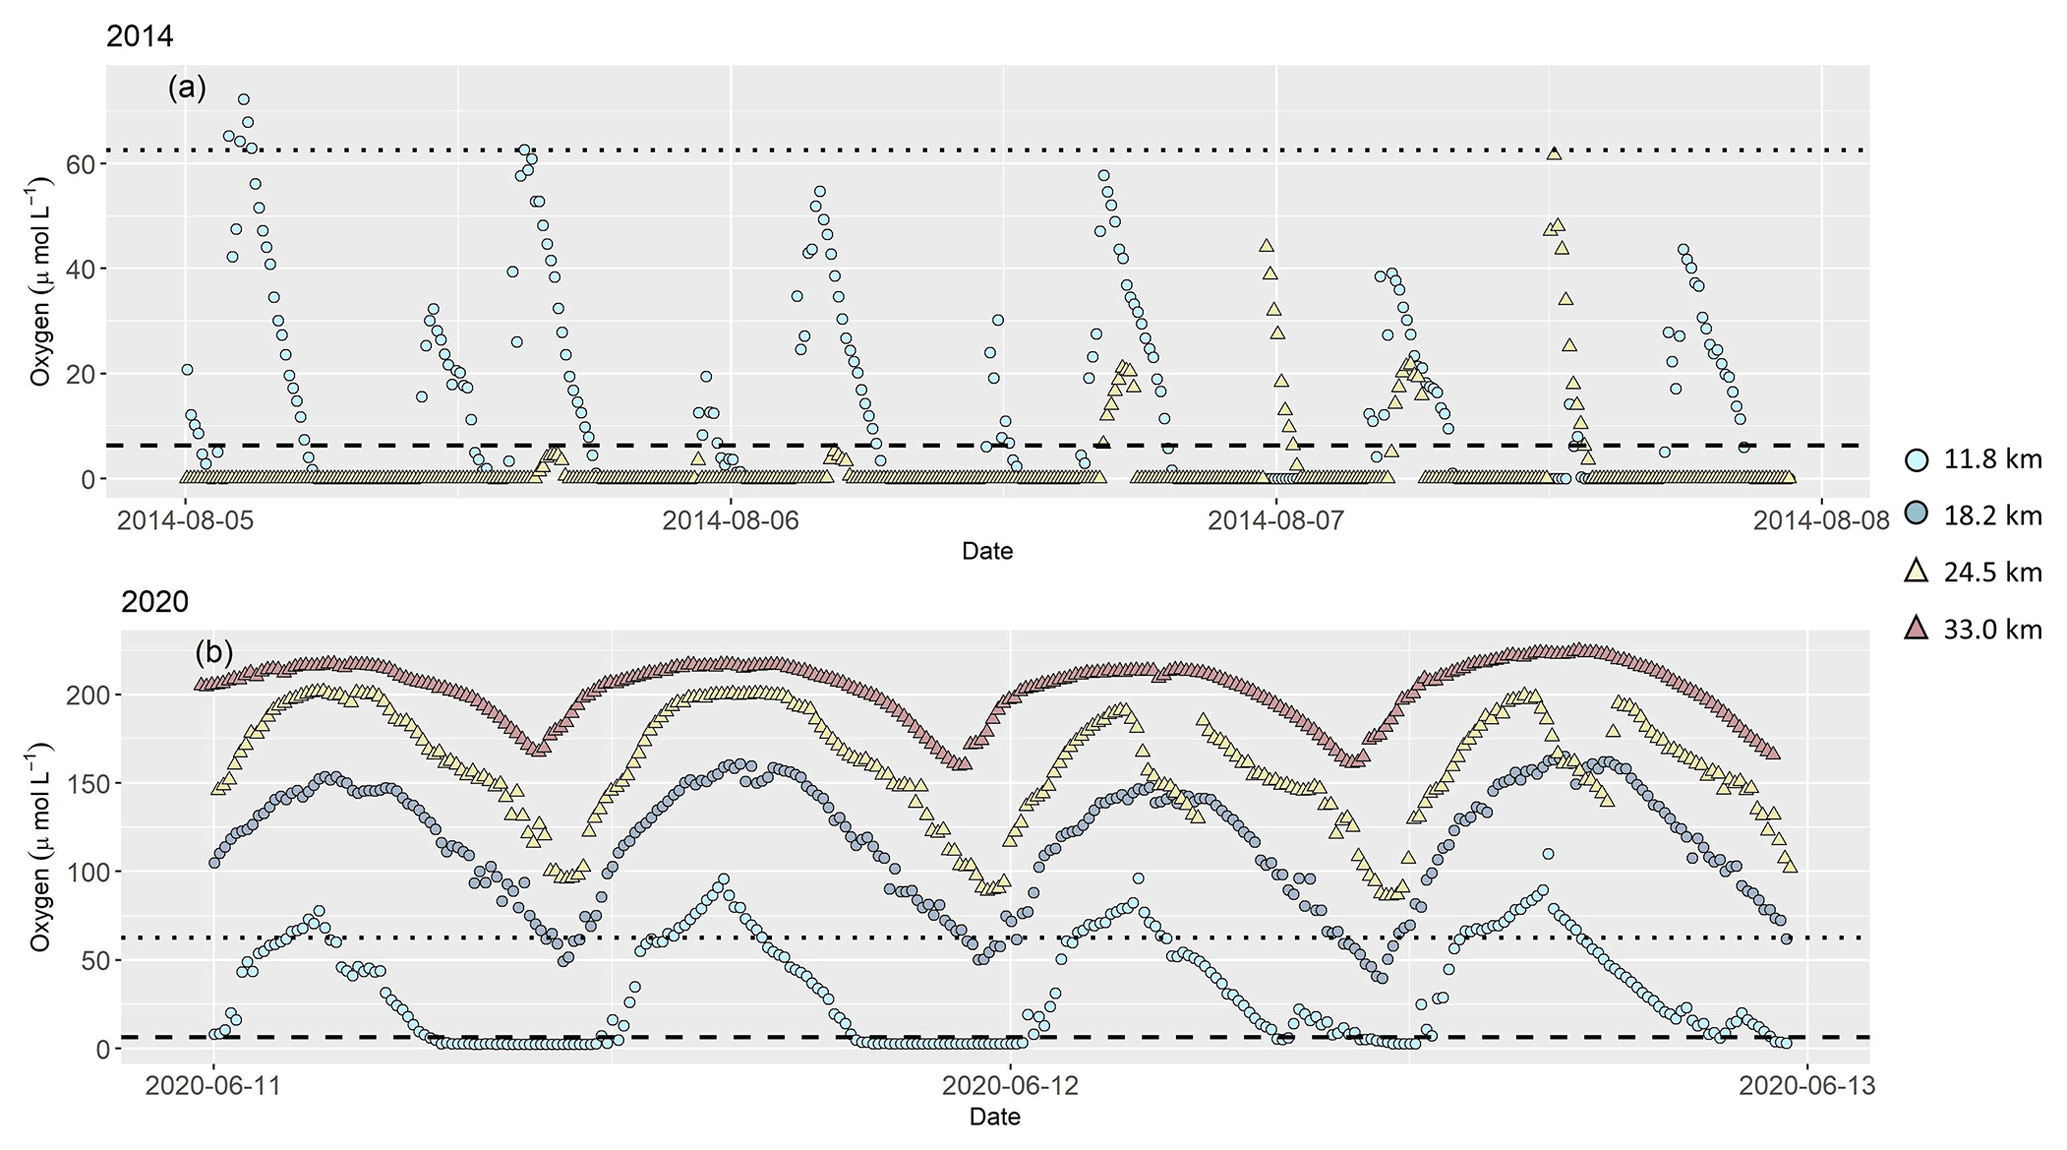
Figure 3Dissolved oxygen concentration in (µmol L−1) 0.5 m above riverbed during our research cruises in (a) 2014 and (b) 2020, measured continuously at several stations along the tidal river. In 2014, oxygen concentration was measured at two stations at stream kilometer 11.8 and 24.5. In 2020, additional measurements were done at stream kilometer 18.2 and 33.0. Symbols and colors mark stream kilometer of each sampling station. Light blue circles are results from a station at stream kilometer 11.8, blue circles at stream kilometer 18.2, yellow triangles at stream kilometer 24.5 and red triangles at stream kilometer 33.0. The dotted line indicates hypoxic conditions at oxygen concentration of 62.5 µmol L−1 (Diaz et al., 2019). The dashed line marks oxygen concentration (6.25 µmol L−1) below which denitrification occurs (Seitzinger, 1988). Note different y axes in plots (a) and (b).
In 2020, oxygen concentration in bottom water was higher, and anoxia was only found at stream kilometer 11.8. At all other stations, oxygen concentration remained above 40 µmol L−1 even at low tide.
3.4 Nitrate mixing
We plotted nitrate versus salinity concentration and nitrate dual isotopes to evaluate mixing properties (Fry, 2002; Fig. 4). We used the most upstream and downstream samples as end-members for each year. In both years, nitrate concentrations plot below the mixing line in the most upstream region with low salinity in both years, corresponding to an enrichment of δ15N-NO3− and δ18O-NO3− in the same region. Above salinity of 20, a slight nitrate source is present, while isotope values decrease. In 2020, the outermost samples have a slightly enriched isotope signature and nitrate concentration below the mixing line.

Figure 4Nitrate concentrations and isotope values of nitrate plotted versus salinity for (a)–(c) in 2014 and (d)–(f) in 2020. Lines indicate calculated conservative mixing.
3.5 Principal component analysis
Together, PC1 and PC2 explained about 80 % of total variance in both years. In 2014, PC1 contributed to 66 % and PC2 to 15 %. PC1 and PC2 explained 61 % and 18 % of total variance in 2020, respectively.
Oxygen, pH, ratios, SPM and nitrate concentration contributed largely to PC1 in 2014, just like silicate concentration in 2020 (this parameter was not measured in 2014). Temperature, phosphate and nitrite concentration contributed largely to PC2 in both years, so did δ15N-SPM in 2020. Due to few data, δ15N-SPM could not be included into the principle component analysis of 2014. In 2014, PC2 was also heavily influenced by SPM. The PCA overall suggests that the estuary can be divided into three biogeochemically distinct zones (Fig. 5).

Figure 5PCA results for (a) 2014 and (b) 2020. Colors and frames stand for the assignment of the samples into the respective zones. Dark blue circles and a straight frame shows samples in zone 1, red circles and a dashed frame samples from zone 2. Green circles and a dotted frame stand for samples in zone 3.
4.1 Biogeochemical zones in the Ems Estuary
The first goal of this study was to identify distinct biogeochemical zones of nitrogen turnover within the Ems estuary to see if changing environmental and geomorphological properties affect the occurring processes. The assessment of estuarine mixing curves showed three zones of different nitrogen turnover along the salinity gradient (Fig. 4).
In both years, 2014 and 2020, nitrate concentration deviated clearly and in a similar manner from the conservative mixing line. In the upper riverine part of the estuary, nitrate concentration fell below the conservative mixing line, indicating nitrate removal (zone 1), followed by a zone with nitrate concentration slightly above the mixing line (zone 2) that acted as a net nitrate source. In the third zone, nitrate mostly followed the conservative mixing line, with nitrate removal and isotopic enrichment near the marine endmember in 2020, indicating nitrate uptake by phytoplankton. In 2014, the identification of the “outer zone” (zone 3) is more complicated, as the outermost samples follow the conservative mixing line in Fig. 4. However, these outermost samples are distinct from the prevailing processes in zone 2, because they do not show signs of nitrate production, a characteristic of zone 2.
The PCA analysis showed that nitrogen turnover was comparable in both years. However, there are distinct differences between the cruises. Seasonal and interannual variation may cause differences in dissolved inorganic nitrogen distribution and nitrate stable isotope composition. The PCA independently confirms comparable zones of nitrogen turnover for both years. The principle component loadings were also similar for both cruises. The PCA supports the suggested nitrate zonation taking the other biogeochemical properties into account (Fig. 5). The three biogeochemical zones were mainly divided according to PC1. Contributing parameters were oxygen, nitrate, , SPM and silicate, which suggests a tight coupling of nitrate turnover to suspended particulate matter. PC2 helped to differentiate zone 2. Contributing parameters (temperature, nitrite, and phosphate) suggest a link to nutrient uptake processes.
Based on the location of the biogeochemical zones along the Ems (Fig. 1), we see a connection with the geomorphological characteristics of the Ems estuary. In both years, zone 1 was located in the hyper-turbid tidal river and the beginning of zone 2 is characterized by increasing ammonium concentration. In 2014, zone 1 included the Dollard reach. In 2020, the Dollard reach was grouped into zone 2, together with the middle reaches. The shift of zone 2 between the cruises may be driven by discharge conditions. In 2014, discharge was significantly higher than in 2020 (about twice the long-term average discharge of 30 to 40 m3 s−1 for June and August; Andreas Engels, NLWKN Bst. Aurich, personal communication, 2021). This may have led to a shift of zone 2 downstream, as was also indicated by the shift in the salinity gradient and SPM concentrations. De Jonge et al. (2014) showed that elevated discharge can relocate estuarine turbidity maxima downstream. Zone 3 was in the outer reaches in 2014 and 2020.
Overall, mixing properties as well as a PCA suggest that there are three distinct biogeochemical zones that act either as sinks (zones 1 and 3) or sources (zone 2) of nitrate along the Ems. These ones are mainly defined by discharge and suspended particulate matter (especially PC1).
4.2 Denitrification in the upper estuary
Zone 1, the most upstream region acted as a nitrate sink in both years, with nitrate concentrations below the conservative mixing line and enriched δ15N-NO3− and δ18O-NO3− values (Fig. 4d and 4e). Potential removal mechanisms are nitrate respiration or nitrate assimilation.
High SPM values in the hyper-turbid tidal river and Dollard reach (Fig. 2i) reduced light availability, limiting primary production (Bos et al., 2012). Therefore, nitrate assimilation by phytoplankton in the upper estuary can be ruled out as a relevant nitrate sink.
Denitrification is a potential nitrate sink that can lead to strong isotope enrichment. Denitrification was a dominant loss pathway in the 1980s in other temperate estuaries like the Elbe Estuary (Schröder et al., 1995), where sediment denitrification removed up to 40 % of the summer nitrate load. We found that δ15N-NO3− and δ18O-NO3 in the Ems estuary increased with decreasing nitrate concentration. δ15N-NO3− versus δ18O-NO3− plot on a slope of 0.5 in both years, which points towards denitrification (S2; Böttcher et al., 1990; Mengis et al., 1999; Granger and Wankel, 2016; Wong et al., 2020). A strong fractionation occurred (15ε∼24 ‰, R2=0.89 in 2014 and 26 ‰, R2=0.76 in 2020). While denitrification in sediments leads to little to no fractionation due to a diffusion limitation (Brandes and Devol, 1997; Lehmann et al., 2004; Sigman and Fripiat, 2018), water column denitrification has an isotope effect that fits our calculations (Kendall et al., 2007; Sigman and Fripiat, 2018), and can explain the observed patterns.
Water column denitrification occurs under anaerobic to low oxygen conditions in the water column (Tiedje, 1988). According to Seitzinger (1988), denitrification occurs at oxygen concentration below 6.25 µM. We measured low oxygen concentration in surface water during both years with lowest concentration of ∼70 µmol L−1 (Fig. 2h), which is well above the threshold for denitrification. However, vertical oxygen concentration profiles and continuous measurements in the estuary in near-bottom water showed that deeper water became anoxic in both years. Even though these anoxic conditions only developed for a few hours over a tidal cycle, we conclude that water column denitrification was the responsible nitrate sink mechanism in the Ems in 2014 and 2020.
Furthermore, denitrification can also occur on suspended particles. Liu et al. (2013) reported the occurrence of denitrification on suspended particles in oxic waters in a hyper-turbid river. Xia et al. (2016) observed a high oxygen influx around suspended particles and decreasing oxygen concentration. They suggest that oxygen was consumed by nitrification and/or microbial respiration close to the particle's surface and thereby provided redox conditions for coupled nitrification–denitrification to take place. Zhu et al. (2018) detected aggregates of nitrifiers and denitrifiers on SPM in the Hangzhou Bay in China. Similarly, Sanders and Laanbroek (2018) propose that coupled nitrification–denitrification processes occur in the upper Ems estuary, and suggested immediate nitrate consumption driven by suspended particles in the water column.
Overall, we find strong evidence for water column denitrification in zone 1, likely in the anoxic bottom waters. Moreover, coupled nitrification–denitrification can add to this nitrate sink in the hyper-turbid tidal river.
4.3 Increasing importance of nitrification in the middle reaches
The mixing lines along the estuary displayed a significant shift of nitrogen turnover from the “denitrification zone” (zone 1) to zone 2. Nitrate concentrations plotted above the mixing line, indicating a net nitrate source with lighter nitrate isotope values (Fig. 4).
Nitrate is produced via nitrification, which was no longer oxygen limited in zone 2 due to increasing concentrations compared to the tidal river. A positive correlation between nitrite and ammonium, as well as a negative correlation between nitrite and nitrate for both years indicate nitrate production via nitrification with nitrite as an intermediate product. This is in line with the findings of Sanders and Laanbroek (2018), who found nitrification in water column and sediments in 2014.
However, there is no clear indication of nitrification in the correlations of nitrate concentration and nitrate isotopes. Nitrate isotopes were positively correlated with nitrate concentrations, but such a parallel increase usually does not occur during nitrification. Nitrification produces isotopically depleted nitrate, but the sources of δ15N-NO3− and δ18O-NO3− are independent and increase the overall nitrate pool. At least in 2014, a plot of δ15N-NO3− versus δ18O-NO3− still plots on a slope of 0.5 in 2014, suggesting that denitrification may still be of importance in this zone. During denitrification, nitrate isotope values and concentrations are also negatively correlated, because denitrification consumes light nitrate and elevates the isotope values in the remaining pool.
The positive correlation in our study thus is intriguing. It seems likely that denitrification still occurs in parts of zone 2, either in the oxygen limited conditions in deeper water layers, in the sediments of the adjacent tidal flats (compare to Gao et al., 2010), or driven by still elevated SPM concentrations of 185 and 230 mg L−1 in 2014 and 2020 respectively. The net addition of nitrate, however, is a clear sign of nitrification.
Therefore, we aim to explore whether the parallel increase of nitrate concentration and isotope values can be explained by simultaneous nitrification and denitrification. To identify the influence of both processes, we used a mapping approach inspired by Lewicka-Szczebak et al. (2017). A detailed description of the open-system mapping approach and figures are shown in S3. Briefly, we try to disentangle the influence of nitrification and denitrification in zone 2 based on the open-system isotope effects, where the slope of the linear relationship between nitrate isotope values and remaining fraction of nitrate concentration corresponds to the isotope effect (Sigman et al., 2009). The initial values used for the mapping are derived from the nitrate mixing calculations based on Fry (2002).
For denitrification, we calculated an isotope effect of ‰ in the “denitrification zone” (zone 1). For nitrification, the expression of the isotope effect depends on the abundance of ammonium. As long as ammonium is limiting, we assume that any ammonium is converted to nitrite and nitrate, so that the apparent isotope effect is that of remineralization. In most parts of zone 2, no ammonium was accumulated. A simultaneous increase of δ15N-SPM, ammonium and nitrite concentration at stream km 50 in 2020 point towards remineralization (Fig. 2a, 2b and 2l). Based on δ15N-SPM, we calculated an isotope effect of ‰ (R2=0.26), which fits with previous assessments of the isotope effect of ammonification (Möbius, 2013). We applied this value for nitrification with prior remineralization. Further downstream, ammonium and nitrite concentrations increased, so we assume that remineralization no longer determines the overall isotope effect of nitrification. Instead, there was a combined influence of ammonium oxidation with an isotope effect to −41 ‰ (Mariotti et al., 1981; Casciotti et al., 2003; Santoro and Casciotti, 2011) and nitrite oxidation with ‰ to +20 ‰ (Casciotti, 2009; Buchwald and Casciotti, 2010; Jacob et al., 2017). As we measured elevated ammonium and nitrite concentrations, both processes influenced the fractionation caused by nitrification. Therefore, for total nitrification we assumed a combined isotope effect of ‰, that we used to describe nitrification in samples with accumulated ammonium and nitrite. This number is lower than previously measured for ammonium oxidation, and is based on nitrification rate from incubations performed previously in the Elbe estuary (Sanders, unpublished data; Sanders and Dähnke, 2014).
Based on these input variables, the mapping approach can indeed explain the development of isotope effects and nitrate concentration. In the most upstream samples, nitrate removal exceeded production: in 2014, denitrification removed 26 µmol L−1, and nitrification added 10 µmol L−1. In 2020, the mapping approach suggests an addition of 52 µmol L−1 and simultaneous denitrification of 62 µmol L−1. In the middle of zone 2, nitrification gained in relative importance with an approximated production of 10 µmol L−1 in 2014 and 20 µmol L−1 in 2020, in contrast to denitrification of approximately 3 and 10 µmol L−1, respectively. In the most downstream samples, mixing was dominant, and we detected neither nitrate production nor reduction.
Overall, nitrification and denitrification determined the evolution of nitrate isotopes and concentration in the estuary. Further downstream of zone 2, nitrification becomes increasingly important, and the relevance of denitrification ceases. Both processes lose in importance towards the North Sea, when mixing turns to be the most important process.
4.4 Mixing and nitrate uptake in the outer reaches
In the “outer zone” (zone 3) the mixing line shows divergent trends for our two cruises (Fig. 4). While conservative mixing dominates in 2014, 2020 shows nitrate uptake in the North Sea.
For 2020, a plot of δ15N-NO3− versus δ18O-NO3− falls along a slope of 1.5, which points towards simultaneous assimilation and nitrification (Wankel et al., 2006; Dähnke et al., 2010). The isotope effect 15ε of this drawdown is −3 ‰ , which also is a sign of assimilation, even though it is at the lower end of values reported for pure cultures (Granger et al., 2004). values close to Redfield ratio in 2020 (Fig. 2j) also pointed towards primary production in the outer reaches. The stronger signal of nitrate uptake in June 2020 compared to August 2014 is likely caused by a stronger influence of the spring phytoplankton bloom in the outer reaches (Colijn, 1983; Colijn et al., 1987; Brinkman et al., 2015) fueled by continuous nutrient supply from the estuary.
In the mixing plot (Fig. 4), the outermost isotope samples of our cruise in 2020 fall on the conservative mixing line. The good fit is caused by the calculation with a marine endmember that has an isotopically enriched signature in comparison to average global values (Sigman et al., 2000, 2009) and North Sea winter values of 5 ‰ (Dähnke et al., 2010). The increase of the isotope signature shows that fractionation takes place, likely due to assimilation.
In contrast to the biogeochemical active inner zones, mixing dominated nitrate distribution in the outer reaches of the estuary in 2014. In 2020 however, the outer reaches were a nitrate sink due to ongoing primary production in the coastal North Sea.
4.5 SPM as driving force of the spatial zonation
We identified three biogeochemical zones of nitrogen turnover along the estuary, which differ significantly in their coastal filter function. The tidal river was a nitrate sink with dominating water column denitrification. In the middle reaches, nitrification gained in importance, turning this section in a net nitrate source. In the “outer zone” (zone 3), mixing gained in importance but with a clear nutrient uptake in 2020. Other estuaries with high turbidity show denitrification zones as well (Ogilvie et al., 1997; Middelburg and Nieuwenhuize, 2001). This finding and our analysis of the PCA and dominant nitrogen turnover processes suggest that the overarching control on biogeochemical nitrogen cycling and zonation may be suspended particulate matter.
Channel deepening led to tidal amplification and an increased sediment transport in the estuary (Winterwerp et al., 2013; De Jonge et al., 2014; Van Maren et al., 2015b, a). Between 1954 and 2005, SPM concentration increased on average 2- to 3-fold, and even 10-fold in the tidal river. The turbidity maximum extended to a length of 30 km and moved upstream, into the freshwater tidal river (De Jonge et al., 2014).
High ratios (Fig. 2j), as well as a low and stable particular organic carbon (POC) fraction of the SPM in this region (∼ 4.5 %) in the tidal river and Dollard reach indicate low organic matter quality and a large contribution of mineral associated organic matter of the present organic matter (Fig. 2k). In 2014, ratios were extremely high, and uncharacteristic for estuarine environments. We attribute this to a potential influence of peat soils or peat debris in sediments (Broder et al., 2012; Loisel et al., 2012; Wang et al., 2015; Papenmeier et al., 2013), which may have been washed into the river due to high discharge. The extremely high ratios should nonetheless be treated with caution, as we cannot entirely rule out sampling artifacts.
Nonetheless, and regardless of organic matter origin, degradation of organic carbon leads to anoxic conditions in the tidal river. Even though the low quality of organic matter fuels only low degradation rates with POC fractions of ∼3 % (Fig. 2k), the extremely high POC concentration (>4000 µmol L−1) support the intense oxygen depletion and anoxic conditions in the tidal river. This indicates very refractory material. Talke et al. (2009) found oxygen depletion rates proportional to SPM concentrations in the Ems estuary. Moreover, high SPM concentrations depress primary production throughout the inner estuary due to light limitation and this leads to a dominance of heterotrophic processes (Bos et al., 2012).
With decreasing SPM concentration, oxygen concentration increases, and the relevance of denitrification ceases in comparison to nitrification. In the “coactive zone” (zone 2) at the transition between Dollard reach and middle reaches, ratios start to decrease, indicating the input of fresh organic matter entering the estuary from the North Sea (Van Beusekom and de Jonge, 1997, 1998), fueling nitrification in zone 2. Although, the quality of the organic matter improves, oxygen depletion decreases due to reduced SPM concentrations leading to lower POC concentrations in comparison to the tidal river. Towards the North Sea, low SPM concentration in the outer reaches enables deeper light penetration supporting local primary production (Liu et al., 2018; Colijn et al., 1987), as is also supported by a slight chlorophyll maximum in the outer reaches (Fig. S4). Given the ongoing import of organic matter from the North Sea to the Wadden Sea and adjacent estuaries, this primary produced organic material probably fuels the remineralization process in the inner estuary.
Changing discharge conditions can lead to a spatial shift of the biogeochemical zones within the estuary. De Jonge et al. (2014) showed that elevated discharge can relocate the turbidity maximum (ETM) downstream. As we identified SPM concentrations as one of the most important controls on nitrogen turnover in the Ems estuary, we assume that the described zones will move with shifting SPM concentration along the estuary.
Overall, we find that the interplay of nitrification and denitrification and nitrogen assimilation is governed by SPM concentration along the Ems estuary. We expect that changing discharge can lead to spatial offsets in SPM concentrations and thus influence the spatial segregation of nitrogen turnover processes.
4.6 Nitrous oxide production and its controls in the Ems estuary
So far, we elucidated nitrogen turnover in the Ems Estuary. We found that nitrification and denitrification vary spatially in importance. Both processes can produce nitrous oxide, and we accordingly found nitrous oxide peaks in the estuary in areas with significant differences in their nitrogen turnover. Nitrous oxide was measured only in 2020, thus we will use the high-resolution data from this cruise to examine the importance of nitrification and denitrification for nitrous oxide production along the estuary. We will also discuss controls that favor the emergence of nitrous oxide production areas.
The calculated average sea-to-air flux of 0.35 g-N2O m−2 yr−1 results in a total nitrous oxide emission of 0.57×10⁸ g-N2O yr−1 along the Ems estuary. In June 1997, a significantly higher average sea-to-air flux density of 1.23 g-N2O m−2 yr−1 was measured (Barnes and Upstill-Goddard, 2011), which amounted to an annual nitrous oxide emission of 2.0×10⁸ g-N2O yr−1 over the entire estuary. Upscaling from a single cruise to an entire year is somewhat questionable, but it is interesting to note that the emissions may have halved since the 1990s. Furthermore, our results as well as those from 1997 were obtained from a single survey in June, making the comparison intriguing. Since the 1990s, the DIN load of the Ems estuary was significantly reduced due to management efforts (Bos et al., 2012). Phytoplankton biomass in the outer reaches (Station Huibertgat Oost, Van Beusekom et al., 2018) decreased in response to decreasing nutrient loads, possibly contributing to the observed lower N2O emissions. However, this hypothesis requires further verification in the future.
The nitrous oxide concentrations observed in 2020 can be linked to the prevailing biogeochemical conditions. The first nitrous oxide maximum was located in the upstream region (stream km 0). In this area, we identified water column denitrification as the dominant nitrogen turnover process, and we found relatively low pH values and high nitrate concentration. In their summary paper about nitrous oxide in streams and rivers, Quick et al. (2019) found that these factors are favorable for nitrous oxide production via denitrification. Intermittent oxygen hypoxia and anoxia in the different water depths also enhance nitrous oxide production in the tidal river, which is in line with our tidal oxygen measurements in the Ems. Several studies also showed a positive correlation between nitrous oxide concentration and SPM concentration (Tiedje, 1988; Liu et al., 2013; Zhou et al., 2019), and SPM concentration was also highest in this region of the tidal river. Altogether, we suggest that the Ems is well suited as a region with extremely high nitrous oxide production, triggered by high nutrient loss, intermittent anoxia, and high SPM loads.
Further downstream, nitrous oxide concentrations decrease, along with oxygen concentrations, reaching a minimum around kilometer 22. The simultaneous reduction of nitrous oxide and oxygen concentration at first sight seems counterintuitive, but it may be caused by complete denitrification that produces N2 instead of nitrous oxide (Knowles, 1982).
Based on our data, we cannot clearly say whether the source of nitrous oxide production was in the water column or in the sediments. Other studies, e.g., in the muddy Colne estuary found high nitrous oxide production due to denitrification, but assigned nitrous oxide production only to the sediments (Ogilvie et al., 1997; Robinson et al., 1998; Dong et al., 2002). Sedimentary denitrification in our study may have contributed to this first nitrous oxide maximum. The beginning of ebb tide during our campaign may have enhanced outgassing of nitrous oxide from the sediment, and low water levels may have caused a mechanical release of nitrous oxide from the sediments caused by our research vessel. Thus, the “denitrification zone” (zone 1) is an important nitrous oxide production zone, but the measured nitrous oxide concentration might in parts be affected by sedimentary processes and might overestimate nitrous oxide production in the water column.
The second nitrous oxide maximum occurred around stream kilometer 35 at the transition between tidal river and Dollard reach. In this area, our mapping approach indicates simultaneous denitrification and nitrification. The nitrous oxide peak coincides with an increase of ammonium and nitrite concentration, as well as a slight rise in nitrate concentration, indicating the onset of nitrification in the water column.
In contrast to conditions leading to the first nitrous oxide peak, not enough fresh organic matter seems to be present in the transition area to support nitrous oxide production. Lower SPM concentrations with comparable low POC fraction leads to lower remineralization rates and higher oxygen levels. Low organic matter availability and increasing oxygen concentration favor nitrous oxide production via nitrification (Otte et al., 1999; Sutka et al., 2006). Similarly, Quick et al. (2019) summarized aerobic or oxygen limited conditions with low organic carbon availability favorable for nitrous oxide production via nitrification. As our data suggest additional denitrification, we speculate that in possible anoxic microsites on suspended particles and anoxic deeper water layers, denitrification may have contributed to nitrous oxide production. Overall, we assume that nitrification and denitrification jointly added to nitrous oxide production in this region.
In summary, we find that two nitrous oxide production hotspots exist in the Ems estuary. SPM plays a big role controlling the nitrous oxide production along the Ems estuary. In the upstream region, where oxygen depletion occurs due to immense SPM concentration, denitrification produces nitrous oxide. At the transition zone between tidal river and Dollard reach, SPM concentration is lower, leading to higher oxygen concentration and nitrous oxide production via nitrification. Denitrification prevails in deeper water layers where oxygen concentration is low, and possibly in anoxic microsites close to particles.
Overall, we find that three distinct biogeochemical zones exist along the Ems. Stable isotope changes point towards water column denitrification in the turbid water column of the tidal river. In the Dollard reach/middle reaches nitrification gains importance turning this section of the estuary into a net nitrate source. Nitrate uptake occurs in the outer reaches due to primary production in the coastal North Sea, in August 2014 mixing dominated. Our analysis of the dominant nitrogen turnover processes suggest that SPM concentration and the linked oxygen deficits exert the overarching control on biogeochemical nitrogen cycling, zonation and nitrous oxide production in the Ems estuary.
Changing biogeochemical conditions can significantly alter estuarine nutrient processing. Deepening of river channels happens not only in Germany (Kerner, 2007; Schuchardt and Scholle, 2009; De Jonge et al., 2014; Van Maren et al., 2015b) but worldwide (e.g., Van Maren et al., 2009; Winterwerp et al., 2013; Cox et al., 2019; Grasso and Le Hir 2019; Pareja-Roman et al., 2020), and this can change SPM loads and composition in estuaries. Increased SPM loads can enhance denitrification, but also trigger nitrous oxide production and enhance oxygen-depleted zones, which is what we observe in the Ems estuary. Thus, the interplay of SPM with riverine nutrient filter function and nitrous oxide emissions should be further evaluated. The common practices of deepening and dredging affect SPM and this creates a direct link between pressing social and ecological problems in coastal regions.
The data sets are available under coastMap Geoportal (https://www.coastmap.org, last access: 6 April 2022) connecting to PANGEA with DOI availability. The data sets are accessible under https://doi.pangaea.de/10.1594/PANGAEA.942220 (Sanders and Petersen, 2022) and https://doi.pangaea.de/10.1594/PANGAEA.942222 (Schulz et al., 2022).
The supplement related to this article is available online at: https://doi.org/10.5194/bg-19-2007-2022-supplement.
GS, TS and KD designed this study. GS did the sampling, sample measurement and analyses for the cruise of 2020 as well as the data interpretation and evaluation. TS did the sampling and sample measurement for the cruise in 2014. YGV provided the oxygen data and correction from the FerryBox. AS provided the oxygen data from German Federal Institute of Hydrology. KD, AS, YGV, JEEvB and TS contributed with scientific and editorial recommendations. GS prepared the manuscript with contributions from all co-authors.
The contact author has declared that neither they nor their co-authors have any competing interests.
Publisher’s note: Copernicus Publications remains neutral with regard to jurisdictional claims in published maps and institutional affiliations.
This study was funded by the Deutsche Forschungsgemeinschaft (DFG, German Research Foundation) under Germany`s Excellence Strategy – EXC 2037 “CLICCS - Climate, Climatic Change, and Society” – Project Number: 390683824, contribution to the Center for Earth System Research and Sustainability (CEN) of Universität Hamburg. We thank the crew of R/V Ludwig Prandtl for the great support during the cruises. Thanks to Leon Schmidt, who measured the nutrients and helped during the field work. Phillip Wiese is gratefully acknowledge for the isotope analyses of the 2014 sampling. We are thankful for the FerryBox Team: Martina Gehrung for the preparation and Tanja Pieplow for the oxygen measurements. Thanks to the working group of Biogeochemistry at the Institute for Geology for measuring ratios, POC fractions and δ15N-SPM values.
This research has been supported by the Deutsche Forschungsgemeinschaft (grant no. 390683824).
The article processing charges for this open-access publication were covered by the Helmholtz-Zentrum Hereon.
This paper was edited by Tina Treude and reviewed by two anonymous referees.
Bange, H. W.: Nitrous oxide and methane in European coastal waters, Estuar. Coast. Shelf Sci., 70, 361–374, https://doi.org/10.1016/j.ecss.2006.05.042, 2006.
Barnes, J. and Upstill-Goddard, R. C.: N2O seasonal distributions and air-sea exchange in UK estuaries: Implications for the tropospheric N2O source from European coastal waters, J. Geophys. Res.-Biogeo., 116, G01006, https://doi.org/10.1029/2009JG001156, 2011.
Billen, G., Silvestre, M., Grizzetti, B., Leip, A., Garnier, J., Voss, M., Howarth, R., Bouraoui, F., Behrendt, H., Lepisto, A., Kortelainen, P., Johnes, P., Curtis, C., Humborg, C., Smedberg, E., Kaste, Ø., Ganeschram, R., Beusen, A., Lancelot, C., Butterbach-Bahl, K., and Gundersen, P.: Nitrogen Flows from European Regional Watersheds to Coastal Marine Waters, in: European Nitrogen Assessment, edited by: Sutton M., Howard C., Erisman, J. W., Billen, G., Bleeker, A., van Grinsven, H., Grennfelt, P., and Grizzetti, B., European Nitrogen Assessment, Cambridge University Press, European Nitrogen Assessment, 271–297, https://doi.org/10.1017/CBO9780511976988.016, 2011.
Borges, A., Vanderborght, J.-P., Schiettecatte, L.-S., Gazeau, F., Ferrón-Smith, S., Delille, B., and Frankignoulle, M.: Variability of gas transfer velocity of CO2 in a macrotidal estuary (The Scheldt), Estuaries, 27, 593–603, https://doi.org/10.1007/BF02907647, 2004.
Bos, D., Büttger, H., Esselink, P., Jager, Z., de Jonge, V. N., Kruckenberg, H., van Maren, D. S., and Schuchardt, B.: The ecological state of the Ems estaury and options for restoration, A&W Report, https://bioconsult-sh.de/site/assets/files/1303/1303.pdf (last access: 6 April 2022), 2012.
Böttcher, J., Strebel, O., Voerkelius, S., and Schmidt, H.-L.: Using isotope fractionation of nitrate-nitrogen and nitrate-oxygen for evaluation of microbial denitrification in a sandy aquifer, J. Hydrol., 114, 413–424, https://doi.org/10.1016/0022-1694(90)90068-9, 1990.
Bouwman, A. F., Bierkens, M. F. P., Griffioen, J., Hefting, M. M., Middelburg, J. J., Middelkoop, H., and Slomp, C. P.: Nutrient dynamics, transfer and retention along the aquatic continuum from land to ocean: towards integration of ecological and biogeochemical models, Biogeosciences, 10, 1–22, https://doi.org/10.5194/bg-10-1-2013, 2013.
Brandes, J. A. and Devol, A. H.: Isotopic fractionation of oxygen and nitrogen in coastal marine sediments, Geochim. Cosmochim. Acta, 61, 1793–1801, https://doi.org/10.1016/S0016-7037(97)00041-0, 1997.
Brase, L., Bange, H. W., Lendt, R., Sanders, T., and Dähnke, K.: High Resolution Measurements of Nitrous Oxide (N2O) in the Elbe Estuary, Front. Mar. Sci., 4, 162, https://doi.org/10.3389/fmars.2017.00162, 2017.
Brinkman, A. G., Riegman, R., Jacobs, P., Kuhn, S., and Meijboom, A.: Ems-Dollard primary production research: Full data report, Institute for Marine Resources & Ecosystem Studies, https://library.wur.nl/WebQuery/wurpubs/fulltext/350873 (last access: 6 April 2022), 2015.
Broder, T., Blodau, C., Biester, H., and Knorr, K. H.: Peat decomposition records in three pristine ombrotrophic bogs in southern Patagonia, Biogeosciences, 9, 1479–1491, https://doi.org/10.5194/bg-9-1479-2012, 2012.
Buchwald, C. and Casciotti, K. L.: Oxygen isotopic fractionation and exchange during bacterial nitrite oxidation, Limnol. Oceanogr., 55, 1064–1074, https://doi.org/10.4319/lo.2010.55.3.1064, 2010.
Carstensen, J., Conley, D. J., Bonsdorff, E., Gustafsson, B. G., Hietanen, S., Janas, U., Jilbert, T., Maximov, A., Norkko, A., Norkko, J., Reed, D. C., Slomp, C. P., Timmermann, K., and Voss, M.: Hypoxia in the Baltic Sea: Biogeochemical Cycles, Benthic Fauna, and Management, AMBIO, 43, 26–36, https://doi.org/10.1007/s13280-013-0474-7, 2014.
Casciotti, K. L.: Inverse kinetic isotope fractionation during bacterial nitrite oxidation, Geochim. Cosmochim. Acta, 73, 2061–2076, https://doi.org/10.1016/j.gca.2008.12.022, 2009.
Casciotti, K. L., Sigman, D. M., Hastings, M. G., Böhlke, J. K., and Hilkert, A.: Measurement of the Oxygen Isotopic Composition of Nitrate in Seawater and Freshwater Using the Denitrifier Method, Anal. Chem., 74, 4905–4912, https://doi.org/10.1021/ac020113w, 2002.
Casciotti, K. L., Sigman, D. M., and Ward, B. B.: Linking Diversity and Stable Isotope Fractionation in Ammonia-Oxidizing Bacteria, Geomicrobiol. J., 20, 335–353, https://doi.org/10.1080/01490450303895, 2003.
Colijn, F.: Primary production in the Ems Dollard estuary, State University Groningen, Groningen, https://doi.org/10.1016/0278-4343(87)90045-8, 1983.
Colijn, F., Admiraal, W., Baretta, J. W., and Ruardij, P.: Primary production in a turbid estuary, the Ems-Dollard: field and model studies, Cont. Shelf Res., 7, 1405–1409, https://doi.org/10.1016/0278-4343(87)90045-8, 1987.
Compton, T. J., Holthuijsen, S., Mulder, M., van Arkel, M., Schaars, L. K., Koolhaas, A., Dekinga, A., ten Horn, J., Luttikhuizen, P. C., van der Meer, J., Piersma, T., and van der Veer, H. W.: Shifting baselines in the Ems Dollard estuary: A comparison across three decades reveals changing benthic communities, J. Sea Res., 127, 119–132, https://doi.org/10.1016/j.seares.2017.06.014, 2017.
Cox, T. J. S., Maris, T., Van Engeland, T., Soetaert, K., and Meire, P.: Critical transitions in suspended sediment dynamics in a temperate meso-tidal estuary, Sci. Rep., 9, 12745, https://doi.org/10.1038/s41598-019-48978-5, 2019.
Crossland, C. J., Baird, D., Ducrotoy, J.-P., Lindeboom, H., Buddemeier, R. W., Dennison, W. C., Maxwell, B. A., Smith, S. V., and Swaney, D. P.: The Coastal Zone – a Domain of Global Interactions, in: Coastal Fluxes in the Anthropocene: The Land-Ocean Interactions in the Coastal Zone Project of the International Geosphere–Biosphere Programme, edited by: Crossland, C. J., Kremer, H. H., Lindeboom, H. J., Marshall Crossland, J. I., and Le Tissier, M. D. A., Springer, Berlin, Heidelberg, 1–37, https://doi.org/10.1007/3-540-27851-6_1, 2005.
Dähnke, K., Bahlmann, E., and Emeis, K.-C.: A nitrate sink in estuaries? An assessment by means of stable nitrate isotopes in the Elbe estuary, Limnol. Oceanogr., 53, 1504–1511, https://doi.org/10.4319/lo.2008.53.4.1504, 2008.
Dähnke, K., Emeis, K.-C., Johannsen, A., and Nagel, B.: Stable isotope composition and turnover of nitrate in the German Bight, Mar. Ecol. Prog. Ser., 408, 7–18, https://doi.org/10.3354/meps08558, 2010.
De Jonge, V. N.: Relations Between Annual Dredging Activities, Suspended Matter Concentrations, and the Development of the Tidal Regime in the Ems Estuary, Can. J. Fish. Aquat. Sci., 40, 289–300, https://doi.org/10.1139/f83-290, 1983.
De Jonge, V. N., Schuttelaars, H. M., van Beusekom, J. E. E., Talke, S. A., and de Swart, H. E.: The influence of channel deepening on estuarine turbidity levels and dynamics, as exemplified by the Ems estuary, Estuar. Coast. Shelf Sci., 139, 46–59, https://doi.org/10.1016/j.ecss.2013.12.030, 2014.
de Wilde, H. P. and de Bie, M. J.: Nitrous oxide in the Schelde estuary: production by nitrification and emission to the atmosphere, Mar. Chem., 69, 203–216, https://doi.org/10.1016/S0304-4203(99)00106-1, 2000.
Deutsch, B., Mewes, M., Liskow, I., and Voss, M.: Quantification of diffuse nitrate inputs into a small river system using stable isotopes of oxygen and nitrogen in nitrate, Org. Geochem., 37, 1333–1342, 2006.
Diaz, R. J. and Rosenberg, R.: Spreading Dead Zones and Consequences for Marine Ecosystems, Science, 321, 926–929, https://doi.org/10.1126/science.1156401, 2008.
Diaz, R. J., Rosenberg, R., and Sturdivant, K.: Hypoxia in estuaries and semi-enclosed seas, in: Ocean deoxygenation: everyone's problem, 20 edn., edited by: Laffoley, D. and Baxter, J. M., IUCN, 85–102, https://doi.org/10.2305/IUCN.CH.2019.13.en, 2019.
Dong, L., Nedwell, D. B., Underwood, G. J. C., Thornton, D. C. O., and Rusmana, I.: Nitrous oxide formation in the Colne estuary, England: the central role of nitrite, Appl. Environ. Microbiol., 68, 1240–1249, https://doi.org/10.1128/aem.68.3.1240-1249.2002, 2002.
FGG Ems: Hochwasserriskiomanagmentplan 2015–2021 für den deutschen Anteil der Flussgebietseinheit Ems gemäß § 75 WHG, Flussgebietsgemeinschaft Ems, https://www.ems-eems.de/fileadmin/co_theme/Default/Media/pdfs/2015_nat_HWRMP_Ems.pdf (last access: 24 February 2022), 2015a.
FGG Ems: Internationaler Bewirtschaftungsplan nach Artikel 13 Wasserrahmenrichtlinie für die Flussgebietseinheit Ems: Bewirtschaftungszeitraum 2015–2021, Flussgebietsgemeinschaft Ems, https://www.ems-eems.de/fileadmin/co_theme/Default/Media/pdfs/2015_int_BWP_Ems_DE.pdf (last access: 16 March 2022), 2015b.
Francis, C. A., Beman, J. M., and Kuypers, M. M. M.: New processes and players in the nitrogen cycle: the microbial ecology of anaerobic and archaeal ammonia oxidation, ISME J., 1, 19–27, https://doi.org/10.1038/ismej.2007.8, 2007.
Fry, B.: Conservative mixing of stable isotopes across estuarine salinity gradients: A conceptual framework for monitoring watershed influences on downstream fisheries production, Estuaries, 25, 264–271, https://doi.org/10.1007/BF02691313, 2002.
Galloway, J. N., Aber, J. D., Erisman, J. W., Seitzinger, S. P., Howarth, R. W., Cowling, E. B., and Cosby, B. J.: The Nitrogen Cascade, Bioscience, 53, 341–356, https://doi.org/10.1641/0006-3568(2003)053[0341:TNC]2.0.CO;2, 2003.
Gao, H., Schreiber, F., Collins, G., Jensen, M. M., Kostka, J. E., Lavik, G., de Beer, D., Zhou, H.-Y., and Kuypers, M. M. M.: Aerobic denitrification in permeable Wadden Sea sediments, ISME J., 4, 417–426, https://doi.org/10.1038/ismej.2009.127, 2010.
GGally: Extension to “ggplot2”: https://www.rdocumentation.org/packages/GGally/versions/1.5.0, last access: 29 January 2021.
Giblin, A., Tobias, C., Song, B., Weston, N., Banta, G., and Rivera-Monroy, V.: The Importance of Dissimilatory Nitrate Reduction to Ammonium (DNRA) in the Nitrogen Cycle of Coastal Ecosystems, Oceanography, 26, 124–131, https://doi.org/10.5670/oceanog.2013.54, 2013.
Granger, J. and Sigman, D. M.: Removal of nitrite with sulfamic acid for nitrate N and O isotope analysis with the denitrifier method, Rapid Commun. Mass Spectrom., 23, 3753–3762, https://doi.org/10.1002/rcm.4307, 2009.
Granger, J. and Wankel, S.: Isotopic overprinting of nitrification on denitrification as a ubiquitous and unifying feature of environmental nitrogen cycling, Proc. Natl. Acad. Sci., 113, E6391–E6400, https://doi.org/10.1073/pnas.1601383113, 2016.
Granger, J., Sigman, D. M., Needoba, J. A., and Harrison, P. J.: Coupled nitrogen and oxygen isotope fractionation of nitrate during assimilation by cultures of marine phytoplankton, Limnol. Oceanogr., 49, 1763–1773, https://doi.org/10.4319/lo.2004.49.5.1763, 2004.
Grasso, F. and Le Hir, P.: Influence of morphological changes on suspended sediment dynamics in a macrotidal estuary: diachronic analysis in the Seine Estuary (France) from 1960 to 2010, Ocean Dyn., 69, 83–100, https://doi.org/10.1007/s10236-018-1233-x, 2019.
Hansen, H. P. and Koroleff, F.: Determination of nutrients, in: Methods of Seawater Analysis, 3rd edn., Methods of Seawater Analysis, edited by: Grasshoff, K., Kremling, K., and Ehrhardt, M., John Wiley & Sons Ltd., 159–228, https://doi.org/10.1002/9783527613984.ch10, 2007.
Howarth, W.: Coastal nitrogen pollution: A review of sources and trends globally and regionally, Harmful Algae, 8, 14–20, https://doi.org/10.1016/j.hal.2008.08.015, 2008.
Howarth, R. W. and Marino, R.: Nitrogen as the limiting nutrient for eutrophication in coastal marine ecosystems: Evolving views over three decades, Limnol. Oceanogr., 51, 364–376, https://doi.org/10.4319/lo.2006.51.1_part_2.0364, 2006.
IPCC: Climate Change 2007: The Physical Science Basis – Contribution of Working Group I to the Fourth Assessment Report of the Intergovernmental Panel on Climate Change, edited by: Solomon, S., Qin, D., Manning, M., Chen, Z., Marquis, M., Averyt, K. B., Tignor, M., and Miller, H. L., Cambridge University Press, Cambridge, United Kingdom and New York, NY, USA, 996 pp., ISBN 978-0-521-70596-7, 2007.
Jacob, J., Nowka, B., Merten, V., Sanders, T., Spieck, E., and Dähnke, K.: Oxidation kinetics and inverse isotope effect of marine nitrite-oxidizing isolates, Aquat. Microb. Ecol., 80, 289–300, https://doi.org/10.3354/ame01859, 2017.
Johannsen, A., Dähnke, K., and Emeis, K.: Isotopic composition of nitrate in five German rivers discharging into the North Sea, Org. Geochem., 39, 1678–1689, https://doi.org/10.1016/j.orggeochem.2008.03.004, 2008.
Kendall, C., Elliott, E. M., and Wankel, S. D.: Tracing Anthropogenic Inputs of Nitrogen to Ecosystems, in: Stable Isotopes in Ecology and Environmental Science, 2nd edn., Stable isotopes in ecology and environmental science, edited by: Michener, R. and Lajtha, K., John Wiley & Sons Ltd., 375–449, https://doi.org/10.1002/9780470691854.ch12, 2007.
Kennish M. J.: Estuaries, Anthropogenic Impacts, in: Encyclopedia of Coastal Science, Encyclopedia of Earth Science Series, edited by: Schwartz M. L., Springer, Dordrecht, 434–436, https://doi.org/10.1007/1-4020-3880-1_140, 2005.
Kerner, M.: Effects of deepening the Elbe Estuary on sediment regime and water quality, Estuar. Coast. Shelf Sci., 75, 492–500, https://doi.org/10.1016/j.ecss.2007.05.033, 2007.
Knowles, R.: Denitrification, Microbiol. Rev., 46, 43–70, 1982.
Krebs, M. and Weilbeer, H.: Ems-Dollart Estuary, Küste, 74, 252–262, 2008.
Lehmann, M. F., Sigman, D. M., and Berelson, W. M.: Coupling the 15N14N and 18O16O of nitrate as a constraint on benthic nitrogen cycling, Mar. Chem., 88, 1–20, https://doi.org/10.1016/j.marchem.2004.02.001, 2004.
Lewicka-Szczebak, D., Augustin, J., Giesemann, A., and Well, R.: Quantifying N2O reduction to N2 based on N2O isotopocules – validation with independent methods (helium incubation and 15N gas flux method), Biogeosciences, 14, 711–732, https://doi.org/10.5194/bg-14-711-2017, 2017.
Liss, P. S.: Conservative and non-conservative behavior ofdissolved constituents during estuarine mixing, in: Estuarine chemistry, edited by: Burton, J. D. and Liss, J. D., Academic Press, 93–130, ISBN 978-0121473501, 1976.
Liu, B., de Swart, H. E., and de Jonge, V. N.: Phytoplankton bloom dynamics in turbid, well-mixed estuaries: A model study, Estuar. Coast. Shelf Sci., 211, 137–151, https://doi.org/10.1016/j.ecss.2018.01.010, 2018.
Liu, T., Xia, X., Liu, S., Mou, X., and Qiu, Y.: Acceleration of denitrification in turbid rivers due to denitrification occurring on suspended sediment in oxic waters, Environ. Sci. Technol., 47, 4053–4061, https://doi.org/10.1021/es304504m, 2013.
Loisel, J., Gallego-Sala, A. V., and Yu, Z.: Global-scale pattern of peatland Sphagnum growth driven by photosynthetically active radiation and growing season length, Biogeosciences, 9, 2737–2746, https://doi.org/10.5194/bg-9-2737-2012, 2012.
Mariotti, A., Germon, J. C., Hubert, P., Kaiser, P., Letolle, R., Tardieux, A., and Tardieux, P.: Experimental determination of nitrogen kinetic isotope fractionation: some principles, illustrations for the denitrification and nitrification process, Plant Soil, 62, 413–430, 1981.
Mengis, M., Schif, S. L., Harris, M., English, M. C., Aravena, R., Elgood, R., and MacLean, A.: Multiple Geochemical and Isotopic Approaches for Assessing Ground Water NO3− Elimination in a Riparian Zone, Groundwater, 37, 448–457, https://doi.org/10.1111/j.1745-6584.1999.tb01124.x, 1999.
Middelburg, J. and Nieuwenhuize, J.: Uptake of dissolved inorganic nitrogen in turbid, tidal estuaries, Mar. Ecol.-Prog. Ser., 192, 79–88, https://doi.org/10.3354/meps192079, 2001.
Möbius, J.: Isotope fractionation during nitrogen remineralization (ammonification): Implications for nitrogen isotope biogeochemistry, Geochim. Cosmochim. Acta, 105, 422–432, https://doi.org/10.1016/j.gca.2012.11.048, 2013.
Murray, R. H., Erler, D. V., and Eyre, B. D.: Nitrous oxide fluxes in estuarine environments: response to global change, Glob. Change Biol., 21, 3219–3245, https://doi.org/10.1111/gcb.12923, 2015.
Ogilvie, B., Nedwell, D. B., Harrison, R. M., Robinson, A., and Sage, A.: High nitrate, muddy estuaries as nitrogen sinks: the nitrogen budget of the River Colne estuary (United Kingdom), Mar. Ecol. Prog. Ser., 150, 217–228, https://doi.org/10.3354/meps150217, 1997.
Otte, S., Schalk, J., Kuenen, J. G., and Jetten, M. S.: Hydroxylamine oxidation and subsequent nitrous oxide production by the heterotrophic ammonia oxidizer Alcaligenes faecalis, Appl. Microbiol. Biotechnol., 51, 255–261, https://doi.org/10.1007/s002530051390, 1999.
Papenmeier, S., Schrottke, K., Bartholomä, A., and Flemming, B. W.: Sedimentological and Rheological Properties of the Water–Solid Bed Interface in the Weser and Ems Estuaries, North Sea, Germany: Implications for Fluid Mud Classification, J. Coast. Res., 289, 797–808, https://doi.org/10.2112/JCOASTRES-D-11-00144.1, 2013.
Pareja-Roman, L. F., Chant, R. J., and Sommerfield, C. K.: Impact of Historical Channel Deepening on Tidal Hydraulics in the Delaware Estuary, J. Geophys. Res. Oceans, 125, e2020JC016256, https://doi.org/10.1029/2020JC016256, 2020.
Petersen, W., Schroeder, F., and Bockelmann, F.-D.: FerryBox – Application of continuous water quality observations along transects in the North Sea, Ocean Dyn., 61, 1541–1554, https://doi.org/10.1007/s10236-011-0445-0, 2011.
Quick, A. M., Reeder, W. J., Farrell, T. B., Tonina, D., Feris, K. P., and Benner, S. G.: Nitrous oxide from streams and rivers: A review of primary biogeochemical pathways and environmental variables, Earth-Sci. Rev., 191, 224–262, https://doi.org/10.1016/j.earscirev.2019.02.021, 2019.
Rhee, T. S., Kettle, A. J., and Andreae, M. O.: Methane and nitrous oxide emissions from the ocean: A reassessment using basin-wide observations in the Atlantic, J. Geophys. Res.-Atmos., 114, D12304, https://doi.org/10.1029/2008JD011662, 2009.
Robinson, A. D., Nedwell, D. B., Harrison, R. M., and Ogilvie, B. G.: Hypernutrified estuaries as sources of N2O emission to the atmosphere: the estuary of the River Colne, Essex, UK, Mar. Ecol. Prog. Ser., 164, 59–71, 1998.
Röttgers, R., Heymann, K., and Krasemann, H.: Suspended matter concentrations in coastal waters: Methodological improvements to quantify individual measurement uncertainty, Estuar. Coast. Shelf Sci., 151, 148–155, https://doi.org/10.1016/j.ecss.2014.10.010, 2014.
Sanders, T. and Dähnke, K.: The N-isotope effect and fractionation of nitrification in the tidal influenced Elbe River estuary, Germany, EGU General Assembly Conference 2014, Wien, EGU2013-5061, https://ui.adsabs.harvard.edu/abs/2013EGUGA..15.5061S (last access: 16 March 2022), 2014.
Sanders, T. and Laanbroek, H. J.: The distribution of sediments and water column nitrification potential in the hyper-turbid Ems estuary, Aquat. Sci., 80, 33, https://doi.org/10.1007/s00027-018-0584-1, 2018.
Sanders, T. and Petersen, W.: Nitrogen turnover in the Ems estuary 2014, PANGAEA [data set], https://doi.pangaea.de/10.1594/PANGAEA.942220, 2022.
Santoro, A. E. and Casciotti, K. L.: Enrichment and characterization of ammonia-oxidizing archaea from the open ocean: phylogeny, physiology and stable isotope fractionation, ISME J., 5, 1796–1808, https://doi.org/10.1038/ismej.2011.58, 2011.
Schröder, F., Wiltshire, K. H., Klages, D., Mathieu, B., and Knauth, H. D.: Nitrogen and oxygen processes in sediments of the Elbe Estuary, Arch. Für Hydrobiol. Suppl., 110, 311–328, 1995.
Schuchardt, B. and Scholle, J.: Estuaries. Thematic Report No. 16, in: Quality Status Report 2009. WaddenSea Ecosystem No. 25, edited by: Marencic, H. and de Vlas, J., Common Wadden Sea Secretariat, Trilateral Monitoring and Assessment Group, Wilhelmshaven, Germany, ISSN 0928-2734, 2009.
Schulz, G., Voynova, Y. G., Metzke, M., and Schmidt, L.: Nitrogen turnover in the Ems estuary 2020, PANGAEA [data set], https://doi.pangaea.de/10.1594/PANGAEA.942222, 2022.
Seitzinger, S. P.: Denitrification in freshwater and coastal marine ecosystems: Ecological and geochemical significance, Limnol. Oceanogr., 33, 702–724, https://doi.org/10.4319/lo.1988.33.4part2.0702, 1988.
Sigman, D. M. and Fripiat, F.: Nitrogen isotopes in the ocean, Encycl. Ocean Sci., 1, 263–278, https://doi.org/10.1016/B978-0-12-409548-9.11605-7, 2018.
Sigman, D. M., Altabet, M., McCorkle, D., Francois, R., and Fischer, G.: The δ15N of nitrate in the Southern Ocean: Nitrogen cycling and circulation in the ocean interior, J. Geophys. Res., 105, 19599–19614, https://doi.org/10.1029/2000JC000265, 2000.
Sigman, D. M., Casciotti, K. L., Andreani, M., Barford, C., Galanter, M., and Böhlke, J. K.: A Bacterial Method for the Nitrogen Isotopic Analysis of Nitrate in Seawater and Freshwater, Anal. Chem., 73, 4145–4153, https://doi.org/10.1021/ac010088e, 2001.
Sigman, D., Karsh, K., and Casciotti, K. L.: Ocean process tracers: Nitrogen isotopes in the ocean, 2nd edn., Encycl. Ocean Sci., https://doi.org/10.1016/B978-012374473-9.00632-9, 4138–4153, 2009.
Sutka, R. L., Ostrom, N. E., Ostrom, P. H., Breznak, J. A., Gandhi, H., Pitt, A. J., and Li, F.: Distinguishing Nitrous Oxide Production from Nitrification and Denitrification on the Basis of Isotopomer Abundances, Appl. Environ. Microbiol., 72, 638–644, https://doi.org/10.1128/AEM.72.1.638-644.2006, 2006.
Talke, S. and de Swart, H. E.: Hydrodynamics and Morphology in the Ems/Dollard Estuary: Review of Models, Measurements, Scientific Literature, and the Effects of Changing Conditions, Civ. Environ. Eng. Fac. Publ. Present., 87, IMAU Report # R06-01, http://archives.pdx.edu/ds/psu/11193 (last access: 6 April 2022), 2006.
Talke, S. A., de Swart, H. E., and de Jonge, V. N.: An Idealized Model and Systematic Process Study of Oxygen Depletion in Highly Turbid Estuaries, Estuaries Coasts, 32, 602–620, https://doi.org/10.1007/s12237-009-9171-y, 2009.
The R Stats Package, Version 4.0.2: https://www.rdocumentation.org/packages/stats/versions/3.6.2/topics/prcomp, last access: 29 January 2021.
Thornton, D. C. O., Dong, L. F., Underwood, G. J. C., and Nedwell, D. B.: Sediment–water inorganic nutrient exchange and nitrogen budgets in the Colne Estuary, UK, Mar. Ecol. Prog. Ser., 337, 63–77, 2007.
Tian, H., Xu, R., Canadell, J. G., Thompson, R. L., Winiwarter, W., Suntharalingam, P., Davidson, E. A., Ciais, P., Jackson, R. B., Janssens-Maenhout, G., Prather, M. J., Regnier, P., Pan, N., Pan, S., Peters, G. P., Shi, H., Tubiello, F. N., Zaehle, S., Zhou, F., Arneth, A., Battaglia, G., Berthet, S., Bopp, L., Bouwman, A. F., Buitenhuis, E. T., Chang, J., Chipperfield, M. P., Dangal, S. R. S., Dlugokencky, E., Elkins, J. W., Eyre, B. D., Fu, B., Hall, B., Ito, A., Joos, F., Krummel, P. B., Landolfi, A., Laruelle, G. G., Lauerwald, R., Li, W., Lienert, S., Maavara, T., MacLeod, M., Millet, D. B., Olin, S., Patra, P. K., Prinn, R. G., Raymond, P. A., Ruiz, D. J., van der Werf, G. R., Vuichard, N., Wang, J., Weiss, R. F., Wells, K. C., Wilson, C., Yang, J., and Yao, Y.: A comprehensive quantification of global nitrous oxide sources and sinks, Nature, 586, 248–256, https://doi.org/10.1038/s41586-020-2780-0, 2020.
Tiedje, J. M.: Ecology of denitrification and dissimilatory nitrate reduction to ammonium, in: Environmental Microbiology of Anaerobes, edited by: Zehnder, A. J. B., John Wiley and Sons, New York, 179–244, https://www.researchgate.net/publication/255948382_Ecology_of_denitrification_and_dissimilatory_nitrate_reduction_to_ammonium (last access: 11 April 2022), 1988.
Van Beusekom, J. E. E. and de Jonge, V. N.: The role of suspended matter in the distribution of dissolved inorganic phosphate, iron and aluminium in the ems estuary, Neth. J. Aquat. Ecol., 28, 383–395, 1994.
Van Beusekom, J. E. E. and de Jonge, V. N.: Transformation of phosphorus in the wadden sea: Apatite formation, Dtsch. Hydrogr. Z., 49, 297–305, https://doi.org/10.1007/BF02764040, 1997.
Van Beusekom, J. E. E. and de Jonge, V. N.: Retention of Phosphorus and Nitrogen in the Ems Estaury, Estuaries, 21, 527–539, 1998.
Van Beusekom, J., Thiel, R., Bobsien, I., Boersma, M., Buschbaum, C., Dänhardt, A., Darr, A., Friedland, R., Kloppmann, M., Kröncke, I., Rick, J., and Wetzel, M.: Aquatische Ökosysteme: Nordsee, Wattenmeer, Elbeästuar und Ostsee, in: Hamburger Klimabericht – Wissen über Klima, Klimawandel und Auswirkungen in Hamburg und Norddeutschland, edited by: von Storch, H., Meinke, I., and Claußen, M., Springer, Berlin, Heidelberg, 89–107, https://doi.org/10.1007/978-3-662-55379-4_5, 2018.
Van Beusekom, J. E. E., Carstensen, J., Dolch, T., Grage, A., Hofmeister, R., Lenhart, H., Kerimoglu, O., Kolbe, K., Pätsch, J., Rick, J., Rönn, L., and Ruiter, H.: Wadden Sea Eutrophication: Long-Term Trends and Regional Differences, Front. Mar. Sci., 6, 370, https://doi.org/10.3389/fmars.2019.00370, 2019.
Van Maren, D. S., Winterwerp, J. C., Wang, Z. Y., and Pu, Q.: Suspended sediment dynamics and morphodynamics in the Yellow River, China, Sedimentology, 56, 785–806, https://doi.org/10.1111/j.1365-3091.2008.00997.x, 2009.
Van Maren, D. S., Winterwerp, J. C., and Vroom, J.: Fine sediment transport into the hyper-turbid lower Ems River: the role of channel deepening and sediment-induced drag reduction, Ocean Dyn., 65, 589–605, https://doi.org/10.1007/s10236-015-0821-2, 2015a.
Van Maren, D. S., van Kessel, T., Cronin, K., and Sittoni, L.: The impact of channel deepening and dredging on estuarine sediment concentration, Cont. Shelf Res., 95, 1–14, https://doi.org/10.1016/j.csr.2014.12.010, 2015b.
Voss, M., Baker, A., Bange, H. W., Conley, D., Cornell, S., Deutsch, B., Engel, A., Ganeshram, R., Garnier, J., Heiskanen, A.-S., Jickells, T., Lancelot, C., McQuatters-Gollop, A., Middelburg, J., Schiedek, D., Slomp, C. P., and Conley, D. P.: Nitrogen processes in coastal and marine ecosystems, in: The European Nitrogen Assessment: Sources, Effects and Policy Perspectives, edited by: Bleeker, A., Grizzetti, B., Howard, C. M., Billen, G., van Grinsven, H., Erisman, J. W., Sutton, M. A., and Grennfelt, P., Cambridge University Press, Cambridge, 147–176, https://doi.org/10.1017/CBO9780511976988.011, 2011.
Wang, M., Moore, T. R., Talbot, J., and Riley, J. L.: The stoichiometry of carbon and nutrients in peat formation, Glob. Biogeochem. Cycles, 29, 113–121, https://doi.org/10.1002/2014GB005000, 2015.
Wankel, S. D., Kendall, C., Francis, C. A., and Paytan, A.: Nitrogen sources and cycling in the San Francisco Bay Estuary: A nitrate dual isotopic composition approach, Limnol. Oceanogr., 51, 1654–1664, 2006.
Weiss, R. F. and Price, B. A.: Nitrous oxide solubility in water and seawater, Mar. Chem., 8, 347–359, https://doi.org/10.1016/0304-4203(80)90024-9, 1980.
Winterwerp, J. C., Wang, Z. B., van Braeckel, A., van Holland, G., and Kösters, F.: Man-induced regime shifts in small estuaries – II: a comparison of rivers, Ocean Dyn., 63, 1293–1306, https://doi.org/10.1007/s10236-013-0663-8, 2013.
Wong, W. W., Applegate, A., Poh, S. C., and Cook, P. L. M.: Biogeochemical attenuation of nitrate in a sandy subterranean estuary: Insights from two stable isotope approaches, Limnol. Oceanogr., 65, 3098–3113, https://doi.org/10.1002/lno.11576, 2020.
Wrage, N., Velthof, G. L., van Beusichem, M. L., and Oenema, O.: The role of nitrifier denitrification in the production of nitrous oxide, Soil Biol. Biochem., 33, 1723–1732, 2001.
Xia, X., Liu, T., Yang, Z., Michalski, G., Liu, S., Jia, Z., and Zhang, S.: Enhanced nitrogen loss from rivers through coupled nitrification-denitrification caused by suspended sediment, Sci. Total Environ., 579, 47–59, https://doi.org/10.1016/j.scitotenv.2016.10.181, 2016.
Zhou, Y., Xu, X., Han, R., Li, L., Feng, Y., Yeerken, S., Song, K., and Wang, Q.: Suspended particles potentially enhance nitrous oxide (N2O) emissions in the oxic estuarine waters of eutrophic lakes: Field and experimental evidence, Environ. Pollut., 252, 1225–1234, https://doi.org/10.1016/j.envpol.2019.06.076, 2019.
Zhu, W., Wang, C., Hill, J., He, Y., Tao, B., Mao, Z., and Wu, W.: A missing link in the estuarine nitrogen cycle?: Coupled nitrification-denitrification mediated by suspended particulate matter, Sci. Rep., 8, 2282, https://doi.org/10.1038/s41598-018-20688-4, 2018.