the Creative Commons Attribution 4.0 License.
the Creative Commons Attribution 4.0 License.
 | 13 Apr 2022
Excess soil moisture and fresh carbon input are prerequisites for methane production in podzolic soil
Mika Korkiakoski
Tiia Määttä
Krista Peltoniemi
Timo Penttilä
Annalea Lohila
Boreal upland forests are generally considered methane (CH4) sinks due to the predominance of CH4 oxidizing bacteria over the methanogenic archaea. However, boreal upland forests can temporarily act as CH4 sources during wet seasons or years. From a landscape perspective and in annual terms, this source can be significant as weather conditions may cause flooding, which can last a considerable proportion of the active season and because often, the forest coverage within a typical boreal catchment is much higher than that of wetlands. Processes and conditions which change mineral soils from acting as a weak sink to a strong source are not well understood. We measured soil CH4 fluxes from 20 different points from regularly irrigated and control plots during two growing seasons. We also estimated potential CH4 production and oxidation rates in different soil layers and performed a laboratory experiment, where soil microcosms were subjected to different moisture levels and glucose addition simulating the fresh labile carbon (C) source from root exudates. The aim was to find the key controlling factors and conditions for boreal upland soil CH4 production. Probably due to long dry periods in both summers, we did not find occasions of CH4 production following the excess irrigation, with one exception in July 2019 with emission of 18 200 µg CH4 m−2 h−1. Otherwise, the soil was always a CH4 sink (median CH4 uptake rate of 260–290 and 150–170 µg CH4 m−2 h−1, in control and irrigated plots, respectively). The median soil CH4 uptake rates at the irrigated plot were 88 % and 50 % lower than at the control plot in 2018 and 2019, respectively. Potential CH4 production rates were highest in the organic layer (0.2–0.6 nmol CH4 g−1 d−1), but some production was also observed in the leaching layer, whereas in other soil layers, the rates were negligible. Potential CH4 oxidation rates varied mainly within 10–40 nmol CH4 g−1 d−1, except in deep soil and the organic layer in 2019, where potential oxidation rates were almost zero. The laboratory experiment revealed that high soil moisture alone does not turn upland forest soil into a CH4 source. However, a simple C source, e.g., substrates coming from root exudates with high moisture, switched the soil into a CH4 source. Our unique study provides new insights into the processes and controlling factors on CH4 production and oxidation, and the resulting net efflux that should be incorporated in process models describing global CH4 cycling.
- Article
(4796 KB) - Full-text XML
-
Supplement
(370 KB) - BibTeX
- EndNote


Methane (CH4) is a greenhouse gas with a significant impact on the global climate. CH4 increases the global temperatures by absorbing infrared radiation into its carbon–hydrogen bonds, resulting in a higher amount of heat energy within the atmosphere (e.g., Chai et al., 2016; Dlugokencky et al., 2011; Whalen, 2005). In soil, CH4 is predominantly formed in biological anaerobic decomposition processes (Le Mer and Roger, 2001; Wuebbles and Hayhoe, 2002). Archaea called methanogens are responsible for the biological production of CH4 in anoxic conditions, whereas methanotrophs conduct aerobic CH4 oxidation (Hanson and Hanson, 1996; Orata et al., 2018; Thauer et al., 2008). The dynamics behind soil CH4 sources and sinks depend on the ratio between CH4 production and oxidation and its transport from the soil to the atmosphere, all of which are affected by an extensive network of numerous biotic and abiotic variables. The interannual fluctuations in global and regional CH4 emissions are influenced by so-far largely unknown variables, the investigation of which is thus essential for understanding the changing dynamics in the current and future CH4 budgets (Bousquet et al., 2006; Crill and Thornton, 2017; Dlugokencky et al., 2011; Fischer et al., 2008; Kirschke et al., 2013). The boreal zone in the Northern Hemisphere regularly presents large CH4 emissions due to the abundance of anoxic wetlands, but part is counterbalanced by high oxidation rates in boreal upland forests. The CH4 emission estimates from the boreal zone lie between 25 and 100 Tg yr−1, which combined with subarctic tundra environments account for approximately 3 %–10 % of the global CH4 emissions (Olefeldt et al., 2013).
Boreal upland forests are broadly considered CH4 sinks due to strongly oxic soils (Gulledge and Schimel, 2000; Megonigal and Guenther, 2008; Oertel et al., 2016; Whalen et al., 1991; Yavitt et al., 1990, 1995). In upland soils, high-affinity methanotrophs can consume CH4 at atmospheric concentrations (Knief et al., 2003; Kolb, 2009). Despite the abundance of oxygen in the boreal upland forest soil, there are some indications of smaller-scale CH4-producing areas, such as wet depressions (Christiansen et al., 2012; Megonigal and Guenther, 2008; Vainio et al., 2021). In addition, some studies have found that upland forest soils may become CH4 sources of varying significance after long periods of heavy precipitation (Lohila et al., 2016; Savage and Moore, 1997). Methanogenic population can stay constant in forest and other dry aerated soils and becomes active under wet and anoxic conditions (Angel et al., 2012; Peter Mayer and Conrad, 1990). With upland forests occupying a significant portion of the boreal zone, a more thorough examination of the complex dynamics behind the sink–source transitions of the forests is needed, especially in the context of climate change which may alter global and regional precipitation and temperature patterns (e.g., Beier et al., 2012; Lehtonen et al., 2014; Lohila et al., 2016). Lohila et al. (2016) also suggested that wet conditions can potentially affect the CH4 exchange patterns differently in forests and wetlands by increasing and decreasing the CH4 emissions in those ecosystems, respectively, amplifying the vital role of upland forests in the regional CH4 balance in wet years. Furthermore, as precipitation may increase during summer and autumn in northern latitudes (Jylhä et al., 2009), this flooding-induced source of CH4 may be activated more frequently in the future. This source is accounted for in the models of global CH4 emissions, but there are recent observation-based indications that its magnitude may be severely underestimated. The global CH4 uptake by mineral soils is only 5 % of global CH4 sink (625 Tg CH4 yr−1; Saunois et al., 2020) and during wet years the CH4 sink of mineral soils is significantly suppressed. It has already been suggested that the emissions from wet mineral soils can be the primary driver for the interannual variability in global CH4 emissions (Spahni et al., 2011).
Soil temperature and moisture manipulations in CH4 flux studies from upland soils have been very few, but some existing manipulation studies exist that focus on carbon dioxide (CO2) fluxes (Allison and Treseder, 2008; Billings et al., 2000; Niinistö et al., 2004; Wu et al., 2011). Recommendations have been made to focus on precipitation manipulations carried out either by wetting or drying and establishing those experiments in mostly underrepresented forest ecosystems (Wu et al., 2011). Methanotrophs are known to be more sensitive to soil drying than methanogens (Ebrahimi and Or, 2018; Megonigal and Guenther, 2008). Since the processes and conditions that change mineral soils from CH4 sink to a source are not sufficiently well understood, direct laboratory measurements of CH4 formation in different soil layers under controlled temperature and moisture conditions are needed to explain the processes in mineral soil in greater detail.
In this study, changes in forest floor CH4 fluxes were assessed with an irrigation experiment during the growing period in a boreal upland forest in Kenttärova in northern Finland over 2 years. Kenttärova was chosen as the study site due to significant soil CH4 emissions detected after a long period of abundant precipitation in 2011 by Lohila et al. (2016). In addition, CH4 production and oxidation potentials were determined in different soil layers at flux measurement points. Finally, a laboratory microcosm experiment was used to investigate the conditions (temperature, moisture) needed to initialize CH4 production from the upland soil. The aims of this study were: (1) to find if the irrigation has any impact on the soil CH4 flux and oxidation and production potentials; (2) to find which soil layers are most significant for CH4 production and oxidation; and (3) to find the optimal conditions and key controlling factors for upland soil CH4 production and oxidation. We hypothesized that: (1) wet conditions prevailing for one or two summers could be seen in the response of microbial populations so that at the irrigated plot, the potential CH4 oxidation would be smaller and at least short production episodes could be detected in the latter part of the summer either after both summers or at least after the second wet summer; (2) highest CH4 oxidation potential are found in the surface soils while the maximum production potentials are found in the deeper layers; and (3) both wet conditions and fresh organic carbon are needed to create conditions suitable for CH4 production in podzolic forest soil.
2.1 Study site
The study was carried out at the Kenttärova forest (67∘59.237′ N, 24∘14.579′ E) in the Kittilä municipality in Finland at the transition zone of the northern-boreal and subarctic zones (Fig. 1). The site is located on a hilltop plateau with an approximate elevation of 347 m above sea level and 60 m above the surrounding plains (Aurela et al., 2015). The study site has climatic and vegetational characteristics typical for a northern-boreal environment. The long-term (1981–2010) annual temperature and precipitation within the area are −1.0 ∘C and 521 mm, respectively, with long-term averages in January and July being −14 and 14 ∘C (Pirinen et al., 2012). The maximum snow depth (average peak: 73 cm) is typically observed in late March; the median end date of snowmelt is 14 May and snow cover start date 24 October, respectively (Lohila et al., 2015). The soil type is podzol with glacial till as soil parent material (Aurela et al., 2015). Typical of the region and soil type, the site represents Hylocomium-Myrtillus type (HMT; Cajander, 1926; Ylläsjärvi and Kuuluvainen, 2009), Picea abies being the dominant tree species mixed with a variety of some deciduous trees such as Betula pubescens, Populus tremula, and Salix caprea. The forest floor vegetation at Kenttärova consists primarily of forest shrubs, such as Vaccinium myrtillus, Empetrum nigrum, and Vaccinium vitis-idaea, and a continuous and vigorous feather moss cover of Pleurozium schreberi, Hylocomium splendens, and Dicranum polysetum with sporadic occurrences of lichens (Aurela et al., 2015). The dominant height of the uneven-aged (1–250 years) tree stand reached approximately 15 m while the heights of individual spruce trees varied greatly. Some of the birches at Kenttärova were logged for firewood in the 1960s, but since then the forest has grown without human disturbances (Aurela et al., 2015).
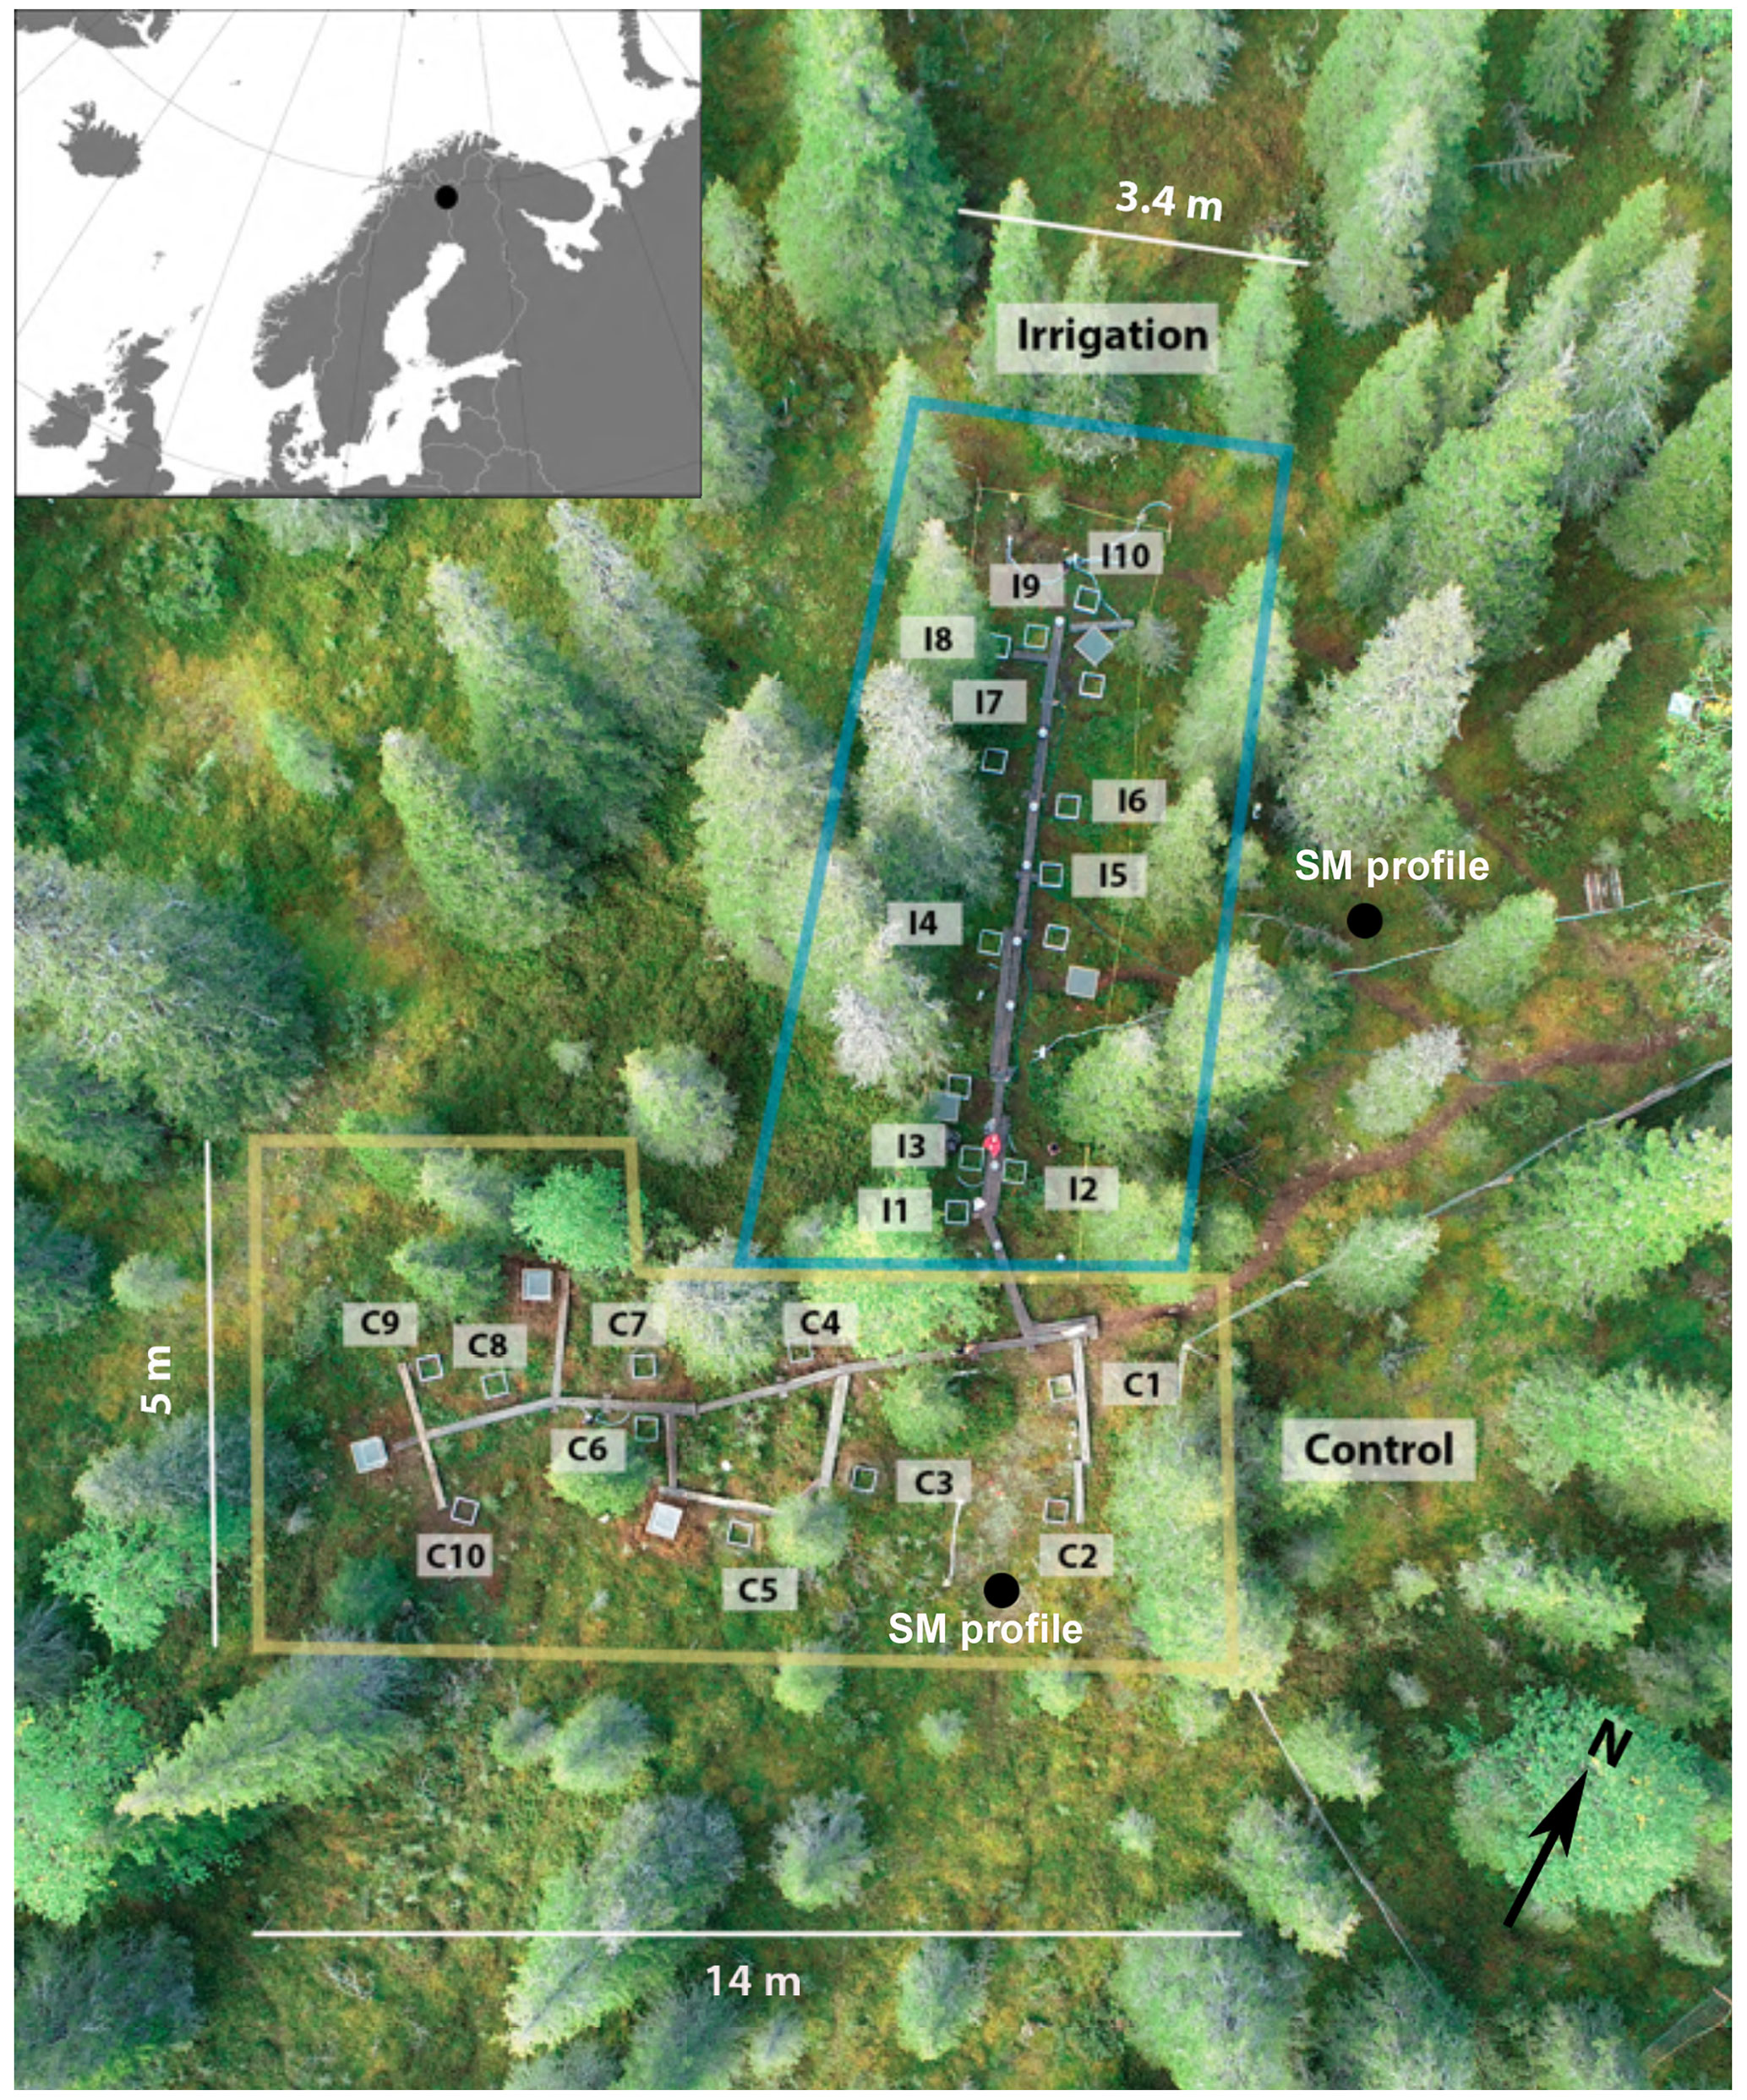
Figure 1Experimental setup and location of the study site. Aerial image by Bastian Steinhoff-Knopp (Leibniz University Hannover, September 2018).
2.2 Experimental setup
For examining causal relationships between CH4 flux and soil moisture and temperature, the field study included two plots: irrigation (Si) and control (Sc) without irrigation treatment (Fig. 1). The surface areas of Sc and Si were approximately 280 and 120 m2, respectively. Both plots included 10 measurement points. Measurement points were assigned somewhat randomly in both plots, with the aim to represent as similar vegetational, topographical, and sun aspect characteristics as possible. Both the Sc and Si and measurement points were connected with wooden boardwalks to minimize soil and vegetation disturbance from trampling.
Soil moisture was manipulated by irrigating part of the experimental area with two water sprinklers. The irrigation periods were 28 May to 7 September 2018 and 6 June to 29 August 2019. The sprinklers were set in the plot so that the irrigated water would evenly reach each measurement point. The irrigated area in practice reached approximately 118 m2 with 3–5.5 m width and 10–21 m length, depending on the wind conditions. Tap water was transported to the experimental site with a 1000 L IBC water tank. For ensuring a relatively even distribution of irrigated water in the plot, the spatial distribution of irrigation was checked with rain gauges (unit: mm) and plastic buckets. The amount of water in each bucket was later proportioned to the rain gauges (in mm) based on their dimensions. The precipitated water was measured after each irrigation from the end of May to mid-June 2018, after which the precipitated water was measured only when the weather was notably windy and/or natural rainfall occurred during the irrigation. It was estimated that 1000 L irrigation resulted on average to 11 mm and 2000 L to 21 mm of precipitation. The amount of rainfall added with irrigation was 11 mm on 2 d per week during 28 May to 1 June 2018, after which the amount was increased to 11 mm on 3 d per week during 7–18 June 2018 and eventually to 21 mm on 5 d per week during 20 June to 7 September 2018. In 2019, the plot was irrigated with 11 mm three times per week throughout the summer.
2.3 CH4 flux measurements and calculation
Chamber measurements started on 30 May 2017 on eight measurement points, of which four were located on Si and Sc, respectively. The flux measurements in 2017 were made to check possible differences between the experimental plots before starting the irrigation experiment in 2018. Six additional points were added to both Si and Sc, and the measurements from these points started on 29 May 2018. The measurements were made mainly between June and September every 2 weeks in 2017 and weekly in 2018 and 2019. The measurements ended on 19 September 2019.
CH4 fluxes were measured with 5 min closure time on the forest floor by the closed-chamber system with an opaque rectangular chamber (60 × 60 × 20 cm, length × width × height). The chamber included a fan to mix the air inside the chamber and a vent tube to prevent pressure differences between the chamber headspace and the atmosphere. Also, chamber headspace temperature was recorded with HOBO Pendant Temperature Data Logger (Onset Computer Corporation, MA, USA). The bottom of the chamber edges had a foam layer to prevent leakage between the collar and the chamber. All the measurement points had metal collars (58 × 58 × 30 cm, length × width × height) installed about 2 cm deep into the soil. CH4 and water vapor (H2O) mixing ratios were measured with G2301 and G1301-m (both from Picarro Inc., CA, USA) before and after 28 June 2018, respectively. The gas analyzer was located inside a cabin about 20 m away from the measurement point. The gas sample from inside the chamber was transported to the analyzer by 20 m long tubing (inner diameter 3.1 mm, Bevaline IV) with a 1 L min−1 flow rate where the mixing ratio was sampled every 3–4 s. The sampled gas was not returned to the chamber, which causes underpressure inside the chamber and underestimating the flux estimation. Because the chambers had a vent tube, we corrected the leakage with an assumption that the underpressure consisted of ambient air.
CH4 fluxes were calculated as:
where is the concentration change over time from an exponential model (e.g., Korkiakoski et al., 2017) at the beginning of the closure, M is the molecular mass of CH4 or N2O (16.04 and 44.01 g mol−1, respectively), P is air pressure, R is the universal gas constant (8.314 J mol−1 K−1), T is the mean chamber headspace temperature during the closure, and V is the air volume of the chamber and the collar, and A is the base area of the chamber or collar. The snow depth and the height of mosses and other vegetation in the chamber headspace volume were taken into account, ignoring the pore space in the soil and snow. The height of the vegetation was measured once a summer. The vegetation height was assumed to remain constant for that year.
When calculating the CH4 balances, measured CH4 fluxes were assumed to be daily mean fluxes. The gaps in the data were filled by linear interpolation. To avoid a biased 2019 balance estimate for point I1, the CH4 emission peak observed on 27 June 2019 was ignored when calculating the balance.
The micrometeorological sign convention is used throughout the paper: a positive flux indicates a flux from the ecosystem to the atmosphere (net emission), and a negative flux indicates a flux from the atmosphere into the ecosystem (net uptake).
2.4 CH4 production and oxidation potential measurements
Samples for the potential CH4 production and oxidation were taken on 23 August 2018 and 26 August 2019. Six composite samples were collected from both Si and Sc next to the chamber collars. Composite soil samples were combined from three to five core samples taken by soil auger separating four soil horizons: the organic layer without vegetation (O) and the three mineral soil layers below (zone of eluviation, i.e., leaching layer, E; zone of illuviation, i.e., enrichment layer, I; and C-horizon representing the bottom layer, C). Samples were kept at 4 ∘C during the shipment into the lab and before analyses. The mean depths of the soil layers were 5.7, 10.5, 18.9, and 32.3 cm, while the mean thicknesses were 5.7, 4.8, 8.4, and 13.4 cm for the O, E, I, and C layers, respectively. The layer depths and thicknesses were determined from six spots inside the experimental area.
Soil moisture and organic matter contents of the samples were determined with a TGA analyzer (LECO TGA-701, Leco Corp., MI, USA) with the standard method (ISO11465), which measures weight loss as a function of temperature in a controlled environment. Soil pH was determined from methane oxidation bottles after measurement by increasing the ratio of 1 : 3 of deionized H2O and measuring them after 24 h. Average soil pH, soil moisture, and organic matter contents for the 2018 and 2019 samples are presented in Table S1 in the Supplement. Total nutrients and C and N contents were determined from soil samples taken in 2018 with standard methods (ISO11466, 10694, and 13878). Samples for the total nutrients were digested by the closed wet HNO3-HCl digestion method in a microwave (CEM MDS 2000), and the extract was analyzed by iCAP 6500 DUO ICP-emission spectrometer (Thermo Fisher Scientific, MA, USA). Total C and N were measured from sieved and air-dried samples on a CN analyzer (Leco-TruMac, Leco Corp., MI, USA). Total nutrient, C, and N contents for the year 2018 samples are shown in Table S2 in the Supplement.
Fresh sieved soil (with 2 mm mesh size) was placed into 120 mL sterile incubation bottles with a standardized volume-based measuring scoop (20 mL), and 10 ppm of CH4 were added as a substrate into the bottles for determining potential CH4 oxidation rates. Oxidation was measured by gas chromatograph (GC) for 24 h. Two volumes of deionized H2O were added into production potential bottles and incubated two times with pure N2 gas to remove oxygen and create anoxic conditions. Production bottles were measured by GC first twice, and then once, a week for 42 d to detect productions. Potential rates were calculated from the linear part of the curve showing the decrease or increase in CH4 concentrations in time. The final potential rates are presented as nmol CH4 g−1 (dry mass of soil) d−1.
2.5 Microcosm experiment
A microcosm experiment was designed to determine the conditions (temperature and moisture) that are needed to initialize the CH4 production from the soil. For the experiment, soil profile samples were taken from the pit next to the Si. Artificial soil profiles were constructed into the plastic jars (volume of 1.6 L), including the vegetation and organic layer and two mineral soils layers (leaching and enrichment layers). Half of the jar volume was left empty for headspace measurements. Jars were placed into two different growth chambers (Binder KBW, Tuttlingen, Germany) with two different temperatures at 15 and 25 ∘C. Both temperature conditions had three replicate jars, including controls without moisture increase (C) and two different levels of moisture increase, lower (M1) and higher (M2) moisture. The experiment also included separate triplicate jars with glucose added into controls (Cglu) and moisture increase (M1glu, M2glu) treatments. Glucose was added at the beginning of the measurements to simulate the effect of fresh, simple C source for microbes such as exist in root exudates. We added 14 mL of 1 M glucose solution into each jar so that they had two times more C that is approximated to be bound into microbial biomass in forest soils to see the possible effect. Two moisture conditions for the jars were adjusted to be different enough to detect changes between the treatments. Average final moisture conditions were adjusted so that in the jars, the lower moisture content (M1) was about 50 % and the higher content (M2) 80 % and the control jars (C) represented the average moisture content in the soil, which was about 30 %–35 % (Table S1).
Light conditions in the growth chambers were adjusted to mimic the natural light conditions at the end of August in northern Finland (about 15 h light and 9 h dark). Every week, the jars were switched from one growth chamber to another to avoid the differences due to features in the chamber itself. Moisture conditions were kept constant by weighing the jars twice a week and adding the water to minimize the effect of evaporation. CH4 fluxes were measured from the headspace of the jars once a week with LI-7810 (LI-COR Biosciences, NE, USA). The fluxes for the 5-week measurement period were calculated from the exponential model the same way as described in Sect. 2.3.
2.6 Soil temperature and moisture measurements
Multiple soil temperature (ST) and moisture (SM) sensors were used to record said variables next to the CH4 flux measurement points. ST was measured with 10 HOBO Pendant data loggers (Onset Computer Corporation, MA, USA) and SM with 9 EC5 Soil Moisture Smart Sensor (Onset Computer Corporation, MA, USA) with HOBO U30 USB Weather Station Data Logger (Onset Computer Corporation, MA, USA). In addition, 7 Soil Scout online sensors (Soil Scout Ltd, Helsinki, Finland) were used to measure both ST and SM. The time intervals for ST logging were 20 and 30 min for Soil Scouts and HOBO sensors, respectively. All the sensors were installed during 23 May to 6 June 2018 5 cm below the soil surface in the mineral soil layer next to the collar and covered carefully with soil. The measurements continued until the experiment ended, except the SM measurements made with EC5 sensors, which broke down at the beginning of June 2019. The locations of the installed sensors are listed in Table S3 in the Supplement.
SM was also measured from two different locations about 10 m distance from the Sc and Si. In both locations, SM was measured at 5 and 20 cm depths with ThetaProbe soil moisture sensor (type ML2, Delta-T Devices Ltd, Cambridge, UK). In addition, ST was measured next to one of the soil moisture sensors at 5 cm depth (PT100, PT4T, Nokeval Oy, Nokia, Finland).
2.7 Statistical methods
Fluxes between the different moisture levels and glucose addition in the microcosm experiment were compared by using the one-way analysis of variance (ANOVA) by using aov command in R programming language (R Core Team, 2021, v4.0.5). The same method was used for comparing the CH4 production and oxidation potentials between the plots and years. In the microcosm experiment, the glucose addition was compared only with the sample without added glucose on the same moisture level and temperature. The effect of three different moisture levels was compared separately for added glucose and without added glucose groups by using Tukey's honestly significant difference (HSD) test by “multcomp” package in R (v1.4-14; Hothorn et al., 2008).
Linear mixed-effect model with Tukey's HSD post hoc test was used for testing the statistical significance of differences in CH4 fluxes between the Si and Sc. The linear mixed-effect model was carried out with the R programming language using “lme4” package (Bates et al., 2015). The chamber points were treated as a random effect. The normality of the model residuals was visually checked using the quantile–quantile plot (Q–Q plot) method.
The linear mixed-effect model was also used for finding the most significant variables affecting CH4 fluxes (). The variables used in the modeling were: 5 cm soil temperature (ST) and moisture (SM), CH4 oxidation potential (OP, where x is one of the O, E, I soil layers or the mean of all layers), CH4 production potential (PP, where x is one of the O, E, I soil layers or the mean), and carbon and nitrogen content (CCx or NCx, where x is one of the O, E, I soil layers or the mean). The model runs were divided into three parts: using mean values of all soil layers, using only values of a specific soil layer, and combining values of multiple different soil layers. Even though SM and temperature were only measured at 5 cm depth, they were included in all the model runs. Measurement points were always treated as a random effect (u). The best model was selected by using stepwise selection. We started with a full model and reduced the number of variables one by one using the Akaike information criterion (AIC), which was conducted using the drop1 function in R. The initial model in all but the combination model run was:
where e is the model error, β0 is the model's intercept, and parameters from β1 to β7 are the regression coefficients of the explaining variables. We used a 95 % confidence interval (p<0.05) to determine whether the results were statistically significant.
Pearson correlation matrix including potential CH4 production and oxidation rates and soil data (SM, organic matter, pH, nutrient elements) were created using commands rcor and corrplot in R. Significance level for correlation coefficients between variables was p=0.01. In addition, simple linear regressions at 95 % confidence level with Pearson's correlation coefficient and smoothed marginal histograms were used for primary correlation analyses between CH4 flux and SM and CH4 flux and ST using “ggpubr” (v0.4.0; Kassambara, 2020) and “cowplot” (v1.1.1; Wilke, 2020) packages in R.
2.8 Meteorological conditions
The mean air temperatures in the May–September period were 8.0, 11.0, and 8.9 ∘C for 2017–2019. Compared with the long-term (1981–2010; Pirinen et al., 2012) mean temperature of the same period (9.3 ∘C), 2017 was cooler and 2018 warmer than the average, respectively. In 2019, the monthly temperatures during the measurement period were close to long-term averages (Table S4 in the Supplement). The year 2017 was the coolest year of the measurement period, primarily attributed to a much cooler May and a slightly cooler August than other years (Table S4). On the other hand, 2018 was the warmest year, primarily due to a much warmer May and July. July 2018 was exceptionally warm (18.8 ∘C) compared with other years (2017: 13.0 ∘C; 2019: 12.6 ∘C) and long-term mean (13.9 ∘C).
The precipitation sums in the May to September period were higher than the long-term average (296 mm) in 2017 (335 mm) and 2019 (357 mm), but about the same in 2018 (293 mm). However, there were notable differences when inspecting monthly precipitation sums. In 2017, May, June, and September were drier than in 2018 and 2019 (Table S4). On the other hand, in July 2017, the amount of precipitation (129 mm) was about 100 mm higher than in 2018 (28 mm) and 2019 (33 mm). Therefore, 2017 was markedly wetter compared with the long-term average in July (75 mm). On the other hand, 2018 and 2019 were markedly drier than on average. In 2019, excluding July, the monthly precipitation sums were very similar and higher than the long-term mean. The snow cover melted on 9 June 2017, 21 May 2018, and 26 May 2019. In 2017 and 2019, the first measurement day was made when snow was still on the ground (Fig. 2).
The meteorological data reported in this section was observed by an official weather station (Kittilä Kenttärova; ID: 101987) maintained by the Finnish Meteorological Institute and it was located about 80 m northeast from the experimental site.
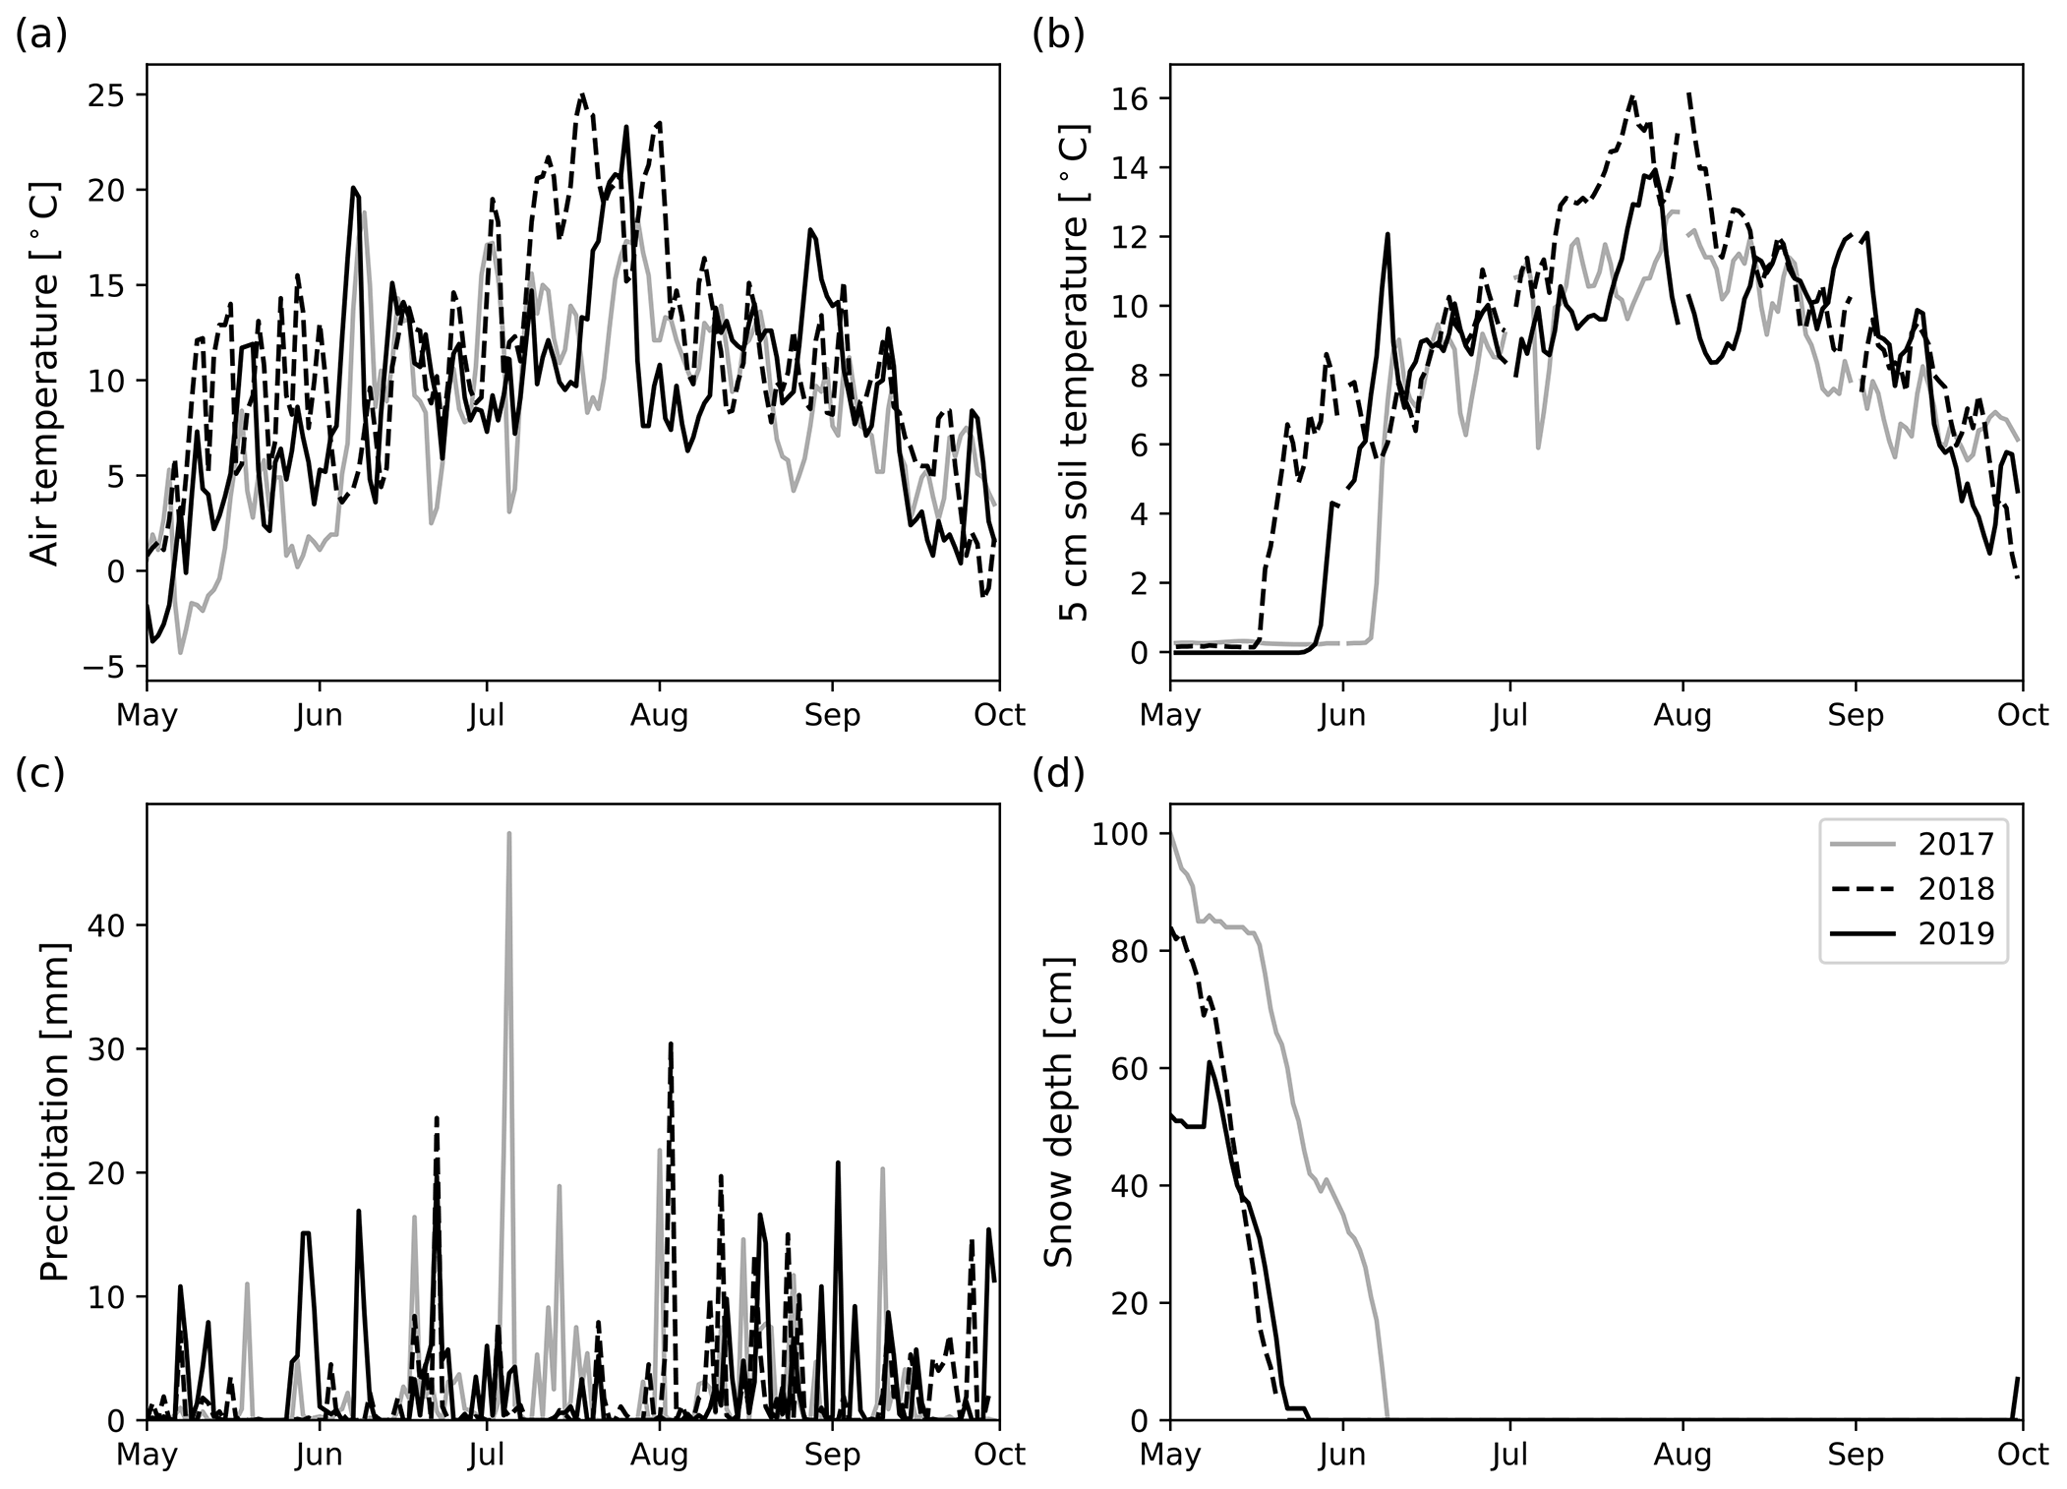
Figure 2Daily mean air temperature (a), daily mean 5 cm soil temperature (b), daily precipitation sum (c), and daily snow depth (d) measured at Kenttärova weather station in May to September 2017–2019.
3.1 Impact of irrigation on soil moisture and temperature
The growing seasons of the study years (2018 and 2019) were generally dry, based on the soil moisture data collected in long-term pits near the experimental area (Fig. 3). While in 2019, the whole growing season was dry, in 2018, the driest month was July. On the other hand, August was relatively wet in terms of precipitation (Table S4), but after a severe drought, the high precipitation was not enough to increase the soil moisture to the same range observed in 2017. There were large differences in SM profiles (located outside the experimental area) between the years (Fig. 3). In 2017, 5 cm soil moisture (SM5 cm) mainly remained between 25 vol % and 35 vol %. Also, SM5 cm in 2019 was relatively stable, varying within 15 vol %–20 vol %, but it was markedly lower than in the other years, except in July 2018. SM5 cm in 2018 had much temporal variation. In May 2018, SM5 cm rose to 50 vol % but fell quickly to 25 vol % after the snow had melted. In July 2018, the SM5 cm fell quickly below 15 vol % and kept decreasing down to 12 vol % until the beginning of May 2019, after which it started recovering up to 25 vol % until the measurement period ended in September 2019. In terms of absolute values, 20 cm soil moisture (SM20 cm) did not differ between years compared with SM5 cm. In June, August, and September, the SM20 cm did not usually differ more than 3 vol % between the years. In May, the rapid increases and decreases in SM20 cm associated with snowmelt occurred at different strengths and times. In July, SM20 cm in 2017 was about 5 vol % higher than in the other years, but the first half of August 2019 was drier than the other years.
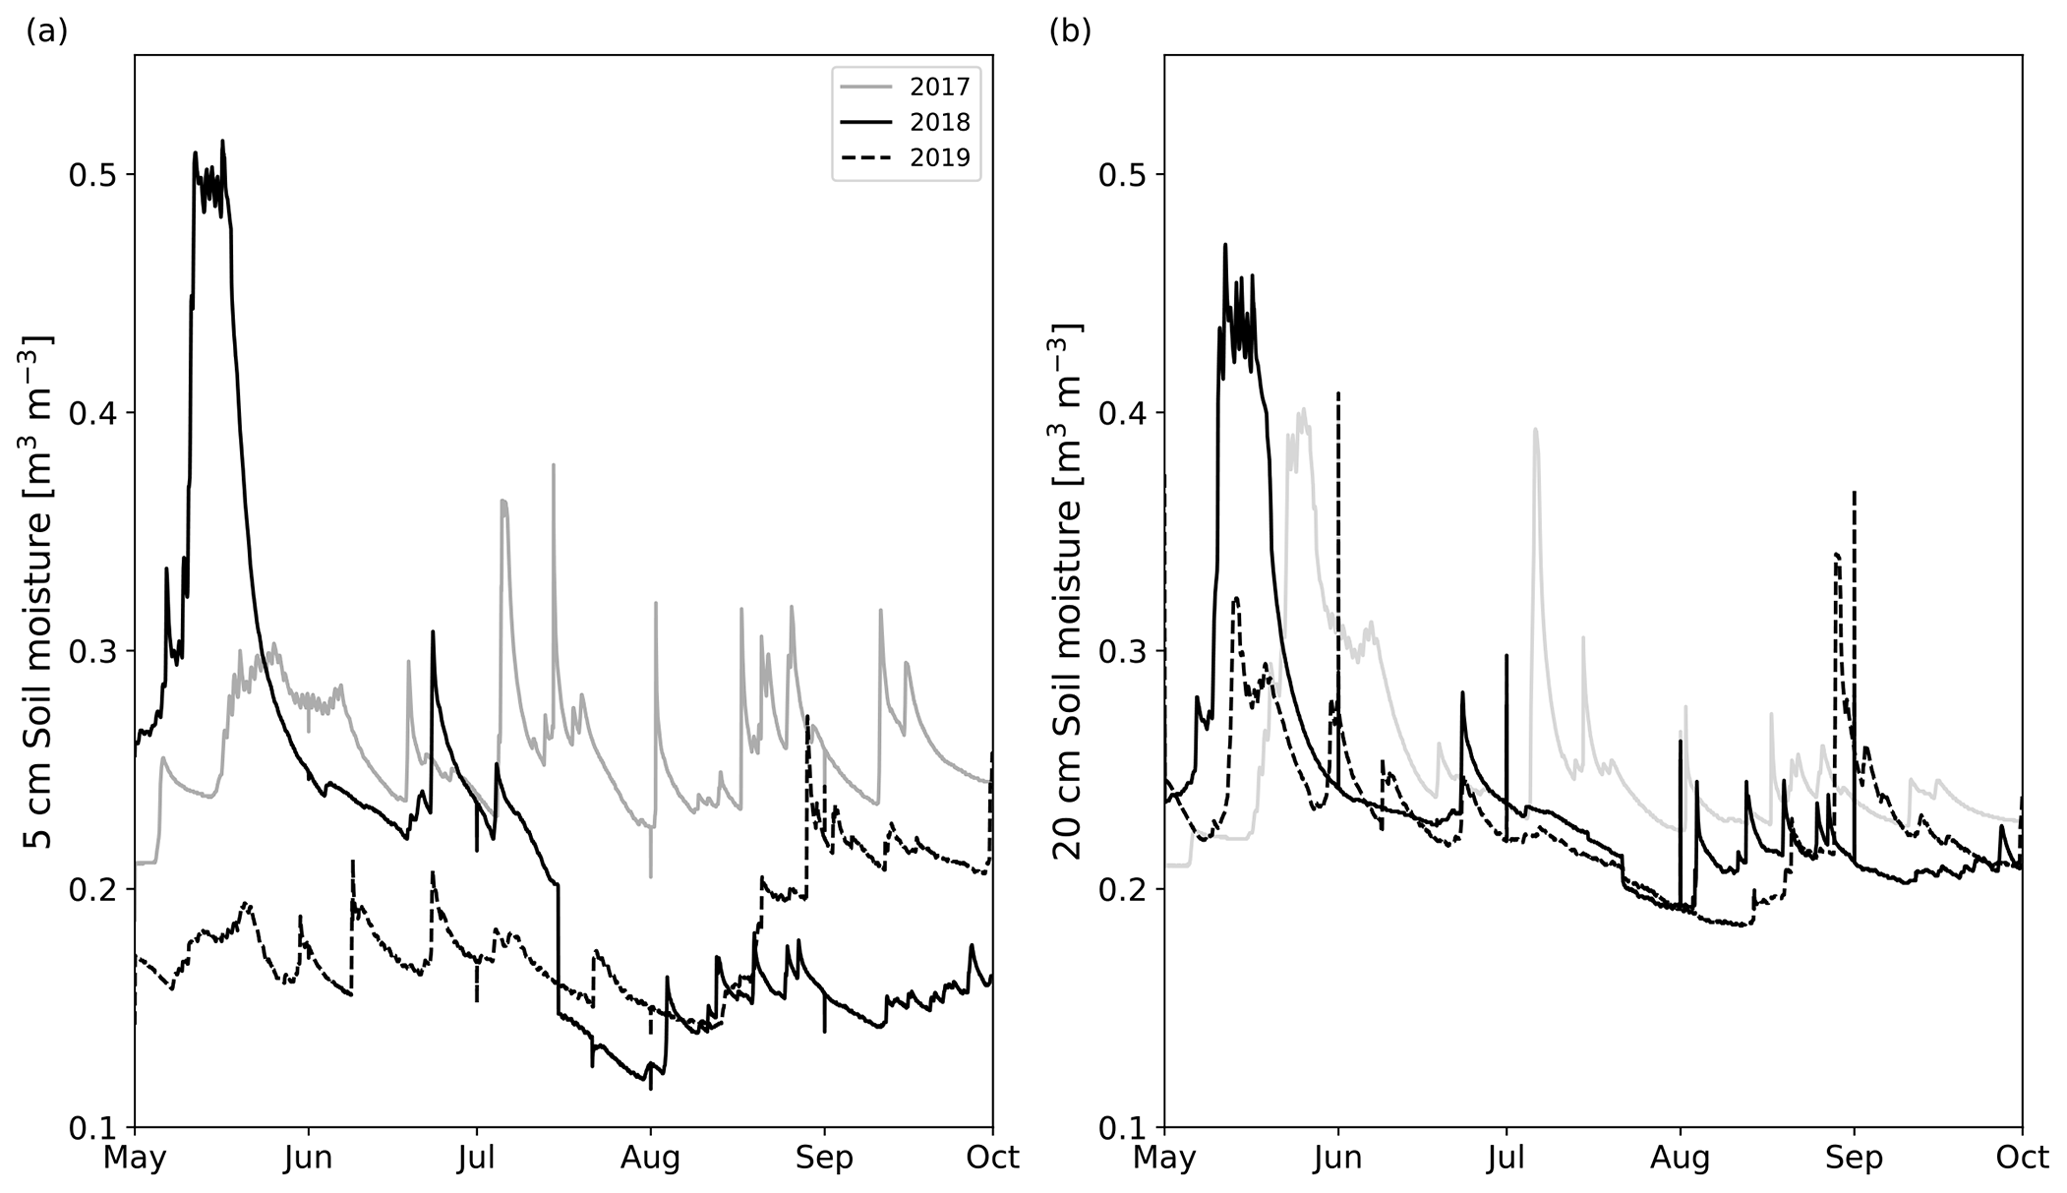
Figure 3The daily mean (a) 5 cm and (b) 20 cm soil moisture time series measured from two different locations outside the experimental area from May to October in 2017 (solid gray line), 2018 (solid black line), and 2019 (dashed black line).
At the experimental area, SM5 cm was on average 6.5 vol % lower at the Sc than at the Si in June to September 2018. SM5 cm in 2018 varied typically within 14 vol %–23 vol % and 6 vol %–14 vol % at the Si and Sc, respectively. However, one SM sensor measured about 10 vol % higher values than the other sensors at the Sc (Fig. 4). Also, at the beginning of August, SM5 cm increased at one of the measurement points by 5 vol %. SM5 cm remained on that higher level until the end of the measurement period in 2018. In 2019, SM5 cm at the Si remained within 15 vol %–18 vol %, except in August and September.
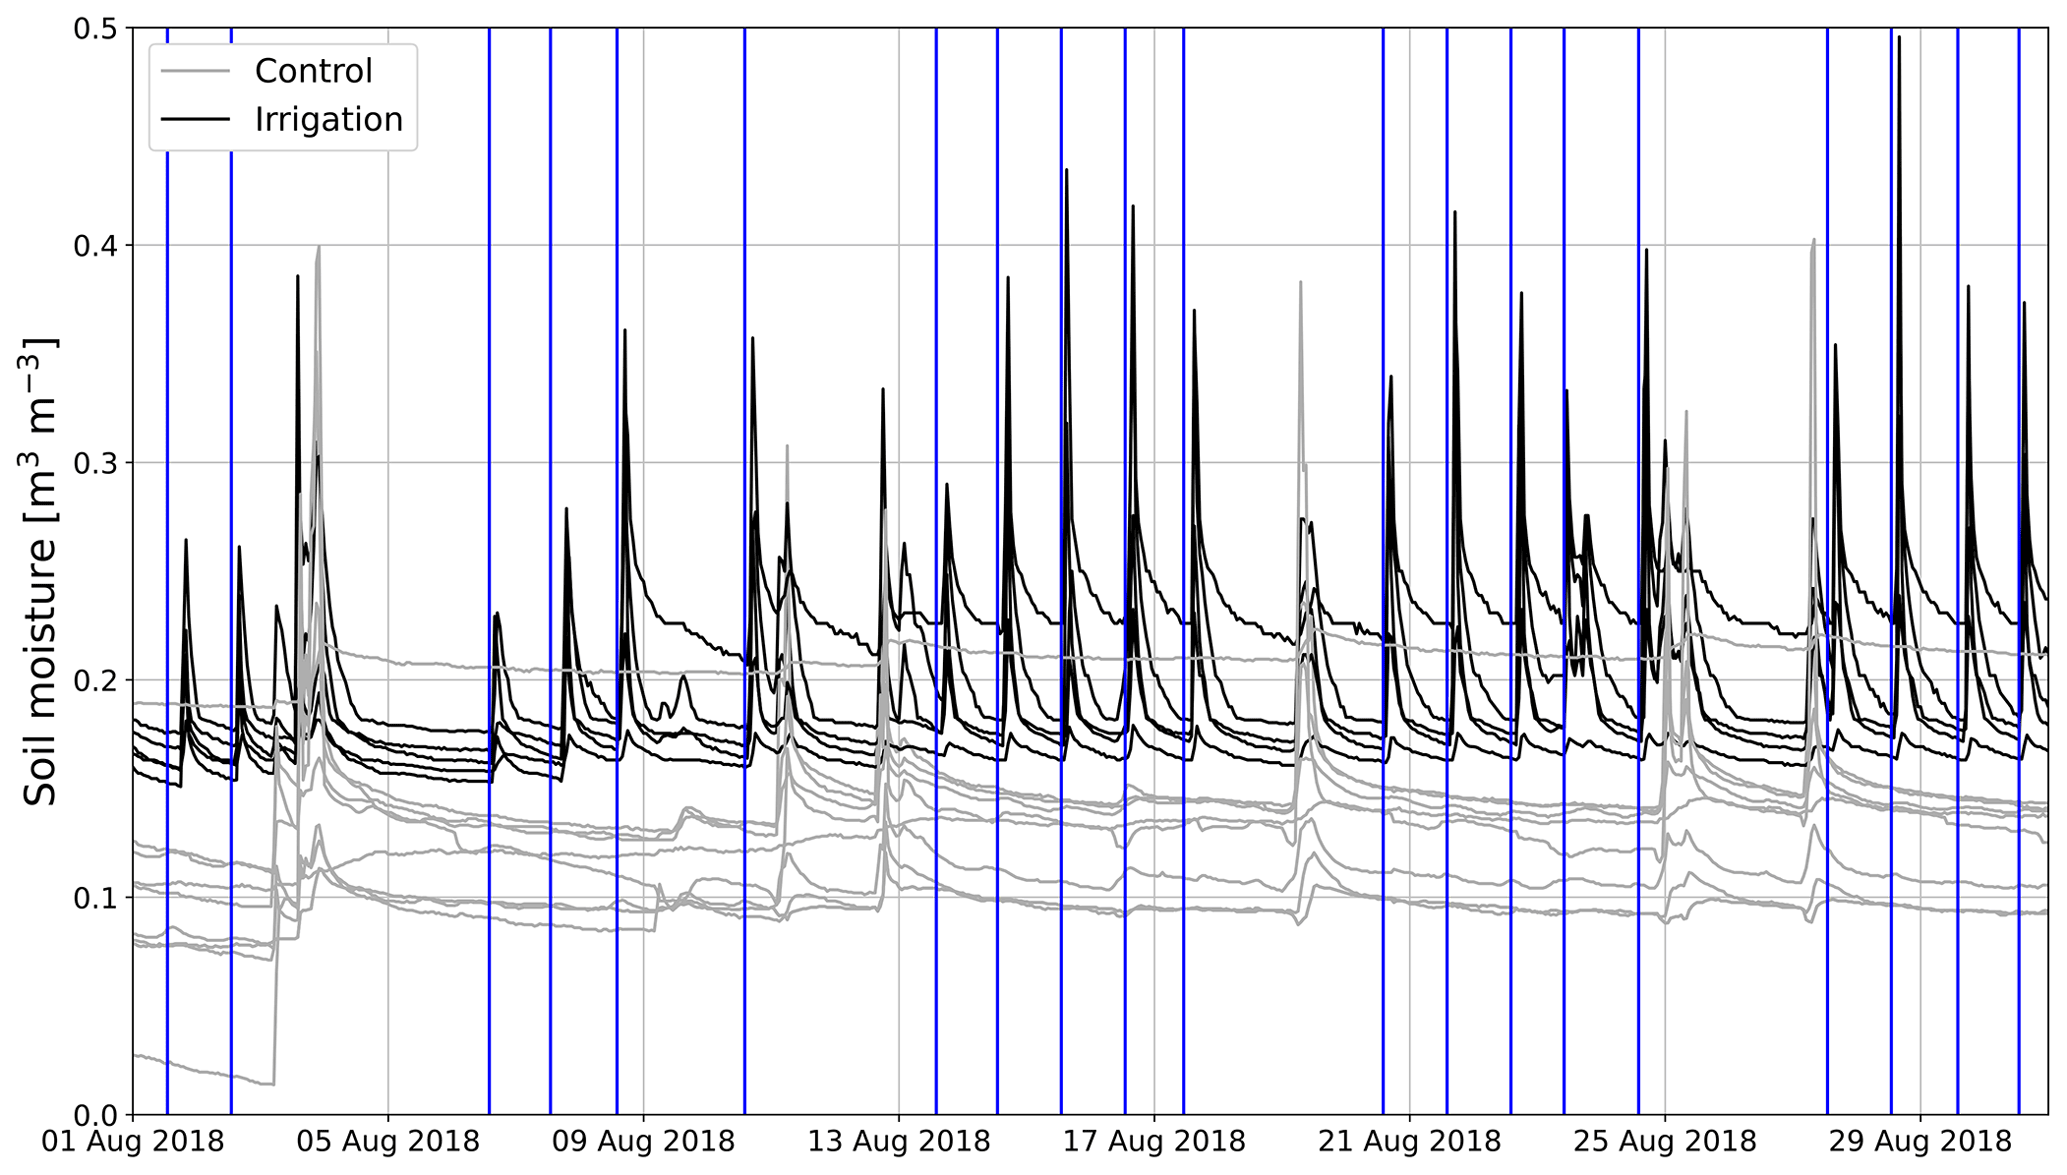
Figure 4Hourly mean soil moisture time series measured at control (gray) and irrigation (black) plots in August 2018. Vertical blue lines show the times when the irrigation plot was irrigated.
In 2018, irrigation was performed on weekdays, and during irrigation SM5 cm rose by 10 vol %–15 vol % (Fig. 4). However, the SM5 cm decreased fast and usually returned to the pre-irrigation level before the next irrigation 24 h later (Fig. 4). In 2019, the rise of 5 cm SM5 cm due to irrigation was usually between 2 vol % and 5 vol %.
The 5 cm daily mean soil temperatures (ST5 cm) were on average 0.7 ∘C higher at the Si compared with the Sc in June to September 2018 (Fig. 5). Also, spatial variation was higher at the Sc (Fig. 5). The biggest difference in daily mean ST5 cm between the plots was observed around mid-July 2018 when the ST5 cm at the Si was on average 2.0 ∘C higher than at the Sc. However, in 2019, the difference in daily mean ST5 cm between the plots was small, and the Si was only about 0.2 ∘C warmer on average than the Sc. Also, the maximum difference between the plots was about 0.6 ∘C, which occurred at the end of July and August.
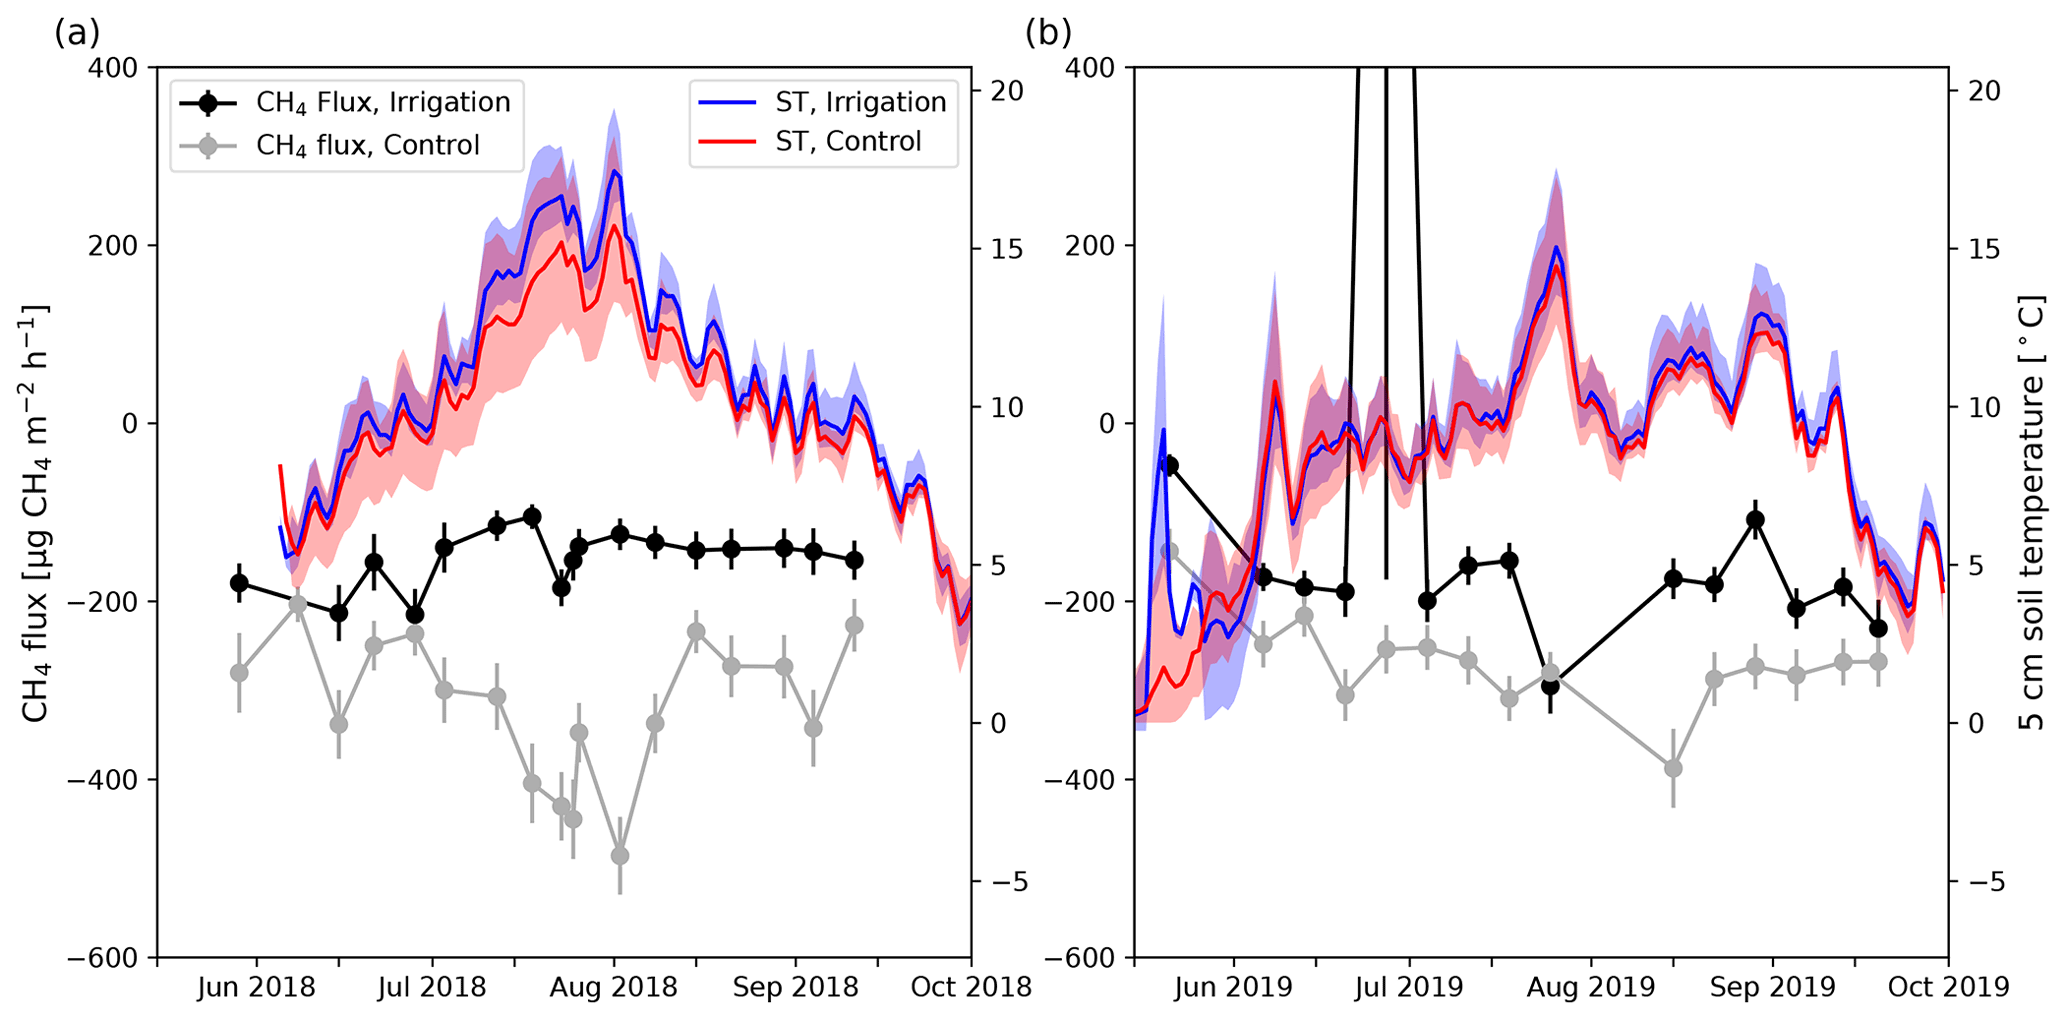
Figure 5Daily mean CH4 flux measured at the irrigated (black) and control (gray) plots in 2018 (a) and 2019 (b). The error bars show the standard error of the mean. Blue (irrigated) and red (control) lines represent daily mean 5 cm soil temperature (ST) and shading shows the minimum and maximum daily values measured by different sensors (irrigation: n=7; control: n=9).
3.2 The effect of irrigation on CH4 uptake
Before the irrigation experiment started, all the measured CH4 fluxes were negative, indicating CH4 uptake, and did not differ significantly between Sc and Si. In 2017, the fluxes were measured from four points at each plot and median fluxes (Sc: −220 µg CH4 m−2 h−1; Si: −230 µg CH4 m−2 h−1) and mean June to September CH4 balances were similar between the plots (Fig. 6). However, there was notable spatial variation between the points as the June to September CH4 balances varied between −950 and −470 mg CH4 m−2).
In 2018 and 2019, when irrigation started, the fluxes measured at the Si and Sc differed significantly from each other in terms of points where measurements had started already in 2017 (I2, I3, I4, I9, C1, C4, C6, C8; 2018: p<0.001; 2019: p=0.01). The mean summer CH4 uptake rates of these points in 2018 were 37 % larger and 15 % smaller than in 2017 at Sc and Si, respectively (Fig. 6; Table S5 in the Supplement). In 2019, the mean June to September balances (Sc: mg CH4 m−2; Si: mg CH4 m−2; Fig. 6; Table S5) remained at about the same level as in 2018 and the fluxes did not differ significantly from fluxes measured in 2018.
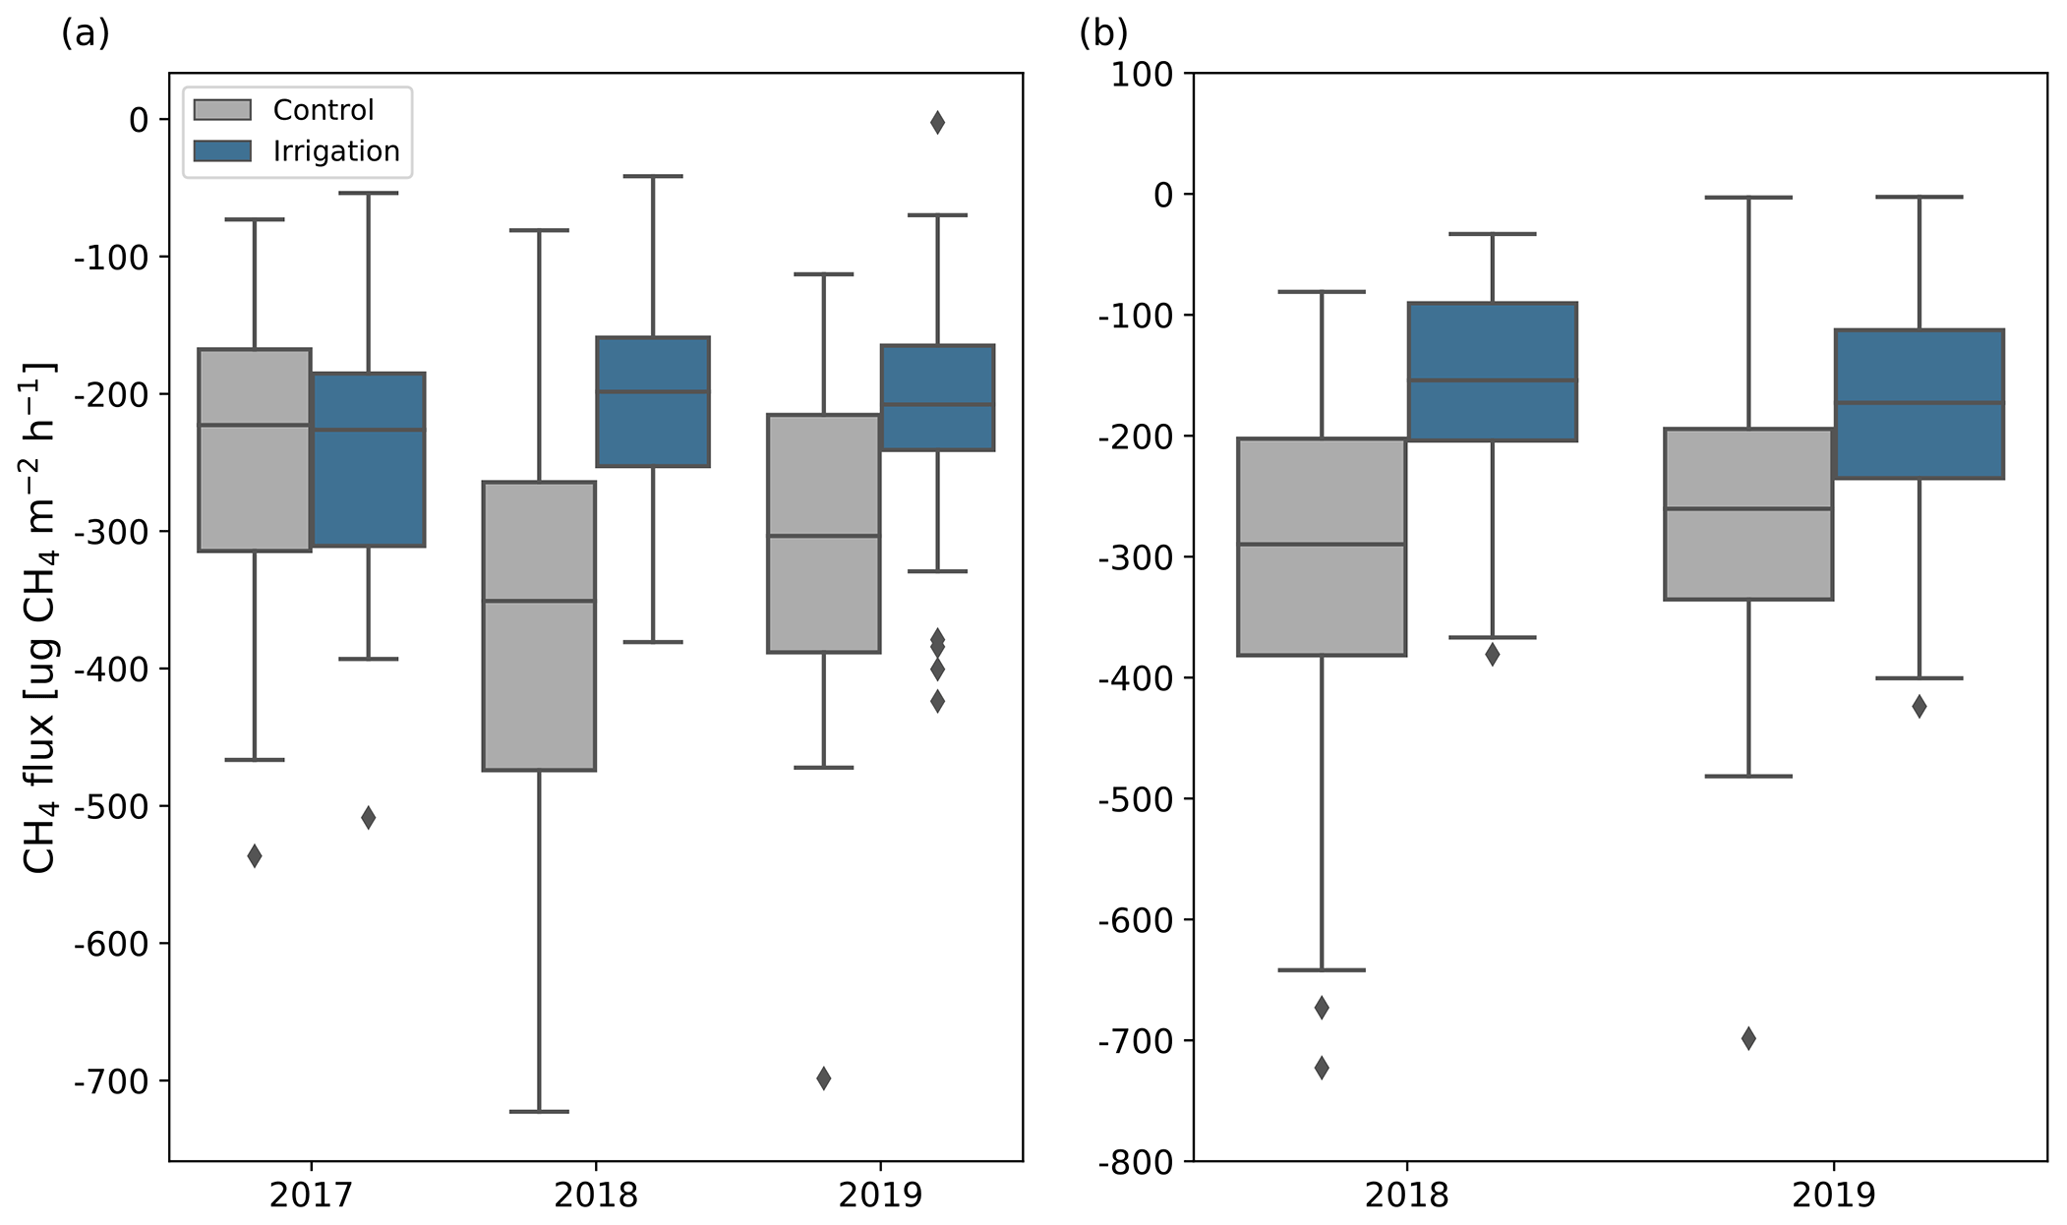
Figure 6CH4 fluxes measured by long-term (C1, C4, C6, C8, I2, I3, I4, I9) (a) and all (b) chamber points in May to September in different years. Positive flux values indicate net emission and negative values indicate net uptake. For comparison, the flux of the points located on the irrigated plot in 2018 and 2019 have been calculated already for 2017, even though the irrigation setup was established only in 2018. The boxes show the quartiles of the dataset and the horizontal line inside the boxes is the median flux. Whiskers show the range of the data, except for the points that are determined to be outliers, which are shown with black diamonds.
The median measured CH4 uptake rate (Fig. 6; Table S5) across all the measurement points at the Si (150 µg CH4 m−2 h−1) was 48 % lower than at the Sc (290 µg CH4 m−2 h−1) in 2018 and 35 % lower in 2019 (Si: 170 µg CH4 m−2 h−1; Sc: 260 µg CH4 m−2 h−1). The fluxes differed significantly between the plots in both years (p<0.001). All but one of the measured fluxes were negative, indicating CH4 uptake. One large CH4 emission pulse (18 200 µg CH4 m−2 h−1) was observed in point I1 on 27 June 2019. Similar differences were also observed in mean 4-month (June to September) CH4 balances (Table S5). There was lots of variation in fluxes between the measurement points. CH4 balances varied from −1280 to −480 mg CH4 m−2 at the Sc and from −740 to −180 mg CH4 m−2 at the Si in 2018. Some of the measurement points at the Si had higher CH4 uptake rates than some points located at the Sc, but on average CH4 uptake rates were noticeably larger at the Sc ( mg CH4 m−2) than at the Si ( mg CH4 m−2). In 2019, CH4 uptake rates increased in most of the points at the Si, averaging at mg CH4 m−2, but the balances remained mostly the same at the Sc (mean: mg CH4 m−2).
3.3 CH4 production and oxidation potentials
Oxidation potential rates were quite similar in all soil layers, except for the C layer where the rates were lower. Between the years, however, the rates differed as those in 2019 were generally higher and more variable than in 2018 (Fig. 7a, b). The most notable increase was detected in the organic layer, where the oxidation potential rates were mainly non-existent in 2018, but about 15 nmol CH4 g−1 d−1 in 2019 at both Si and Sc. However, the change was significant only at the Si (p=0.03). Oxidation rates were significantly (p=0.03) higher in 2019 (median: 22 nmol CH4 g−1 d−1) than in 2018 (median: 15 nmol CH4 g−1 d−1) also in the I layer at the Sc, but there was no significant difference in the same layer at the Si. There were no statistically significant differences between the years in any other soil layers at either plot. Comparing the soil layers between the plots revealed that the oxidation rates were significantly higher (p=0.01) in the C layer at the Sc than in Si in 2018. The rates were significantly higher (p<0.01) at the Sc in the I layer in 2019, but there were no other significant differences between the plots in other soil layers.

Figure 7CH4 oxidation (a, b) and production (c, d) potentials in different podzolic soil layers (organic layer, O, mean depth: 5.7 cm; leaching layer, E, mean depth: 10.5 cm; enrichment layer, I, mean depth: 18.9 cm; bottom layer, C, mean depth: 32.3 cm) in 2018 (a, c) and 2019 (b, d) (n=9). The boxes show the quartiles of the dataset and the vertical line inside the boxes is the median flux. Whiskers show the range of the data, except for the data that are determined to be outliers, which are shown with black diamonds.
The highest CH4 production potential rates occurred in the O layer and some production potential was observed in the E layer, while in the lowest soil layers, the production rates were negligible (Fig. 7c, d). At the Si, the production potential rates were significantly lower in 2019 than in 2018 in the O (p=0.04) and I (p=0.001) layers. At the Sc, the production rates differed significantly (p<0.02) only in the C layer, but the rates were negligible in both years. Comparing the production rates between the plots revealed that the rates were significantly (p<0.04) higher in the O layer at the Sc in 2019. A significant difference (p<0.01) between the plots was also found in the C layer in 2018.
Potential CH4 production rates in 2018 had strong positive Pearson correlation coefficients (ρ) with organic matter content (ρ=0.94), moisture content (ρ=0.90), and total N and C amounts (ρ=0.95 and 0.94, respectively) determined from the soil samples (Fig. S1a in the Supplement). Potential CH4 production rates in 2019 had a similar stronger positive correlation with organic matter (ρ=0.96) and moisture content (ρ=0.93; Fig. S1b in the Supplement).
3.4 Factors controlling field CH4 fluxes
Correlations between field CH4 flux and SM were nearly negligible (ρ<0.2) in both Si and Sc in both years (Fig. 8), with the exception of Si in 2019 with a ρ value of −0.5 (p<0.001). In both 2018 and 2019, correlation trends were weakly negative between CH4 flux and SM, except for Sc in 2018 with a weak positive correlation (ρ=0.17, p=0.07). In contrast, CH4 flux and ST had generally stronger correlations in both Si and Sc, the latter having the highest ρ values in both years (2018: ; 2019: ), only 2018, however, being statistically significant (p<0.001). Si showed differing correlation trends between years, 2018 having relatively weak positive (ρ=0.4, p=0.01) and 2019 almost negligible negative (, p=0.16) correlations.
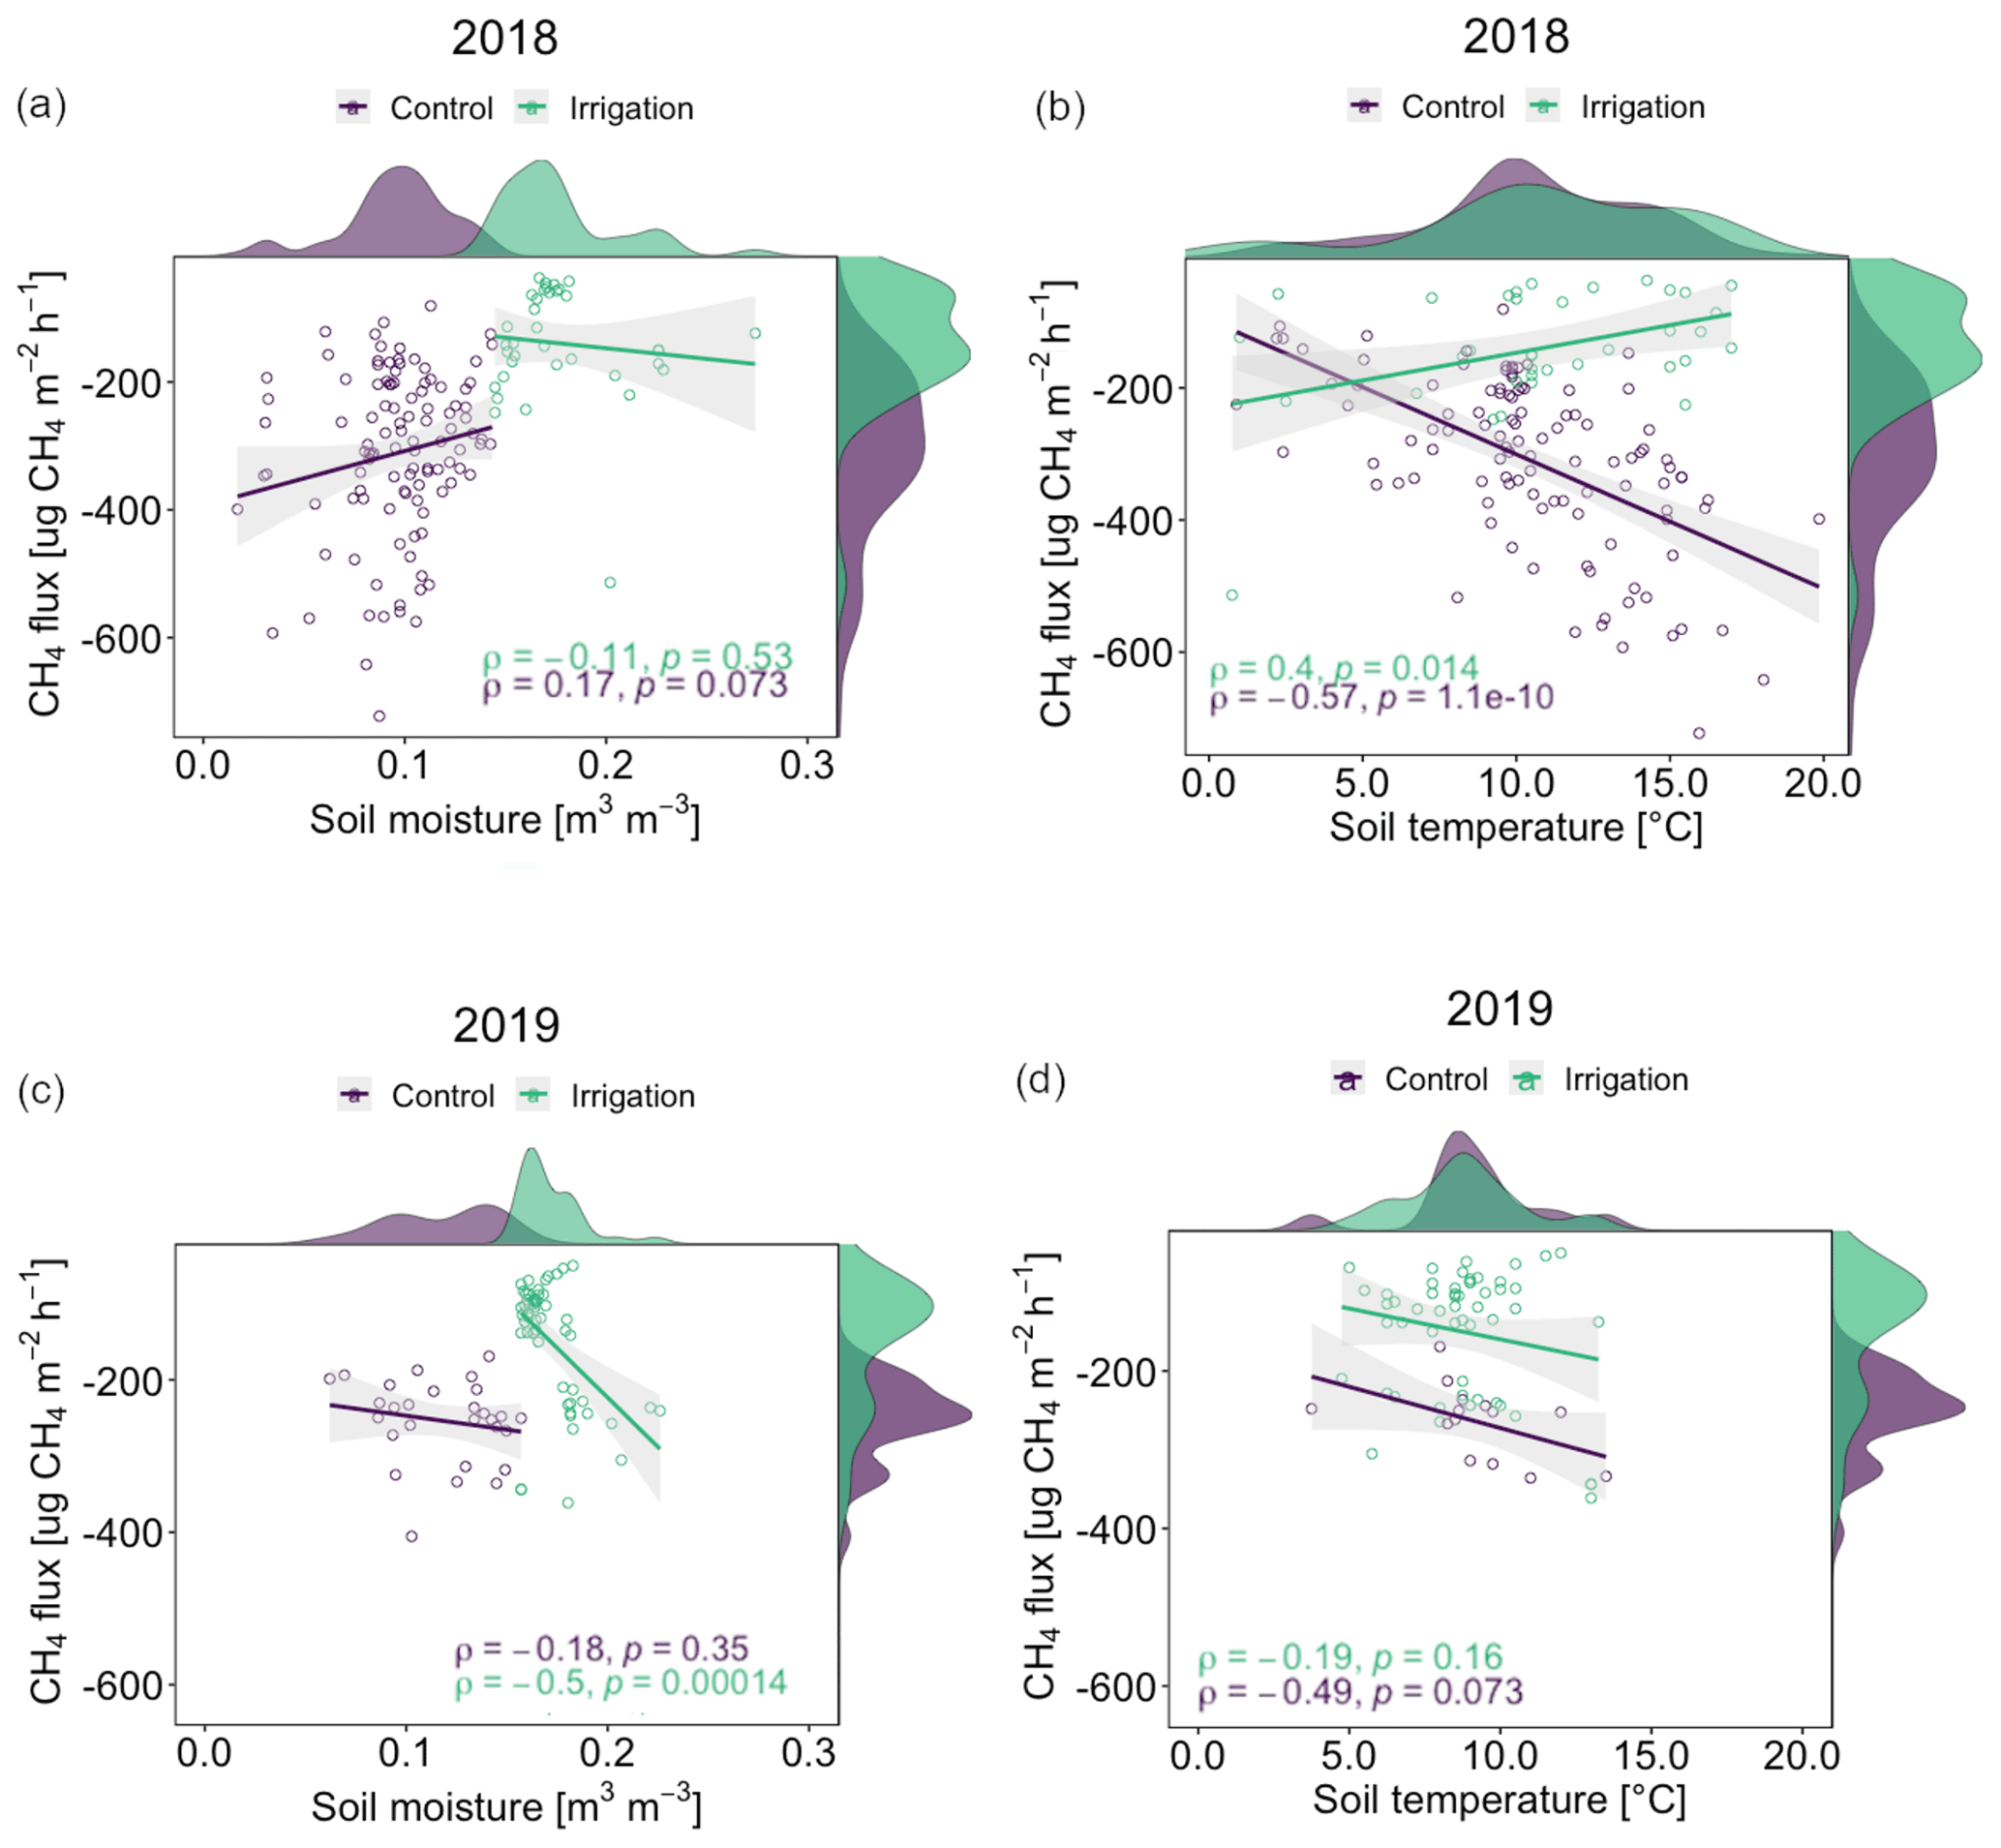
Figure 8Correlations (Pearson's coefficient, ρ) between soil moisture and CH4 flux (a, c) and soil temperature and CH4 flux (b, d) with smoothed frequency histograms in 2018 and 2019. The emission case of 27 June 2019 was removed from the data in the correlation analyses for more clear presentation.
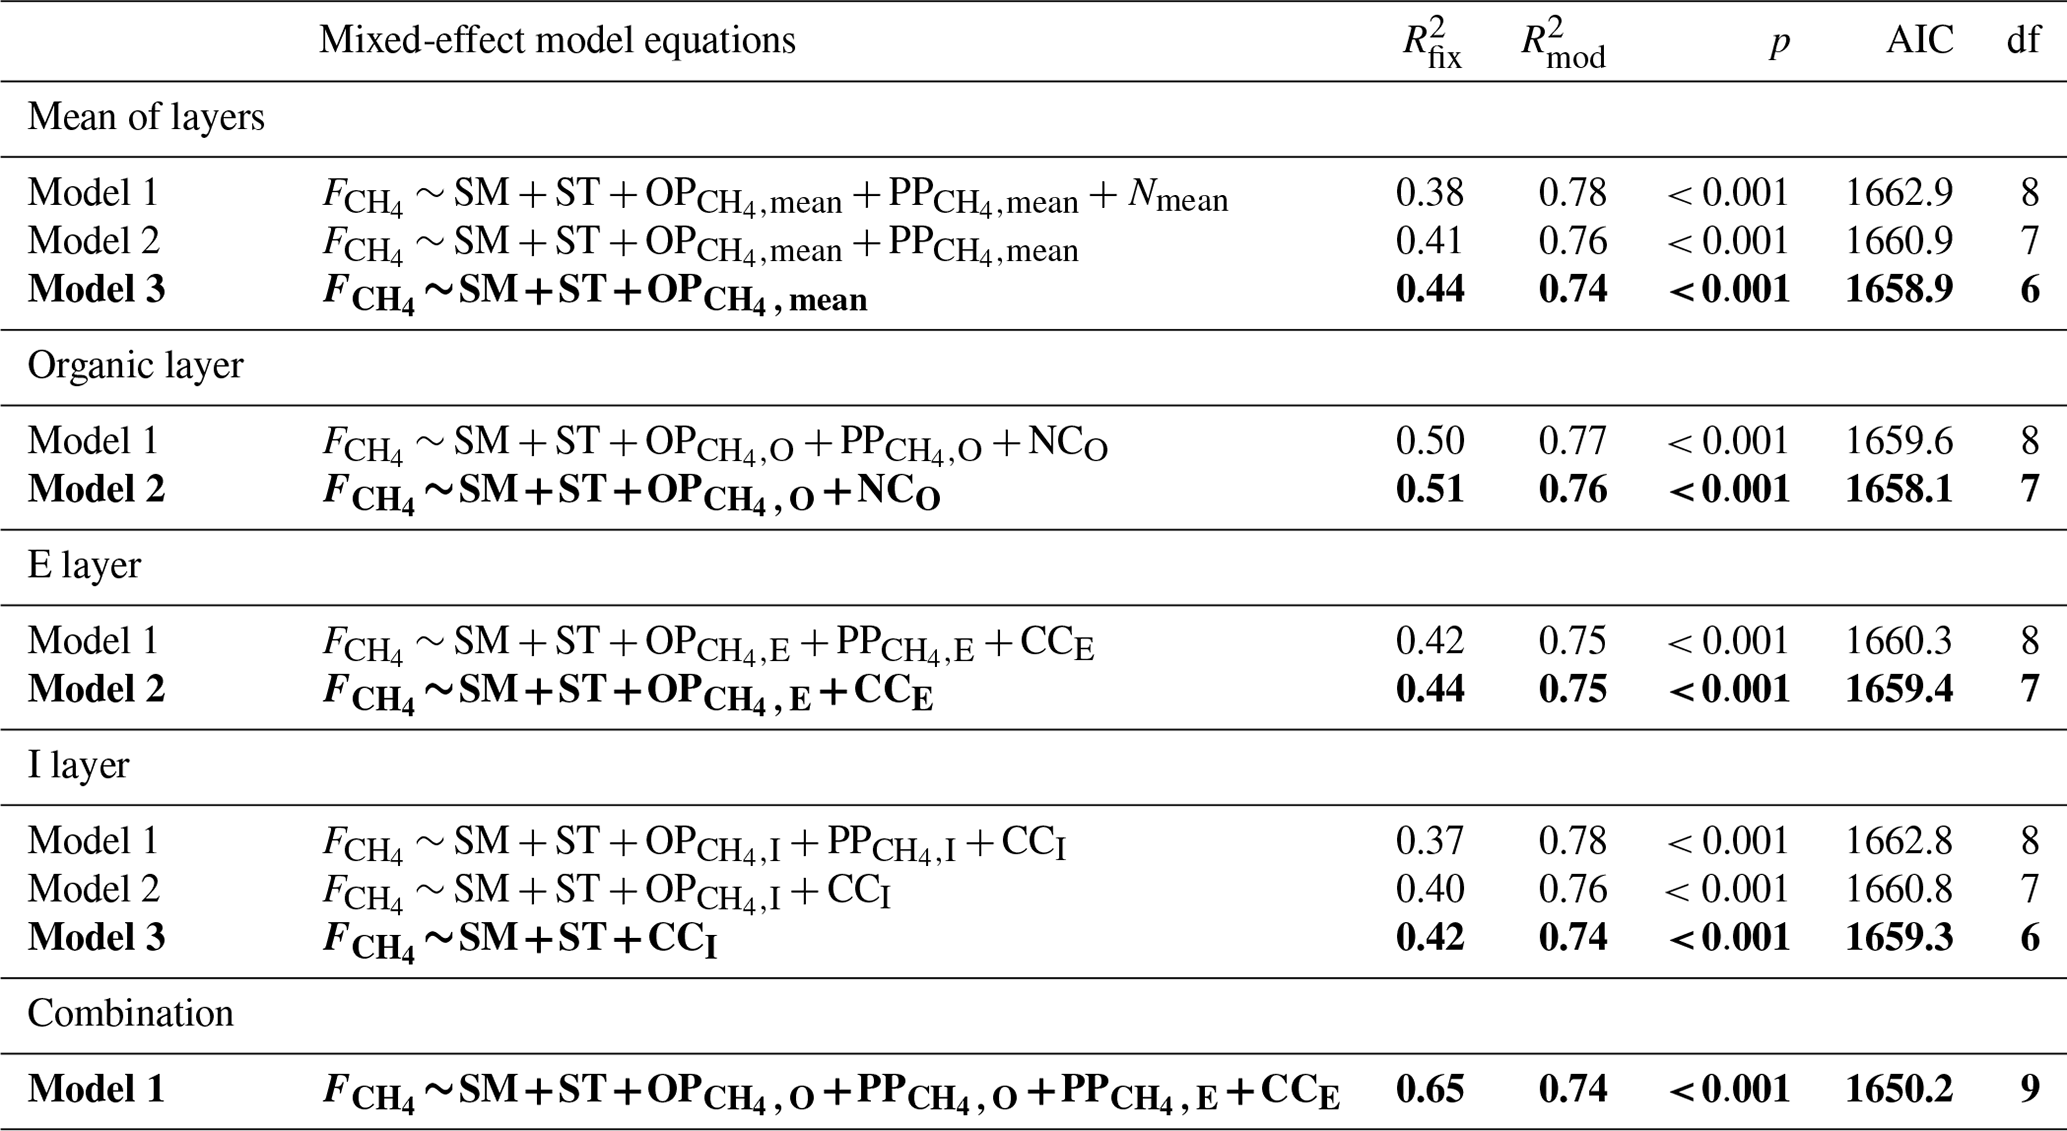
Several mixed-effect model runs were made to investigate the environmental drivers behind CH4 fluxes. SM5 cm and ST5 cm were among the significant variables explaining CH4 fluxes in all the model runs. The rest of the significant drivers varied depending on the soil layer. In the organic layer, the most significant model, in addition to SM5 cm and ST5 cm, included oxidation potential and nitrogen content. The model explained 51 % of the variation in CH4 fluxes (Table 1). The significant drivers were otherwise similar to the O layer in the E layer, except nitrogen content was replaced by carbon. However, the model had weaker explanative power () than the O layer model (). It should be noted that carbon and nitrogen contents had strong cross-correlation, and using either of them in the model would have given almost the same result. The I layer model had the weakest model explaining CH4 fluxes (), and the significant drivers included only SM5 cm and ST5 cm and the carbon content in the I layer. Using the drivers' mean values over all soil layers also resulted in a relatively weak model (), and it included only oxidation potential and SM5 cm and ST5 cm. Finally, a model combining drivers from multiple depths was made, and it explained the CH4 flux the best (). In that model, CH4 flux was most influenced by SM5 cm and ST5 cm, oxidation potential in the organic layer, production potentials in the organic and E layer, and carbon content in the E layer (Table 1).
Table 1Linear mixed-effect models fitted against CH4 fluxes () and experimental factors. The fixed effects in the model were: SM – 5 cm soil moisture; ST – 5 cm soil temperature; OP – CH4 oxidation potential at soil layer x (O, E, I soil layers or the mean of all layers); PP – CH4 production potential at soil layer x; CCx – carbon content at soil layer x; and NCx – nitrogen content at soil layer x. The table shows the r2 of the fixed effects ( and the whole model (fixed effects + random effects, ), p value of the model (p), AIC of the model and the degrees of freedom (df). The models in bold are the best-fitted models.
3.5 Microcosm experiment
Adding glucose to the sample and keeping the moisture level similar did not cause significant changes in the potential CH4 uptake rate, but on average, CH4 uptake rate was lower or the CH4 emission was higher with added glucose on the same moisture level (Fig. 9). There was an exception to this case at high 25 ∘C temperature and moderate moisture (M1), where the added glucose samples had a higher CH4 uptake rate, but as said above, these were not statistically significant differences.
Generally, increasing soil moisture with no added glucose decreased the mean potential CH4 uptake rate, but even with the high SM (M2) group, the soil did not turn into a CH4 source (Fig. 9). Also, the differences between the different moisture groups were generally not statistically significant. Significant differences were only observed between the M2 and the control group in the first 2 weeks of measurements. The weekly mean CH4 uptake rates also decreased further in time in all groups, except in the M2 group, where the changes in time were negligible.
In samples with added glucose, increasing SM significantly (p<0.05) decreased potential CH4 uptake rate in both M1 and M2 groups compared with the control group. On the other hand, M1 and M2 groups did not differ significantly, except in week two at 25 ∘C temperature. In that case, relatively high CH4 emission was measured in the M2 group with added glucose, but emission dropped rapidly already in the third week, although it remained a small CH4 source (Fig. 8). At 15 ∘C temperature, there was no such CH4 emission peak in the M2 group.
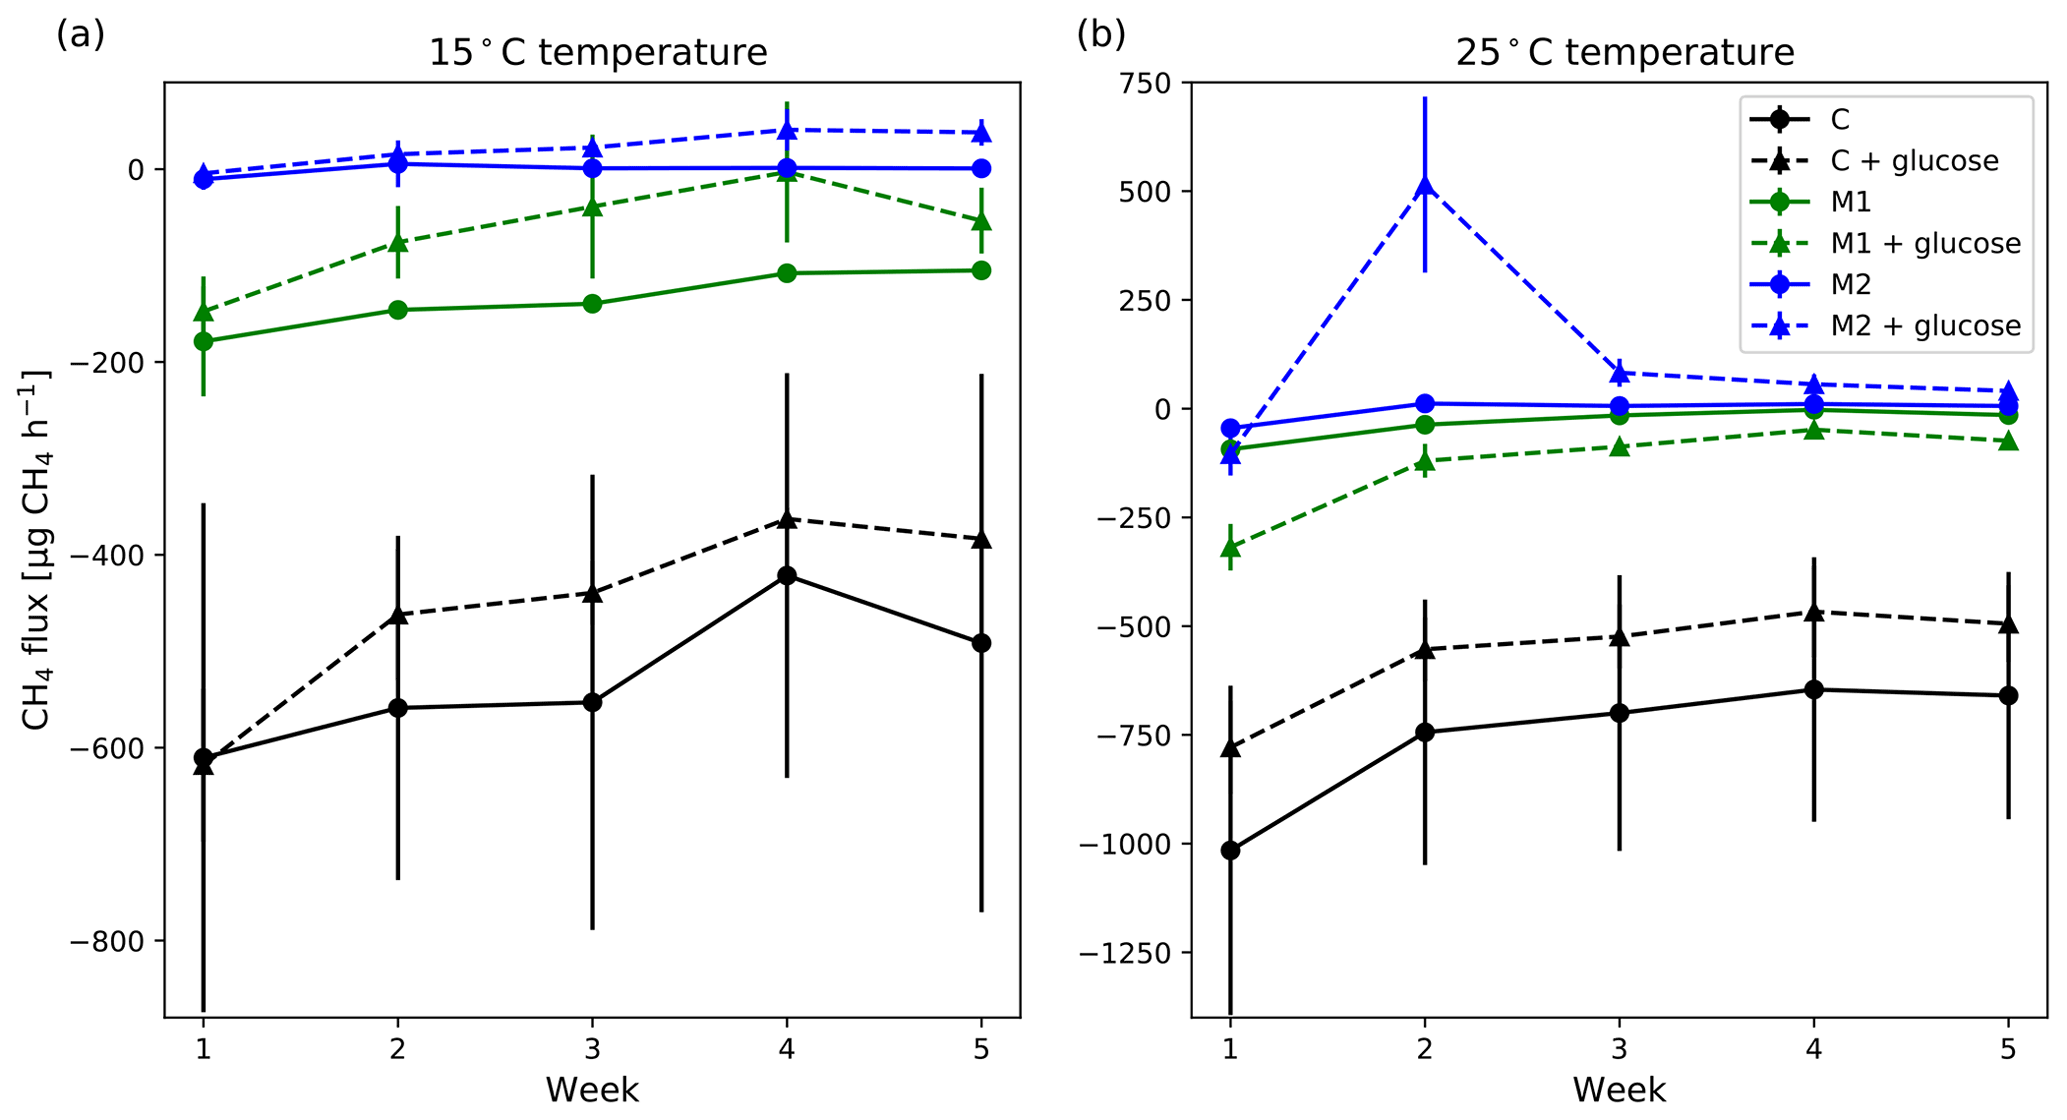
Figure 9Weekly mean CH4 flux measured at 15 ∘C (a) and 25 ∘C (b) without (solid lines) and with (dashed lines) added glucose on different moisture levels (black: control; green: low added moisture; blue: high added moisture). The error bars show the standard error of the mean (n=3). Positive flux values indicate net emission and negative values indicate net uptake.
In this study, our initial aim was to mimic a wet growing season in a boreal upland forest with podzol soil in northern Finland by irrigating the area regularly and studying the conditions needed to switch the forest floor to a CH4 source. Earlier, we discovered that the soil of the same site turned into a CH4 source in August after long-lasting rains during the growing season of 2011 (Lohila et al., 2016). Therefore, we assumed that we could reach the conditions needed to initiate the CH4 production in the podzolic soil by at least tripling the long-term mean precipitation. However, the two study summers of 2018 and 2019 turned out to be the driest summers of the decade, with a long warm and dry period in June to July 2018 and generally dry summer in 2019. Unfortunately, due to the remote location of the experimental site and a distance of several kilometers to the closest water tap, we were not able to counter the effect of the droughts. As a result, our control plot could be considered a drought experiment, while the irrigated plot followed the moisture and CH4 flux patterns of a “normal” summer. Therefore, it is recommended that with similar studies in the future, the experiment be set in a location where the irrigation system is able to distribute higher amounts of water and with higher frequency than what was practically possible in this study. In the Lohila et al. (2016) study, we also speculated that the reason for the CH4 emission occurring in August and not in spring after the snowmelt could be that fresh carbon substrates consumed by soil microbes are needed to make the soil anoxic, i.e., the wet soil alone is not enough to initiate CH4 production. To confirm this hypothesis, we conducted a laboratory mesocosm experiment in which the temperature and moisture responses were studied, and glucose was added to some of the samples to mimic the root exudation providing fresh carbon substrates to the soil microbes.
We found that the field CH4 uptake at the control plot was higher during the study years than a more typical summer of 2017. This comparison was possible since some of our study plots had been established already a year before the experiment. On the other hand, the irrigated plot showed similar uptake rates during the previous summer, which was close to normal in terms of temperature and precipitation. The same pattern was observed for the soil moisture: the soil was as moist in the irrigated plot in 2018 and 2019 as it was without irrigation in 2017. One single occasion when clear CH4 emission was detected took place in the irrigated plot at the end of June 2019, but the emission was only observed in one of the irrigated plots. The mean emission rate during that day from the irrigated plots was 1670 µg CH4 m−2 h−1 (data not shown, the point removed from Fig. 5b). Although encouraging, the observation unfortunately did not provide means to systematically study the conditions needed to switch the soil into a CH4 source, since the soil moisture or any other variable at the same measurement point did not differ from the other points.
The laboratory experiments for studying the possible differences in the CH4 production and oxidation potentials indicated no significant differences between the control and irrigated soils. Initially, we hypothesized that the wet conditions prevailing for one or two summers could be seen in the response of microbial populations so that at the irrigated plot the oxidation would be smaller and the production higher either after both summers or at least after the second wet summer. Unfortunately, the dry summers turned the whole setup around so that we ended up examining the effect of dry growing seasons on the response of microbial populations. Hence, our results suggest that the period of one or two dry summers did not impact soil production or oxidation potentials, although we found differences in the actual CH4 uptake between the irrigated and control plots. Therefore, it seems likely that the differences in observed field fluxes were due to the impact of soil moisture on the gas diffusion rate: the drier the soil, the higher the air-filled porosity and the quicker the diffusion of oxygen and CH4 into the soils, and the higher the CH4 uptake rates (Dörr et al., 1993; Van Den Pol-van Dasselaar et al., 1998; Striegl, 1993).
We also hypothesized that the oxidation potentials would be highest in the topsoil, which is closest to the main source of the substrate for oxidation, namely atmospheric CH4 (Bradford et al., 2001), while the production potentials would be higher deeper in the soil, where the oxygen is more likely to be depleted periodically after wet conditions when diffusion rates are suppressed. The oxidation potentials indeed peaked in the topsoil, but interestingly, so did the production potentials, showing clearly the highest rates in the organic/humus layers (Fig. 7).
Our findings are parallel with the previous ones from forest soils since the highest CH4 oxidation has been detected both in the uppermost mineral soil below the organic layer (Saari et al., 1998) and, on the other hand, in the organic layer (Wang and Ineson, 2003). Thus, the distribution of CH4 consuming organisms in the upland soil horizon seems to vary somewhat depending on the year and prevailing physical and chemical conditions. High potential CH4 productions in the surface layers in 2018 and 2019 (Fig. 7) are most likely linked to higher soil organic matter and moisture content of soils, which is also supported by a strong positive correlation with the soil organic matter and moisture content. Potential CH4 oxidation did not show a strong correlation with these. Similar results obtained from upland soils and especially from forest soils are hard to find. However, high organic C content has simulated CH4 production under hypoxia in agricultural soil (Brzezińska et al., 2012), and water content was observed as a major influencing factor regarding CH4 production potential in subalpine upland soil (Praeg et al., 2014). Thus, over 2 times higher moisture content and about 10 times higher organic matter content in the organic layer compared with mineral layers below most likely explain partly the higher CH4 production potentials observed in this study.
The mesocosm experiment provided interesting insights into the CH4 dynamics of the podzolic soil. First of all, this experiment confirmed the result of field fluxes by showing that the CH4 uptake decreased along with higher soil moisture. Also, CH4 uptake was totally ceased in the high soil moisture treatment (M2) due to suppression of diffusion rates in waterlogged conditions. The higher temperature increased the net uptake, most likely by increasing the oxidation, but this was true only for the mesocosms with “field conditions” (no water added). In other words, CH4 uptake was higher in warmer soils but smaller in wetter soils (as expected), so it seemed that increasing either the temperature or the soil moisture, or both, affect the CH4 oxidation straightforwardly but is not able to induce CH4 production in the soil. However, only if the soils were made wet enough and glucose was added, significant CH4 production was initiated, which was further increased by higher temperatures. Thus, the results obtained here supported our hypothesis that both excess moisture and easily decomposable carbon are needed to initiate CH4 production in podzolic soil. Indeed, the root exudate analogues containing simple sugars accelerated CH4 production in tropical peat soil (Girkin et al., 2018). However, in a study conducted in Japanese upland soil, added glucose was rapidly decomposed within 7 d of the incubation, and part of the glucose-derived C flow ended up to methanogens even under unflooded conditions (Watanabe et al., 2011). Even though it is largely known that methanogens can survive and tolerate dry and oxic conditions for some periods, they become active only when the conditions turn favorable for CH4 production (i.e., wet and anoxic). Since methanogenic archaea cannot use glucose directly as C source, methanogens probably utilized acetate or CO2 produced by the glucose-decomposing bacteria. Thus, the obtained results from the microcosm experiment may reflect the situation that in wet conditions, glucose has increased the activity of microbial communities that supply methanogenic substrates (hydrogen-producing bacteria or acetyl-producing bacteria), promoting the activity of methanogens production as was detected in a forested wetland (Koh et al., 2009). Simultaneously decreased activity of CH4 oxidizers may have been followed by the competition of other aerobic microorganisms, which have metabolized glucose rapidly, creating more anaerobic conditions favoring CH4 production. However, the comparison of the obtained results with earlier findings is rather obscure since similar experiments conducted in boreal forest soil do not exist. Thus, our results are one of the first attempts to understand the complex conditions which initiate CH4 production. In addition, our study is unique since we are presenting both CH4 fluxes and laboratory CH4 potentials from the soil taken from the same field points.
Based on our field and laboratory experiments, the main conclusion is that CH4 production from boreal upland forest soil cannot occur solely by prolonged wet conditions, but there also has to be enough fresh carbon in the soil. Therefore, we expect the possible CH4 production episodes to occur in late summer and autumn rather than in spring, even though the soil can be very wet after snowmelt. These findings can be applied in CH4 process models to improve estimations of regional and global upland forest CH4 balances.
We did not observe any changes in CH4 production and oxidation potentials due to irrigation over two summers, meaning microbial communities were not very sensitive to environmental variables. This suggests that the measured field fluxes are rather controlled by the physical soil conditions by limiting gas diffusion rates and not by the changes due to microbial function. One conclusion from our results is that CH4 production and oxidation are controlled by different driving variables and processes: the oxidation is boosted when the conditions for higher gaseous diffusion are optimal (dry soil), while the production is boosted only if anoxic conditions are created (wet soil reducing diffusion + microbial activity consuming oxygen) and there are fresh organic substrates available for CH4 production. In our field experiment, CH4 production episodes were not detected (with one exception), and the changes in net field CH4 flux were solely caused by the changes in CH4 oxidation. The net CH4 flux (here total oxidation) was primarily controlled by soil temperature and soil moisture. Increasing soil temperature enhanced oxidation and gas diffusion, and increasing soil moisture limited oxidation by making conditions for methanotrophs unfavorable and diminished diffusion. We also found that upland forest soils have the potential to produce CH4, but contrary to wetlands, the potential is highest near the soil surface and decreases rapidly as a function of soil depth. This could happen because the conditions for methanogenic archaea are more favorable in the topsoil layer due to the higher amount of organic matter.
Our study confirms that soil moisture is a critical variable in explaining the soil CH4 uptake rate and suggests that the diffusion rate of both CH4 and oxygen into the soil is the primary constraint of oxidation. For the onset of CH4 production in podzolic soil, not only high soil moisture but also the addition of sugar, mimicking root exudates from trees, was needed. Glucose impacts CH4 production mainly by boosting the consumption of oxygen in the soil and providing substrates for CH4 production. We also found that the highest potential production and oxidation rates were found in the same topsoil layers, suggesting that the surface soil plays the main role in the soil–atmosphere exchange of CH4 in boreal upland forest
The flux, meteorological, and soil data are available at Zenodo (https://doi.org/10.5281/zenodo.5153347, Korkiakoski et al., 2021).
The supplement related to this article is available online at: https://doi.org/10.5194/bg-19-2025-2022-supplement.
AL, TP, and KP designed the study. MK, AL, TP, and TM constructed the experimental site. KP took the soil samples and calculated methane production and oxidation potentials and did the laboratory work for the microcosm experiment. TM made the flux measurements and took part in the data analysis. MK calculated the fluxes for the field and microcosm experiments and did the statistical analysis. MK prepared the paper with contributions from all co-authors.
The contact author has declared that neither they nor their co-authors have any competing interests.
Publisher’s note: Copernicus Publications remains neutral with regard to jurisdictional claims in published maps and institutional affiliations.
Valtteri Hyöky, Päivi Pietikäinen, Stephanie Gerin, and Petri Salovaara are acknowledged for assisting in the fieldwork. We also thank Bastian Steinhoff-Knopp for letting us use his aerial photo of the experimental site, and the Finnish Forest Administration (Metsähallitus) for their generous cooperation during the fieldwork in 2018–2019.
This research has been supported by the Academy of Finland (grant no. 308511).
Open-access funding was provided by the Helsinki University Library.
This paper was edited by Lutz Merbold and reviewed by two anonymous referees.
Allison, S. D. and Treseder, K. K.: Warming and drying suppress microbial activity and carbon cycling in boreal forest soils, Glob. Change Biol., 14, 2898–2909, https://doi.org/10.1111/j.1365-2486.2008.01716.x, 2008.
Angel, R., Claus, P., and Conrad, R.: Methanogenic archaea are globally ubiquitous in aerated soils and become active under wet anoxic conditions, ISME J., 6, 847–862, https://doi.org/10.1038/ismej.2011.141, 2012.
Aurela, M., Lohila, A., Tuovinen, J. P., Hatakka, J., Penttilä, T., and Laurila, T.: Carbon dioxide and energy flux measurements in four northern-boreal ecosystems at Pallas, Boreal Environ. Res., 20, 455–473, 2015.
Bates, D., Maechler, M., Bolker, B., and Walker, S.: Fitting Linear Mixed-Effects Models Using lme4, J. Stat. Softw., 67, 1–48, https://doi.org/10.18637/jss.v067.i01, 2015.
Beier, C., Beierkuhnlein, C., Wohlgemuth, T., Penuelas, J., Emmett, B., Körner, C., de Boeck, H., Christensen, J. H., Leuzinger, S., Janssens, I. A., and Hansen, K.: Precipitation manipulation experiments – challenges and recommendations for the future, Ecol. Lett., 15, 899–911, https://doi.org/10.1111/j.1461-0248.2012.01793.x, 2012.
Billings, S. A., Richter, D. D., and Yarie, J.: Sensitivity of soil methane fluxes to reduced precipitation in boreal forest soils, Soil Biol. Biochem., 32, 1431–1441, https://doi.org/10.1016/S0038-0717(00)00061-4, 2000.
Bousquet, P., Ciais, P., Miller, J. B., Dlugokencky, E. J., Hauglustaine, D. A., Prigent, C., Van Der Werf, G. R., Peylin, P., Brunke, E. G., Carouge, C., Langenfelds, R. L., Lathière, J., Papa, F., Ramonet, M., Schmidt, M., Steele, L. P., Tyler, S. C., and White, J.: Contribution of anthropogenic and natural sources to atmospheric methane variability, Nature, 443, 439–443, https://doi.org/10.1038/nature05132, 2006.
Bradford, M. A., Ineson, P., Wookey, P. A., and Lappin-Scott, H. M.: Role of CH4 oxidation, production and transport in forest soil CH4 flux, Soil Biol. Biochem., 33, 1625–1631, https://doi.org/10.1016/S0038-0717(01)00078-5, 2001.
Brzezińska, M., Nosalewicz, M., Pasztelan, M., and Wodarczyk, T.: Methane production and consumption in loess soil at different slope position, Sci. World J., 2012, 620270, https://doi.org/10.1100/2012/620270, 2012.
Cajander, A.: The theory of forest types, Acta For. Fenn., 29, 7193, https://doi.org/10.14214/aff.7193, 1926.
Chai, X., Tonjes, D. J., and Mahajan, D.: Methane emissions as energy reservoir: Context, scope, causes and mitigation strategies, Prog. Energ. Combust., 56, 33–70, https://doi.org/10.1016/j.pecs.2016.05.001, 2016.
Christiansen, J. R., Vesterdal, L., and Gundersen, P.: Nitrous oxide and methane exchange in two small temperate forest catchments-effects of hydrological gradients and implications for global warming potentials of forest soils, Biogeochemistry, 107, 437–454, https://doi.org/10.1007/s10533-010-9563-x, 2012.
Crill, P. M. and Thornton, B. F.: Whither methane in the IPCC process?, Nat. Clim. Change, 7, 678–680, https://doi.org/10.1038/nclimate3403, 2017.
Dlugokencky, E. J., Nisbet, E. G., Fisher, R., and Lowry, D.: Global atmospheric methane: Budget, changes and dangers, Philos. T. R. Soc. A, 369, 2058–2072, https://doi.org/10.1098/rsta.2010.0341, 2011.
Dörr, H., Katruff, L., and Levin, I.: Soil texture parameterization of the methane uptake in aerated soils, Chemosphere, 26, 697–713, https://doi.org/10.1016/0045-6535(93)90454-D, 1993.
Ebrahimi, A. and Or, D.: Dynamics of soil biogeochemical gas emissions shaped by remolded aggregate sizes and carbon configurations under hydration cycles, Glob. Change Biol., 24, e378–e392, https://doi.org/10.1111/gcb.13938, 2018.
Fischer, H., Behrens, M., Bock, M., Richter, U., Schmitt, J., Loulergue, L., Chappellaz, J., Spahni, R., Blunier, T., Leuenberger, M., and Stocker, T. F.: Changing boreal methane sources and constant biomass burning during the last termination, Nature, 452, 864–867, https://doi.org/10.1038/nature06825, 2008.
Girkin, N. T., Turner, B. L., Ostle, N., Craigon, J., and Sjögersten, S.: Root exudate analogues accelerate CO2 and CH4 production in tropical peat, Soil Biol. Biochem., 117, 48–55, https://doi.org/10.1016/j.soilbio.2017.11.008, 2018.
Gulledge, J. and Schimel, J. P.: Controls on soil carbon dioxide and methane fluxes in a variety of taiga forest stands in interior Alaska, Ecosystems, 3, 269–282, https://doi.org/10.1007/s100210000025, 2000.
Hanson, R. S. and Hanson, T. E.: Methanotrophic bacteria, Microbiol. Rev., 60, 439–471, https://doi.org/10.1128/mmbr.60.2.439-471.1996, 1996.
Hothorn, T., Bretz, F., and Westfall, P.: Simultaneous Inference in General Parametric Models, Biometrical J., 50, 346–363, 2008.
Jylhä, K., Ruosteenoja, K., Räisänen, J., Venäläinen, A., Tuomenvirta, H., Ruokolainen, L., Saku, S., and Seitola, T.: Changing climate in Finland: estimates for adaptation studies, ACCLIM project report, Finnish Meteorological Institute, ISBN 978-951-697-700-6, 2009.
Kassambara, A.: ggpubr: “ggplot2” Based Publication Ready Plots, R package version 0.4.0, https://CRAN.R-project.org/package=ggpubr (last access: 8 April 2022), 2020.
Kirschke, S., Bousquet, P., Ciais, P., Saunois, M., Canadell, J. G., Dlugokencky, E., Bergamaschi, P., Bergmann, D., Blake, D. R., Bruhwiler, L., Cameron-Smith, P., Castaldi, S., Chevallier, F., Feng, L., Fraser, A., Heimann, M., Hodson, E. L., Houweling, S., Josse, B., Fraser, P. J., Krummel, P. B., Lamarque, J.-F., Langenfelds, R. L., Le Quéré, C., Naik, V., O'doherty, S., Palmer, P. I., Pison, I., Plummer, D., Poulter, B., Prinn, R., Rigby, M., Ringeval, B., Santini, M., Schmidt, M., Shindell, D., Simpson, I. J., Spahni, R., Steele, L. P., Strode, S. A., Sudo, K., Szopa, S., Van Der Werf, G. R., Voulgarakis, A., Van Weele, M., Weiss, R. F., Williams, J. E., and Zeng, G.: Three decades of global methane sources and sinks, Nat. Geosci., 6, 813–823, https://doi.org/10.1038/ngeo1955, 2013.
Knief, C., Lipski, A., and Dunfield, P. F.: Diversity and Activity of Methanotrophic Bacteria in Different Upland Soils, Appl. Environ. Microb., 69, 6703–6714, https://doi.org/10.1128/AEM.69.11.6703-6714.2003, 2003.
Koh, H. S., Ochs, C. A., and Yu, K.: Hydrologic gradient and vegetation controls on CH4 and CO2 fluxes in a spring-fed forested wetland, Hydrobiologia, 630, 271–286, https://doi.org/10.1007/s10750-009-9821-x, 2009.
Kolb, S.: The quest for atmospheric methane oxidizers in forest soils, Env. Microbiol. Rep., 1, 336–346, https://doi.org/10.1111/j.1758-2229.2009.00047.x, 2009.
Korkiakoski, M., Tuovinen, J.-P., Aurela, M., Koskinen, M., Minkkinen, K., Ojanen, P., Penttilä, T., Rainne, J., Laurila, T., and Lohila, A.: Methane exchange at the peatland forest floor – automatic chamber system exposes the dynamics of small fluxes, Biogeosciences, 14, 1947–1967, https://doi.org/10.5194/bg-14-1947-2017, 2017.
Korkiakoski, M., Määttä, T., Peltoniemi, K., Penttilä, T., and Lohila, A.: Excess soil moisture and fresh carbon input are prerequisites for methane production in podzolic soil (Version v1), Zenodo [data set], https://doi.org/10.5281/zenodo.5153347, 2021.
Lehtonen, I., Ruosteenoja, K., and Jylhä, K.: Projected changes in European extreme precipitation indices on the basis of global and regional climate model ensembles, Int. J. Climatol., 34, 1208–1222, https://doi.org/10.1002/joc.3758, 2014.
Lohila, A., Penttilä, T., Jortikka, S., Aalto, T., Anttila, P., Asmi, E., Aurela, M., Hatakka, J., Hellén, H., Henttonen, H., Hänninen, P., Kilkki, J., Kyllönen, K., Laurila, T., Lepistö, A., Lihavainen, H., Makkonen, U., Paatero, J., Rask, M., Sutinen, R., Tuovinen, J. P., Vuorenmaa, J., and Viisanen, Y.: Preface to the special issue on integrated research of atmosphere, ecosystems and environment at Pallas, Boreal Environ. Res., 20, 431–454, 2015.
Lohila, A., Aalto, T., Aurela, M., Hatakka, J., Tuovinen, J.-P., Kilkki, J., Penttilä, T., Vuorenmaa, J., Hänninen, P., Sutinen, R., Viisanen, Y., and Laurila, T.: Large contribution of boreal upland forest soils to a catchment-scale CH4 balance in a wet year, Geophys. Res. Lett., 43, 2946–2953, https://doi.org/10.1002/2016GL067718, 2016.
Megonigal, J. P. and Guenther, A. B.: Methane emissions from upland forest soils and vegetation, Tree Physiol., 28, 491–498, https://doi.org/10.1093/treephys/28.4.491, 2008.
Le Mer, J. and Roger, P.: Production, oxidation, emission and consumption of methane by soils: A review, Eur. J. Soil Biol., 37, 25–50, https://doi.org/10.1016/S1164-5563(01)01067-6, 2001.
Niinistö, S. M., Silvola, J., and Kellomäki, S.: Soil CO2 efflux in a boreal pine forest under atmospheric CO2 enrichment and air warming, Glob. Change Biol., 10, 1363–1376, https://doi.org/10.1111/j.1365-2486.2004.00799.x, 2004.
Oertel, C., Matschullat, J., Zurba, K., Zimmermann, F., and Erasmi, S.: Greenhouse gas emissions from soils – A review, Chem. Erde, 76, 327–352, https://doi.org/10.1016/j.chemer.2016.04.002, 2016.
Olefeldt, D., Turetsky, M. R., Crill, P. M. and Mcguire, A. D.: Environmental and physical controls on northern terrestrial methane emissions across permafrost zones, Glob. Change Biol., 19, 589–603, https://doi.org/10.1111/gcb.12071, 2013.
Orata, F. D., Meier-Kolthoff, J. P., Sauvageau, D., and Stein, L. Y.: Phylogenomic analysis of the gammaproteobacterial methanotrophs (order methylococcales) calls for the reclassification of members at the genus and species levels, Front. Microbiol., 9, 1–17, https://doi.org/10.3389/fmicb.2018.03162, 2018.
Peter Mayer, H. and Conrad, R.: Factors influencing the population of methanogenic bacteria and the initiation of methane production upon flooding of paddy soil, FEMS Microbiol. Ecol., 73, 103–112, https://doi.org/10.1016/0378-1097(90)90656-B, 1990.
Pirinen, P., Simola, H., Aalto, J., Kaukoranta, J.-P., Karlsson, P., and Ruuhela, R.: Climatological statistics of Finland 1981–2010, Reports, 2, Finnish Meteorological Institute, Helsinki, Finland, ISBN 978-951-697-766-2, 2012.
Praeg, N., Wagner, A. O., and Illmer, P.: Effects of fertilisation, temperature and water content on microbial properties and methane production and methane oxidation in subalpine soils, Eur. J. Soil Biol., 65, 96–106, https://doi.org/10.1016/j.ejsobi.2014.10.002, 2014.
R Core Team: R: A language and Environment for Statistical Computing, https://www.r-project.org (last access: 8 April 2022), 2021.
Saari, A., Heiskanen, J., and Martikainen, P. J.: Effect of the organic horizon on methane oxidation and uptake in soil of a boreal Scots pine forest, FEMS Microbiol. Ecol., 26, 245–255, https://doi.org/10.1016/S0168-6496(98)00040-3, 1998.
Saunois, M., Stavert, A. R., Poulter, B., Bousquet, P., Canadell, J. G., Jackson, R. B., Raymond, P. A., Dlugokencky, E. J., Houweling, S., Patra, P. K., Ciais, P., Arora, V. K., Bastviken, D., Bergamaschi, P., Blake, D. R., Brailsford, G., Bruhwiler, L., Carlson, K. M., Carrol, M., Castaldi, S., Chandra, N., Crevoisier, C., Crill, P. M., Covey, K., Curry, C. L., Etiope, G., Frankenberg, C., Gedney, N., Hegglin, M. I., Höglund-Isaksson, L., Hugelius, G., Ishizawa, M., Ito, A., Janssens-Maenhout, G., Jensen, K. M., Joos, F., Kleinen, T., Krummel, P. B., Langenfelds, R. L., Laruelle, G. G., Liu, L., Machida, T., Maksyutov, S., McDonald, K. C., McNorton, J., Miller, P. A., Melton, J. R., Morino, I., Müller, J., Murguia-Flores, F., Naik, V., Niwa, Y., Noce, S., O'Doherty, S., Parker, R. J., Peng, C., Peng, S., Peters, G. P., Prigent, C., Prinn, R., Ramonet, M., Regnier, P., Riley, W. J., Rosentreter, J. A., Segers, A., Simpson, I. J., Shi, H., Smith, S. J., Steele, L. P., Thornton, B. F., Tian, H., Tohjima, Y., Tubiello, F. N., Tsuruta, A., Viovy, N., Voulgarakis, A., Weber, T. S., van Weele, M., van der Werf, G. R., Weiss, R. F., Worthy, D., Wunch, D., Yin, Y., Yoshida, Y., Zhang, W., Zhang, Z., Zhao, Y., Zheng, B., Zhu, Q., Zhu, Q., and Zhuang, Q.: The Global Methane Budget 2000–2017, Earth Syst. Sci. Data, 12, 1561–1623, https://doi.org/10.5194/essd-12-1561-2020, 2020.
Savage, K. and Moore, T. R.: Methane and carbon dioxide exchanges between the atmosphere and northern boreal forest soils, J. Geophys. Res., 102, 279–288, https://doi.org/10.1029/97JD02233, 1997.
Spahni, R., Wania, R., Neef, L., van Weele, M., Pison, I., Bousquet, P., Frankenberg, C., Foster, P. N., Joos, F., Prentice, I. C., and van Velthoven, P.: Constraining global methane emissions and uptake by ecosystems, Biogeosciences, 8, 1643–1665, https://doi.org/10.5194/bg-8-1643-2011, 2011.
Striegl, R. G.: Diffusional limits to the consumption of atmospheric methane by soils, Chemosphere, 26, 715–720, https://doi.org/10.1016/0045-6535(93)90455-E, 1993.
Thauer, R. K., Kaster, A. K., Seedorf, H., Buckel, W., and Hedderich, R.: Methanogenic archaea: Ecologically relevant differences in energy conservation, Nat. Rev. Microbiol., 6, 579–591, https://doi.org/10.1038/nrmicro1931, 2008.
Vainio, E., Peltola, O., Kasurinen, V., Kieloaho, A.-J., Tuittila, E.-S., and Pihlatie, M.: Topography-based statistical modelling reveals high spatial variability and seasonal emission patches in forest floor methane flux, Biogeosciences, 18, 2003–2025, https://doi.org/10.5194/bg-18-2003-2021, 2021.
Van Den Pol-van Dasselaar, A., Van Beusichem, M. L., and Oenema, O.: Effects of soil moisture content and temperature on methane uptake by grasslands on sandy soils, Plant Soil, 204, 213–222, https://doi.org/10.1023/A:1004371309361, 1998.
Wang, Z. P. and Ineson, P.: Methane oxidation in a temperate coniferous forest soil: Effects of inorganic N, Soil Biol. Biochem., 35, 427–433, https://doi.org/10.1016/S0038-0717(02)00294-8, 2003.
Watanabe, T., Wang, G., Lee, C. G., Murase, J., Asakawa, S., and Kimura, M.: Assimilation of glucose-derived carbon into methanogenic archaea in soil under unflooded condition, Appl. Soil Ecol., 48, 201–209, https://doi.org/10.1016/j.apsoil.2011.03.005, 2011.
Whalen, S. C.: Natural Wetlands and the Atmosphere, Environ. Eng. Sci., 22, 73–94, https://doi.org/10.1089/ees.2005.22.73, 2005.
Whalen, S. C., Reeburgh, W. S., and Kizer, K. S.: Methane consumption and emission by taiga, Global Biogeochem. Cy., 5, 261–273, https://doi.org/10.1029/91gb01303, 1991.
Wilke, C. O.: cowplot: Streamlined Plot Theme and Plot Annotations for “ggplot2”, R package version 1.1.0., https://CRAN.R-project.org/package=cowplot, 2020.
Wu, Z., Dijkstra, P., Koch, G. W., Peñuelas, J., and Hungate, B. A.: Responses of terrestrial ecosystems to temperature and precipitation change: A meta-analysis of experimental manipulation, Glob. Change Biol., 17, 927–942, https://doi.org/10.1111/j.1365-2486.2010.02302.x, 2011.
Wuebbles, D. J. and Hayhoe, K.: Atmospheric methane and global change, Earth-Sci. Rev., 57, 177–210, https://doi.org/10.1016/S0012-8252(01)00062-9, 2002.
Yavitt, J. B., Downey, D. M., Lang, G. E. and Sexston, A. J.: Methane consumption in two temperate forest soils, Biogeochemistry, 9, 39–52, https://doi.org/10.1007/BF00002716, 1990.
Yavitt, J. B., Fahey, T. J., and Simmons, J. A.: Methane and Carbon Dioxide Dynamics in a Northern Hardwood Ecosystem, Soil Sci. Soc. Am. J., 59, 796–804, https://doi.org/10.2136/sssaj1995.03615995005900030023x, 1995.
Ylläsjärvi, I. and Kuuluvainen, T.: How homogeneous is the boreal forest? Characteristics and variability of old-growth forest on a hylocomium-myrtillus site type in the Pallas-Yllästunturi national park, northern Finland, Ann. Bot. Fenn., 46, 263–279, https://doi.org/10.5735/085.046.0403, 2009.