the Creative Commons Attribution 4.0 License.
the Creative Commons Attribution 4.0 License.
 | 20 Apr 2022
Compositions of dissolved organic matter in the ice-covered waters above the Aurora hydrothermal vent system, Gakkel Ridge, Arctic Ocean
Muhammed Fatih Sert
Helge Niemann
Eoghan P. Reeves
Mats A. Granskog
Kevin P. Hand
Timo Kekäläinen
Janne Jänis
Pamela E. Rossel
Bénédicte Ferré
Anna Silyakova
Friederike Gründger
Hydrothermal vents modify and displace subsurface dissolved organic matter (DOM) into the ocean. Once in the ocean, this DOM is transported together with elements, particles, dissolved gases and biomass along with the neutrally buoyant plume layer. Considering the number and extent of actively venting hydrothermal sites in the oceans, their contribution to the oceanic DOM pool may be substantial. Here, we investigate the dynamics of DOM in relation to hydrothermal venting and related processes at the as yet unexplored Aurora hydrothermal vent field within the ultraslow-spreading Gakkel Ridge in the Arctic Ocean at 82.9∘ N. We examined the vertical distribution of DOM composition from sea ice to deep waters at six hydrocast stations distal to the active vent and its neutrally buoyant plume layer. In comparison to background seawater, we found that the DOM in waters directly affected by the hydrothermal plume was molecularly less diverse and 5 %–10 % lower in number of molecular formulas associated with the molecular categories related to lipid and protein-like compounds. On the other hand, samples that were not directly affected by the plume were chemically more diverse and had a higher percentage of chemical formulas associated with the carbohydrate-like category. Our results suggest that hydrothermal processes at Aurora may influence the DOM distribution in the bathypelagic ocean by spreading more thermally and/or chemically induced compositions, while DOM compositions in epipelagic and mesopelagic layers are mainly governed by the microbial carbon pump dynamics and surface-ocean–sea-ice interactions.
- Article
(5591 KB) - Full-text XML
-
Supplement
(600 KB) - BibTeX
- EndNote


Dissolved organic matter (DOM) in the vicinity of high-temperature hydrothermal vents shows discrepancies in concentration compared to ocean background concentrations, mainly due to thermal decomposition of DOM during hydrothermal circulation (Hawkes et al., 2015; Lang et al., 2006). During the formation of hot hydrothermal fluids in convective circulation systems, cold deep ocean water percolates through permeable pathways (faults/fissures) in the crust and is progressively heated and modified during high-temperature alteration of igneous (e.g., mafic, ultramafic) rocks (German and Seyfried, 2014; Simoneit et al., 2004). Continuous exposure to extremes of temperature (up to 400 ∘C) and low pH either completely degrade DOM to volatile species (e.g., CO2, methane) (Lang et al., 2006) or alters originally stable, high-molecular-weight, refractory DOM to highly aromatic, unsaturated, oxygen-poor, petroleum-like compositions in the hydrothermal vent fluids (Hawkes et al., 2015, 2016; Rossel et al., 2015, 2017). In relatively low temperature hydrothermal systems (<150 ∘C), DOM is not degraded by cracking (Lang et al., 2006), and production of DOM may be more prevalent (Hawkes et al., 2015). DOM may therefore be a significant source of mixed forms of complex reduced carbon in the vent fluids, which can include dissolved free amino acids (Fuchida et al., 2014; Haberstroh and Karl, 1989; Horiuchi et al., 2004), lipids (McCollom et al., 1999, 2015) and bio-labile organic carbon (Hansen et al., 2019; Longnecker et al., 2018; Rossel et al., 2015). Considering that the deep-ocean DOM is refractory (e.g., Dittmar and Stubbins, 2014; Hansell, 2013) or primarily inaccessible for organisms (e.g., Arrieta et al., 2015), specialized microbial communities may therefore utilize hydrothermally modified DOM as a carbon source and support hydrothermal fauna in the vicinity of hydrothermal vents (Bart et al., 2020; Folkers and Rombouts, 2020; Hestetun et al., 2016; Yahel et al., 2003).
The chemical composition and temperature of venting fluids emanating at the seafloor and contributing to hydrothermal plume formation are mainly controlled by the geological setting and physicochemical constraints including phase separation, water–rock interaction (mineral precipitation/dissolution) and biological processes (German and Seyfried, 2014; Nakamura and Takai, 2014). Hydrothermal fluids emitted from the vents are diluted with ambient water by factors of 104–105 and form a hydrothermal plume that rises hundreds of meters until reaching neutral buoyancy in the water column (Baker et al., 1995). Previous field observations, as well as models, show that rising, neutrally buoyant plumes can disperse horizontally at isopycnal surfaces for tens to even thousands of kilometers (Baker et al., 1995; Lupton and Craig, 1981; Rudnicki and Elderfield, 1993; Speer and Rona, 1989; Tao et al., 2013). Thereby, they form environmental gradients (also called ecotones) conducting particles, nutrients, organic matter, trace elements and biomass (Levin et al., 2016; Ramirez-Llodra et al., 2010).
These neutrally buoyant hydrothermal plumes in deep oceans are areas of active chemical cycling that sustain life in the hyper-oligotrophic bathypelagic zones. Plumes fuel chemosynthetic and heterotrophic prokaryotes, archaea, viruses and zooplankton that grow in this ecosystem in a spatiotemporal succession (Burd and Thomson, 1994; Dick, 2019; Levin et al., 2016). Morphological evidence suggests that heterotrophic deep-sea communities take over chemosynthetic vent-derived communities along the path of the dispersing plume layer. The heterotrophs use DOM in the plume in which subsequent lysis of their cells further amplifies heterotrophic bacteria and DOM release (Ortmann and Suttle, 2005). Controlled incubation experiments showed that the thermal degradation of deep-sea recalcitrant DOM elevates the microbially accessible composition and stimulates the growth of prokaryotic communities (Hansen et al., 2019).
More than 300 high-temperature venting sites have been identified at mid-ocean ridges (Hannington et al., 2011; Nakamura and Takai, 2014), and around 800 are estimated to exist, roughly half of which are expected to be found in slow/ultraslow-spreading mid-ocean ridges (Beaulieu et al., 2015). Because of the limited number of expeditions in the ice-covered Arctic Ocean, surveys of hydrothermal vents at very high latitudes have been extremely rare. However, considering the amount of fluid venting at hydrothermal vents and the far-reaching area of impact through plume dispersion, their influence on marine DOM may be substantial in the oligotrophic Arctic Ocean. There, hydrothermally derived DOM could potentially influence mesopelagic and epipelagic layers, as well as surface-ocean–sea-ice interactions.
In this paper, we investigate the influence of hydrothermal activity on the DOM composition in the Arctic Ocean water column at the Aurora hydrothermal vent system. We suggest that the hydrothermal plume distributes thermally altered DOM to greater areas, where its composition will be altered through admixture with background seawater and through microbial processes. We characterize the water column DOM composition from the seafloor to the sea ice to assess the vertical extent of hydrothermal intrusion and its confluence with hydrophysical and chemical parameters.
2.1 Study area
The Aurora seamount (82.897 N, 6.255 W) is located at the southern tip of the ultraslow-spreading (<12.0 mm yr−1) Gakkel Ridge that extends for 1800 km across the Eurasian Basin in the Arctic Ocean (DeMets et al., 2010). The seamount has a height of 300 m above the seafloor (m a.s.f.) and is elongated in a southeast–northwest direction (Fig. 1). The water column at the mount's summit has a depth of 3800 m, and it reaches 4500 m at the southern side of the ridge flank. The sea surface in this region is capped by a perennial ice cover. The Aurora seamount was explored by two research icebreakers in 2001 (expedition AMORE); evidence for high levels of hydrothermal activity was observed (fresh sulfide chimney structures, shimmering water, abundant biological activity); and anomalies in temperature, dissolved manganese and light scattering were detected (Edmonds et al., 2003; Michael et al., 2003). An active “black smoker” hydrothermal vent at the Aurora site (named after Aurora seamount) was later located ∼100 m southwest of the summit in 2014, and high methane concentrations and temperature anomalies were documented along with a plume layer extending towards northwest of vent field (Boetius et al., 2014, 2015; German and Boetius, 2017). As a continuation of the investigation in the area, and to further understand the role of the Gakkel Ridge in the scope of the global biogeography of chemosynthetic ecosystems (Vanreusel et al., 2009), the first HACON (Hot vents in an ice-covered ocean, HACON19) expedition attempted to reach the site again in 2019 (Bünz et al., 2020). During the cruise, both active and inactive hydrothermal vents at the vent site were visually observed in much greater detail, using a towed camera system (Ocean Floor Observation and Bathymetry System, OFOBS; Purser et al., 2019). The active vent area is evidently characterized by several vigorously venting black smokers, sulfide mounds, bacterial mats, thinly sedimented outcrops, and benthic communities typical of hydrothermal vent ecosystems (Bünz et al., 2020).
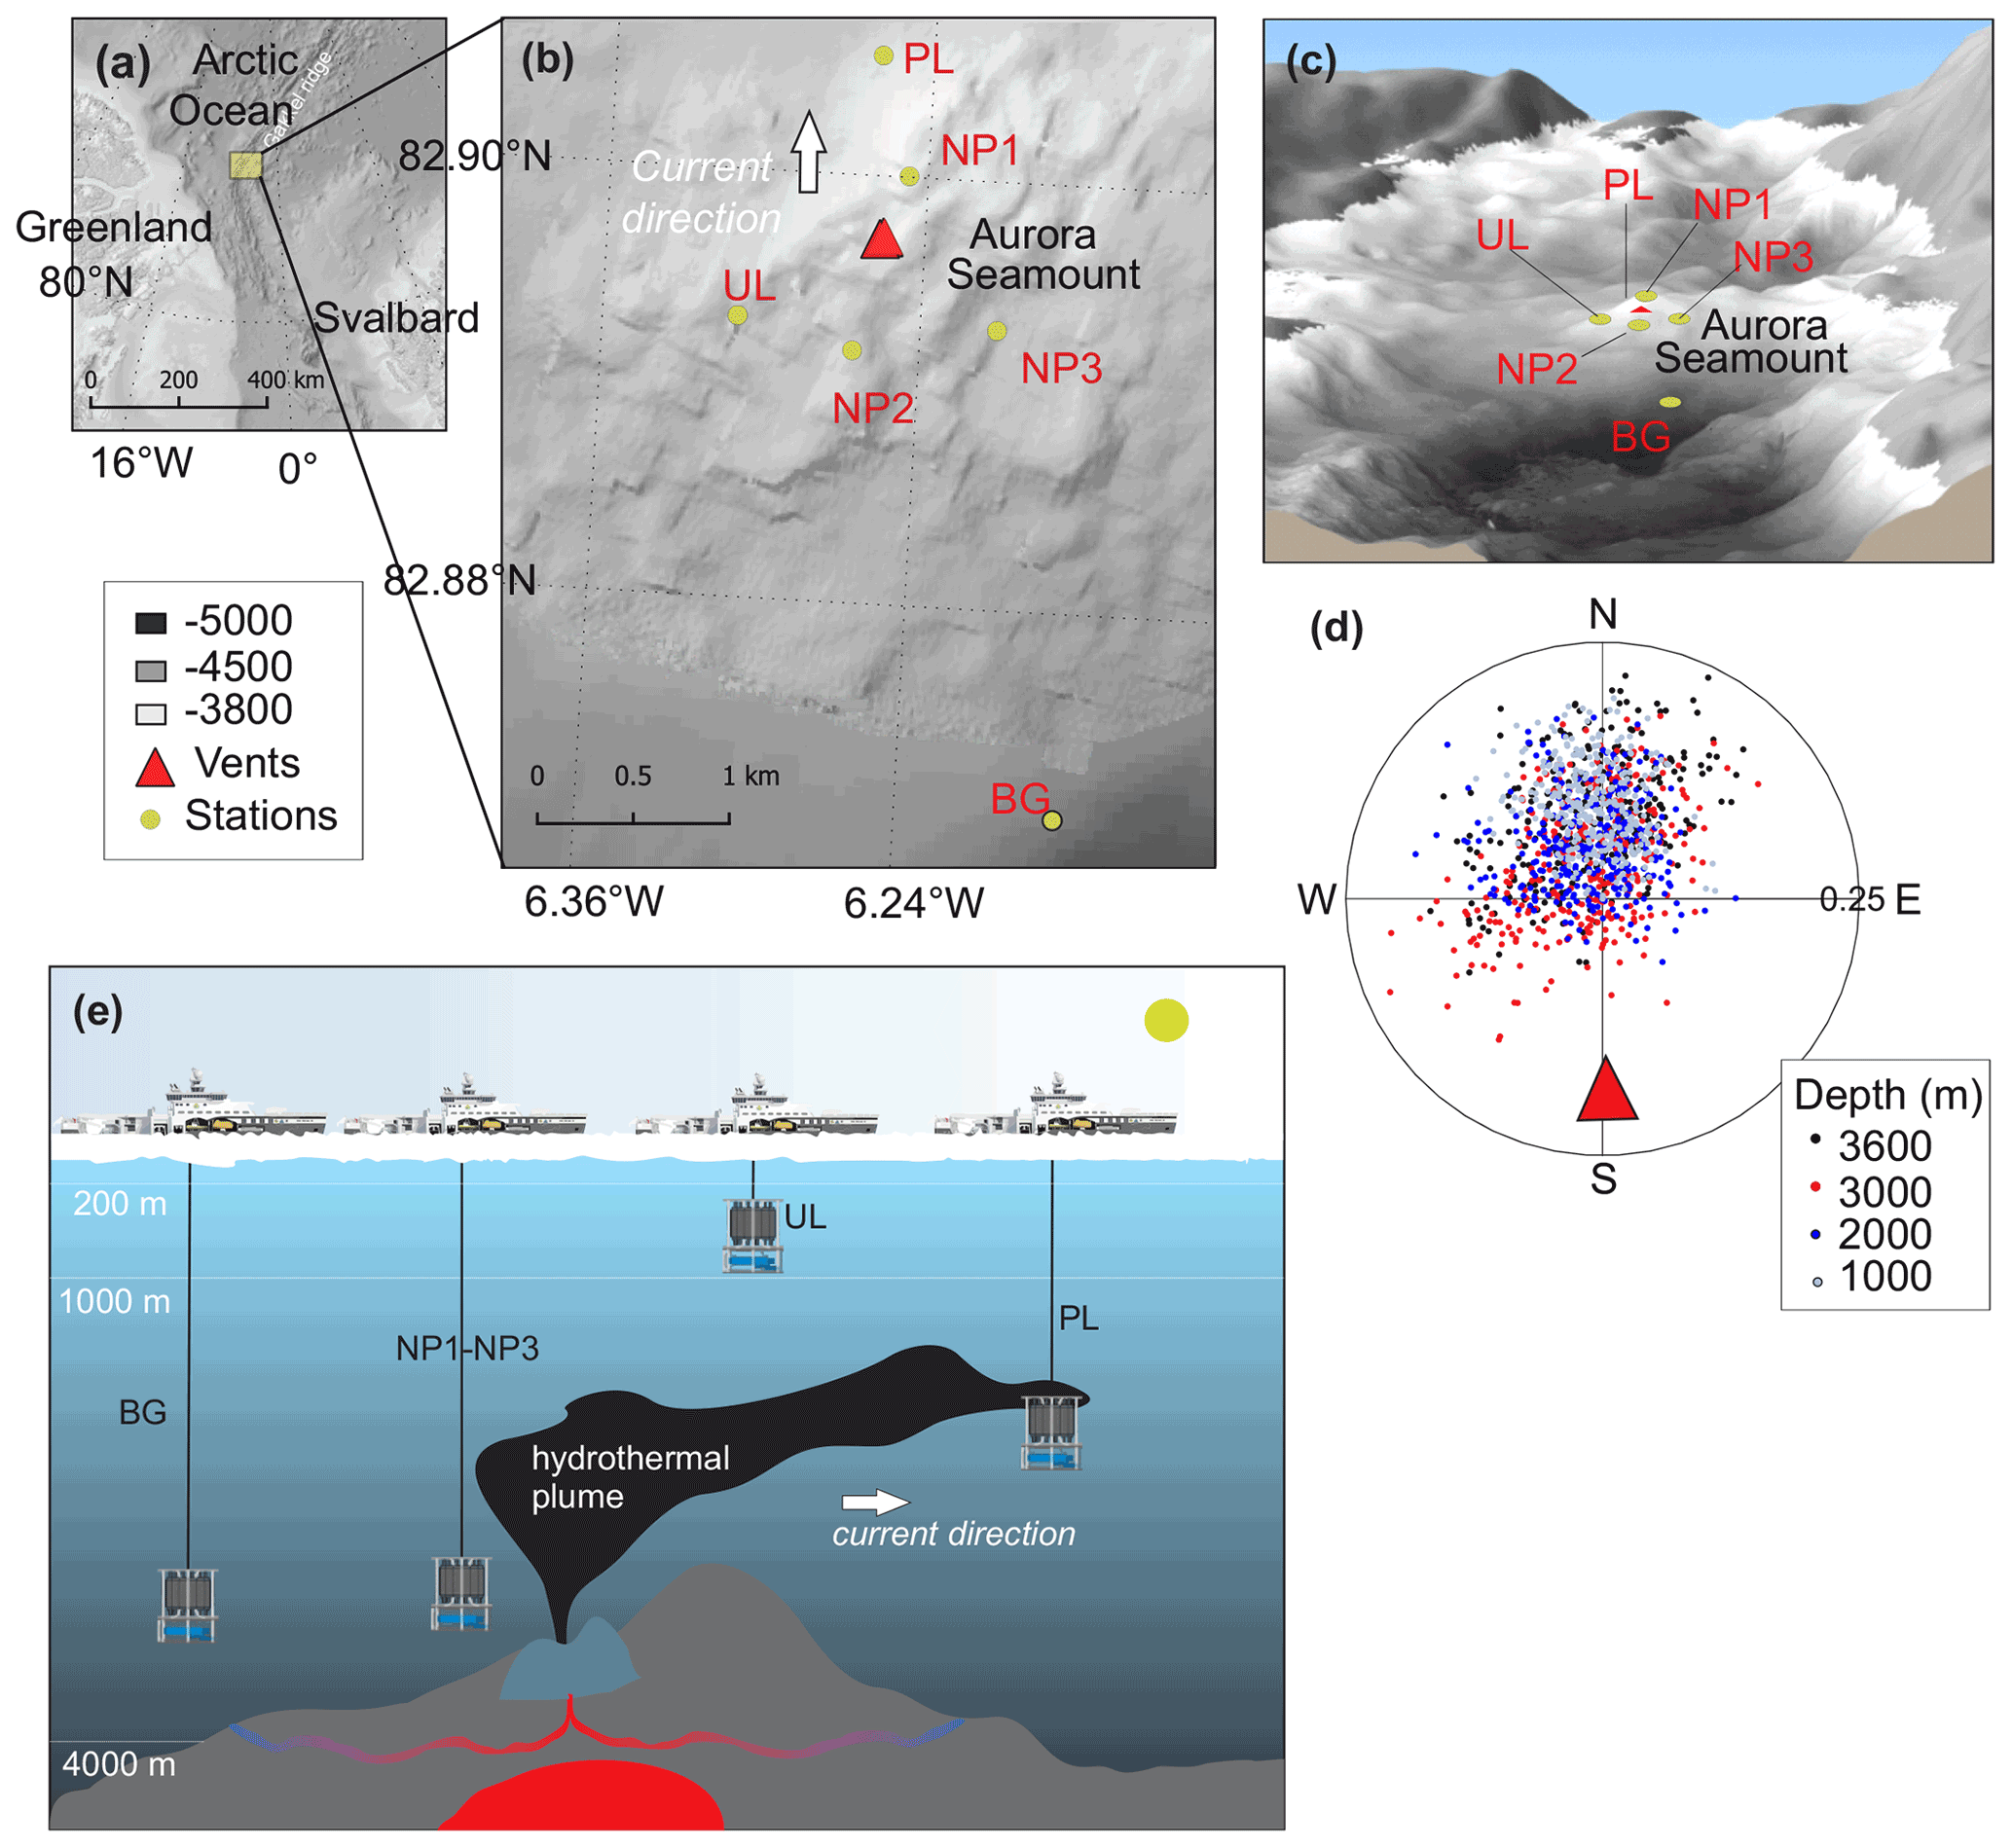
Figure 1(a) Study site in the Arctic Ocean. (b, c) Close-up of the study site showing the locations of the background station (BG), plume layer station (PL), non-plume stations (NP1 to NP3) and upper layer station (UL) on a bathymetric map (IBCAO; Jakobsson et al., 2008). (d) Direction and the current velocity obtained from the LADCP (lowered acoustic Doppler current profiler) at the PL station where each point represents an average of a depth bin calculated from east and north velocity components. (e) The graphical representation of station locations with respect to the dispersion of the hydrothermal plume, current direction and the oceanic layers.
2.2 Water sampling and analyses
2.2.1 Sampling/sub-sampling
We collected water samples from six stations near the Aurora hydrothermal vent field during the HACON19 research cruise on board R/V Kronprins Haakon (September–October 2019) (Fig. 1). Sea ice and the upper 1000 m of the water column were sampled at the upper layer (UL) station southwest of the vents. Plume (PL) and non-plume (NP1, NP2, NP3) stations were designated to observe the spreading of the hydrothermal plume and were measured from 2000 m depth down to 10 m a.s.f. (<4500 m water depth). A background station (BG) was sampled further away from the seamount (Fig. 1e). At this station, measurements were done from 2000–4500 m water depth similarly to the PL and NP stations (Table 1).
Table 1Sampling stations, positions, water depth and measured parameters at corresponding sampling depths for methane, δ13C-CH4, dissolved organic matter (DOM) composition and nutrients (see text for details).
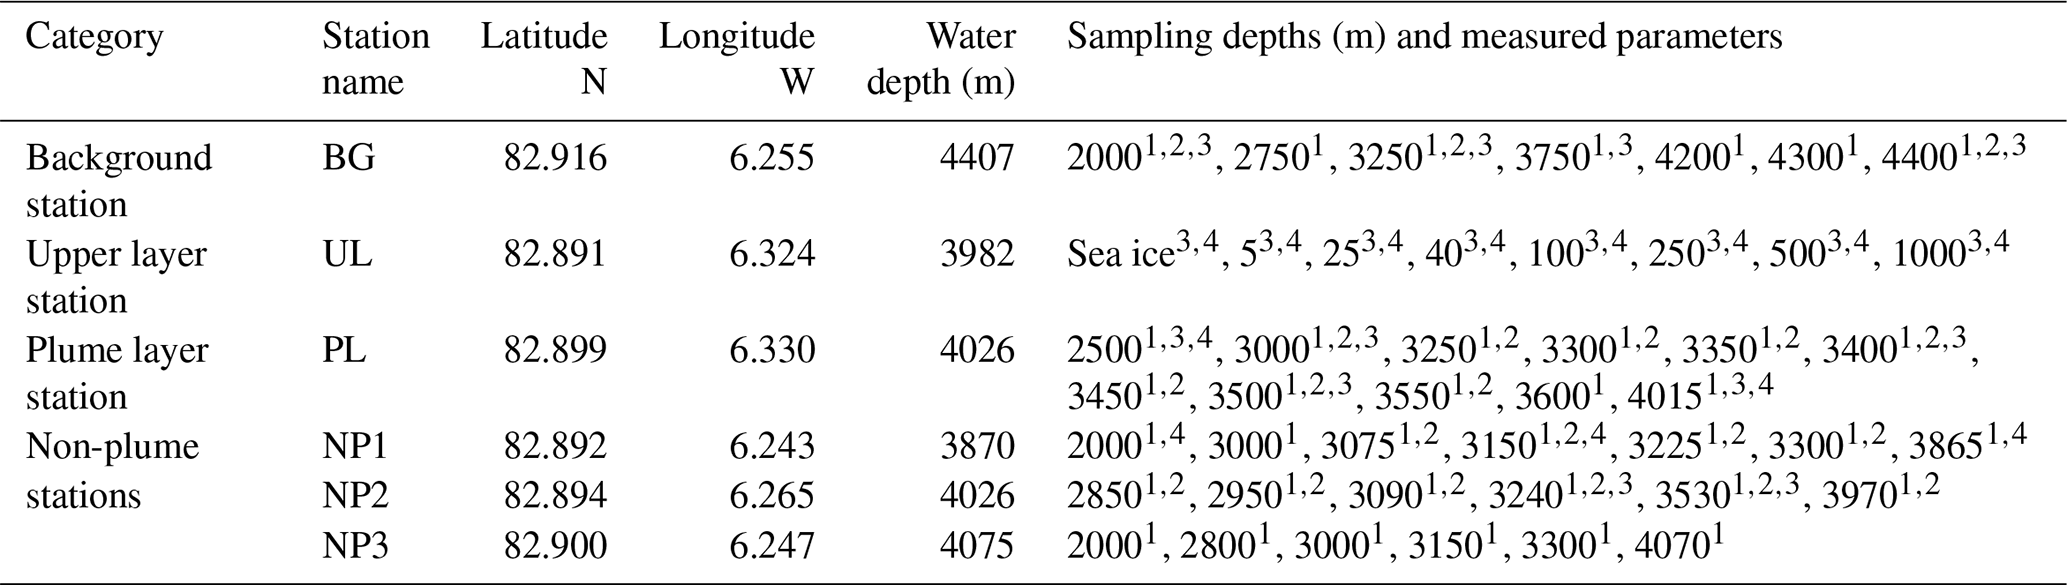
1 Methane concentration. 2 δ13C-CH4.3 DOM composition. 4 Nutrients.
Seawater samples were collected at selected sampling depths using Niskin bottles attached to a rosette (Table 1). Sea ice was sampled at the surface of UL, thawed in a high-density polyethylene (HDPE) container at room temperature and further treated similarly to the seawater samples collected with the rosette sampler.
Duplicate samples for methane concentration and stable C isotope ratios (δ13C-CH4) were collected immediately after the recovery of the rosette sampler into 120 mL airtight syringes and pre-evacuated rubber-stoppered serum vials, respectively. Care was taken to purge sampling lines of any bubbles, and methane samples were typically the first collected upon opening of Niskin bottles. Methane concentrations from two independent samples (i.e., Niskin bottles closed at the same depth) typically agreed to within ±10 %–20 % (two standard deviations; note that we could take duplicate samples only occasionally). For DOM and nutrient characterization, seawater was first transferred into acid-washed (2 % HCl) glass bottles (2×1135 mL) and filtered through pre-combusted (400 ∘C, 5 h) GF/F filters (Whatman) within 2 h after collection using a low-pressure vacuum. Nitrate, phosphate, silicate, ammonium, total nitrogen, total phosphorus, and dissolved organic carbon (DOC) samples were collected in 60 mL HDPE bottles from the filtrate and stored at −20 ∘C. Samples for dissolved inorganic carbon (DIC) and δ13C-DIC measurement were taken and poisoned with 10 µL HgCl2 and stored at 4 ∘C. Seawater aliquots for δ18O-H2O analysis were sampled in 20 mL clear glass vials and stored at 4 ∘C. For solid phase extraction of DOM, 1 L of filtrate was acidified to pH 2 with HCl (37 % , Merck) and extracted with preconditioned (with 6 mL methanol + 12 mL pH 2 water) 500 mg PPL cartridges (Bond Elut, Agilent Technologies) as described previously (Dittmar et al., 2008). Loaded cartridges were dried under air vacuum for ∼30 min, and any organics retained in the cartridges were then eluted into pre-combusted, amber glass vials with 2 mL methanol and stored at −20 ∘C until analysis in Fourier-transform ion cyclotron resonance mass spectrometer (FT-ICR MS).
2.2.2 CTD and LADCP measurements
Sensor-based profiling of the water column was conducted with a Sea-Bird SBE 911 plus CTD (conductivity–temperature–depth) profiler (accuracies of 0.3 db, 0.001 ∘C, 0.002 for salinity (practical salinity scale, unitless)), an SBE 43 coupled with a dissolved oxygen sensor (calibrated by Winkler (1888) titration), a Wet Labs ECO chlorophyll fluorometer (excitation/emission: 470695 nm; sensitivity and limit of detection 0.01 µg L−1) and a Wet Labs C-Star beam transmissometer. As a proxy for turbidity, the beam attenuation coefficient (c, m−1) at 650 nm was determined by post calibration (see Fig. S1 in the Supplement). The sampling rosette was equipped with a HiPAP (High Precision Acoustic Positioning, Kongsberg Maritime) acoustic beacon to obtain real-time positioning at depth. Two Lowered Acoustic Doppler Current Profilers (LADCP) were mounted on the CTD rosette in downward- and upward-looking configurations. The CTD rosette was stopped at predefined depths for 10 min for LADCP measurements, and the raw data were corrected against the continuous drift of the vessel based on HiPAP data (see Fig. S2 in the Supplement).
2.2.3 Analysis of seawater constituents and dissolved gases
Nitrate, nitrite, silicate, phosphate, ammonium, total phosphorus, and total nitrogen concentrations were measured with a segmented flow nutrient analyzer (Alpkem Flow Solution IV, OI Analytical), based on colorimetry, with associated detection limits and precision for nitrate (0.5±0.1 µM), nitrite (0.05±0.01 µM), phosphate (0.06±0.01 µM), silicate (0.4±0.1 µM), and ammonium (0.01±0.01 µM). Dissolved organic nitrogen (DON) was determined from total dissolved nitrogen by subtracting the concentrations of dissolved inorganic nitrogen (nitrate + nitrite + ammonium). Similarly, dissolved organic phosphorus (DOP) was calculated from total dissolved phosphorus by subtracting phosphate concentration. Dissolved organic carbon (DOC) concentrations were measured with a TOC analyzer (MQ-1001) utilizing a high-temperature combustion technique (Qian and Mopper, 1996). Deep-ocean DOC reference samples (Hansell Laboratory, University of Miami) were used to monitor precision and accuracy. DIC concentrations, δ13C-DIC and δ18O-H2O were measured on a Thermo Scientific MAT253 isotope ratio mass spectrometry (IRMS) and presented in the delta notation as δ13C relative to Vienna Pee Dee Belemnite (VPDB) and δ18O relative to Vienna Standard Mean Ocean Water (VSMOW). The IRMS was calibrated with international standards VSMOW2, GISP (Greenland ice sheet precipitation), SLAP2 (Standard Light Antarctic Precipitation 2), and VPDB, and the uncertainty of single measurements is ≤0.01 ‰. Dissolved methane concentrations were measured on board following headspace extraction with nitrogen using a gas chromatograph (GC) equipped with a flame ionization detector following the procedure used in German et al. (2010). For δ13C-CH4 measurements, samples were quantified on board by a Picarro cavity ring-down spectrometer instrument (as per McDermott et al., 2017).
2.3 Fourier-transform ion cyclotron resonance mass spectrometry analyses and molecular formula assignments
FT-ICR MS analyses to evaluate the composition of DOM samples were carried out with a 12T Bruker solariX FT-ICR mass spectrometer (Bruker Daltonics, Bremen, Germany), equipped with a dynamically harmonized ICR cell (ParaCell) and an Apollo-II electrospray ionization (ESI) source, operated in both positive-ion and negative-ion modes. For the MS analyses, 100 µL aliquots of DOM samples were diluted 1:10 () with methanol (HPLC grade). ESI was selected as the ionization technique due to its ability to ionize polar, oxygen-containing compounds present in the DOM samples (Mopper et al., 2007). The samples were directly infused into the ion source by a syringe pump, operating at a flow rate 2 µL min−1. Dry nitrogen was used as the drying and nebulizing gas. The ESI-generated ions were accumulated in the hexapole ion trap and transferred into the ICR cell for trapping, excitation and detection. For each spectrum, 100 scans were co-added over a mass / charge ratio () range of 150–2000. The Bruker Compass ftmsControl 2.1 software package was used for instrument control and data acquisition.
Initial spectral post-processing was done with the Bruker DataAnalysis 5.0 SR1 software, including an internal mass re-calibration with an in-house calibration list for the DOM samples. The data were then transferred to the PetroOrg IS-18.0.3 software (Omics LLC, Tallahassee, FL, USA) for molecular formula assignments. Only mass peaks with a signal-to-noise ratio were considered. In the assignments of the molecular formulas, monoisotopic compositions were limited to with a double bond equivalent (DBE) of 0–50 and a mass error of ≤1.0 ppm. Relative intensities were calculated by normalization with the most abundant ion in each mass spectrum (Kujawinski et al., 2009). Assigned molecular formulas were then generated for each sample at positive- and negative-ion modes and combined to obtain a single molecular formula list. In case of duplicate formula, relative intensity obtained from the negative ESI was considered. The combination of negative and positive mode ESI provides a better representation of DOM composition for the carboxylic and acidic compounds (negative ESI) and hydrogen-saturated aliphatic compounds (positive ESI) (Ohno et al., 2016; Sert et al., 2020).
From the combined formula lists, chemical characterization of DOM compositions was conducted to obtain percentages of (i) three categories of heterogeneous atomic content as CHO, CHON, and CHOS and (ii) H:C and O:C atomic ratios and ranges on van Krevelen diagrams (Kim et al., 2003). Considering the H:C and O:C atomic ratios of major biomolecules, ranges of H:C and O:C were generically associated with four biochemical compound categories, disregarding structural differences and atomic compositions of individual formulas in the group. These categories are (a) lipid- and protein-like (LPD) for , ; (b) carbohydrates and amino-sugar-like (CAR) for , ; (c) unsaturated hydrocarbons and condensed aromatics (UHC) for , and , ; and (d) lignin- and tannin-like (LGN) for , . Boundaries were modified from Hockaday et al. (2009) and Hodgkins et al. (2016) as explained previously (Sert et al., 2020). For calculating percentages, the number of formulas that associated with a given category was divided by the total number of formulas in the sample and multiplied by 100. For example, the sum of the percentages of LPD, CAR, LGN and UHC is equal to 100 %, and, similarly, the sum of the percentages of CHO, CHON and CHOS is equal to 100 % for each sample.
2.4 Statistical analyses of DOM samples
Statistical analyses were performed in R (R Core Team, 2018). Diversity indices for DOM samples were calculated by the “diversity” function analogous to biodiversity in ecology using the Shannon–Weaver formulation (Oksanen, 2020) as explained previously (Sert et al., 2020). A Bray–Curtis dissimilarity (distance) matrix (Bray and Curtis, 1957) was constructed by using relative intensities of formulas from 11 DOM samples that were collected >2000 m in stations BG, PL and NP2. Hierarchical cluster analysis was applied for DOM compositions using a Ward clustering algorithm (“hclust” function in vegan) on a Bray–Curtis dissimilarity matrix. A heat map was constructed to visualize the sample clusters and the relative dissimilarities. Principal coordinate analysis (PCoA) was applied by using “pcoa” function in the R package APE (Paradis and Schliep, 2019) on the Bray–Curtis dissimilarity matrix. The ordination plot was constructed from the first two main axes that represent the highest variation between samples. Percentages of explained variances on two main axes were calculated by dividing the two highest eigenvalues to the sum of all eigenvalues.
3.1 Water column physical and chemical properties
Water circulation in the Eurasian part of the Arctic Ocean is mainly characterized by Atlantic inflow and Arctic outflow through the Fram Strait, with a monthly mean volume of 9.5 and 11 Sv, respectively (Fahrbach et al., 2001). We categorize the water column in three water layers as epipelagic (0–200 m), mesopelagic (200–1000 m) and bathypelagic (1000–4000 m) considering the depth and the four water masses that are defined by the density layers of σt≤27.7 for Polar Surface Water (PSW), for Arctic Atlantic Water (AAW), σt>27.97 and σ0.5≤30.444 for Arctic Intermediate Water (AIW), and σ0.5>30.444 for Deep Water (DW) (Marnela et al., 2008; Rudels et al., 2005). The epipelagic layer contains PSW until 165 m depth with temperatures ranging between −1.7 and 0.4 ∘C and salinity from 31.6 to 34.65 (Fig. 2a–e). AAW exists beneath PSW from the bottom of the epipelagic layer down to 450 m and includes a temperature maximum of 1.27 ∘C at 350 m. From 450 to 1400 m, the temperature decreases from 0.9 to −0.5 ∘C in a steep thermocline, forming AIW. AAW and AIW together form the East Greenland Current that carries Arctic waters southwest along the Greenland coasts and gradually mixes with the convected surface waters (Rudels et al., 1995). Below the AIW layer, water temperature decreases to −0.73 ∘C at around 2500 m, where DW fills the Eurasian Basin. Here, the density is largely controlled by salinity rather than temperature, and the shape of the density profile is almost identical to the salinity profile (Fig. 2b and c). Despite the dominant sea ice cover at our study area, preventing solar radiation from reaching the water column, a chlorophyll a (Chl a) fluorescence signal was detected down to 200 m depth (Fig. 2d). At all stations, the first 40 m below the sea surface showed a Chl a maximum with an average concentration of 0.17 µg L−1, followed by a decrease to 0.10 µg L−1 at 50 m. From this depth, concentrations gradually decreased further until the detection limit (0.01 µg L−) was reached at the bottom of the epipelagic layer (Fig. 2d).
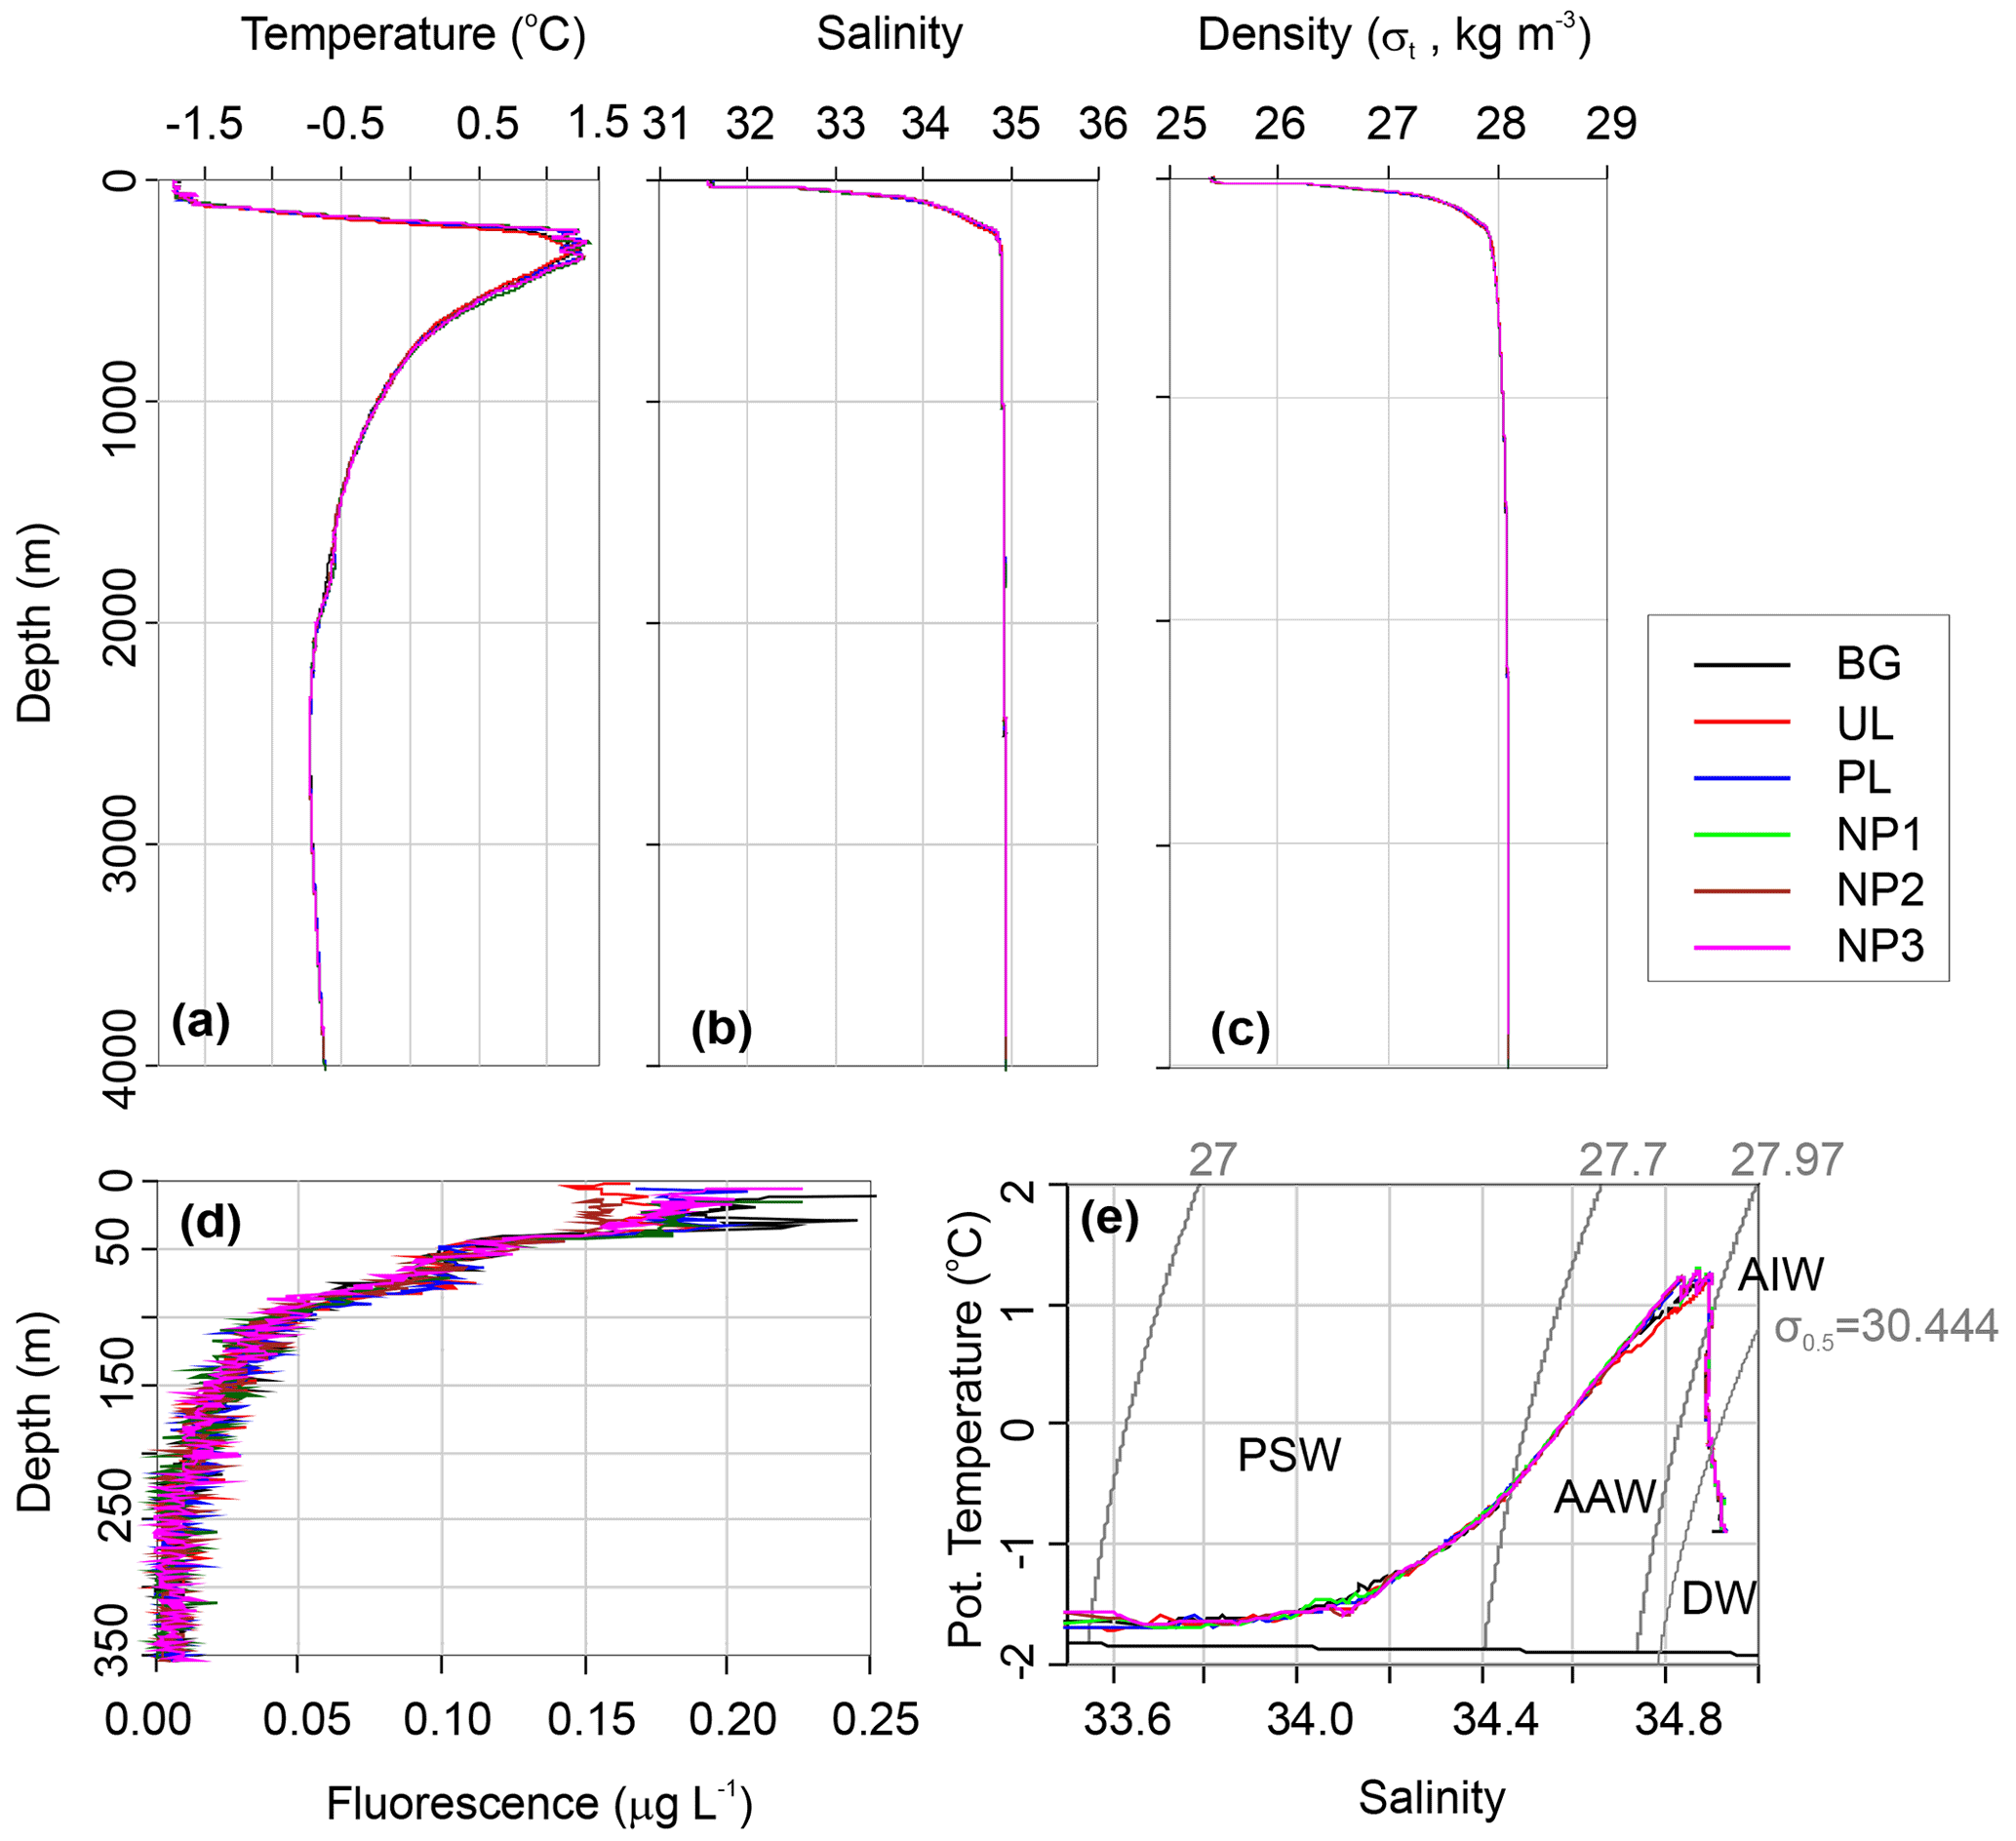
Figure 2Depth profiles of (a) in situ temperature, (b) salinity on the practical salinity scale, (c) potential density, (d) Chl a fluorescence, and (e) potential temperature vs. salinity profile along with the characterized water masses, Polar Surface Water (PSW), Arctic Atlantic Water and Arctic Intermediate Water (AAW/AIW), Arctic Deep Water (DW) in the background (BG), upper layer (UL), plume (PL) and non-plume (NP1–NP3) stations.
Nutrient profiles, nutrient ratios, δ13C-DIC and δ18O all display a typical deep-ocean surface-to-bottom gradient and were identical at all stations (Fig. 3). Nitrate, phosphate, and silicate concentrations were lowest at the surface (5 m) with 1, 0.44, and 6.1 µM, respectively, and increased gradually to average bathypelagic concentrations of 14.8, 0.96 and 12.0 µM at 2000 m (Fig. 3a–c). On the contrary, dissolved organic nutrients were highest in the epipelagic layer with the maximum concentrations of 92 µM for DOC at 100 m and 6.2 µM for DON at the surface (Fig. 3e and f). Similarly, ammonium and DOP were detectable only in the epipelagic layer with average concentrations of 0.2 and 0.1 µM, respectively (see Fig. 3d for ammonium; DOP is not plotted). Nitrate, phosphate, and silicate concentrations in sea ice were below the detection limit; however, detectable concentrations of ammonium (0.6 µM), DOC (4.0 µM) and DON (0.6 µM) were measured in sea ice.

Figure 3Depth profiles of (a–d) dissolved inorganic nutrients, (e) dissolved organic carbon (DOC), (f) dissolved organic nitrogen (DON), (g) δ13C of dissolved inorganic carbon (DIC) and (h) δ18O of water, and (i–l) nutrient ratios in sea ice and sampling stations background station (BG) and in sampling stations in the upper layer (UL), plume (PL) and non-plume (NP1, NP2). Axis breaks are used for a better visualization of ammonium concentration and δ13C-DIC values. Total dissolved nitrogen (TDN) = nitrate + nitrite + ammonium + DON. Red dashed lines indicate the non-buoyant plume layer at PL.
δ18O values were obtained in three different concentration ranges that changed with depth. Sea ice had a δ18O value of −4.53 ‰. At the top 100 m, δ18O had an average value of −2.24 ‰. From 250 m to bottom δ18O was uniform with an average of 0.36 ‰ (Fig. 3h). This corresponds to water mass properties with contributions from sea ice melt waters and Arctic river runoff with negative δ18O values in the upper 100 m within PSW, compared to highly uniform deep-water ratios. Our δ18O measurements are comparable to previous measurements in the area that reported ∼0.3 ‰ in deep water and −2.6 ‰ to −1.6 ‰ in the upper 100 m (Bauch et al., 1995; Östlund and Hut, 1984).
A δ13C-DIC value of −13 ‰ was measured in sea ice. δ13C-DIC values decreased from 0.86 ‰ at the surface to 0.44 ‰ at 250 m and gradually increased to 0.62 ‰ at 1000 m. δ13C-DIC changed in a narrow range from 2000 m to bottom with an average composition of 1.03 ‰ (Fig. 3g). Sea ice coverage in the Arctic Ocean has been decreasing by ∼9 % per decade, leading to a longer growing period for phytoplankton and associated increase in net primary production (Arrigo and van Dijken, 2015, and references therein). Taken together with the imprint of the anthropogenic CO2 (with a δ13C value of ca. −8.5 ‰), δ13C-DIC values obtained at the sea ice and the upper layer of the water column are linked to contributions of several factors, including biological productivity, air–sea gas exchange and sea ice or brine formation, which admixes DIC with a lighter δ13C signature compared to that of deep waters. For example, deep-water δ13C-DIC values of 1.0 ‰±0.2 ‰ were found in the Canada Amundsen and Nansen basins (Bauch et al., 2015; de la Vega et al., 2019). At the time of sampling, the net growth of phytoplankton seems to decelerate at the top 50 m layer of the water column considering the nutrient depletion and the subsurface maxima of Chl a at ∼40 m water depth. During the Arctic summer (from March to September), this layer gets depleted in inorganic nutrients and enriched in dissolved organic matter (Thingstad et al., 1997). In the deeper layers, nitrate / phosphate and nitrate / silicate ratios are almost identical to the Redfield ratios of 16:1 and 1:1, respectively (Redfield, 1958) (Fig. 3i and j). Ratios of nitrate / phosphate (2.3:1–5.2:1) and nitrate / silicate (1:5–1:2.5) in the 0–100 m layer indicate that nitrate limits primary production. With the contribution of the epipelagic DON, however, surface/subsurface TDN / phosphate (16.3:1) and TDN / silicate (1.2:1) ratios became comparable with the mesopelagic / bathypelagic ratios (Fig. 3l). This indicates that DON may be used as a nitrogen source to support bacterial growth, considering that such low primary production cannot sustain the bacterial demand in relation to limited light and low water temperature (Fouilland et al., 2018). Besides nitrogen, silicate was also limiting at the surface waters when compared to phosphate (silicate / phosphate ratios of ). Thus, perhaps due to diatom growth, silicate demand accompanies bacterial phosphate regeneration below the surface, lowering the silicate / phosphate ratios (7.6:1–9.6:1) compared to the deep ocean (12.4:1) (Fig. 3k).
3.2 Dispersion of the hydrothermal plume
Turbidity anomalies, elevated methane concentrations and varying δ13C-CH4 values in the vertical profiles imply that the plume rises from the ∼3900 m deep vent up to ∼3000 m in the water column and spreads laterally northward in the direction of the prevailing water current (Fig. 1d). Irrespective of the vent setting, tectonic structure, and background currents, previous studies and models imply that the fundamental physics behind the spreading of hydrothermal plumes are commonly characterized by buoyant flow dynamics that have been described in depth for atmospheric systems (Tao et al., 2013). Upon entering the water column, a multi-phase plume rises and spreads laterally and carries dissolved gases and entrained particles that alter turbidity and methane concentrations in the non-buoyant plume layer (Fig. 4). Fundamental anomalies of venting fluids such as elevated temperature or low salinity can, on the other hand, become rapidly overprinted by ambient seawater background hydrography, making potential anomalies in these parameters undetectable with our instrumentation (Fig. 2). Similarly, parameters that are not strongly influenced by the vent plume intrusion (i.e., nutrients, DOC and DON concentrations) do not indicate any anomaly in relation to plume dispersion distant from the vent due to dilution with seawater (Fig. 3). This seems contradictory to molecular changes in DOM compositions (as detailed further in Sect. 3.3.3); however, it must be stated that solid phase extractable DOM represents only a portion of bulk DOM (43 % to 62 %; Dittmar et al., 2008), and compositional changes are not necessarily always coupled to large or substantial concentration changes. In essence, DOM molecular compositions may, more subtly, preserve some broad variations in end-member DOM traits than DOC and DON concentrations (Osterholz et al., 2016).
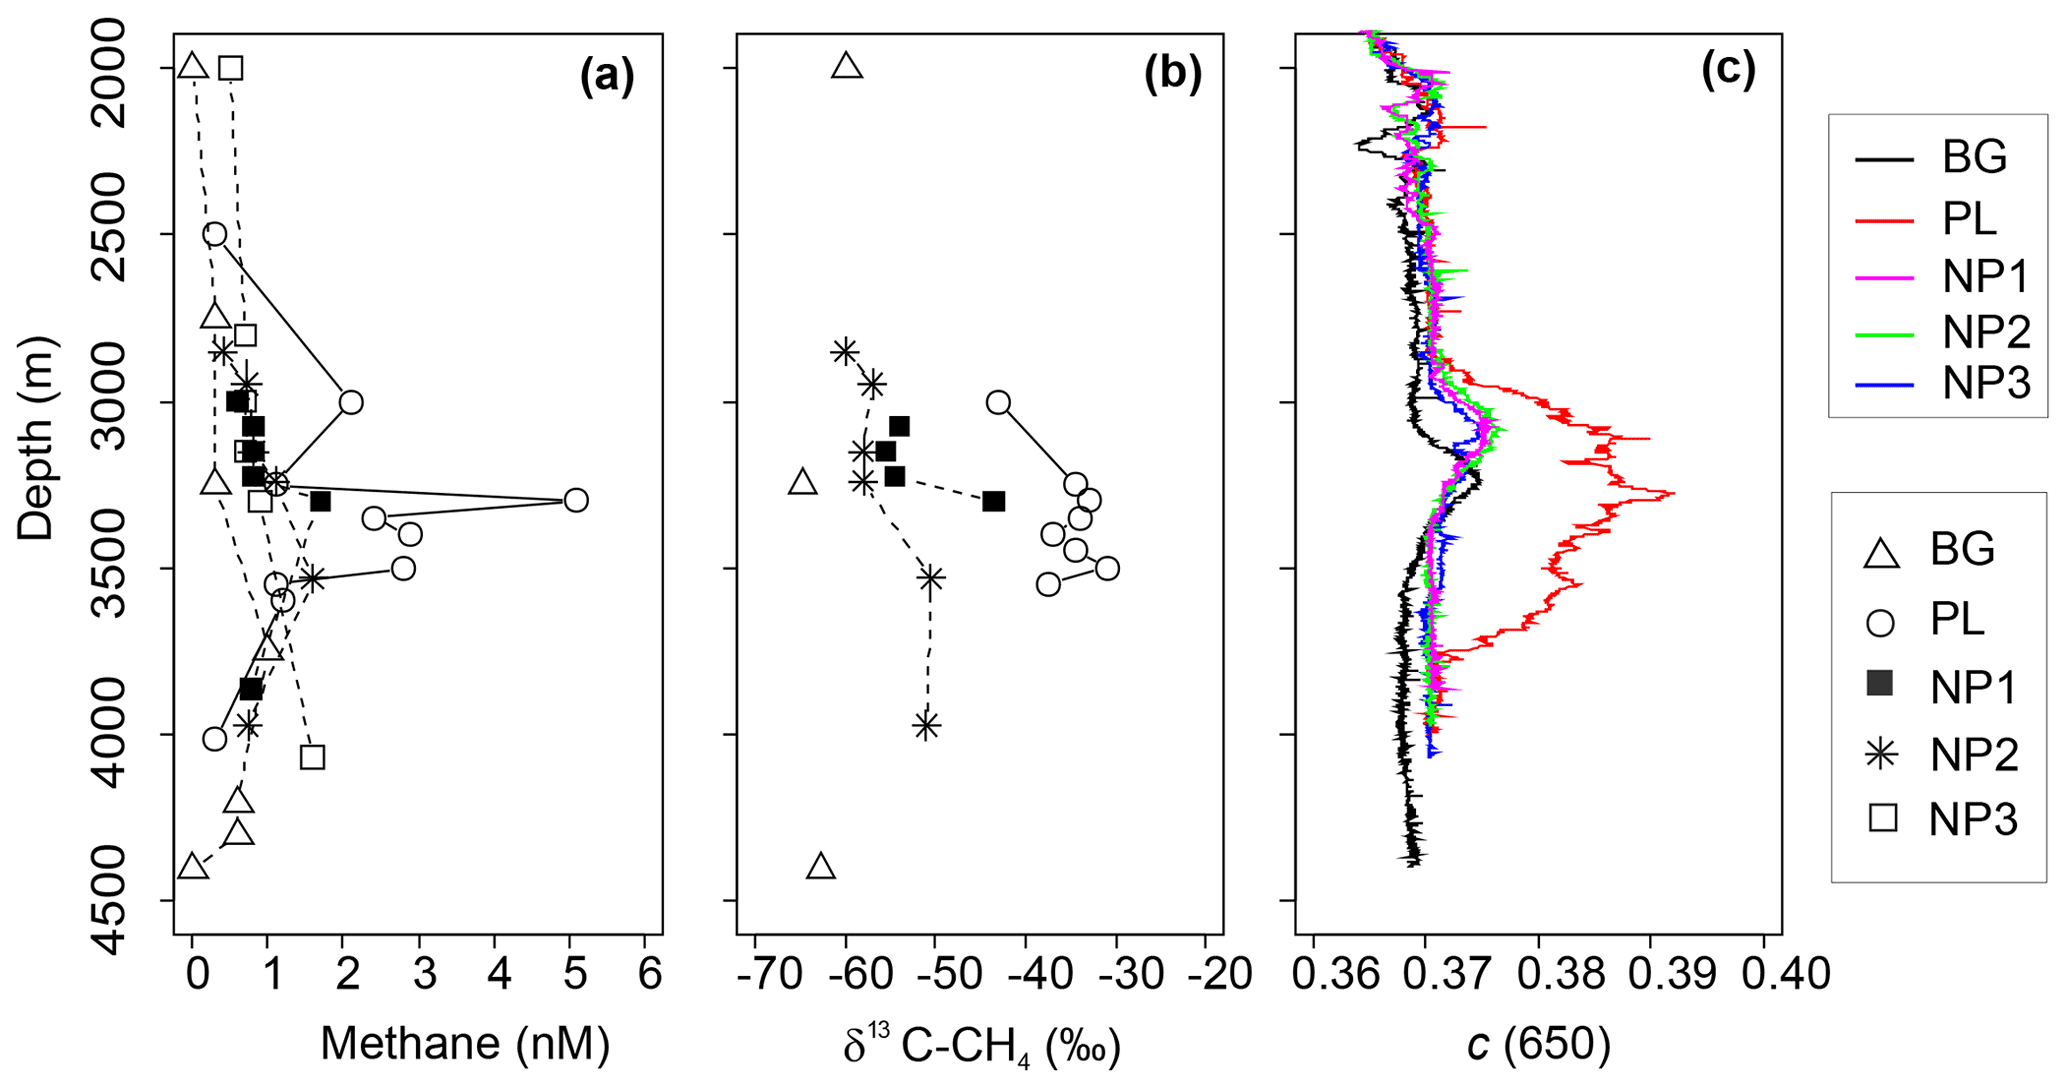
Figure 4Depth profiles of (a) methane (CH4) concentration, (b) δ13C-CH4 values and (c) beam attenuation coefficient at 650 nm (c) between 2000 and 4500 m depths in background (BG), upper layer (UL), plume (PL) and non-plume (NP1–NP3) stations.
Continuous drifting (often ∼0.2 kn or more) of massive (kilometer scale, ∼1 m thick) ice floes prevented the vessel from keeping stable positions on station while taking samples, and, together with time constraints, related to other operational needs of the expedition, precluded us from directly sampling the buoyant stem of hydrothermal plume immediately above the active Aurora site. Due to the extreme depths (near 4 km), it furthermore typically took 3–4 h to complete a single CTD cast, so that the distance between start and end positions of a given cast were often 300–500 m apart. Nonetheless, the exact location of sampling was determined based on HiPAP data. The thickness of the non-buoyant plume also varied depending on the position of the sampling station in relation to the vent location, current direction, and bathymetric features. Based on turbidity anomalies, methane concentrations, and δ13C-CH4 contents, the plume layer was most evident at station PL, which was, counterintuitively, the station furthest away from the seamount (Fig. 4a–c), yet consistent with the prevailing current direction (see Fig. 1d). Here, methane concentrations reached a maximum of 5.1 nM at 3363 m, which is >10-fold higher compared to ambient seawater concentrations (0.3 nM) as measured at similar depths at BG and coincides with the sharp maximum in turbidity. A small increase in turbidity was also measured at the other stations from 3000 to 3250 m, implying some level of perturbation from the hydrothermal intrusion (Fig. 4c), but these were not as strong as in PL and not accompanied with an increase in δ13C-CH4 values or methane concentrations. We found one exception to this at NP1, which was also at the northern side of the vents. Here, methane concentration (1.7 nM) and δ13C-CH4 (−43 ‰) were elevated at 3350 m, i.e., just below the turbidity anomaly.
Deep-water methane stable carbon isotope compositions in the Arctic Ocean have previously been reported with values ranging from −63 ‰ to −58 ‰ in the Beaufort and Chukchi seas, along with higher concentrations of methane of up to 55 nM (Damm et al., 2008; Kudo et al., 2018; Lorenson et al., 2016). These are attributed to microbial methanogenesis overprinting the atmospheric methane equilibrium signature (typically ∼3.5 nM and −47 ‰). We observed a similar range of δ13C-CH4 values with much lower concentrations of methane (e.g., −64.7 ‰ and 0.3 nM) at BG (3250 m) and argue that these values may also be caused by methanogenesis, possibly in sediments or even in the water column (Damm et al., 2010; Grossart et al., 2011; Karl et al., 2008), but we suggest that methanotrophs also consume methane there (Reeburgh, 2007). In contrast, we found relatively heavy methane isotope values together with maximum methane concentrations in the plume layer at PL (e.g., −33 ‰ and 5.1 nM) (Fig. 4). Methane at hydrothermal vents is typically produced non-biologically, either by abiogenic (C reduction) or thermogenic (breakdown) processes, and is generally characterized by much higher δ13C values (Whiticar, 1999; Reeves and Fiebig, 2020; Baumberger et al., 2016, and references therein). Abiogenic δ13C-CH4 values of ca. −5 ‰ to −20 ‰ are typically found in bare rock (mafic/ultramafic systems), while lower (thermogenic) values of ‰ to −56 ‰ are prevalent in systems influenced by hydrothermal alteration of sedimentary organic matter (Charlou et al., 2002; Baumberger et al., 2016; Wang et al., 2018; and references therein). Hence, the higher δ13C-CH4 values detected at PL provide strong evidence for a similar non-biogenic origin of plume methane venting from the Aurora site. While δ13C-CH4 values measured at the Aurora hydrothermal field are relatively depleted compared to many bare-rock-hosted hydrothermal systems, to some degree, this can be explained by both the distal nature of PL samples relative to the more concentrated buoyant plume and admixing of background seawater with its extremely isotopically depleted δ13C signature and low methane concentration values (−64.7 ‰ and 0.3 nM).
To further probe the dynamics of water column methane dynamics at Aurora, we applied a Keeling mixing model approach (Keeling, 1961; Keir et al., 2006). This end-member isotope mixing model is widely used in the fields of atmospheric chemistry/physics to analyze admixtures of two isotopically distinct gas sources and to determine the source isotope composition (e.g., Pataki et al., 2003). In a Keeling plot, the reciprocal of concentration is plotted against isotope composition (Fig. 5). In case of a linear mixing, the values scatter along a straight line, and the intercept with the y axis denotes the isotope value of the source signal. Our values of methane concentration and isotope composition show predominantly linear behavior, indicating that the mixing and dilution dominates the observed concentration and isotope systematics, as has been found in other Arctic settings (Damm and Budéus, 2003; Graves et al., 2015). More complex mixing scenarios involving mixing and methane oxidation were also suggested to explain methane isotope patterns in hydrothermal plumes (Keir et al., 2009). Though we cannot completely rule out some extent of microbial methane oxidation (particularly in the most distal samples), this process is associated with a significant kinetic isotope effect (Whiticar, 1999) and can even result in extremely high δ13C-CH4 values in microbially aged hydrothermal plumes (Keir et al., 2006; Cowen et al., 2002) . If such oxidation were pronounced, it would lead to substantial curvature in a Keeling plot by shifting the residual methane towards heavier isotopic values at lower concentrations (higher ).
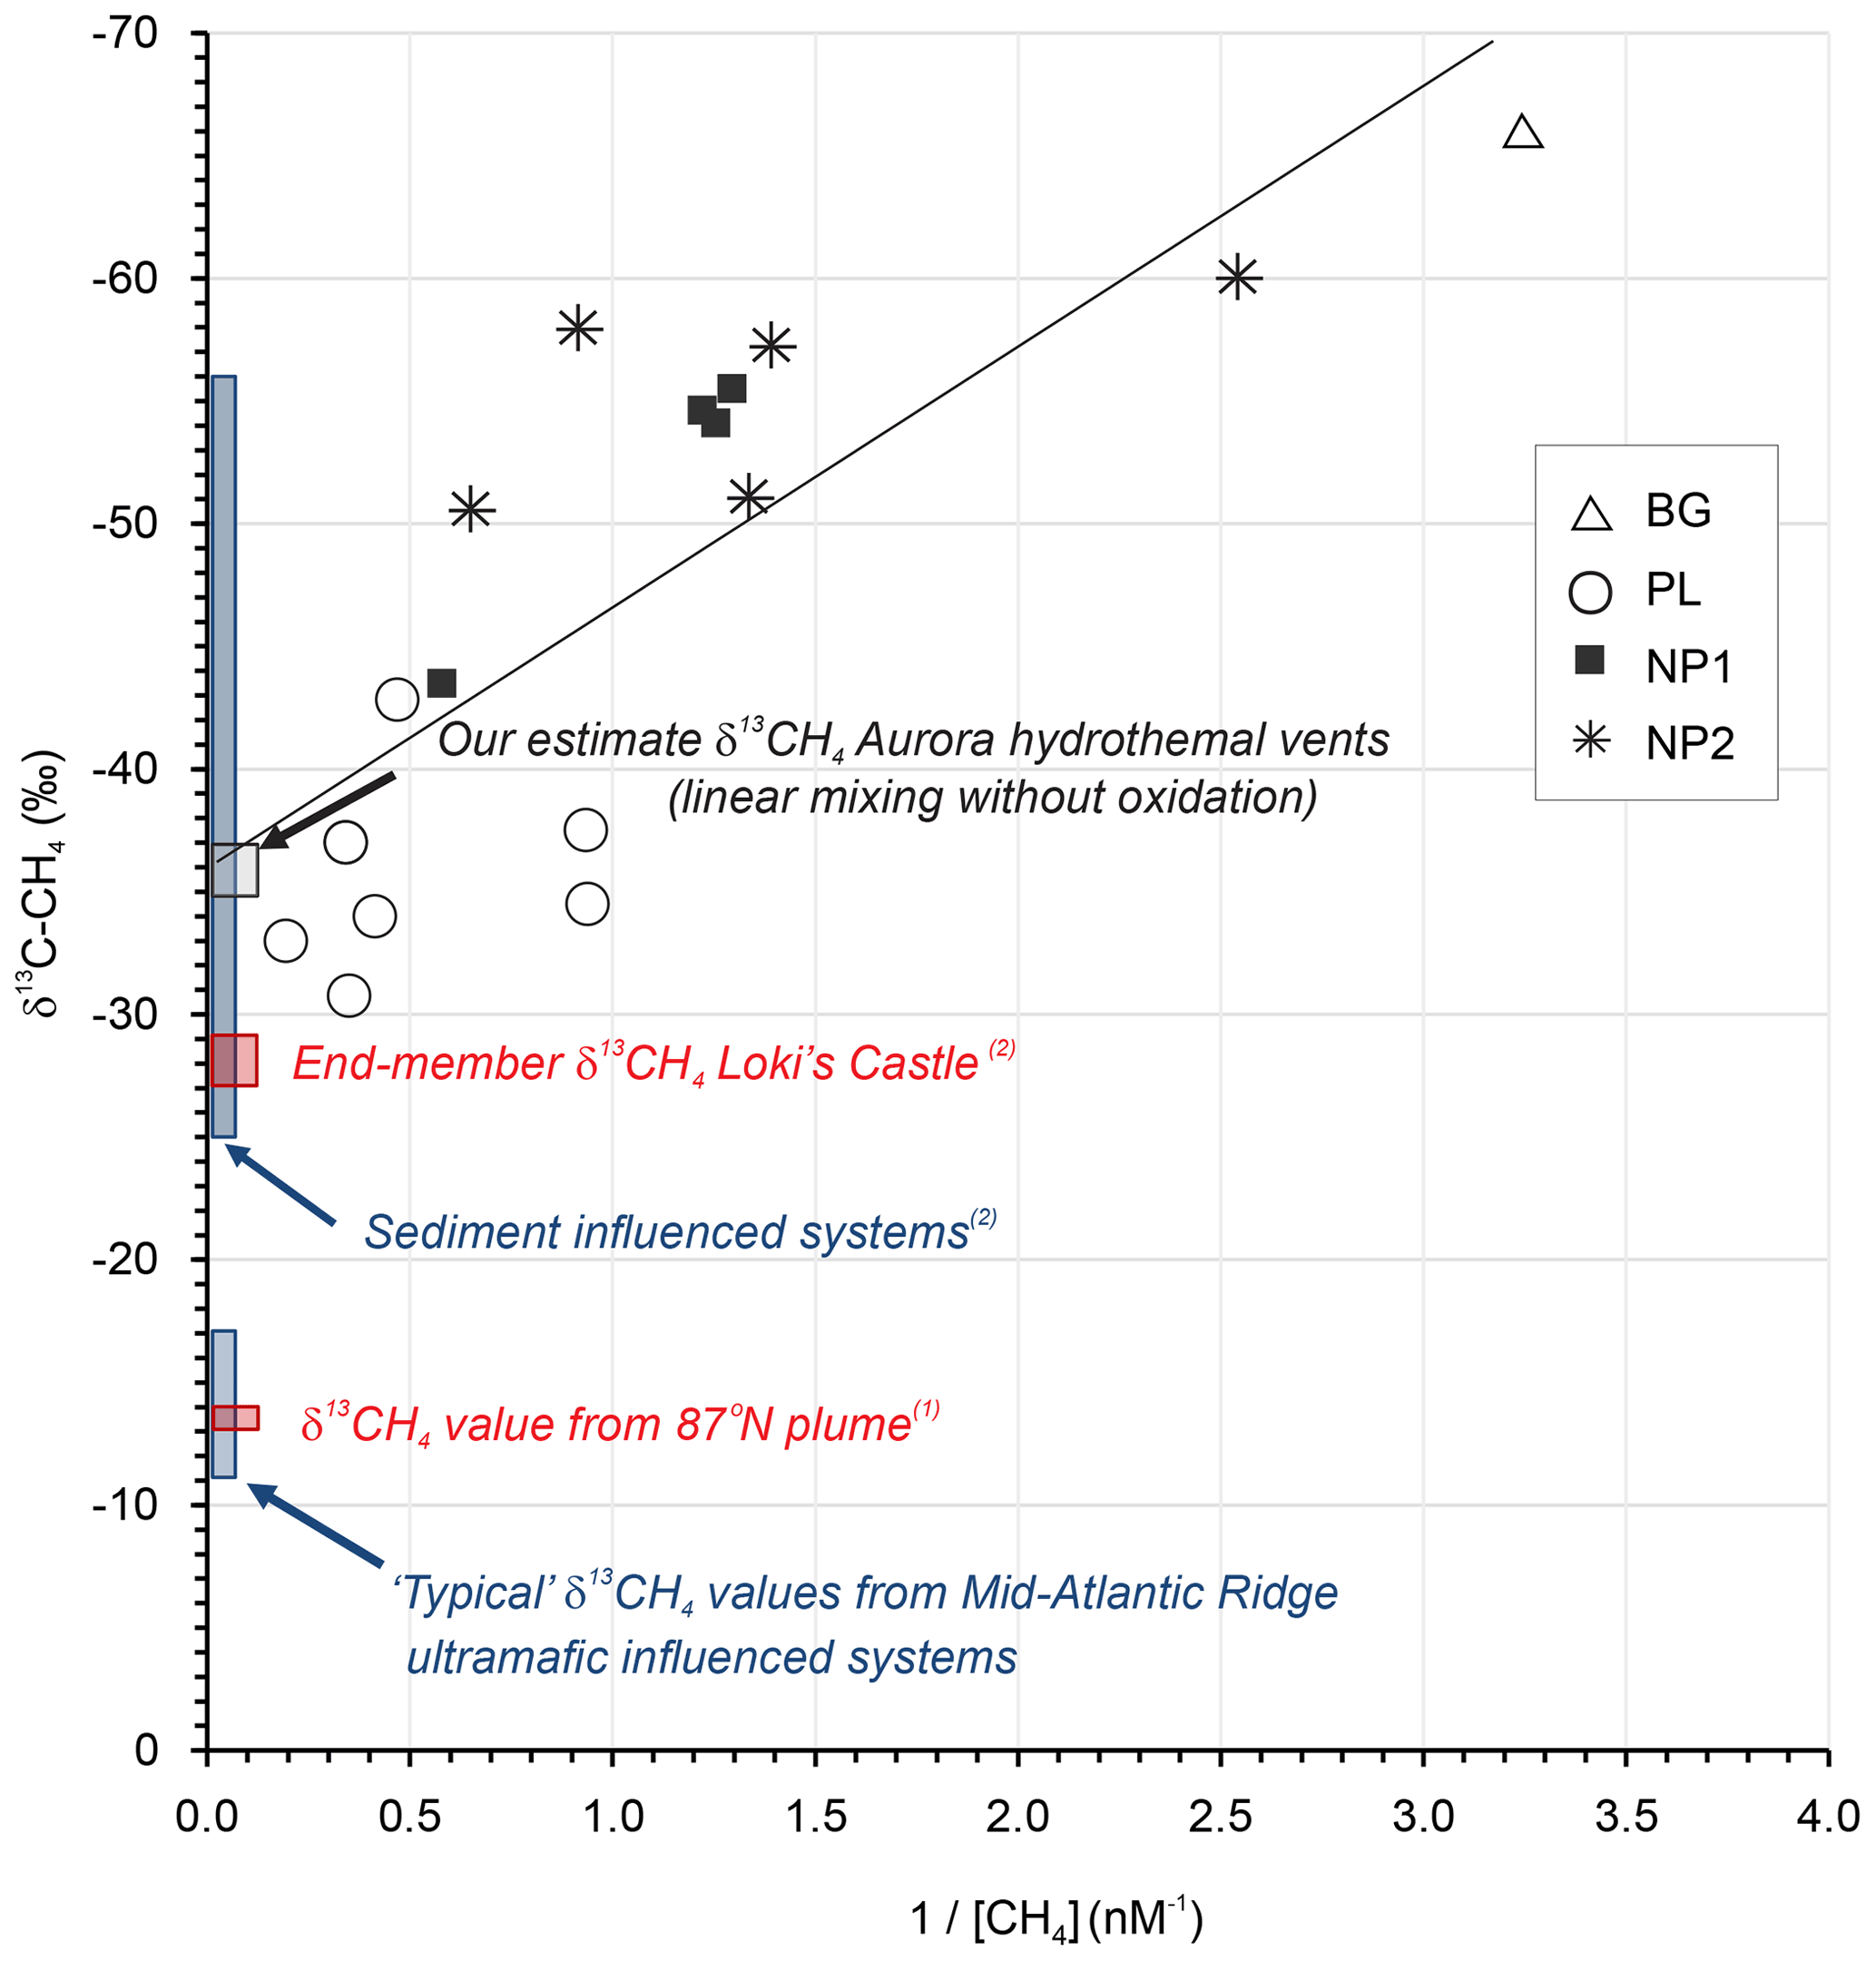
Figure 5Keeling plot for δ13C-CH4 versus for the data obtained in background (BG), upper layer (UL), plume (PL) and non-plume (NP1–NP3) stations (Keeling, 1961; Keir et al., 2006). Plotted also are “closest approach” δ13C-CH4 value reported for the 87∘ N hydrothermal plume on the Gakkel Ridge (1 McDermott et al., 2017), end-member hydrothermal fluid δ13C-CH4 values from Mid-Atlantic Ridge black smoker systems known to be influenced by ultramafic rock, and the sediment-influenced Loki's Castle system (2 Baumberger et al., 2016, and references therein).
Considering a “mixing without oxidation” scenario and under the assumption of linear mixing (Keir et al., 2009), we estimate the δ13CH4 value of the hydrothermal fluid source to be −36 ‰ using a least squares linear regression of the entire plume methane dataset (R2=0.59), with an intercept uncertainty of ±3 ‰ at the Aurora hydrothermal field (Fig. 5). The estimate is interesting, since the Aurora hydrothermal system has, thus far, been postulated to be hosted in ultramafic rock (German and Boetius, 2017; Marcon et al., 2017). The δ13CH4 estimate presented here is substantially lower than both plume and end-member δ13CH4 values of many Mid-Atlantic Ridge hydrothermal vents known to be hosted in or influenced by ultramafic rock (ca. −5 to −20, e.g., Keir et al., 2006; Wang et al., 2018). Such ranges are assumed to be characteristic of putatively abiotic methane (e.g., Wang et al., 2018), most likely derived from leaching of rock-hosted gas inclusions (e.g., Grozeva et al., 2020). A δ13CH4 value −13.1 ‰ within this range of has also been reported for a “closest approach” in a CH4- and H2-rich hydrothermal plume further east on the Gakkel Ridge at 87∘ N (McDermott et al., 2017; confirmed by the same cavity ring-down spectrometry approach used here), also postulated to reflect ultramafic influence. In contrast, δ13CH4 values in hydrothermal fluids either heavily influenced by (or hosted in) sediments undergoing substantial thermal alteration of associated sedimentary organic matter tend to be generally more 13C-depleted (ranging from −25 ‰ to −56 ‰; Baumberger et al., 2016, and references therein). Indeed, similarly intermediate values of δ13CH4 (−27 ‰ to −29 ‰) compared to Mid-Atlantic Ridge hydrothermal systems were also obtained in the bare-rock-hosted, but sediment-influenced, Loki's Castle hydrothermal system farther to the south on the ultraslow-spreading Mohns–Knipovich ridge junction of the Arctic Mid-Ocean Ridge system (Baumberger et al., 2016; Pedersen et al., 2010). There, exceptionally high methane (15.5 mM) and ammonium (6.1 mM) concentrations together with low ratios are attributed to subsurface hydrothermal fluid–sediment interactions (linked to sediment accumulation at ridge flanks and ridge valley, Baumberger et al., 2016; Pedersen et al., 2010).
A greater extent of plume dispersion and somewhat higher methane concentrations (≤32 nM) were previously reported within ∼200 m of the Aurora hydrothermal vent area (Boetius, 2015; German and Boetius, 2017), but the maximum concentrations reported here (2.8–5.1 nM, in station PL) do at least coincide with the highest δ13CH4 values (−31 ‰ to −33 ‰) and maximum water column turbidity. Hence, we tentatively suggest that hydrothermal fluids at Aurora might, on the basis of these closest approach plume δ13CH4 values alone, potentially contain a thermogenic organic matter influence.
3.3 Composition of DOM in the sea ice, water column and in the hydrothermal plume layer
Analyses of DOM extracts revealed 8093 unique formulas in the whole dataset, with the molecular mass range between 150 and 1000 Da. From all unique formulas, 2614 and 2391 were uniquely obtained by negative and positive ESI, respectively, and 3088 formulas were assigned in both (see Fig. S3 in the Supplement). In agreement with previous findings (Ohno et al., 2016; Sert et al., 2020), unique positive ESI formulas were markedly more hydrogen saturated (average ) and oxygen-poor (average ) compared to negative ESI formulas (average and ). Numbers of assignments for aliphatic and lipid-like DOM components were more abundant in positive mode, and unsaturated oxygen-rich molecular formulas, carbohydrates, and lignin-like and aromatic compounds were more abundant in negative mode. Considering the features obtained in different modes (Fig. S4 in the Supplement), combining positive and negative ESI datasets provides a considerable advantage for differentiating samples.
3.3.1 Sea ice
The DOM composition of sea ice was determined from a single sample and indicates that it was predominantly more hydrogen saturated relative to surface water composition (i.e., higher ratios), with a lower number of formulas, average relative intensities, average molecular weights and considerably high LPD content (Fig. 6a–k). Differences in molecular composition between seawater and sea ice are in agreement with previous observations in sea ice DOM (Longnecker, 2015; Retelletti Brogi et al., 2018) and lake ice DOM (Liu et al., 2020; Santibáñez et al., 2019; Xu et al., 2020), implying a selective transport of DOM with less complex, aliphatic compounds, rather than larger aromatic oligomers, during ice formation. The hydrodynamics of DOM transport are not known between phases, but previous observations show that DOM segregates between water and ice, favoring lower MW formulas and less aromatic fractions in the ice phase (Belzile et al., 2002; Santibáñez et al., 2019). In the Arctic Ocean, this partition process increases the bioavailability of terrestrial DOM from rivers during initial ice formation and contributes to its removal by retaining biologically active components (Jørgensen et al., 2015). In addition to the abiotic fractionation and transport, biofilm-mediated microbial degradation and photooxidation were previously shown to be responsible for fast degradation of petroleum biopolymers in sea ice (Vergeynst et al., 2019). High LPD percentage and low average MW in sea ice DOM may also be attributed to a fresh production by ice algae or heterotrophic degradation of DOM (Hill and Zimmerman, 2016; Li et al., 2019; Retelletti Brogi et al., 2018).
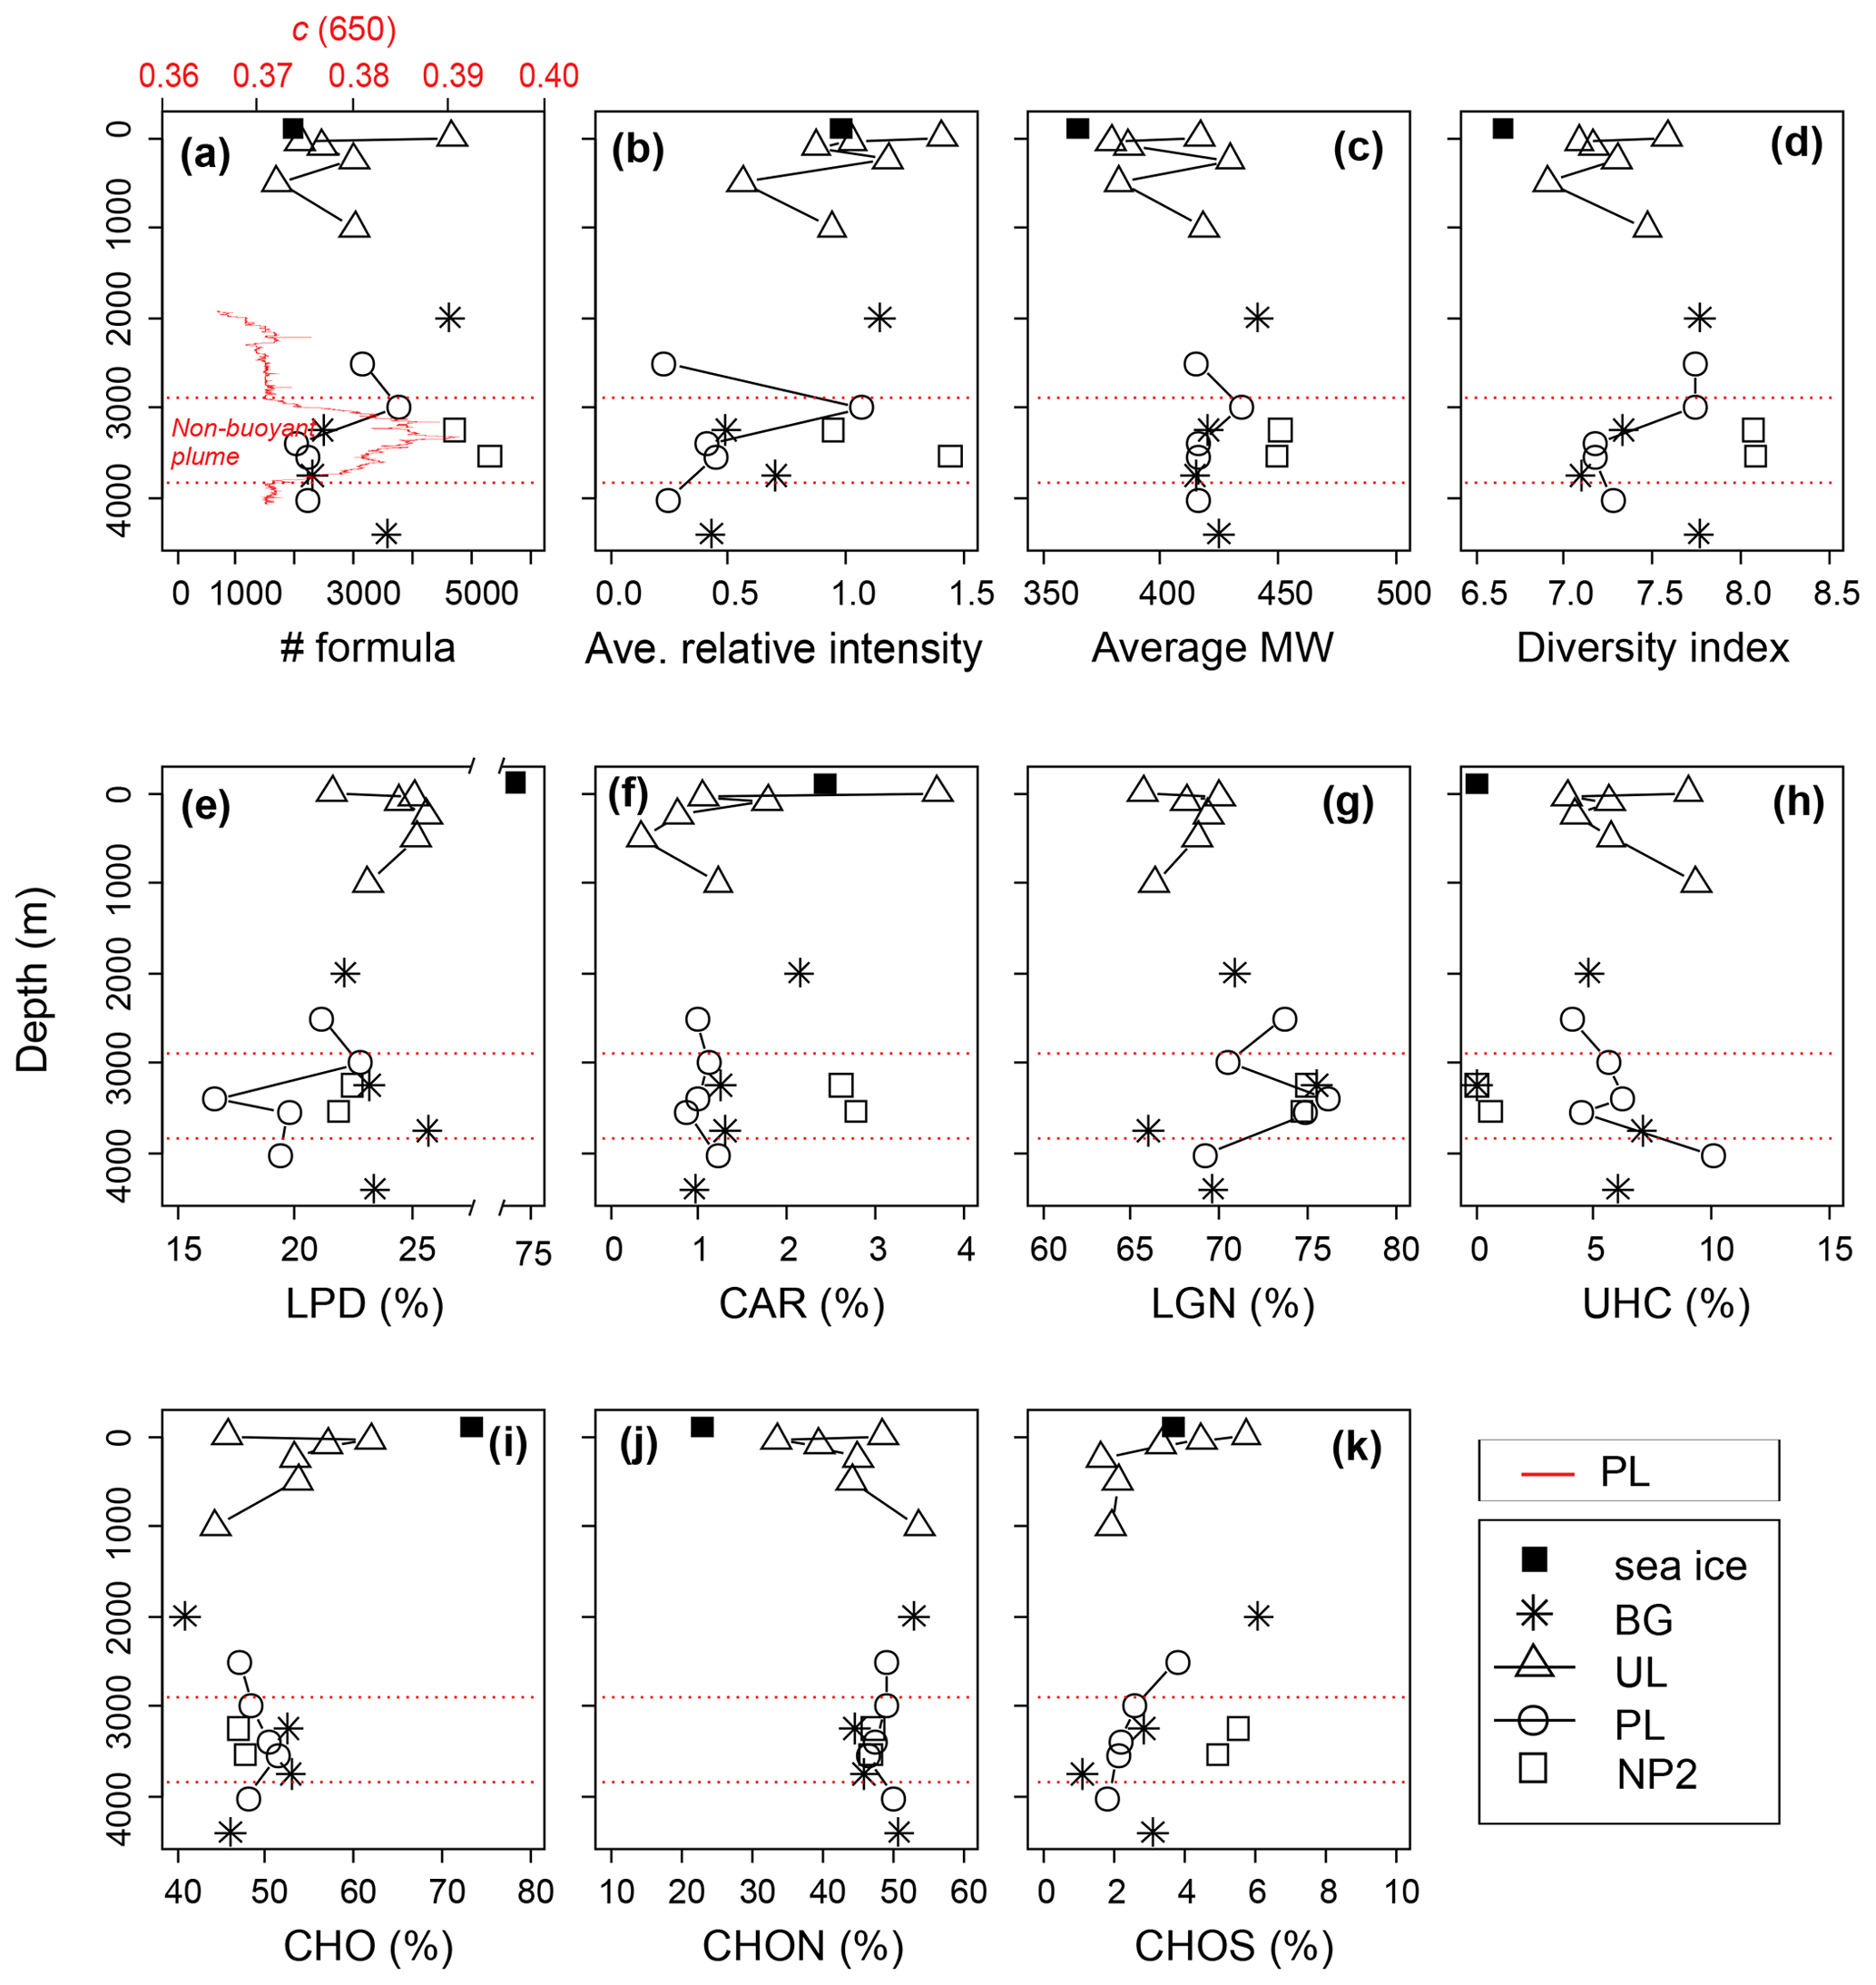
Figure 6Depth profiles of the dissolved organic matter (DOM) composition, (a–d) molecular indices, (e–h) percentages of number of formulas in biochemical compound groups defined by H:C and O:C ratios, and (i–k) heteroatomic content in background (BG), upper layer (UL), plume (PL) and non-plume (NP2) stations. Abbreviations are MW, molecular weight; LPD, lipid- and protein-like; CAR, carbohydrate-like; LGN, lignin- and tannin-like; UHC, unsaturated hydrocarbon- and condensed aromatic-like; O:C, oxygen-to-carbon ratio; and H:C, hydrogen-to-carbon ratio. The beam attenuation profile of PL is added to the first panel to indicate the non-buoyant plume layer, and corresponding boundaries of the plume layer are indicated by red dashed lines in all panels.
3.3.2 Upper 1000 m of the water column
From the sea surface down to 1000 m, changes in DOM indices such as the number of formulas, molecular diversity and average relative intensities are consistent with changes in nutrient and DOC showing their maxima at 5 m (Figs. 6a–d and 3a–e). This is in agreement with the expected pace and diversity of biological processes in this water layer, i.e., dissolved nutrient uptake by phytoplankton and the contribution to the synthesis of dissolved and particulate organic matter (Benner et al., 1992; Hedges, 1992). Below this layer, average relative intensities of formulas decreased and showed a less diverse composition below the photic zone with decreasing light availability and heterotrophic consumption (Fig. 6b–d).
The uptake of bioavailable DOM alongside nutrients could explain the distribution of formulas of different chemical classes in the 0–1000 m layer. For example, lower abundances of LPD and LGN at the surface against the higher CAR and UNC contents (Fig. 6e–h) indicate the selective use of the more hydrogenated aliphatic compounds compared to oxygenated or aromatic formulas. Similarly, CHON and CHOS heteroatom contents were higher at the surface compared to subsurface contents up to 500 m depth (Fig. 6i–k), indicating the increase in the molecular variability and abundance of fresh DOM (Coch et al., 2019; Hertkorn et al., 2016; Jaffé et al., 2012). In contrast to bulk dissolved organic nitrogen (DON) concentrations and CHOS heteroatom contents, percentages of CHON formulas systematically increased from the subsurface (∼33 %) to 1000 m to reach ∼50 % of deep-water abundances (Fig. 6j). Taking this together with the CAR and LPD percentages at subsurface layers, surface-derived carbohydrates are presumably used with increasing depth by heterotrophs to build up cell materials where N-containing proteins dominate intracellular biochemicals (Aluwihare and Meador, 2008) .
For a detailed examination of the DOM structure in the upper layer (i.e., 0–1000 m) a more extensive dataset would be required. However, changes in the percentages of the molecular formulas seem to indicate the gradual transformation of semi-labile DOM at the surface to semi-refractory DOM in the mesopelagic zone (200–1000 m) (see Hansell, 2013). This trend was evident in most of the profiles displaying molecular percentages (Fig. 6e–k).
3.3.3 Hydrothermal plume and the surroundings
The influence of the plume dispersion on DOM composition was investigated in 11 samples from three stations below 2000 m: BG (background), PL (plume) and NP2 (non-plume). The approximate locations of these samples relative to hydrothermal vents and the possible route of the plume dispersion are depicted in Fig. 7a. PCoA and hierarchical clustering indicate a similar composition in the samples obtained from the same station (Fig. 7b and c). Exceptions are samples PL-3000 and BG-2000, which display higher molecular diversity and number of formulas and are therefore more similar to NP2 samples (Fig. 7b). Nevertheless, samples from different depths but from the same station prominently group into three separate clusters (Fig. 7a–c).
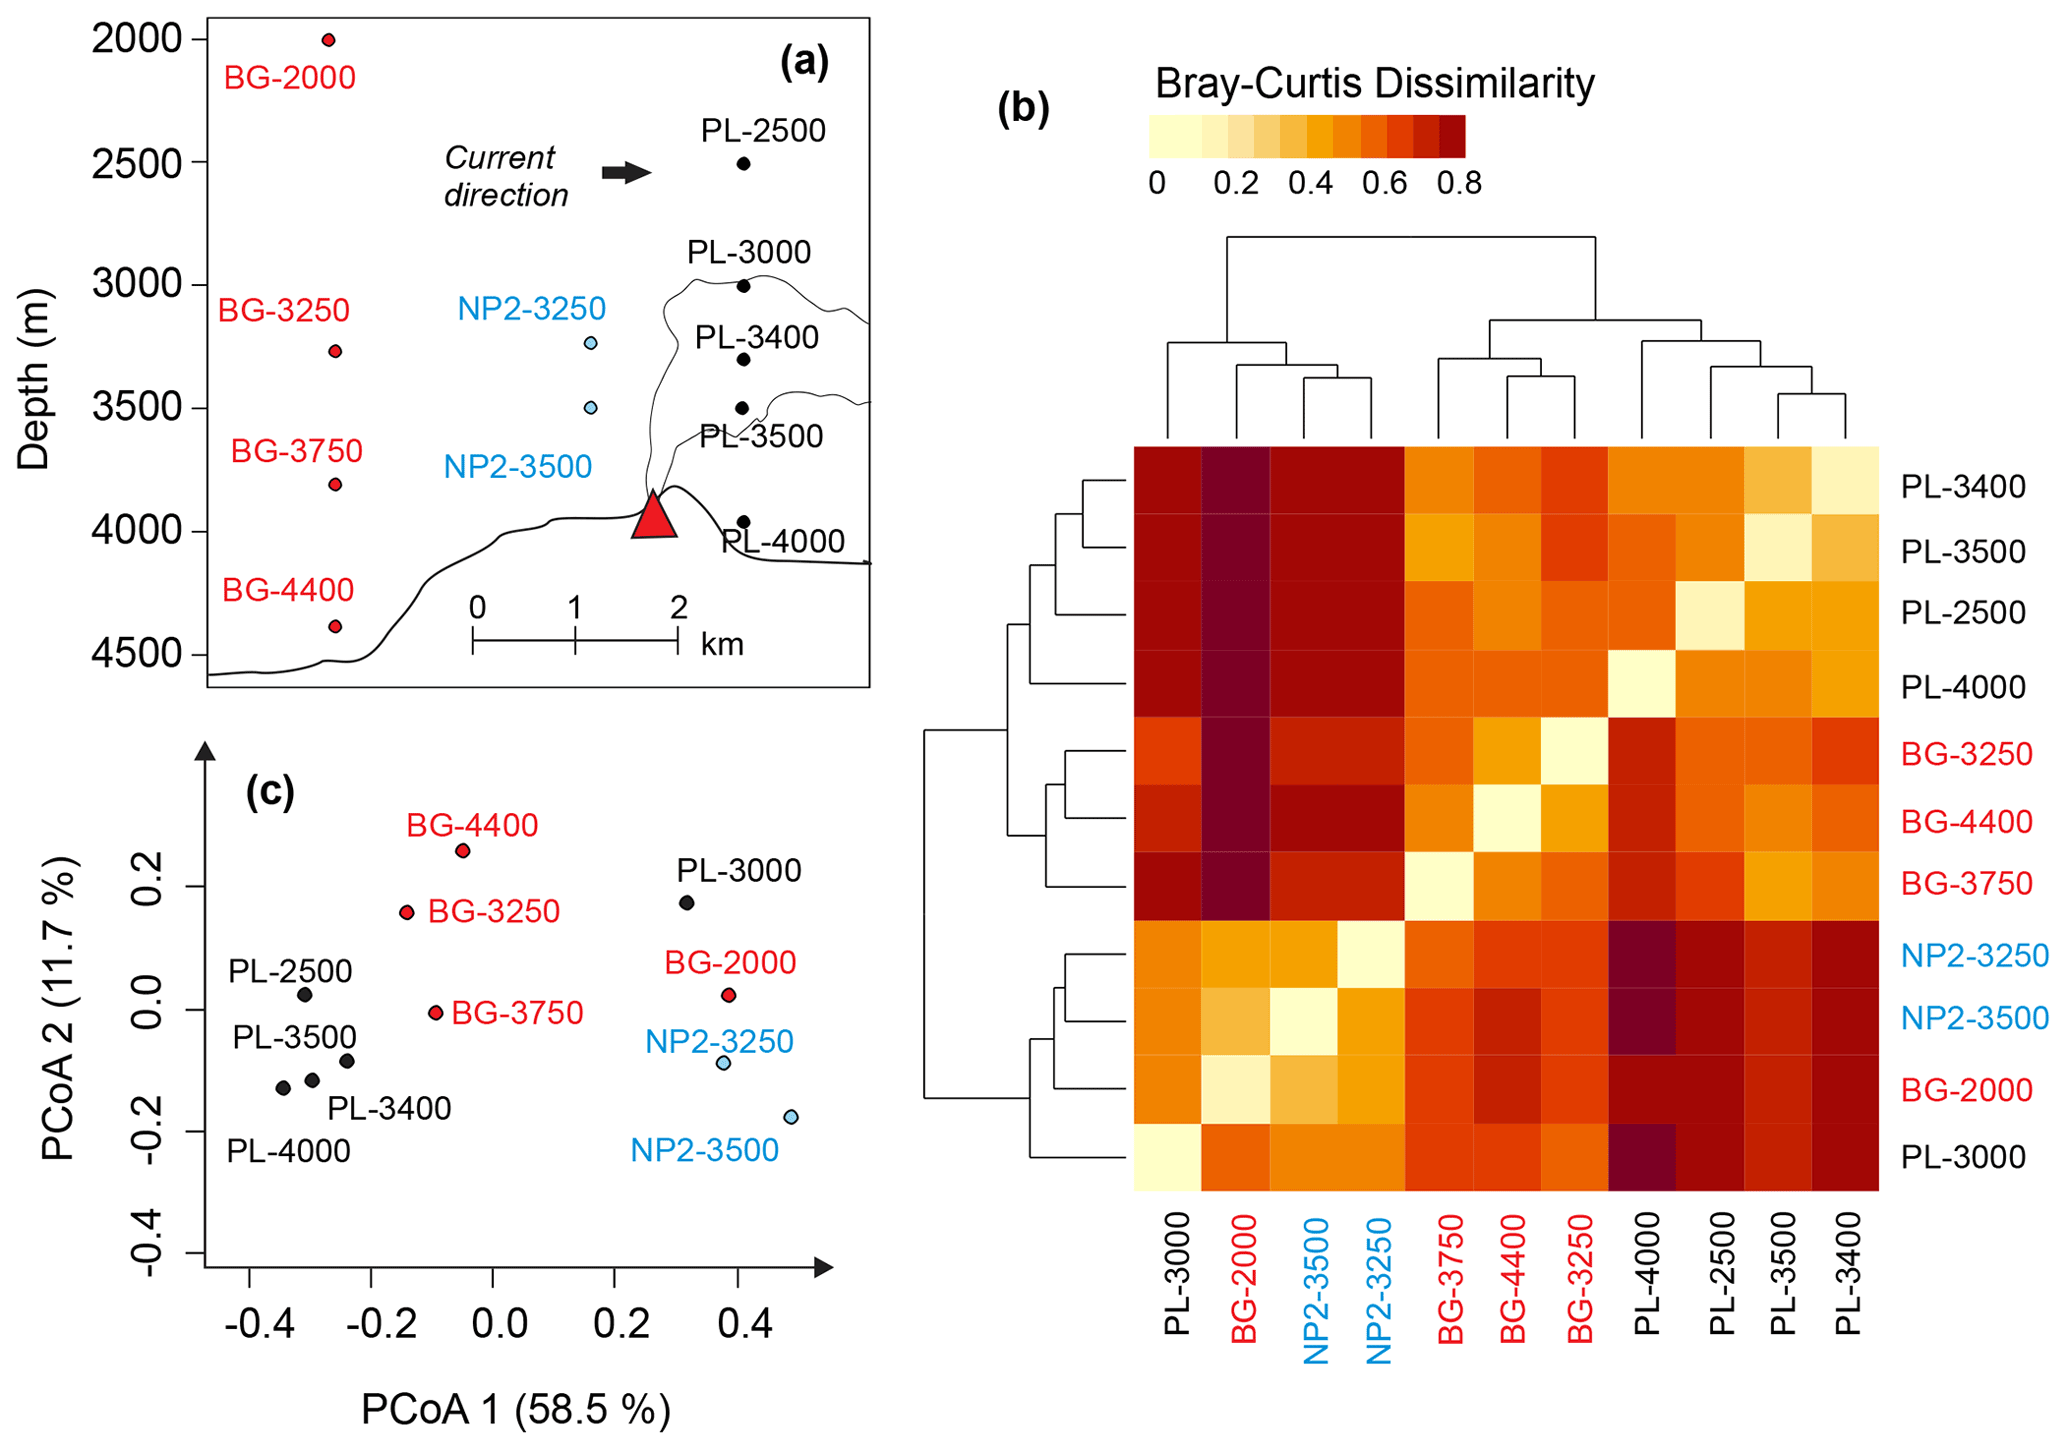
Figure 7(a) Relative positions of the dissolved organic matter (DOM) samples below 2000 m and the hydrothermal plume. (b) Heat-map representing the relation between hierarchical clustering of DOM compositions based on Bray–Curtis dissimilarity. (c) Principal coordinate analysis (PCoA) based on Bray–Curtis dissimilarity of DOM composition samples. Sample names are coded as station name and the approximate depth of the sample for background (BG), upper layer (UL), plume (PL) and non-plume (NP2) stations.
The detailed DOM formula compositions as depicted by van Krevelen diagrams reveal compositional differences between BG, PL and NP2 samples (Fig. 8). All van Krevelen diagrams are populated by a large number of molecular formulas with H:C ratios in the range of 1.0 to 1.8 and O:C ratio of 0.1 to 0.9. In general, the compositions in BG and PL samples display a similar distribution of formulas (Fig. 8a–i). However, BG samples have more formulas, especially at regions and compared to samples at PL. Contrary to BG and PL, NP2 samples have a higher number of formulas and higher frequency of oxygen-containing formulas (i.e., O:C ratio extended until 1.5) and almost no formulas with H:C ratio ≤0.5 (Fig. 8j and k).
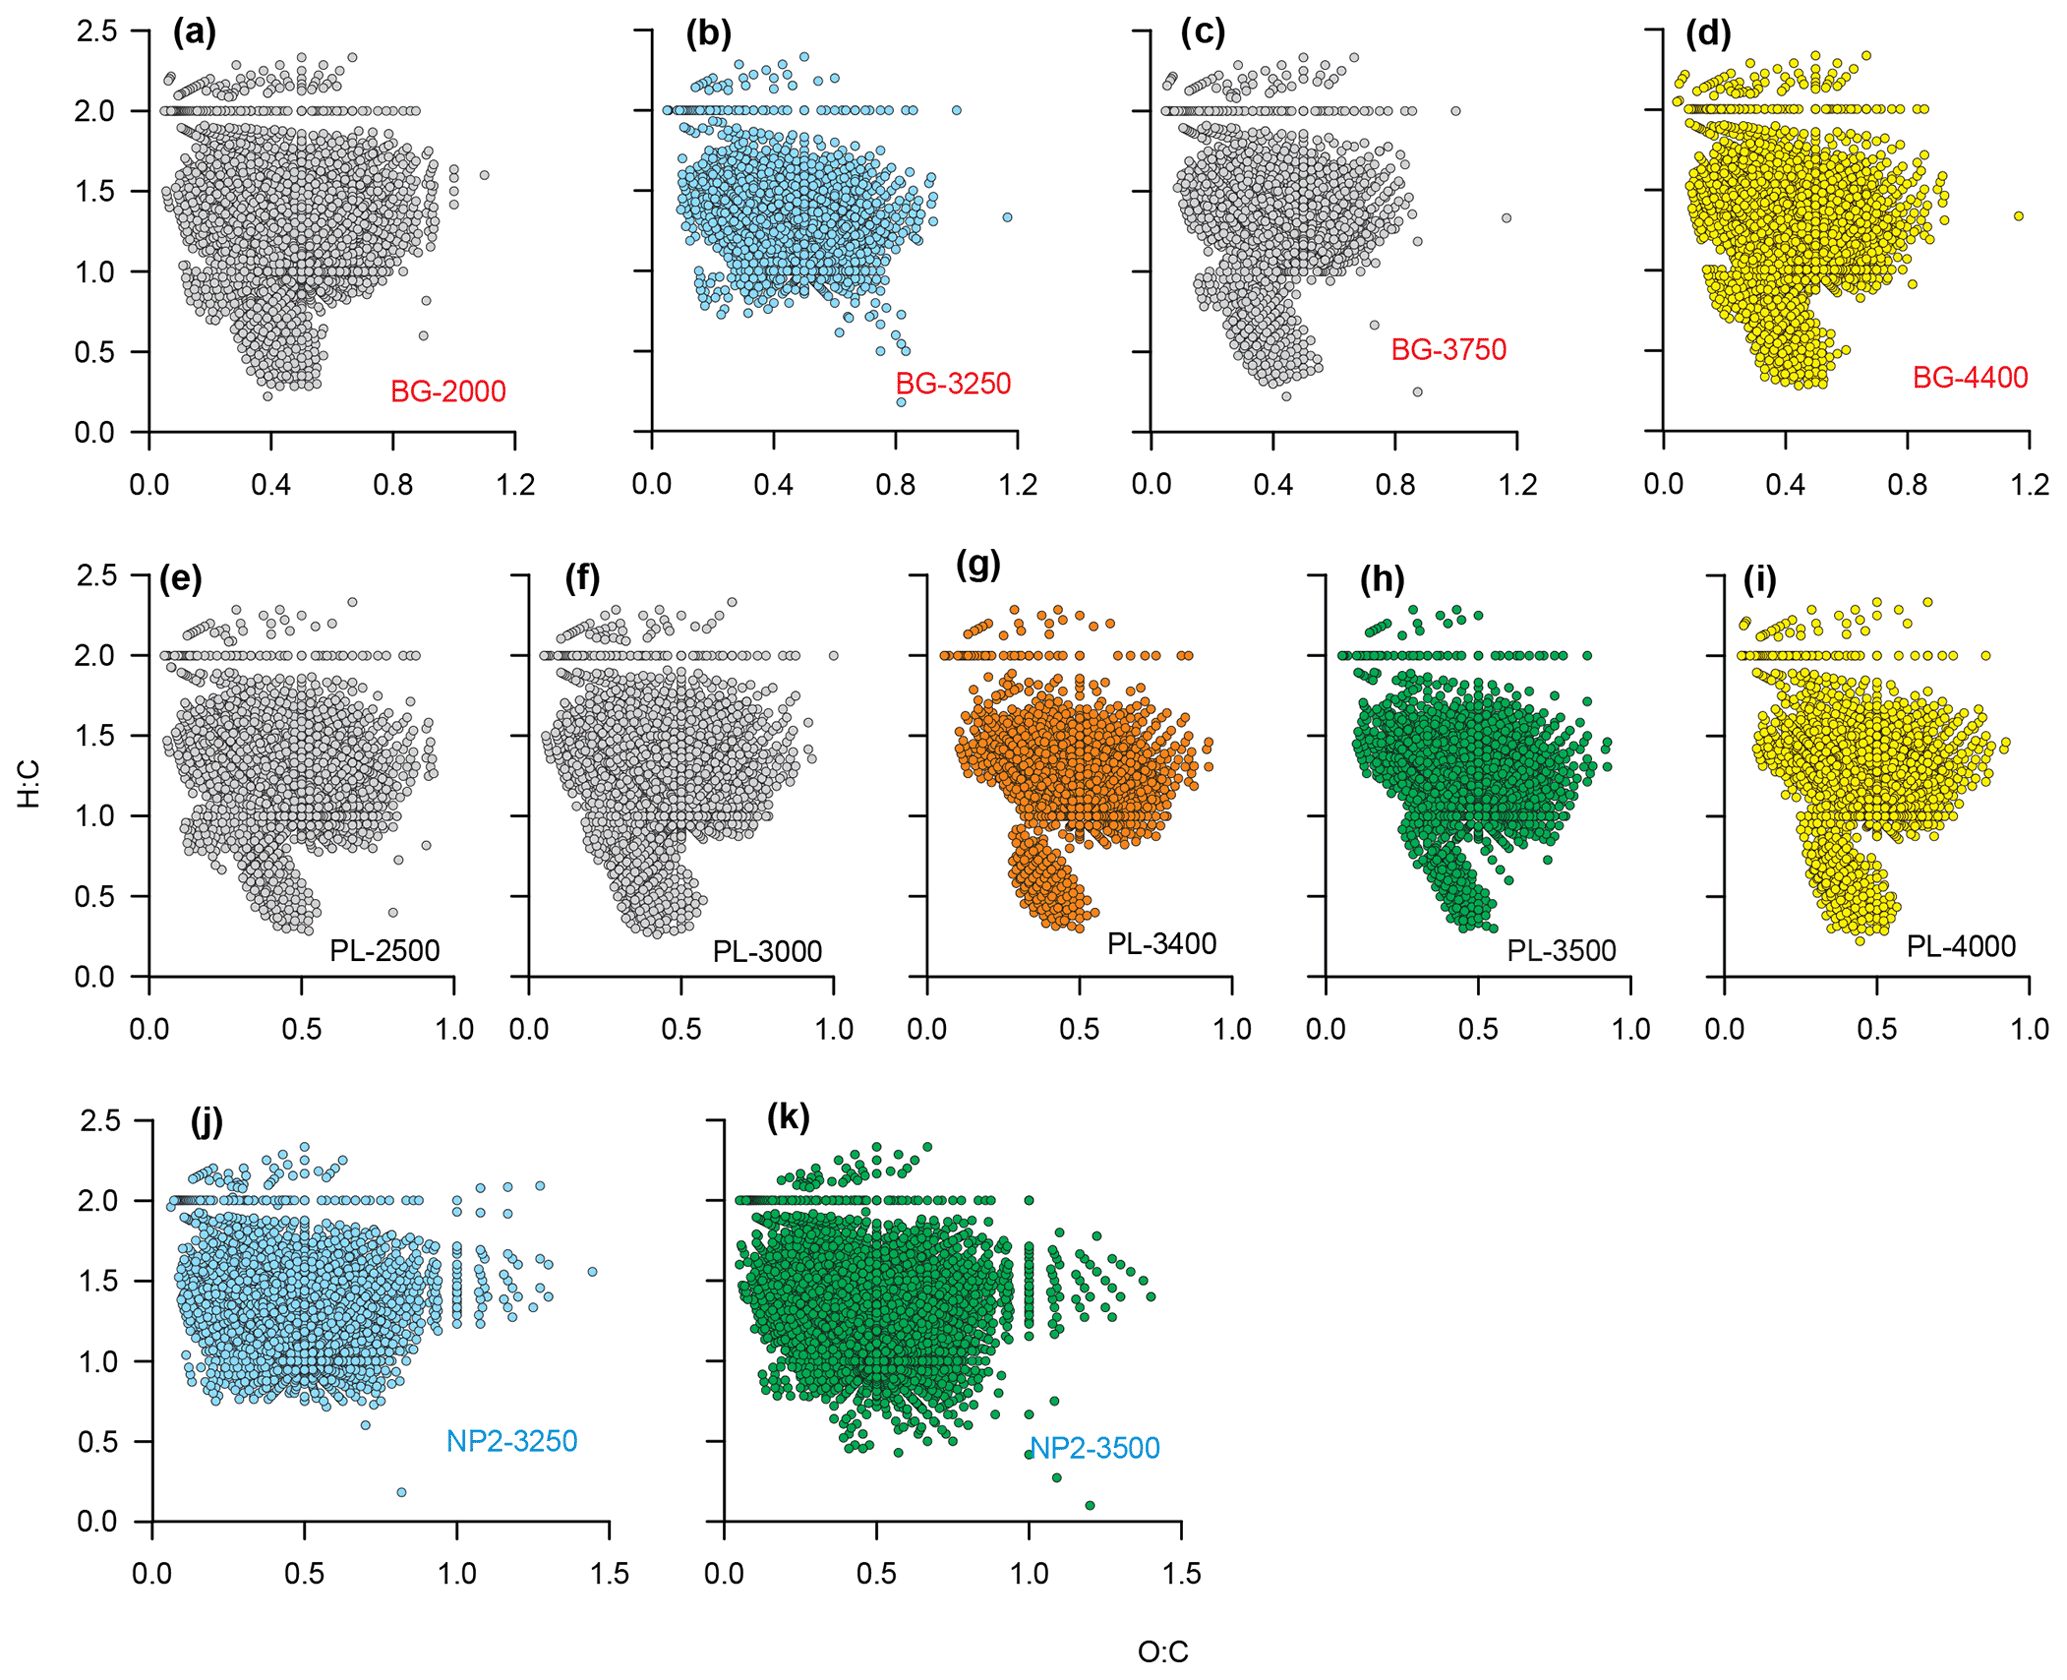
Figure 8Dissolved organic matter (DOM) formulas on van Krevelen diagrams showing O:C and H:C ratios of the formulas at stations (a–d) BG, (e–i) PL and (j–k) NP2. Sample names are coded as station name and sample depth. Orange color is given to PL-3400, where the plume effect is expected to be the highest. Blue and green are used for the formulas in samples that were taken from same depths at different stations. Yellow color is for the samples that were taken from the bottom of the water column at BG and PL.
Considering that the plume dispersion mainly occurs along a lateral transect, we collected samples at the same depths along this lateral transect to be able to compare the differences in the DOM composition (e.g., BG-3250 vs. NP2–3250 m and PL-3500 vs. NP2-3500; Fig. 8b, h, j and k, respectively). Formulas that were unique (i.e., formulas that were not present in samples from the same layer in other stations) or distinct molecular indices (i.e., percentages in different molecular classes like LPD or CAR) were used to evaluate changes in DOM composition. Variations in these molecular properties might be related to distinct biogeochemical settings associated with the plume dispersion, as found with turbidity, methane concentrations and δ13C-CH4 contents. For example, low molecular diversity, average relative intensities and LPD content in PL-3500 and PL-3400 (Fig. 6a–e) indicate the effect of hydrothermal intrusion or the molecular composition carried by the plume, in line with previous experimental and environmental data suggesting preferential removal of higher-molecular-weight and oxygen-rich compounds under hydrothermal conditions (Hawkes et al., 2016; Rossel et al., 2017).
Given that the DOM composition throughout the region is thermally altered, the nature of thermal alteration of organic matter at the hydrothermal systems has been previously formulated as (i) reduction of organic compounds in low-temperature regions (∼60–150 ∘C) to generate products from weaker bonds (e.g., formation of petroleum, aliphatic hydrocarbons) (Simoneit, 1992), (ii) oxidation at higher-temperature conditions (e.g., PAHs and alkanones) (Dittmar and Koch, 2006; Simoneit, 1995) and (iii) abiotic synthesis of organic matter by thermocatalytic (Fischer–Tropsch-type) reactions (McCollom et al., 1999; McCollom and Seewald, 2007). Therefore, it is difficult to categorize thermal processes as either a source or a sink mechanism for marine DOM over a range of temperatures from ∼60 to ∼150 ∘C due to, for instance, formation of petroleum products (Simoneit, 1992), water-soluble vitamins and amino acids (Longnecker et al., 2018), elevated concentrations of formate, acetate concentrations (Lang et al., 2010; McDermott et al., 2015), fractions of labile compositions (Hansen et al., 2019), and formation of iron- and sulfur-bearing organic ligands (Yücel et al., 2011). During high-temperature hydrothermal circulation, however, ∼94 % of the solid phase extractable DOC is typically removed (Hawkes et al., 2015). Findings at several Mid-Atlantic Ridge hydrothermal systems and temperature-controlled hydrothermal experiments showed that DOM is highly unstable and effectively removed during hydrothermal circulation, with a reduction in the abundance of recalcitrant DOM and a decrease in the number of formulas and average molecular mass (Hawkes et al., 2015, 2016; Rossel et al., 2015, 2017).
This agrees with our observations of a decreasing number of molecular formulas, molecular diversity, average relative intensity and LPD composition in the samples where plume-related hydrochemistry was manifested by a higher level of turbidity, 5 times higher methane concentration and markedly heavier methane carbon isotope compositions. We can therefore assume that the compositional differences between background seawater in BG samples and DOM in the plume layer (PL-3400) may be due to hydrothermal degradation or some other chemical combination of reactions that result in a molecular signal similar to those reported for hydrothermal fluids. Due to the difficult sampling situation in the high-Arctic marine environment, we were unfortunately unable to take samples directly from the buoyant plume of the vent to properly illustrate the distribution and composition of hydrothermal end-member DOM. Our analysis, therefore, is solely based on compositional comparison between samples that were different in their relative position to the vent and its non-buoyant plume. However, we do suggest that a portion of the observed composition in the PL is associated with the hydrothermal fluids, which are efficient at scavenging hydrothermal organic compounds from the vent area and transporting them from the heated subsurface (Simoneit, 1992). Accordingly, the temperature profile at PL implies that the hydrothermal fluids must have been cooled down to the ambient temperature before reaching the sampling point. Therefore, any thermal modifications in DOM compositions must have occurred either before entering the lithosphere or in areas adjacent to the vents themselves, being merely carried along with the plume-transported particles, dissolved gases, or water masses and gradually diluted with the surrounding waters until it reached the sampling location.
Alternatively, unique formula compositions in NP2 with higher oxygen saturation (i.e., ) or ∼2 % higher CAR content (see Fig. 6f) could be a product of microbial enrichment attributed to chemosynthetic activity at the southern part of the seamount where the faunal communities, sponges, amphipods and traces of biological activity were more abundant as logged by video and photographic transects from OFOBS dives (Bünz et al., 2020). Nevertheless, based on our data, a clear and direct link between activity of faunal communities and DOM molecular compositions could not be made. Because of this, we cannot yet suggest any mechanism that can transfer modifications of benthic communities to pelagic DOM compositions.
One other plausible explanation for the differences in molecular composition in PL and NP2 compared to BG could be a change in the current direction. The current direction could have been different in the past compared to what we observed on our cruise. If this were the case, the observed composition at the NP2 station could be an imprint of a previous composition of the hydrothermal vent or some other form of environmental gradient that modified and diversified the DOM composition at NP2, while the PL samples reflect the current composition at the sampling location. The higher abundance of CHOS heteroatom composition in the NP2 samples could be evidence of that. A very recent study in Kairei and Pelagia hydrothermal vents in the Indian Ocean indicate 17 % more CHOS molecular formulas in DOM from hot vent fluids along with the elevated hydrogen sulfide concentrations compared to surrounding seawater (Noowong et al., 2021). Similarly, reproduction of sulfur-containing compounds is found to occur under experimental hydrothermal conditions at several selected temperatures (Hawkes et al., 2016) and at less acidic conditions (Rossel et al., 2017).
Our investigations of the water column above the Aurora hydrothermal vent field (Gakkel Ridge, Arctic Ocean) show that hydrothermal venting in this region displaces thermally degraded DOM compositions within the hydrothermal plume, along with 13C-enriched methane and other vent-derived properties. We show that DOM compositions in the plume layer samples had lower numbers of molecular formulas, molecular diversity, average relative intensity, and percentage of formulas assigned to the LPD molecular class. However, at a site with higher vent-related biological imprinting and lower influence from plume dispersion, DOM compositions had higher numbers of formulas, molecular diversity, and CAR percentages. We characterized the water column hydrophysical and biochemical properties, observing that nutrient distributions and DOM compositions mainly reflect vertical changes in primary production, atmospheric gas exchange, riverine influence and water mass distributions in the upper 1000 m layer, while the water column below 2000 m was quite uniform. DOM composition in sea ice was more labile, with markedly high LPD and low-molecular-weight compositions than the ocean surface waters, suggesting selective transport during ice formation and new production by ice algae.
DOM compositions in the Arctic Ocean are prone to changes in the upper ocean layers, in parallel to the changes in global climate and decline in sea ice extent. However, deep-ocean DOM is mostly refractory, displaying remnants of ancient biological processes. Hydrothermal vents in the deep ocean could therefore be a dynamic source of organic matter and perhaps influence overlying pelagic ecosystems. There are several experimental studies on how DOM is modified during hydrothermal processes under different physical and chemical conditions; however, there is a gap of knowledge on to what extent hydrothermally and chemosynthetically modified DOM spreads along plume layers, altering water column biogeochemistry. To the best of our knowledge, our study is the first attempt to differentiate hydrothermal plume and non-plume DOM compositions in the deep Arctic Ocean; clearly more studies should address this in different hydrothermal systems and other plume-generating deep-sea environments.
The data and the codes for generating figures and statistical analyses are available in UiT Open Research Data repository https://doi.org/10.18710/QPGDFW (Sert et al., 2021).
The supplement related to this article is available online at: https://doi.org/10.5194/bg-19-2101-2022-supplement.
MFS designed the study and performed data acquisition with supervision from AS, FG and HN. EPR and KPH analyzed shipboard methane concentrations and methane carbon isotope compositions, respectively. TK and JJ analyzed dissolved organic matter samples, generated formula lists and wrote mass spectrometry methodology. MFS wrote the manuscript with contributions from all coauthors.
At least one of the (co-)authors is a member of the editorial board of Biogeosciences. The peer-review process was guided by an independent editor, and the authors also have no other competing interests to declare.
Publisher's note: Copernicus Publications remains neutral with regard to jurisdictional claims in published maps and institutional affiliations.
We would like to acknowledge the crew of R/V Kronprins Haakon, chief scientist Stefan Bünz and co-chief scientist Eva Ramirez-Llodra for their tremendous efforts during this challenging expedition. We would like to thank Autun Purser and Ulrich Hoge for OFOBS observations, Colin A. Stedmon for DOC and TDN measurements, and Linda Fondes Lunde for nutrient analyses. This study is a part of CAGE (Centre for Arctic Gas Hydrate, Environment and Climate), Norwegian Research Council (grant no. 223259). The HACON project is funded by the Research Council of Norway through a FRINATEK grant (274330). This study is supported by European Union's Horizon 2020 research and innovation program (EU FT-ICR MS project; grant agreement 731077). The FT-ICR MS facility is also supported by Biocenter Finland, Biocenter Kuopio and the European Regional Development Fund (grant A70135). Kevin P. Hand contributed this research through support from the Exo-Ocean Worlds project within the Astrobiology Program at NASA and through support from the Jet Propulsion Laboratory, California Institute of Technology, under a contract with the National Aeronautics and Space Administration (80NM0018D0004). Pamela E. Rossel is funded by a European Research Council (ERC) Synergy Grant (DEEP PURPLE, grant agreement no. 856416) awarded under the European Union's Horizon 2020 research and innovation program. The publication charges for this article have been funded by a grant from the publication fund of UiT The Arctic University of Norway.
This research has been supported by the Norges Forskningsråd (grant nos. 223259 and 274330).
This paper was edited by Yuan Shen and reviewed by two anonymous referees.
Aluwihare, L. I. and Meador, T.: Chemical Composition of Marine Dissolved Organic Nitrogen, in: Nitrogen in the Marine Environment (Second edn.), edited by: Capone, D. G., Bronk, D. A., Mulholland, M. R., and Carpenter, E. J., Academic Press, San Diego, 95–140, https://doi.org/10.1016/B978-0-12-372522-6.00003-7, 2008.
Arrieta, J. M., Mayol, E., Hansman, R. L., Herndl, G. J., Dittmar, T., and Duarte, C. M.: Dilution limits dissolved organic carbon utilization in the deep ocean, Science, 348, 331–333, https://doi.org/10.1126/science.1258955, 2015.
Arrigo, K. R. and van Dijken, G. L.: Continued increases in Arctic Ocean primary production, Prog. Oceanogr., 136, 60–70, https://doi.org/10.1016/j.pocean.2015.05.002, 2015.
Baker, E. T., German, C. R., and Elderfield, H.: Hydrothermal Plumes Over Spreading-Center Axes: Global Distributions and Geological Inferences, in: Seafloor Hydrothermal Systems: Physical, Chemical, Biological, and Geological Interactions, American Geophysical Union (AGU), 47–71, https://doi.org/10.1029/GM091p0047, 1995.
Bart, M. C., de Kluijver, A., Hoetjes, S., Absalah, S., Mueller, B., Kenchington, E., Rapp, H. T., and de Goeij, J. M.: Differential processing of dissolved and particulate organic matter by deep-sea sponges and their microbial symbionts, Sci. Rep., 10, 17515, https://doi.org/10.1038/s41598-020-74670-0, 2020.
Bauch, D., Schlosser, P., and Fairbanks, R. G.: Freshwater balance and the sources of deep and bottom waters in the Arctic Ocean inferred from the distribution of H2180, Prog. Oceanogr., 35, 53–80, 1995.
Bauch, D., Polyak, L., and Ortiz, J. D.: A baseline for the vertical distribution of the stable carbon isotopes of dissolved inorganic carbon (δ13CDIC) in the Arctic Ocean, Arktos, 1, 15, https://doi.org/10.1007/s41063-015-0001-0, 2015.
Baumberger, T., Früh-Green, G. L., Thorseth, I. H., Lilley, M. D., Hamelin, C., Bernasconi, S. M., Okland, I. E., and Pedersen, R. B.: Fluid composition of the sediment-influenced Loki's Castle vent field at the ultra-slow spreading Arctic Mid-Ocean Ridge, Geochim. Cosmochim. Ac., 187, 156–178, https://doi.org/10.1016/j.gca.2016.05.017, 2016.
Beaulieu, S. E., Baker, E. T., and German, C. R.: Where are the undiscovered hydrothermal vents on oceanic spreading ridges?, Deep-Sea Res. Pt. II, 121, 202–212, https://doi.org/10.1016/j.dsr2.2015.05.001, 2015.
Belzile, C., Gibson, J. A. E., and Vincent, W. F.: Colored dissolved organic matter and dissolved organic carbon exclusion from lake ice: Implications for irradiance transmission and carbon cycling, Limnol. Oceanogr., 47, 1283–1293, https://doi.org/10.4319/lo.2002.47.5.1283, 2002.
Benner, R., Pakulski, J. D., Mccarthy, M., Hedges, J. I., and Hatcher, P. G.: Bulk Chemical Characteristics of Dissolved Organic Matter in the Ocean, Science, 255, 1561–1564, https://doi.org/10.1126/science.255.5051.1561, 1992.
Boetius, A.: The Expedition PS86 of the Research Vessel POLARSTERN to the Arctic Ocean in 2014, Alfred-Wegener-Institut Helmholtz-Zentrum für Polar- und Meeresforschung, ISSN 1866-3192, https://doi.org/10.2312/BzPM_0685_2015, 2015.
Boetius, A., Bach, W., Borowski, C., Diehl, A., German, C. R., Kaul, N. E., Koehler, J., Marcon, Y., Mertens, C., Molari, M., Schlindwein, V. S. N., Tuerke, A., and Wegener, G.: Exploring the Habitability of Ice-covered Waterworlds: The Deep-Sea Hydrothermal System of the Aurora Mount at Gakkel Ridge, Arctic Ocean ( N, 6∘15 W, 3900 m), AGU Fall Meeting Abstracts, 15–19 December 2014, San Francisco, B24A-02, 2014.
Bray, J. R. and Curtis, J. T.: An Ordination of the Upland Forest Communities of Southern Wisconsin, Ecol. Monogr., 27, 325–349, https://doi.org/10.2307/1942268, 1957.
Bünz, S., Ramirez-Llodra, E., German, C., Ferre, B., Sert, F., Kalenickenko, D., Reeves, E., Hand, K., Dahle, H., Kutti, T., Purser, A., Hilario, A., Ramalho, S., Rapp, H. T., Ribeiro, P., Victorero, L., Hoge, U., Panieri, G., Bowen, A., Jakuba, M., Suman, S., Gomez-Ibanez, D., Judge, C., Curran, M., Nalicki, V., Vagenes, S., Lamar, L., Klesh, A., Dessandier, P. A., Steen, I., Mall, A., Vulcano, F., Meckel, E. M., and Drake, N.: RV Kronprins Håkon (cruise no. 2019708) Longyearbyen – Longyearbyen 19.09.–16.10.2019, UIT – The Arctic University of Norway, 100 pp., https://haconfrinatek.com/2020/01/20/hacon-cruise-report/f (last access: 14 April 2022), 2020.
Burd, B. J. and Thomson, R. E.: Hydrothermal venting at endeavour ridge: effect on zooplankton biomass throughout the water column, Deep-Sea Res. Pt. I, 41, 1407–1423, https://doi.org/10.1016/0967-0637(94)90105-8, 1994.
Charlou, J. L., Donval, J. P., Fouquet, Y., Jean-Baptiste, P., and Holm, N.: Geochemistry of high H2 and CH4 vent fluids issuing from ultramafic rocks at the Rainbow hydrothermal field (36∘14′ N, MAR), Chem. Geol., 191, 345–359, https://doi.org/10.1016/S0009-2541(02)00134-1, 2002.
Coch, C., Juhls, B., Lamoureux, S. F., Lafrenière, M. J., Fritz, M., Heim, B., and Lantuit, H.: Comparisons of dissolved organic matter and its optical characteristics in small low and high Arctic catchments, Biogeosciences, 16, 4535–4553, https://doi.org/10.5194/bg-16-4535-2019, 2019.
Cowen, J. P., Wen, X., and Popp, B. N.: Methane in aging hydrothermal plumes, Geochim. Cosmochim. Ac., 66, 3563–3571, https://doi.org/10.1016/S0016-7037(02)00975-4, 2002.
Damm, E. and Budéus, G.: Fate of vent-derived methane in seawater above the Håkon Mosby mud volcano (Norwegian Sea), Mar. Chem., 82, 1–11, https://doi.org/10.1016/S0304-4203(03)00031-8, 2003.
Damm, E., Kiene, R. P., Schwarz, J., Falck, E., and Dieckmann, G.: Methane cycling in Arctic shelf water and its relationship with phytoplankton biomass and DMSP, Mar. Chem., 109, 45–59, https://doi.org/10.1016/j.marchem.2007.12.003, 2008.
Damm, E., Helmke, E., Thoms, S., Schauer, U., Nöthig, E., Bakker, K., and Kiene, R. P.: Methane production in aerobic oligotrophic surface water in the central Arctic Ocean, Biogeosciences, 7, 1099–1108, https://doi.org/10.5194/bg-7-1099-2010, 2010.
de la Vega, C., Jeffreys, R. M., Tuerena, R., Ganeshram, R., and Mahaffey, C.: Temporal and spatial trends in marine carbon isotopes in the Arctic Ocean and implications for food web studies, Glob. Change Biol., 25, 4116–4130, https://doi.org/10.1111/gcb.14832, 2019.
DeMets, C., Gordon, R., and Argus, D.: Geological current plate motions, Geophys. J. Int., 181, 1–80, https://doi.org/10.1111/j.1365-246X.2009.04491.x, 2010.
Dick, G. J.: The microbiomes of deep-sea hydrothermal vents: distributed globally, shaped locally, Nat. Rev. Microbiol., 17, 271–283, https://doi.org/10.1038/s41579-019-0160-2, 2019.
Dittmar, T. and Koch, B. P.: Thermogenic organic matter dissolved in the abyssal ocean, Mar. Chem., 102, 208–217, https://doi.org/10.1016/j.marchem.2006.04.003, 2006.
Dittmar, T. and Stubbins, A.: Dissolved Organic Matter in Aquatic Systems, in: Treatise on Geochemistry, edited by: Holland, H. D. and Turekian, K. K., Elsevier, Oxford, 125–156, https://doi.org/10.1016/B978-0-08-095975-7.01010-X, 2014.
Dittmar, T., Koch, B., Hertkorn, N., and Kattner, G.: A simple and efficient method for the solid-phase extraction of dissolved organic matter (SPE-DOM) from seawater, Limnol. Oceanogr.-Meth., 6, 230–235, 2008.
Edmonds, H. N., Michael, P. J., Baker, E. T., Connelly, D. P., Snow, J. E., Langmuir, C. H., Dick, H. J. B., Mühe, R., German, C. R., and Graham, D. W.: Discovery of abundant hydrothermal venting on the ultraslow-spreading Gakkel ridge in the Arctic Ocean, Nature, 421, 252–256, https://doi.org/10.1038/nature01351, 2003.
Fahrbach, E., Meincke, J., Østerhus, S., Rohardt, G., Schauer, U., Tverberg, V., and Verduin, J.: Direct measurements of volume transports through Fram Strait, Polar Res., 20, 217–224, https://doi.org/10.3402/polar.v20i2.6520, 2001.
Folkers, M. and Rombouts, T.: Sponges Revealed: A Synthesis of Their Overlooked Ecological Functions Within Aquatic Ecosystems, in: YOUMARES 9 – The Oceans: Our Research, Our Future: Proceedings of the 2018 conference for YOUng MArine RESearcher in Oldenburg, Germany, September 2018, edited by: Jungblut, S., Liebich, V., and Bode-Dalby, M., Springer International Publishing, Cham, 181–193, https://doi.org/10.1007/978-3-030-20389-4_9, 2020.
Fouilland, E., Floc'h, E. L., Brennan, D., Bell, E. M., Lordsmith, S. L., McNeill, S., Mitchell, E., Brand, T. D., García-Martín, E. E., and Leakey, R. J.: Assessment of bacterial dependence on marine primary production along a northern latitudinal gradient, FEMS Microbiol. Ecol., 94, fiy150, https://doi.org/10.1093/femsec/fiy150, 2018.
Fuchida, S., Mizuno, Y., Masuda, H., Toki, T., and Makita, H.: Concentrations and distributions of amino acids in black and white smoker fluids at temperatures over 200 ∘C, Org. Geochem., 66, 98–106, https://doi.org/10.1016/j.orggeochem.2013.11.008, 2014.
German, C. R. and Boetius, A.: Hydrothermal Exploration of the Gakkel Ridge, 2014 and 2016, Goldschmidt Abstracts, 1, 1324, https://goldschmidtabstracts.info/abstracts/abstractView?id=2017001867 (last access: 14 April 2022), 2017.
German, C. R. and Seyfried, W. E.: Hydrothermal Processes, in: Treatise on Geochemistry, Elsevier, 191–233, https://doi.org/10.1016/B978-0-08-095975-7.00607-0, 2014.
German, C. R., Bowen, A., Coleman, M. L., Honig, D. L., Huber, J. A., Jakuba, M. V., Kinsey, J. C., Kurz, M. D., Leroy, S., McDermott, J. M., de Lépinay, B. M., Nakamura, K., Seewald, J. S., Smith, J. L., Sylva, S. P., Van Dover, C. L., Whitcomb, L. L., and Yoerger, D. R.: Diverse styles of submarine venting on the ultraslow spreading Mid-Cayman Rise, P. Natl. Acad. Sci. USA, 107, 14020–14025, https://doi.org/10.1073/pnas.1009205107, 2010.
Graves, C. A., Steinle, L., Rehder, G., Niemann, H., Connelly, D. P., Lowry, D., Fisher, R. E., Stott, A. W., Sahling, H., and James, R. H.: Fluxes and fate of dissolved methane released at the seafloor at the landward limit of the gas hydrate stability zone offshore western Svalbard: Dissolved methane off western Svalbard, J. Geophys. Res.-Oceans, 120, 6185–6201, https://doi.org/10.1002/2015JC011084, 2015.
Grossart, H.-P., Frindte, K., Dziallas, C., Eckert, W., and Tang, K. W.: Microbial methane production in oxygenated water column of an oligotrophic lake, P. Natl. Acad. Sci. USA, 108, 19657–19661, https://doi.org/10.1073/pnas.1110716108, 2011.
Grozeva, N. G., Klein, F., Seewald, J. S., and Sylva, S. P.: Chemical and isotopic analyses of hydrocarbon-bearing fluid inclusions in olivine-rich rocks, Philos. T. Roy. Soc. A, 378, 20180431, https://doi.org/10.1098/rsta.2018.0431, 2020.
Haberstroh, P. R. and Karl, D. M.: Dissolved free amino acids in hydrothermal vent habitats of the Guaymas Basin, Geochim. Cosmochim. Ac., 53, 2937–2945, https://doi.org/10.1016/0016-7037(89)90170-1, 1989.
Hannington, M., Jamieson, J., Monecke, T., Petersen, S., and Beaulieu, S.: The abundance of seafloor massive sulfide deposits, Geology, 39, 1155–1158, https://doi.org/10.1130/G32468.1, 2011.
Hansell, D. A.: Recalcitrant Dissolved Organic Carbon Fractions, Annu. Rev. Mar. Sci., 5, 421–445, https://doi.org/10.1146/annurev-marine-120710-100757, 2013.
Hansen, C. T., Niggemann, J., Giebel, H.-A., Simon, M., Bach, W., and Dittmar, T.: Biodegradability of hydrothermally altered deep-sea dissolved organic matter, Mar. Chem., 217, 103706, https://doi.org/10.1016/j.marchem.2019.103706, 2019.
Hawkes, J. A., Rossel, P. E., Stubbins, A., Butterfield, D., Connelly, D. P., Achterberg, E. P., Koschinsky, A., Chavagnac, V., Hansen, C. T., Bach, W., and Dittmar, T.: Efficient removal of recalcitrant deep-ocean dissolved organic matter during hydrothermal circulation, Nat. Geosci., 8, 856–860, https://doi.org/10.1038/ngeo2543, 2015.
Hawkes, J. A., Hansen, C. T., Goldhammer, T., Bach, W., and Dittmar, T.: Molecular alteration of marine dissolved organic matter under experimental hydrothermal conditions, Geochim. Cosmochim. Ac., 175, 68–85, https://doi.org/10.1016/j.gca.2015.11.025, 2016.
Hedges, J. I.: Global biogeochemical cycles: progress and problems, Mar. Chem., 39, 67–93, https://doi.org/10.1016/0304-4203(92)90096-S, 1992.
Hertkorn, N., Harir, M., Cawley, K. M., Schmitt-Kopplin, P., and Jaffé, R.: Molecular characterization of dissolved organic matter from subtropical wetlands: a comparative study through the analysis of optical properties, NMR and FTICR/MS, Biogeosciences, 13, 2257–2277, https://doi.org/10.5194/bg-13-2257-2016, 2016.
Hestetun, J. T., Dahle, H., Jørgensen, S. L., Olsen, B. R., and Rapp, H. T.: The Microbiome and Occurrence of Methanotrophy in Carnivorous Sponges, Front. Microbiol., 7, 1781, https://doi.org/10.3389/fmicb.2016.01781, 2016.
Hill, V. J. and Zimmerman, R. C.: Characteristics of colored dissolved organic material in first year landfast sea ice and the underlying water column in the Canadian Arctic in the early spring, Mar. Chem., 180, 1–13, https://doi.org/10.1016/j.marchem.2016.01.007, 2016.
Hockaday, W. C., Purcell, J. M., Marshall, A. G., Baldock, J. A., and Hatcher, P. G.: Electrospray and photoionization mass spectrometry for the characterization of organic matter in natural waters: a qualitative assessment, Limnol. Oceanogr.-Meth., 7, 81–95, 2009.
Hodgkins, S. B., Tfaily, M. M., Podgorski, D. C., McCalley, C. K., Saleska, S. R., Crill, P. M., Rich, V. I., Chanton, J. P., and Cooper, W. T.: Elemental composition and optical properties reveal changes in dissolved organic matter along a permafrost thaw chronosequence in a subarctic peatland, Geochim. Cosmochim. Ac., 187, 123–140, https://doi.org/10.1016/j.gca.2016.05.015, 2016.
Horiuchi, T., Takano, Y., Ishibashi, J., Marumo, K., Urabe, T., and Kobayashi, K.: Amino acids in water samples from deep sea hydrothermal vents at Suiyo Seamount, Izu-Bonin Arc, Pacific Ocean, Org. Geochem., 35, 1121–1128, https://doi.org/10.1016/j.orggeochem.2004.06.006, 2004.
Jaffé, R., Yamashita, Y., Maie, N., Cooper, W. T., Dittmar, T., Dodds, W. K., Jones, J. B., Myoshi, T., Ortiz-Zayas, J. R., Podgorski, D. C., and Watanabe, A.: Dissolved Organic Matter in Headwater Streams: Compositional Variability across Climatic Regions of North America, Geochim. Cosmochim. Ac., 94, 95–108, https://doi.org/10.1016/j.gca.2012.06.031, 2012.
Jakobsson, M., Macnab, R., Mayer, L., Anderson, R., Edwards, M., Hatzky, J., Schenke, H. W., and Johnson, P.: An improved bathymetric portrayal of the Arctic Ocean: Implications for ocean modeling and geological, geophysical and oceanographic analyses, Geophys. Res. Lett., 35, L07602, https://doi.org/10.1029/2008GL033520, 2008.
Jørgensen, L., Stedmon, C. A., Kaartokallio, H., Middelboe, M., and Thomas, D. N.: Changes in the composition and bioavailability of dissolved organic matter during sea ice formation, Limnol. Oceanogr., 60, 817–830, 2015.
Karl, D., Beversdorf, L., Orkman, K., Church, M., Martinez, A., and Delong, E.: Aerobic production of methane in the sea, Nat. Geosci., 1, 473–478, https://doi.org/10.1038/ngeo234, 2008.
Keeling, C. D.: The concentration and isotopic abundances of carbon dioxide in rural and marine air, Geochim. Cosmochim. Ac., 24, 277–298, https://doi.org/10.1016/0016-7037(61)90023-0, 1961.
Keir, R. S., Sültenfuß, J., Rhein, M., Petrick, G., and Greinert, J.: Separation of 3He and CH4 signals on the Mid-Atlantic Ridge at 5∘ N and 51∘ N, Geochim. Cosmochim. Ac., 70, 5766–5778, https://doi.org/10.1016/j.gca.2006.06.005, 2006.
Keir, R. S., Schmale, O., Seifert, R., and Sültenfuß, J.: Isotope fractionation and mixing in methane plumes from the Logatchev hydrothermal field, Geochem. Geophy. Geosy., 10, Q05005, https://doi.org/10.1029/2009GC002403, 2009.
Kim, S., Kramer, R. W., and Hatcher, P. G.: Graphical Method for Analysis of Ultrahigh-Resolution Broadband Mass Spectra of Natural Organic Matter, the Van Krevelen Diagram, Anal. Chem., 75, 5336–5344, https://doi.org/10.1021/ac034415p, 2003.
Kudo, K., Yamada, K., Toyoda, S., Yoshida, N., Sasano, D., Kosugi, N., Ishii, M., Yoshikawa, H., Murata, A., Uchida, H., and Nishino, S.: Spatial distribution of dissolved methane and its source in the western Arctic Ocean, J. Oceanogr., 74, 305–317, https://doi.org/10.1007/s10872-017-0460-y, 2018.
Kujawinski, E. B., Longnecker, K., Blough, N. V., Vecchio, R. D., Finlay, L., Kitner, J. B., and Giovannoni, S. J.: Identification of possible source markers in marine dissolved organic matter using ultrahigh resolution mass spectrometry, Geochim. Cosmochim. Ac., 73, 4384–4399, https://doi.org/10.1016/j.gca.2009.04.033, 2009.
Lang, S. Q., Butterfield, D. A., Lilley, M. D., Johnson, H. P., and Hedges, J. I.: Dissolved organic carbon in ridge-axis and ridge-flank hydrothermal systems, Geochim. Cosmochim. Ac., 70, 3830–3842, https://doi.org/10.1016/j.gca.2006.04.031, 2006.
Lang, S. Q., Butterfield, D. A., Schulte, M., Kelley, D. S., and Lilley, M. D.: Elevated concentrations of formate, acetate and dissolved organic carbon found at the Lost City hydrothermal field, Geochim. Cosmochim. Ac., 74, 941–952, https://doi.org/10.1016/j.gca.2009.10.045, 2010.
Levin, L. A., Baco, A. R., Bowden, D. A., Colaco, A., Cordes, E. E., Cunha, M. R., Demopoulos, A. W. J., Gobin, J., Grupe, B. M., Le, J., Metaxas, A., Netburn, A. N., Rouse, G. W., Thurber, A. R., Tunnicliffe, V., Van Dover, C. L., Vanreusel, A., and Watling, L.: Hydrothermal Vents and Methane Seeps: Rethinking the Sphere of Influence, Front. Mar. Sci., 3, 72, https://doi.org/10.3389/fmars.2016.00072, 2016.
Li, G., Xie, H., Song, G., and Gosselin, M.: Production of Chromophoric Dissolved Organic Matter (CDOM) in Laboratory Cultures of Arctic Sea Ice Algae, Water, 11, 926, https://doi.org/10.3390/w11050926, 2019.
Liu, S., He, Z., Tang, Z., Liu, L., Hou, J., Li, T., Zhang, Y., Shi, Q., Giesy, J. P., and Wu, F.: Linking the molecular composition of autochthonous dissolved organic matter to source identification for freshwater lake ecosystems by combination of optical spectroscopy and FT-ICR-MS analysis, Sci. Total Environ., 703, 134764, https://doi.org/10.1016/j.scitotenv.2019.134764, 2020.
Longnecker, K.: Dissolved organic matter in newly formed sea ice and surface seawater, Geochim. Cosmochim. Ac., 171, 39–49, https://doi.org/10.1016/j.gca.2015.08.014, 2015.
Longnecker, K., Sievert, S. M., Sylva, S. P., Seewald, J. S., and Kujawinski, E. B.: Dissolved organic carbon compounds in deep-sea hydrothermal vent fluids from the East Pacific Rise at N, Org. Geochem., 125, 41–49, https://doi.org/10.1016/j.orggeochem.2018.08.004, 2018.
Lorenson, T. D., Greinert, J., and Coffin, R. B.: Dissolved methane in the Beaufort Sea and the Arctic Ocean, 1992–2009; sources and atmospheric flux, Limnol. Oceanogr., 61, S300–S323, https://doi.org/10.1002/lno.10457, 2016.
Lupton, J. E. and Craig, H.: A Major Helium-3 Source at 15∘ S on the East Pacific Rise, Science, 214, 13–18, https://doi.org/10.1126/science.214.4516.13, 1981.
Marcon, Y., Purser, A., Albers, E., Türke, A., German, C., Hand, K., Schlindwein, V., Dorschel, B., Boetius, A., and Bach, W.: Geological settings of hydrothermal vents at W and E on the Gakkel Ridge, Arctic Ocean, Goldschmidt Abstracts, 1, 2566, https://goldschmidtabstracts.info/abstracts/abstractView?id=2017004414 (last access: 14 April 2022), 2017.
Marnela, M., Rudels, B., Olsson, K. A., Anderson, L. G., Jeansson, E., Torres, D. J., Messias, M.-J., Swift, J. H., and Watson, A. J.: Transports of Nordic Seas water masses and excess SF6 through Fram Strait to the Arctic Ocean, Prog. Oceanogr., 78, 1–11, https://doi.org/10.1016/j.pocean.2007.06.004, 2008.
McCollom, T. M. and Seewald, J. S.: Abiotic Synthesis of Organic Compounds in Deep-Sea Hydrothermal Environments, Chem. Rev., 107, 382–401, https://doi.org/10.1021/cr0503660, 2007.
McCollom, T. M., Ritter, G., and Simoneit, B. R. T.: Lipid Synthesis Under Hydrothermal Conditions by Fischer- Tropsch-Type Reactions, Origins Life Evol. B., 29, 153–166, 1999.
McCollom, T. M., Seewald, J. S., and German, C. R.: Investigation of extractable organic compounds in deep-sea hydrothermal vent fluids along the Mid-Atlantic Ridge, Geochim. Cosmochim. Ac., 156, 122–144, https://doi.org/10.1016/j.gca.2015.02.022, 2015.
McDermott, J. M., Seewald, J. S., German, C. R., and Sylva, S. P.: Pathways for abiotic organic synthesis at submarine hydrothermal fields, PNAS, 112, 7668–7672, https://doi.org/10.1073/pnas.1506295112, 2015.
McDermott, J. M., Albers, E., Bach, W., Diehl, A., German, C. R., Hand, K., Koehler, J., Walter, M., Wegener, G., and Boetius, A.: Geochemistry, physics, and dispersion of a Gakkel Ridge hydrothermal plume, 87∘ N, E, Goldschmidt Abstracts, 1, 2654, https://goldschmidtabstracts.info/abstracts/abstractView?id=2017006020 (last access: 14 April 2022), 2017.
Michael, P. J., Langmuir, C. H., Dick, H. J. B., Snow, J. E., Goldstein, S. L., Graham, D. W., Lehnert, K., Kurras, G., Jokat, W., Mühe, R., and Edmonds, H. N.: Magmatic and amagmatic seafloor generation at the ultraslow-spreading Gakkel ridge, Arctic Ocean, Nature, 423, 956–961, https://doi.org/10.1038/nature01704, 2003.
Mopper, K., Stubbins, A., Ritchie, J. D., Bialk, H. M., and Hatcher, P. G.: Advanced Instrumental Approaches for Characterization of Marine Dissolved Organic Matter: Extraction Techniques, Mass Spectrometry, and Nuclear Magnetic Resonance Spectroscopy, Chem. Rev., 107, 419–442, https://doi.org/10.1021/cr050359b, 2007.
Nakamura, K. and Takai, K.: Theoretical constraints of physical and chemical properties of hydrothermal fluids on variations in chemolithotrophic microbial communities in seafloor hydrothermal systems, Progress in Earth and Planetary Science, 1, 5, https://doi.org/10.1186/2197-4284-1-5, 2014.
Noowong, A., Gomez-Saez, G. V., Hansen, C. T., Schwarz-Schampera, U., Koschinsky, A., and Dittmar, T.: Imprint of Kairei and Pelagia deep-sea hydrothermal systems (Indian Ocean) on marine dissolved organic matter, Org. Geochem., 152, 104141, https://doi.org/10.1016/j.orggeochem.2020.104141, 2021.
Ohno, T., Sleighter, R. L., and Hatcher, P. G.: Comparative study of organic matter chemical characterization using negative and positive mode electrospray ionization ultrahigh-resolution mass spectrometry, Anal. Bioanal. Chem., 408, 2497–2504, https://doi.org/10.1007/s00216-016-9346-x, 2016.
Oksanen, J., Blanchet, F. G., Friendly, M., Kindt, R., Legendre, P., McGlinn, D., Minchin, P. R., O’Hara, R. B., Simpson, G. L., Solymos, P., Stevens, M. H. H., Szoecs, E., and Wagner, H.: vegan: Community Ecology Package, R package version 2.5-7, https://CRAN.R-project.org/package=vegan (last access: 14 April 2022), 2020.
Ortmann, A. and Suttle, C.: High abundance of viruses in a deep-sea hydrothermal vent system indicates viral mediated microbial mortality, Deep-Sea Res. Pt. I, 52, 1515–1527, https://doi.org/10.1016/j.dsr.2005.04.002, 2005.
Osterholz, H., Kirchman, D. L., Niggemann, J., and Dittmar, T.: Environmental Drivers of Dissolved Organic Matter Molecular Composition in the Delaware Estuary, Front. Earth Sci., 4, 35, https://doi.org/10.3389/feart.2016.00095, 2016.
Östlund, H. G. and Hut, G.: Arctic Ocean water mass balance from isotope data, J. Geophys. Res., 89, 6373, https://doi.org/10.1029/JC089iC04p06373, 1984.
Paradis, E. and Schliep, K.: ape 5.0: an environment for modern phylogenetics and evolutionary analyses in R, Bioinformatics, 35, 526–528, https://doi.org/10.1093/bioinformatics/bty633, 2019.
Pataki, D. E., Ehleringer, J. R., Flanagan, L. B., Yakir, D., Bowling, D. R., Still, C. J., Buchmann, N., Kaplan, J. O., and Berry, J. A.: The application and interpretation of Keeling plots in terrestrial carbon cycle research, Global Biogeochem. Cy., 17, 1022, https://doi.org/10.1029/2001GB001850, 2003.
Pedersen, R. B., Rapp, H. T., Thorseth, I. H., Lilley, M. D., Barriga, F. J. A. S., Baumberger, T., Flesland, K., Fonseca, R., Früh-Green, G. L., and Jorgensen, S. L.: Discovery of a black smoker vent field and vent fauna at the Arctic Mid-Ocean Ridge, Nat. Commun., 1, 126, https://doi.org/10.1038/ncomms1124, 2010.
Purser, A., Marcon, Y., Dreutter, S., Hoge, U., Sablotny, B., Hehemann, L., Lemburg, J., Dorschel, B., Biebow, H., and Boetius, A.: Ocean Floor Observation and Bathymetry System (OFOBS): A New Towed Camera/Sonar System for Deep-Sea Habitat Surveys, IEEE J. Oceanic Eng., 44, 87–99, https://doi.org/10.1109/JOE.2018.2794095, 2019.
Qian, J. and Mopper, K.: Automated High-Performance, High-Temperature Combustion Total Organic Carbon Analyzer, Anal. Chem., 68, 3090–3097, https://doi.org/10.1021/ac960370z, 1996.
R Core Team: R: A Language and Environment for Statistical Computing, R Foundation for Statistical Computing, Vienna, Austria, https://www.R-project.org/ (last access: 14 April 2022), 2018.
Ramirez-Llodra, E., Brandt, A., Danovaro, R., De Mol, B., Escobar, E., German, C. R., Levin, L. A., Martinez Arbizu, P., Menot, L., Buhl-Mortensen, P., Narayanaswamy, B. E., Smith, C. R., Tittensor, D. P., Tyler, P. A., Vanreusel, A., and Vecchione, M.: Deep, diverse and definitely different: unique attributes of the world's largest ecosystem, Biogeosciences, 7, 2851–2899, https://doi.org/10.5194/bg-7-2851-2010, 2010.
Redfield, A. C.: The biological control of chemical factors in the environment, Am. Sci., 46, 205–221, 1958.
Reeburgh, W. S.: Oceanic Methane Biogeochemistry, Chem. Rev., 107, 486–513, https://doi.org/10.1021/cr050362v, 2007.
Reeves, E. P. and Fiebig, J.: Abiotic Synthesis of Methane and Organic Compounds in Earth's Lithosphere, Elements, 16, 25–31, https://doi.org/10.2138/gselements.16.1.25, 2020.
Retelletti Brogi, S., Ha, S.-Y., Kim, K., Derrien, M., Lee, Y. K., and Hur, J.: Optical and molecular characterization of dissolved organic matter (DOM) in the Arctic ice core and the underlying seawater (Cambridge Bay, Canada): Implication for increased autochthonous DOM during ice melting, Sci. Total Environ., 627, 802–811, https://doi.org/10.1016/j.scitotenv.2018.01.251, 2018.
Rossel, P. E., Stubbins, A., Hach, P. F., and Dittmar, T.: Bioavailability and molecular composition of dissolved organic matter from a diffuse hydrothermal system, Mar. Chem., 177, 257–266, https://doi.org/10.1016/j.marchem.2015.07.002, 2015.
Rossel, P. E., Stubbins, A., Rebling, T., Koschinsky, A., Hawkes, J. A., and Dittmar, T.: Thermally altered marine dissolved organic matter in hydrothermal fluids, Org. Geochem., 110, 73–86, https://doi.org/10.1016/j.orggeochem.2017.05.003, 2017.
Rudels, B., Wadhams, P., Dowdeswell, J. A., and Schofield, A. N.: The thermohaline circulation of the Arctic Ocean and the Greenland Sea, Philos. T. R. Soc. A, 352, 287–299, https://doi.org/10.1098/rsta.1995.0071, 1995.
Rudels, B., Björk, G., Nilsson, J., Winsor, P., Lake, I., and Nohr, C.: The interaction between waters from the Arctic Ocean and the Nordic Seas north of Fram Strait and along the East Greenland Current: results from the Arctic Ocean-02 Oden expedition, J. Marine Syst., 55, 1–30, https://doi.org/10.1016/j.jmarsys.2004.06.008, 2005.
Rudnicki, M. D. and Elderfield, H.: A chemical model of the buoyant and neutrally buoyant plume above the TAG vent field, 26 degrees N, Mid-Atlantic Ridge, Geochim. Cosmochim. Ac., 57, 2939–2957, https://doi.org/10.1016/0016-7037(93)90285-5, 1993.
Santibáñez, P. A., Michaud, A. B., Vick-Majors, T. J., D'Andrilli, J., Chiuchiolo, A., Hand, K. P., and Priscu, J. C.: Differential Incorporation of Bacteria, Organic Matter, and Inorganic Ions Into Lake Ice During Ice Formation, J. Geophys. Res.-Biogeo., 124, 585–600, https://doi.org/10.1029/2018JG004825, 2019.
Sert, M. F., D’Andrilli, J., Gründger, F., Niemann, H., Granskog, M. A., Pavlov, A. K., Ferré, B., and Silyakova, A.: Compositional Differences in Dissolved Organic Matter Between Arctic Cold Seeps Versus Non-Seep Sites at the Svalbard Continental Margin and the Barents Sea, Front. Earth Sci., 8, 552731, https://doi.org/10.3389/feart.2020.552731, 2020.
Sert, M. F., Reeves, E. P., Hand, K. P., and Ferré, B.: Replication data for: Compositions of dissolved organic matter in the ice-covered waters above the Aurora hydrothermal vent system, Gakkel Ridge, Arctic Ocean, DataverseNO [data set] and [code], https://doi.org/10.18710/QPGDFW, 2021.
Simoneit, B. R. T.: Aqueous organic geochemistry at high temperature/high pressure, Origins Life Evol. B., 22, 43–65, https://doi.org/10.1007/BF01808018, 1992.
Simoneit, B. R. T.: Evidence for organic synthesis in high temperature aqueous media – Facts and prognosis, Origins Life Evol. B., 25, 119–140, https://doi.org/10.1007/BF01581578, 1995.
Simoneit, B. R. T., Lein, A. Yu., Peresypkin, V. I., and Osipov, G. A.: Composition and origin of hydrothermal petroleum and associated lipids in the sulfide deposits of the Rainbow field (Mid-Atlantic Ridge at 36∘ N), Geochim. Cosmochim. Ac., 68, 2275–2294, https://doi.org/10.1016/j.gca.2003.11.025, 2004.
Speer, K. G. and Rona, P. A.: A model of an Atlantic and Pacific hydrothermal plume, J. Geophys. Res.-Oceans, 94, 6213–6220, https://doi.org/10.1029/JC094iC05p06213, 1989.
Tao, Y., Rosswog, S., and Brüggen, M.: A simulation modeling approach to hydrothermal plumes and its comparison to analytical models, Ocean Model., 61, 68–80, https://doi.org/10.1016/j.ocemod.2012.10.001, 2013.
Thingstad, T. F., Hagström, Å., and Rassoulzadegan, F.: Accumulation of degradable DOC in surface waters: Is it caused by a malfunctioning microbial loop?, Limnol. Oceanogr., 42, 398–404, https://doi.org/10.4319/lo.1997.42.2.0398, 1997.
Vanreusel, A., Andersen, A., Boetius, A., Connelly, D., Cunha, M., Decker, C., Heeschen, K., Hilario, A., Kormas, K., Maignien, L., Olu, K., Pachiadaki, M., Ritt, B., Rodrigues, C., Sarrazin, J., Tyler, P., Van Gaever, S., and Vanneste, H.: Biodiversity of Cold Seep Ecosystems Along the European Margins, Oceanography, 22, 110–127, https://doi.org/10.5670/oceanog.2009.12, 2009.
Vergeynst, L., Christensen, J. H., Kjeldsen, K. U., Meire, L., Boone, W., Malmquist, L. M. V., and Rysgaard, S.: In situ biodegradation, photooxidation and dissolution of petroleum compounds in Arctic seawater and sea ice, Water Res., 148, 459–468, https://doi.org/10.1016/j.watres.2018.10.066, 2019.
Wang, D. T., Reeves, E. P., McDermott, J. M., Seewald, J. S., and Ono, S.: Clumped isotopologue constraints on the origin of methane at seafloor hot springs, Geochim. Cosmochim. Ac., 223, 141–158, https://doi.org/10.1016/j.gca.2017.11.030, 2018.
Whiticar, M. J.: Carbon and hydrogen isotope systematics of bacterial formation and oxidation of methane, Chem. Geol., 161, 291–314, https://doi.org/10.1016/S0009-2541(99)00092-3, 1999.
Winkler, L. W.: Die Bestimmung des im Wasser gelösten Sauerstoffes, Ber. Dtsch. Chem. Ges., 21, 2843–2854, https://doi.org/10.1002/cber.188802102122, 1888.
Xu, W., Gao, Q., He, C., Shi, Q., Hou, Z.-Q., and Zhao, H.-Z.: Using ESI FT-ICR MS to Characterize Dissolved Organic Matter in Salt Lakes with Different Salinity, Environ. Sci. Technol., 54, 12929–12937, https://doi.org/10.1021/acs.est.0c01681, 2020.
Yahel, G., Sharp, J. H., Marie, D., Häse, C., and Genin, A.: In situ feeding and element removal in the symbiont-bearing sponge Theonella swinhoei: Bulk DOC is the major source for carbon, Limnol. Oceanogr., 48, 141–149, https://doi.org/10.4319/lo.2003.48.1.0141, 2003.
Yücel, M., Gartman, A., Chan, C. S., and Luther, G. W.: Hydrothermal vents as a kinetically stable source of iron-sulphide-bearing nanoparticles to the ocean, Nat. Geosci., 4, 367–371, https://doi.org/10.1038/ngeo1148, 2011.