the Creative Commons Attribution 4.0 License.
the Creative Commons Attribution 4.0 License.
 | 22 Apr 2022
Carbon sequestration potential of street tree plantings in Helsinki
Liisa Kulmala
Pasi Kolari
Timo Vesala
Anu Riikonen
Leena Järvi
Cities have become increasingly interested in reducing their greenhouse gas emissions and increasing carbon sequestration and storage in urban vegetation and soil as part of their climate mitigation actions. However, most of our knowledge of the biogenic carbon cycle is based on data and models from forested ecosystems, despite urban nature and microclimates differing greatly from those in natural or forested ecosystems. There is a need for modelling tools that can correctly consider temporal variations in the urban carbon cycle and take specific urban conditions into account. The main aims of our study were to (1) examine the carbon sequestration potential of two commonly used street tree species (Tilia × vulgaris and Alnus glutinosa) growing in three different growing media by taking into account the complexity of urban conditions and (2) evaluate the urban land surface model SUEWS (Surface Urban Energy and Water Balance Scheme) and the soil carbon model Yasso15 in simulating the carbon sequestration of these street tree plantings at temporal scales (diurnal, monthly, and annual). SUEWS provides data on the urban microclimate and on street tree photosynthesis and respiration, whereas soil carbon storage is estimated with Yasso. These models were used to study the urban carbon cycle throughout the expected lifespan of street trees (2002–2031). Within this period, model performances were evaluated against transpiration estimated from sap flow, soil carbon content, and soil moisture measurements from two street tree sites located in Helsinki, Finland.
The models were able to capture the variability in the urban carbon cycle and transpiration due to changes in environmental conditions, soil type, and tree species. Carbon sequestration potential was estimated for an average street tree and for the average of the diverse soils present in the study area. Over the study period, soil respiration dominated carbon exchange over carbon sequestration due to the high initial carbon loss from the soil after street construction. However, the street tree plantings turned into a modest sink of carbon from the atmosphere on an annual scale, as tree and soil respiration approximately balanced the photosynthesis. The compensation point when street tree plantings turned from an annual source into a sink was reached more rapidly – after 12 years – by Alnus trees, while this point was reached by Tilia trees after 14 years. However, these moments naturally vary from site to site depending on the growing media, planting density, tree species, and climate. Overall, the results indicate the importance of soil in urban carbon sequestration estimations.
- Article
(3867 KB) - Full-text XML
- BibTeX
- EndNote


Ongoing climate warming is caused by anthropogenic emissions of greenhouse gases (GHGs). A large proportion of these emissions, especially carbon dioxide (CO2), originate from urban areas (Marcotullio et al., 2013). To fight against the climate crisis, a significant number of cities have declared targets for becoming carbon neutral in future decades. City-scale carbon neutrality means that either the GHG emissions and sinks are in balance or, alternatively, part of the emissions are compensated for elsewhere. Urban green areas have been found to sequester significant levels of city GHG emissions. For example, the biogenic carbon fluxes in Boston, USA and Florence, Italy amounted to 14 % (Hardiman et al., 2017) and 6.2 % (Vaccari et al., 2013) of both cities' GHG emissions, respectively. However, urban nature is highly diverse in terms of soil properties, plant species, and biomass, which creates a great deal of uncertainty in the estimates. For cities to reliably quantify their own carbon sinks to urban vegetation and soil, more information on the biogenic carbon cycle in urban areas is required.
Urban trees can offer a variety of ecosystem services, ranging from carbon sequestration to cooling of local temperatures, storm water mitigation, and improving air quality (Pataki et al., 2011; Pickett et al., 2011). The efficiency of these ecosystem services depends on local growing and climatic conditions for trees. City trees are affected for example by the urban heat island effect (Oke, 1982), soil moisture availability, limited growth conditions, and management practices (Dahlhausen et al., 2018; Nielsen et al., 2007; Raciti et al., 2014). The quantification of carbon storage and sequestration by urban trees has previously been studied using field campaigns (Riikonen et al., 2017), biomass estimations (Stoffberg et al., 2010), remote sensing (Myeong et al., 2006; Zhao and Sander, 2015), and most widely with GIS-based i-Tree software, including i-Tree Eco and i-Tree Streets (Nowak and Crane, 2000). i-Tree software uses data on tree characteristics and estimates carbon sequestration and storage using biomass equations developed for urban trees based on US urban tree data. Most of these studies are from the US (McPherson et al., 2005, 2011), but some studies outside the US have also applied these models (Soares et al., 2011; Russo et al., 2014). However, these methods are incapable of detecting the correct response of the urban biogenic carbon cycle to local environmental conditions and changes in local climate, as climate conditions have been adjusted for the US and thus lack high temporal resolution. In addition, the model cannot simulate carbon cycling in future climates. Moreover, the methods focus on urban trees, ignoring other vegetation types and often urban soil altogether.
Urban land surface models (LSMs) can be used to simulate the carbon cycle in urban areas (e.g. SURFEX, Goret et al., 2019), but vegetation is commonly treated in a separate tile without any interactions with built surfaces. In reality, the built environment in urban areas allows the formation of the urban heat island effect, strong variation in soil moisture, and lateral water flows between built-up and vegetative surfaces. Interactions of urban surfaces with photosynthesis and plant and soil respiration were recently included in the urban land surface model SUEWS (Surface Urban Energy and Water Balance Scheme, Järvi et al., 2019), which allows the net carbon sink of urban vegetation to be examined. In SUEWS, photosynthesis is modelled with the empirical canopy model, which accounts for local conditions affecting plant stomatal control, such as air temperature, specific humidity, soil moisture, and short-wave radiation (Järvi et al., 2019). Plant and soil respiration is modelled as exponentially depending on air temperature. Urban LSMs focus on the exchange of carbon between vegetation and the atmosphere, taking local-scale soil respiration into account. Overall, LSMs are ideal for partitioning observed net CO2 fluxes into anthropogenic and biogenic components, particularly considering the effect of the interaction of urban structure and vegetation on the urban climate and thus on carbon sequestration. LSM-simulated carbon sinks can also be used to reduce uncertainties in anthropogenic CO2 emissions derived from satellite and atmospheric in situ observations.
Urban soils can differ greatly from natural soils (Pickett et al., 2011), as they are usually man-made soils that are created when streets and parks are built. Management practices, such as irrigation, litter removal, and fertilization, also directly affect the soil. Previous studies have shown that soil organic carbon (SOC) stocks in urban soils vary widely (Lorenz and Lal, 2015), with most studies showing urban soils to contain more SOC than soils in non-urban areas (Pataki et al., 2006; Pouyat et al., 2006; Raciti et al., 2012; Edmondson et al., 2012, 2014; Lindén et al., 2020), but contradicting results have also been published (Sarzhanov et al., 2017; Liu et al., 2016; Chen et al., 2013). The consensus has been that soil loses carbon rapidly initially after construction, but SOC levels increase more in the subsequent decades in urban soils than in the natural environment (Pataki et al., 2006). The impact is visible in parks, but in general, the structure of cities affects the soil beneath buildings and paved areas, preventing such processes. In some cases, higher soil respiration levels have been observed in urban than in the natural environment (Kaye et al., 2005; Pataki et al., 2006; Sarzhanov et al., 2015; Decina et al., 2016). Depending on the management practices, more or less litter, i.e. carbon input, can reach the soil. Turf grasses are usually irrigated, fertilized, and clipped regularly throughout the growing season, leading to higher soil carbon levels (Pouyat et al., 2009). On the contrary, above-ground plant litter is usually removed from gardens, parks, and roadsides, and therefore less above-ground carbon reaches the soil to decompose.
Soil carbon decomposition depends on the size of the SOC pool, and on temperature and precipitation (Davidson and Janssens, 2006). Multiple climate-driven ecosystem soil decomposition models therefore exist, e.g. Yasso15 (Viskari et al., 2020), CENTURY (Parton et al., 1988), Millennial (Abramoff et al., 2018), and ORCHIDEE-SOM (Camino-Serrano et al., 2018). Soil carbon models are developed especially for native ecosystems, such as forests, and for agricultural soils (Karhu et al., 2012). None, to our knowledge, have been developed to simulate the complexity of urban soils, and therefore it remains unclear whether these models are suitable for urban areas. So far, the CENTURY model has been used to evaluate soil organic carbon for turf grass in golf courses (Bandaranayake et al., 2003) and to simulate how clippings affect SOC storage (Qian et al., 2003). In addition, CENTURY simulations of lawn SOC were more successful when management practices were considered (Trammell et al., 2017). Recently, the Yasso model was used to estimate citywide SOC in Finland (HSY, 2021), but it lacked verification against measurements. Because the urban environment and management have a large impact on the soil carbon cycle, the use of these models in cities requires more testing.
The aim of our study is to use SUEWS and Yasso to estimate the carbon cycle dynamics in urban nature. We had two specific objectives: (1) to describe the diurnal, seasonal, and interannual CO2 flux dynamics of planted urban street trees and (2) to describe the temporal dynamics of the organic carbon pool in the soil beneath those street trees. For this purpose, we evaluated the performance of both models using measurements from two street tree sites in Helsinki, Finland. The stomatal control model in SUEWS was parameterized to meet the leaf-scale measurements of street trees and verified against whole-tree transpiration of the trees, whereas the Yasso model was evaluated against SOC pools.
SUEWS and Yasso were used to simulate the two street tree sites in 2002–2016. The sites represent typical suburban neighbourhoods of Helsinki.
2.1 Site description
In 2002, the City of Helsinki, collaborating with the University of Helsinki, established two street tree study sites in Viikki (60∘15′ N, 25∘03′ N, Fig. 1, Table 1), 9 km northeast of Helsinki city centre, as part of the Viikki Street Tree Research project (2002–2016, Riikonen et al., 2011). The main aim of the project was to examine the impact of growing media on the growth and well-being of street trees. Intensive monitoring of tree properties, gas exchange, and soil carbon content was conducted during the study period. On one street (hereafter “the Tilia site”), 15 Tilia × vulgaris Hayne trees were planted, while 22 Alnus glutinosa (L.) Gaertn. f. pyramidalis “Sakari” trees were planted on another street (hereafter “the Alnus site”). Approximately 15–30 m3 and 45–50 m3 rooting volumes were provided for each Tilia and Alnus tree, respectively. The spacing between trees was 15 m for Tilia and 4–5 m for Alnus trees. The Tilia site is surrounded by a park and office buildings, and the Alnus site is surrounded by two-floor apartment buildings. The trees were irrigated weekly for 2 years after street construction. However, irrigation was neglected in the model simulations, as Yasso cannot currently include irrigation and the irrigation model in SUEWS is designed for typical garden irrigation. This is expected to have only a minor impact on our results. Hereafter, we call the unit formed by the trees and their growing media, i.e. soil, “street tree plantings”. The Tilia and Alnus sites are characterized by local climate zones (LCZ, Stewart and Oke, 2012) 9 and 6, respectively.
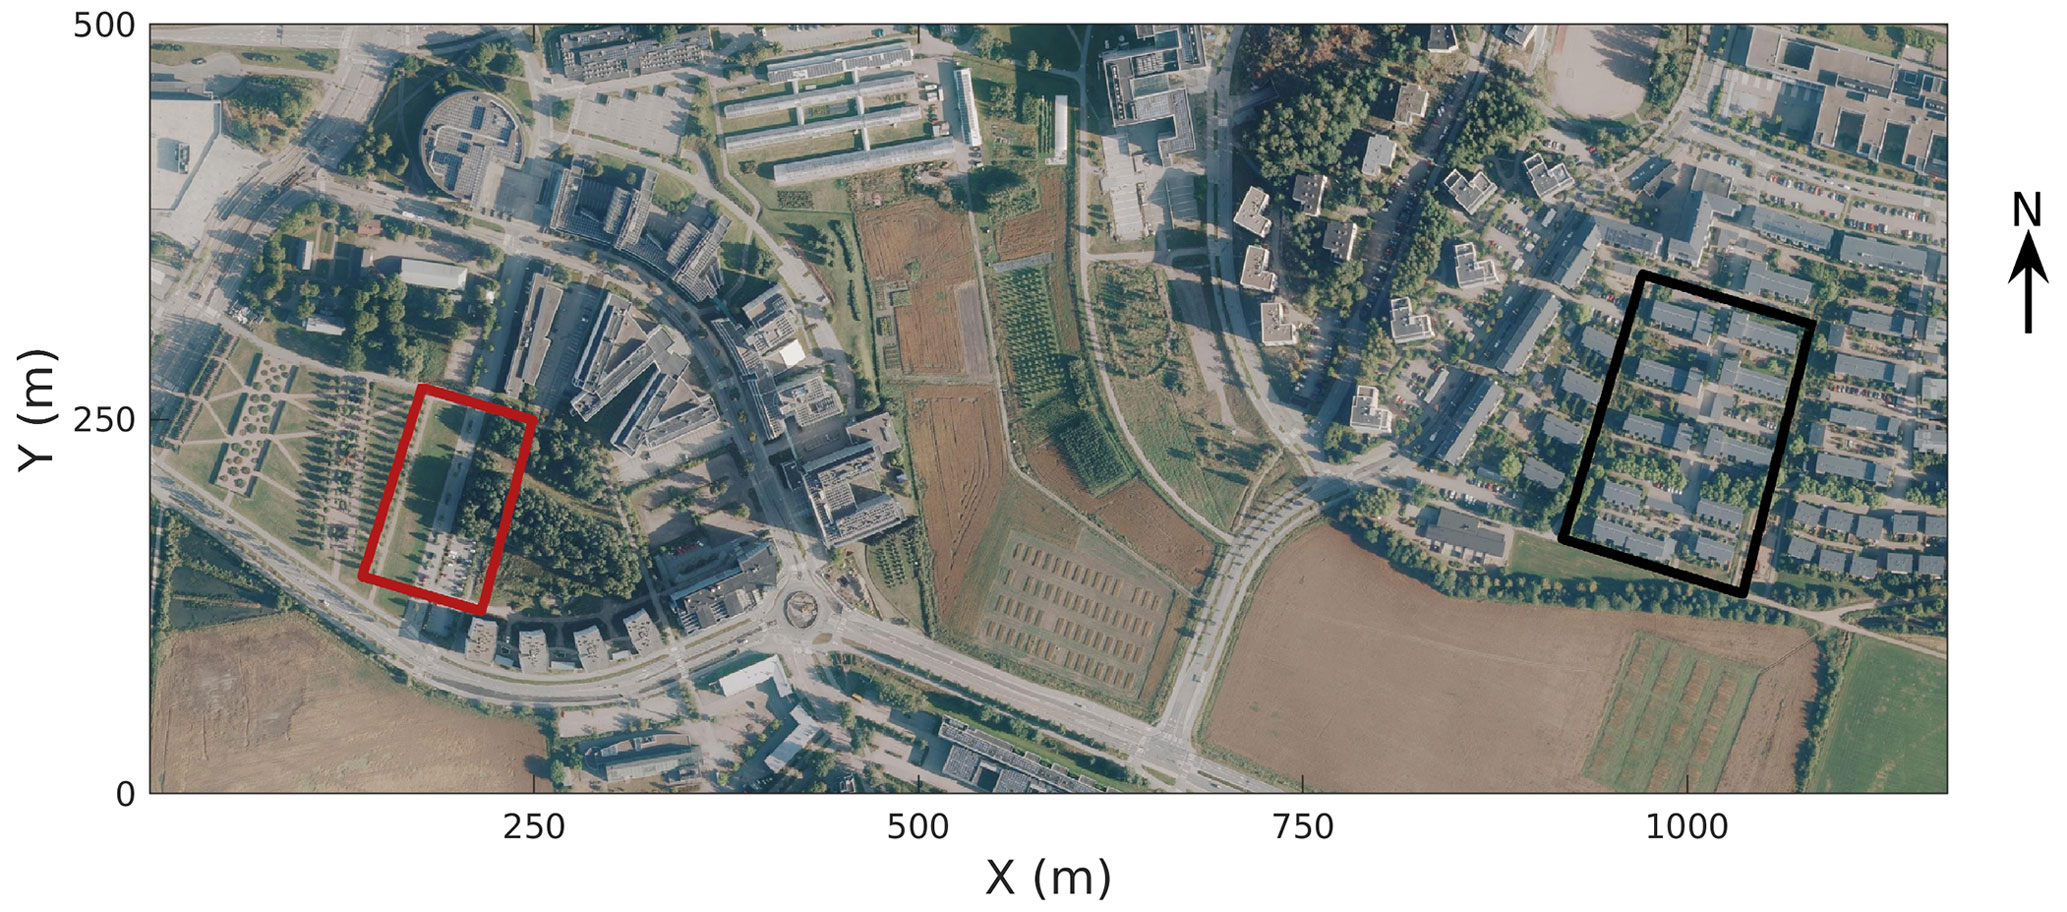
Figure 1Study areas in Viikki, Helsinki (Kaupunkimittausosasto, Helsinki, 2019). The Tilia site is marked by a red square and the Alnus site by a black square.
Table 1Site characteristics and model parameters for the Tilia and Alnus sites in Viikki, Helsinki.
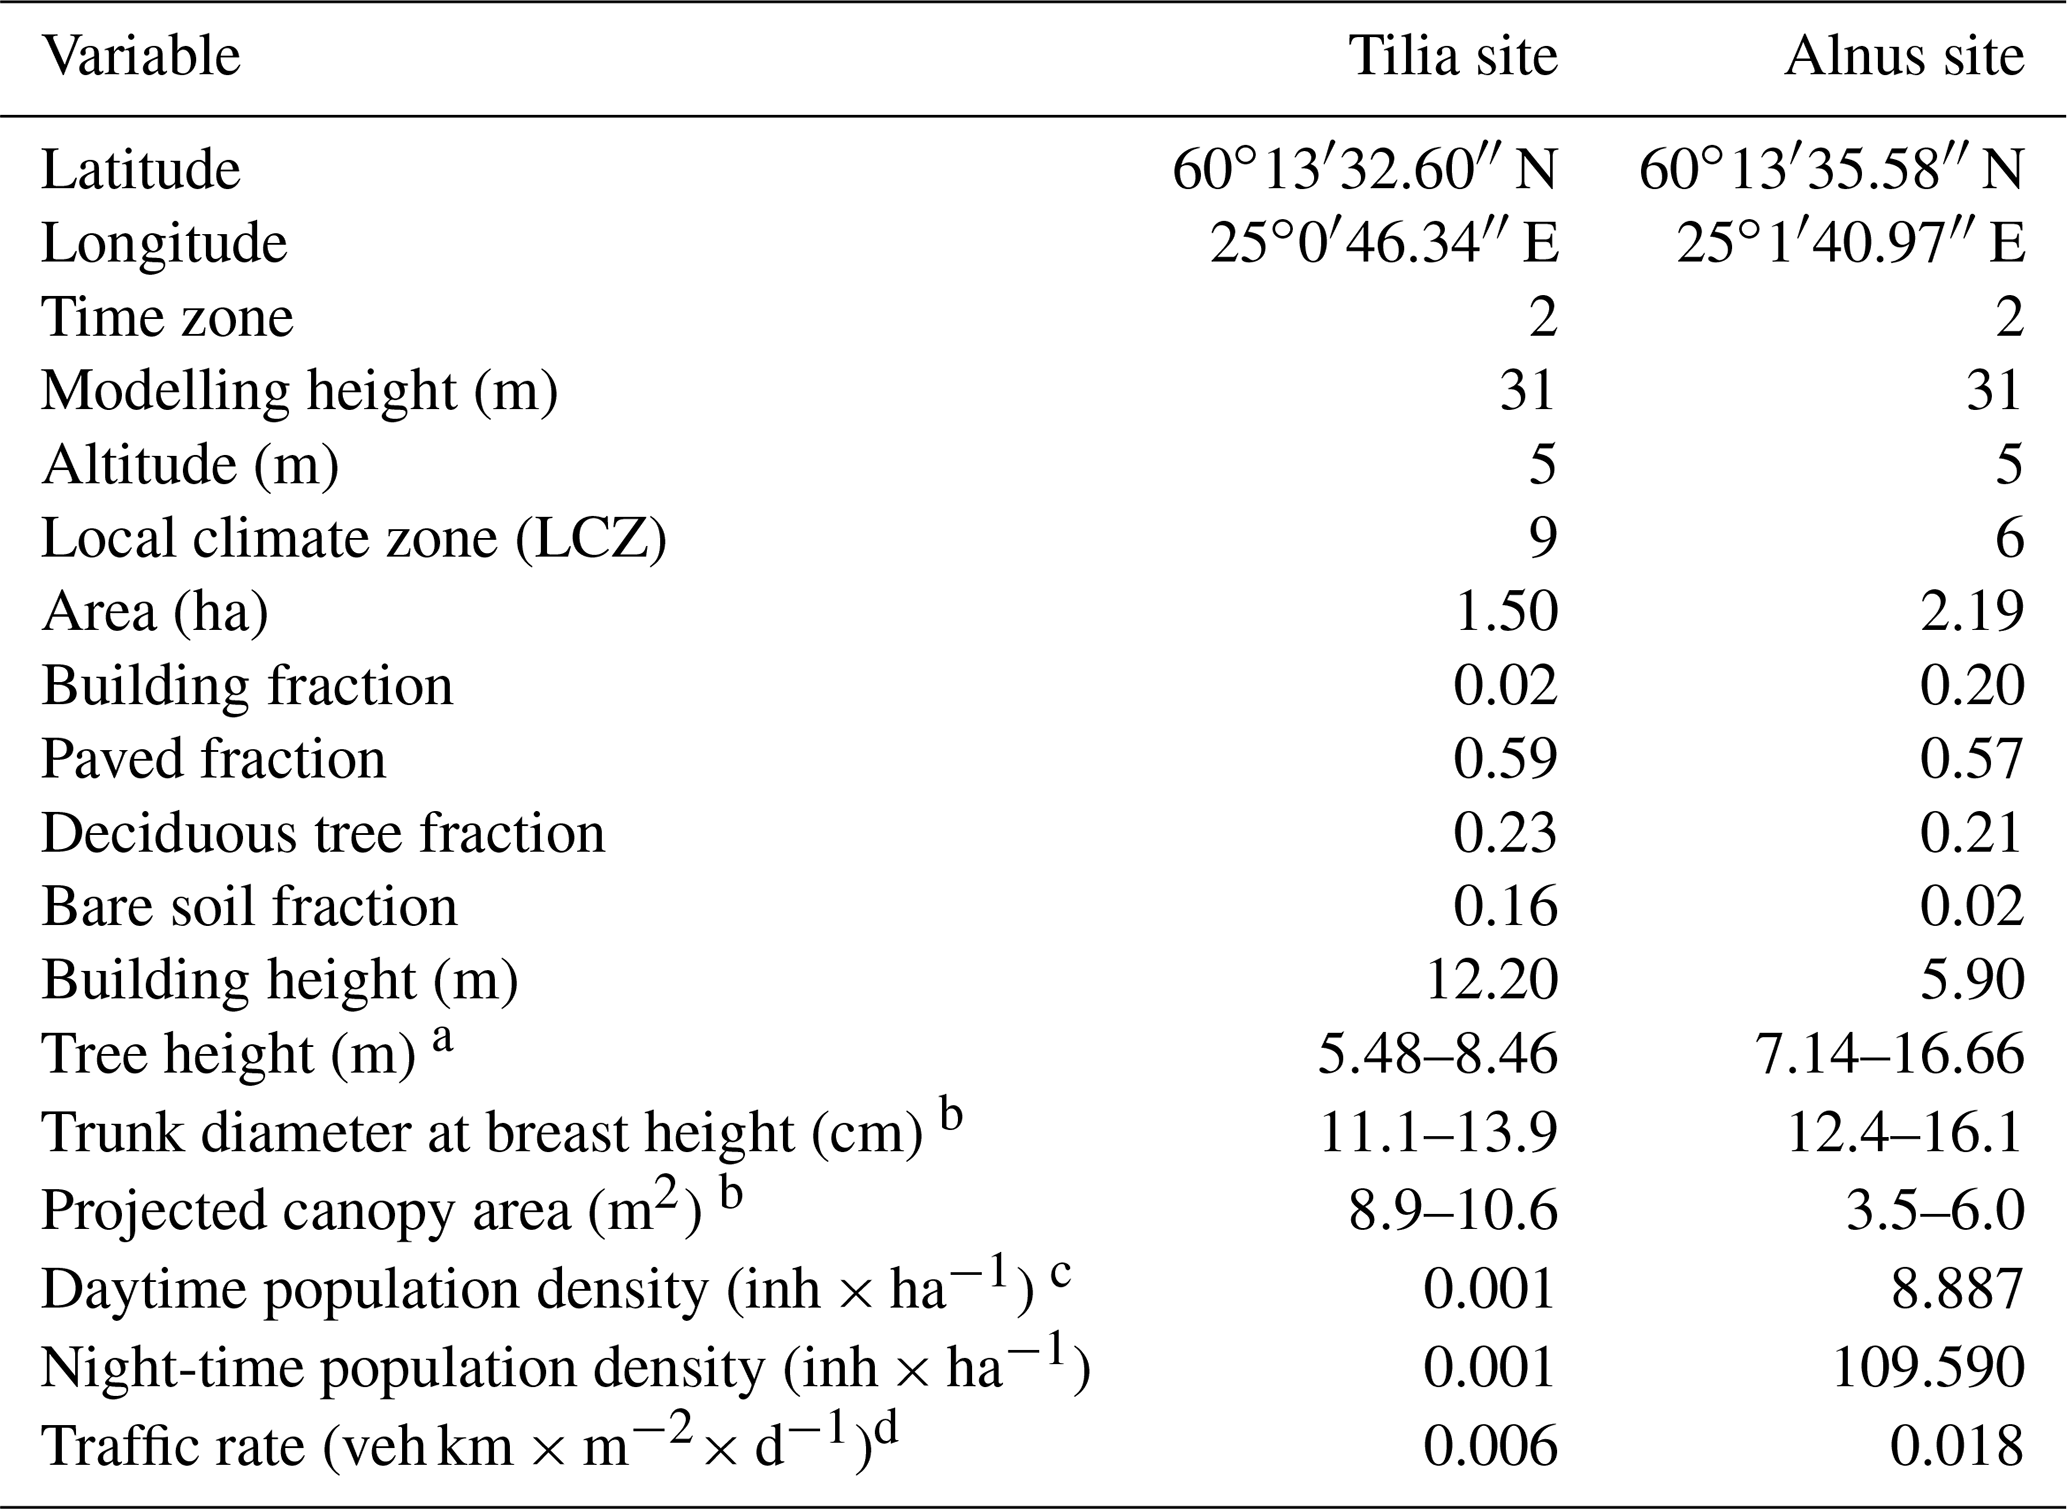
Both sites had three structural soils constructed as layers 1 m deep and 3 m wide. The soils were installed as planting pockets separated by compacted gravel at the Alnus site or as continuous strips at the Tilia site. The composition of soil 1 was mainly sand, clay, and peat; soil 2 was composted sewage sludge mixed with sand, pine bark, and peat; and soil 3 was a mix of fine gravel, sand, clay, leaf compost, and pine bark. Soils 1 and 2 were commercial soils, but soil 3 was a mixture made specifically for the research project. Riikonen et al. (2017) estimated the initial loss on ignition (LOI) for each soil type. Initial LOIs were 6 %, 20 %, and 4.4 % for soils 1, 2, and 3, respectively. The initial LOI, fine soil dry bulk density, and stone matrix were measured in a laboratory (Riikonen et al., 2011) and used to evaluate the soil SOC pools. On average, 32 % of the 1 m deep soil layer was fine soil, and the averaged saturated soil water capacity of the fine soil was 45 %. The measured fine soil permanent wilting point (WP) was 6 %.
2.2 Ecophysiological measurements
A portable gas exchange sensor (CIRAS-2, PP Systems, UK) was used to determine leaf-level responses of transpiration and CO2 exchange to environmental drivers (light, CO2). A total of 22–25 leaf samples located at various positions in the crown in six to seven trees of each studied species were measured during five field campaigns in 2007–2009 (Riikonen et al., 2011). The campaign measurements were normally carried out between 08:00 and 16:00. The measured light and CO2 responses of leaf-level CO2 exchange were scaled to the stand level using the forest stand gas exchange model SPP (Mäkelä et al., 2006) and meteorological measurements from Kumpula (see Sect. 2.3). The optimal stomatal control model (Hari et al., 1986) was used as the photosynthesis model in SPP. Stand-level photosynthetic responses were used to derive stomatal conductance parameters representative of Tilia and Alnus street trees in the SUEWS model (see Sect. 2.4.3).
To form an estimate of whole-tree transpiration, the sap flow sfm (L m−2 h−1 or mm h−1) was measured with a Granier-type heat dissipation sensor pair (Hölttä et al., 2015) from three Tilia and three Alnus trees (Riikonen et al., 2016). The measured sap flow was divided by the projected canopy area (PCA) and averaged over the trees. Measurements were available for the summers of 2008–2011, and only the months from June to August were used in this study to evaluate the SUEWS model. The time lag between the sap flow measurements, transpiration, and environmental conditions varied from 30 to 90 min (Riikonen et al., 2016). The best fit between transpiration and sap flow measurements for most cases was found with a 60 min lag time, which was chosen for the whole study period.
Soil volumetric water content (SWC), also used to evaluate SUEWS model performance, was measured at below-surface depths of 10 and 30 cm with Theta probes (ML2x, Delta T Devices Ltd, Cambridge, UK). SWC was averaged over various trees, soil types, and depths separately for the Tilia and Alnus sites.
The soil carbon stock measurements used to evaluate the Yasso model were available for 2002, 2005, 2008, 2011, and 2014 (Riikonen et al., 2017). Soil samples were collected in autumn from each soil type from depths varying between 30 to 90 cm.
2.3 Meteorological measurements
Meteorological variables used to force the models with hourly resolution for the years 2002–2016 were primarily obtained from the nearby (4 km) SMEAR III urban measurement station in Kumpula (Järvi et al., 2009). Air temperature (Tair; Pt-100, “in-house”), wind speed (; Thies Clima 2.1x, Gottingen, Germany), and incoming short-wave radiation (K↓; CNR1, Kipp & Zonen, Delft, the Netherlands) were measured from the top of a 31 m high measurement mast. Air pressure (DPA500, Vaisala Oyj, Vantaa, Finland), relative humidity (HMP243, Vaisala Oyj), and precipitation (rain gauge, Pluvio2, Ott Messtechnik GmbH, Germany) were measured on the roof of a nearby building at 24 m above the ground. Additional precipitation measurements began in 2014 (PWD-11, Vaisala Oyj), and these were primarily used when available due to their higher quality than the Ott measurements.
To create continuous meteorological forcing files for the modelled years, missing data from Kumpula were gap filled with observations from a station at Helsinki-Vantaa Airport hosted by the Finnish Meteorological Institute and located 10 km northwest from Viikki. More detailed information on the gap-filling procedure is given in Appendix A.
2.4 SUEWS
The Surface Urban Energy and Water Balance Scheme (SUEWS) was originally developed to simulate the urban surface energy and water balance at the local or neighbourhood scale (Järvi et al., 2011; Ward et al., 2016). The model includes several submodels for net all-wave radiation (Offerle et al., 2003), storage (Grimmond et al., 1991; Sun et al., 2017), and anthropogenic heat fluxes, snow, and irrigation (Järvi et al., 2014) to appropriately account for urban features in the balances (see Appendix B). Recently, the surface–atmosphere exchange of anthropogenic and biogenic CO2 has been included into the model, providing integrated information on the energy, water, and CO2 cycles in urban areas, including the impact of increased air temperatures on the water and CO2 cycles (Järvi et al., 2019). This study used the most recent SUEWS version available (V2020a). The model is forced with commonly measured meteorological variables such as wind speed, wind direction, air temperature, air pressure, precipitation, and short-wave radiation. Specific site information are also needed in the model simulations, e.g. surface cover fractions and tree and building heights.
2.4.1 Biogenic CO2 flux
Biogenic CO2 flux components include the carbon uptake by photosynthesis (FGPP) and carbon emissions by vegetation respiration (FR). Soil respiration can be included if integrated vegetation and soil parameters are used in the model runs. An empirical canopy-level photosynthesis model (Järvi et al., 2019) was used for the connection of transpiration to photosynthesis via stomatal conductance and its dependency on local environmental conditions. FGPP (µmol m−2 s−1) for deciduous trees is calculated from
where the potential photosynthesis (FGPP,max,decid) is scaled with the leaf area index (LAIdecid, m2 m−2), surface cover fraction (frdecid), and the environmental response functions g(Tair), g(Δq), g(Δθ), and g(K↓) (for air temperature, specific humidity deficit, soil moisture deficit, and short-wave radiation, respectively). These functions have the following forms (Ward et al., 2016):
where
and
Parameters G2–G6 describe the responses of photosynthesis and stomatal conductance to each environmental variable. (W m−2) is the maximum observed short-wave radiation, TL and TH (∘C) are the lower and upper limits of the temperature that determines when photosynthesis and transpiration switch off, and ΔθWP (mm) is the wilting point deficit. Variables Δq (g kg−1), K↓ (W m−2), and Tair (∘C) are passed to the model as inputs that depend on the modelling height, typically well above the urban surface, but SUEWS has an option to model local values of Δq and Tair at a height of 2 m (Sun and Grimmond, 2019; Tang et al., 2021), which allows the impact of local climate conditions on the spatial variability of FGPP. Δθ (mm) is to be simulated within SUEWS (Järvi et al., 2017).
In SUEWS, FR increases exponentially with the measured input or modelled local air temperature. Air temperature is used instead of soil temperature due to its common availability. FR (µmol m−2 s−1) is simulated with the empirical constants a and b according to
The lower limit of FR (0.6 µmol m−2 s−1) takes into account wintertime carbon emissions that cannot be achieved with the simple exponential model (Järvi et al., 2019). In this study, FR included only above-ground respiration, as soil respiration was determined with Yasso (see Sect. 2.5). To correctly simulate the carbon sequestration and respiration of street trees, the empirical parameters in Eqs. (1) and (7) were derived from urban leaf-level photosynthetic observations for deciduous street trees in Helsinki (Riikonen et al., 2011) (see Sect. 2.4.3).
2.4.2 Evapotranspiration
The latent heat flux (QE, W m−2), including both evaporation and transpiration, is calculated with the modified Penman–Monteith equation for urban areas (Grimmond and Oke, 1991):
where Q* (W m−2) is the net all-wave radiation, QF (W m−2) is the anthropogenic heat flux, ΔQS (W m−2) the net storage heat flux, ρ (kg m−3) the air density, cp (J kg−1 K−1) the specific heat capacity of air at constant pressure, VPD (Pa) the vapour pressure deficit, s (Pa ∘C−1) the slope of the saturation vapour pressure curve, γ (Pa ∘C−1) the psychrometric constant, rav (s m−1) the aerodynamic resistance for water vapour, and rs (s m−1) the surface resistance. The surface resistance, or its inverse, the surface conductance gs (m s−1), depends on the same environmental factors as photosynthesis (Ward et al., 2016):
where the maximum conductance gmax,decid is scaled with the maximum leaf area index (LAImax,decid), frdecid, and the environmental response functions. G1 (mm s−1) is a constant obtained from latent heat (QE) and sensible heat (QH, W m−2) observations that connects stomatal conductance to canopy conductance.
2.4.3 Fitting environmental response functions
To obtain the correct response from street trees to environmental factors in SUEWS, the environmental response functions (g(Tair), g(Δq), g(Δθ), and g(K↓)) in Eqs. (1) and (9) were separately fitted for Tilia and Alnus trees using a non-linear least-squares method. In a previous study at the Tilia site, similar fits were performed, but only to FGPP,max and g(Δq), with the other function forms assumed to be the same as those from a park located in England (Järvi et al., 2019). To obtain more precise parameters to describe street tree behaviour, all the response functions were fitted against observations to get the parameters G2−G6 and FGPP,max.
Previously calculated stand-level photosynthesis estimates for 2016 were used in the fitting as a dependent variable, while observed Tair, Δq, and K↓ from Kumpula and SWC from the study sites were used as independent variables. Fitting was performed for W m−2 and Δq>1 g kg−1, as otherwise the stomatal conductance may deviate from the fits seen in Fig. 2 (Bosveld and Bouten, 2001). This resulted in a total of 2492 data points. In the fitting process, a bootstrapping method was carried out by 100 times randomly selecting seven-eighths of the available observations with the final parameters calculated as medians with uncertainty from the fittings. Table 2 gives the fitted parameter values needed in Eqs. (2)–(6). When calculating g(Δθ), the WP is needed to calculate the limit ΔθWP. A site-specific estimate for ΔθWP was calculated with soil information from Riikonen et al. (2011).
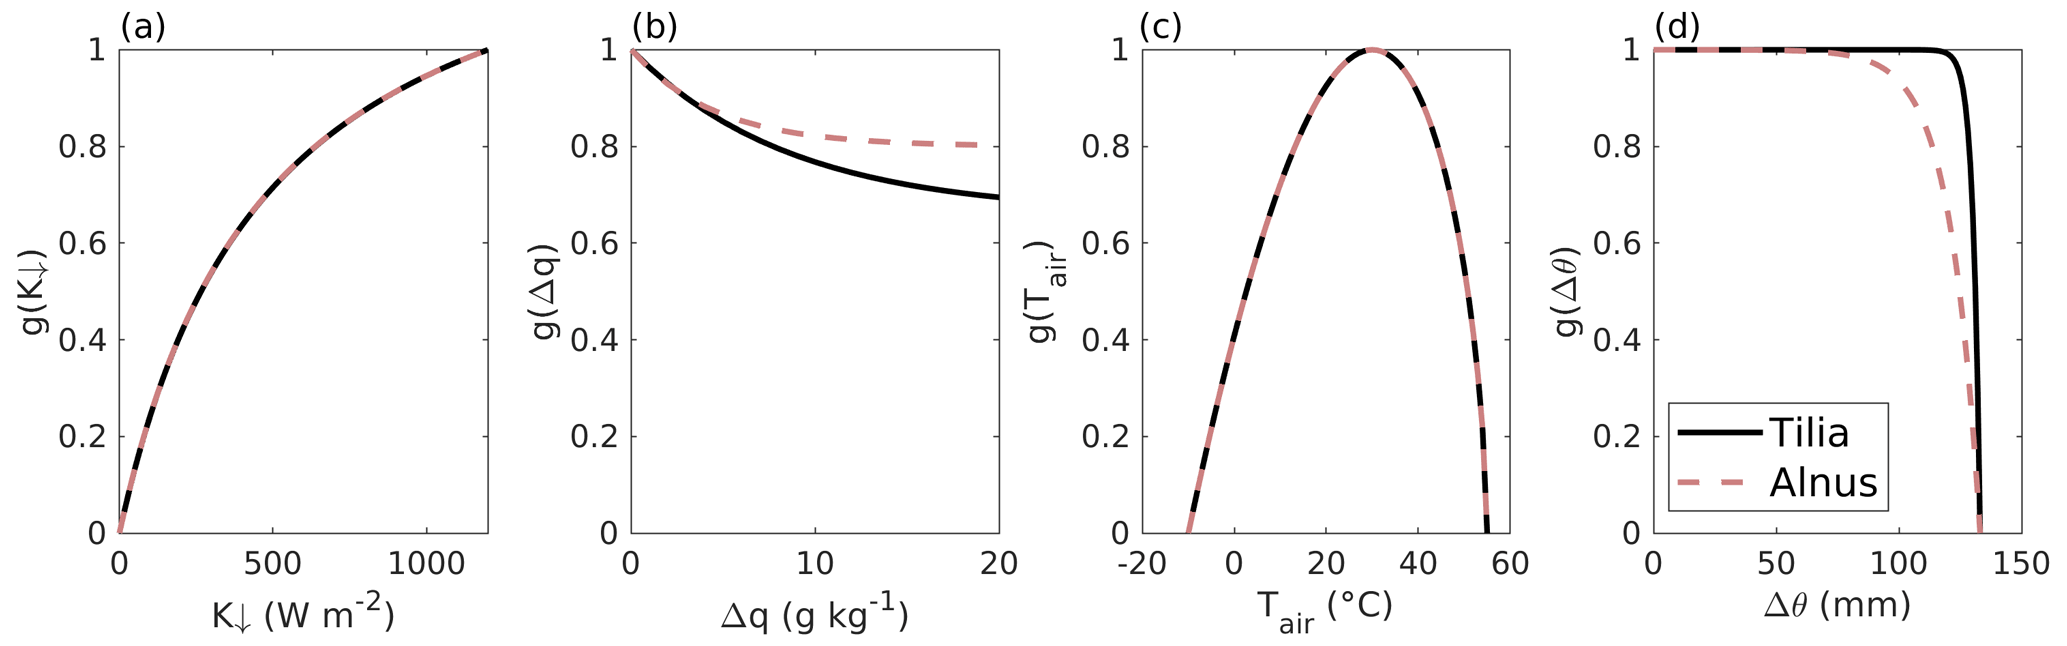
Figure 2The fitted dependencies of the surface conductance on environmental factors for the (a) incoming short-wave radiation K↓, (b) specific humidity deficit Δq, (c) air temperature Tair, and (d) soil moisture deficit Δθ in SUEWS separately for Tilia (solid black line) and Alnus (dashed red line) trees.
Table 2SUEWS parameters used to simulate photosynthesis, respiration, and transpiration of the studied street trees.
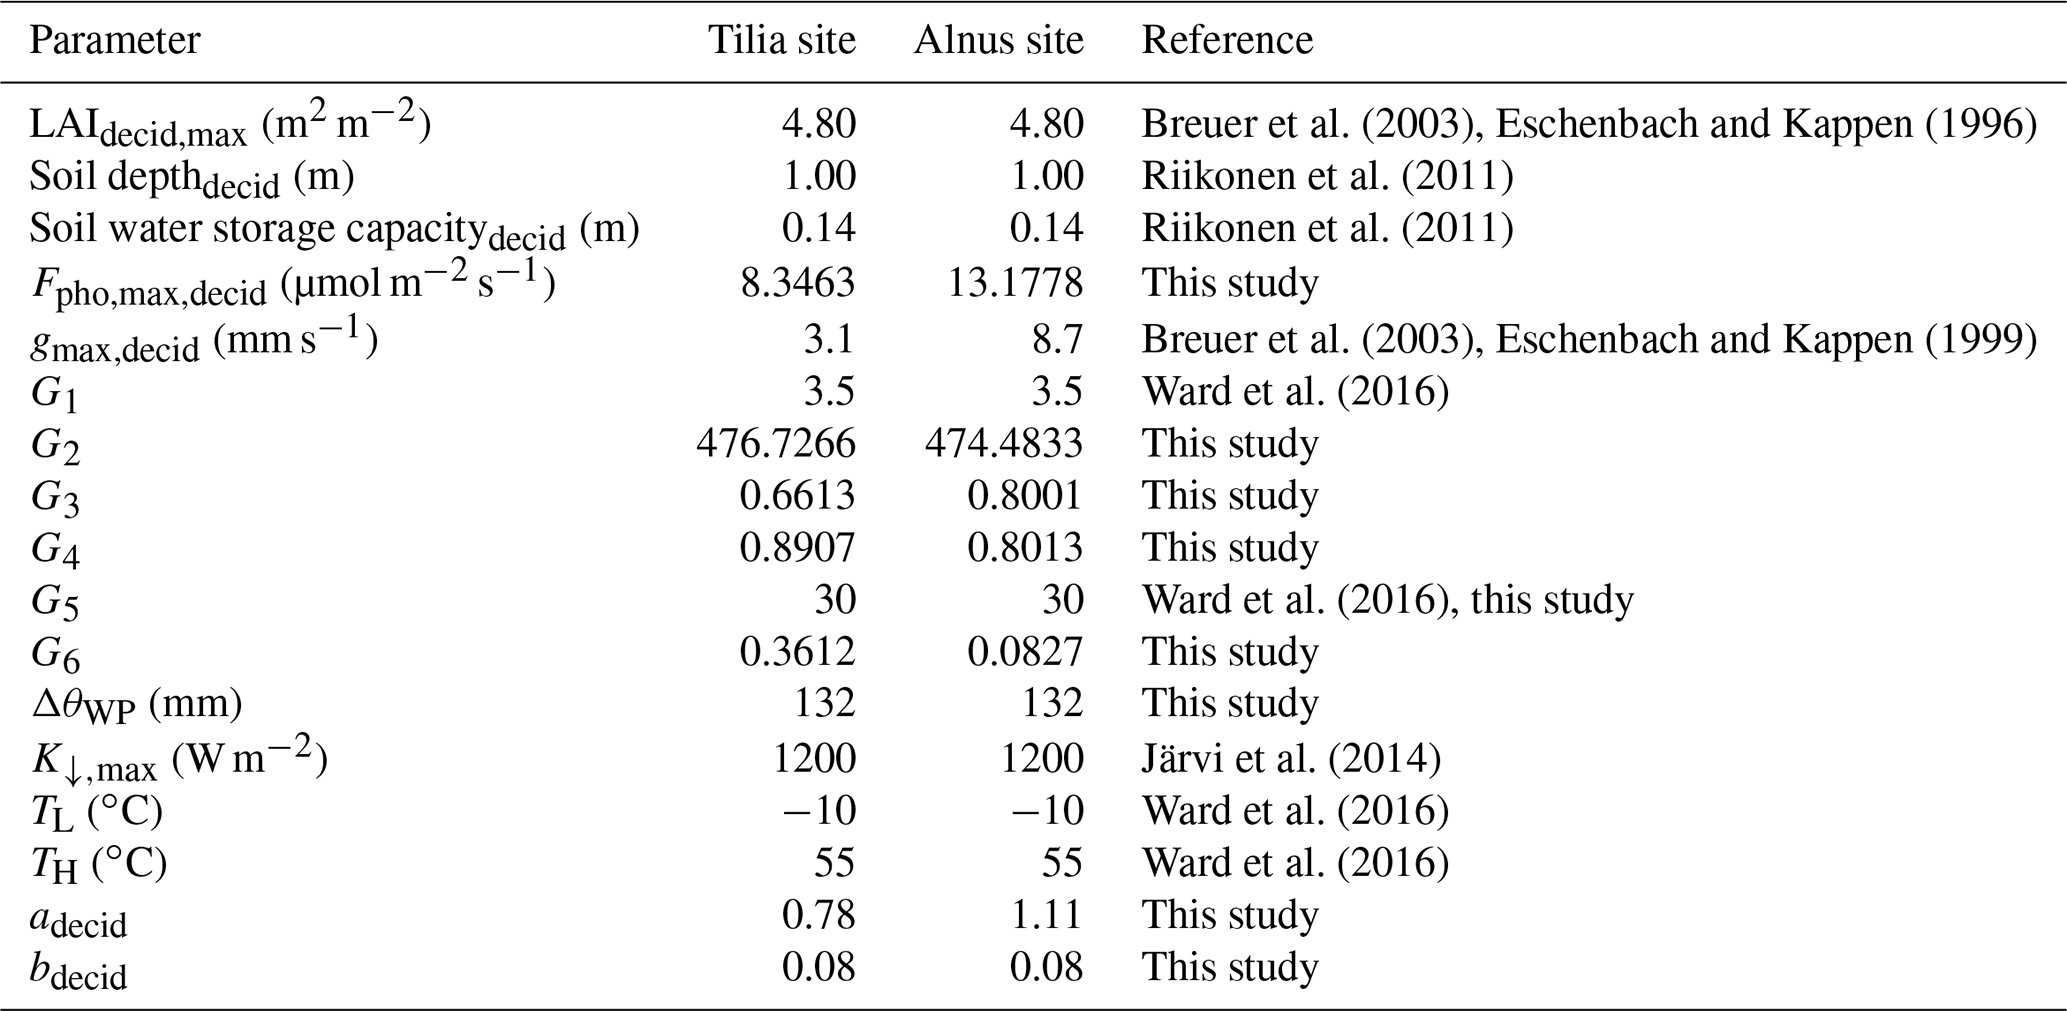
Figure 2 shows the environmental response functions and their dependencies on the corresponding variable. The parameter values are W m−2, , , ∘C, mm−1, and µmol m−2 s−1 for the Tilia site. Similarly, for the Alnus site W m−2, , , ∘C, mm−1, and µmol m−2 s−1.
The respiration parameters a and b in Eq. (7) were obtained by fitting canopy-level respiration estimates from the street trees for the year 2016 against air temperature measurements from Kumpula. The estimations represent respiration from leaves and branches. To estimate whole-tree respiration, one-third of the canopy respiration was added to the values before the fittings to represent respiration from the trunk. Using the bootstrapping method described above, the parameter values and are obtained for the Tilia site and and for the Alnus site.
2.4.4 SUEWS run
SUEWS was run around the street tree sites within modelling areas of 1.5 ha at the Tilia site and 2.19 ha at the Alnus site (Fig. 1). The first modelled year, 2002, was used as a spin-up year, leaving 2003–2016 for the carbon balance analysis. The years 2008–2011 were used to evaluate the model against the street tree observations. The hourly meteorological forcing data were used to force the model; however, the model calculations had a time step of 5 min. The surface cover fractions and building heights (Table 1) for both sites were obtained from airborne laser scanning data with a resolution of 1 m (StromJan, 2020). The modelling areas had buildings, paved surfaces, bare soil, grass, and deciduous trees. As SUEWS provides integrated evapotranspiration, photosynthesis, and respiration for the whole simulation domain, grass surfaces present in the areas were set as impervious surfaces. This had a minor impact on the modelled local air temperature (averaging 0.16 ∘C warmer in summer) and humidity, and furthermore on tree functioning, but this was considered a more suitable approach when model outputs were compared with tree observations.
The trees at both sites were planted in 2002, and as SUEWS does not currently include tree growth, information on tree development during the modelled period was obtained from the local measurements. Tree height and maximum LAI were given to the SUEWS as model input for each year, whereas the seasonal development of LAI was based on growing degree days within the model. Tree heights were measured from 2002 until 2011 (Riikonen et al., 2016) and, as tree growth follows an exponential curve, the same exponential growth was assumed for the other years. The maximum LAI for both Tilia and Alnus trees was set to 4.8 m2 m−2, as obtained for Tilia cordata in Breuer et al. (2003) and Alnus glutinosa in Eschenbach and Kappen (1996), respectively. The observations were not used for the maximum LAI, as they were values for individual trees and not for the neighbourhood (stand) level, as expected by SUEWS.
The vegetation type-specific maximum stomatal conductance values (gmax,decid) needed for the model input are significantly different for the two tree species. Alnus glutinosa has larger water use than Tilia × vulgaris. Similarly to the maximum LAI values, gmax,decid=8.7 mm s−1 was chosen for the Alnus site based on a study made in Germany (Eschenbach and Kappen, 1999), and gmax,decid=3.1 mm s−1 was chosen for the Tilia site based on Breuer et al. (2003).
The modelled soil depth under the street trees was 1 m, and a soil water storage capacity of 0.141 m was calculated from laboratory measurements. The water quantity in the top 1 m of soil was not sufficient to maintain the high transpiration rates of Alnus trees. This may be due to many reasons; for example, street trees may not receive enough drainage from paved areas in the model, or tree roots may reach deeper than 1 m, from where they may receive more water if they reach groundwater, which SUEWS cannot take into account yet. To estimate tree transpiration correctly at the Alnus site, a modified simulation was run with additional water input (0.06 mm h−1) to represent the groundwater intake. The limit was chosen by sensitivity testing such that the soil does not dry and limit the modelled transpiration. The model run without water input is hereafter called the “base run” and the modified run the “final run” (see Sect. 3.1.2).
2.5 Yasso
Yasso15 (Viskari et al., 2020) is the most recent version of the soil carbon decomposition model Yasso (Tuomi et al., 2009; Liski et al., 2005), where the decomposition rate depends on the climatic conditions and the chemical composition of soil organic matter. The model can be run on an annual or monthly basis. Annual precipitation, air temperature, and air temperature amplitude or monthly precipitation and monthly average air temperatures are needed as model drivers. The model simulates the change in carbon stock based on the balance between the decomposition of soil organic matter and possible litter input. The decomposition rate varies for the four carbon compound groups included in the model: compounds soluble in ethanol (E) or in water (W), compounds hydrolysable in acid (A), and compounds that are neither soluble nor hydrolysable at all (N). There is also a mass flow towards recalcitrant humus (H). Litter input can be added to the model, such as leaf or fine root litter and woody litter such as branches, stems, and coarse roots. The AWENH ratios are defined for the initial soil carbon pool and for the litter input separately. The parameters for the decomposition rates of various compounds are based on global litter decomposition measurements.
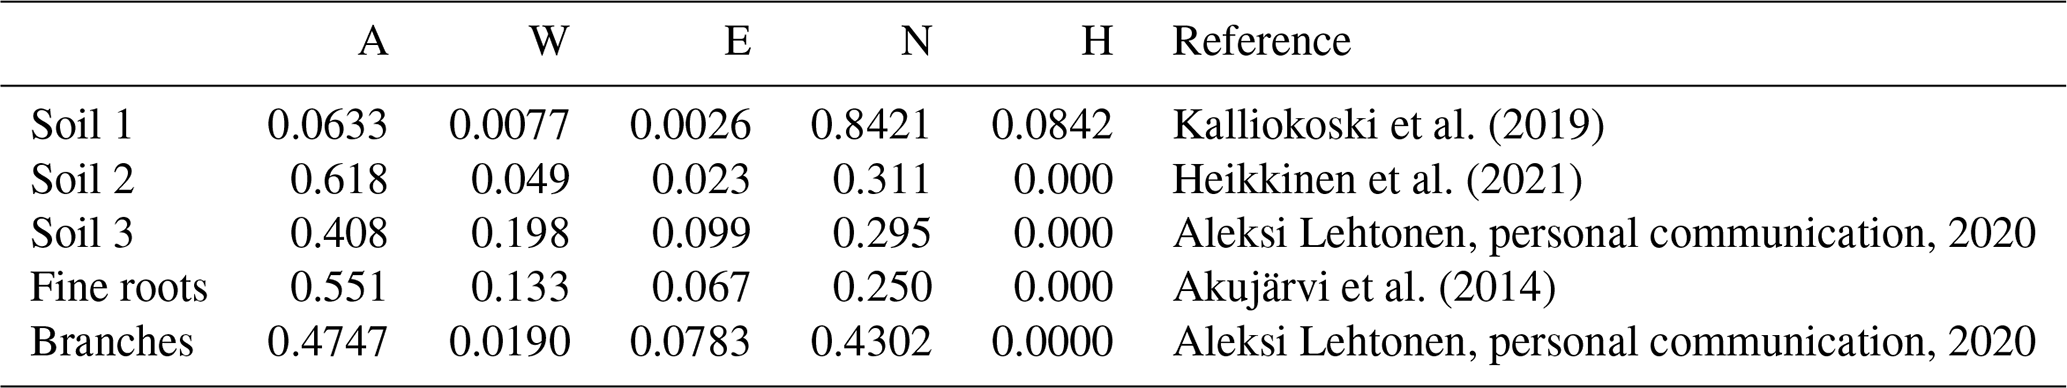
In this study, a monthly time step was used to simulate the SOC at the study sites. The model was forced with 2 m local air temperature estimations simulated by SUEWS (Sun and Grimmond, 2019; Tang et al., 2021) and precipitation measurements from Kumpula, using the monthly precipitation and mean temperature for each month. As the streets were built in 2002 and the initial soil carbon amount and composition were known, the initial carbon pool was entered into the model. The decomposition rates for each chemical compound were estimated based on soil composition (Table 3). The organic matter in soil 1 was peat, and AWENH fractions for peat were therefore chosen (Kalliokoski et al., 2019). The decomposition matter in soil 2 was a mixture of peat, sewage sludge, and pine bark, but the shares of the components were not known. For soil 2, we used AWENH values determined for a mixture of composted sludge (70 %) and peat litter (30 %) (Heikkinen et al., 2021). Finally, soil 3 had leaf compost as the sole decomposition matter, so the AWENH of birch leaves (Aleksi Lehtonen, personal communication, 2020) were used. Air temperature goes below freezing during the studied period, but snow cover typically prevents the soil from freezing. Even if some ice were to form in the soil, a notable soil water share would still be in the liquid phase, and the soil temperature would remain close to zero. Also, Yasso does not incorporate a mechanism to account for completely frozen soil. Thus, the decomposition rate in the model runs also follows the changes in air temperature in frozen conditions.
Kalliokoski et al. (2019)Heikkinen et al. (2021)Akujärvi et al. (2014)Table 3AWENH fractions used in the Yasso model runs for the soil types and for fine roots.
Above-ground litter was assumed to contribute only slightly to the urban SOC stock because it was mostly removed from the sites. Therefore, the effect of leaves was ignored in the local SOC estimations, whereas their impact on the total carbon sequestration of street trees was estimated also with above-ground litter, i.e. leaves and pruned branches. The pruned branches were estimated to average 0.5 cm in diameter, with their AWENH fractions equalling those of woody matter (Table 3), and the annual number of pruned branches and their carbon levels were based on a previous estimate (0.18 kg C per tree, Riikonen et al., 2017). The AWENH shares in the leaves were estimated to be those of birch leaves (Table 3). The leaf biomass for the study trees was estimated in 2005, 2008, and 2011 (Riikonen et al., 2017). The missing years in between were linearly interpolated. The growth rates before the first and after the last observations were extrapolated using the growth rates estimated between the first two and last two measurements, respectively. However, the litter input of fine roots needs to be taken into account in the local SOC estimations, as those roots naturally remain in the soil. The annual root litter input was estimated assuming that the fine root biomass equals that of leaves and the lifetime of fine roots was 1 year. The roots were assumed to be evenly spread in the soil volume, which were approximately 20 and 48 m3 for Alnus and Tilia, respectively. The annual estimates were assumed to evenly distribute over the months. The AWENH shares in the root litter were estimated to be as in Akujärvi et al. (2014) (Table 3), and the carbon content in the fine root litter was estimated to be 50 %. The model run without roots is hereafter called the “base run”, and the model run with roots is the “final run” (see Sect. 3.2).
2.6 Model evaluation and statistics
The modelled soil moisture from SUEWS was evaluated against observations to examine the simulation of water balance in the model. Additionally, the performance levels of the surface conductance and photosynthesis models were evaluated against transpiration estimations from sap flow and leaf gas exchange measurements. The evaluation years were 2008–2011, when most of the measurements were available. Only months from June to August were included in the evaluation. However, measurements in 2008 were only available for July and August.
To compare the modelled and observed soil moisture, the modelled soil moisture deficits (Δθ) were changed to SWCs. The observed SWC is an average measured from depths of 10 and 30 cm, whereas the modelled SWC represents the average from the whole modelling area excluding the soil beneath buildings. The modelled soil depth depends on the surface type, varying between 23 cm for paved areas and 1 m for the street trees. Thus, for the comparisons, both the observed and modelled SWC have been normalized between 0 (dry soils) and 1 (wet soils) for each year.
In SUEWS, the evapotranspiration for the whole simulation area is estimated from the modified Penman–Monteith model (Eq. 8). However, the sap flow measurements, against which SUEWS was evaluated, provide an estimation for street tree transpiration only. To overcome the different representativenesses of the model and observations, comparisons between the two were only made for hours with no rain and over 2 h after each rain event. The model output was scaled with the street tree surface fraction to obtain the transpiration per tree area. Similarly, the observed sap flow was scaled with the projected canopy area (PCA) to estimate the tree transpiration per tree area. The lag time between the sap flow measurements and the modelled transpiration was taken into account (see Sect. 2.2).
Simulated CO2 uptake by photosynthesis and emissions by respiration were evaluated against leaf-level measurements that were scaled to the canopy level for the year 2016. These measurements were used for the stomatal conductance model parameter fittings in SUEWS and thus are not an independent data set. However, the comparison was made to show that SUEWS does indeed reproduce similar responses to environmental conditions to the estimations from leaf-level measurements.
Yasso model simulations were compared with carbon pool estimates derived from LOI-based soil carbon contents. The proportion of carbon in the LOI was assumed to be 0.56 (Hoogsteen et al., 2015). However, the first measurement point in 2002 was not used in the model evaluation, as it was given to the model.
SUEWS can consider increases in tree height and increases of the canopy horizontally through surface cover fractions, but it cannot currently account for canopy densification. However, this must be considered when calculating the long-term carbon sequestration of street tree plantings. When calculating the carbon sequestration of the street tree plantings for 2003–2016, the modelled tree gas exchanges were thus scaled with measured leaf area to obtain canopy densification. The canopy was allowed to grow (densify) between 2002 and 2008, after which its growth was assumed to cease due to regular pruning of the trees. The calculations for annual carbon sequestration and respiration were performed based on how much space was allocated to one street tree. Soil respiration was scaled to a 25 m2 area typical for street trees, and the trees were scaled to 9.5 and 4.7 m2 for the Tilia and Alnus sites, respectively, based on canopy area estimations from Riikonen et al. (2016). The soil respiration estimation was an average of the three soil types.
A simplified estimation of carbon sequestration potential throughout the expected street tree lifespan was made using both models. The estimation was made for 30 years (2002–2031) after street tree planting, as the expected lifespan of a street tree is approximately 20–30 years (Roman and Scatena, 2011). For SUEWS, both annual photosynthesis and plant respiration were averaged from pruning years (2008–2016) and it was assumed that the calculated average rates of photosynthesis and plant respiration will continue for 2017–2031. For Yasso runs, the mean monthly air temperature and precipitation were used for the same years with stable root litter input. In addition to these runs, the change in soil carbon pool was simulated in a scenario where above-ground litter (i.e. leaves and pruned branches) was kept at the site. The latter reveals the actual sequestration potential, as the litter produced by these trees causes emissions outside the sites.
Common statistical metrics were used to evaluate model performance, including root-mean-square error (RMSE), normalized RMSE (nRMSE), mean bias error (MBE), and normalized MBE (nMBE). RMSE is calculated with the summed square of residuals:
where is the modelled and yi the measured value. The normalization of the RMSE is performed with the maximum and minimum values of the observations:
The MBE is defined as follows:
and, similarly to nRMSE, nMBE is calculated using the maximum and minimum values of the observations. The normalized metrics were mainly used in the analysis, as they allow comparison between various scales. nRMSE was used to evaluate the accuracy of the models, and nMBE indicated whether the models had systematic over- or underestimation.
3.1 SUEWS model performance
3.1.1 Soil moisture
Simulated soil moisture covaried with the observations at both sites, as shown in Fig. 3. Model performance was reasonably good; nRMSE varied between 0.13 and 0.22 at the Tilia site and between 0.16 and 0.23 at the Alnus site (Table 4). In general, the Tilia site was more moist than the Alnus site, as the observed groundwater level was continuously high and the catchment area large, whereas the Alnus site was mainly fed with local rainfall (Riikonen et al., 2011). For the summers from 2008 to 2011, SWC averaged 27 % and 13 % for the Tilia and Alnus sites, respectively. The model was not always able to capture the changes in SWC at the Tilia site, particularly in the early summers of 2009 and 2011 (Fig. 3b, d). At the Alnus site, SUEWS was able to simulate SWC reasonably well (Fig. 3e–h). However, on a few occasions, the base run showed soil moisture exhaustion under the street trees, which can be seen when the normalized modelled SWC approaches zero.
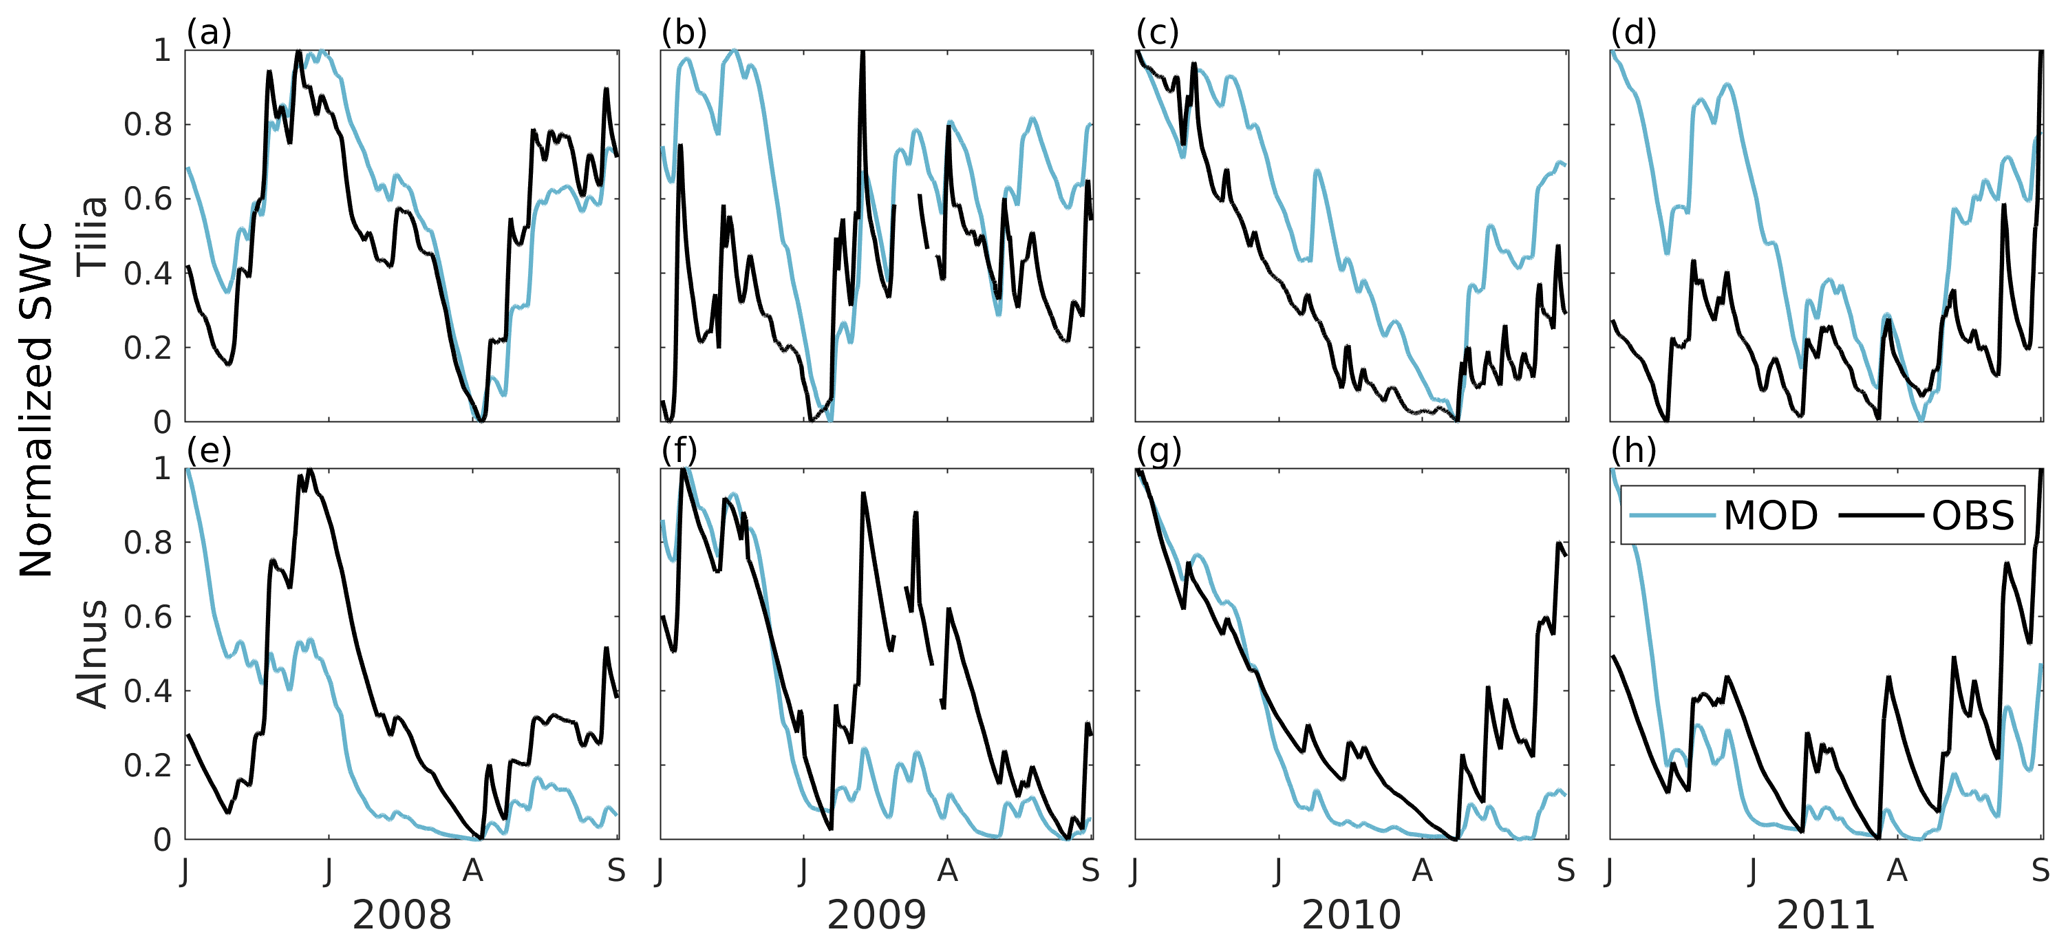
Figure 3Modelled (MOD, blue) and observed (OBS, black) 1 d running mean of normalized soil water content (SWC) from June to August in 2008–2011. The normalization uses minimum and maximum values of modelled and observed SWC, respectively. The normalization is performed separately for each year.
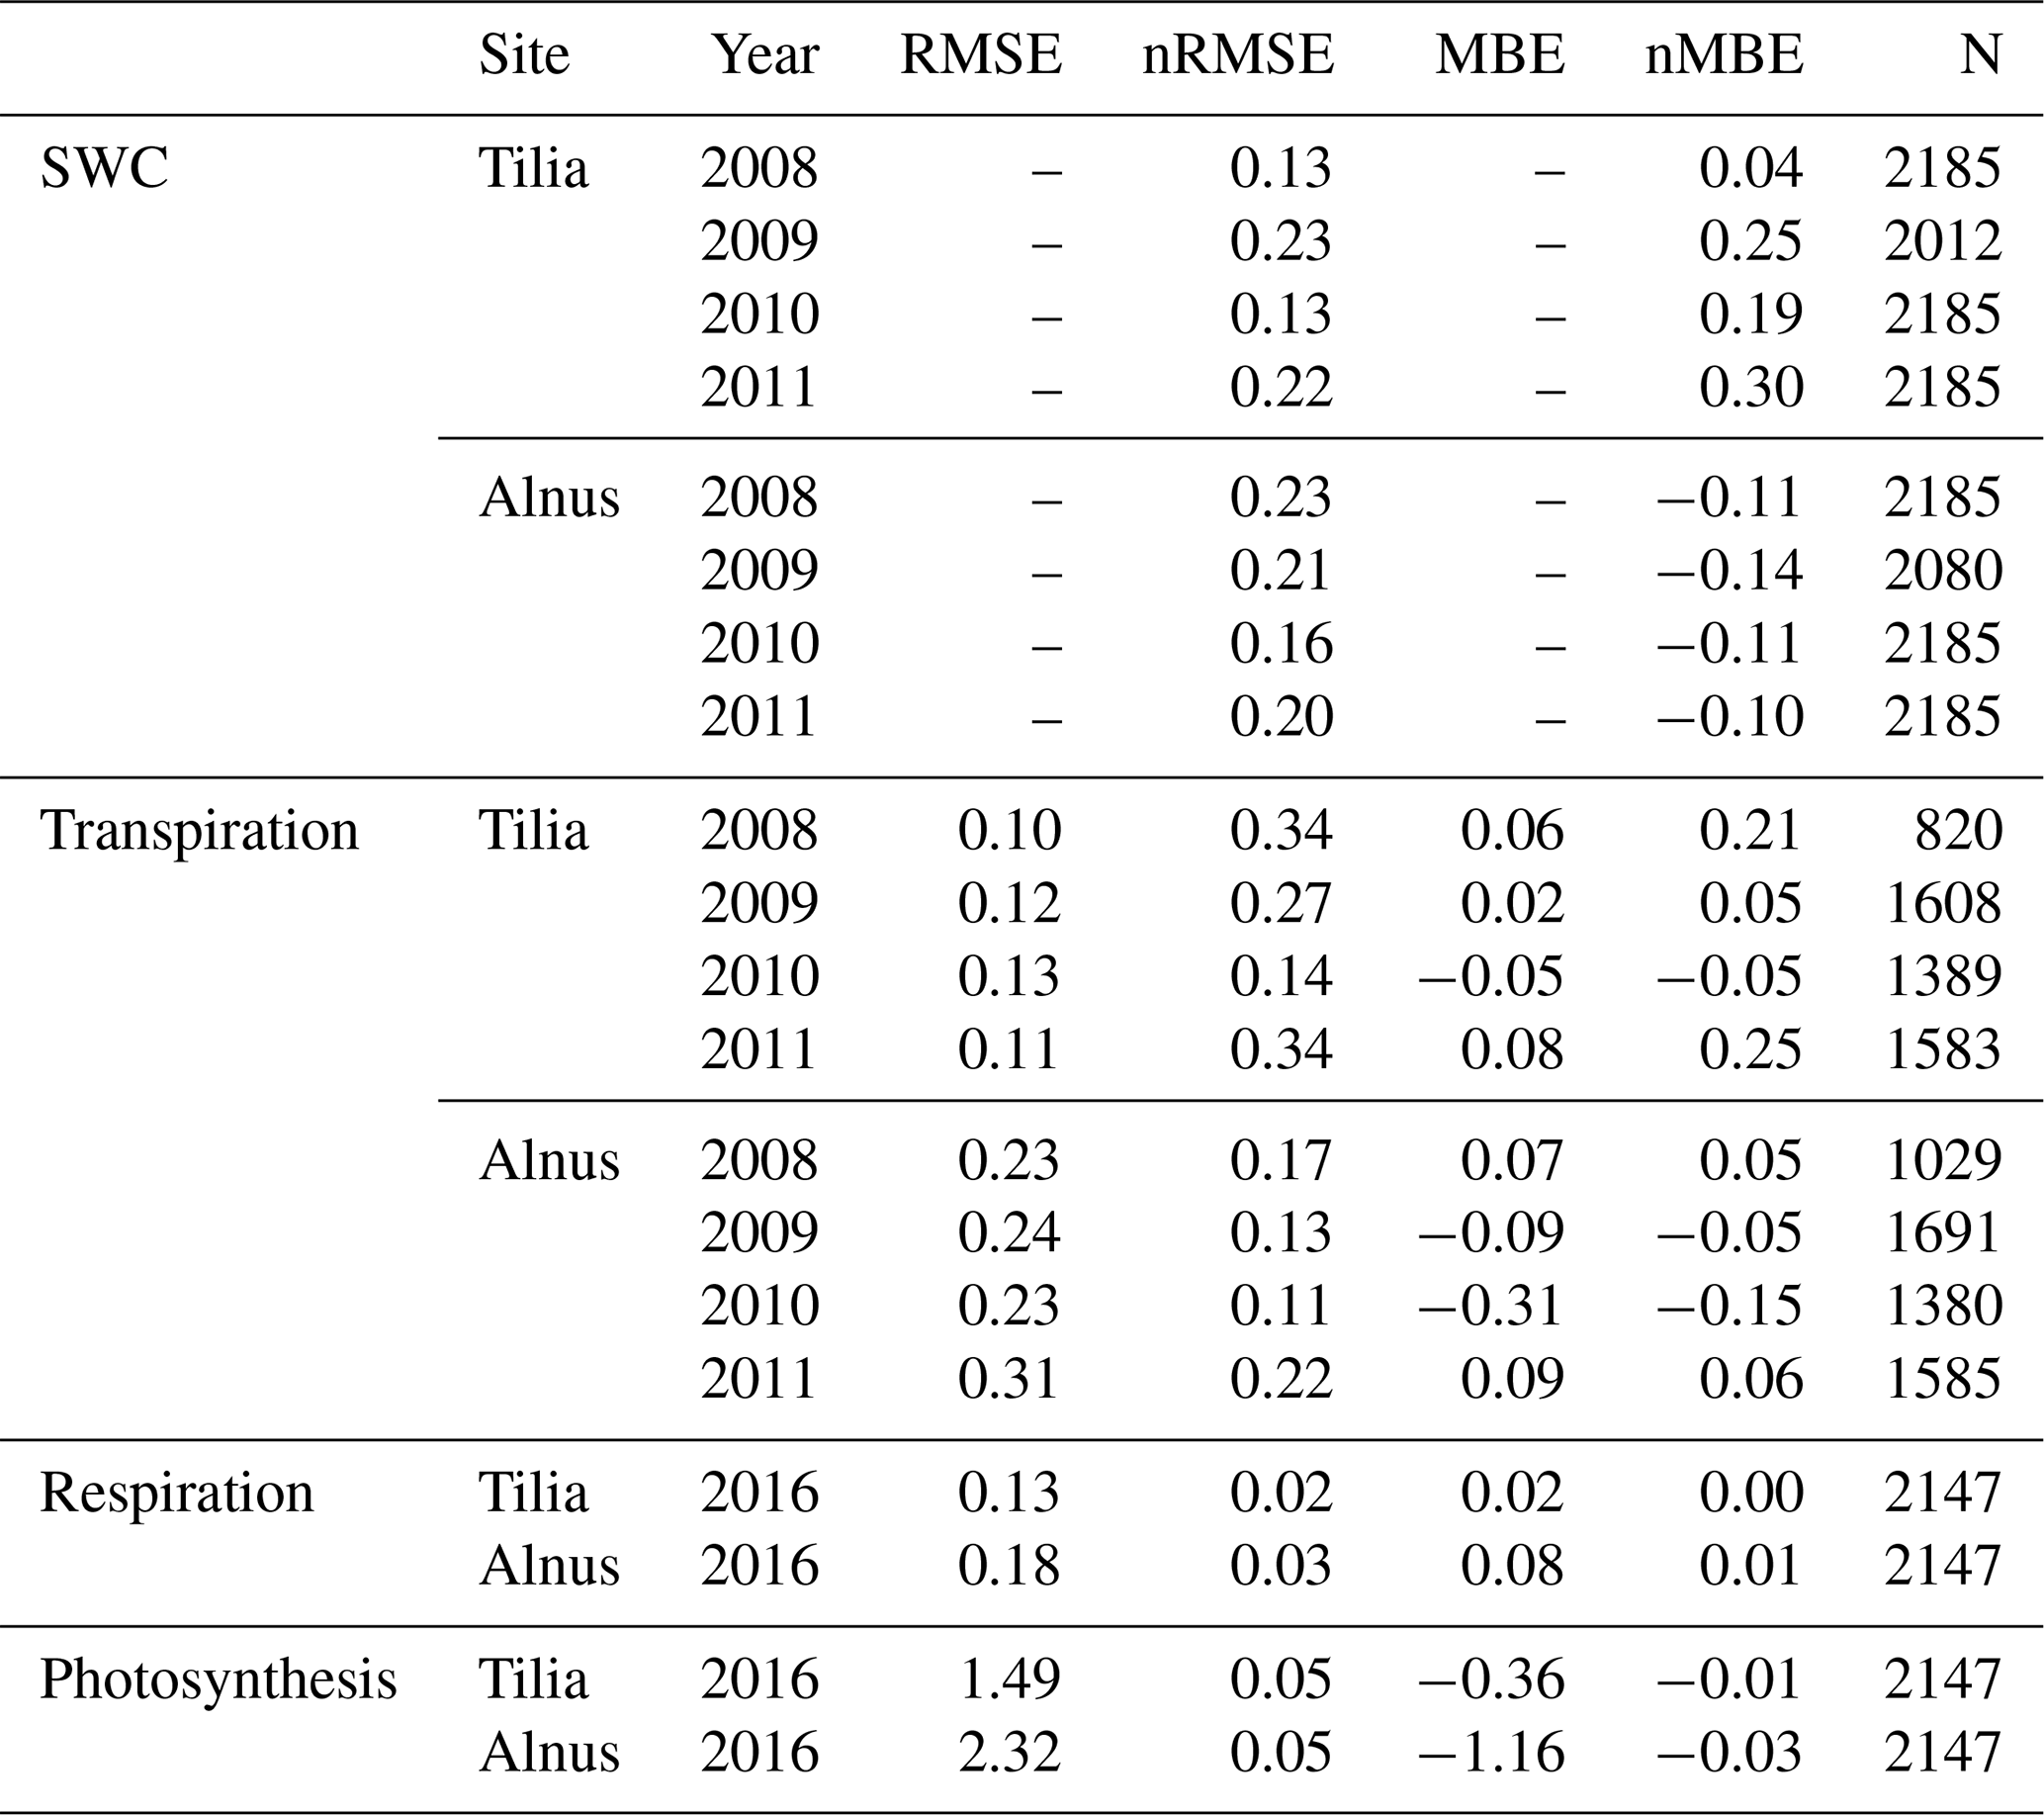
Table 4SUEWS model performance statistics for soil water content (SWC), transpiration, and the CO2 exchange components at the Tilia and Alnus sites.
3.1.2 Transpiration
SUEWS was able to simulate the observed diurnal dynamics of tree transpiration at the Tilia site (Fig. 4a). Concurrently, SUEWS greatly underestimated transpiration at the Alnus site when transpiration was compared with sap flow in the base run (Fig. 4b). Model performance improved at the diurnal scale in the final run, when an additional external water input of 0.06 mm h−1 was included in the soil to represent the groundwater input to the tree roots.
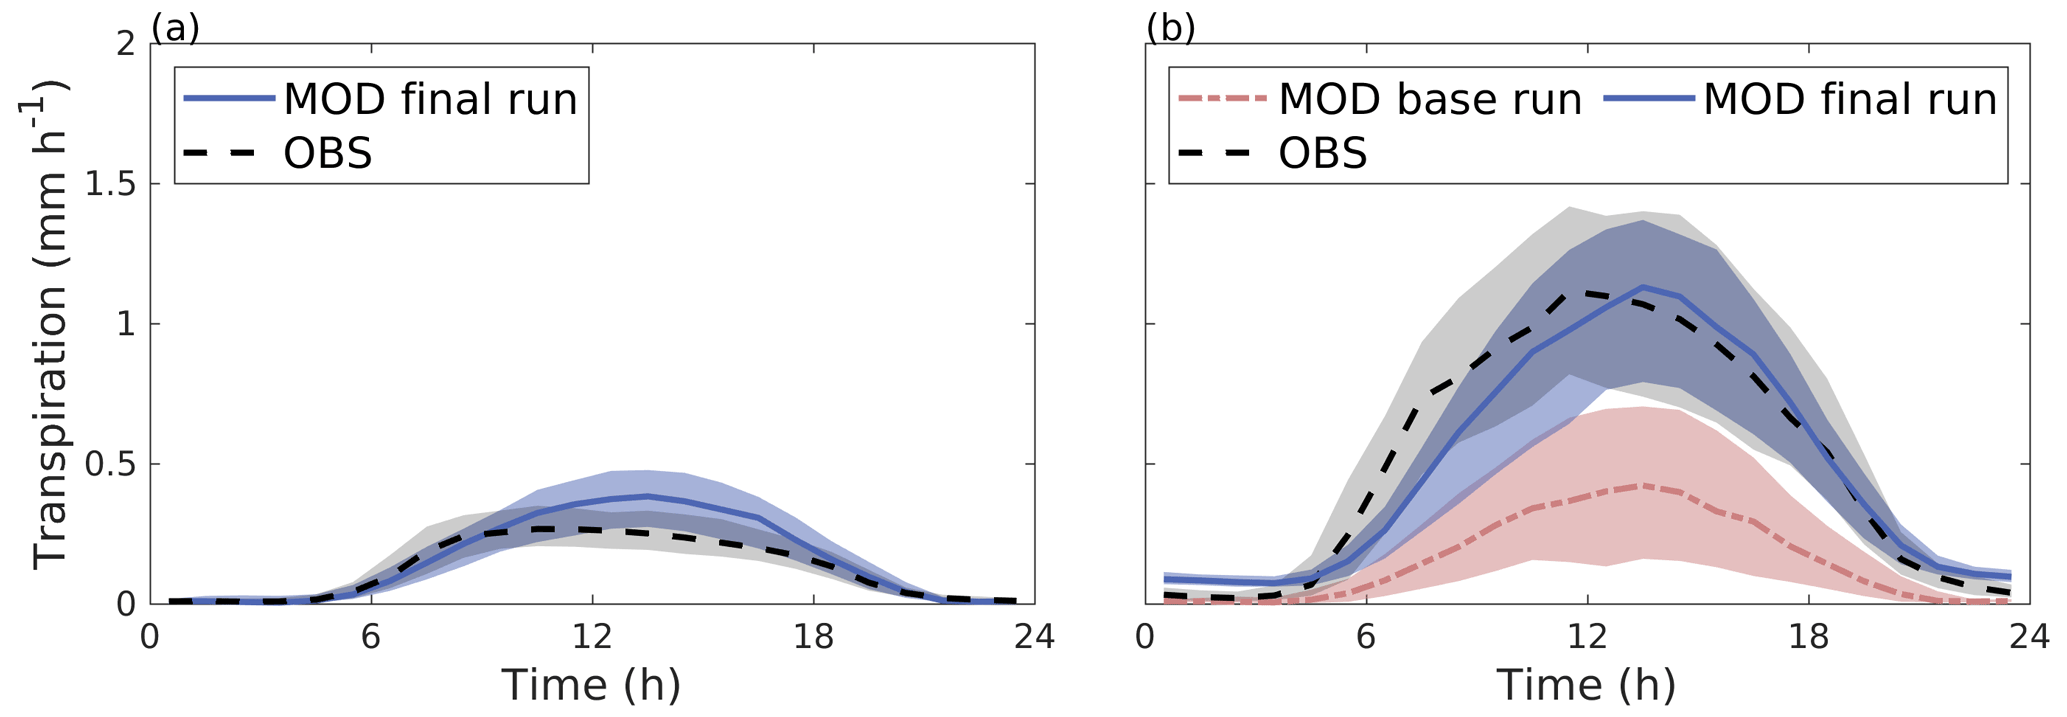
Figure 4Median diurnal cycle of modelled transpiration (solid blue line) and transpiration estimated from observed sap flow (dashed black line) from June to August 2008–2011 for (a) the Tilia site and (b) the Alnus site. In panel (b), the red line represents the model simulation without an additional water source (the base run). The shaded areas are the 25th/75th percentiles.
The diurnal maximum of observed transpiration reached 0.27 mm h−1 at the Tilia site in the morning. The model did not show the morning maximum and slightly overestimated the daytime transpiration, with maximal values reaching 0.38 mm h−1. At the Alnus site, the modelled median transpiration reached 0.42 and 1.12 mm h−1 for the base run and final run, respectively, whereas the estimated transpiration from sap flow measurements was 1.12 mm h−1 (Fig. 4b).
Figure 5 shows the correlation between hourly values of modelled transpiration and transpiration estimated from sap flow measurements for the summers of 2008–2011 separately for the two sites. The model performance varied between the years. The nRMSE at the Tilia site varied between 0.14 and 0.34, whereas performance was slightly better at the Alnus site, as the values ranged between 0.11 and 0.22. Moreover, the nMBE at the Tilia site varied between −0.05 and 0.25, whereas performance was again better at the Alnus site, as the values ranged between −0.15 and 0.06. Both sites showed higher transpiration in 2010, with measured 95th percentiles reaching 0.68 and 1.83 mm h−1 for the Tilia and Alnus sites, respectively, whereas the 95th percentiles during other years remained below 1.48 mm h−1. The modelled transpiration at the Alnus site slightly underestimated the transpiration in 2010, as the nMBE was poor (−0.15) despite the nRMSE showing good model performance (0.11).
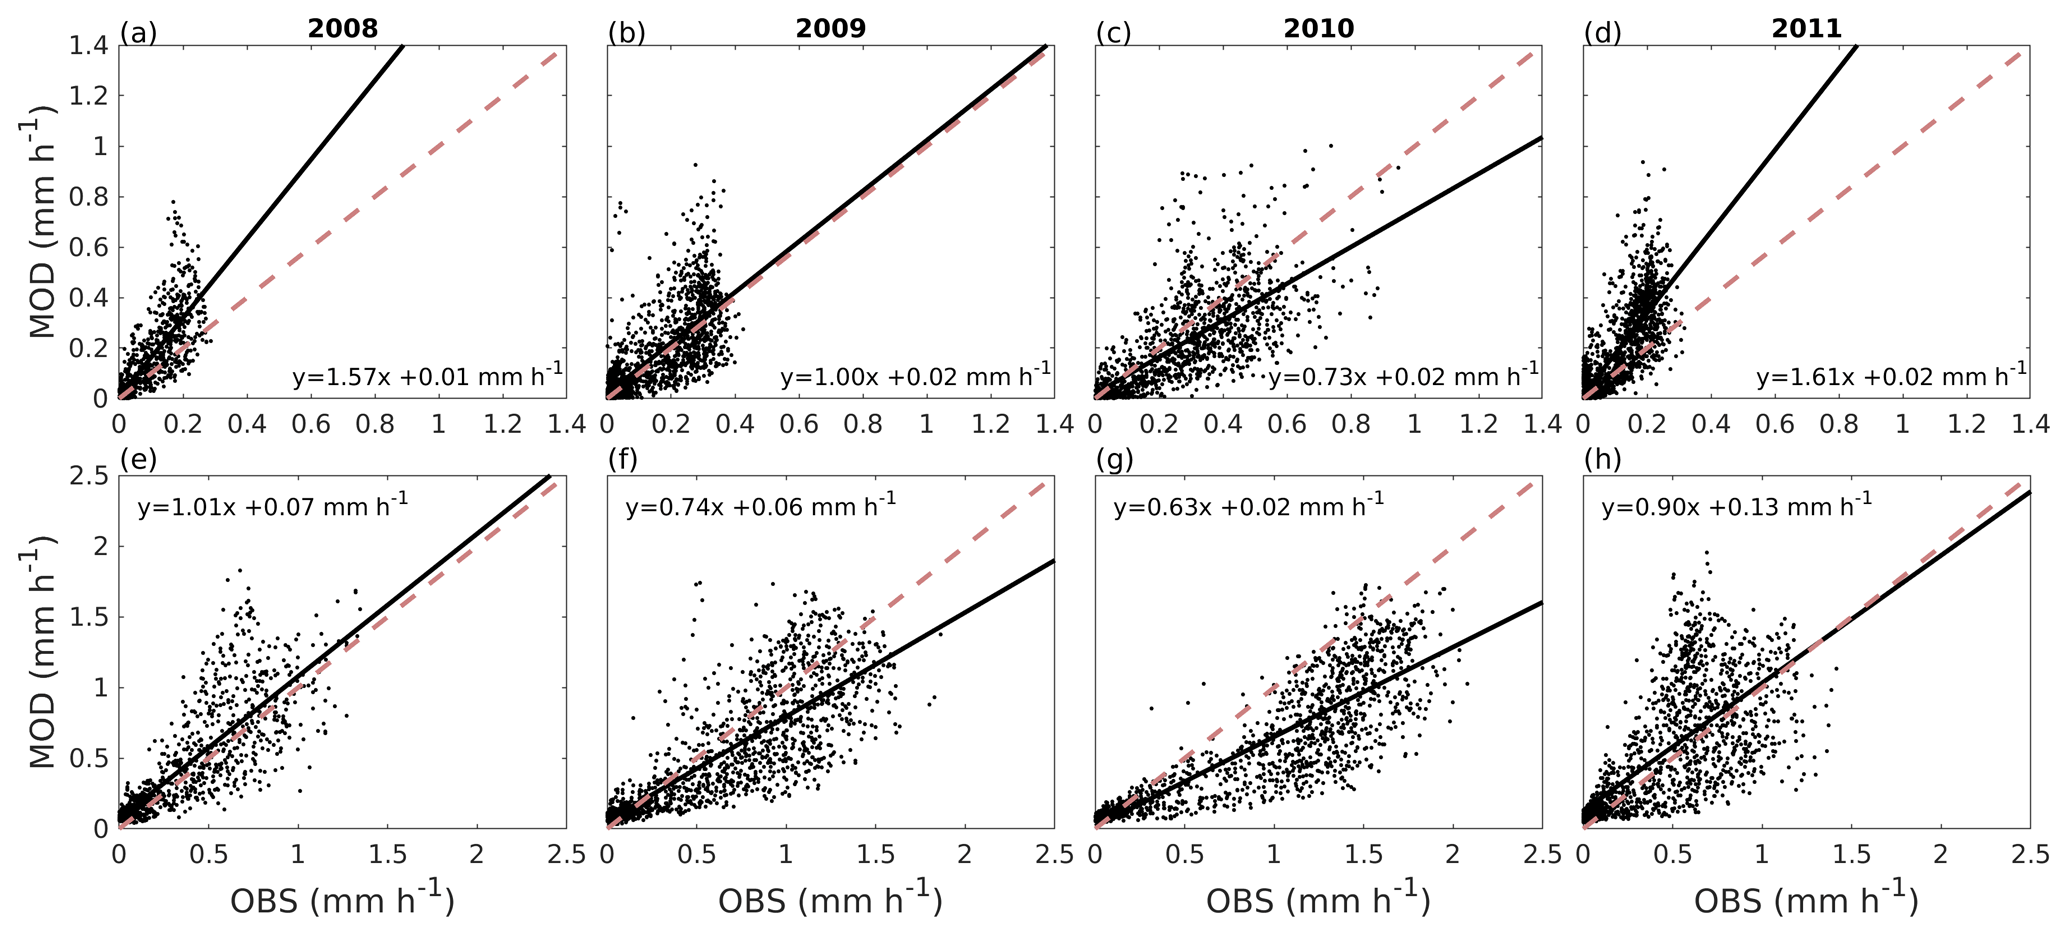
Figure 5Correlation between hourly values of modelled transpiration (MOD) and transpiration estimated from sap flow measurements (OBS) from June to August for the Tilia site (a–d) and the Alnus site (e–h) for each year during the period 2008–2011. The dashed red line is the 1:1 line, and the solid black line represents the linear fit.
3.1.3 Photosynthesis and respiration
Figure 6 shows the median diurnal behaviour of photosynthesis and autotrophic respiration from June to August 2016. Both photosynthesis and respiration were larger for the Alnus site. The daytime maximal photosynthesis values were 22.5 and 35.9 µmol m−2 s−1 for the Tilia and Alnus sites, respectively. Similarly, maximum respiration was higher at the Alnus site (5.1 µmol m−2 s−1) than at the Tilia site (3.7 µmol m−2 s−1). The model performed well at both sites, nRMSEs for respiration were 0.02 and 0.03 for the Tilia and Alnus sites, respectively, and photosynthesis was 0.05 for both sites. Although the nMBE values for photosynthesis were negative, the modelled underestimation of photosynthesis remained small.
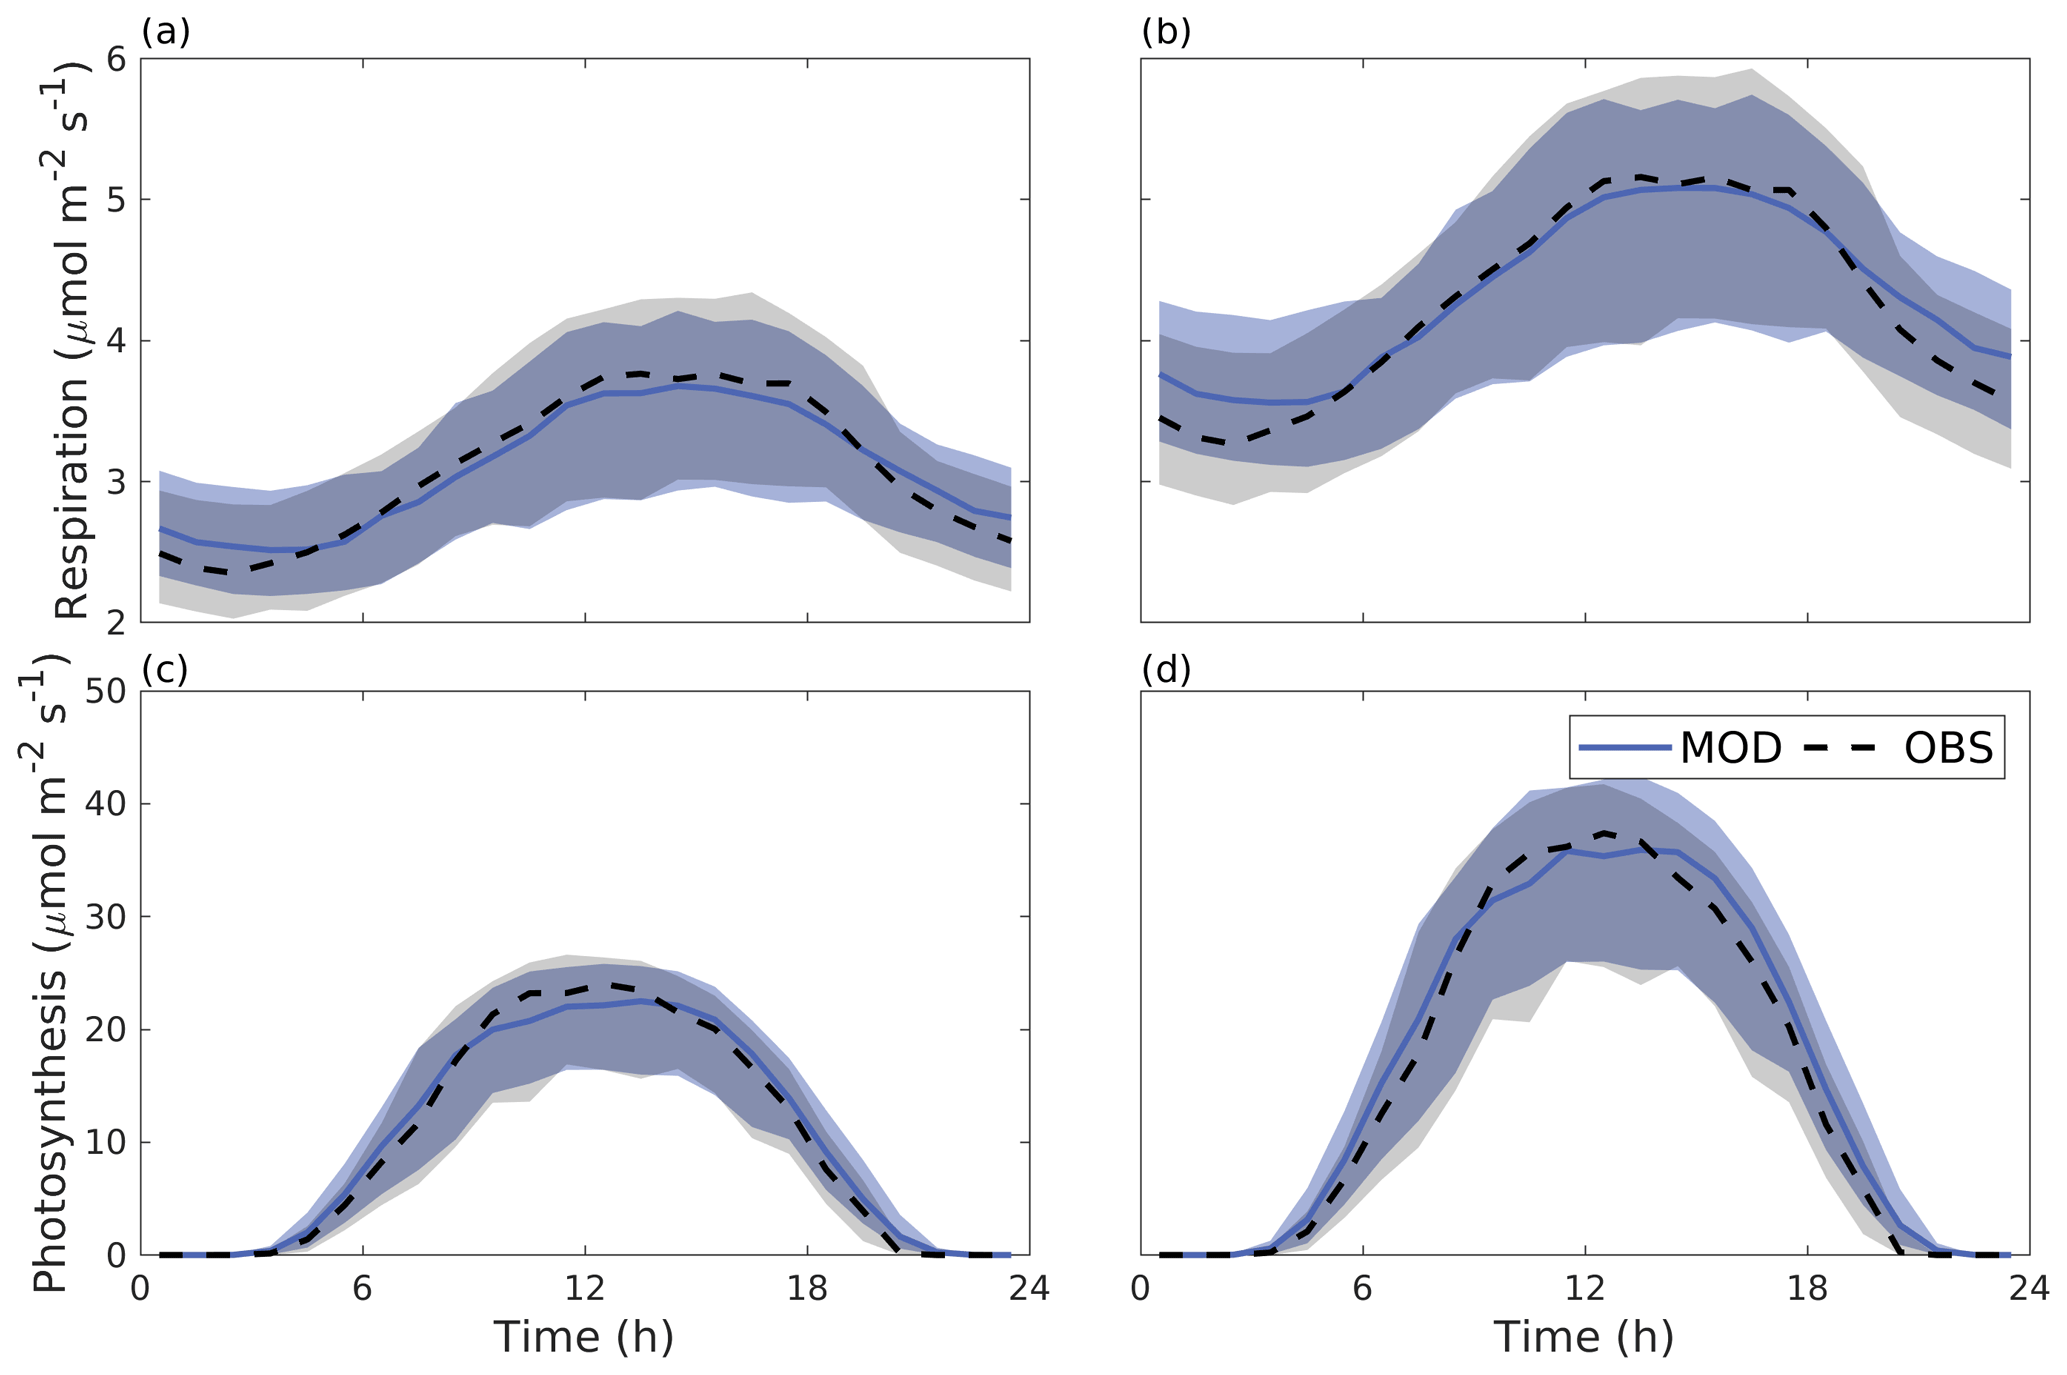
Figure 6Median diurnal cycle of modelled (blue line) and observed (dashed black line) CO2 emissions in tree respiration (a–b) and photosynthesis (c–d) from June to August 2016 for the Tilia site (a, c) and the Alnus site (b, d). The shaded areas show the 25th/75th percentiles.
3.2 Yasso model performance
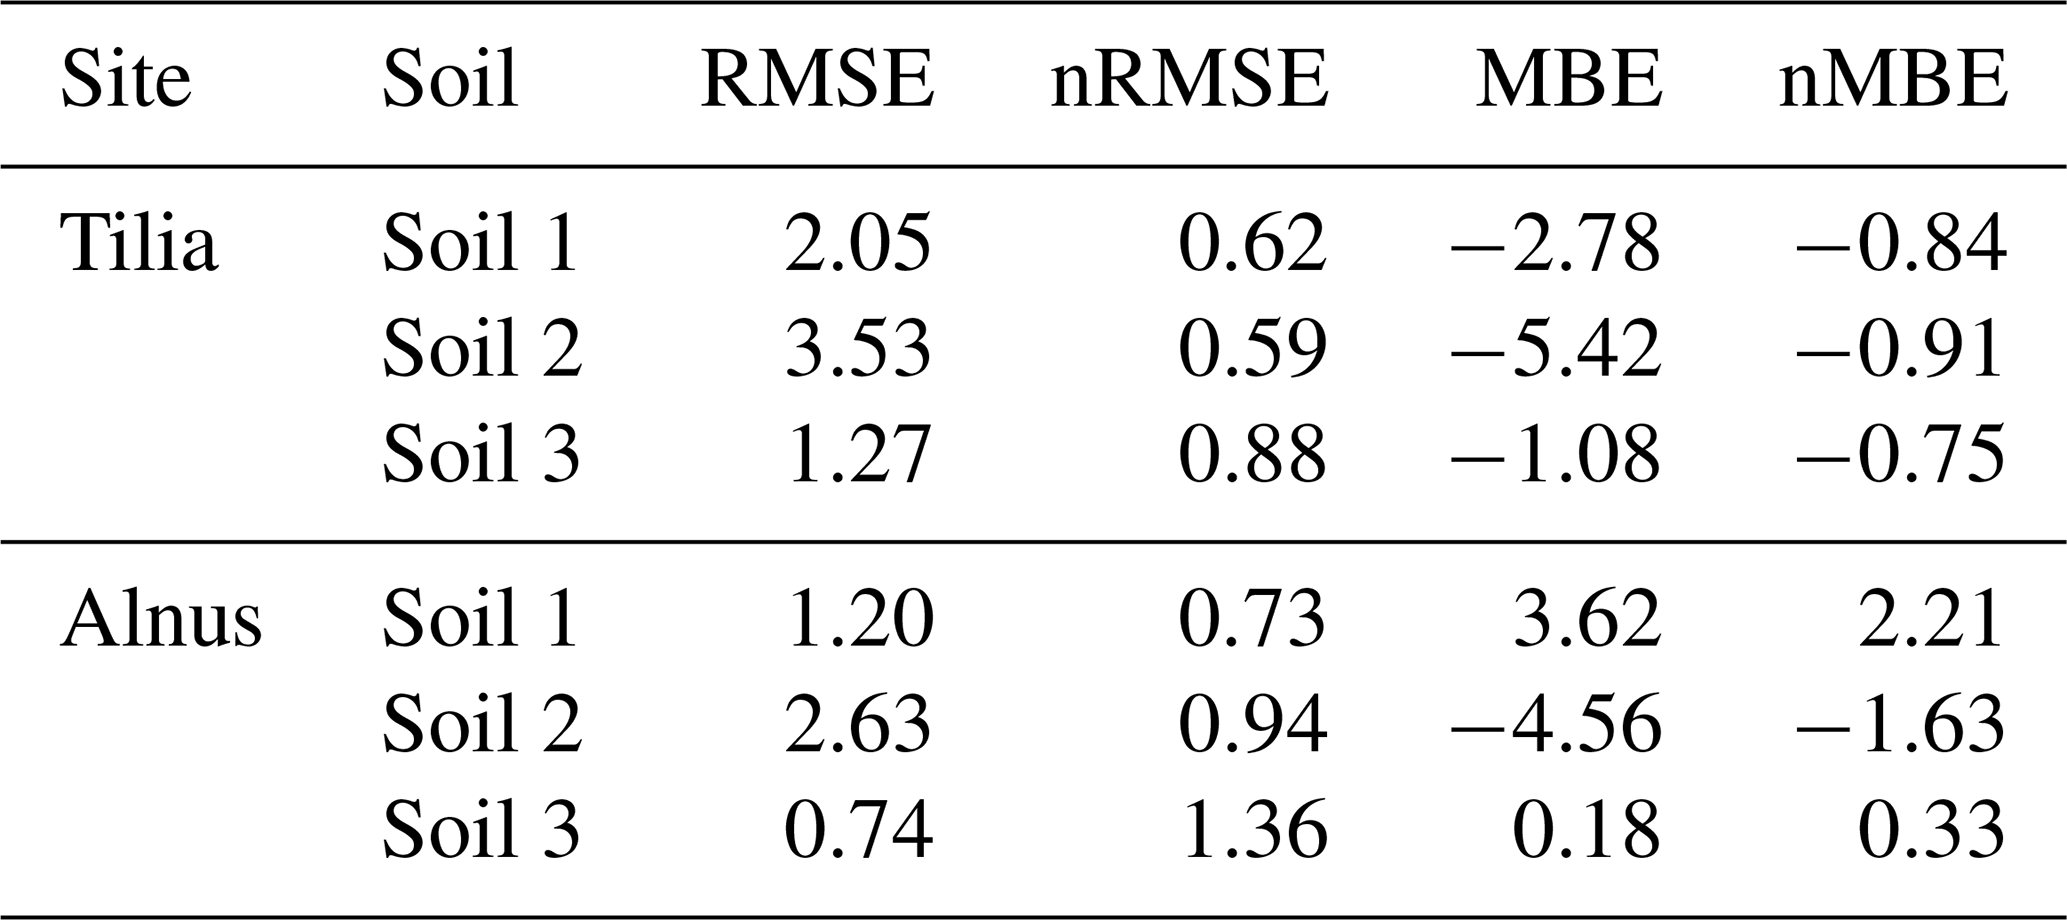
Overall from 2002 until 2016, the soil carbon pool decreased from 14.5, 27.9, and 9.6 kg C m−2 to 5.1, 4.5, and 1.7 kg C m−2 for the Tilia site and to 5.7, 5.4, and 2.2 kg C m−2 for the Alnus site for soils 1, 2, and 3, respectively (Fig. 7). Yasso model performance was evaluated using only four measurement points in time, and therefore the following statistical values should be treated with caution. Model performance was best in soil 3, as nMBE was lowest at both sites (Table 5). Yasso underestimated the soil carbon pool in soil 2 at both sites, whereas it showed mixed performance in soil 1 (Fig. 7). In general, the nRMSE ranged from 0.59 to 0.88 at the Tilia site, indicating better model performance than at the Alnus site, where values ranged from 0.73 to 1.36 (Table 5). Overall, the nMBE also showed better performance at the Tilia site, with values ranging from −0.91 to −0.75, whereas values ranged from −1.63 to 2.21 at the Alnus site. The role of decomposing fine roots was small and barely detectable before the later phase of the simulation period, as shown by the very small deviation of the model run with roots from the base run without roots (Fig. 7).

Figure 7Monthly soil carbon stock modelled using Yasso without roots (dashed black line) and with roots (dashed blue line) from 2002 to 2016, and measured average loss-on-ignition-based soil carbon stock estimations (± SD; red dots) for the three studied soil types at the Tilia site (a–c) and the Alnus site (d–f).
Table 5Yasso model performance statistics for soil carbon stock at the Tilia and Alnus sites by soil type.
3.3 Carbon sequestration
The seasonal distribution of tree gas exchange and soil respiration slightly varied between the years (Fig. 8). The tree canopy area grew until 2008, after which the canopy was regularly pruned and the annual changes in carbon sequestration and tree respiration were then mainly due to the prevailing weather. Autotrophic respiration was at its highest in July, while photosynthesis peaked in either June or July depending on the year. In 2010, the model estimated the highest monthly autotrophic respiration rates in July, with values of 0.16 and 0.22 kg C m−2 month−1 for the Tilia and Alnus sites, respectively. However, the maximal photosynthesis values were simulated in July 2014, with values of 0.39 and 0.63 kg C m−2 month−1 for the Tilia and Alnus sites, respectively. Leaf onset began at different times in different years depending on the simulated growing degree days, leading to a difference of up to 20 d in the model simulations. This is most evident for May 2015, when the photosynthesis was 0.16 kg C m−2 month−1, which is only 55 % of the highest photosynthesis level in May (in 2016). However, photosynthesis did not differ from the other years on an annual basis because the growing season lasted longer in 2015, with vegetation remaining more active even in August compared with the other years. Soil respiration estimations (Fig. 8e, f) were higher in the initial years after street construction. The model estimated that the highest soil respiration rates of 0.73 kg C m−2 month−1 occurred in July 2004. After the initial soil carbon loss, the maximum monthly values ranged between 0.08 and 0.26 kg C m−2 month−1. According to the model, the highest monthly values were reached from May to October, depending on the year. The variability in soil respiration seasonality is due to both temperature and moisture. In June 2010, the average monthly temperature was exceptionally high (22.5 ∘C), although the monthly precipitation level was high in August 2011 (253.5 mm), leading to high soil respiration in both cases.
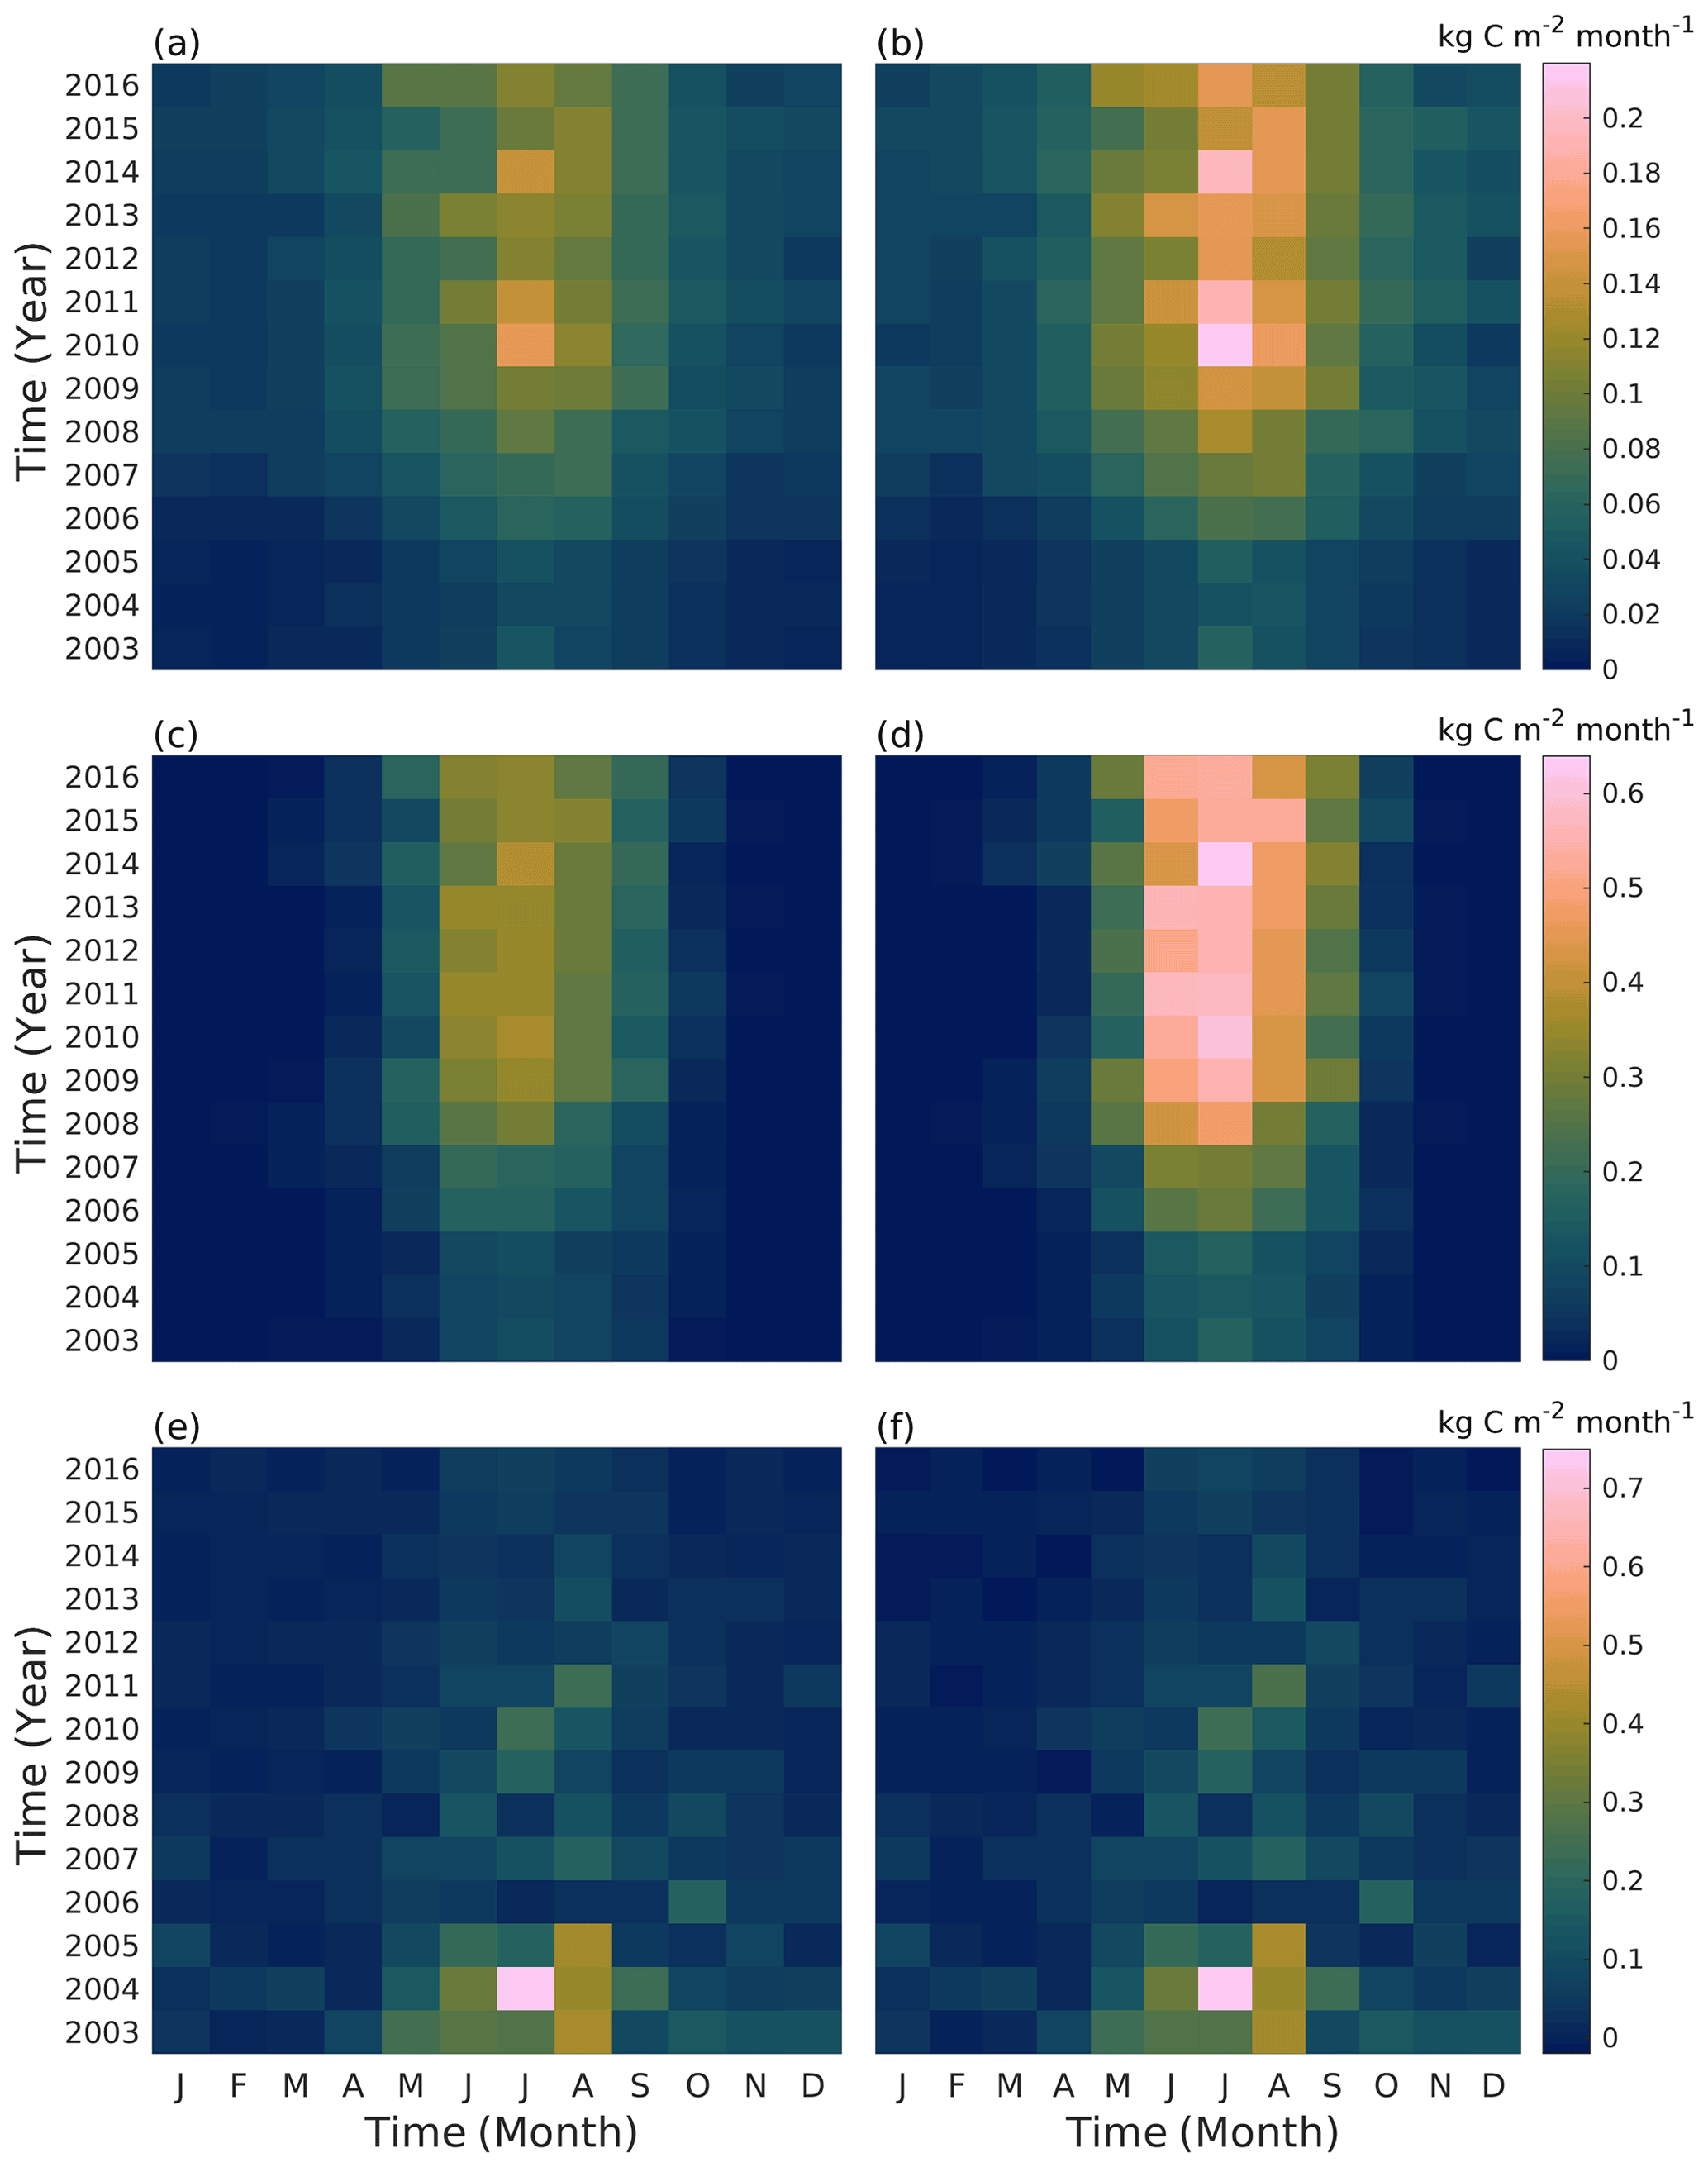
Figure 8Simulated monthly street tree respiration (a, b), photosynthesis (c, d), and soil respiration (e, f) at the Tilia (a, c) and Alnus (b, d) sites during the simulation period (2003–2016).
Over the whole study period (2003–2016), uptake by tree photosynthesis increased while soil emissions decreased (Fig. 9). As a result, the sites turned from being annual CO2 sources to being carbon neutral or even small sinks. The estimated annual uptake by photosynthesis varied between the years from 3.55 to 13.44 kg C yr−1 per tree for the Tilia site and from 2.68 to 10.73 kg C yr−1 per tree for the Alnus site. Similarly, tree respiration varied between 1.87 and 6.80 kg C yr−1 per tree for the Tilia site and between 1.22 and 4.68 kg C yr−1 per tree for the Alnus site. Soil respiration varied from 6.16 to 56.68 kg C yr−1 per tree for the Tilia site and from 4.41 to 56.21 kg C yr−1 per tree for the Alnus site. Overall, the net exchange (NE) of street tree plantings varied between −0.86 and 54.92 kg C yr−1 per tree for the Tilia site and between −1.82 and 54.70 kg C yr−1 per tree for the Alnus site.
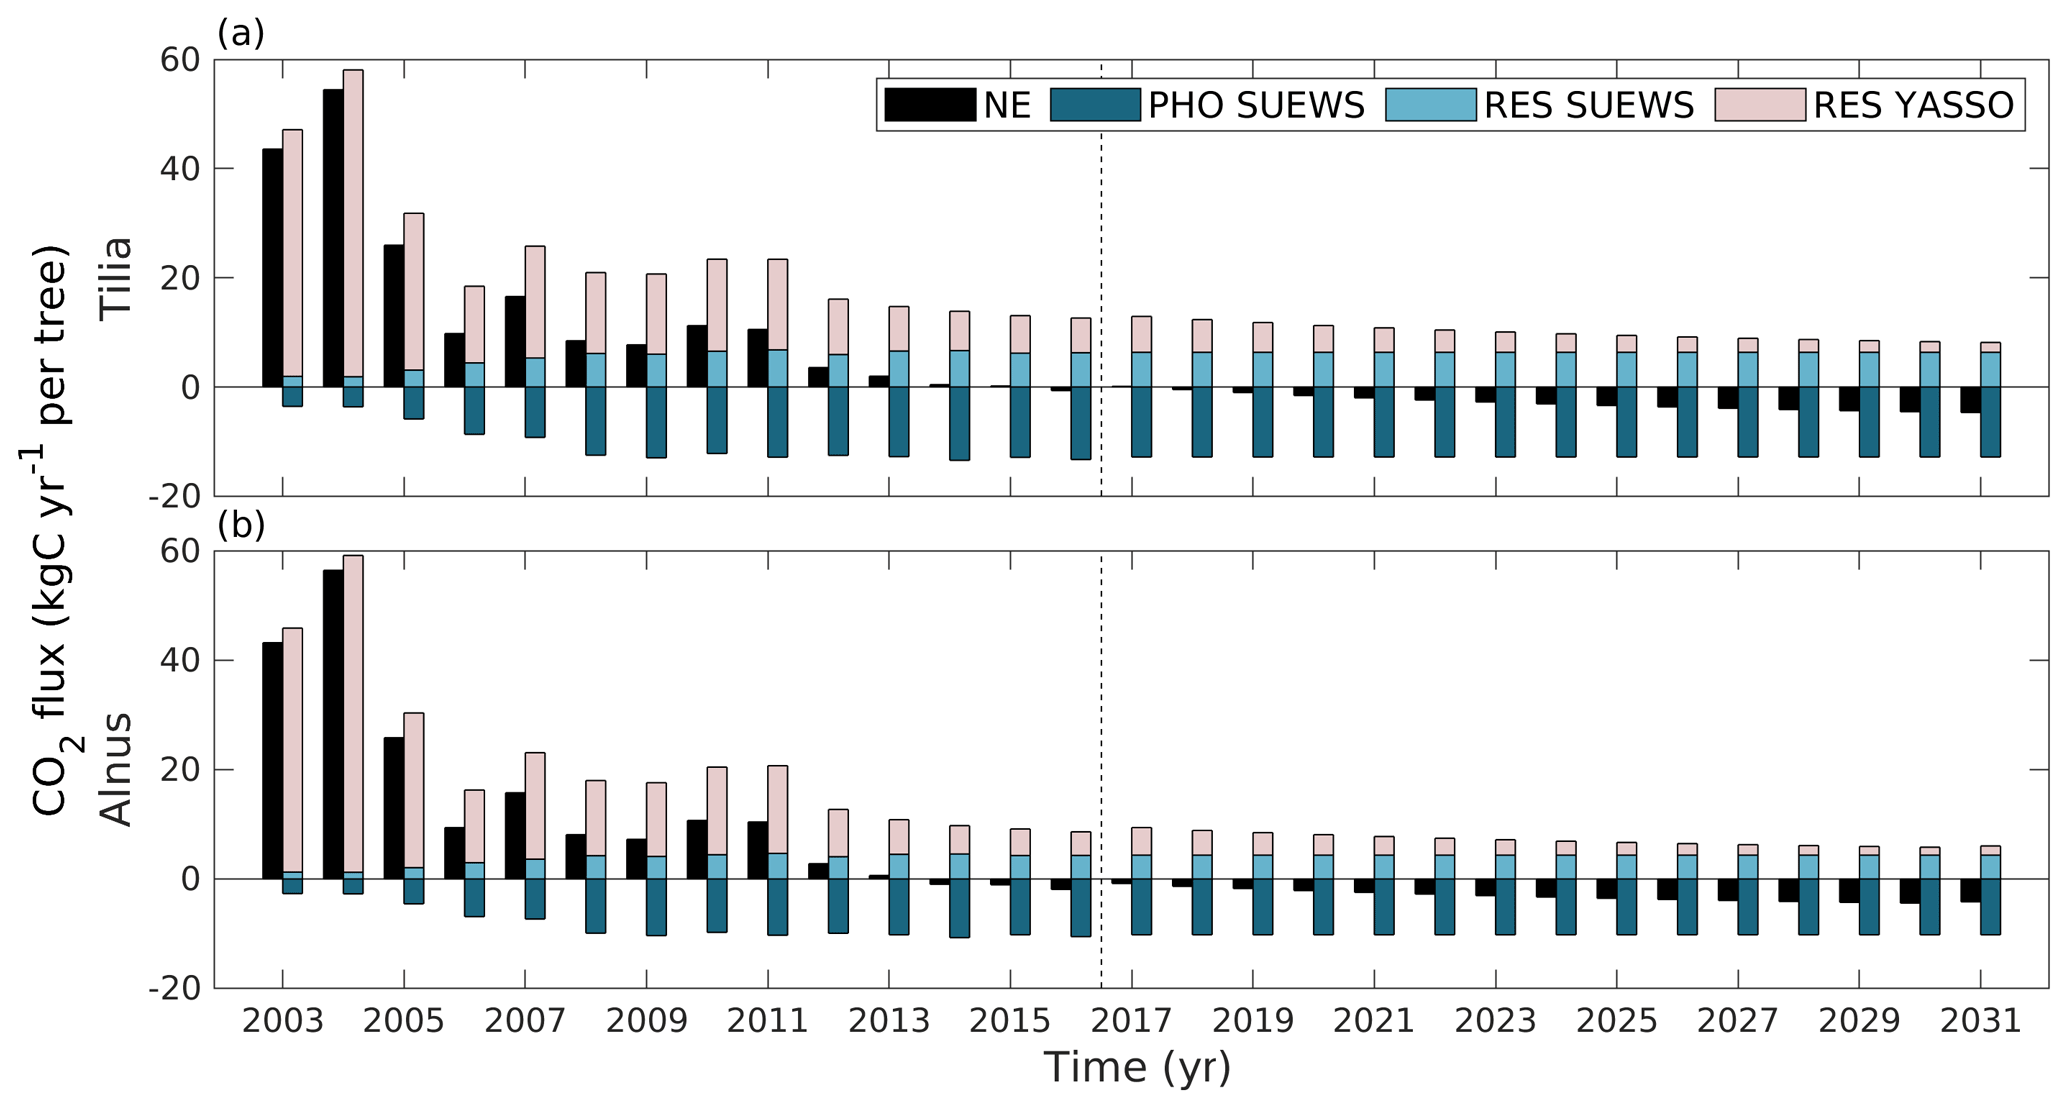
Figure 9Estimated annual net exchange (NE, black) of street tree plantings, CO2 uptake by photosynthesis (PHO SUEWS, dark blue), emissions from tree respiration (RES SUEWS, light blue) simulated with SUEWS, and emissions from soil respiration simulated with Yasso (RES Yasso, light rose) at the Tilia (a) and Alnus (b) sites. The dashed line separates the actual simulations from the estimations made with mean meteorological forcing. Here, positive values indicate a release of CO2 to the atmosphere and negative values indicate uptake from the atmosphere.
We also examined the carbon sequestration potential of the street tree plantings during their expected lifespan of 30 years. In 2031, the estimated annual net exchange was −4.66 kg C yr−1 per tree at the Tilia site and −4.18 kg C yr−1 per tree at the Alnus site if we assume that the above-ground litter is removed from the site as done previously (Fig. 9). The annual estimated uptake by photosynthesis was −12.83 and −10.22 kg C yr−1 per tree, respiration by trees was 6.35 and 4.36 kg C yr−1 per tree, and soil respiration was 1.81 and 1.68 kg C yr−1 per tree at the Tilia and Alnus sites, respectively. The estimated annual sink was stronger due to weakened soil respiration, as the soil carbon pool decreased over time. The net exchange was less negative if we also considered above-ground litter. Over the 30 year period, leaves on the Tilia and Alnus trees accumulated 1.0 and 4.3 kg C m−2 carbon. Approximately 24 % of this carbon was accumulated in soil carbon storage and the rest was emitted back to the atmosphere during the simulation period. As a result, soil respiration was 5 % and 23 % higher at the Tilia and Alnus sites, respectively, in the scenario that accounted for leaf decomposition. The estimated pruned branches accumulated approximately 50 % of their carbon into soil storage during the simulation period. However, their respiration was only 5 % that of leaf respiration, and their impact was small in the annual carbon sequestration estimations. Cumulatively over the 30-year period, the trees sequestered 172 and 156 kg C per tree at the Tilia and Alnus sites, respectively. At the Tilia site, the soil respired 390 kg C per tree, and the effect of the leaves and pruned branches added 41 kg C per tree to the estimations. At the Alnus site, soil respiration was smaller (359 kg C per tree), yet the effect of the leaves and pruned branches was slightly larger (68 kg C per tree).
In this work, we estimated the CO2 exchange dynamics in common urban street trees and their growing media using validated models. We found that these ecosystems turned from sources to sinks of atmospheric carbon at an annual level during the first 14 years after soil preparation and tree planting. Cumulatively over the years, these street tree plantings would not become sinks until 30 years after the streets were built, or even later (Riikonen et al., 2017). Commonly used methods to assess the carbon sequestration of street trees, such as i-Tree, estimate the sink strength with biomass equations and growth rate estimations (Nowak and Crane, 2000). However, these methods are unable to provide high temporal variations. Furthermore, these studies have mainly focused on the carbon cycle of trees, leaving soil carbon out of the estimations. The models used in this study allow the temporal variations in urban carbon sequestration and respiration by vegetation and soil to be considered, and they can account for climate and local meteorological conditions in their estimations.
Urban areas are heterogeneous, with variation in soil properties, plant species, and biomass. Even streets have diverse soil types, making it difficult to assess the carbon sequestration potential of street tree plantings. Here, we estimated the sequestration potential for street trees by utilizing an average calculated over diverse soil types and taking into account the most common city-wide planting pocket size for street trees (25 m2). The carbon sequestration of each tree and the soil beneath ranged from a strong carbon source to the atmosphere in the initial years (54.9 kg C yr−1 per tree) to a weak carbon sink at the end of the simulation period (−1.8 kg C yr−1 per tree). In the initial years after construction, high soil carbon decomposition dominated the gas exchange. At the latest stages of the main study period, i.e. after approximately 12–14 years, soil respiration roughly equalled tree respiration (approximately 5 kg C yr−1 per tree), and photosynthesis balanced these two components.
The mean lifetime of street trees is estimated at only 20–30 years (Roman and Scatena, 2011). If we continued the simulations up to 30 years, the sink grew during the study period, mainly because soil respiration decreased; by the end of the simulation, the street tree plantings were clearly carbon sinks on an annual basis. However, cumulatively, the street tree plantings remained sources of CO2 to the atmosphere, mainly due to their high soil respiration rates during the first years after planting. In the main simulations, the contribution of above-ground litter was excluded from the site-based estimations of carbon sequestration, as the initial aim was to test the soil module in a system where litter was removed. Nevertheless, the litter collected is part of the whole street tree carbon sequestration, and even if leaf decomposition did not happen on the street tree site, it probably occurred somewhere else. Based on the 30-year simulations, soil respiration increased 5 %–23 % due to the leaves, as approximately 24 % of their carbon would have accumulated in the soil carbon stock. On the other hand, the soil that caused notable initial emissions consisted of waste and residues (such as composted sewage sludge and leaf litter), which would have caused emissions even if it was not circulated as growing media. Therefore, the overall carbon sequestration potential of such street plantings should not be seen as negative, as these cumulative net exchange values indicate. As the growth rate changes are not included here and the study does not represent the full variety of soils, tree species, growing rates, or densities used in street tree plantings, these simulations should not be upscaled to a larger area without caution. Instead, these results highlight the importance of soil and its respiration in the urban carbon balance; soil respiration is often neglected in urban studies but can be of a similar magnitude to tree carbon sequestration, as shown.
4.1 Dynamics of tree carbon gas exchange
We found that tree CO2 exchange varied between days, seasons, and years due to changes in environmental factors, tree species, and tree size. The diurnal cycle of photosynthesis was mainly driven by the changes in incoming short-wave radiation, limiting the uptake at night-time and on cloudy days. Additionally, the decrease in air humidity slightly limited daytime uptake. Seasonal variability was driven by variations in incoming short-wave radiation, air temperature, and LAI, whereas year-to-year variability was driven by changes in air temperature and LAI only, as the growing season length varied by 26 d between the years and therefore had a clear impact on carbon sequestration. In this study, the size of the tree canopy was assumed to remain constant after 2008, which is why the annual variations in carbon sequestration and tree respiration thereafter were mainly determined by prevailing weather. These street trees had access to water outside the growing medium, and the top 1 m soil moisture therefore did not limit CO2 uptake by photosynthesis in this study.
Here, the annual tree respiration varied between 1.2 and 6.8 kg C yr−1 per tree and photosynthesis ranged between 2.7 and 13.4 kg C yr−1 per tree. In the last simulation year (2016), the net uptakes were 7.0 and 6.2 kg C yr−1 per tree for the Tilia and Alnus sites, respectively. These estimations are lower than those resulting from other methods used to estimate carbon sequestered by street trees in Europe. Russo et al. (2014) used models (UFORE and CUFR Tree Carbon Calculator), allometric equations, and field data to estimate the average above-ground carbon sequestration of street trees in Bolzano, Italy, which ranged from 12.1 to 17.4 kg C yr−1 per tree. Moreover, street trees in Lisbon, Portugal were estimated to sequester 43.1 kg C yr−1 per tree (Soares et al., 2011). However, those street trees grew in a warmer temperate zone and were probably more mature and could therefore sequester more carbon than the younger trees examined in this study.
Tree biomass equations have been used to estimate the carbon accumulated in woody biomass, roots, and leaves in 2003–2011 for the same street trees as in our study. Riikonen et al. (2017) estimated that 26.1 and 38.2 kg C per Tilia and Alnus tree, respectively, was sequestered during the first 10 years after planting. Correspondingly, 39.4 and 35.9 kg C per tree was estimated to accumulate based on the balance between simulated tree respiration and photosynthesis during the decade. However, root respiration was not taken into account in these simulations, which would decrease the accumulated carbon estimations. Moreover, urban biomass estimations still contain uncertainty, and Riikonen et al. (2017) noted that the estimation for Tilia trees may be an underestimation. Furthermore, the i-Tree model has been used to estimate the carbon sequestration of potential Tilia trees in Helsinki, using weather from Maine, USA (Ariluoma et al., 2021). The sequestration potential in 50 years was 1.7 t CO2 at best, corresponding on average to 7.6 kg C yr−1 per tree. This estimation possibly overestimated the carbon sequestration potential in Helsinki, as Maine has higher precipitation levels than Helsinki. In addition, the models differ in how they handle leaves. With our streets, we assume that all the leaves end up out of the simulation area, so their decomposition is not taken into account. Overall, the annual carbon sequestration estimated with i-Tree was close to the estimations for Tilia trees in this study.
4.2 SUEWS performance and tree measurements
We found that SUEWS is able to simulate evapotranspiration dynamics correctly, even though the study sites greatly differ in soil water availability. Alnus glutinosa trees reportedly tend to have deep roots that can access groundwater (Claessens et al., 2010), and therefore the trees are not only dependent on precipitation but can also access deep water sources. Our study supports this phenomenon, as the modelled transpiration at the Alnus site notably improved when an external water input was fed into the soil, while soil moisture in the top layer was concurrently simulated well without additional water. Therefore, the possible existence of unidentified water pools may further complicate urban photosynthesis simulations in soils with access to groundwater.
Modelling photosynthesis is a relatively new addition to the SUEWS model (Järvi et al., 2019), which combines evapotranspiration and photosynthesis with stomatal opening. The model parameters G1−G6 were previously fitted against surface conductance values that were estimated from observed latent and sensible heat fluxes (Järvi et al., 2011; Ward et al., 2016) and represent the integrated conductance for all surface types. The effect of evaporation was eliminated by performing the parameter fits for dry conditions only. Such general parameters represent the environmental response functions for all vegetation types, in contrast with the method used in this study, where the parameters only represent street trees. Compared with general parameters derived from eddy covariance measurements from Swindon, England (Ward et al., 2016) (G2=200 W m−2, G3=0.13, G4=0.7, G5=30 ∘C, G6=0.05 mm−1, ΔθWP=120 mm), the g(Δq) parameters G3 and G4 show significant differences. Δq seems to be less relevant for street trees, although extremely dry conditions were not reached during the fitting period, which may have affected the fitted parameters. The same behaviour was found in Riikonen et al. (2016), where they studied the relationship of Δq to sap flow measurements. g(K↓) is slightly more restricting for street trees than the general parameters. g(Tair) is the same for general parameters as for street trees, because the shape and upper and lower limits are the same. The peak air temperature G5 does not change, as such high temperatures are rarely measured in Helsinki. ΔθWP is slightly smaller for the Swindon site than what we estimated. g(Δθ) for the general parameters is similar to that for the Alnus site.
The dependencies of the two tree species on K↓ and Tair are very similar, whereas clearly different responses to Δq and Δθ are seen. The relationship of Δq to stomatal conductance has already been reported to be smaller for these street trees, especially for the Alnus site (Riikonen et al., 2016), whereas soil moisture is expected to have little effect at both sites until a significant deficit is reached. SWC is high, especially at the Tilia site, and therefore no clear dependence on Δθ is found. The high soil water availability can also affect the response of stomatal conductance to Δq, as the trees have access to water in soil even in dry air conditions.
Carbon sequestration and evapotranspiration both depend on tree leaf stomata control. In this study, leaf-level gas exchange measurements were used to parameterize the stomatal control model in SUEWS, whereas sap flow measurements were used to evaluate model functionality. However, both measuring methods have known uncertainties. The leaf-level photosynthetic responses were not used as such, but were scaled to the canopy level with a forest stand gas exchange model, SPP (Mäkelä et al., 2006). Measurements were made manually, so no continuous measurement data were available, but continuous photosynthesis data were created separately with SPP. For further research, the use of automatic chambers is recommended to gain more realistic environmental response functions. The Granier-type heat dissipation method (Granier, 1987; Hölttä et al., 2015) used in this study to measure sap flow and estimate whole-tree transpiration has some uncertainties caused by method-related issues, such as the sensors responding slowly to flow rate changes, and tree-related issues, such as the water stores in the trees themselves being utilized (Clearwater et al., 1999; Burgess and Dawson, 2008). These issues with the measurement method lead to a time lag between the measured sap flow and the actual tree transpiration, and likewise between the meteorological conditions affecting transpiration. Riikonen et al. (2016) estimated that the time lag for the street trees ranges between 30 and 90 min depending on the year. Here, an average of 60 min was used for all cases, which may lead to a slight error. The Tilia trees showed a slight morning maximum in the observations, which may be due to transpiration from internal water reservoirs in the tree trunk. Furthermore, the observed sap flows may not be accurate representations of tree transpiration, as the sensor location may not represent the whole tree trunk. However, Riikonen et al. (2016) estimated the possible overestimation to be 21 % at its highest. Sap flow values also varied between measurement years, partly due to meteorological conditions. In 2010, sap flow values were at times twice as high as during other years, due to the higher air temperature and increased VPD observed that year. However, long-term measurements contain some uncertainty because, as the trees grow, the sensors may become buried more deeply, leading to changes in flow rates (Moore et al., 2010).
4.3 Soil carbon
Here, we demonstrated the relative importance of soil carbon in the carbon cycle of street trees. Cities have already used soil carbon models to estimate their soil carbon stocks, but relatively few studies exist concerning the applicability of these models to urban soils (Bandaranayake et al., 2003; Qian et al., 2003; Trammell et al., 2017). We showed that the Yasso soil model is mainly able to simulate the initial decrease in the soil carbon pool after tree planting, but there seems to be an increasing level of misfitting over the simulation period. The reasons behind this issue in this study remain unsolved, but we assume that the differences arise from the unknown initial AWENH of the soil substrates, spatially limited sampling of the soil carbon pool, and possibly overestimated soil moisture on paved systems. Next, we discuss these in detail.
Yasso simulates the decomposition of soil carbon as depending on the solubility of the carbon compounds. The used AWENH fractions were based on a qualitative description of the soil composition, i.e. the various organic materials present (Riikonen et al., 2017). Their proportions in the mixture, such as the share of peat, were unclear, leading to uncertainty in the initial AWENH. Further, the settings used for these initial fractions had a high impact on the model results. For example, bark was ignored in soil 2, as we assumed its share to be minor, but its absence in the model runs may explain some of the underestimation in comparison with the measurements. On the other hand, soil measurements also have large uncertainty, as the measurements were performed at only two locations, although measurements were taken at multiple depths. The samples were taken approx. 2–3 m from the trees, whereas we simulated the whole soil volume, where the distances (especially those between the Tilia trees) were notably longer. According to the measurements, the soil carbon pool was stable or even increasing 7–15 years after planting. Such a finding in nature can only result from notable litter input, a notable decrease in the decomposition of organic matter, or, most likely, from a combination of the two.
In the simulations, the fine roots had a minor impact on the soil carbon stock, as the study trees were still young and thus the root biomass was low. As the fine roots were assumed to be evenly spread in the model runs, the simulated fine root litter input and decomposition represent an average of the whole soil volume. In nature, fine roots probably occur more densely close to the trees, i.e. at the sampling locations, than further away. Besides, high root mass decreases soil moisture and subsequently also the decomposition rate. Higher root litter input and a decreased decomposition rate at the sampling locations could have caused the observed underestimation in the model simulation in the long run. With current knowledge, quantifying the fine root litter input is difficult, as its amount and the turnover rate are still unknown, especially in urban areas. Turnover rates have been estimated to vary between 1 and 9 years in forest ecosystems (Matamala et al., 2003), and future estimations would therefore benefit from studies revealing more accurate root lifetimes in urban ecosystems.
The forcing meteorology for Yasso was generated from the 2 m local air temperature simulated by SUEWS to obtain local temperatures. Local temperatures vary spatially in urban areas because built environments tend to warm up more while vegetative environments cool down due to evapotranspiration (Oke, 1982). However, the study sites in Viikki are similar to the measurement site in Kumpula, so the difference between measured air temperatures from Kumpula and the modelled local temperatures in Viikki remained small. In theory, increasing the soil temperature would lead to increased soil organic matter decomposition. The role of soil moisture is concurrently more complex, as decomposition decreases in both high and low soil moisture conditions (Moyano et al., 2012). The Yasso soil carbon model is driven by precipitation, but soil moisture may be lower than expected in paved systems such as ours, as a notable part of the water never enters the soil volume. Changing the drivers below ground would probably lead to improved model performance, but, on the other hand, observations of soil moisture and temperature are rare. Nevertheless, further efforts to study the role of soil moisture in the decomposition of the urban soil carbon pool are needed.
The estimated SOC densities in 2016 ranged from 1.7 to 5.7 kg C m−2, mostly depending on soil type. Soils 1 and 2 reached similar SOCs in 2016 (4.5–5.7 kg C m−2) despite the initial SOC being nearly twice as high for soil 2. These street soil estimates are much lower than those previously measured in parks in the City of Helsinki (10.4 kg C m−2; Lindén et al., 2020) and even lower than forest soils in Finland (6.3 kg C m−2; Liski et al., 2006). However, a direct comparison between SOC estimations may be challenging due to the different soil types, vegetation, and age. On the other hand, a limited amount of new carbon enters the soils of these streets, which may partly explain the difference. The date of construction or renovation of the park had a major impact on SOC (Scharenbroch et al., 2005; Setälä et al., 2016), as also observed by Lindén et al. (2020) for the parks in the City of Helsinki, where SOC accumulation stabilized after 50 years. The effect of street construction is also clearly seen in the street SOC estimations. The estimations show a decrease of SOC during the study period, as the root litter input is not enough to stabilize SOC decomposition. Compared with other urban soil studies outside of Finland, the average SOC storage in a green space was 9.9 kg C m−2 in Leicester, UK (Edmondson et al., 2014), which is similar to estimates for parks in Helsinki. However, the estimated SOC values have been lower in warmer climates. In Singapore, under turfgrass, SOC was estimated to be 2.0 kg C m−2 (Velasco et al., 2021). Furthermore, in Auckland, New Zealand, parkland soils were estimated to have 4.8 kg C m−2 and urban forest soils to have 2.7 kg C m−2 (Weissert et al., 2016).
The maximum monthly soil respiration estimates varied between 0.08 and 0.26 kg C m−2 month−1 after a high initial carbon loss, which correspond to 2.5 and 8.1 µmol CO2 m−2 s−1, respectively. These estimates compare reasonably well to previous research on soil respiration in urban areas. In Greater Boston's residential areas (Decina et al., 2016), the soil respiration of urban forests, lawns, and landscaped cover types was 2.6, 4.5, and 6.7 µmol CO2 m−2 s−1, respectively. In Singapore, turfgrass soil respiration was measured to be an average of 2.4 µmol CO2 m−2 s−1, with a highest mean value of 4.4 µmol CO2 m−2 s−1 (Velasco et al., 2021). No seasonal trends were observed, as tropical weather is favourable to constant soil respiration. In New Zealand, the median soil respiration was 5.2 µmol CO2 m−2 s−1 for parklands and 4.5 µmol CO2 m−2 s−1 (Weissert et al., 2016) for urban forest sites.
Quantification of the carbon cycle of urban nature is needed when planning green areas and when conducting carbon neutrality assessments and urban climate studies. In this study, an urban land surface model, SUEWS, and a soil carbon model, Yasso, were evaluated and used to estimate the carbon sequestration of street trees and soil in Helsinki, Finland. The compensation point at which street tree plantings turn from annual sources to sinks was achieved 14 years after street tree planting, but as the setup does not represent the full variety of soil growing media, planting densities, and plant types, these results should be upscaled with caution. The annual carbon sequestration depended on environmental factors, such as air temperature and humidity, indicating the need for modelling techniques that allow us to appropriately account for local climate conditions. Yasso and SUEWS are able to simulate the carbon cycle of street tree plantings, as shown by the observed soil moisture, sap flow, and soil carbon from two street tree sites, but the used substrates vary widely and the indeterminable soil properties cause great uncertainty in estimating the longevity of soil organic carbon. However, Yasso, which was developed for a non-urban area, performs reasonably well, but further studies – especially on root litter input and on the role of soil moisture in the decomposition process – would decrease the model's uncertainties.
Data from two locations were used to generate the continuous meteorological data set for 2002–2016 that was used to force the SUEWS and Yasso models. Measurements from the SMEAR III station tower and the nearby roof (Järvi et al., 2009) were primarily used and gap filled with measurements from Helsinki-Vantaa Airport, hosted by the Finnish Meteorological Institute (FMI) and located 10 km from Viikki. Additional SYNOP weather station precipitation measurements from Kumpula, hosted by FMI, were also used.
Precipitation was gap filled with multiple measurement devices and locations. The order of measurements used in the gap filling was: hourly PWD (since 2014), hourly SYNOP from Kumpula (since 2006), hourly Ott (since summer 2002), daily SYNOP from Kumpula (since 2006), and daily SYNOP from the airport (since 2002). Daily SYNOP data were divided evenly over the day to obtain hourly values.
Temperature, wind speed, wind direction, and incoming radiation were measured from the tower, rooftop, and airport, whereas relative humidity and air pressure were measured from the rooftop and airport only. Primary measurements were either the tower or rooftop measurements, which were gap filled with airport measurements using a linear correlation. The remaining missing hours were gap filled by linear interpolation if less than 5 h were missing (2 h for radiation), or with the average of the values for the same hour from the previous day and the following day if less than a day was missing. If more than a day was missing, the values were filled by calculating the average of the values for the same hour from the 3 previous days and the 3 following days.
Table B1Urban-specific processes accounted for in SUEWS and Yasso.

* 2 m air temperature from SUEWS.
The data sets are openly available at https://doi.org/10.5281/zenodo.5870101 (Havu et al., 2022), including the model runs for SUEWS and Yasso, the fits of the environmental response functions, the gap filling of the meteorological measurements, and codes to reproduce the figures. The surface cover fractions are based on the data set available at https://doi.org/10.5281/zenodo.4005833 (StromJan, 2020).
MH, LJ, and LK conceptualized the study. MH performed the SUEWS and Yasso model runs and formal analysis and prepared the figures. AR and PK collected the data; PK performed the SPP model runs. LJ, LK, and TV supervised the study. All authors contributed to writing and preparing the article.
The contact author has declared that neither they nor their co-authors have any competing interests.
Publisher’s note: Copernicus Publications remains neutral with regard to jurisdictional claims in published maps and institutional affiliations.
We thank the Tiina and Antti Herlin Foundation, the Academy of Finland funded CarboCity project and the Atmosphere and Climate Competence Center (ACCC), and Finnish Strategic Research Council funded CO-CARBON project. We also thank Toni Viskari for an introduction to the Yasso model.
This research has been supported by the Tiina and Antti Herlin Foundation (grant no. 20200027), the Academy of Finland (grant nos. 321527, 325549, 337549, and 337552), and the Strategic Research Council (SRC) established within the Academy of Finland (grant nos. 335201 and 335204).
Open-access funding was provided by the Helsinki University Library.
This paper was edited by Sebastiaan Luyssaert and reviewed by two anonymous referees.
Abramoff, R., Xu, X., Hartman, M., O’Brien, S., Feng, W., Davidson, E., Finzi, A., Moorhead, D., Schimel, J., Torn, M., and Mayes, M. A.: The Millennial model: in search of measurable pools and transformations for modeling soil carbon in the new century, Biogeochemistry, 137, 51–71, https://doi.org/10.1007/s10533-017-0409-7, 2018. a
Akujärvi, A., Heikkinen, J., Palosuo, T., and Liski, J.: Carbon budget of Finnish croplands – effects of land use change from natural forest to cropland, Geoderma Regional, 2, 1–8, https://doi.org/10.1016/j.geodrs.2014.09.003, 2014. a, b
Ariluoma, M., Ottelin, J., Hautamäki, R., Tuhkanen, E.-M., and Mänttäri, M.: Carbon sequestration and storage potential of urban green in residential yards: A case study from Helsinki, Urban For. Urban Gree., 57, 126939, https://doi.org/10.1016/j.ufug.2020.126939, 2021. a
Bandaranayake, W., Qian, Y., Parton, W., Ojima, D., and Follett, R.: Estimation of soil organic carbon changes in turfgrass systems using the CENTURY model, Agron. J., 95, 558–563, https://doi.org/10.2134/agronj2003.5580, 2003. a, b
Bosveld, F. C. and Bouten, W.: Evaluation of transpiration models with observations over a Douglas-fir forest, Agr. Forest Meteorol., 108, 247–264, https://doi.org/10.1016/S0168-1923(01)00251-9, 2001. a
Breuer, L., Eckhardt, K., and Frede, H.-G.: Plant parameter values for models in temperate climates, Ecol. Model., 169, 237–293, https://doi.org/10.1016/S0304-3800(03)00274-6, 2003. a, b, c, d
Burgess, S. S. and Dawson, T. E.: Using branch and basal trunk sap flow measurements to estimate whole-plant water capacitance: a caution, Plant Soil, 305, 5–13, https://doi.org/10.1007/s11104-007-9378-2, 2008. a
Camino-Serrano, M., Guenet, B., Luyssaert, S., Ciais, P., Bastrikov, V., De Vos, B., Gielen, B., Gleixner, G., Jornet-Puig, A., Kaiser, K., Kothawala, D., Lauerwald, R., Peñuelas, J., Schrumpf, M., Vicca, S., Vuichard, N., Walmsley, D., and Janssens, I. A.: ORCHIDEE-SOM: modeling soil organic carbon (SOC) and dissolved organic carbon (DOC) dynamics along vertical soil profiles in Europe, Geosci. Model Dev., 11, 937–957, https://doi.org/10.5194/gmd-11-937-2018, 2018. a
Chen, Y., Day, S. D., Wick, A. F., Strahm, B. D., Wiseman, P. E., and Daniels, W. L.: Changes in soil carbon pools and microbial biomass from urban land development and subsequent post-development soil rehabilitation, Soil Biol. Biochem., 66, 38–44, https://doi.org/10.1016/j.soilbio.2013.06.022, 2013. a
Claessens, H., Oosterbaan, A., Savill, P., and Rondeux, J.: A review of the characteristics of black alder (Alnus glutinosa (L.) Gaertn.) and their implications for silvicultural practices, Forestry, 83, 163–175, https://doi.org/10.1093/forestry/cpp038, 2010. a
Clearwater, M. J., Meinzer, F. C., Andrade, J. L., Goldstein, G., and Holbrook, N. M.: Potential errors in measurement of nonuniform sap flow using heat dissipation probes, Tree Physiol., 19, 681–687, https://doi.org/10.1093/treephys/19.10.681, 1999. a
Dahlhausen, J., Rötzer, T., Biber, P., Uhl, E., and Pretzsch, H.: Urban climate modifies tree growth in Berlin, Int. J. Biometeorol., 62, 795–808, https://doi.org/10.1007/s00484-017-1481-3, 2018. a
Davidson, E. A. and Janssens, I. A.: Temperature sensitivity of soil carbon decomposition and feedbacks to climate change, Nature, 440, 165–173, https://doi.org/10.1038/nature04514, 2006. a
Decina, S. M., Hutyra, L. R., Gately, C. K., Getson, J. M., Reinmann, A. B., Gianotti, A. G. S., and Templer, P. H.: Soil respiration contributes substantially to urban carbon fluxes in the greater Boston area, Environ. Pollut., 212, 433–439, https://doi.org/10.1016/j.envpol.2016.01.012, 2016. a, b
Edmondson, J. L., Davies, Z. G., McHugh, N., Gaston, K. J., and Leake, J. R.: Organic carbon hidden in urban ecosystems, Scientific Reports, 2, 1–7, https://doi.org/10.1038/srep00963, 2012. a
Edmondson, J. L., Davies, Z. G., McCormack, S. A., Gaston, K. J., and Leake, J. R.: Land-cover effects on soil organic carbon stocks in a European city, Sci. Total Environ., 472, 444–453, https://doi.org/10.1016/j.scitotenv.2013.11.025, 2014. a, b
Eschenbach, C. and Kappen, L.: Leaf area index determination in an alder forest: a comparison of three methods, J. Exp. Bot., 47, 1457–1462, https://doi.org/10.1093/jxb/47.9.1457, 1996. a, b
Eschenbach, C. and Kappen, L.: Leaf water relations of black alder [Alnus glutinosa (L.) Gaertn.] growing at neighbouring sites with different water regimes, Trees, 14, 28–38, https://doi.org/10.1007/s004680050004, 1999. a, b
Goret, M., Masson, V., Schoetter, R., and Moine, M.-P.: Inclusion of CO2 flux modelling in an urban canopy layer model and an evaluation over an old European city centre, Atmos. Environ., 3, 100042, https://doi.org/10.1016/j.aeaoa.2019.100042, 2019. a
Granier, A.: Evaluation of transpiration in a Douglas-fir stand by means of sap flow measurements, Tree Physiol., 3, 309–320, https://doi.org/10.1093/treephys/3.4.309, 1987. a
Grimmond, C. S. B. and Oke, T. R.: An evapotranspiration-interception model for urban areas, Water Resour. Res., 27, 1739–1755, https://doi.org/10.1029/91WR00557, 1991. a
Grimmond, C., Cleugh, H., and Oke, T.: An objective urban heat storage model and its comparison with other schemes, Atmos. Environ. B-Urb., 25, 311–326, https://doi.org/10.1016/0957-1272(91)90003-W, 1991. a
Hardiman, B. S., Wang, J. A., Hutyra, L. R., Gately, C. K., Getson, J. M., and Friedl, M. A.: Accounting for urban biogenic fluxes in regional carbon budgets, Sci. Total Environ., 592, 366–372, https://doi.org/10.1016/j.scitotenv.2017.03.028, 2017. a
Hari, P., Mäkelä, A., Korpilahti, E., and Holmberg, M.: Optimal control of gas exchange, Tree Physiol., 2, 169–175, https://doi.org/10.1093/treephys/2.1-2-3.169, 1986. a
Havu, M., Kulmala, L., Kolari, P., Vesala, T., Riikonen, A., and Järvi, L.: Data used in manuscript Carbon sequestration potential of street tree plantings in Helsinki, Zenodo [data set], https://doi.org/10.5281/zenodo.5870101, 2022. a
Heikkinen, J., Ketoja, E., Seppänen, L., Luostarinen, S., Fritze, H., Pennanen, T., Peltoniemi, K., Velmala, S., Hanajik, P., and Regina, K.: Chemical composition controls the decomposition of organic amendments and influences the microbial community structure in agricultural soils, Carbon Manag., 12, 1–18, https://doi.org/10.1080/17583004.2021.1947386, 2021. a, b
HEL: Syksyn arkivuorokauden liikenne Helsingissä 2016, https://www.hel.fi/hel2/ksv/aineistot/liikennesuunnittelu/liikennetutkimus/liikennemaarat.pdf (last access: 1 August 2020), 2016. a
Hölttä, T., Linkosalo, T., Riikonen, A., Sevanto, S., and Nikinmaa, E.: An analysis of Granier sap flow method, its sensitivity to heat storage and a new approach to improve its time dynamics, Agr. Forest Meteorol., 211, 2–12, https://doi.org/10.1016/j.agrformet.2015.05.005, 2015. a, b
Hoogsteen, M. J., Lantinga, E. A., Bakker, E. J., Groot, J. C., and Tittonell, P. A.: Estimating soil organic carbon through loss on ignition: effects of ignition conditions and structural water loss, Eur. J. Soil Sci., 66, 320–328, https://doi.org/10.1111/ejss.12224, 2015. a
HSY: SeutuCD'11 database, https://www.hsy.fi/en/environmental-information/open-data/avoin-data---sivut/population-grid-of-helsinki-metropolitan-area/ (last access: 1 May 2019), 2011. a
HSY: Selvitys pääkaupunkiseudun hiilinieluista ja -varastoista, Helsinki Region Environmental Services Authority, https://julkaisu.hsy.fi/selvitys-paakaupunkiseudun-hiilinieluista-ja–varastoista.pdf, (last access: 30 February 2021), 2021. a
Järvi, L., Hannuniemi, H., Hussein, T., Junninen, H., Aalto, P. P., Hillamo, R., Mäkelä, T., Keronen, P., Siivola, E., Vesala, T., and Kulmala, M.: The urban measurement station SMEAR III: Continuous monitoring of air pollution and surface–atmosphere interactions in Helsinki, Finland, Boreal Environ. Res., 14, 86–109, 2009. a, b
Järvi, L., Grimmond, C., and Christen, A.: The surface urban energy and water balance scheme (SUEWS): Evaluation in Los Angeles and Vancouver, J. Hydrol., 411, 219–237, https://doi.org/10.1016/j.jhydrol.2011.10.001, 2011. a, b
Järvi, L., Grimmond, C. S. B., Taka, M., Nordbo, A., Setälä, H., and Strachan, I. B.: Development of the Surface Urban Energy and Water Balance Scheme (SUEWS) for cold climate cities, Geosci. Model Dev., 7, 1691–1711, https://doi.org/10.5194/gmd-7-1691-2014, 2014. a, b
Järvi, L., Grimmond, C., McFadden, J., Christen, A., Strachan, I., Taka, M., Warsta, L., and Heimann, M.: Warming effects on the urban hydrology in cold climate regions, Scientific Reports, 7, 1–8, https://doi.org/10.1038/s41598-017-05733-y, 2017. a
Järvi, L., Havu, M., Ward, H. C., Bellucco, V., McFadden, J. P., Toivonen, T., Heikinheimo, V., Kolari, P., Riikonen, A., and Grimmond, C. S. B.: Spatial modeling of local-scale biogenic and anthropogenic carbon dioxide emissions in Helsinki, J. Geophys. Res.-Atmos., 124, 8363–8384, https://doi.org/10.1029/2018JD029576, 2019. a, b, c, d, e, f, g
Kalliokoski, T., Heinonen, T., Holder, J., Lehtonen, A., Mäkelä, A., Minunno, F., Ollikainen, M., Packalen, T., Peltoniemi, M., Pukkala, T., Salminen, O., Schelhaas, MJ., Seppälä, J., Vauhkonen, J., Kanninen, M.: Skenaarioanalyysi metsien Kehitystä Kuvaavien Mallien Ennusteiden Yhtäläisyyksistä ja Eroista, Finnish Climate Panel Report 2/2019, 88, (Suomen ilmastopaneeli), https://www.ilmastopaneeli.fi/wp-content/uploads/2019/02/Ilmastopaneeli_mets%C3%A4mallit_raportti_180219.pdf (last access: 5 May 2021), 2019. a, b
Karhu, K., Gärdenäs, A. I., Heikkinen, J., Vanhala, P., Tuomi, M., and Liski, J.: Impacts of organic amendments on carbon stocks of an agricultural soil – comparison of model-simulations to measurements, Geoderma, 189, 606–616, https://doi.org/10.1016/j.geoderma.2012.06.007, 2012. a
Kaye, J. P., McCulley, R., and Burke, I.: Carbon fluxes, nitrogen cycling, and soil microbial communities in adjacent urban, native and agricultural ecosystems, Glob. Change Biol., 11, 575–587, 2005. a
Lindén, L., Riikonen, A., Setälä, H., and Yli-Pelkonen, V.: Quantifying carbon stocks in urban parks under cold climate conditions, Urban For. Urban Gree., 49, 126633, https://doi.org/10.1016/j.ufug.2020.126633, 2020. a, b, c
Liski, J., Palosuo, T., Peltoniemi, M., and Sievänen, R.: Carbon and decomposition model Yasso for forest soils, Ecol. Model., 189, 168–182, https://doi.org/10.1016/j.ecolmodel.2005.03.005, 2005. a
Liski, J., Lehtonen, A., Palosuo, T., Peltoniemi, M., Eggers, T., Muukkonen, P., and Mäkipää, R.: Carbon accumulation in Finland's forests 1922–2004 – an estimate obtained by combination of forest inventory data with modelling of biomass, litter and soil, Ann. Forest Sci., 63, 687–697, https://doi.org/10.1051/forest:2006049, 2006. a
Liu, X., Li, T., Zhang, S., Jia, Y., Li, Y., and Xu, X.: The role of land use, construction and road on terrestrial carbon stocks in a newly urbanized area of western Chengdu, China, Landscape Urban Plan., 147, 88–95, https://doi.org/10.1016/j.landurbplan.2015.12.001, 2016. a
Lorenz, K. and Lal, R.: Managing soil carbon stocks to enhance the resilience of urban ecosystems, Carbon Manag., 6, 35–50, https://doi.org/10.1080/17583004.2015.1071182, 2015. a
Mäkelä, A., Kolari, P., Karimäki, J., Nikinmaa, E., Perämäki, M., and Hari, P.: Modelling five years of weather-driven variation of GPP in a boreal forest, Agr. Forest Meteorol., 139, 382–398, https://doi.org/10.1016/j.agrformet.2006.08.017, 2006. a, b
Marcotullio, P. J., Sarzynski, A., Albrecht, J., Schulz, N., and Garcia, J.: The geography of global urban greenhouse gas emissions: An exploratory analysis, Climatic Change, 121, 621–634, https://doi.org/10.1007/s10584-013-0977-z, 2013. a
Matamala, R., Gonzalez-Meler, M. A., Jastrow, J. D., Norby, R. J., and Schlesinger, W. H.: Impacts of fine root turnover on forest NPP and soil C sequestration potential, Science, 302, 1385–1387, https://doi.org/10.1126/science.1089543, 2003. a
McPherson, G., Simpson, J. R., Peper, P. J., Maco, S. E., and Xiao, Q.: Municipal forest benefits and costs in five US cities, J. Forest., 103, 411–416, 2005. a
McPherson, E. G., Simpson, J. R., Xiao, Q., and Wu, C.: Million trees Los Angeles canopy cover and benefit assessment, Landscape Urban Plan., 99, 40–50, 2011. a
Moore, G. W., Bond, B. J., Jones, J. A., and Meinzer, F. C.: Thermal-dissipation sap flow sensors may not yield consistent sap-flux estimates over multiple years, Trees, 24, 165–174, https://doi.org/10.1007/s00468-009-0390-4, 2010. a
Moyano, F. E., Vasilyeva, N., Bouckaert, L., Cook, F., Craine, J., Curiel Yuste, J., Don, A., Epron, D., Formanek, P., Franzluebbers, A., Ilstedt, U., Kätterer, T., Orchard, V., Reichstein, M., Rey, A., Ruamps, L., Subke, J.-A., Thomsen, I. K., and Chenu, C.: The moisture response of soil heterotrophic respiration: interaction with soil properties, Biogeosciences, 9, 1173–1182, https://doi.org/10.5194/bg-9-1173-2012, 2012. a
Myeong, S., Nowak, D. J., and Duggin, M. J.: A temporal analysis of urban forest carbon storage using remote sensing, Remote Sens. Environ., 101, 277–282, https://doi.org/10.1016/j.rse.2005.12.001, 2006. a
Nielsen, C. N., Buhler, O., and Kristoffersen, P.: Soil Water Dynamics and Growth of Street and Park Trees, Arboriculture and Urban Forestry, 33, 231, https://doi.org/10.48044/jauf.2007.027, 2007. a
Nowak, D. J. and Crane, D. E.: The Urban Forest Effects (UFORE) model: quantifying urban forest structure and functions, in: Integrated tools for natural resources inventories in the 21st century, edited by: Hansen, M. and Burk, T., Gen. Tech. Rep. NC-212, St. Paul, MN, U.S. Dept. of Agriculture, Forest Service, North Central Forest Experiment Station, 714–720, 2000. a, b
Offerle, B., Grimmond, C., and Oke, T. R.: Parameterization of net all-wave radiation for urban areas, J. Appl. Meteorol. Clim., 42, 1157–1173, https://doi.org/10.1175/1520-0450(2003)042<1157:PONARF>2.0.CO;2, 2003. a
Oke, T. R.: The energetic basis of the urban heat island, Q. J. Roy. Meteor. Soc., 108, 1–24, https://doi.org/10.1002/qj.49710845502, 1982. a, b
Parton, W. J., Stewart, J. W., and Cole, C. V.: Dynamics of C, N, P and S in grassland soils: a model, Biogeochemistry, 5, 109–131, https://doi.org/10.1007/BF02180320, 1988. a
Pataki, D. E., Alig, R., Fung, A., Golubiewski, N., Kennedy, C., McPherson, E., Nowak, D., Pouyat, R., and Romero Lankao, P.: Urban ecosystems and the North American carbon cycle, Glob. Change Biol., 12, 2092–2102, https://doi.org/10.1111/j.1365-2486.2006.01242.x, 2006. a, b, c
Pataki, D. E., Carreiro, M. M., Cherrier, J., Grulke, N. E., Jennings, V., Pincetl, S., Pouyat, R. V., Whitlow, T. H., and Zipperer, W. C.: Coupling biogeochemical cycles in urban environments: ecosystem services, green solutions, and misconceptions, Front. Ecol. Environ., 9, 27–36, https://doi.org/10.1890/090220, 2011. a
Pickett, S. T., Cadenasso, M. L., Grove, J. M., Boone, C. G., Groffman, P. M., Irwin, E., Kaushal, S. S., Marshall, V., McGrath, B. P., Nilon, C. H., Pouyat, R. V., Szlavecs, K., Troy, A., and Warren, P.: Urban ecological systems: Scientific foundations and a decade of progress, J. Environ. Manage., 92, 331–362, https://doi.org/10.1016/j.jenvman.2010.08.022, 2011. a, b
Pouyat, R. V., Yesilonis, I. D., and Nowak, D. J.: Carbon storage by urban soils in the United States, J. Environ. Qual., 35, 1566–1575, https://doi.org/10.2134/jeq2005.0215, 2006. a
Pouyat, R. V., Yesilonis, I. D., and Golubiewski, N. E.: A comparison of soil organic carbon stocks between residential turf grass and native soil, Urban Ecosyst., 12, 45–62, https://doi.org/10.1007/s11252-008-0059-6, 2009. a
Qian, Y., Bandaranayake, W., Parton, W., Mecham, B., Harivandi, M., and Mosier, A.: Long-term effects of clipping and nitrogen management in turfgrass on soil organic carbon and nitrogen dynamics: The CENTURY model simulation, J. Environ. Qual., 32, 1694–1700, https://doi.org/10.2134/jeq2003.1694, 2003. a, b
Raciti, S. M., Hutyra, L. R., Rao, P., and Finzi, A. C.: Inconsistent definitions of “urban” result in different conclusions about the size of urban carbon and nitrogen stocks, Ecol. Appl., 22, 1015–1035, https://doi.org/10.1890/11-1250.1, 2012. a
Raciti, S. M., Hutyra, L. R., and Newell, J. D.: Mapping carbon storage in urban trees with multi-source remote sensing data: Relationships between biomass, land use, and demographics in Boston neighborhoods, Sci. Total Environ., 500, 72–83, https://doi.org/10.1016/j.scitotenv.2014.08.070, 2014. a
Riikonen, A., Lindén, L., Pulkkinen, M., and Nikinmaa, E.: Post-transplant crown allometry and shoot growth of two species of street trees, Urban For. Urban Gree., 10, 87–94, https://doi.org/10.1016/j.ufug.2010.09.001, 2011. a, b, c, d, e, f, g, h
Riikonen, A., Järvi, L., and Nikinmaa, E.: Environmental and crown related factors affecting street tree transpiration in Helsinki, Finland, Urban Ecosyst., 19, 1693–1715, https://doi.org/10.1007/s11252-016-0561-1, 2016. a, b, c, d, e, f, g, h
Riikonen, A., Pumpanen, J., Mäki, M., and Nikinmaa, E.: High carbon losses from established growing sites delay the carbon sequestration benefits of street tree plantings–A case study in Helsinki, Finland, Urban For. Urban Gree., 26, 85–94, https://doi.org/10.1016/j.ufug.2017.04.004, 2017. a, b, c, d, e, f, g, h, i
Roman, L. A. and Scatena, F. N.: Street tree survival rates: Meta-analysis of previous studies and application to a field survey in Philadelphia, PA, USA, Urban For. Urban Gree., 10, 269–274, https://doi.org/10.1016/j.ufug.2011.05.008, 2011. a, b
Russo, A., Escobedo, F. J., Timilsina, N., Schmitt, A. O., Varela, S., and Zerbe, S.: Assessing urban tree carbon storage and sequestration in Bolzano, Italy, International Journal of Biodiversity Science, Ecosystem Services & Management, 10, 54–70, https://doi.org/10.1080/21513732.2013.873822, 2014. a, b
Sarzhanov, D., Vasenev, V., Sotnikova, Y. L., Tembo, A., Vasenev, I., and Valentini, R.: Short-term dynamics and spatial heterogeneity of CO2 emission from the soils of natural and urban ecosystems in the Central Chernozemic Region, Eurasian Soil Sci.+, 48, 416–424, https://doi.org/10.1134/S1064229315040092, 2015. a
Sarzhanov, D., Vasenev, V., Vasenev, I., Sotnikova, Y., Ryzhkov, O., and Morin, T.: Carbon stocks and CO2 emissions of urban and natural soils in Central Chernozemic region of Russia, Catena, 158, 131–140, https://doi.org/10.1016/j.catena.2017.06.021, 2017. a
Scharenbroch, B. C., Lloyd, J. E., and Johnson-Maynard, J. L.: Distinguishing urban soils with physical, chemical, and biological properties, Pedobiologia, 49, 283–296, https://doi.org/10.1016/j.pedobi.2004.12.002, 2005. a
Setälä, H. M., Francini, G., Allen, J. A., Hui, N., Jumpponen, A., and Kotze, D. J.: Vegetation type and age drive changes in soil properties, nitrogen, and carbon sequestration in urban parks under cold climate, Frontiers in Ecology and Evolution, 4, 93, https://doi.org/10.3389/fevo.2016.00093, 2016. a
Soares, A. L., Rego, F. C., McPherson, E., Simpson, J., Peper, P., and Xiao, Q.: Benefits and costs of street trees in Lisbon, Portugal, Urban For. Urban Gree., 10, 69–78, https://doi.org/10.1016/j.ufug.2010.12.001, 2011. a, b
Stewart, I. D. and Oke, T. R.: Local climate zones for urban temperature studies, B. Am. Meteorol. Soc., 93, 1879–1900, https://doi.org/10.1175/BAMS-D-11-00019.1, 2012. a
Stoffberg, G. H., Van Rooyen, M., Van der Linde, M., and Groeneveld, H.: Carbon sequestration estimates of indigenous street trees in the City of Tshwane, South Africa, Urban For. Urban Gree., 9, 9–14, https://doi.org/10.1016/j.ufug.2009.09.004, 2010. a
StromJan: StromJan/Raster4H: Final version, Zenodo [data set], https://doi.org/10.5281/zenodo.4005833, 2020. a, b
Sun, T. and Grimmond, S.: A Python-enhanced urban land surface model SuPy (SUEWS in Python, v2019.2): development, deployment and demonstration, Geosci. Model Dev., 12, 2781–2795, https://doi.org/10.5194/gmd-12-2781-2019, 2019. a, b
Sun, T., Wang, Z.-H., Oechel, W. C., and Grimmond, S.: The Analytical Objective Hysteresis Model (AnOHM v1.0): methodology to determine bulk storage heat flux coefficients, Geosci. Model Dev., 10, 2875–2890, https://doi.org/10.5194/gmd-10-2875-2017, 2017. a
Tang, Y., Sun, T., Luo, Z., Omidvar, H., Theeuwes, N., Xie, X., Xiong, J., Yao, R., and Grimmond, S.: Urban meteorological forcing data for building energy simulations, Build. Environ., 204, 108088, https://doi.org/10.1016/j.buildenv.2021.108088, 2021. a, b
Trammell, T., Pouyat, R., Carreiro, M., and Yesilonis, I.: Drivers of soil and tree carbon dynamics in urban residential lawns: a modeling approach, Ecol. Appl., 27, 991–1000, https://doi.org/10.1002/eap.1502, 2017. a, b
Tuomi, M., Thum, T., Järvinen, H., Fronzek, S., Berg, B., Harmon, M., Trofymow, J., Sevanto, S., and Liski, J.: Leaf litter decomposition – Estimates of global variability based on Yasso07 model, Ecol. Model., 220, 3362–3371, https://doi.org/10.1016/j.ecolmodel.2009.05.016, 2009. a
Vaccari, F. P., Gioli, B., Toscano, P., and Perrone, C.: Carbon dioxide balance assessment of the city of Florence (Italy), and implications for urban planning, Landscape Urban Plan., 120, 138–146, https://doi.org/10.1016/j.landurbplan.2013.08.004, 2013. a
Velasco, E., Segovia, E., Choong, A. M., Lim, B. K., and Vargas, R.: Carbon dioxide dynamics in a residential lawn of a tropical city, J. Environ. Manage., 280, 111752, https://doi.org/10.1016/j.jenvman.2020.111752, 2021. a, b
Viskari, T., Laine, M., Kulmala, L., Mäkelä, J., Fer, I., and Liski, J.: Improving Yasso15 soil carbon model estimates with ensemble adjustment Kalman filter state data assimilation, Geosci. Model Dev., 13, 5959–5971, https://doi.org/10.5194/gmd-13-5959-2020, 2020. a, b
Ward, H. C., Kotthaus, S., Järvi, L., and Grimmond, C. S. B.: Surface Urban Energy and Water Balance Scheme (SUEWS): development and evaluation at two UK sites, Urban Climate, 18, 1–32, https://doi.org/10.1016/j.uclim.2016.05.001, 2016. a, b, c, d, e, f, g, h, i
Weissert, L., Salmond, J., and Schwendenmann, L.: Variability of soil organic carbon stocks and soil CO2 efflux across urban land use and soil cover types, Geoderma, 271, 80–90, https://doi.org/10.1016/j.geoderma.2016.02.014, 2016. a, b
Zhao, C. and Sander, H. A.: Quantifying and mapping the supply of and demand for carbon storage and sequestration service from urban trees, PLoS One, 10, e0136392, https://doi.org/10.1371/journal.pone.0136392, 2015. a
- Abstract
- Introduction
- Materials and methods
- Results
- Discussion
- Conclusions
- Appendix A: Gap filling the meteorological data
- Appendix B: Specific urban processes used in CO2 models
- Code and data availability
- Author contributions
- Competing interests
- Disclaimer
- Acknowledgements
- Financial support
- Review statement
- References