the Creative Commons Attribution 4.0 License.
the Creative Commons Attribution 4.0 License.
 | 22 Apr 2022
Carbon, nitrogen, and phosphorus stoichiometry of organic matter in Swedish forest soils and its relationship with climate, tree species, and soil texture
Johan Stendahl
While the carbon (C) content of temperate and boreal forest soils is relatively well studied, much less is known about the ratios of C, nitrogen (N), and phosphorus (P) of the soil organic matter, as well as the abiotic and biotic factors that shape them. Therefore, the aim of this study was to explore carbon, nitrogen, and organic phosphorus (OP) contents and element ratios in temperate and boreal forest soils and their relationships with climate, dominant tree species, and soil texture. For this purpose, we studied 309 forest soils located all over Sweden between 56 and 68∘ N. The soils are a representative subsample of Swedish forest soils with a stand age >60 years that were sampled for the Swedish Forest Soil Inventory. We found that the N stock of the organic layer increased by a factor of 7.5 from −2.0 to 7.5 ∘C mean annual temperature (MAT), which is almost twice as much as the increase in the organic layer stock along the MAT gradient. The increase in the N stock went along with an increase in the N:P ratio of the organic layer by a factor of 2.1 from −2.0 to 7.5 ∘C MAT (R2=0.36, p<0.001). Forests dominated by pine had higher C:N ratios in the organic layer and mineral soil down to a depth of 65 cm than forests dominated by spruce. Further, also the C:P ratio was increased in the pine-dominated forests compared to forests dominated by other tree species in the organic layer, while the C:OP ratio in the mineral soil was not elevated in pine forests. C, N, and OP contents in the mineral soil were higher in fine-textured soils than in coarse-textured soils by a factor of 2.3, 3.5, and 4.6, respectively. Thus, the effect of texture was stronger on OP than on N and C likely because OP adsorbs very rigidly to mineral surfaces. Further, we found that the P and K concentrations of the organic layer were inversely related to the organic layer stock, while the N:P ratio was positively related to the organic layer stock. Taken together, the results show that the N:P ratio of the organic layer was most strongly related to MAT. Further, the C:N ratio was most strongly related to dominant tree species even in the mineral subsoil. In contrast, the C:P ratio was only affected by dominant tree species in the organic layer, but the C:OP ratio in the mineral soil was hardly affected by tree species due to the strong effect of soil texture on the OP concentration.
- Article
(3040 KB) - Full-text XML
-
Supplement
(406 KB) - BibTeX
- EndNote


Temperate and boreal forests store large amounts of soil organic matter (SOM) (Bradshaw and Warkentin, 2015; Tau-Strand et al., 2016; Hounkpatin et al., 2021). While most studies on SOM in temperate and boreal forests concentrated exclusively on carbon (C), and some studies also included nitrogen (N) and investigated the C:N ratio (Callesen et al., 2007; Cools et al., 2014; Tau-Strand et al., 2016), very few studies explored the phosphorus (P) content, as well as the C:P and N:P ratios of SOM in forests (for an exception see Tipping et al., 2016), particularly in North European forests. Thus, we lack knowledge about the stoichiometry of the organic matter of temperate and boreal forest soils and the factors that control it.
The N stock of well-drained temperate and boreal forest soils in northern Europe increases with increasing mean annual temperature (MAT) (Callesen et al., 2007). Yet, it is unknown whether organic P (OP) increases in the same way as N along the MAT gradient in northern Europe or if the N:P ratio of SOM changes with MAT in North European forest soils. If P availability is high enough to balance the elevated N availability at sites with high N availability and high MAT, the N:P ratio of SOM in North European forests will likely not change with MAT. However, several studies question whether P availability is sufficient to balance the high rates at which N is incorporated into plant biomass in N-rich European forests (Flückiger and Braun, 1998; Braun et al., 2010; Talkner et al., 2015; Jonard et al., 2015; Heuck et al., 2018). In particular, it has been suggested based on modeling exercises that high N availability in South Sweden might lead to P limitations in trees (indicated by a needle N:P ratio >12) in South Swedish forests (Akselsson et al., 2008; Yu et al., 2018), which likely translates into high N:P ratios of plant litter and potentially of SOM (Zechmeister-Boltenstern et al., 2015). Yet, on the other hand, it has to be considered that most soils in Scandinavia are only between 9000 and 14 000 years old. Thus, comparatively little P leaching and P occlusion has likely occurred during the short duration of pedogenesis, resulting probably in a relatively high P availability in soils of all climate regimes which should be able to balance the high N availability at sites with high MAT. Taken together, it is currently still an open question if and how the N:P ratio of SOM in Swedish forest soils changes with organic matter N stock and MAT.
Several studies showed that the C:N ratios of the organic layer and the mineral topsoil of forests in North Europe are affect by the dominant tree species (Vesterdal and Raulund-Rasmussen, 1998; Vesterdal et al., 2008; Hansson et al., 2011; Cools et al., 2014). In particular, it has been reported that the organic layers of pine forests have a higher C:N ratio than spruce and deciduous forests (Vesterdal and Raulund-Rasmussen, 1998; Vesterdal et al., 2008; Hansson et al., 2011; Cools et al., 2014). However, little is known about the C:N ratio in the mineral soil below the uppermost 10 cm. Furthermore, very little is known about the relationship between dominant tree species and the C:OP and N:OP ratios of the organic layer and the mineral soil in North European forests (for exceptions see Vesterdal and Raulund-Rasmussen, 1998; Hansson et al., 2011). Since N and P contents in leaf litter are strongly associated (McGroddy et al., 2004), it can by hypothesized that C:N and C:P ratios show similar differences between forests dominated by different tree species.
Besides climate and tree species, the SOM stoichiometry is likely also affected by soil texture. Recent research showed that OP is more strongly enriched in the clay-size fraction than organic C because OP compounds adsorb rigidly to mineral surfaces in soils (Spohn, 2020b). This suggests that OP has also higher concentrations in fine-textured than in coarse-textured soils because the adsorption of organic compounds protects them against microbial decomposition which thus should lead to a preferential enrichment of the compounds that adsorb particularly strongly in soils that provide many sorption sites. Further, it seems likely that besides OP, N is also enriched in fine-textured soils because a large part of N is present in SOM in the form of charged amino groups that can adsorb to charged surfaces (Knicker et al., 1993; Jones and Hodge, 1999; Kopittke et al., 2018; Miltner et al., 2009). However, previous studies on the effect of texture on the soil N concentration and the C:N ratios in North European forest soils arrived at contradicting conclusions (Vejre et al., 2003; Callesen et al., 2007).
The aim of this study was to explore the C, N, and OP contents and element ratios in temperate and boreal forest soils in Sweden and their relationships with climate, dominant tree species, and soil texture. We hypothesized, first, that while the N stock of the organic layer increases with increasing MAT, the N:P ratio of the organic layer does not change with MAT. We hypothesized, second, that the C:OP ratio of the organic layer and mineral soil shows similar differences between forests with different tree species to those of the C:N ratio. Third, we hypothesized that organic matter is richer in N and P in fine-textured than in coarse-textured mineral soils. In order to test these hypotheses, we studied 309 forest soils with a forest stand age >60 years located all over Sweden between 56 and 68∘ N. The soils are a representative subsample of Swedish forest soils with a stand age >60 years that were sampled for the Swedish Forest Soil Inventory. We selected sites with a stand age >60 years in order to minimize the effect of forest management (such as clear-cutting) on the results.
2.1 Data collection, sampling, and sample preparation
Data and soil samples were collected for the Swedish Forest Soil Inventory (SFSI), which has been conducted together with the National Forest Inventory (Riksskogstaxeringen) since 1923. The SFSI in its current form started in 1983 and monitors the state of the Swedish forests with respect to soil and vegetation. It covers all of Sweden except for arable land and urban areas. The inventory visits about 20 000 permanent plots over a 10-year period, sampling every year about 2000 plots distributed all over Sweden. Circular plots with 10 m radius are located in quadratic clusters on a triangular grid (Ranneby et al., 1987), which is denser towards the south of the country to account for the greater fragmentation of the landscape and a more diverse geology in the south of Sweden. Each quadratic cluster encompasses eight circular plots (four in the southwestern region; Ranneby et al., 1987). At each of these circular plots the dominant tree species is classified according to the following classes based on basal area: deciduous (birch, aspen, beech, and oak), mixed (which are mainly mixed coniferous forests), pine (Pinus sylvestris + Pinus contorta), and spruce (Picea abies). The diameter at breast height is determined for all trees, and from the differences over 10 years, the stem growth rate of the trees at plot level is calculated. A loss of one or more tree(s) can therefore result in a decline in standing volume between inventories and thus a negative stem growth rate. In addition, the stand age is determined from the stand history assessed by the repetitive inventory, together with wood coring in the 1980s.
Soil sampling is carried out on a subset of the circular plots, i.e., organic layer sampling on ca. 10 000 plots and mineral soil sampling on ca. 4500 plots. The organic layer is sampled volumetrically using a 10 cm diameter corer in a 3.14 m2 subplot within each circular plot throughout the entire depth of the organic layer (up to 30 cm depth), excluding the litter layer. To gain a sample of about 1.5 L, one to nine volumetric samples are combined. In addition, a small soil profile is prepared in the subplot. The soil order is determined according to WRB (World Reference Base; IUSS Working Group WRB, 2015), and mineral soil is collected at fixed depth intervals: 0–10, 10–20, and 55–65 cm. The texture of the mineral soil samples is determined in the field according to the following classes: clay, fine silt, coarse silt, fine sand, sand, and coarse sand. In the laboratory, all soil samples are dried to constant weight at 35 ∘C. The samples are homogenized and sieved (<2 mm), and living and dead roots >1 mm diameter are removed from the mineral soil samples. The samples are weighed, and the stock of the organic layer is calculated based on the weight of the fraction <2 mm. The organic layer stock is the mass of the organic layer on an area basis (t ha−1). Chemical analyses are carried out on the fine soil fraction (<2 mm).
For the present study, we selected plots (i) that have been sampled between 2013 and 2018, (ii) that were covered by forest with a long-term productivity >1m3 yr−1 and a stand age >60 years, (iii) that had the humus form mor or moder (which excludes peatlands and plots with humus form mull), and (iv) for which data on the concentration of P in the parent material (at a depth of 50 cm) were available (Olsson et al., 1993). We excluded plots with the humus form mull because at these plots, the mull humus is classified as an A horizon, and no organic layer is sampled for the SFSI. The plot selection based on these four criteria resulted in a total number of 309 plots, also called forests in the following (Fig. 1). Of these, 203 were Podzols, 84 were Regosols, 12 were Arenosols, 3 were Leptosols, 3 were Gleysols, 3 were Cambisols, and 1 soil was an Umbrisol. Two of the three Gleysols were covered by pine forest and the other one by spruce forest. The mean stand age was 113 years. Of the 309 sites, 119 sites had a stand age >120 years and are thus generally classified as old growth forests (not planted). Further, 25 sites were on formally set-aside land. Only 10 forests were classified as deciduous, with 5 of them being beech and oak forests.
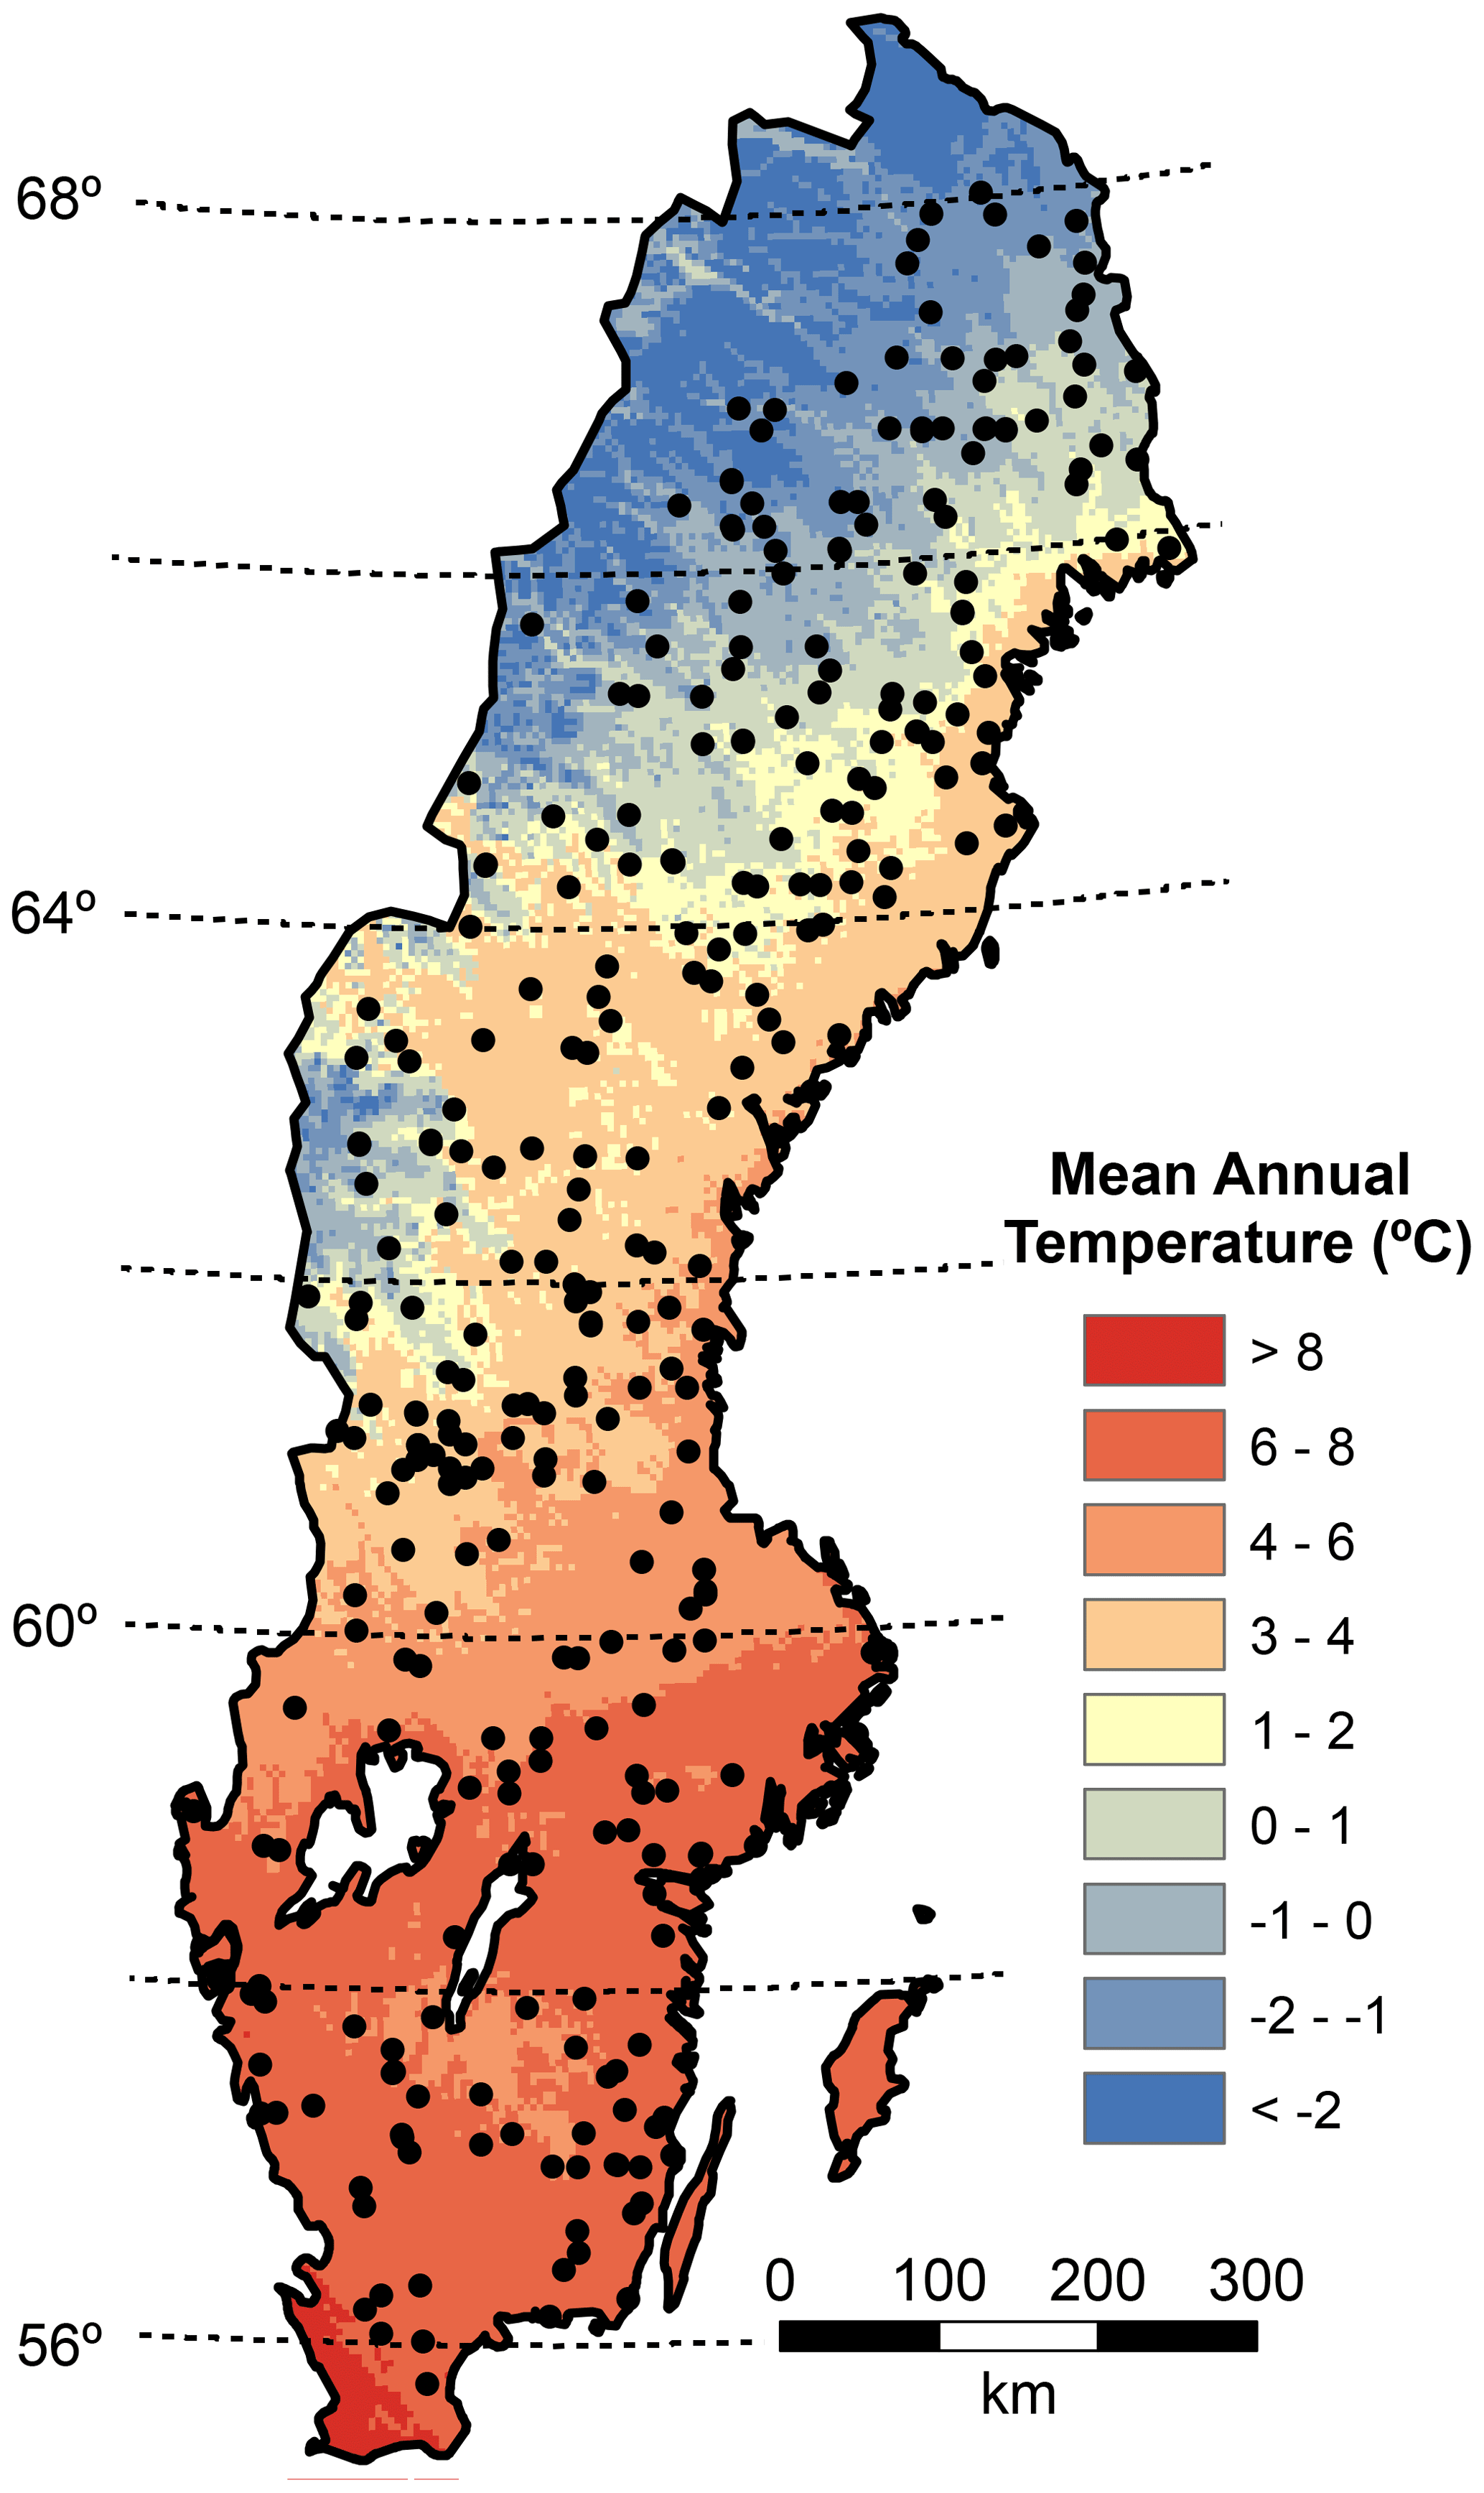
Figure 1Map depicting mean annual temperature (MAT), latitude, and the plot locations (black dots).
2.2 Soil chemical analyses and climate data
Most soil chemical analyses were conducted for the Swedish Forest Soil Inventory based on the samples taken between 2013 and 2018. The total C and N content was analyzed using an elemental analyzer (TruMac CN, LECO). The pH was determined in water (soil : water ratio 1:2.5) using a Pt electrode (Aquatrode Plus Pt1000, Metrohm). Exchangeable cations (Ca, Mg, Na, K, and Mn) were extracted in 1 M ammonium acetate buffered at pH 7.00 and analyzed by inductively coupled plasma optical emission spectroscopy (ICP-OES; Avio 200, Perkin Elmer).
In addition to the variables determined for the Swedish Forest Soil Inventory, we measured total P and organic P for the present study based on the samples taken between 2013 and 2018. Total P of the organic layer and the mineral soil at a depth of 0–10 cm was extracted in nitric acid and hydrogen peroxide (in a ratio of 1:3) in a microwave system (Ethos Easy, Milestone) according to the instructions of the manufacturer, and P was determined using ICP-OES (Avio 200, Perkin Elmer) after filtration of the extract.
Organic P in the mineral soil at a depth of 0–10 cm was determined according to Saunders and Williams (1955) and Williams and Saunders (1956) as specified in Pansu and Gautheyrou (2006). Briefly, each sample was separated in two aliquots, each of 1 g. The first aliquot was directly extracted in 0.5 M H2SO4 on a horizontal shaker for 16 h. The other aliquot was ignited at 550 ∘C for 2 h and subsequently extracted in H2SO4 in the same way as the non-ignited sample. Inorganic P was measured in the extracts by the molybdenum blue method according to Murphy and Riley (1962) using a continuous flow system (AA500, Seal). Total organic P was calculated as the difference between inorganic P in ignited and non-ignited samples.
Total C in this study is considered organic C since all soils were acidic. Furthermore, total P in the organic layer is considered to be organic P. For the mineral soil, we specify whether we refer to organic or total P in the following.
Total P in the parent material was determined on samples that were collected at the plots of the SFSI from the BC and C horizon in the 1980s. The samples were ground, sieved (<2 mm), ignited, and fused with lithium metaborate, and subsequently, total P was determined by ICP (Olsson et al., 1993).
Other data used in this study are mean annual temperature (MAT; from 2012), mean annual precipitation (MAP; from 2012), and total N deposition (NDep; from 1998) retrieved from the Swedish Meteorological and Hydrological Institute (https://www.smhi.se/data, last access: January 2017). We assume that the N deposition flux data of the year 1998 are representative for historic N deposition fluxes in Sweden during the last decades, which were highest in the 1990s.
2.3 Data analysis
For the analysis of soil texture, the texture class clay and fine silt was combined, as well as the texture class sand and coarse sand. Organic layer element stocks were calculated by multiplying the organic layer stock with the respective element concentration. All element ratios were calculated on a molar basis (mol mol−1). We calculated linear models, power functions, medians, and arithmetic means and conducted (multiple) regression analyses. For the regression analyses, all soil chemical variables (element stocks, element concentrations, and element ratios), as well as the organic layer stock and the P concentration in the parent material, were transformed by calculating their natural logarithm (log-transformation) since they tended to be not normally distributed but were right-skewed. In addition, also the variable atmospheric N deposition was log-transformed prior to regression analysis because it was not normally distributed. The variables latitude, MAT, and texture class were not transformed for the regression analysis. All significant regressions referred to in the text are significant at p<0.001 (if not indicated otherwise), and individual p values for specific regressions are given in the tables. Furthermore, we conducted ANOVA followed by Tukey's test after log-transformation of the data, and we considered p=0.05 as the threshold for significance. All data analyses were conducted using R (version 4.1.1, R Core Team, 2021).
3.1 Latitude, mean annual temperature, N deposition, and SOM stoichiometry
We found that many soil properties were correlated with latitude, MAT, and N deposition but hardly with MAP (Table 1). The log-transformed N stock of the organic layer was positively correlated with MAT (R2=0.30; Table 1) and with the log-transformed N deposition (R2=0.30) and negatively with latitude (R2=0.26; Table 1). In the linear model fitted to the data, the N stock of the organic layer increased by a factor of 7.5 from 192 kg ha−1 at −2.0 ∘C MAT to 1439 kg ha−1 at 7.5 ∘C MAT (Fig. 2a).
Table 1Results of the regression analyses (adjusted R2, p value) for the organic layer, mineral soil (0–10 cm), and parent material in 309 Swedish forest soils (n=309). The signs + and − indicate positive and negative regressions, respectively.
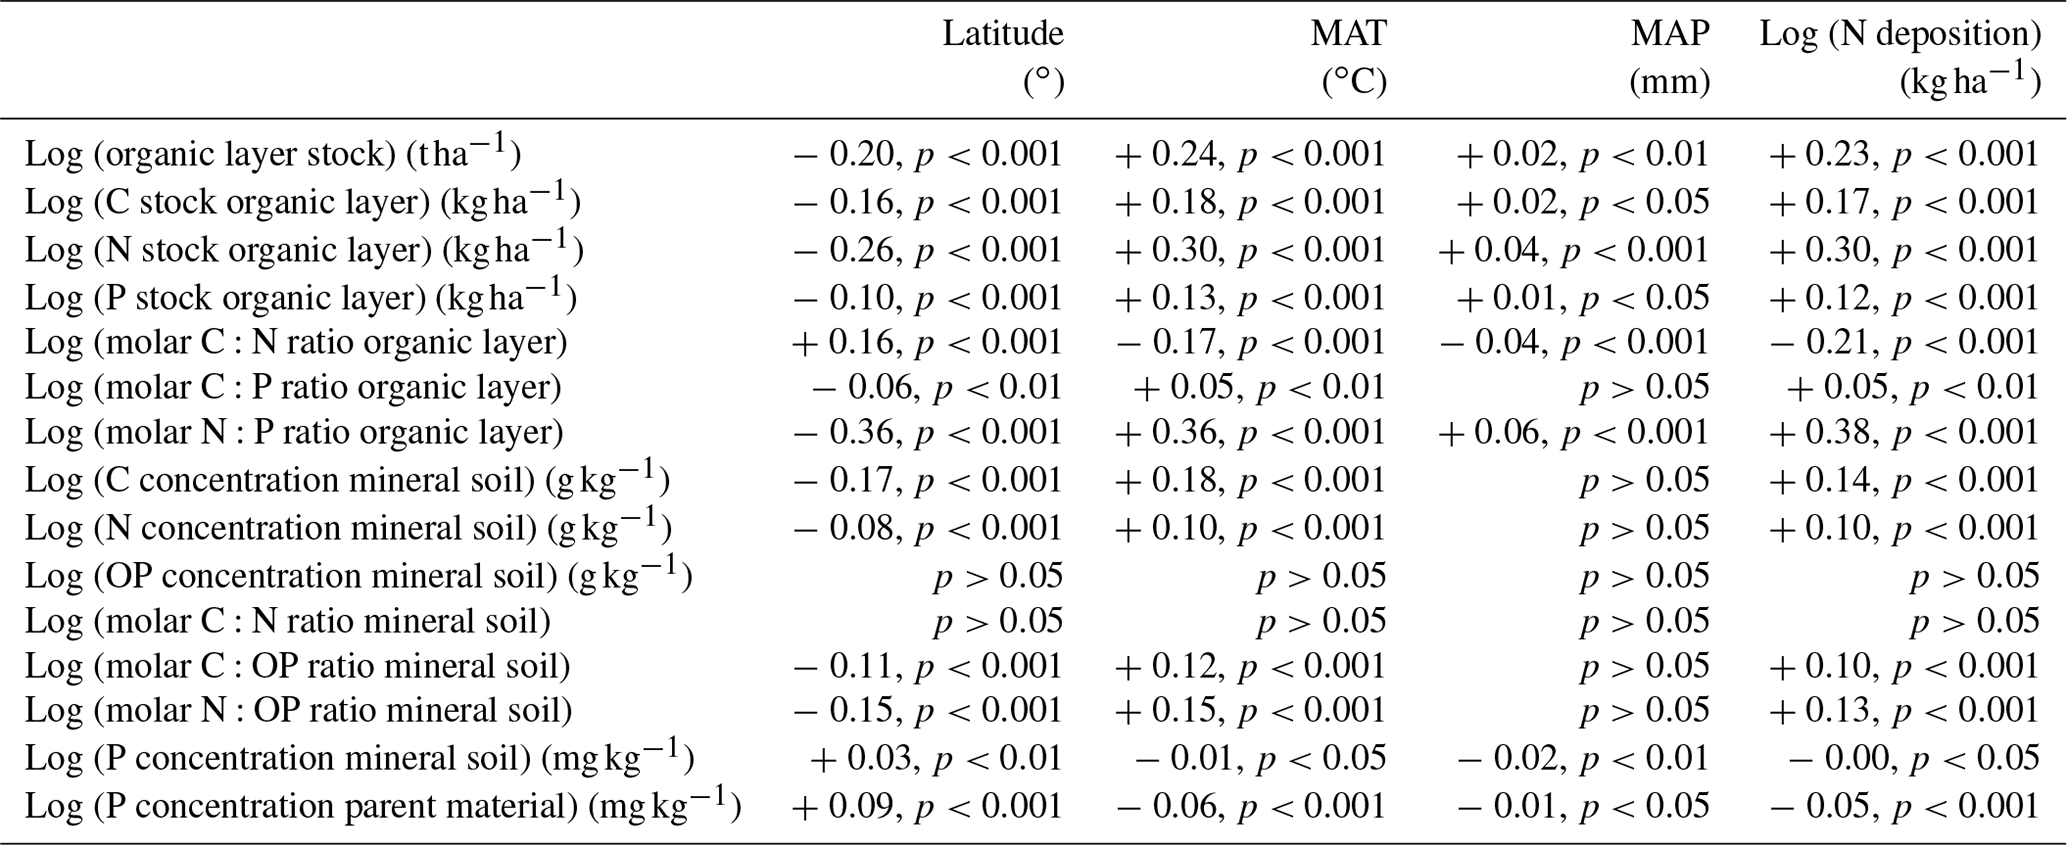
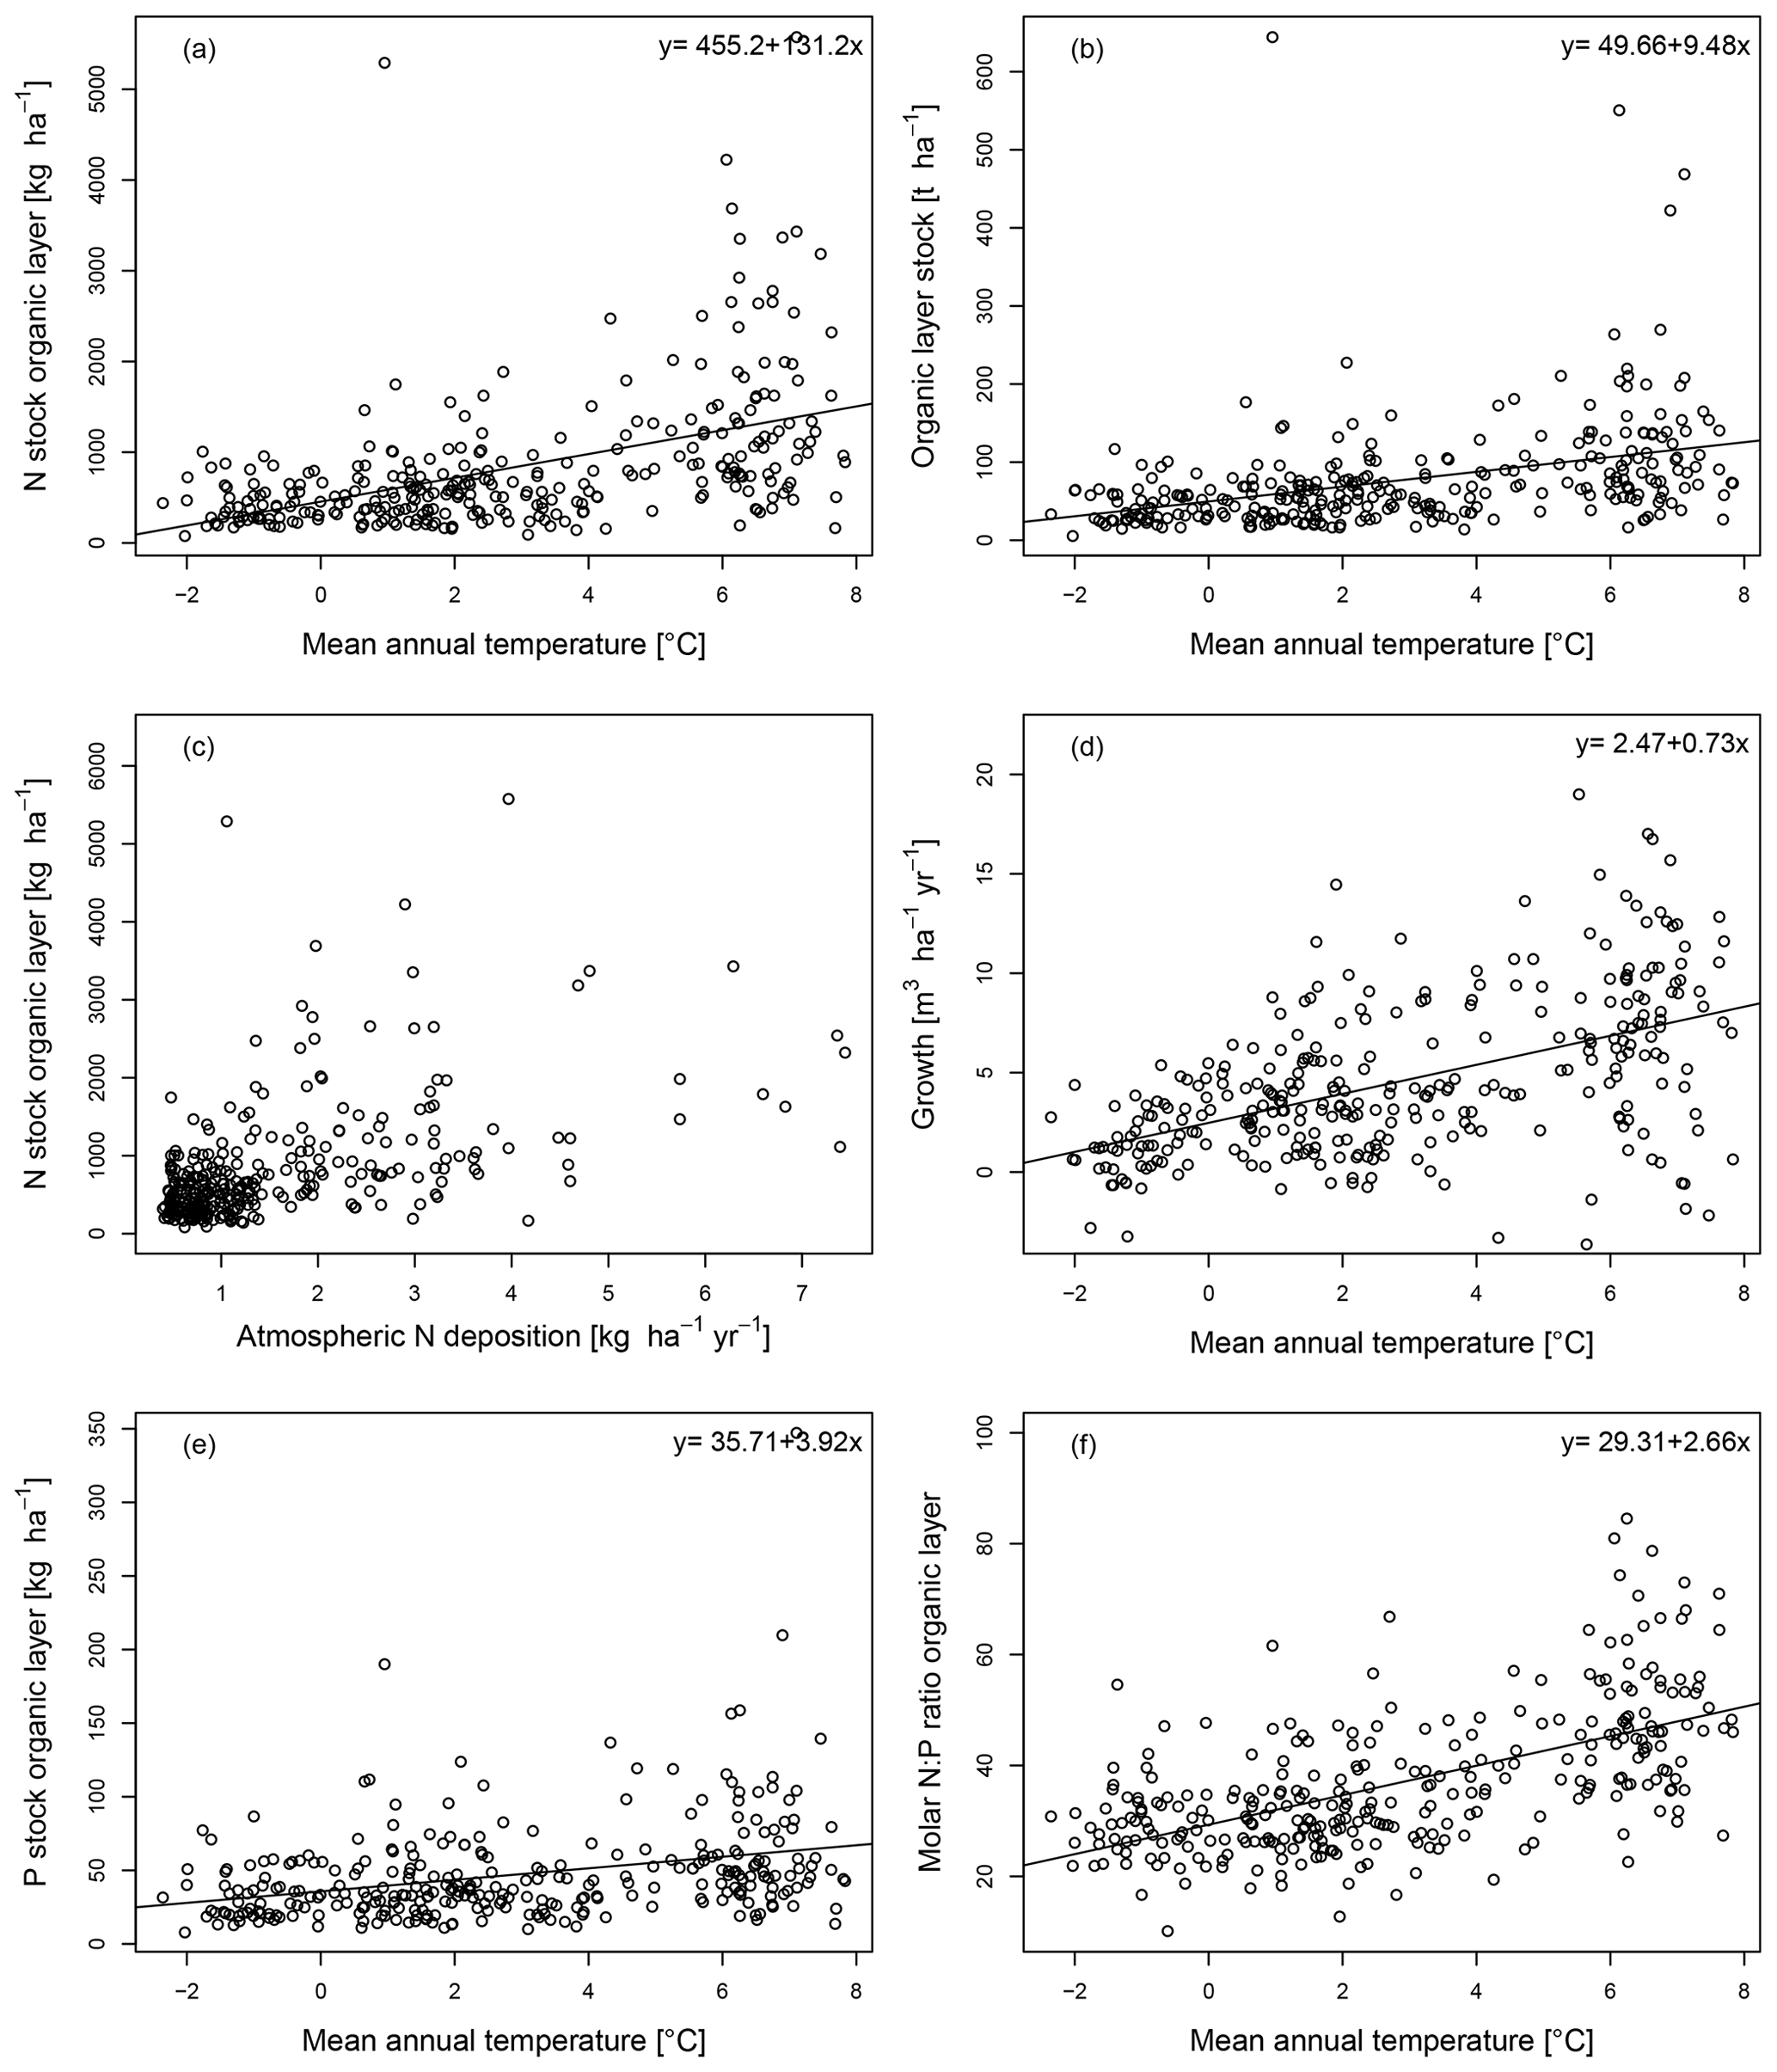
Figure 2The nitrogen (N) stock of the organic layer (a) and the organic layer stock (b) as a function of mean annual temperature, together with the N stock of the organic layer as a function of atmospheric N deposition (c), as well as tree stem growth (d), the P stock of the organic layer (e), and the molar nitrogen-to-phosphorus (N:P) ratio of the organic layer (f) as a function of mean annual temperature in 309 Swedish forest soils with a stand age >60 years.
The log-transformed organic layer stock was positively correlated with MAT (R2=0.24; Table 1) and with the log-transformed N deposition (R2=0.23) and negatively with latitude (R2=0.20; Table 1). In the linear model fitted to the data, the organic layer stock increased by a factor of 3.9 from 30.7 t ha−1 at −2.0 ∘C MAT to 120.8 t ha−1 at 7.5 ∘C MAT (Fig. 2b).
Atmospheric N deposition was below 1.5 in most forests, but in some, it was higher, and in eight forests it was even between 5.5 and 8 (Fig. 2c). The forests with the highest N deposition rate had mostly intermediately high organic layer N stocks; thus the N deposition rate and the N stock of the organic layer were only loosely related (Fig. 2c).
Tree stem growth was positively correlated with MAT (R2=0.27), and it increased by a factor of 2.5 from 1.87 at −2.0 ∘C MAT to 4.72 at 7.5 ∘C (Fig. 2d).
The log-transformed C:N ratio of the organic layer was negatively correlated with MAT (R2=0.17; Table 1) and with the log-transformed N deposition (R2=0.21) and positively with latitude (R2=0.16; Table 1). In the linear model fitted to the data, the molar C:N ratio of the organic layer decreased from 55.3 at −2.0 ∘C MAT to 37.8 at 7.5 ∘C MAT (Fig. 2d).
The log-transformed P stock of the organic layer was positively correlated with MAT (R2=0.13, Table 1) and with the log-transformed N deposition (R2=0.12) and negatively with latitude (R2=0.10; Table 1). In the linear model fitted to the data, the P stock of the organic layer increased by a factor of 2.3 from 28 kg ha−1 at −2.0 ∘C MAT to 65 kg ha−1 at 7.5 ∘C MAT (Fig. 2e).
The log-transformed N:P ratio of the organic layer was positively correlated with MAT (R2=0.36, Table 1) and the log-transformed N deposition (R2=0.38) and negatively with latitude (R2=0.36). In the linear model fitted to the data, the N:P ratio of the organic layer increased by a factor of 2.1 from 24.0 at −2.0 ∘C MAT to 49.3 at 7.5 ∘C MAT (Fig. 2f).
The log-transformed C:P ratio of the organic layer was only weakly positively (R2=0.05) correlated with MAT and the log-transformed N deposition and negatively with latitude (Table 1). Furthermore, C and N concentrations in the mineral soil were only weakly positively correlated with MAT and the log-transformed N deposition and negatively with latitude (Table 1).
In most soils, the P concentration of the parent material was below 1.0 g kg−1, but in a small number of forests, it was substantially higher, up to 3.4 g kg−1. The P concentration of the soil parent material and the total P concentration of the upper 10 cm of the mineral soil were only very weakly negatively correlated with MAT and positively with latitude (Table 1).
3.2 Dominant tree species and SOM stoichiometry
The C:N ratio of the organic layer differed between forests with different dominant tree species (Fig. 3a). The C:N of the organic layer was highest in pine forests, on average 1.8 times higher than in deciduous forests, and 1.3 times higher than in spruce forests (Fig. 3a). A similar relationship between forests dominated by different tree species was observed for the C:N ratio in the mineral soil (Fig. 3b–d). At a depth of 55–65 cm, the C:N ratio of the mineral soil in pine forests was on average 1.8 times higher than in deciduous forests and 1.2 times higher than in spruce forests (Fig. 3d), similar to the organic layer. Some pine forests had very high C:N and C:P ratios due to low N and P contents. It needs to be taken into account that there is some uncertainty regarding the samples with very low N and P concentrations since the determination of N and P contents in very nutrient-poor samples is more strongly affected by sample inhomogeneity than the measurement of nutrient-rich samples.
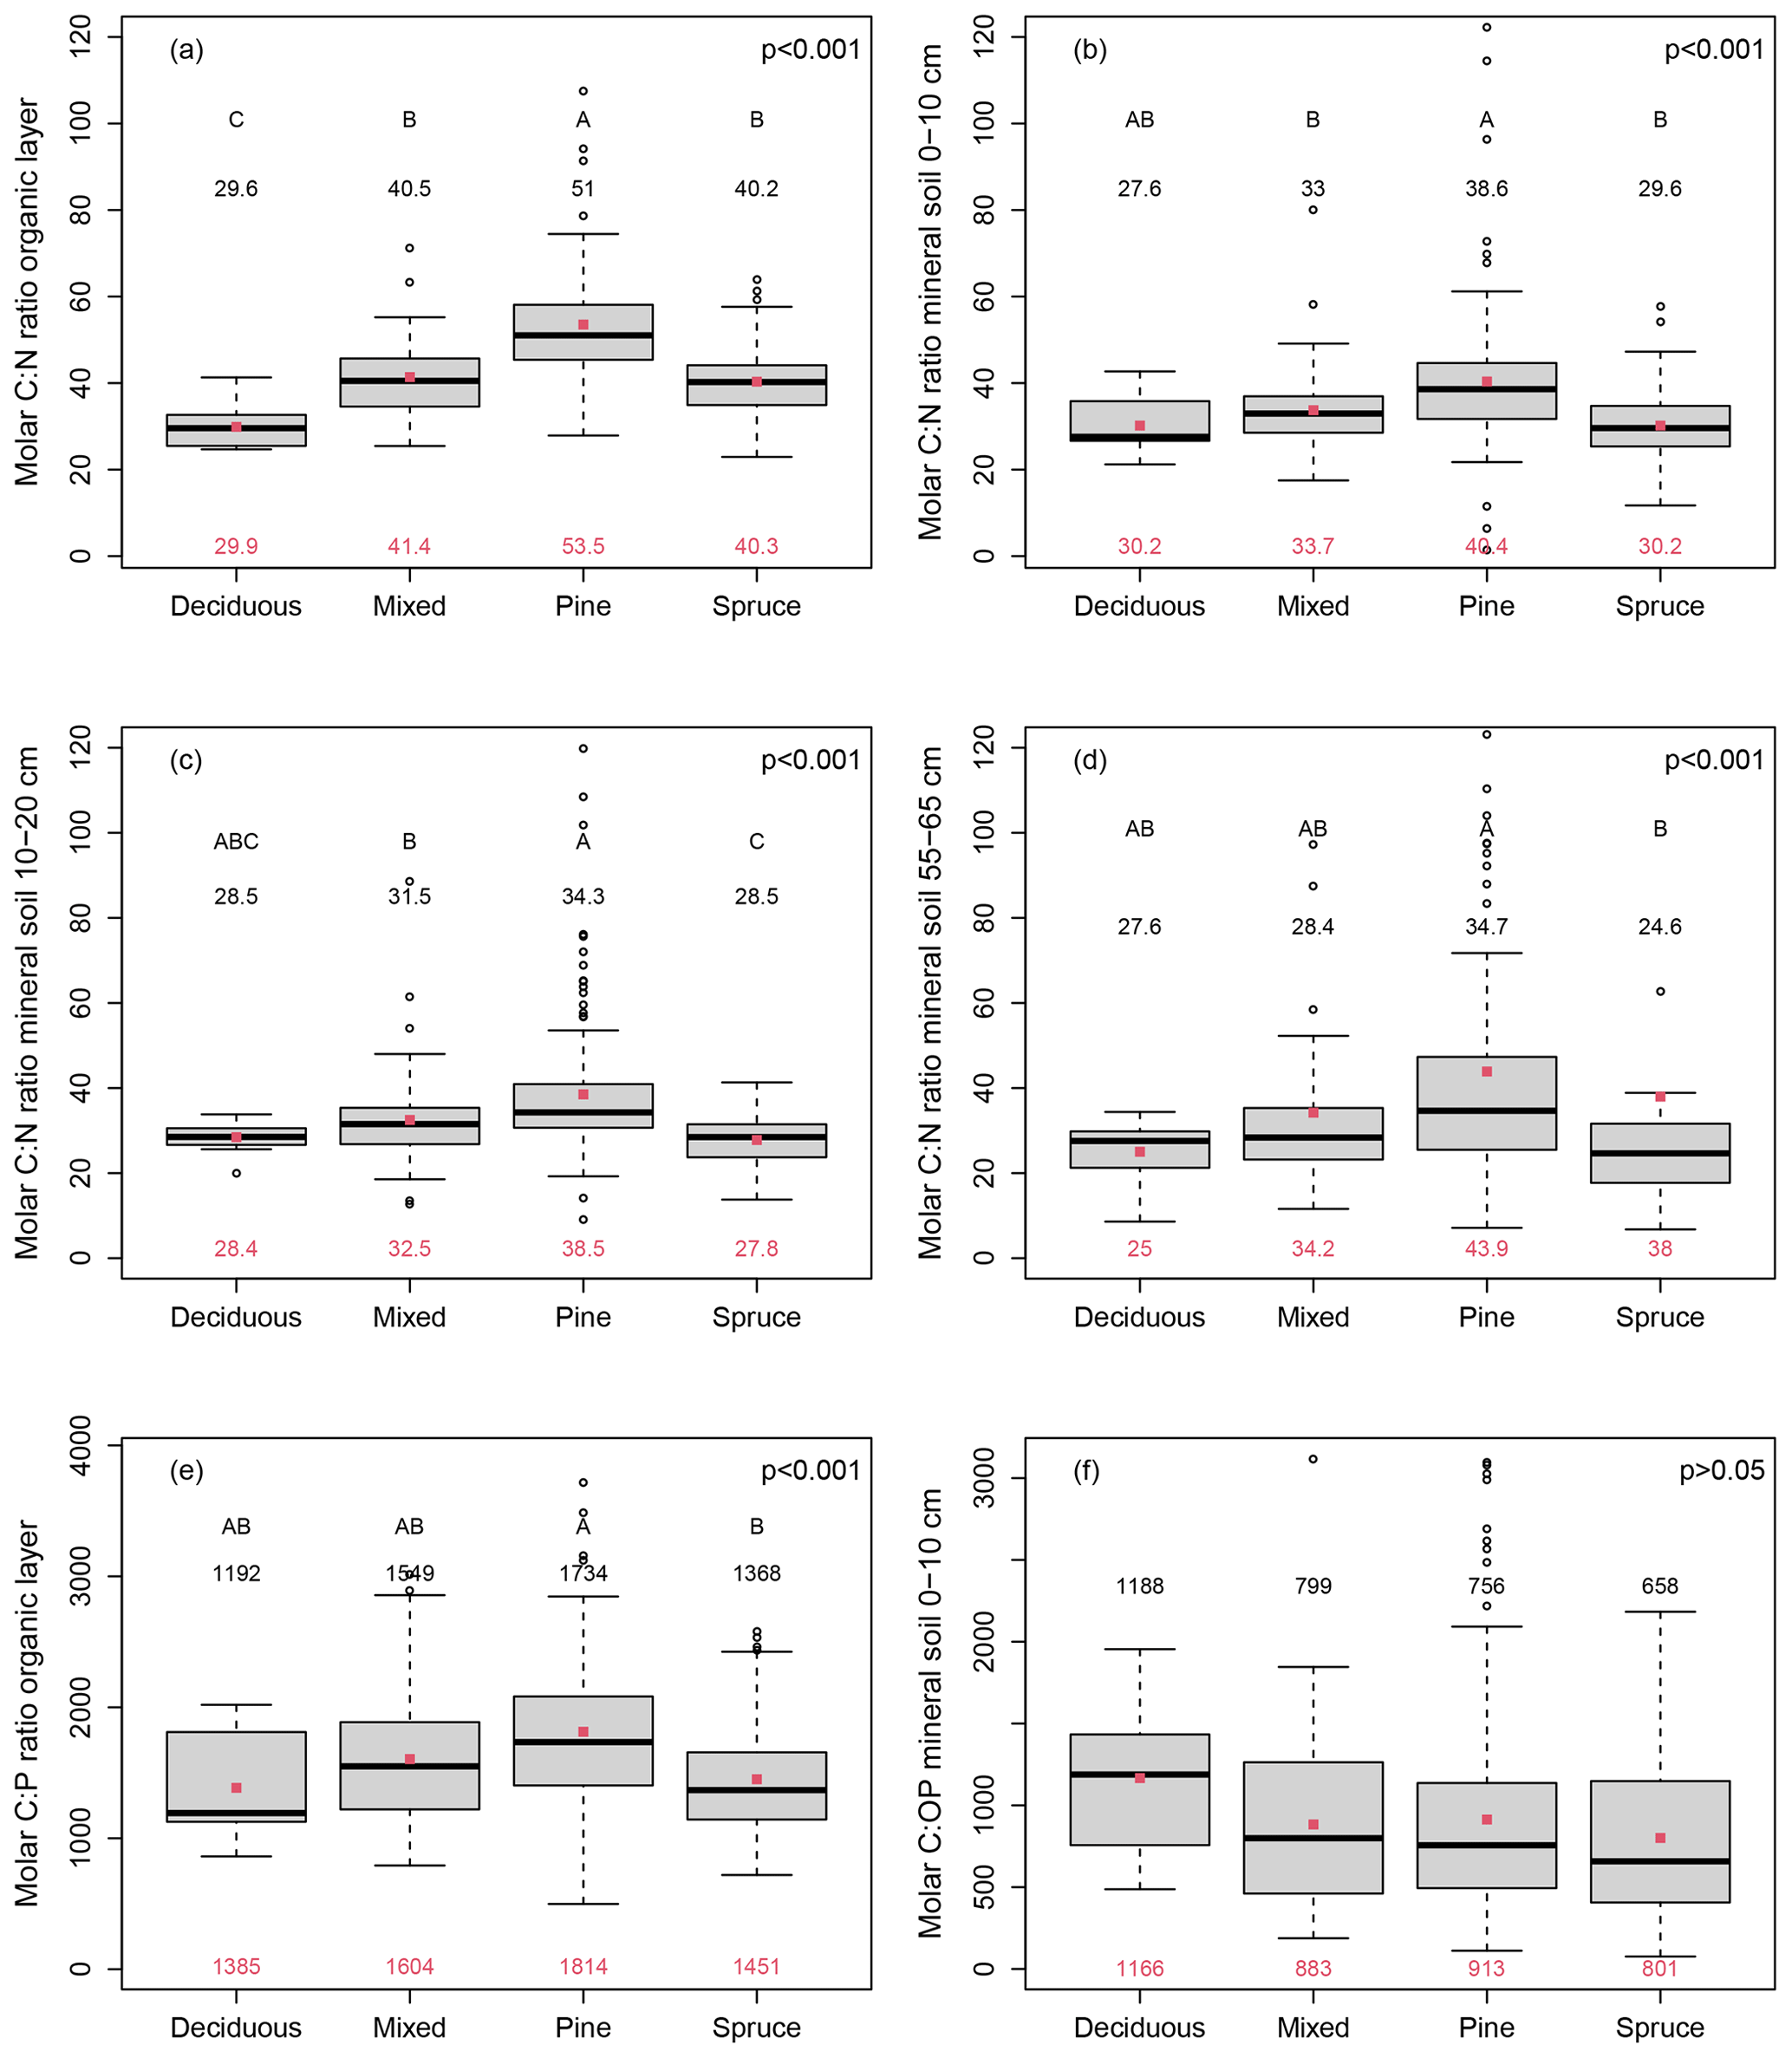
Figure 3Molar carbon-to-nitrogen (C:N) ratio of the organic layer (a) and the mineral soil at 0–10 cm depth (b), 10–20 cm depth (c), and 55–65 cm depth (d), as well as the molar carbon-to-phosphorus (C:P) ratio of the organic layer (e) and the molar carbon-to-organic phosphorus (C:OP) ratio in the mineral soil at 0–10 cm depth (f) depending on the dominant tree species (deciduous n=10, mixed n=67, pine n=144, and spruce n=88). Please notice that mixed refers to mixed pine and spruce forests. Black numbers give the median, and red dots and red numbers depict the arithmetic mean. Different capital letters indicate statistically significant differences (p<0.05) between plots with different dominant tree species, while the p value of the ANOVA is indicated in the right corner of each panel.
The C:P ratio of the organic layer (Fig. 3e) followed a similar pattern as the C:N ratio across forests with different dominant tree species, and the C:P ratio of the organic layer in pine forests was on average 1.3 times higher than in both deciduous and spruce forests (Fig. 3e). In contrast, the C:OP ratio in the mineral soil was not elevated in pine forests but in deciduous forests (Fig. 2f). The N:P ratio was elevated in deciduous forests but did not significantly differ between pine and spruce forests (Fig. S2a in the Supplement). The organic layer stock differed also between forests with different dominant tree species (Fig. S2b). In deciduous forests, it was on average 2.2 times higher than in pine forests and 1.9 times higher than in spruce forests.
3.3 Texture and SOM stoichiometry
Concentrations of C, N, and OP in the uppermost 10 cm of the mineral soil were highest in soils with the texture clay or fine silt (Fig. 4a–c). The concentrations of C, N, and OP decreased gradually with increasing particle size (Fig. 4a–c). C, N, and OP concentrations were higher in soils with the texture clay or fine silt than in soils with the texture sand or coarse sand by a factor of 2.3, 3.5, and 4.6, respectively (Fig. 4a–c). Thus, the differences in element concentrations between soils with different textures were largest for OP and decreased in the order . In contrast to OP, the total P concentration did not differ between soils with the texture class sand, find sand, or coarse sand. Only soils with the texture clay had elevated P concentrations compared to soils of the other three texture classes by a factor of 1.9, but the differences between the texture classes were not statistically significant (p>0.05, Fig. S3 in the Supplement). The C:N ratio and the C:OP ratio in the mineral soil (0–10 cm depth) increased gradually with increasing particle size (Fig. 4d and e). The mean C:N ratio and C:OP ratio were 1.5 and 1.4 times lower in soils with the texture clay or fine silt than in soils with the texture sand or coarse sand (Fig. 4d and e).
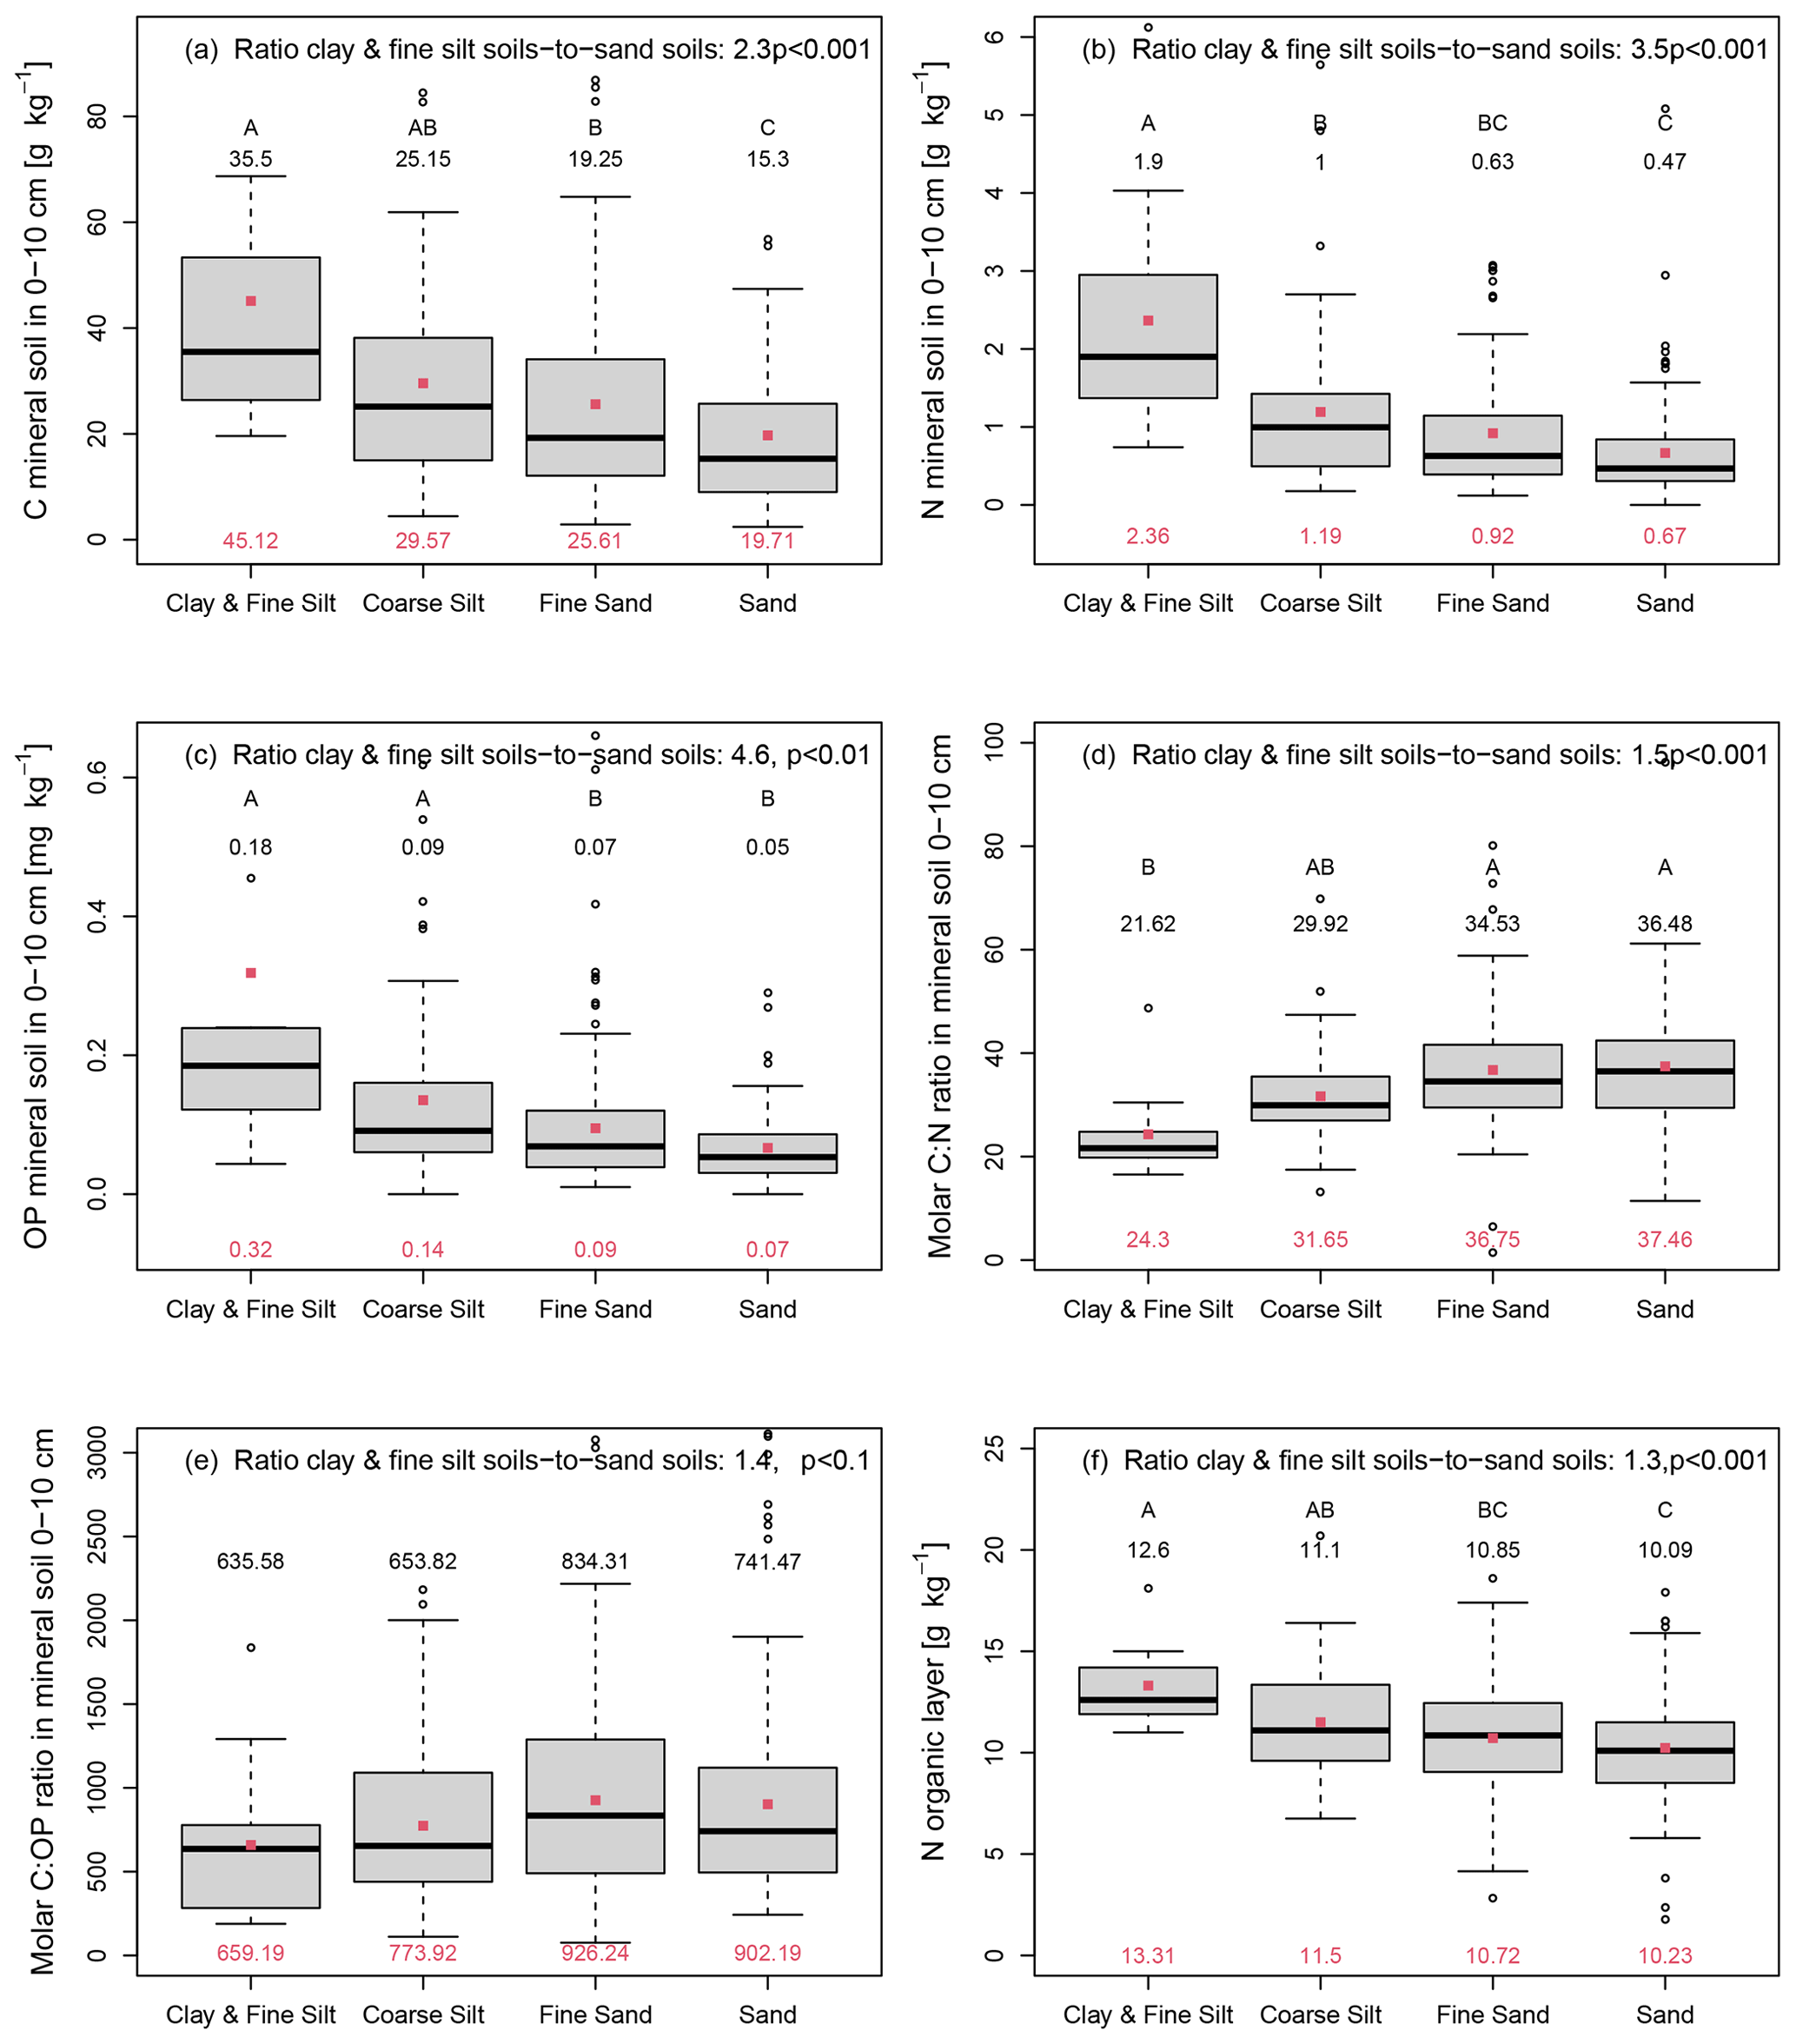
Figure 4Carbon (a), nitrogen (b), and organic phosphorus (c) concentrations, the molar carbon-to-nitrogen (C:N) ratio (d), and the molar carbon-to-organic phosphorus (C:OP) ratio (e) in the mineral soil at a depth of 0–10 cm, as well as the nitrogen (N) concentration of the organic layer (f) depending on the soil texture (clay and fine silt n=11, coarse silt n=52, fine sand n=136, and sand n=110) in 309 Swedish forest soils with a stand age >60 years. The texture class called sand encompasses sand and coarse sand. The indicated ratio of clay and fine silt soil-to-sand soils is the mean ratio. Black numbers give the median, and red dots and red numbers depict the arithmetic mean. Different capital letters indicate statistically significant differences (p<0.05) between the soils of different texture classes, while the p value of the ANOVA is indicated in the right corner of each panel.
Different soil textures were also associated with differences in the N concentration of the organic layer (Fig. 4f). The mean N concentration of the organic layer increased with decreasing particle size, and it was 1.3 times higher in soils with the texture clay and fine silt than in soils with the texture sand and coarse sand (Fig. 4f).
3.4 Organic layer stock and element contents
The organic layer stock was inversely related to the concentration of exchangeable K in a nonlinear way (Fig. 5a), and the variables were correlated when log-transformed (R2=0.38; Fig. 5b). Further, the organic layer stock was also inversely related to its P concentration in a nonlinear way (Fig. 5c), and the variables were correlated (R2=0.27; Fig. 5d). The log-transformed organic layer stock was only weakly negatively correlated with the log-transformed P concentration of the parent material and the P concentration of the uppermost 10 cm of the mineral soil (both R2=0.03, p<0.01). The organic layer stock was also positively linearly related to the organic layer N:P ratio (Fig. 5e), and the log-transformed variables were correlated (R2=0.25; Fig. 5f). In contrast, the organic layer stock was not significantly related to the N concentration of the organic layer and only very weakly with its C:N ratio (R2=0.03).
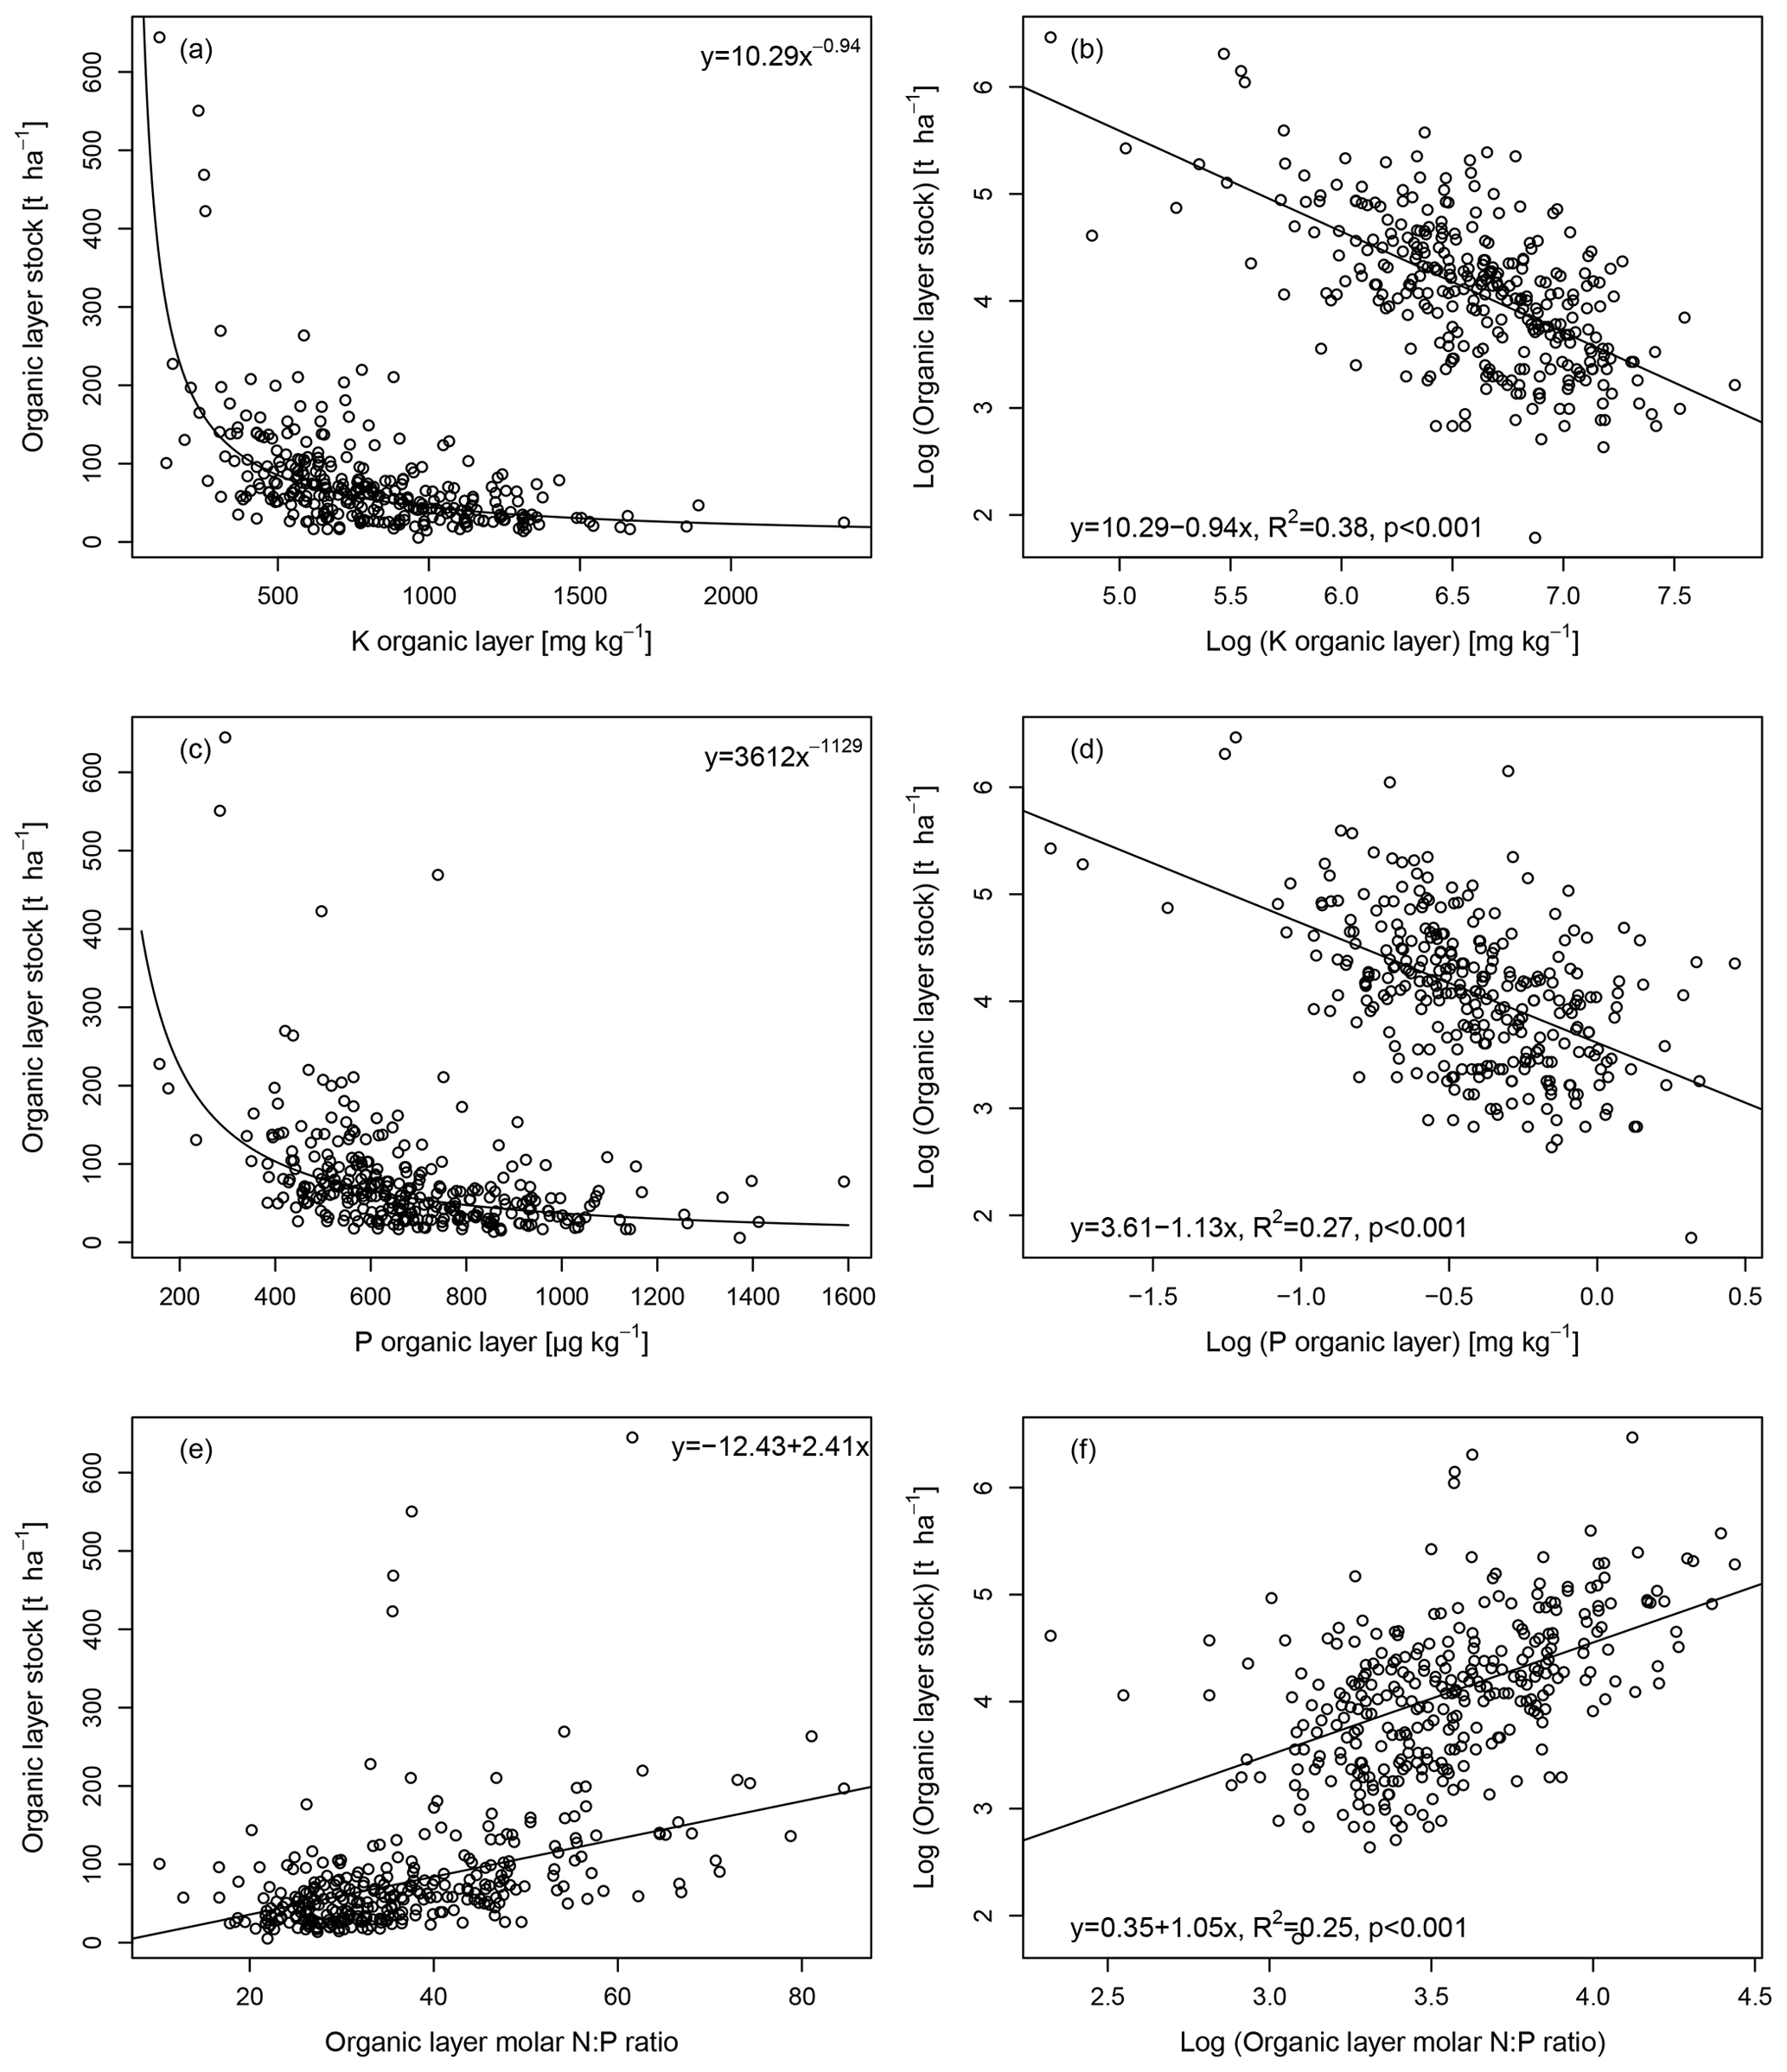
Figure 5The organic layer stock as a function of the organic layer K concentration shown for the original data with a power function (a) and the log-transformed data with a linear model (b), as well as the organic layer stock as a function of the organic layer P concentration shown for the original data with a power function (c), the log-transformed data with a linear model (d), and the organic layer stock as a function of the organic layer molar N:P ratio shown for the original data (e) and the log-transformed data with a linear model (f).
The log-transformed concentrations of K and P of the organic layer were positively correlated (R2=0.67, Fig. S4a in the Supplement). In addition, the log-transformed concentrations of N and Mg in the organic layer were strongly positively correlated (R2=0.81, Fig. S4b). In the organic layer, log-transformed C and N stocks (R2=0.87), as well as C and P (R2=0.75) and N and P (R2=0.83) stocks, were strongly correlated (Fig. S5a, c, and e in the Supplement). In the uppermost 10 cm of the mineral soil, log-transformed C and N concentrations were also strongly correlated (R2=0.79, Fig. S5b). Further, the log-transformed C and P (R2=0.47) and N and P (R2=0.49) concentrations in the uppermost 10 cm of the mineral soil were also positively correlated (Fig. S5d and f).
3.5 Covariance
Latitude and MAT were strongly negatively correlated (R2=0.88). Further, the log-transformed N deposition rate was strongly negatively correlated with latitude (R2=0.78) and strongly positively with MAT (R2=0.82). Deciduous forests had a lower latitude than all other forests, while mixed, pine, and spruce forests did not differ significantly in latitude (Fig. S6a in the Supplement). Further, the latitude of plots with different soil texture did not vary significantly (Fig. S6b). Spruce forests had a higher texture class, i.e., a finer soil texture than mixed and pine forests, while there was no significant difference in texture between deciduous, mixed, and pine forests (Fig. S6c).
3.6 Multiple regressions
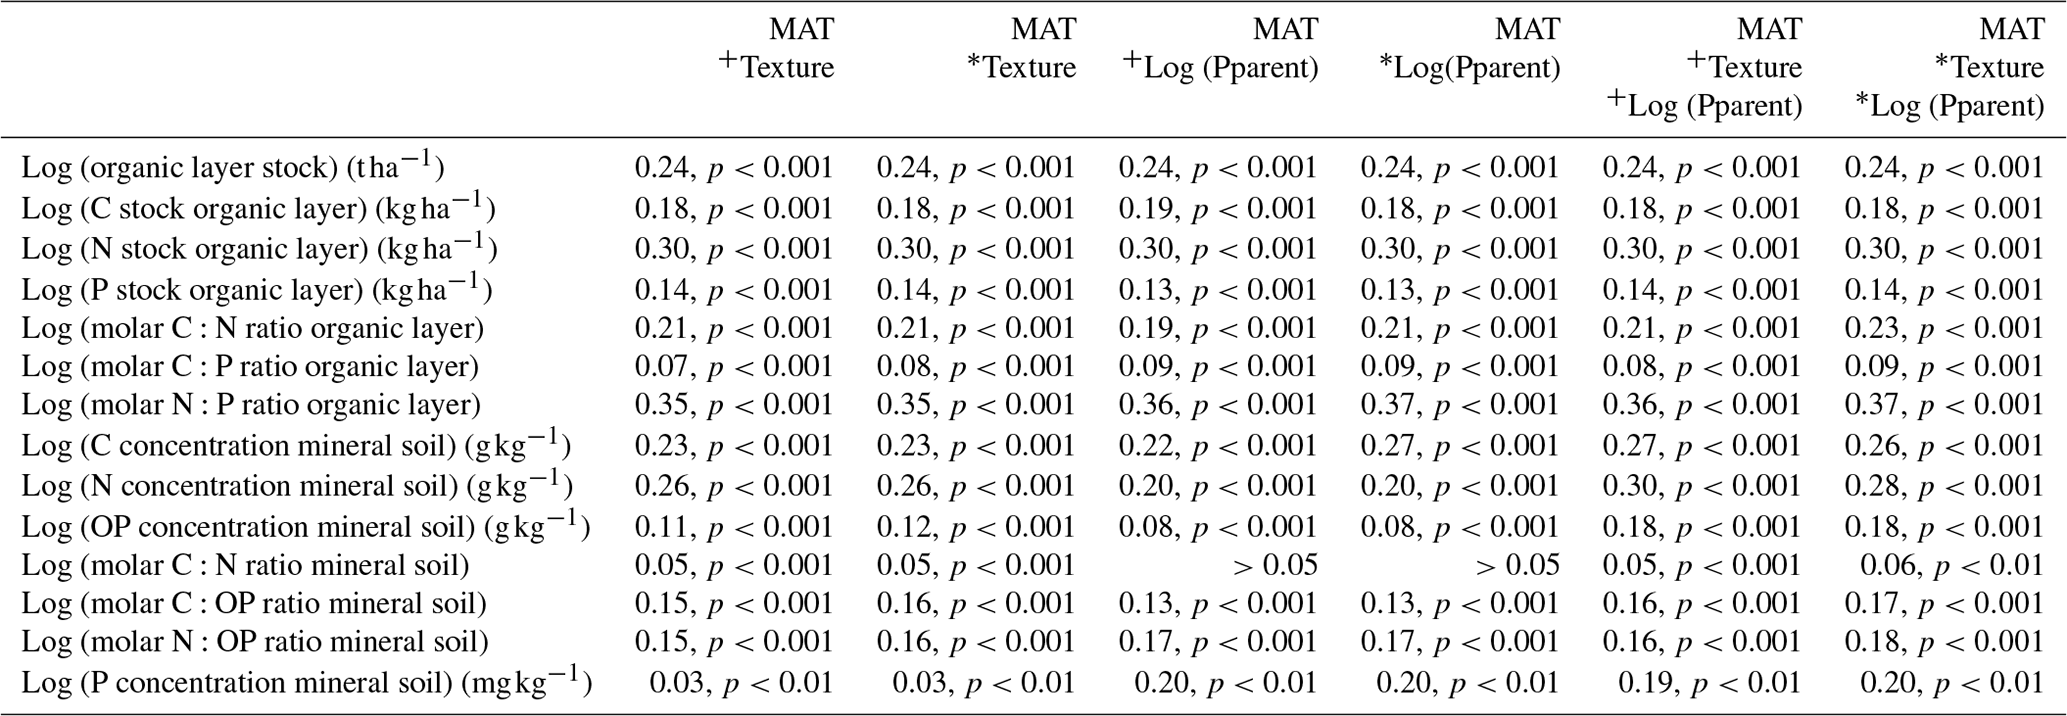
We tested if we could improve the regressions between MAT and several soil properties (Table 1) by including data on texture and the P concentration of the parent material (Table 2). The log-transformed C and total P concentrations of the mineral soil (0–10 cm) could be better predicted by the combination of MAT and the log-transformed P concentration of the parent material (Table 2) than by only MAT (Table 1). The prediction of the OP concentration of the mineral soil (0–10 cm) improved when soil texture was included together with MAT and the log-transformed P concentration of the parent material (Table 2). Further, also the C:OP and N:OP ratios could be better predicted by the combination of MAT, soil texture, and the P concentration of the parent material (Table 2) than by only MAT (Table 1). For other variables, the improvement of the prediction was smaller, independent of whether the models included interactions between the independent variables or not.
Table 2Results of the multiple regression analyses (adjusted R2, p value) with (*) and without (+) interactions of the independent variables for the organic layer and mineral soil (0–10 cm) in 309 Swedish forest soils (n=309). Pparent stands for the P concentration of the parent material.
4.1 The organic layer stock is related to MAT, as well as P and K
We found a positive relationship between the organic layer stock and MAT (Fig. 2b). This relationship is in accordance with Akselsson et al. (2005) showing stronger C accumulation in the organic layer in the south than in the north of Sweden, as well as with Stendahl et al. (2010) reporting a positive relationship between the soil C stock and the temperature sum for forests in Sweden. The positive relationship between the organic layer stock and MAT (Fig. 2b) suggests that plant productivity (Fig. 2d) increases more strongly than decomposition from northern to southern Sweden, which is likely due to differences in the temperature regime among the plots (Akselsson et al., 2005; Högberg et al., 2021).
In addition, it could also be that decomposition is affected by the P concentration or the N:P ratio of the organic layer which varies considerably along the MAT gradient (Fig. 2f). We found a positive relationship between the N:P ratio of the organic layer and the organic layer stock (Fig. 5e and f), which is largely caused by a negative relationship between the organic layer stock and its P concentration (Fig. 5c and d). The reasons for this negative relationship might be a higher contribution of fine woody debris, which is P-poor (Spohn, 2020a), to the organic layer in forests with high organic layer stock. Further, it could be that the decomposition rate of the organic layer is positively related to the organic layer P concentration. This is supported by a study showing that P is the most limiting element for microbial activity during the first phase of decomposition of pine needles in Sweden (Staaf and Berg, 1982) and by a meta-analysis reporting that the decomposition rate decreased with increasing C:P ratio of plant detritus across different ecosystems (Zechmeister-Boltenstern et al., 2015).
The organic matter stock was also negatively related to the concentration of exchangeable K (Fig. 5a and b). This finding is in agreement with the relationship reported by Stendahl et al. (2017) about the C stock of the organic layer and both its K and Mn concentration. The reason for this negative correlation could be faster leaching of K from thinner rather than from more massive organic layers (Osono and Takeda, 2004; Schlesinger, 2021). In addition, it could be that there is a relatively high contribution of fine-wood debris, which is K-poor, to the more massive organic layers. Further, K has also been reported to be related to the decomposition rate of needles in Scots pine forests, yet the underlying mechanisms are not well understood (Laskowski et al., 1995; Stendahl et al., 2017).
4.2 The N stock increases strongly with increasing MAT
We found that the N stock of the organic layer increased more strongly from −2.0 to 7.5 ∘C MAT than the organic layer stock (Fig. 1a and b). Our finding is in accordance with Callesen et al. (2007) who studied 198 forest soils in North Europe and reported that the N stock of the total soil profiles (organic layer plus uppermost 100 cm of the mineral soil) was positively correlated with MAT. The reasons for the strong change in the N stock with MAT could be, first, the higher N deposition towards the south–southwest of Sweden that enriches the organic layer in south–southwest Sweden with N. Second, it could potentially be that the rate at which N is taken up by trees increases with decreasing MAT, leading to N depletion in the organic layer at sites with low MAT. Third, it could be that the net N mineralization rate is negatively related to MAT. Fourth, it might be that N2 fixation strongly increases with MAT. These four explanations will be discussed in the following.
First, atmospheric N deposition is well known to be an important N input in forest ecosystems in the south of Sweden (Akselsson et al., 2008; Högberg et al., 2017; Yu et al., 2018). However, our finding that N deposition was only loosely related to the N stock of the organic layer (Fig. 2c) suggests that N deposition only explains a small part of the increase in the N stock with increasing MAT. Yet, at the same time, we need to take into account that the N deposition data might not be fully representative of the accumulated differences in deposited N.
Concerning the second potential explanation, our results show that the growth rate of trees increases with increasing MAT (Fig. 2d). Thus, the potential explanation that the organic layer N stock is decreased (by a factor of 7.5) due to high tree N uptake in the forests with the lowest MAT and lowest tree growth rate compared to forests with the highest MAT and growth rate is rather questionable.
Third, it could potentially be that the net N mineralization rate is negatively related to MAT. However, the net N mineralization rate in the organic layer of temperate and boreal forests is usually negatively related to the C:N ratio (Parton et al., 2007; Moore et al., 2011; Heuck and Spohn, 2016) which rather suggests a high net N mineralization rate at sites with high MAT and low C:N ratio, as also discussed recently by Högberg et al. (2021).
Fourth, it seems likely that the positive correlation between the organic layer N stock and MAT is, at least partly, caused by a positive relationship between N2 fixation and MAT. Rates of N2 fixation can be as high as 4 in boreal ecosystems (DeLuca et al., 2002, 2008; Lagerström et al., 2007; Gundale et al., 2010), which is a larger N input than atmospheric N deposition in most boreal areas (Gundale et al., 2011) and in the forests studied here. N2 fixation is known to depend strongly on temperature in temperate and boreal ecosystems (Sorensen and Michelsen, 2011; Gundale et al., 2012; Rousk et al., 2013). Therefore, it seems likely that the stronger MAT-dependent variation in the N stock of the organic layer than in the organic layer stock is related to the temperature-dependence of N2 fixation. Most studies that explored the temperature-dependence in high-latitudinal ecosystems focused on arctic heath ecosystems (for exceptions see Gundale et al., 2012; Rousk et al., 2013). Future research should explore the temperature-dependence of N2 fixation in forest soils along temperature gradients and investigate to what extent the temperature-dependence of N2 fixation explains the change in N stocks along the MAT gradient observed here.
Taken together, our data are not conclusive as to why the N stock of the organic layer changes more strongly than the organic layer stock along the MAT gradient, although the last explanation (temperature-dependence of N2 fixation) seems most likely.
4.3 The organic layer N:P ratio is positively related to MAT
Our finding that the organic layer N:P ratio increased with increasing MAT (Fig. 2f) indicates that P is not incorporated into the organic layer in a constant ratio with N across all temperature regimes. The reason for the change in the N:P ratio with MAT could be a similar change in the N:P ratio of the plant litter inputs to the soils. This is supported by Akselsson et al. (2015) showing that the N:P ratio of pine and spruce needles was substantially larger in south–southwest Sweden than in middle and northern Sweden. This is further supported by studies about European forests reporting that the foliage N:P ratio increases with increasing N inputs because trees do not take up enough P to balance the high N availability (Flückiger and Braun, 1998; Braun et al., 2010; Talkner et al., 2015; Jonard et al., 2015). Further, it was suggested in modeling exercises that high N inputs can lead to P limitation in South Swedish forests (Akselsson et al., 2008; Yu et al., 2018), resulting in increased needle N:P ratios (Yu et al., 2018). Changes in foliage N:P ratio with MAT likely translate into similar changes in the N:P ratio of the organic layer. The reason why P is not incorporated into the plant biomass in a constant ratio with N across all temperature regimes is likely that P availability limits P uptake at sites with high N availability. This is supported by studies showing that despite the young age of Swedish forest soils, a relatively large proportion of the soil P is adsorbed to Fe and Al oxides (Giesler et al., 1998, 2002; Tuyishime et al., 2022). In addition, also latitude-dependent differences in dominant tree species (i.e., more deciduous forests in the south) seem to contribute to the differences in the N:P ratio between different climate regimes since the N:P ratio of the organic layer was significantly higher in deciduous forests than in pine and spruce forests (Fig. S2a).
4.4 Organic matter stoichiometry varies with tree species even in the subsoil
We found that the C:N and C:P ratios of the organic layer were higher in pine forests than in forests dominated by other tree species, and a very similar difference in the C:N ratio between forests dominated by different tree species was still observed in the mineral soil at a depth of 55–65 cm (Fig. 3). The differences in element ratios of the organic layer are likely derived from differences in the C:N and C:P ratio of the plant litter since particularly the C:N ratio of the organic layer is closely associated with the C:N of the plant litter in Swedish forest soils (Ladanai et al., 2010). Similarly in the mineral soil, the differences in the C:N ratio between forests dominated by different tree species are likely also due to the difference in the C:N ratio of root litter and the litter layer (Cotrufo et al., 2013; Zechmeister-Boltenstern et al., 2015; Spohn and Chodak, 2015). In addition, the relatively low C:N ratio in the mineral soil in spruce forests compared to pine forests might also partially result from the fact that the spruce forests tend to have a slightly finer texture (Fig. S6c), which is associated with lower C:N ratios (Fig. 4d, see discussion below). This is in accordance with Stendahl et al. (2010) showing that in Swedish forests, spruce tends to grow in more fertile soils than pine. Furthermore, some of the pine forests had extremely high C:N and C:P ratios, which might be due to charcoal in the soils which is likely more abundant in pine forests than in other forests due to more frequent fires (Zackrisson, 1977). Previous studies also reported a very high C:N ratio in the organic layer and the uppermost centimeter of the mineral soil in pine forests compared to other forests in Europe (Vesterdal and Raulund-Rasmussen, 1998; Vesterdal et al., 2008; Hansson et al., 2011; Cools et al., 2014). However, this is the first study to show that this difference in the C:N ratio between forests dominated by different tree species is also visible in the mineral subsoil, at a depth of 55–65 cm, to our knowledge. Yet, it has to be considered that we cannot clearly attribute the differences in stoichiometry to differences in vegetation since pine forests might have been established preferably on soils that already had nutrient-poor SOM. Further, we cannot exclude that differences in former land use (Goodale and Aber, 2001; Spohn et al., 2016) or the depth of the groundwater table also affect the mineral soil C:N ratio, although at least the former seems unlikely given that the mean stand age of the forests was 113 years.
The higher C:P ratio of the organic layer observed for pine forests than for all other forests is very likely also related to differences in the stoichiometry of the plant litter inputs. Our result that the C:P ratio of the organic layer was higher in pine forests than in all other forests is in accordance with similar observations of the difference in the organic layer C:P ratio between pine and spruce forests (Vesterdal and Raulund-Rasmussen, 1998; Ladanai et al., 2010). The reason why we found no substantial difference in the C:OP ratio in the mineral soil between forests dominated by different tree species (Fig. 3f) is that the concentration of OP in the mineral soil was strongly affected by texture (Fig. 4c), more strongly than the N concentration (Fig. 4b), as we will discuss in the following.
4.5 Organic P and N contents are high in fine-textured soils
The concentrations of C, N, and P in the uppermost 10 cm of mineral soils were higher in fine-textured soils than in coarse-textured soils. The reason for this is very likely the higher charge density of fine-textured than of coarse-textured soils that allows a large number of organic compounds to adsorb to charged mineral surfaces, which protects them against microbial decomposition through steric hindrance (Lützow et al., 2006; Kögel-Knabner et al., 2008; Kleber et al., 2015). Our results are in accordance with previous studies showing that the capacity of soils to store OM is largely determined by the proportion of fine mineral particles with high surface area and high charge density, such as, for example, phyllosilicates and Fe and Al oxides (Oades, 1988; Mayer et al., 2004; Christensen, 2001; Hassink, 1997). Sorption of OM to mineral surfaces is one of the most important processes that slows down the decomposition of organic matter in soils (Lützow et al., 2006; Kleber et al., 2007; Kögel-Knabner et al., 2008) and very likely leads to enrichment of OM in the fine-textured forest soils studied here.
Our finding that the enrichment in fine-textured soils (compared to coarse-textured soils) increased in the order indicates that the capacity to compete for sorption sites is highest for P-containing organic compounds and higher for N-containing compounds than for N- and P-free compounds. The reason for the strong enrichment of OP in fine-textured soils is likely that OP compounds adsorb rigidly to mineral surfaces. This interpretation is supported by studies demonstrating that phosphorylated organic compounds have a larger capacity to compete for binding sites in soils than non-phosphorylated organic compounds (Afif et al., 1995; Fransson and Jones, 2007; Schneider et al., 2010). Sorption to mineral surfaces makes OP compounds likely more persistent in soil than non-phosphorylated organic compounds (Spohn, 2020a, b). The fact that the total P concentration (Fig. S3) differed much less than the OP concentration (Fig. 4c) among soils of different texture classes supports our interpretation that the strong enrichment of OP in the fine-textured soils is mostly caused by rigid adsorption of OP compounds (which protects OP against decomposition) and much less by a higher P concentration in these soils. Similarly, a large part of N is present in SOM in the form of charged amino moieties, for example, in peptides that can adsorb to charged surfaces, which decreases the decomposition rate of the N-containing compounds (Knicker et al., 1993; Jones and Hodge, 1999; Miltner et al., 2009; Kopittke et al., 2018). Thus, the large capacity of N- and P-containing organic compounds to adsorb to charged surfaces in soils is likely the main reason why N and particularly OP are more highly concentrated in the fine-textured soils compared to the coarse-textured soils than C. In addition, the high N concentration in fine-textured soils could also partly result from high N2 fixation since fine-textured soils are commonly formed from nutrient-rich minerals which support high plant productivity and N2 fixation (Clarholm and Skyllberg, 2013). High N2 fixation is likely also the reason for the higher N concentration of the organic layer in the fine-textured soils compared to the coarse-textured soils (Fig. 4f).
4.6 Future research questions
Based on the results gained from the analysis of forest soil inventory data, we identified the following questions that should be studied in the future.
First, our finding that the N:P ratio of the organic layer increased strongly with increasing MAT and the atmospheric N deposition rate raises the question of whether the growth of trees in Scandinavia at sites with high atmospheric N deposition is co-limited by P, and if so, to what extent.
Second, future research should study the temperature-dependence of N2 fixation in forest soils in Scandinavia along MAT gradients to investigate to what extent temperature-dependence of N2 fixation explains the change in N stocks along the MAT gradient observed here.
Third, the result that the OP concentration in the mineral soil depends strongly on soil texture, which is likely due to rigid adsorption of OP compounds on soil minerals, calls for future investigations of (a) the role of OP for the sorptive stabilization of SOM and (b) the turnover of the soil OP pool in relation to the soil organic C pool.
Fourth, we speculated that very high C:N ratios in some pine forests might be related to forest fires. Future research should explore the legacy of forest fires on SOM stoichiometry.
Fifth, the negative relationships found here between the organic layer stock and the organic layer P concentration raise the question of whether and to what extent P limits organic matter decomposition in Scandinavian forests, which should be investigated in the future.
We found that the N stock of the organic layer increased more with increasing MAT than the organic layer stock, which might be due to the temperature-dependency of N2 fixation or P-dependency of decomposition. Against our first hypothesis, we observed that the N:P ratio of the organic layer increased substantially with increasing MAT likely due to an increase in the availability of N relative to P with increasing MAT. Further, the C:P ratio showed similar differences between forests dominated by different tree species to those of the C:N ratio in the organic layer, as hypothesized. However, the C:OP ratio in the mineral soil differed little between forests dominated by different tree species. The reason for this is likely that the OP concentration was very strongly affected by texture in the mineral soil as the concentration of OP was much higher in fine- than in coarse-textured soils. The difference in element concentrations between fine- and coarse-textured soils decreased in the order , in agreement with the third hypothesis. Taken together, the results show that the N:P ratio of the organic layer was most strongly related to MAT. Further, the C:N ratio was most strongly related to dominant tree species even in the mineral subsoil. In contrast, the C:P ratio was only affected by dominant tree species in the organic layer, while the C:OP ratio in the mineral soil was hardly affected by tree species due to the strong effect of soil texture on the OP concentration.
The R code can be obtained from the corresponding author upon request.
The data can be obtained from the corresponding author upon request.
The supplement related to this article is available online at: https://doi.org/10.5194/bg-19-2171-2022-supplement.
MS designed the study, conducted the data analysis, and wrote the manuscript. JS leads the Swedish Forest Soil Inventory and contributed to the manuscript.
The contact author has declared that neither they nor their co-author has any competing interests.
Publisher's note: Copernicus Publications remains neutral with regard to jurisdictional claims in published maps and institutional affiliations.
The authors thank all technical staff who conducted the sampling and chemical analyses and particularly Oscar Skirfors for conducting the P analyses. The Swedish Forest Soil Inventory is part of the national environmental monitoring program commissioned by the Swedish Environmental Protection Agency. The authors thank three anonymous reviewers for their helpful comments.
This paper was edited by Sara Vicca and reviewed by three anonymous referees.
Afif, E., Barron, V., and Torrent, J.: Organic matter delays but does not prevent phosphate sorption by Cerrado soils from Brazil, Soil Sci., 159, 207–211, 1995.
Akselsson, C., Berg, B., Meentemeyer, V., and Westling, O.: Carbon sequestration rates in organic layers of boreal and temperate forest soils – Sweden as a case study, Global Ecol. Biogeogr., 14, 77–84, 2005.
Akselsson, C., Westling, O., Alveteg, M., Thelin, G., Fransson, A. M., and Hellsten, S.: The influence of N load and harvest intensity on the risk of P limitation in Swedish forest soils, Sci. Total Environ., 404, 284–289, 2008.
Akselsson, C., Karlsson, G. P., Karlsson P. E., and Ahlstrand, J.: Miljöövervakning på Obsytorna 1984–2013, Skogsstyrelsen, 142, 2015.
Bradshaw, C. J. and Warkentin, I. G.: Global estimates of boreal forest carbon stocks and flux, Global Planet. Change, 128, 24–30, 2015.
Braun, S., Thomas, V. F., Quiring, R., and Flückiger, W.: Does nitrogen deposition increase forest production? The role of phosphorus, Environ. Pollut., 158, 2043–2052, 2010.
Callesen, I., Raulund-Rasmussen, K., Westman, C. J., and Tau-Strand, L.: Nitrogen pools and C:N ratios in well-drained Nordic forest soils related to climate and soil texture, Boreal Environ. Res., 12, 681–692, 2007.
Christensen, B. T.: Physical fractionation of soil and structural and functional complexity in organic matter turnover, Eur. J. Soil Sci., 52, 345–353, 2001.
Clarholm, M. and Skyllberg, U.: Translocation of metals by trees and fungi regulates pH, soil organic matter turnover and nitrogen availability in acidic forest soils, Soil Biol. Biochem., 63, 142–153, 2013.
Cools, N., Vesterdal, L., De Vos, B., Vanguelova, E., and Hansen, K.: Tree species is the major factor explaining C:N ratios in European forest soils, Forest Ecol. Manag., 311, 3–16, 2014.
Cotrufo, M. F., Wallenstein, M. D., Boot, C. M., Denef, K., and Paul, E.: The Microbial Efficiency-Matrix Stabilization (MEMS) framework integrates plant litter decomposition with soil organic matter stabilization: do labile plant inputs form stable soil organic matter?, Global Change Biol., 19, 988–995, 2013.
DeLuca, T. H., Zackrisson, O., Nilsson, M. C., and Sellstedt, A.: Quantifying nitrogen-fixation in feather moss carpets of boreal forests, Nature, 419, 917–920, 2002.
DeLuca, T. H., Zackrisson, O., Gundale, M. J., and Nilsson, M. C.: Ecosystem feedbacks and nitrogen fixation in boreal forests, Science, 320, 1181, 2008.
Flückiger, W. and Braun, S.: Nitrogen deposition in Swiss forests and its possible relevance for leaf nutrient status, parasite attacks and soil acidification, Environ. Pollut., 102, 69–76, 1998.
Fransson, A. M. and Jones, D. L.: Phosphatase activity does not limit the microbial use of low molecular weight organic-P substrates in soil, Soil Biol. Biochem., 39, 1213–1217, 2007.
Giesler, R., Högberg, M., and Högberg, P.: Soil chemistry and plants in Fennoscandian boreal forest as exemplified by a local gradient, Ecology, 79, 119–137, 1998.
Giesler, R., Petersson, T., and Högberg, P.: Phosphorus limitation in boreal forests: effects of aluminum and iron accumulation in the humus layer, Ecosystems, 5, 300–314, 2002.
Goodale, C. L. and Aber, J. D.: The long-term effects of land-use history on nitrogen cycling in northern hardwood forests, Ecol. Appl., 11, 253–267, 2001.
Gundale, M. J., Wardle, D. A., and Nilsson, M. C.: Vascular plant removal effects on biological N fixation vary across a boreal forest island gradient, Ecology, 91, 1704–1714, 2010.
Gundale, M. J., Deluca, T. H., and Nordin, A.: Bryophytes attenuate anthropogenic nitrogen inputs in boreal forests, Global Change Biol., 17, 2743–2753, 2011.
Gundale, M. J., Nilsson, M., Bansal, S., and Jäderlund, A.: The interactive effects of temperature and light on biological nitrogen fixation in boreal forests, New Phytol., 194, 453–463, 2012.
Hansson, K., Olsson, B. A., Olsson, M., Johansson, U., and Kleja, D. B.: Differences in soil properties in adjacent stands of Scots pine, Norway spruce and silver birch in SW Sweden, Forest Ecol. Manag., 262, 522–530, 2011.
Hassink, J.: The capacity of soils to preserve organic C and N by their association with clay and silt particles, Plant Soil, 191, 77–87, 1997.
Heuck, C. and Spohn, M.: Carbon, nitrogen and phosphorus net mineralization in organic horizons of temperate forests: stoichiometry and relations to organic matter quality, Biogeochemistry, 131, 229–242, 2016.
Heuck, C., Smolka, G., Whalen, E. D., Frey, S., Gundersen, P., Moldan, F., Fernandez, I. J., and Spohn, M.: Effects of long-term nitrogen addition on phosphorus cycling in organic soil horizons of temperate forests, Biogeochemistry, 141, 167–181, 2018.
Högberg, P., Näsholm, T., Franklin, O., and Högberg, M. N.: Tamm Review: On the nature of the nitrogen limitation to plant growth in Fennoscandian boreal forests, Forest Ecol. Manag., 403, 161–185, 2017.
Högberg, P., Wellbrock, N., Högberg, M. N., Mikaelsson, H., and Stendahl, J.: Large differences in plant nitrogen supply in German and Swedish forests – Implications for management, Forest Ecol. Manag., 482, 118899, https://doi.org/10.1016/j.foreco.2020.118899, 2021.
Hounkpatin, K. O., Stendahl, J., Lundblad, M., and Karltun, E.: Predicting the spatial distribution of soil organic carbon stock in Swedish forests using a group of covariates and site-specific data, Soil, 7, 377–398, 2021.
IUSS Working Group WRB: World Reference Base for Soil Resources 2014, update 2015, International soil classification system for naming soils and creating legends for soil maps, World Soil Resources Reports No. 106, FAO, Rome, 2015.
Jonard, M., Fürst, A., Verstraeten, A., Thimonier, A., Timmermann, V., Potočić, N., Waldner, P., Benham, S., Hansen, K., Merilä, P., Ponette, Q., de la Cruz, A.C., Roskams, P., Nicolas, M., Croisé, L., Ingerslev, M., Matteucci, G., Decinti, B., Bascietto, M., and Rautio, P.: Tree mineral nutrition is deteriorating in Europe, Global Change Biol., 21, 418–430, 2015.
Jones, D. L. and Hodge, A.: Biodegradation kinetics and sorption reactions of three differently charged amino acids in soil and their effects on plant organic nitrogen availability, Soil Biol. Biochem., 31, 1331–1342, 1999.
Kleber, M., Sollins, P., and Sutton, R.: A conceptual model of organo-mineral interactions in soils: self-assembly of organic molecular fragments into zonal structures on mineral surfaces, Biogeochemistry, 85, 9–24, 2007.
Kleber, M., Eusterhues, K., Keiluweit, M., Mikutta, C., Mikutta, R., and Nico, P. S.: Mineral–organic associations: formation, properties, and relevance in soil environments, Adv. Agron., 130, 1–140, 2015.
Knicker, H., Fründ, R., and Lüdemann, H. D.: The chemical nature of nitrogen in native soil organic matter, Naturwissenschaften, 80, 219–221, 1993.
Kögel‐Knabner, I., Guggenberger, G., Kleber, M., Kandeler, E., Kalbitz, K., Scheu, S., Eusterhues, K., and Leinweber, P.: Organo-mineral associations in temperate soils: Integrating biology, mineralogy, and organic matter chemistry, J. Plant Nutr. Soil Sc., 171, 61–82, 2008.
Kopittke, P. M., Hernandez-Soriano, M. C., Dalal, R. C., Finn, D., Menzies, N. W., Hoeschen, C., and Mueller, C. W.: Nitrogen-rich microbial products provide new organo-mineral associations for the stabilization of soil organic matter, Global Change Biol., 24, 1762–1770, 2018.
Ladanai, S., Ågren, G. I., and Olsson, B. A.: Relationships between tree and soil properties in Picea abies and Pinus sylvestris forests in Sweden, Ecosystems, 13, 302–316, 2010.
Lagerström, A., Nilsson, M. C., Zackrisson, O., and Wardle, D. A.: Ecosystem input of nitrogen through biological fixation in feather mosses during ecosystem retrogression, Funct. Ecol., 21, 1027–1033, 2007.
Laskowski, R., Berg, B., Johansson, M. B., and McClaugherty, C.: Release pattern for potassium from decomposing forest needle and leaf litter. Long-term decomposition in a Scots pine forest. IX, Can. J. Botany, 73, 2019–2027, 1995.
Lützow, M. V., Kögel-Knabner, I., Ekschmitt, K., Matzner, E., Guggenberger, G., Marschner, B., and Flessa, H.: Stabilization of organic matter in temperate soils: mechanisms and their relevance under different soil conditions – a review, Eur. J. Soil Sci., 57, 426–445, 2006.
Mayer, L. M., Schick, L. L., Hardy, K. R., Wagai, R., and McCarthy, J.: Organic matter in small mesopores in sediments and soils, Geochim. Cosmochim. Ac., 68, 3863–3872, 2004.
McGroddy, M. E., Daufresne, T., and Hedin, L. O.: Scaling of stoichiometry in forests worldwide: Implications of terrestrial redfield-type ratios, Ecology, 85, 2390–2401, 2004.
Miltner, A., Kindler, R., Knicker, H., Richnow, H. H., and Kästner, M.: Fate of microbial biomass-derived amino acids in soil and their contribution to soil organic matter, Org. Geochem., 40, 978–985, 2009.
Moore, T. R., Trofymow, J. A., Prescott, C. E., and Titus, B. D.: Nature and nurture in the dynamics of C, N and P during litter decomposition in Canadian forests, Plant Soil, 339, 163–175, 2011.
Murphy, J. and Riley, J. P.: A modified single solution method for the determination of phosphate in natural waters, Anal. Chim. Acta, 27, 31–36, 1962.
Oades, J. M.: The retention of organic matter in soils, Biogeochemistry, 5, 35–70, 1988.
Olsson, M., Rosén, K., and Melkerud, P. A.: Regional modelling of base cation losses from Swedish forest soils due to whole-tree harvesting, Appl. Geochem., 8, 189–194, 1993.
Osono, T. and Takeda, H.: Potassium, calcium, and magnesium dynamics during litter decomposition in a cool temperate forest, J. Forest Res.-Jpn., 9, 23–31, 2004.
Pansu, M. and Gautheyrou, J.: Handbook of soil analysis: mineralogical, organic and inorganic methods, Springer Science and Business Media, ISBN 1-280-95753-0, 2006.
Parton, W., Silver, W. L., Burke, I. C., Grassens, L., Harmon, M. E., Currie, W. S., King, J., Adair, C., Brandt, L. A., Hart, S. C., and Fasth, B.: Global-scale similarities in nitrogen release patterns during long-term decomposition, Science, 315, 361–364, 2007.
R Core Team: A Language and Environment for Statistical Computing R Foundation for Statistical Computing, Austria, Vienna, 2021.
Ranneby, B., Cruse, T., Hägglund, B., Jonasson, H., and Swärd, J.: Designing a new national forest survey for Sweden, Studia Forestalia Suecica 177, ISBN 91-576-2982-X, 1987.
Rousk, K., Jones, D. L., and DeLuca, T. H.: Moss-cyanobacteria associations as biogenic sources of nitrogen in boreal forest ecosystems, Front. Microbiol., 4, 150, 2013.
Saunders, W. M. H. and Williams, E. G.: Observations on the determination of total organic phosphorus in soils, J. Soil Sci., 6, 254–267, 1955.
Schlesinger, W. H.: Some thoughts on the biogeochemical cycling of potassium in terrestrial ecosystems, Biogeochemistry, 154, 427–432, 2021.
Schneider, M. P. W., Scheel, T., Mikutta, R., Van Hees, P., Kaiser, K., and Kalbitz, K.: Sorptive stabilization of organic matter by amorphous Al hydroxide, Geochim. Cosmochim. Ac., 74, 1606–1619, 2010.
Sorensen, P. L. and Michelsen, A.: Long-term warming and litter addition affects nitrogen fixation in a subarctic heath, Global Change Biol., 17, 528–537, 2011.
Spohn, M.: Increasing the organic carbon stocks in mineral soils sequesters large amounts of phosphorus, Global Change Biol., 26, 4169–4177, 2020a.
Spohn, M.: Phosphorus and carbon in soil particle size fractions: A synthesis, Biogeochemistry, 147, 225–242, 2020b.
Spohn, M. and Chodak, M.: Microbial respiration per unit biomass increases with carbon-to-nutrient ratios in forest soils, Soil Biol. Biochem., 81, 128–133, 2015.
Spohn, M., Novák, T. J., Incze, J., and Giani, L.: Dynamics of soil carbon, nitrogen, and phosphorus in calcareous soils after land-use abandonment – A chronosequence study, Plant Soil, 401, 185–196, 2016.
Staaf, H. and Berg, B.: Accumulation and release of plant nutrients in decomposing Scots pine needle litter. Long-term decomposition in a Scots pine forest II, Can. J. Botany, 60, 1561–1568, 1982.
Stendahl, J., Johansson, M. B., Eriksson, E., Nilsson, Å., and Langvall, O.: Soil organic carbon in Swedish spruce and pine forests–differences in stock levels and regional patterns, Silva Fenn., 44, 5–21, 2010.
Stendahl, J., Berg, B., and Lindahl, B. D.: Manganese availability is negatively associated with carbon storage in northern coniferous forest humus layers, Sci. Reports, 7, 1–6, 2017.
Talkner, U., Meiwes, K. J., Potočić, N., Seletković, I., Cools, N., De Vos, B., and Rautio, P.: Phosphorus nutrition of beech (Fagus sylvatica L.) is decreasing in Europe, Ann. Forest Sci., 72, 919–928, 2015.
Tau-Strand, L., Callesen, I., Dalsgaard, L., and de Wit, H. A.: Carbon and nitrogen stocks in Norwegian forest soils – the importance of soil formation, climate, and vegetation type for organic matter accumulation, Can. J. Forest Res., 46, 1459–1473, 2016.
Tipping, E., Somerville, C. J., and Luster, J.: The stoichiometry of soil organic matter, Biogeochemistry, 130, 117–131, 2016.
Tuyishime, J. M., Adediran, G. A., Olsson, B. A., Spohn, M., Hillier, S., Klysubun, W., and Gustafsson, J. P.: Phosphorus abundance and speciation in acid forest Podzols–Effect of postglacial weathering, Geoderma, 406, 115500, https://doi.org/10.1016/j.geoderma.2021.115500, 2022.
Vejre, H., Callesen, I., Vesterdal, L., and Raulund-Rasmussen, K.: Carbon and nitrogen in Danish forest soils – contents and distribution determined by soil order, Soil Sci. Soc. Am. J., 67, 335–343, 2003.
Vesterdal, L. and Raulund-Rasmussen, K.: Forest floor chemistry under seven tree species along a soil fertility gradient, Can. J. Forest Res., 28, 1636–1647, 1998.
Vesterdal, L., Schmidt, I. K., Callesen, I., Nilsson, L. O., and Gundersen, P.: Carbon and nitrogen in forest floor and mineral soil under six common European tree species, Forest Ecol. Manag., 255, 35–48, 2008.
Williams, E. G. and Saunders, W. M. H.: Distribution of phosphorus in profiles and particle-size fractions of some Scottish soils, J. Soil Sci., 7, 90–109, 1956.
Yu, L., Zanchi, G., Akselsson, C., Wallander, H., and Belyazid, S.: Modeling the forest phosphorus nutrition in a southwestern Swedish forest site, Ecol. Model., 369, 88–100, 2018.
Zackrisson, O.: Influence of forest fires on the North Swedish boreal forest, Oikos, 29, 22–32, 1977.
Zechmeister-Boltenstern, S., Keiblinger, K. M., Mooshammer, M., Peñuelas, J., Richter, A., Sardans, J., and Wanek, W.: The application of ecological stoichiometry to plant–microbial–soil organic matter transformations, Ecol. Monogr., 85, 133–155, 2015.