the Creative Commons Attribution 4.0 License.
the Creative Commons Attribution 4.0 License.
 | 28 Apr 2022
Toward estimation of seasonal water dynamics of winter wheat from ground-based L-band radiometry: a concept study
Thomas Jagdhuber
François Jonard
Anke Fluhrer
David Chaparro
Martin J. Baur
Thomas Meyer
María Piles
The vegetation optical depth (VOD) variable contains information on plant water content and biomass. It can be estimated alongside soil moisture from currently operating satellite radiometer missions, such as SMOS (ESA) and SMAP (NASA). The estimation of water fluxes, such as plant water uptake (PWU) and transpiration rate (TR), from these earth system parameters (VOD, soil moisture) requires assessing water potential gradients and flow resistances in the soil, the vegetation and the atmosphere. Yet water flux estimation remains an elusive challenge especially on a global scale. In this concept study, we conduct a field-scale experiment to test mechanistic models for the estimation of seasonal water fluxes (PWU and TR) of a winter wheat stand using measurements of soil moisture, VOD, and relative air humidity (RH) in a controlled environment. We utilize microwave L-band observations from a tower-based radiometer to estimate VOD of a wheat stand during the 2017 growing season at the Selhausen test site in Germany. From VOD, we first extract the gravimetric moisture of vegetation and then determine the relative water content (RWC) and vegetation water potential (VWP) of the wheat field. Although the relative water content could be directly estimated from VOD, our results indicate this may be challenging for the phenological phases, when rapid biomass and plant structure development take place within the wheat canopy. We estimate water uptake from the soil to the wheat plants from the difference between the soil and vegetation potentials divided by the flow resistance from soil into wheat plants. The TR from the wheat plants into the atmosphere was obtained from the difference between the vegetation and atmosphere water potentials divided by the flow resistances from plants to the atmosphere. For this, the required soil matric potential (SMP), the vapor pressure deficit (VPD), and the flow resistances were obtained from on-site observations of soil, plant, and atmosphere together with simple mechanistic models. This pathfinder study shows that the L-band microwave radiation contains valuable information on vegetation water status that enables the estimation of water dynamics (up to fluxes) from the soil via wheat plants into the atmosphere, when combined with additional information of soil and atmosphere water content. Still, assumptions have to be made when estimating the vegetation water potential from relative water content as well as the water flow resistances between soil, wheat plants, and atmosphere. Moreover, direct validation of water flux estimates for the assessment of their absolute accuracy could not be performed due to a lack of in situ PWU and TR measurements. Nonetheless, our estimates of water status, potentials, and fluxes show the expected temporal dynamics, known from the literature, and intercompare reasonably well in absolute terms with independent TR estimates of the NASA ECOSTRESS mission, which relies on a Priestly–Taylor type of retrieval model. Our findings support that passive microwave remote-sensing techniques qualify for the estimation of vegetation water dynamics next to traditionally measured stand-scale or plot-scale techniques. They might shed light on future capabilities of monitoring water dynamics in the soil–plant–atmosphere system including wide-area, remote-sensing-based earth observation data.
- Article
(1779 KB) - Full-text XML
- BibTeX
- EndNote


The monitoring of water dynamics between soil, vegetation, and atmosphere and therefore the water availability for plants requires a system-driven and holistic approach integrating these three water storage compartments. The soil–plant–atmosphere system (SPAS) represents such an approach, linking the water, energy, and carbon cycles (Reichardt and Timm, 2014; Manzoni et al., 2013a; Ritchie, 1981; Cowan, 1965). SPAS is understood as a physical continuum, in which water dynamics occur as interdependent transfer processes between the three system compartments (Nobel, 2020). Gardner (1960, 1965) was among the first to study the system holistically and to point out that the water transport in the system follows the direction of decreasing energy leading to the concept of water potential in soil, plant, and atmosphere (Slatyer and Taylor, 1960). A gradient in water potential induces a flow, for instance, from soil via roots and plant parts into the atmosphere mediated by the resistance of the traversed system compartments (Oosterhuis and Walker, 1987; Choudhury and Idso, 1985a; Yang and Jong, 1971).
Water potential (WP) refers to the potential energy of water and is a key variable in plant hydrology (Reichardt and Timm, 2014). Since plants are the central component of the SPAS, the decreasing gradient in WP from soils to the atmosphere drives the movement of water through plants (Elfving et al., 1972; Pearcy et al., 2012). Thus, the vegetation water potential (VWP) changes according to the water availability in soils and the uptake capabilities of the plant root and xylem systems, according to the regulation of transpiration through the stomata in leaves, and according to the vapor pressure deficit in the atmosphere (Lambers et al., 2008; Jonard et al., 2020).
The water transport through the different compartments of the SPAS is coordinated by adaption of resistances, in a way that water use efficiency is maximized by the plants, avoiding conditions with potentially plant-damaging WPs (Tyree and Zimmermann, 2013). According to Manzoni et al. (2014), the coordinated behavior is an outcome of plant adaption to their habitat by optimizing water use and gain in carbon assimilation for plant growth.
Under drought conditions, VWP might change due to more negative WPs in soil and atmosphere (Choat et al., 2018; Johnson et al., 2018). Under these conditions, VWP is regulated by stomatal closure and the general plant hydraulic strategy (isohydric to anisohydric behavior) and thereby mechanistically relates water, energy and carbon cycles (Lambers et al., 2008; Martínez-Vilalta and Garcia-Forner, 2017). Estimating VWP from satellites would be interesting for regional and global ecological studies addressing drought impacts, especially on forest and agricultural ecosystems (e.g., Feldman et al., 2020). Such retrievals could inform or update global vegetation, earth system, or atmospheric boundary layer models (Bonan et al., 2014; Matheny et al., 2017; Moment et al., 2017; Momen and Bou-Zeid, 2017).
Microwave remote-sensing retrieval approaches up to satellite observation missions (e.g., SMOS (soil moisture and ocean salinity, ESA) or SMAP (soil moisture active passive, NASA)) often deal with the estimation of earth system parameters (such as soil moisture) rather than with the assessment of dynamic flow processes, such as water uptake or transpiration of plants (Entekhabi et al., 2010; Kerr et al., 2010; Portal et al., 2020). An exception in terms of estimation of water dynamics is the GRACE mission (Sadeghi et al., 2020a), assessing total water storage change, and especially its combination with the SMOS and SMAP missions (Sadeghi et al., 2020b). The estimation of water dynamics from remote sensing requires assessing the potential (suction tension) gradients of water rather than the (storage) filling status of soils or plants with water.
Passive microwave remote-sensing techniques should be capable of obtaining VWP estimates, provided that information on plant hydraulic traits is available (Konings et al., 2019). To do so, the vegetation optical depth (VOD) parameter, which measures the degree of attenuation of microwaves as they pass through vegetation, needs to be first extracted from the radiometer observations by model-based parameter retrievals. Afterward the biomass and water contributions to the VOD parameter need to be disentangled (Martínez-Vilalta et al., 2019). As proposed by Bonan et al. (2014), the relative water content (RWC) can be a valid metric for plant water status and can be utilized to estimate VWP. Konings et al. (2019) explained how microwave remote sensing can be applied for monitoring of plant parameters, such as RWC. Furthermore, Rao et al. (2019) showed that VOD from X-band satellite radiometry can be converted into RWC estimates with the caveat that both, water and biomass, influence the VOD especially in seasonally growing agricultural species such as winter wheat. Therefore, only periods with constant biomass should be evaluated in order to isolate the water component directly from VOD. Fink et al. (2018) found a way to extract the gravimetric moisture of vegetation (mg) from the VOD signal. mg can be converted into RWC and is not affected by biomass dynamics. The mg estimation methodology of Fink et al. (2018) was further developed and validated at the field scale by Meyer et al. (2019).
For the present study, we estimate WP and water flux along SPAS for the 2017 growing season of a winter wheat field based on the dataset of Meyer et al. (2019). A wheat monoculture has the advantage that growth stages between individual plants are nearly completely synchronized and the canopy develops very homogeneously. The benefit here is that measurements of individual plants are very likely representative for all other plants and can be scaled to the whole canopy. Most notably, the main motivation for analyzing wheat comes from its importance in food production, being one of the major crop types cultivated around the globe.
The winter wheat field was monitored with the ground-based L-band radiometer instrument ELBARA-II. Simultaneously, in situ measurements for key plant (e.g., mg, height, biomass, leaf area index (LAI), and phenology), soil (e.g., relative permittivity and moisture), and atmosphere (e.g., air temperature, wind speed, net radiation, and relative humidity) properties were recorded directly at or around the test field.
The objective of this concept study is to research the feasibility of estimating WPs as well as water uptake from soil and transpiration rates (TRs) into the atmosphere for a winter wheat field from ground-based L-band radiometry and on-site measurements of soil and atmosphere. With our research we aim to shed light on whether the combination of L-band radiometry and a confined set of on-site measurements are sufficient for the derivation of reasonable WP dynamics and water flux rates in the SPAS of a winter wheat field.
The research study was carried out at the Selhausen remote-sensing field laboratory in Germany (Jonard et al., 2015, 2018). In 2017 winter wheat (Triticum aestivum L.) was grown in the farmers' crop rotation at the field laboratory. Key developmental stages of winter wheat are published by Bruns and Croy (1983) and indicate that this agricultural crop has a distinct phenological cycle in the yearly growing period. Detailed information on the distribution, botany, growth, and physiology of winter wheat is presented in Curtis et al. (2002). The winter wheat at Selhausen grew well without irrigation or fertilization. It was also not affected by plant diseases.
The experimental setup consists of a 12 [m] × 20 [m] plot covered by a mesh reflector (metal grid) on the ground with winter wheat plants growing through it. We performed L-band (1.4 [GHz]) passive microwave measurements using an ELBARA-II radiometer of the Forschungszentrum Jülich (FZJ) fixed at 4 [m] height. ELBARA-II features a dual-mode conical horn antenna with an absolute accuracy of 1 [∘K] and relative sensitivity of <0.1 [∘K] (Meyer et al., 2018). We repeated the radiometer measurement twice a week at incidence angles between 40∘ and 60∘ in 5∘ increments.
Solely the vegetation microwave radiation is measured using a mesh reflector on the ground and the radiation from the soil is blocked by the reflector (Jonard et al., 2015). We conducted in situ measurements of soil texture (silt loam with 13 [%] sand, 70 [%] silt, and 17 [%] clay), soil permittivity, and soil temperature every 15 [min] (and every 30 [min]) using 15 capacitance sensors installed at 5 [cm] (and using 30 time-domain reflectometry (TDR) sensors installed at 30 [cm]) depth in the direct vicinity of the radiometer footprint within the field. Soil permittivity measurements can be converted to soil moisture θ according to the well-established dielectric mixing model of Topp et al. (1980). Precipitation, net solar radiation, air temperature, wind speed, and relative humidity data are available in 10 [min] resolution (except for wind speed at 30 [min] resolution) from two TERENO climate stations, located next to the field laboratory (6.449∘ E, 50.869∘ N) and on a neighboring field (6.447∘ E, 50.865∘ N). In order to be less dependent on in situ measurements, we could have also used L-band radiometer-derived soil moisture data from a non-meshed area of the winter wheat field instead of the in situ soil permittivity measurements. However, the in situ data have a significantly higher temporal resolution than the radiometer observations. But similar to the soil permittivity, these data could be derived from remote-sensing-based approaches in a future, more in situ-independent and larger-scale research study.
We measured vegetation height [m], leaf area index (LAI) [m2 m−2], above ground biomass (AGB) [kg m−2], and vegetation water content (VWC) [kg m−2] destructively every week around the radiometer measurements for comparison and validation. Following Meyer et al. (2019), we used in situ measured VWC to obtain in situ mg by calculating first the dry matter fraction (md) as defined by Mätzler (1994), i.e., md= dry mass/fresh mass, and subtracting it afterward from one (i.e., ).
All vegetation-related measurements of the growing season in 2017 and the different phenological phases are presented in Fig. 1 and Table 1 showing a distinct correlation between VWC and LAI (R=0.94). For a detailed description of the trends and dynamics of these on-site measurements as well as a full sketch of the experimental setup, the reader is referred to Meyer et al. (2018) and Meyer et al. (2019).
Table 1Overview of growth stages of the winter wheat between 10 April (DOY 100) and 14 August 2017 (DOY 226) and their corresponding phenological phase (after BBCH (Biologische Bundesanstalt, Bundessortenamt und Chemische Industrie) code) (Meyer et al., 2018).


Figure 1In situ measurements of the wheat field along growing season for days of year (DOY) in 2017 at the Selhausen field laboratory, Germany: Vegetation height [m] and leaf area index (LAI) [m2 m−2] (a); above ground biomass (AGB) [kg m−2] and vegetation water content (VWC) [kg m−2] (b) (Meyer et al., 2018).
For later comparison of the transpiration estimates in Selhausen with benchmark information, we apply data from the NASA ECOsystem Spaceborne Thermal Radiometer Experiment on Space Station (ECOSTRESS) mission (https://ecostress.jpl.nasa.gov/, last access: 8 November 2021, Hook and Fischer, 2019). The ECOSTRESS mission was launched in 2018 and carries on board a thermal infrared radiometer with high spatial resolution (70 [m]). The radiometer measurements are used to estimate the earth's surface temperatures and to derive evapotranspiration (ET). Two ECOSTRESS L3 products provide ET data: the L3_ET_PT-JPL product, based on L2 information, and the L3_ET_ALEXI product, based on the ALEXI/disALEXI algorithm. In our case, we focus on the L3_ET_ PT-JPL product, which also uses data from the Moderate Resolution Imaging Spectroradiometer (MODIS) as auxiliary information and leads to partitioning of ET into canopy transpiration and soil evaporation (Halverson et al., 2019).
We compare our transpiration estimates in Selhausen (2017) with ECOSTRESS L3_ET_PT-JPL transpiration data for years 2019, 2020, and 2021, for days of year (DOY) between 100 and 200. Note that no ECOSTRESS data are available for this DOY period in 2018, and that the number of data available varies for each year and is irregularly distributed, which hinders obtaining regularly sampled time series. The L3_ET_PT-JPL dataset provides instantaneous information (i.e., transpiration at MODIS time over pass: 10:30 local time, approximately) and daily information (i.e., a daily integral of ET built from a sinusoidal model mimicking radiation intensity; Halverson et al., 2019). Uncertainty information is available for the instantaneous ET dataset: when uncertainty was higher than 50 % of the transpiration value, we excluded the respective date. In addition, note that nightly overpasses of the ECOSTRESS sensor are excluded. Moreover, transpiration estimates equal to 0 are screened out due to unlikely (probably wrong) 100 % vs. 0 % partition of ET (between soil evaporation and canopy transpiration, respectively). Finally, on some days two or more transpiration estimates are available. Thus, we compute the median for each day to ensure we finally have one transpiration estimate per day. Transpiration estimates of L3_ET_PT-JPL are in units of [W m−2]. We transform these estimates into units of [mm s−1] as follows (Halverson et al., 2019): TR [mm s−1] = TR [W m−2] , where LH is latent heat and is computed with LH=2.501–0.002361 ×T. T is temperature in degrees Celsius. T is obtained in 30 min time steps from a meteorological station next to the Selhausen test field. For the instantaneous transpiration data, T at 10:30 is used. For the daily transpiration data, T is averaged between 07:00 and 20:00.
The methodology for water dynamics estimation – water uptake from soil to wheat vegetation (PWU) and transpiration from wheat vegetation to atmosphere (TR) – is conceptualized in the workflow of Fig. 2. First, the water status of soil (θ), vegetation (mg; cf. Sect. 2), and atmosphere (RH) need to be known from remote-sensing estimates or on-site measurements. From the water status, the WPs for the three environmental compartments (soil, vegetation, and atmosphere) are calculated (Sect. 3.1–3.3) and then SMP and VWP are used to retrieve the water uptake from the soil into the wheat vegetation (Sect. 3.4). In addition, the atmospheric WP, usually expressed by the vapor pressure deficit (VPD), is applied together with the VWP to calculate the TR of the wheat vegetation into the atmosphere (Sect. 3.5).
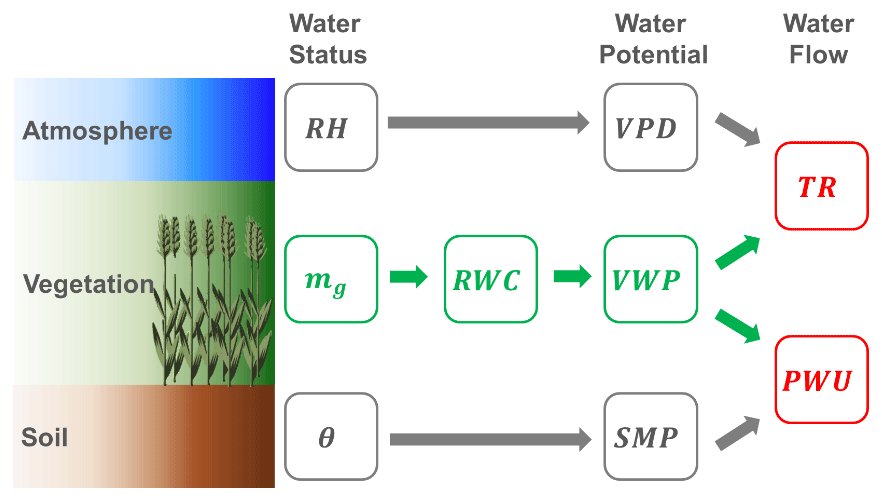
Figure 2Processing workflow for estimation of soil, vegetation, and atmosphere water potentials (SMP = soil matric potential, RWC = relative water content of vegetation, VWP = vegetation water potential, VPD = vapor pressure deficit) and water fluxes (PWU = plant water uptake, TR = transpiration rate) from storage variables (θ = soil moisture, mg = vegetation water content (gravimetric), RH = relative air humidity). Green variables are derived from radiometer observations, while gray ones are calculated from in situ measurements; red variables are derived jointly from radiometer and in situ observations.
3.1 Soil matric potential (SMP) from soil moisture (θ)
The fundamental force describing the overall state and movement of water within the soil is energy: kinetic or potential (Hillel, 1980). The kinetic energy is assumed to be negligible in these agricultural (wheat-covered) soils around the test site due to the overall slow movement of soil water in fields with no to moderate slopes (Hillel, 1980; Shukla, 2014). The potential energy describes the movement of water in soils and the water retention forces against percolation toward ground water level. Hence, the rate of decrease in potential energy with distance is actually the driving force which causes water to flow within soils (Hillel, 1980). The difference in energy states between the soil water and pure free water (i.e., reference potential) is defined as the total soil WP. In unsaturated soils various forces, such as capillary or adsorption, act on soil water, which causes soil WP to be lower than that of pure water in reference conditions (known as “suction tension”).
Due to the different forces influencing the soil water, the total soil WP is mainly the sum of pressure, gravitational, and osmotic potentials (Hillel, 1980; Shukla, 2014). Since the pressure potential is defined as the WP resulting from capillary and adsorptive forces acting on the soil matrix, it is generally called the “SMP” or “matric suction” (Hillel, 1980; Shukla, 2014); it can be expressed in energy per unit mass [J kg−1], in energy per unit volume (pressure: [bar] or [Pa]), or energy per unit weight (hydraulic head: [cm] or [pF]) (Hillel, 1980; Shukla, 2014, Ward and Robinson, 2014). WP values in this study will be presented in units of pressure [Pa].
The SMP is dependent on θ and vice versa. The relationship between both parameters is described by the soil water retention curve. Water retention subsumes all mechanisms and processes related to changes of soil moisture and its energy state (Gupta and Wang, 2006). The shape of the soil water retention curve is dependent on various soil characteristics (e.g., texture, and particularly clay fraction), as well as on the current and previous states of θ (Hillel, 1980; Ward and Robinson, 2014).
When investigating plant growth, two common values of SMP are of major interest: the permanent wilting point and the field capacity. The wilting point (around SMP of −1.5 [MPa]) is defined as the minimum soil water content at which most crop plants can still extract water from the soil (Nobel, 2020, p. 542). The field capacity, reported for instance at −0.01 [MPa] by Ward and Robinson (2014) or at −0.033 [MPa] by Gupta and Wang (2006), corresponds to the amount of remaining water after a saturated soil drained under gravity for 1–2 d following a precipitation event. Exact values for each soil are dependent on the individual soil characteristics. The difference between field capacity and wilting point is regarded as available water that can be taken up by plants (Ward and Robinson, 2014; Gupta and Wang, 2006). Besides tensiometers or thermocouple psychrometers, which can directly measure SMP (Hillel, 1980; Gupta and Wang, 2006), several soil water retention models exist to estimate SMP from θ. Widely used models are those from Brooks and Corey (1964), Campbell (1974), or van Genuchten (1980). In this study we apply the Campbell model to estimate SMP from θ measurements:
with SMPs as matric potential at field capacity (saturated suction), n representing soil porosity, and b as empirically determined constant characterizing the pore-size distribution of the soil (Margulis, 2017; Campbell, 1974). The values for SMPs and b for Eq. (1) are provided by Clapp and Hornberger (1978), where representative values for hydraulic parameters are presented for various soil textures. The values for the soil type silty loam at Selhausen are [m], (including soil moisture content at field capacity θs=0.485 [–] from Clapp and Hornberger (1978) and silt fraction from soil surveys at the test site fs=0.7 [–]) and b=5.3 [–]. Values for θ originate from in situ relative permittivity measurements from 5 and 30 [cm] soil depth (cf. Sect. 2).
Meyer et al. (2019) first estimated the mg of the winter wheat field [kg kg−1] from ground-based L-band radiometer data, acquired between 09:00 and 14:00 at a 40∘ incidence angle. In this process, they retrieved VOD via radiative transfer model inversion from the V-polarized brightness temperature measurements of ELBARA-II. Afterward, mg was estimated from VOD by inversion of the forward model proposed by Schmugge and Jackson (1992) (Meyer et al., 2019; Ulaby and El-Rayes, 1987). They assumed vertical stalks as mainly affecting the plant component of winter wheat for L-band emission and within the radiometer-based mg calculus for subsequent analysis in this study. Full estimation details are provided in Meyer et al. (2019).
mg is a metric of kilogram water per kilogram wet biomass and can be converted into a change metric, called “relative water content”, RWC [%], by putting boundaries on upmost (maximum ) and lowest (minimum ) mg (Pearcy et al., 2012; Eamus et al., 2016; Smart and Bingham, 1974):
As these boundary conditions are found for this study along the measured growing season in 2017 within the winter wheat field, the RWC serves as a relative metric referring to the water dynamics of the recorded season (RWCSeason). Since mg estimates are obtained only once on a measuring day, it limits the chance of capturing the true minimum and maximum of the 2017 growing season. However, the is found in the senescence phase where the water content drops to a minimum (see low and constant level of VWC in Fig. 1 for the senescence phase). The detection of the maximum of the season is even more challenging due to the temporally sparse measurements. Therefore, the maximum of the mg time series is used. Note that RWCSeason by definition is not representative of water dynamics on shorter time scales than seasons, like on weekly or even diurnal scales or for single phenological phases (Passioura, 1982)
For the next step, Zweifel et al. (2000, 2001) described a semi-empirical model linking the RWC [%] to its VWP [MPa]:
where k1 and k2 are empirical parameters representing the inflection point of the function, and the rate of change between RWC and VWP, respectively. VWPmin [MPa] is the minimum of VWP assumed for the relationship. All three parameters are plant type specific and need plant-specific adaption, since the parameterization of Zweifel et al. (2000, 2001) was done for trees. In this study we adapted the parameterization for winter wheat with VWPmin of −2.5 [MPa] (Frank et al., 1973; Gupta et al., 1989; Kameli and Lösel, 1993; Rascio et al., 1994, Siddique et al., 2000). Figure 3 illustrates the RWC–VWP relationship for slow (k1=55; k2=10), intermediate (k1=68; k2=7.5), and rapid (k1=81; k2=5) change dynamics according to the literature (Turner and Long, 1980; Turner, 1988; Zweifel et al., 2001; Pearcy et al., 2012; Konings et al., 2019). The sigmoidal dynamics in Fig. 3 should cover the potential variation of dynamics for wheat, as understood from the literature. It is by no means exhaustive or fully precise.
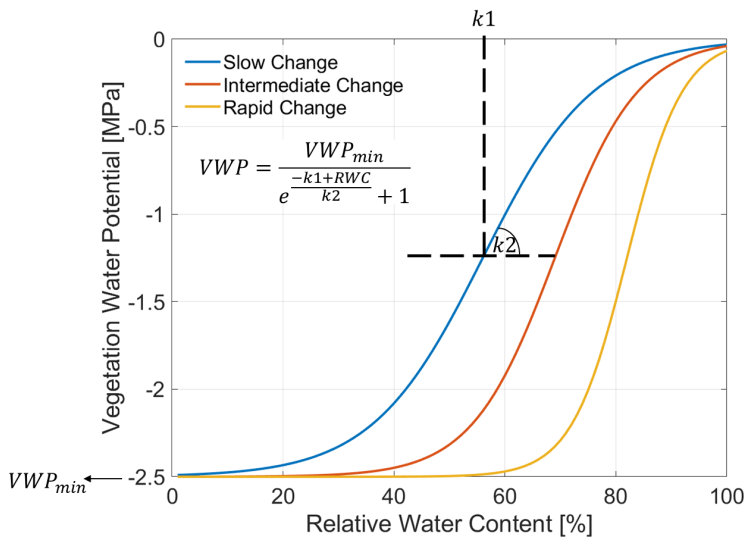
Figure 3Modeled relation between relative water content (RWC) [%] and vegetation water potential (VWP) [MPa] adapted for winter wheat and assuming different rates from slow (blue) to intermediate (red) until rapid (orange) change. The inset equation, adopted from Zweifel and Häsler (2000) and Zweifel et al. (2001), integrates a minimum VWP (VWPmin) and specifies an inflection point (k1) and a rate (k2) of the change dynamic between RWC and VWP. k1 and k2 are also indicated schematically with dashed black lines.
4.1 Atmosphere water potential (vapor pressure deficit) from relative humidity (RH) and air temperature (TAir)
In unsaturated air conditions the atmosphere shows a deficit of water vapor indicating the WP of the atmosphere. Atmospheric vapor pressure deficit (VPD) is defined as the difference between the actual water vapor pressure and the saturation water vapor pressure at a particular temperature. It can be calculated as follows (Reichardt and Timm, 2014; Castellvi et al., 1996):
including the relative humidity of the air RH [–] and saturation water vapor pressure of the air [kPa], where TAir represents the air temperature [∘C] (Alduchov and Eskridge, 1996). In this study RH and TAir are measured at 2 [m] height above ground at the on-site meteorological station. Time series of VPD and its input variables (RH, TAir) for the study period are presented in Fig. 4.

Figure 4Calculated vapor pressure deficit (VPD [kPa]) at 2 [m] height (a) from measurements of air temperature (T [∘K]) (b) and relative humidity (RH [%]) (c) using Eq. (4) in the growing period of 2017 along days of year (DOY) in 2017 at the winter wheat field in Selhausen, Germany. Colored and gray curves indicate daily median, minimum, and maximum of measurements and estimates.
4.2 Water uptake (PWU) from soil into the wheat plants
The water uptake process follows from hydraulic potential gradients and flow resistances in the SPAS. The principle of potential difference by flow resistance is inspired from the field of electricity by Ohm's law. Van den Honert (1948) was one of the first who showed this connecting concept (Cowan, 1965; Monteith and Unsworth, 2013; Nobel, 2020).
The PWU [mm s−1] from the soil into the winter wheat plant can be defined as the potential difference (converted to [mm]) between the soil (SMP) and the vegetation (VWP) divided by the resistance (e.g., in the rhizosphere, roots, and xylem along SPAS, Van den Honert, 1948; Wallace, 1978; Wallace and Biscoe, 1983):
where RRX [s] is the resistance to water flow in the roots and xylem of the wheat plants (Lynn and Carson, 1990) and RS [s] is the resistance to water uptake from the soil into the wheat roots. Since RS and RRX cannot be measured in situ at field scale along the growing season (Wallace, 1978; Wallace and Biscoe, 1983; Ruggiero et al., 2007), all resistances in this study are effective values with no claim on absolute accuracy.
We adopted the approach of Feddes and Rijtema (1972) estimating the RS from soil hydraulic conductivity [m s−1], based on the Campbell model (Campbell, 1974; Choudhury and Idso, 1985a; Lynn and Carlson, 1990; Dingman, 2015; Meyer et al., 2018). We used soil moisture [m3 m−3] (converted from soil permittivity) and soil parameters for silty loam from Clapp and Hornberger (1978) and Steenpass et al. (2010), and a rooting depth of 1 [m] according to the literature (Fan et al., 2016). Figure 5 shows estimates of soil resistance [s] from Feddes and Rijtema (1972) based on soil hydraulic conductivity [m s−1] at 5 and 30 [cm] soil depth.

Figure 5Comparison of the soil permittivity-derived and Campbell (1974) model-based soil hydraulic conductivity [m s−1] and the calculated soil resistance RS [s] from the model of Feddes and Rijtema (1972) implemented according to Choudhury and Idso (1985a): at 5 [cm] (a) and 30 [cm] (b) soil depth; symbols indicate radiometer observation dates along days of year (DOY).
For the root-xylem resistance RRX we deduced an LAI-based linear model from an approach combining in situ measurements with boundary layer modeling, detailed in Lynn and Carlson (1990, Fig. 16):
where LAI (m2 m−2) was measured in situ (cf. Fig. 1) and represents the unit conversion from [bar (W m−2)−1] to [s]. The coefficients in Eq. (6) are empirically derived from the study of Lynn and Carlson (1990) on corn. It should be noted that the relationship for winter wheat may be different than for corn. However, due to its simplicity (linear correlation with LAI ) it makes it possible to dynamize the root-xylem resistance along the growing season, while keeping the number of input variables needed constant. Figure 6 shows RRX along the growing period and its linear relation to LAI.
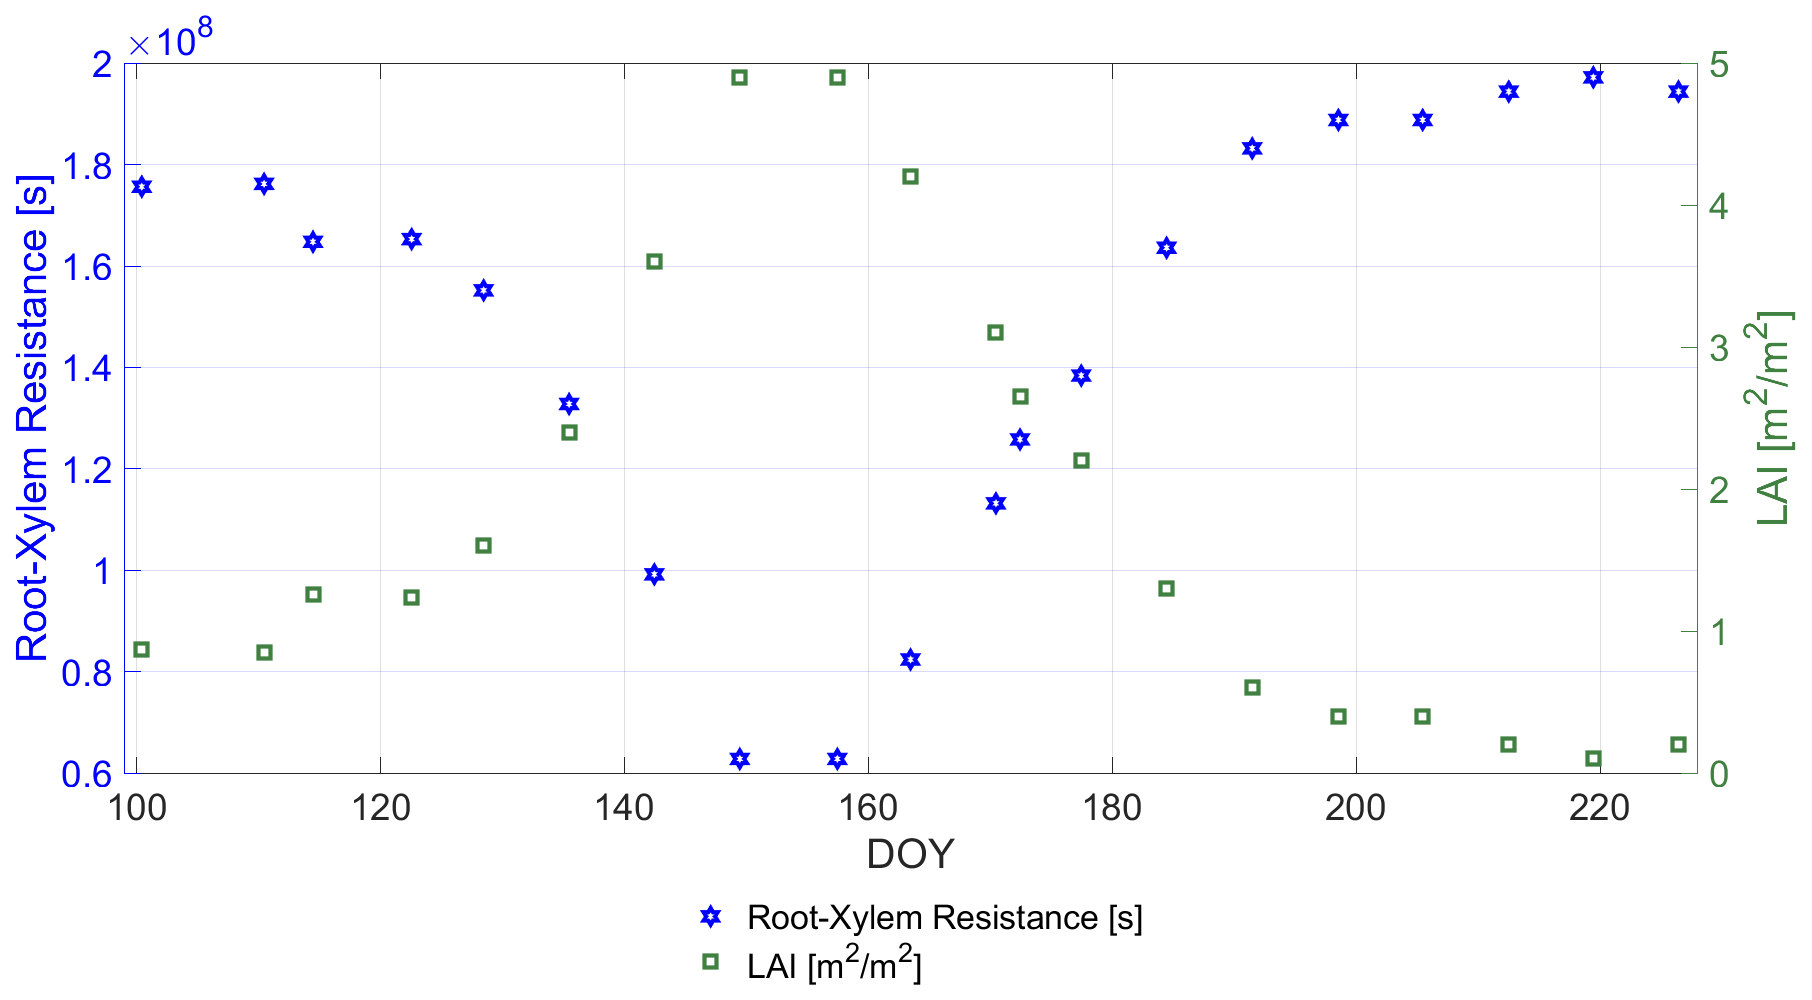
Figure 6Comparison of the in situ-measured leaf are index LAI [m2 m−2] and the calculated root-xylem resistance RRX [s] deduced from Lynn and Carlson (1990) along days of year (DOY).
4.3 Transpiration (TR) from wheat plants into the atmosphere
The TR [mm s−1] from the wheat plants into the surface-proximate atmosphere is expressed as the potential difference between the vegetation (VWP) and the atmosphere (VPD) (at 2 [m] height above ground) divided by the resistances against transpiration. These latter are the resistance of the upper (adaxial) and lower (abaxial) side of the leaves and their respective stomata to water vapor outgassing and the resistance of the surrounding atmosphere (Reichardt and Timm, 2014, p. 277 ff.; Pearcy et al., 2012, p. 175 ff.; Nobel, 2020, p. 415 ff.):
where RA [s m−1] is the aerodynamic resistance of the proximate atmosphere to the absorption of the vaporized moisture (Allen et al., 1998; Monteith, 1965; Chouhury and Idso, 1985). RC [s m−1] is the cuticular resistance of the leaf surface for direct transpiration through the epidermis (fixed to [s m−1]) (Monteith and Unsworth, 2013; Nobel, 2020, p. 415). RC is of minor influence in this study due to non-drought conditions (Duursma et al., 2019). It is included for simplicity as an additive resistance component in Eq. (7) (Nobel, 2020, p. 427 ff.). RST [s m−1] is the resistance of the wheat canopy stomata to transpiration (Gallardo et al., 1996). Damour et al. (2010) provide a comprehensive overview of stomatal resistance models. Choudhury and Idso (1985a) proposed an empirical model for canopy stomatal resistance of field-grown wheat. It is adopted in the following to provide estimates of time-varying stomatal resistance [MPa m−1] values for the winter wheat field (Choudhury and Idso, 1985a), where density of liquid water (997 [kg m−3]) and latent heat of water vaporization (2.2564×10⁶ [J kg−1]) are used to convert units from [s m−1] to [MPa m−1] to match the calculus in Eq. (7) (Monteith and Unsworth, 2013). On-site measurements of solar net radiation [W m−2] (cf. Fig. 1) and VWP were used as inputs to the model. The net radiation as well as the stomatal resistance RST values are displayed in Fig. 7 and compared with values reported in Nobel (2020, p. 421). Details of the implementation are provided in Choudhury and Idso (1985a).
The aerodynamic resistance RA, shown in Fig. 8, is a function of the wind speed (measured at 2 [m] height) and the vegetation height (cf. Fig. 1). The RA calculus was adopted from Monteith (1963). This definition was also adopted by Allen et al. (1998) and Choudhury and Idso (1985a).
Both resistance values (RST, RA) are used together with RC in Eq. (7) to calculate time-dynamic TRs.

Figure 7Comparison of the in situ-measured net solar radiation [W m−2] and the calculated stomata resistance RST [s m−1] of the winter wheat canopy from the model of Choudhury and Idso (1985a) under incorporation of VWP observations (cf. Fig. 1) along days of year (DOY). The gray area indicates two dates where no net solar radiation measurement was available and the resistance values for the canopy are set to fixed values of 168 [s m−1].
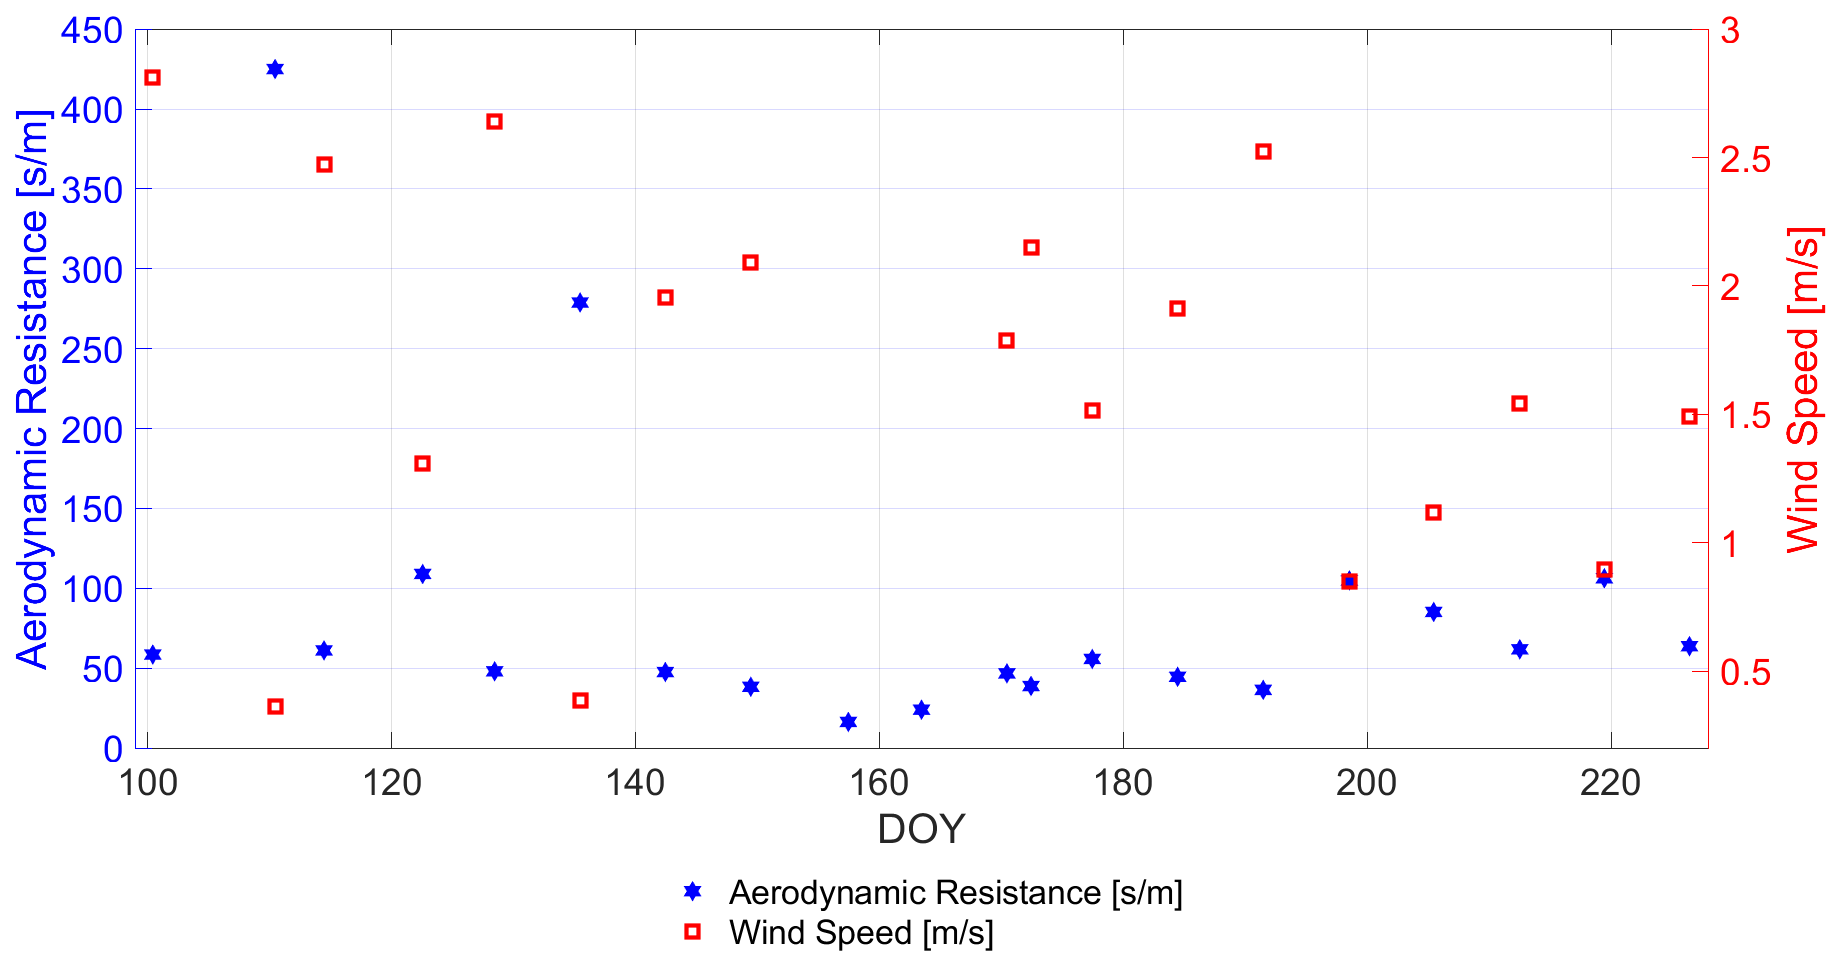
Figure 8Comparison of the in situ-measured wind speed [m s−1] and the calculated aerodynamic resistance RA [s m−1] of the winter wheat canopy from the model of Monteith (1963) (adopted in Choudhury and Idso, 1985a) under incorporation of vegetation height observations (cf. Fig. 1) along days of year (DOY).
Since RA, RC, and RST are effective values (Wallace, 1978; Wallace and Biscoe, 1983) and not directly measurable in situ for an entire wheat field (Selhausen test site) along the full growth period (April to August 2017) (Ruggiero et al., 2007; Blizzard and Boyer, 1980), they were retrieved in a model-based way as introduced earlier.
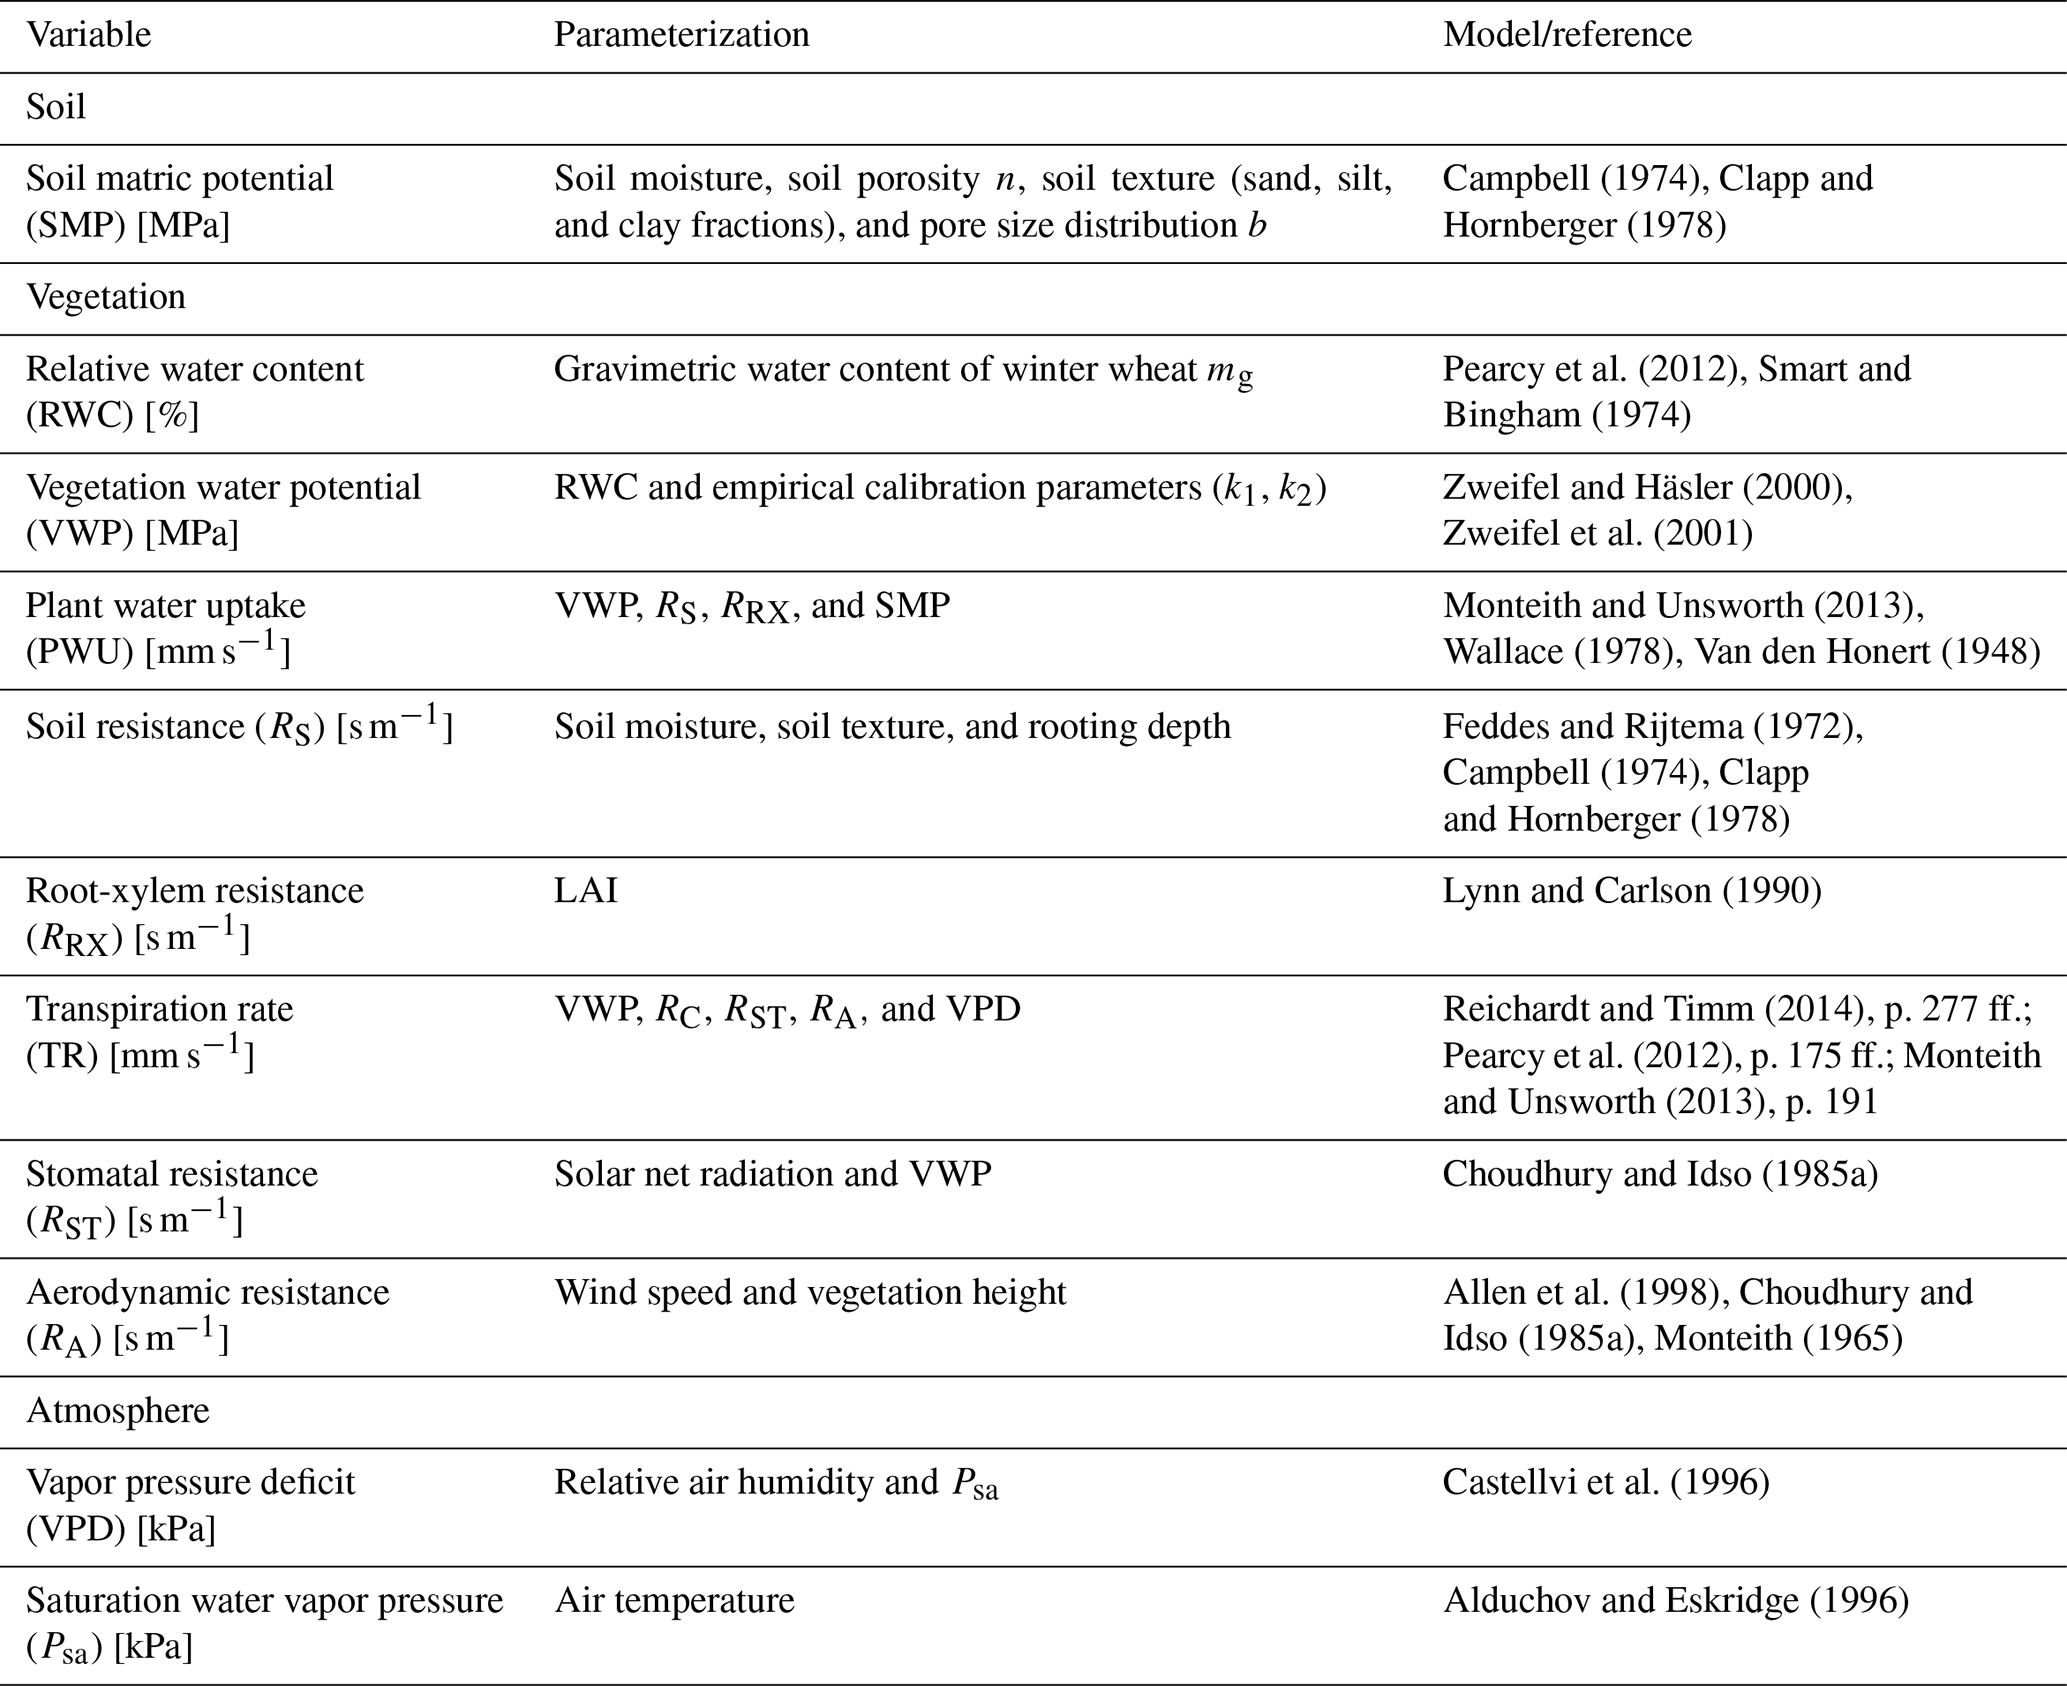
Table 2 provides a summary on the non-directly measured variables for estimation of plant water dynamics that were obtained from parameterizations and models in this study.
Table 2Summary of parameterizations and models for the non-directly measured variables in the estimation of plant water dynamics of winter wheat.
This section shows the water status determined in the soil and wheat plants, as well as the estimated water dynamics from the soil via wheat plants into the atmosphere.
5.1 Water status in the soil
In Fig. 9, we show the estimated SMPs at 5 and 30 [cm] soil depth together with the soil permittivity of the top soil (5 [cm] below surface) and in the root zone (30 [cm] below surface) as well as the daily sum of precipitation.
The highest permittivity values are reached in the top soil after the early senescence with ∼ 15.5 [–], corresponding to a soil moisture value of ∼ 28.4 [vol %]. From DOY 160 to DOY 190 the soil permittivity stays at a low level of ∼ 9 [–] (∼ 16.8 [vol %]), since during that period almost no precipitation occurred. The high correlation between the SMP and soil permittivity curves at 5 [cm] as well as at 30 [cm] soil depth is a result of the fact that soil permittivity is one of the main input parameters within the Campbell model to determine SMP, and, in addition, due to the water retention characteristics between θ and SMP (cf. Sect. 3). After every rain event when soil permittivity increases, the SMP also increases toward less negative values. This is more pronounced for the top soil layer than for the deeper one.
As the empirically fitted parameter b in Eq. (1) was set to 5.3, the soil water retention curve obtained is non-linear. This effect is visible during the dry period between DOYs 140 and 190, where the SMP constantly decreases to more and more negative values until DOY 180 and then increases toward less negative values again. While the soil permittivity decreases, the SMP takes on more negative values. For SMP at 30 [cm] soil depth, the drying period starts at DOY 150, which is slightly delayed in time compared to the start of the drying period of SMP at 5 [cm] soil depth, as indicated in Fig. 9. The drying period affects the deeper soil layers longer (until DOY 200). Furthermore, at around DOY 185 the maximum suction tension with −0.15 [MPa] is lower (by 0.05 [MPa]) for soil in the root zone than for SMP in the top soil.
If SMP at −0.033 [MPa] is considered as field capacity, the estimated results always indicate enough available water for plants to be extracted from the soil across the entire period of investigation. However, if one considers the SMP at −0.01 [MPa] as field capacity, the winter wheat may have less available water some times during the stem elongation and after the early senescence phases. However, rooting depth was not measured along the growing season of 2017, even though it would provide information on the respective water reservoirs assessable for the wheat plants during the different phenological phases. During the period between DOY 178 and DOY 182 the results for SMP at 5 [cm] depth show the highest suction tensions with values down to −0.2 [MPa], whereas the permanent wilting point is around −1.5 [MPa]. This indicates a drier period for the wheat plants, although water from the soil was available for the plants at any time during the growing season (cf. Sect. 3).
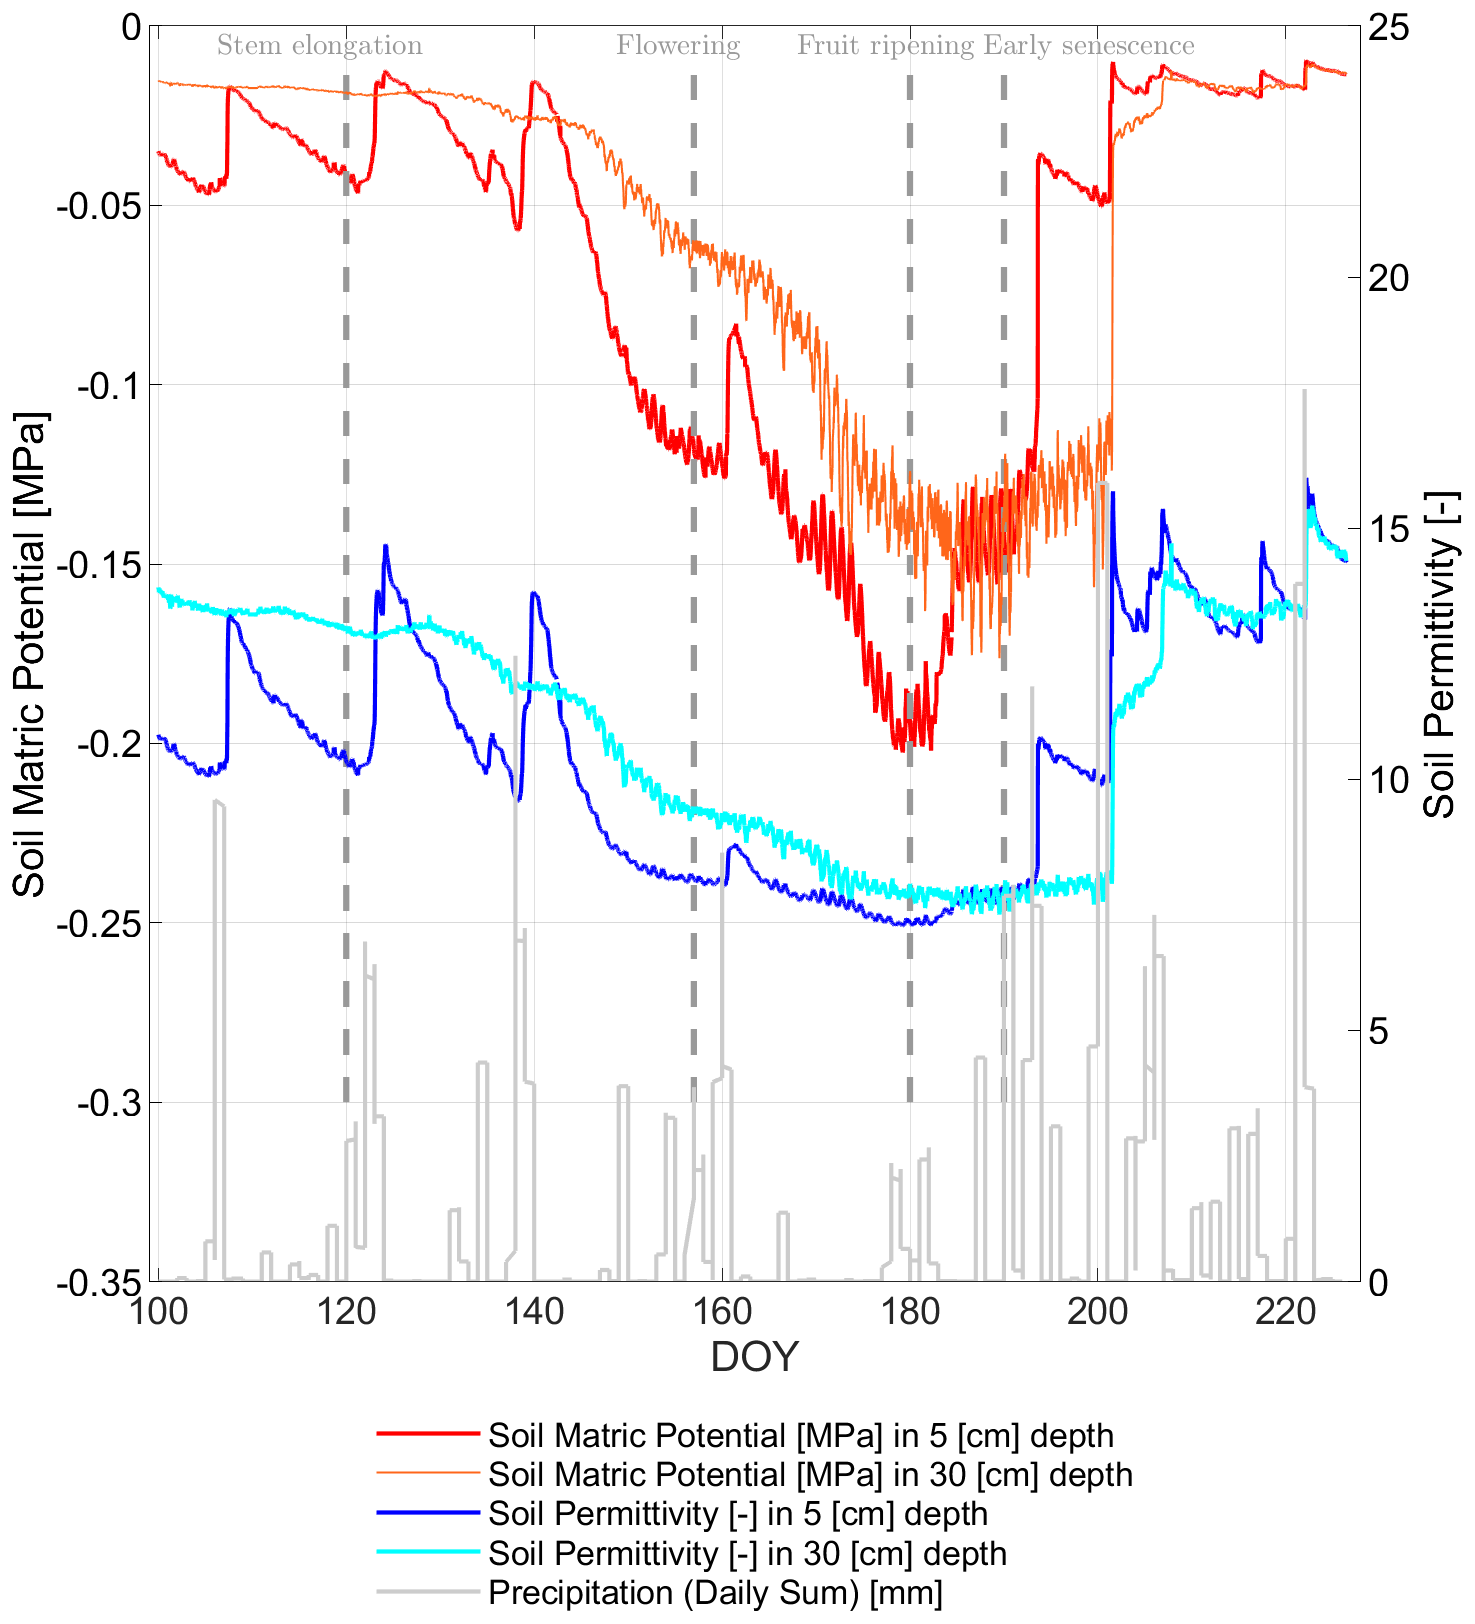
Figure 9Comparison of the temporal evolution of soil matric potential (SMP) [MPa], calculated after Campbell (1974) and Clapp and Hornberger (1978) in 5 [cm] (red curve) and 30 [cm] (orange curve) soil depth from in situ-measured soil permittivity [–] in 5 [cm] (blue curve) and 30 [cm] (cyan curve) throughout growing season of 2017 in days of year (DOY). Gray bars indicate the daily sum of precipitation [mm] at the winter wheat field in Selhausen, Germany.
5.2 Water status in wheat plants
In order to understand the vegetation status along the growing season, mg [kg kg−1] of the winter wheat is calculated from radiometer observations and presented in Fig. 10 (Meyer et al., 2019). Figure 10 indicates the in situ measurements (gray crosses), described in Sect. 2, and the radiometer-based estimates (blue circles) of mg over the wheat growing period (senescence from DOY 191). The overall dry-down of the winter wheat along the growing season accompanied by the ripening of the plants until senescence is tracked by in situ measurements as well as by the radiometer-based mg estimates, despite the fact that both are statistically independent entities.
From Fig. 10, it becomes apparent that the estimates yield a higher mg level in comparison with the in situ measurements in the senescence phase (cf. Fig. 10, DOY 200–226), which can be explained by assuming in the retrieval of Meyer et al. (2019) that the vegetation volume fraction stays constant along the growing season. This is a strong but unavoidable assumption as long as auxiliary information on vegetation volume fraction, as seen by a microwave L-band radiometer, is not at hand. To the authors' knowledge, no measurements for the vegetation volume fraction from L-band radiometers exist to date.
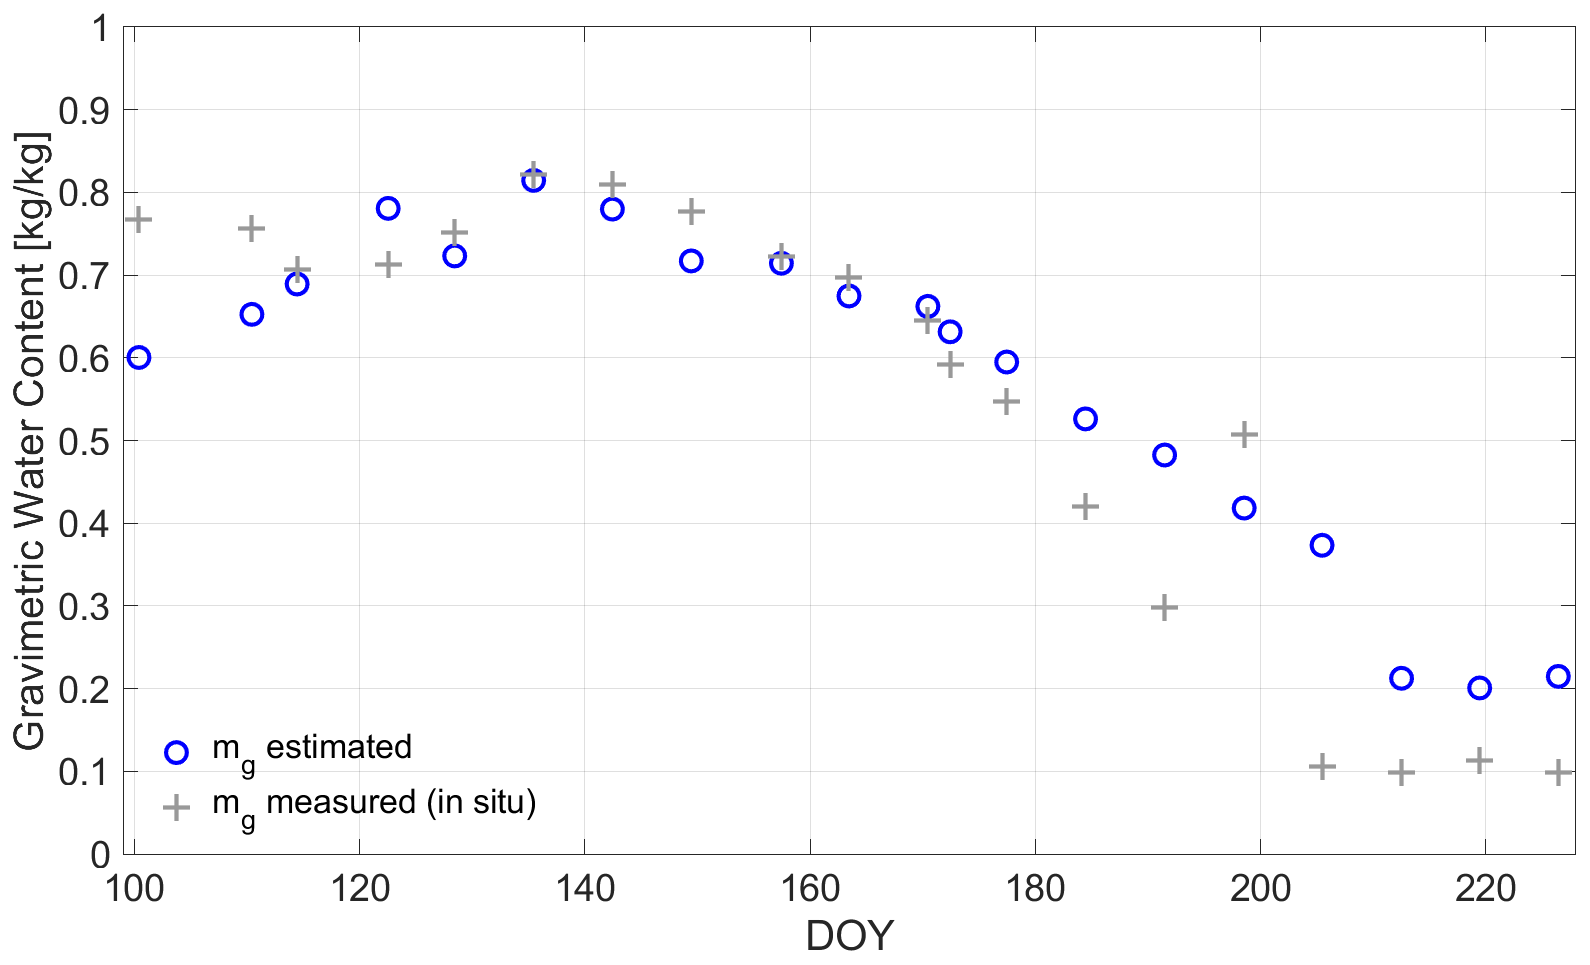
Figure 10Measured (gray crosses) and radiometer-derived (blue circles) gravimetric vegetation water content (mg) [kg kg−1] of winter wheat along days of year (DOY) in the growing season of 2017 at the field laboratory in Selhausen, Germany (Meyer et al., 2019).
In Fig. 11, the RWCSeason is shown for the entire growing period after the calculus from (2) based on mg. A contrasting way of calculating RWCSeason [%] from radiometer-based methods is reported by Rao et al. (2019), but adopted by using the extremes of the VOD along the growing season:
where VODmin and VODmax are the minimum and maximum, respectively, of VOD within the recorded time series. By calculating RWCSeason in this way, it is assumed that VOD is a direct indicator for mg in wheat and does not depend on biomass or vegetation structure. But, as can be seen from the course of RWCSeason,VOD along the growing period (cf. Fig. 11), the water content is low for DOY 100 (tillering), since RWC values are below 10 [–]. Afterward, they increase until DOY 157 (onset of flowering with peak of vegetation height at DOY 149) to the level of RWCSeason, calculated from Eq. (2). In this phase from tillering to flowering, also the main biomass and plant structure developments of the wheat plants took place (cf. Fig. 1) and are included in the VOD signal (Momen et al., 2017). This indicates one shortcoming of assessing the water content directly on the basis of VOD, as in Eq. (8) (Fink et al., 2018; Meyer et al., 2019). However, in periods of constant biomass, that is, times where only the water content in the plants would change, RWCSeason could be directly estimated from VOD (Rao et al., 2019; Holtzman et al., 2020; Xu et al., 2021).
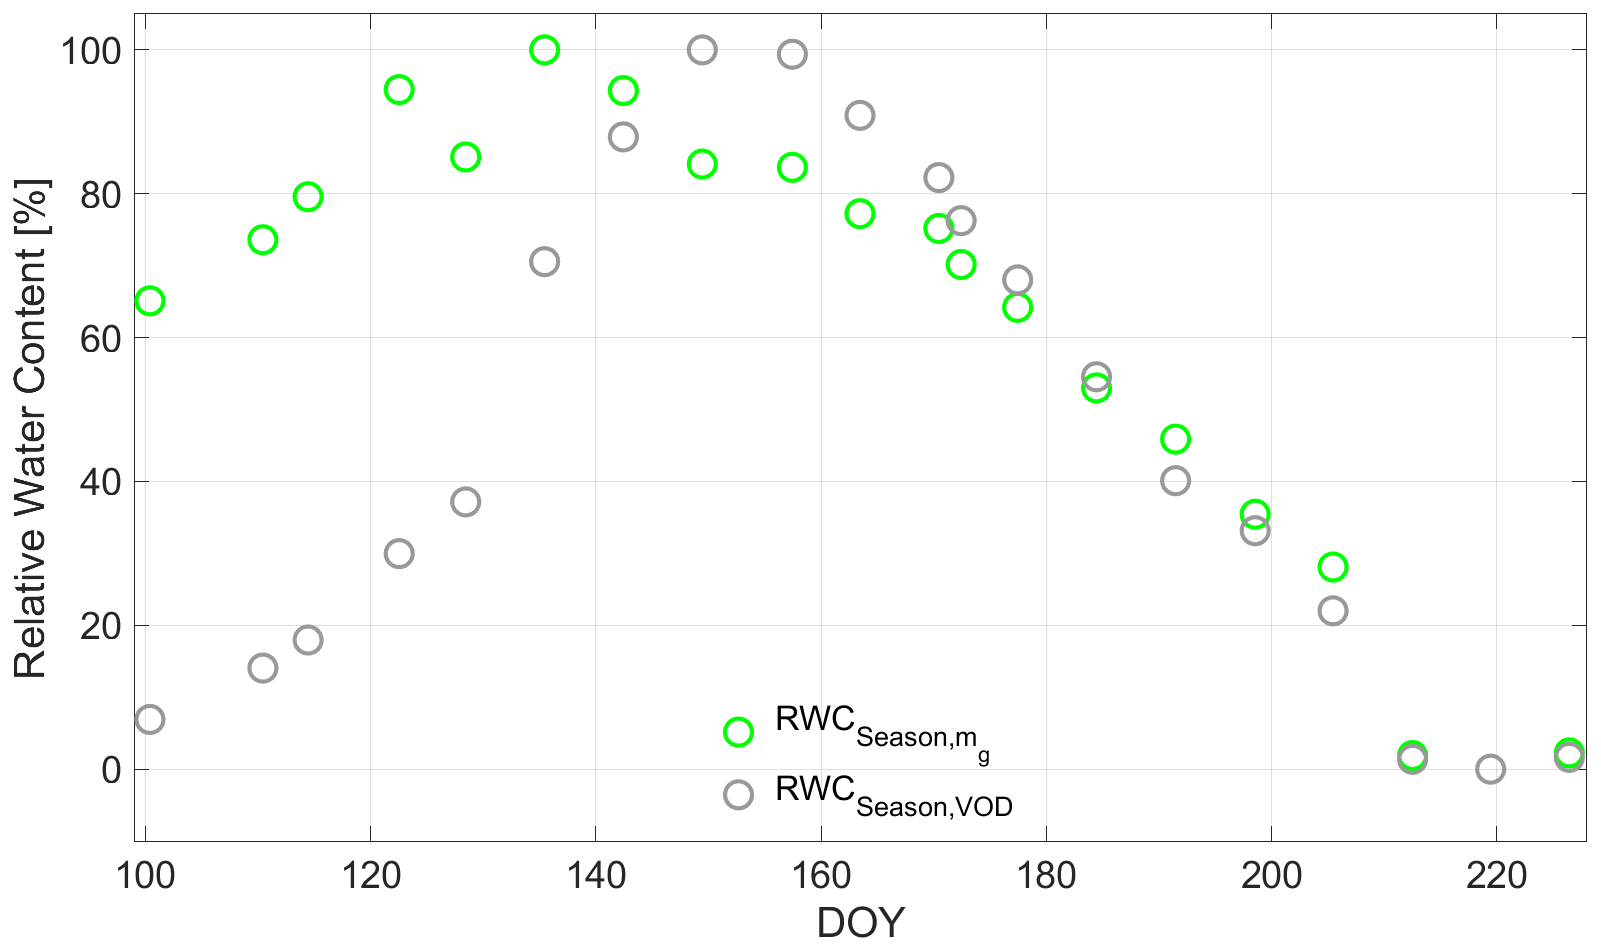
Figure 11Seasonal relative water content (RWCSeason) [%] calculated in Eq. (2) with radiometer-derived mg (green circles) along the growing season of 2017 in days of year (DOY) at the winter wheat field in Selhausen, Germany. The gray circles indicate RWCSeason calculated directly with the radiometer-derived vegetation optical depth (VOD) according to Eq. (9).
From RWCSeason, the VWP of the winter wheat can be retrieved using Eq. (3) and assuming different change rates of VWP according to RWCSeason dynamics (cf. Fig. 3). In the following, the RWCSeason from mg is used in the analyses. Figure 12 shows in green the VWP using intermediate change rate and in the gray area between dashed curves the behavior of the VWP according to the different change rates assumed (blue: slow change rate; red: rapid change rate).
Hence, the influence of k1 and k2 in Eq. (3) is evident. The three different change rates (slow, intermediate, and rapid) represent the possible spread of RWC–VWP relationships occurring for winter wheat and provide a potentially occurring VWP value range resulting from the different change rate assumptions.
The common trends of the VWP value range might be interpreted as guided by the precipitation inputs along the growing season (cf. Fig. 9): SMP in the top soil (0–5 [cm]) and in the deeper soil layers (30 [cm]). The SMP increases to less negative values with each infiltrating precipitation impulse.
Then, SMP gradually decreases in periods of dry-downs (between the rain events, e.g., DOY 165 to DOY 175). VWP does not follow SMP at any depth from DOY 100 to DOY 140. This might be partly due to the distinct phenological changes (stem elongation) or the lower temperature regime, since mean daily temperatures can be seen to slowly increase from around 10 [∘C] to about 20 [∘C] in these 40 d (cf. Fig. 4). In addition, the VWP matches the SMP values close to zero in this period (cf. Fig. 12). This indicates a sufficient water supply (close to or at field capacity) of the wheat plants with sufficient canopy hydration.
Figure 12Comparison of in situ-based soil matric (both blueish curves) and radiometer-based vegetation water (solid green and small dashed curves) potentials (SMP [MPa] and VWP [MPa]) in the growing period of 2017 along days of year (DOY) at the winter wheat field. The gray-shaded area indicates the potential variability of the estimated VWP depending on the relationship applied in Eq. (3) (cf. Fig. 3). Vertical dashed lines indicate major phenological phases of the winter wheat.
A distinct decrease in VWP to more negative values occurs between DOY 140 and DOY 180. In line with results from Choudhury and Idso (1985b), this decrease to strongly negative values is concurrent with a period of low rainfall and high evapotranspiration due to higher air temperature with a daily mean of around 20 [∘C] (cf. Fig. 4) and the maturation of the wheat in fruit development stage toward full biomass stage at DOY 191 (cf. also Table 1).
Moreover, the different sampling rates for SMPs and VWP should be kept in mind, as SMPs and VWP originate from different sources (SMPs: in situ soil moisture measurements; VWP: L-band radiometer observations). However, the trend of both potentials (soil and vegetation) for the period of fully developed wheat canopy from DOY 140, with peak LAI at DOY 149 (cf. Fig. 4), to DOY 180 is apparently consistent with the in situ conditions of a diminishing water availability in the soil and subsequently for the wheat plants.
Due to the onset of senescence in the wheat stand (latest DOY 200), the water supply of the drying plants decreases in importance, as the fruit (grains) ripen, meaning that its content of liquid in the grains decreases (Steduto et al., 2012; Sarto et al., 2017). Hence, water availability is no longer the limiting factor and the concurrency of SMP and VWP trends vanishes completely. SMPs at both depths increase to less negative values by a series of irregular rain events starting from DOY 180. VWP reaches the minimum of −2.5 [MPa] (cf. Fig. 12) at around DOY 200. This indicates that water loss in the plant due to senescence processes (strong increase of RRX) reached a stage where water content (mg) falls to a minimum. Subsequently, VWP reaches its predefined minimum value (VWPmin= −2.5 [MPa]), which was set for the semi-empirical relationship between water content and WP (cf. Eq. 3 and Fig. 3).
5.3 Seasonal water dynamics along the SPAS
Previous results (Figs. 10–12) presented the water filling status and the WP in soil and wheat vegetation. The analyses are now taken one step further by using the differences of the potentials (between atmosphere and vegetation as well as between vegetation and soil) together with soil, plant, and atmosphere resistance estimates to assess water fluxes from soil to atmosphere: PWU and TR.
In Fig. 13, the PWU [mm s−1] (blueish curves) is depicted as time-variable uptake (depending on soil and root-xylem resistances used in Eq. 5) together with its radiometer-based input parameter VWP (green curve). The other input parameter in Eq. (5) is SMP, which is illustrated in Fig. 10 for both soil depths.
The blue PWU curves in Fig. 13 show an overall decline of water uptake until DOY 122. This results from a sufficient supply by precipitation water (SMP <−0.05 [MPa]) under low evaporative conditions (daily mean of VPD <0.5 [kPa] and of air temperature around 10 [∘C]) and wheat plants in tillering and early stem elongation phase, but without major biomass development (DOY 122: LAI = 1.24 [–], plant height = 0.25 [m] and above ground biomass = 0.24 [kg m−2]; all values from Fig. 1 and Table 1).
Figure 13Comparison of radiometer-based plant water uptake PWU [mm s−1] (blueish curves with variable soil resistance at 5 [cm] and 30 [cm] soil depth) and vegetation water (solid green curve) potential VWP [MPa] along the growing season of 2017 for days of year (DOY) at the winter wheat field in Selhausen, Germany. The gray-masked area indicates the senescence phase where the water uptake estimates are no longer valid due to simplifying assumptions in the calculus of the root-xylem resistance. Vertical dashed lines indicate major phenological phases of the winter wheat.
From DOY 122 to DOY 142 (stem elongation phase) the biomass level increased slightly, but due to the wheat stalk development, the vegetation height and LAI changed significantly from 0.25 [m] to 0.56 [m] and 1.24 [–] to 3.6 [–], respectively (cf. Fig. 1). Moreover, the soil hydraulic conductivity and the respective soil flow resistance RS (cf. Fig. 5) showed a steady decrease in water flow conditions at 30 [cm] depth and a fluctuating behavior due to rain impulses at 5 [cm] depth. Hence, the PWU curves (blueish lines in Fig. 13) show the same trends for 30 and 5 [cm] depth, having a lower level of PWU at shallower soil depth resulting from smaller soil hydraulic conductivity values (cf. Fig. 5). The lowest PWU values in the range of [mm s−1] are supported by the analysis of Cai et al. (2018), working at the same test site (Selhausen) and the same crop type (winter wheat), but in 2016.
The root-xylem resistance RRX in Fig. 6 indicates a steady decrease until DOY 142, clearly following its driving parameter LAI. The assumption behind is an increase in roots and xylem vessels concurrent to leaf growth leading to an increase in flow capacities along plant development (Lynn and Carlson, 1990). Until DOY 142, PWU curves are guided by RRX rather than RS due to stronger resistance values of the root-xylem system in the early development stages of the winter wheat compared to a sufficiently watered soil for uptake (cf. Figs. 5 and 6).
Afterward, PWU decreased and increased with different strength from DOY 142 until the senescence phase (DOY >190). First, there is a distinct decrease from DOY 142 to DOY 157 (inflorescence and flowering phase, cf. Table 1). In this phase the soil moisture dropped mainly due to a daily mean air temperature of about 20 [∘C] and absence of major precipitation events, leading to an SMP decrease from −0.03 [MPa] to −0.12 [MPa]. This is accompanied by a significant increase in soil resistance (cf. Fig. 5) and a decrease in root-xylem resistance (cf. Fig. 6).
From DOY 157 to DOY 180 (flowering and grain development phase) rain input was absent and soil water decreased with SMP values up to −0.2 [MPa] on DOY 180 and a soil conductivity minimum of [m s−1] (cf. Fig. 5). The VWP values strongly dropped from −0.28 [MPa] to about −1.75 [MPa]. In this period PWU increased, in the beginning stronger and then only slightly, indicating water depletion from the soil (cf. Fig. 9) in the reproductive stage of the wheat plants.
In the last grain development phase (DOY 180 to DOY 190) before senescence (DOY >190), the VWP further decreased to −2.38 [MPa], but with a milder slope due to refilling water in soils (note that SMP for both soil depths increased to −0.14 [MPa] during several consecutive rain events as seen in Fig. 9 as gray bars). The PWU curves at 5 [cm] depth start to rise again from DOY 191 to DOY 198 due to the first strong rain impulses seen first by the top soil (cf. Fig. 13).
In the senescence phase (DOY 199), the soil moisture was no longer the limiting factor and VWP dropped to its predefined minimum of −2.5 [MPa] as soon as RWC reached a level of 35 [%], subsequently approaching almost zero beyond DOY 210 (cf. Fig. 11). In Fig. 13 a gray-masked area indicates the senescence phase where the water uptake estimates are no longer valid, since root-xylem resistance is considered to be solely dependent on LAI in Eq. (6).
After uptake of water into the wheat plants, we focus in the following on water release from the wheat plants into the atmosphere. In Fig. 14, the estimated TRs [mm s−1] are shown along the growing season including its input variables VWP and VPD. The value range of the TR estimates is similar to the range presented by Kang et al. (2003) and Zhang et al. (2019) for winter wheat fields, whereby the latter also analyzed different fertilization levels. The general trend of the TR curves indicates considerable concurrency with the PWU curves over the entire season in Fig. 13. This connection of dynamics, pointing toward steady water flow along the SPAS, supports the connection of the different water storage compartments in the system.
However, the magnitudes of TR and PWU are different especially around the ripening phase of the wheat (around DOY 180) due to differently modeled time-variant flow resistances for both processes. This is more decisive for transpiration (including radiation and temperature dependence within VPD) having a stronger diurnal cycle than water uptake (including mainly moisture dependence within the soil matric potential). Hence the temporal dynamics and magnitudes of TR and PWU exhibit no absolute concurrency due to the dependence of TR to faster changing atmospheric conditions, while the dependence of PWU is on slower changing soil conditions.
Figure 14(a) Minimum and maximum of the vapor pressure deficit (VPD) [kPa] for atmospheric water need shown with gray lines. The asterisks indicate the VPD values at time of radiometer measurement. The x-axis labels are the same as for (b). Bottom: Comparison of radiometer-based transpiration rates TR [mm s−1](cyan curve for variable canopy and aerodynamic resistances as well as a fixed cuticular resistance) and vegetation water potential (green curve) VWP [MPa] along the growing period of 2017 for days of year (DOY) at the winter wheat field in Selhausen, Germany. The gray-masked area indicates the senescence phase where the assumption in the stomatal resistance calculus is not applicable. Vertical dashed lines indicate major phenological phases of the winter wheat.
Considering both flux estimates, we recall that for calculating PWU and TR two substantially different in situ measurements (SMP, VPD) were paired together with the same radiometer-based VWP input. However, the dynamics of both fluxes (PWU, TR) are concurrent in trend and show considerable similarity along the wheat growing season. This comes with the caveat that the applied resistances of the soil–plant–atmosphere compartments were derived from the literature (RC) or from auxiliary in situ information (e.g., soil hydraulic conductivity, LAI, net solar radiation, and wind speed) applied in empirical models (RS, RRX, RST, RA), (Manzoni et al., 2013b; Monteith and Unsworth, 2013). Nonetheless, VWP as a radiometer-based potential estimate shows considerable similarity in temporal dynamics to the on-site measurement-derived potentials of soil (SMP) and atmosphere (VPD).
For the first comparison with an independent dataset, the estimated TRs of the space-borne ECOSTRESS sensor were used (cf. Sect. 2 for sensor and product characteristics) and shown in Fig. 15. Our results show that the value ranges of the ECOSTRESS estimates are equivalent (showing the same order of magnitude) to the field-based TR estimates at Selhausen. In Fig. 15 the TR estimates are presented for several years (2017, 2019–2021) and with different sample sizes. Note that the heterogeneity of land surface conditions at the spatial resolution of ECOSTRESS (70 [m]) does not allow for direct validation against the in situ measurements.

Figure 15Boxplots of estimated transpiration rates TR [mm s−1] comparing the field-based estimates presented for the Selhausen test site (see Fig. 14) and (a) the space-borne ECOSTRESS daily product and (b) the instantaneous product. The number of samples (n) is indicated at the top of each box. For each box, the red line shows the median, top and bottom edges are percentiles 75 and 25, respectively, top and bottom whiskers are percentiles 95 and 5, respectively, and red crosses indicate outliers.
This concept study presents a radiometer-based approach to estimate time-dynamic flux rates (plant water uptake and transpiration) from water status observations along the SPAS, even if assumptions on water flow properties (soil and plant hydraulic traits, e.g., effective soil porosity, rooting depth, and flow resistances) and some ancillary data are necessary. With the proposed approach, analyses of the SPAS are enabled covering the different water pools (soil, plant, and atmosphere), their potentials (suction tension), and in-between fluxes (uptake, transpiration). Water pools are accessible depending on the measurement depth and sensing volume of the in situ and remote-sensing sensors (cf. Sect. 2). In the case of the in situ soil instruments, only the soil moisture and SMP down to 30 [cm] were accessible, which may not cover the entire water reservoir from which the wheat roots can take up water. The water may also come from deeper layers. However, White et al. (2015) report that for winter wheat (in 17 experiments) the soil depths of 10 and 30 [cm] showed a median of the root length density (RLD) above the critical RLD of 1 [cm cm−3] for wheat.
In addition to the limitation in sensing depth, the study solely relies on snapshot analysis of radiometer-based vegetation parameters (e.g., mg, RWC and VWP) for single days along the growing period, since radiometer measurements were only conducted over 1–2 h within 09:00 and 14:00 on a measuring day. No analyses on the diurnal cycle of RWC, VWP, PWU, and TR or their sub-daily variability within the wheat canopy can be provided, but are reported in the literature (e.g., Dutt and Gill, 1978). Thus, the study results are representative with respect to their trends along the growing season and not for diel dynamics (Konings et al., 2021).
Moreover, as the setup of the experiment at the Selhausen field laboratory is temporally confined (one growing season), specific in setup (metal mesh for soil signal blockage; only vegetation-related signals included), small-scale (one field), and single-species (only winter wheat), it is currently not possible to significantly generalize the present results with respect to other temporal and spatial domains, species (traits and phenologies), and scales (cf. Konings et al., 2019, 2021). Furthermore, the generalization of the method is challenging, since, for instance, the RWC to VWP conversion (cf. Fig. 3) is plant type-specific (Martínez-Vilalta et al., 2019) and not yet well understood for spatiotemporal resolution conditions of satellite radiometer (passive microwave) remote sensing with resolutions of kilometers in space and days in time (cf. Fig. 2 in Konings et al., 2019). This means the rate and strength of water supply on potential (suction) reduction are not accessible at field scale and along the growing season from the on-site measurements, but in a first attempt deducible from the literature survey (Turner and Long, 1980; Turner, 1988; Zweifel and Häsler, 2000; Zweifel et al., 2001; Pearcy et al., 2012).
Since variables, such as the soil, wheat canopy, and atmospheric resistances, are not directly measured in situ at the field scale, they are estimated in the study using (wheat-specific) mechanistic models for soil, root-xylem, stomatal, and aerodynamic resistances fed with (auxiliary) on-site measurements (cf. Sects. 3.2 and 3.4 for details). However, the mechanistic models are empirically derived and therefore not complete in terms of their inclusion of all potentially occurring flow resistances within the wheat plants, e.g., intercellular air space resistance.
We conducted an uncertainty analysis on the flow resistances and found that introducing up to 20 % uncertainty does not change the seasonal trend of the PWU and TR estimates. However, the higher the initial PWU and TR estimates, the stronger the effect of the included uncertainty. This led to uncertainty-induced changes in PWU and TR of maximum [mm s−1] (30 [cm] depth), [mm s−1] (5 [cm] depth) and [mm s−1], respectively, when including 20 % uncertainty.
As briefly mentioned earlier, the soil emission is completely blocked physically by a metal mesh on the ground (Meyer et al., 2018). This could be recognized as a burden on larger-area monitoring of water dynamics with space-borne radiometer-based retrievals. However, a joint approach combining emission modeling and data inversion (e.g., using zeroth- or first-order radiative transfer models, Wigneron et al., 2017) was tested in Meyer et al. (2018) on another part of the wheat field without mesh coverage. Soil and vegetation emission signals were separated leading to equivalent estimates of soil moisture and VOD compared to the values from the mesh-covered part (VOD) and from the in situ measurements (soil moisture). Hence, soil moisture products from operating satellite radiometer missions, such as SMAP, could be used for wide-area studies (Konings et al., 2017).
Despite all restrictions (due to having no complete measurement portfolio of all SPAS variables), no attempts have been reported in the literature which follow a similar approach combining soil, plant, and atmosphere information from L-band passive radiometry with (on-site) measurements at the field scale. One exception is the correlation of L-band radiometer-derived VOD with WP measurements of a tree stand at Harvard Forest along one growing season (Holtzman et al., 2020). In any case, there is a need for remote-sensing-scale analyses of transfer functions from VOD via water content to WP in plants, which must be different from laboratory analyses of single tissues of leaves (Turner, 1988).
In this way, atmosphere and soil information, such as the VPD or soil moisture, can already be derived today on a global scale from space-borne remote-sensing sources, e.g., VPD from Atmospheric Infrared Sounder (AIRS) on-board NASA's Aqua satellite (Feldman et al., 2020) or surface soil moisture from SMAP or SMOS microwave radiometer missions (Entekhabi et al., 2010; Kerr et al., 2010). In addition, a major part of the additional soil–plant–atmosphere parameters, needed as input in the water dynamic calculus presented here and listed in Table 2, can already be estimated from multisensor remote sensing, including lidars (vegetation height, e.g., from the Global Ecosystem Dynamics Investigation (GEDI) lidar), optical sensors (solar net radiation, LAI, e.g., from Copernicus Global Land Service using the Sentinel-3 instrument), radars/scatterometers (vegetation volume fraction, VOD, e.g., from ASCAT, Liu et al., 2021), and radiometers (VOD). However, this comes with the limitations in spatiotemporal as well as in spectral coverage of remote-sensing systems, whether active (e.g., lidar, radar) or passive (e.g., spectrometer, radiometer) systems are used (Horning et al., 2010). Moreover, it has to be acknowledged that remote-sensing acquisitions do not purely sense one variable of the earth system, but normally a mixture of variables (e.g., a combination of soil and vegetation variables; Jackson and Schmugge, 1991; Jagdhuber, 2012). Hence, the quality of retrieved earth system variables (e.g., soil or plant moisture), extracted from remotely sensed observations, depends directly on the sophistication of the signal-to-variable conversion (e.g., Du et al., 2016).
In fact, L-band radiometry does not measure fluxes directly, but brightness temperatures (Ulaby and Long, 2013). Hence, estimates of the water reservoirs (soil moisture, plant moisture, and RH of atmosphere) need to be retrieved by multisensor remote sensing. Afterward, performant estimates of the WPs need to be established based on the water reservoir estimates (Holtzman, 2021; Jagdhuber et al., 2021) or other techniques (first attempts with GPS sensors in Humphrey, 2021). In the end, the WP estimates need to be converted to the water fluxes, here the essential auxiliaries are the flow resistances of the soil, vegetation, and atmosphere (Pearcy et al., 2012; Nobel, 2020). For these reasons, we advocate that in order to retrieve exact water flow dynamics at remote-sensing scales, a plausible solution may come from the combination of soil–plant–atmosphere transport or vegetation growth models and high spatiotemporal resolution remote-sensing data from multiple instruments (Wang and Engel, 2002; Palosuo et al., 2011). This multisource approach will be key for applications requiring quantitative estimates of water fluxes in time and space and should be the subject of further research.
The objective of this concept study was to investigate whether observations of a ground-based radiometer over a winter wheat field allow for the estimation of seasonal flux rates of water (plant water uptake and transpiration) along the soil–plant–atmosphere system (SPAS). We started from L-band vegetation optical depth (VOD) together with on-site measurements of soil and atmosphere. The major research question was how far these observations contain enough information to derive WPs and flux rates.
Initial conclusions can be drawn within the boundaries of the experimental setup, discussed in the previous section. To arrive at exact water fluxes in the SPAS of winter wheat needs more information (e.g., about soil, plant, and atmosphere resistances) than initially acquired during the campaign in 2017 at the Selhausen (Germany) field laboratory. The campaign was originally not designed for studying water fluxes in the SPAS. Existing on-site measurements of soil (permittivity), plant (height and LAI), and atmosphere (net radiation, temperature, RH of air) were used here to estimate water flux rates (PWU and TR). Hence, it is imperative to have water status information (θ, mg, RH) along the SPAS for estimating water dynamics (cf. Fig. 2). Otherwise, these dynamics cannot be fully assessed.
We were able to obtain reasonable estimates of WPs and water flux rates in terms of the major trend along the season (cf. Sects. 4.2–4.3 and Figs. 12–14). The results reveal the capacity of the setup to assess water dynamics of a wheat field. A first comparison of TR estimates from the presented field-based approach and from the space-borne ECOSTRESS mission indicates similar value ranges (same order of magnitude, mainly between 0 and [mm s−1]). However, the validation of absolute accuracies needs to be tackled in future studies with dedicated in situ measurements of water dynamics (potentials and flux rates). This is especially true for the PWU estimates where no comparison or validation dataset was available, in contrast to the TR case.
In these dedicated field laboratory studies, explicitly including ground-based (L-band) radiometry and other remote-sensing sensors together with in situ measurements, the focus will be on validation of the water flux dynamics with measurements of soil WP, leaf WP, sap flux, stomatal conductance, and TRs. On the basis of the initial results of this study, we advocate that a hybrid-based (remote sensing and earth system models), large-area (up to global) SPAS assessment could potentially be established in the future. For this, the study indicates that with more measurements or broader knowledge of plant characteristics regarding water flux, the approach should be applicable to more plant types and beyond field scale connecting to the spatial mapping capabilities of space-borne sensors. Future missions, such as the Copernicus Imaging Microwave Radiometer (CIMR) of the European Space Agency (ESA) (Kilic et al., 2018), could be potential candidates for addressing research on water fluxes within the SPAS on a global scale. This would exploit the benefit of multiple sensing frequencies allowing for different penetration and transmission capabilities through vegetation canopies (Prigent and Jiménez, 2021; Zhao et al., 2021). Advanced methodologies exploiting the synergies from present and planned satellite constellations will possibly enable a frequent and large-scale mapping of water fluxes through the SPAS.
All data were recorded by Forschungszentrum Jülich, Institute of Bio- and Geosciences, Agrosphere (IGB-3), and are partly available upon request from François Jonard (f.jonard@fz-Juelich.de). TERENO data are available at https://www.tereno.net, last access: 22 April 2022. ECOSTRESS datasets are freely available at https://ecostress.jpl.nasa.gov/data/ (Hook and Fisher, 2019).
TJ, FJ and MP designed the study concept. TJ, AF, FJ, DC and MP were involved in developing the methodology. The software was created by TJ, FJ, AF and TM All were taking part in the formal analysis. Data curation was conducted by TM, FJ, TJ and AF The original draft was written and prepared by TJ, AF, FJ, DC, MJB and MP Draft editing and review was done by all authors. TJ, AF, FJ, MJB and TM worked on visualization of the manuscript content and MP supervised all activities.
The contact author has declared that neither they nor their co-authors have any competing interests.
Publisher’s note: Copernicus Publications remains neutral with regard to jurisdictional claims in published maps and institutional affiliations.
This article is part of the special issue “Microwave remote sensing for improved understanding of vegetation–water interactions (BG/HESS inter-journal SI)”. It is not associated with a conference.
The authors thank Andrew Feldman (MIT), Dara Entekhabi (MIT), Stan Schymanski (LIST) and Jordi Martínez-Vilalta (CREAF) for their helpful comments and suggestions supporting this research. They also thank Mark Lützner for language editing. The authors want to acknowledge MIT for supporting this research with the MIT-Germany Seed Fund “Global Water Cycle and Environmental Monitoring using Active and Passive Satellite-based Microwave Instruments” and with the MIT-Belgium UCL Seed Fund “Early Detection of Plant Water Stress Using Remote Sensing”. The ELBARA-II radiometer was provided by the Terrestrial Environmental Observatories (TERENO) initiative funded by the Helmholtz Association of German Research Centers.
David Chaparro has received funding by “la Caixa” Foundation (ID 100010434), under agreement LCF/PR/MIT19/51840001, by the MIT-MISTI, by the XXXIII Ramón Areces Postdoctoral Fellowship, and by grants PID2020-114623RB-C32 and MDM-2016-0600 funded by MCIN/AEI/10.13039/501100011033 and by the European Regional Development Fund (ERDF, EU). María Piles was supported by grant RTI2018-096765-A-100 funded by MCIN/AEI/10.13039/501100011033 and by the European Regional Development Fund (ERDF, EU).
The article processing charges for this open-access publication were covered by the German Aerospace Center (DLR).
This paper was edited by Julia K. Green and reviewed by Mostafa Momen and two anonymous referees.
Alduchov, O. A. and Eskridge, R. E.: Improved Magnus form approximation of saturation vapor pressure, J. Appl. Meteorol., 35, 601–609, 1996.
Allen, R. G., Pereira, L. S., Raes, D., and Smith, M.: Crop evapotranspiration-Guidelines for computing crop water requirements-FAO Irrigation and drainage paper 56, FAO, Rome, 300, D05109, ISBN 92-5-104219-5, 1998.
Blizzard, W. E. and Boyer, J. S.: Comparative resistance of the soil and the plant to water transport, Plant Physiol., 66, 809–814, 1980.
Bonan, G. B., Williams, M., Fisher, R. A., and Oleson, K. W.: Modeling stomatal conductance in the earth system: linking leaf water-use efficiency and water transport along the soil–plant–atmosphere continuum, Geosci. Model Dev., 7, 2193–2222, https://doi.org/10.5194/gmd-7-2193-2014, 2014.
Brooks, R. H. and Corey, A. T.: Properties of porous media affecting fluid flow, J. Irrig. Drain. Div., 92, 61–90, 1964.
Bruns, H. A. and Croy, L. I.: Key developmental stages of winter wheat, Triticum aestivum, Econ. Bot., 37, 410–417, 1983.
Cai, G., Vanderborght, J., Langensiepen, M., Schnepf, A., Hüging, H., and Vereecken, H.: Root growth, water uptake, and sap flow of winter wheat in response to different soil water conditions, Hydrol. Earth Syst. Sci., 22, 2449–2470, https://doi.org/10.5194/hess-22-2449-2018, 2018.
Campbell, G.: A simple method for determining unsaturated conductivity from moisture retention data, Soil Sci., 117, 311–314, 1974.
Castellvi, F., Perez, P. J., Villar, J. M., and Rosell, J. I.: Analysis of methods for estimating vapor pressure deficits and relative humidity, Agr. Forest Meteorol., 82, 29–45, 1996.
Choat, B., Brodribb, T. J., Brodersen, C. R., Duursma, R. A., López, R., and Medlyn, B. E.: Triggers of tree mortality under drought, Nature, 558, 531–539, 2018.
Choudhury, B. J. and Idso, S. B.: An empirical model for stomatal resistance of field-grown wheat, Agr. Forest Meteorol., 36, 65–82, 1985a.
Choudhury, B. J. and Idso, S. B.: Evaluating plant and canopy resistances of field-grown wheat from concurrent diurnal observations of leaf water potential, stomatal resistance, canopy temperature, and evapotranspiration flux, Agr. Forest Meteorol., 34, 67–76, 1985b.
Clapp, R. B. and Hornberger, G. M.: Empirical equations for some soil hydraulic properties, Water Resour. Res. 14, 601–604, 1978.
Cowan, I. R.: Transport of water in the soil-plant-atmosphere system, J. Appl. Ecol., 2, 221–239, 1965.
Curtis, B. C., Rajaram, S., and Gómez Macpherson, H.: Bread wheat: improvement and production, Food and Agriculture Organization of the United Nations (FAO), Report, edited by: Curtis, B. C., Rajaram, S., and Gómez Macpherson, H., Food and Agriculture Organization of the United Nations (FAO), Rome, Italy, ISBN 9251048096, 2002.
Damour, G., Simonneau, T., Cochard, H., and Urban, L.: An overview of models of stomatal conductance at the leaf level, Plant Cell Environ., 33, 1419–1438, 2010.
Dingman, S. L.: Physical hydrology, Waveland Press, Long Grove, USA, ISBN 9781478611189, 2015.
Du, J., Kimball, J. S., and Jones, L. A.: Passive microwave remote sensing of soil moisture based on dynamic vegetation scattering properties for AMSR-E, IEEE Trans. Geosci. Remote Sens., 54, 597–608, 2015.
Dutt, S. K. and Gill, K. S.: Diurnal changes in leaf water potential of rice, barley and wheat, Biol. Plantarum, 20, 472–474, 1978.
Duursma, R. A., Blackman, C. J., Lopéz, R., Martin-StPaul, N. K., Cochard, H., and Medlyn, B. E.: On the minimum leaf conductance: its role in models of plant water use, and ecological and environmental controls, New Phytol., 221, 693–705, 2019.
Eamus, D., Huete, A., and Yu, Q.: Vegetation dynamics, Cambridge University Press, UK, ISBN 9781107054202, 2016.
Elfving, D. C., Kaufmann, M. R., and Hall, A. E.: Interpreting leaf water potential measurements with a model of the soil-plant-atmosphere continuum, Physiol. Plantarum, 27, 161–168, 1972.
Entekhabi, D., Njoku, E. G., O'Neill, P. E., Kellogg, K. H., Crow, W. T., Edelstein, W. N., Entin, J. K., Goodman, S. D., Jackson, T. J., Johnson, J., Kimball, J., Piepmeier, J. R., Koster, R. D., Martin, N., McDonald, K. C., Moghaddam, M., Moran, S., Reichle, R., Shi, J. C., Spencer, M. W., Thurman, S. W., Tsang, L., and Van Zyl, J.: The soil moisture active passive (SMAP) mission, Proc. IEEE, 98, 704–716, 2010.
Fan, J., McConkey, B., Wang, H., and Janzen, H.: Root distribution by depth for temperate agricultural crops, Field Crops Res., 189, 68–74, 2016.
Feddes, R. A. and Rijtema, P. E.: Water withdrawal by plant roots, J. Hydrol., 17, 33–59, 1972.
Feldman, A. F., Short Gianotti, D. J., Trigo, I. F., Salvucci, G. D., and Entekhabi, D.: Land-atmosphere drivers of landscape-scale plant water content loss, Geophys. Res. Lett., 47, e2020GL09033, https://doi.org/10.1029/2020GL090331, 2021.
Fink, A., Jagdhuber, T., Piles, M., Grant, J., Baur, M., Link, M., and Entekhabi, D.: Estimating Gravimetric Moisture of Vegetation Using an Attenuation-Based Multi-Sensor Approach, In IGARSS 2018–2018 IEEE International Geoscience and Remote Sensing Symposium, 353–356, IEEE, https://doi.org/10.1109/IGARSS.2018.8518949, 2018.
Frank, A. B., Power, J. F., and Willis, W. O.: Effect of Temperature and Plant Water Stress on Photosynthesis, Diffusion Resistance, and Leaf Water Potential in Spring Wheat, Agron. J., 65, 777–780, 1973.
Gallardo, M., Eastham, J., Gregory, P. J., and Turner, N. C.: A comparison of plant hydraulic conductances in wheat and lupins, J. Exp. Bot., 47, 233–239, 1996.
Gardner, W. R.: Dynamic aspects of water availability to plants, Soil Sci., 89, 63–73, 1960.
Gardner, W. R.: Dynamic aspects of soil-water availability to plants, Ann. Rev. Plant Physiol., 16, 323–342, 1965.
Gupta, A. S., Berkowitz, G. A., and Pier, P. A.: Maintenance of photosynthesis at low leaf water potential in wheat: role of potassium status and irrigation history, Plant Physiol., 89, 1358–1365, 1989.
Gupta, S. C. and Wang, D.: Water Retention in Soil, in: Encyclopedia of Soil Science, edited by: Lal, R., CRC Press, Taylor and Francis Group, Boca Raton, FL, USA, Taylor and Francis Group, ISBN 9780849350542, 2006.
Halverson, G. H., Fisher, J. B., and Lee, C. M.: ECOsystem Spaceborne Thermal Radiometer Experiment on Space Station (ECOSTRESS), Mission Level 3 Evapotranspiration Priestley-Taylor Jet Propulsion Laboratory (PT-JPL), Data User Guide D-57153, Version 2, Jet Propulsion Laboratory, California Institute of Technology, Pasadena, CA, United States, 1–18, JPL, https://lpdaac.usgs.gov/documents/424/ECO3ETPTJPL_User_Guide_V1.pdf (last access: 23 April 2022), 2019.
Hillel, D.: Fundamentals of soil physics, Academic Press, New York, https://doi.org/10.1016/C2009-0-03109-2, 1980.
Holtzman, N. M., Anderegg, L. D. L., Kraatz, S., Mavrovic, A., Sonnentag, O., Pappas, C., Cosh, M. H., Langlois, A., Lakhankar, T., Tesser, D., Steiner, N., Colliander, A., Roy, A., and Konings, A. G.: L-band vegetation optical depth as an indicator of plant water potential in a temperate deciduous forest stand, Biogeosciences, 18, 739–753, https://doi.org/10.5194/bg-18-739-2021, 2021.
Hook, S. and Fisher, J.: ECOSTRESS Evapotranspiration PT-JPL Daily L3 Global 70,m V001 [data set], NASA EOSDIS Land Processes DAAC, https://doi.org/10.5067/ECOSTRESS/ECO3ETPTJPL.001, 2019.
Horning, N., Robinson, J. A., Sterling, E. J., Spector, S., and Turner, W.: Remote sensing for ecology and conservation: a handbook of techniques, Oxford University Press, ISBN 9780199219957, 2010.
Humphrey, V., Dorsey, B. L., and Frankenberg, C.: Continuous observation of canopy water content changes with GPS sensors, EGU General Assembly 2021, online, 19–30 April 2021, EGU21-15551, https://doi.org/10.5194/egusphere-egu21-15551, 2021.
Jackson, T. J. and Schmugge, T. J.: Vegetation effects on the microwave emission of soils, Remote Sens. Environ., 36, 203–212, 1991.
Jagdhuber, T.: Soil parameter retrieval under vegetation cover using SAR polarimetry, Doctoral dissertation, Universität Potsdam, urn:nbn:de:kobv:517-opus-60519, https://publishup.uni-potsdam.de/frontdoor/index/index/docId/5894 (last access: 25 April 2022), 2012.
Jagdhuber, T., Fluhrer, A., Jonard, F., Chaparro, D., Meyer, T., Holtzman, N., Konings, A.G., Feldman, A., Baur, M. J., Piles, M., and Entekhabi, D.: Retrieval of Forest Water Potential from L-Band Vegetation Optical Depth, in: International Geoscience and Remote Sensing Symposium (IGARSS), Proceedings of the IEEE International Geoscience and Remote Sensing Symposium, Brussels, Belgium, 12–16 July 2021, 5949–5952, https://doi.org/10.1109/IGARSS47720.2021.9554622, 2021.
Johnson, K. M., Jordan, G. J., and Brodribb, T. J.: Wheat leaves embolized by water stress do not recover function upon rewatering, Plant Cell Environ., 41, 2704–2714, 2018.
Jonard, F., Weihermüller, L., Schwank, M., Jadoon, K. Z., Vereecken, H., and Lambot, S.: Estimation of hydraulic properties of a sandy soil using ground-based active and passive microwave remote sensing, IEEE Trans. Geosci. Remote Sens., 53, 3095–3109, 2015.
Jonard, F., Bircher, S., Demontoux, F., Weihermüller, L., Razafindratsima, S., Wigneron, J. P., and Vereecken H.: Passive L-band microwave remote sensing of organic soil surface layers: a tower-based experiment, Remote Sens., 10, 108088, https://doi.org/10.1016/j.agrformet.2020.108088, 2018.
Jonard F., De Cannière S., Brüggemann N., Gentine P., Short Gianotti D. J., Lobet G., Miralles D. J., Montzka C., Pagán B. R., Rascher U., and Vereecken H.: Value of chlorophyll fluorescence for quantifying hydrological states and fluxes: Current status and challenges, Agr. Forest Meteorol., 291, 108088, https://doi.org/10.1016/j.agrformet.2020.108088, 2020.
Kameli, A. and Lösel, D. M.: Carbohydrates and water status in wheat plants under water stress, New Phytol., 125, 609–614, 1993.
Kang, S., Gu, B., Du, T., and Zhang, J.: Crop coefficient and ratio of transpiration to evapotranspiration of winter wheat and maize in a semi-humid region, Agr. Water Manage., 59, 239–254, 2003.
Kerr, Y. H., Waldteufel, P., Wigneron, J. P., Delwart, S., Cabot, F., Boutin, J., Escorihuela, M.-J., Font, J., Reul, N., Gruhier, C., Enache Juglea, S., Drinkwater, M. R., Hahne, A., Martin-Neira, M., and Mecklenburg, S.: The SMOS mission: New tool for monitoring key elements of the global water cycle, Proc. IEEE, 98, 666–687, 2010.
Kilic, L., Prigent, C., Aires, F., Boutin, J., Heygster, G., Tonboe, R. T., Roquet, H., Jimenez, C., and Donlon, C.: Expected performances of the Copernicus Imaging Microwave Radiometer (CIMR) for an all-weather and high spatial resolution estimation of ocean and sea ice parameters, J. Geophys. Res.-Ocean., 123, 7564–7580, 2018.
Konings, A. G., Piles, M., Das, N., and Entekhabi, D.: L-band vegetation optical depth and effective scattering albedo estimation from SMAP, Remote Sens. Environ., 198, 460–470, 2017.
Konings, A. G., Rao, K., and Steele-Dunne, S. C.: Macro to micro: microwave remote sensing of plant water content for physiology and ecology, New Phytol., 223, 1166–1172, 2019.
Konings, A. G., Saatchi, S. S., Frankenberg, C., Keller, M., Leshyk, V., Anderegg, W. R., Humphrey, V., Matheny, A. M., Trugman, A., Sack, L., Agee, E., Barnes, M. L., Binks, O., Nicholson, K. C., Christoffersen, B. O., Entekhabi, D., Gentine, P., Holtzman, N. M., Katul, G. G., Liu, Y., Longo, M., Martinez-Vilalta, J., McDowell, N., Meir, P., Mencuccini, M., Mrad, A., Novick, K. A., Oliveira, R. S., Siqueira, P., Steele-Dunne, S. C., Thompson, D. R., Wang, Y., Wehr, R., Wood, J. D., Xu, X., and Zuidema, P. A.: Detecting forest response to droughts with global observations of vegetation water content, Glob. Change Biol., 27, 6005–6024, 2021.
Lambers, H., Stuart Chapin III, F., and Pons T. L.: Plant physiological ecology, Springer Science and Business Media, ISBN 9783030296391, 2008.
Liu, X., Wigneron, J. P., Fan, L., Frappart, F., Ciais, P., Baghdadi, N., Zribi, M., Jagdhuber, T., Li, X., Wang, M., Bai, X., and Moisy, C.: ASCAT IB: A radar-based vegetation optical depth retrieved from the ASCAT scatterometer satellite, Remote Sens. Environ., 264, 112587, https://doi.org/10.1016/j.rse.2021.112587, 2021.
Lynn, B. H. and Carlson, T. N.: A stomatal resistance model illustrating plant vs. external control of transpiration, Agr. Forest Meteorol., 52, 5–43, 1990.
Mätzler, C.: Microwave (1–100 GHz) dielectric model of leaves, IEEE Trans. Geosci. Remote Sens., 32, 947–949, 1994.
Manzoni, S., Vico, G., Porporato, A., and Katul, G.: Biological constraints on water transport in the soil-plant-atmosphere system, Adv. Water Res., 51, 292–304, 2013a.
Manzoni, S., Vico, G., Katul, G., Palmroth, S., Jackson, R. B., and Porporato, A.: Hydraulic limits on maximum plant transpiration and the emergence of the safety–efficiency trade-off, New Phytol., 198, 169–178, 2013b.
Manzoni, S., Vico, G., Katul, G., Palmroth, S., and Porporato, A.: Optimal plant water-use strategies under stochastic rainfall, Water Resour. Res., 50, 5379–5394, 2014.
Margulis, S. A.: Introduction to hydrology, https://ucla.app.box.com/v/Intro-to-Hydrology-pdf (last access: 20 April 2022), 2017.
Martínez-Vilalta, J. and Garcia-Forner, N.: Water potential regulation, stomatal behaviour and hydraulic transport under drought: deconstructing the iso/anisohydric concept, Plant Cell Environ., 40, 962–976, 2017.
Martínez-Vilalta, J., Anderegg, W. R., Sapes, G., and Sala, A.: Greater focus on water pools may improve our ability to understand and anticipate drought-induced mortality in plants, New Phytol., 223, 22–32, 2019.
Matheny, A. M., Mirfenderesgi, G., and Bohrer, G.: Trait-based representation of hydrological functional properties of plants in weather and ecosystem models, Plant Div., 39, 1–12, 2017.
Meyer, T., Weihermüller, L., Vereecken, H., and Jonard, F.: Vegetation Optical Depth and Soil Moisture Retrieved from L-Band Radiometry over the Growth Cycle of a Winter Wheat, Remote Sens., 10, 1637, https://doi.org/10.3390/rs10101637, 2018.
Meyer, T., Jagdhuber, T., Piles, M., Fink, A., Grant, J., Vereecken, H., and Jonard, F.: Estimating Gravimetric Water Content of a Winter Wheat Field from L-Band Vegetation Optical Depth, Remote Sens., 11, 2353, https://doi.org/10.3390/rs11202353, 2019.
Momen, M. and Bou-Zeid, E.: Analytical reduced models for non-stationary diabatic atmospheric boundary layers, Bound.-Lay. Meteorol., 164, 383–399, https://doi.org/10.1007/s10546-017-0247-0, 2017.
Momen, M., Wood, J. D., Novick, K. A., Pangle, R., Pockman, W. T., McDowell, N. G., and Konings, A. G.: Interacting effects of leaf water potential and biomass on vegetation optical depth, J. Geophys. Res.-Biogeo., 122, 3031–3046, 2017.
Monteith, J. and Unsworth, M.: Principles of environmental physics: plants, animals, and the atmosphere, Academic Press, Cambridge, USA, ISBN 9780123869104, 2013.
Monteith, J. L.: Evaporation and environment, in: Symposia of the society for experimental biology, Cambridge University Press (CUP), Cambridge, 19, 205–234, 1965.
Nobel, P. S.: Physicochemical and Environmental Plant Physiology, Academic Press, Cambridge, USA, ISBN 9780128191460, 2020.
Oosterhuis, D. M. and Walker, S.: Stomatal resistance measurement as an indicator of water deficit stress in wheat and soybeans, South Afr. J. Plant Soil, 4, 113–120, 1987.
Palosuo, T., Kersebaum, K. C., Angulo, C., Hlavinka, P., Moriondo, M., Olesen, J. E., Patil, R.H., Ruget, F., Rumbaur, C., Takáč, J., Trnka, M., Bindi, M., Çaldağ, B., Ewert, F., Ferrise, R., Mirschel, W., Şaylan, L., Šiška, B., and Rötter, R.: Simulation of winter wheat yield and its variability in different climates of Europe: a comparison of eight crop growth models, Europ. J. Agr., 35, 103–114, 2011.
Passioura, J. B.: Water in the soil-plant-atmosphere continuum, in: Physiological plant ecology II (5-33), Springer, Berlin, Heidelberg, Springer,https://doi.org/10.1007/978-3-642-68150-9_2, 1982.
Pearcy, R. W., Ehleringer, J. R., Mooney, H., and Rundel, P. W. (Eds.): Plant physiological ecology: field methods and instrumentation, Springer Science and Business Media, Kluwer Academic Publishers, Dortrecht, the Netherlands, https://doi.org/10.1007/978-94-010-9013-1, 2012.
Portal, G., Jagdhuber, T., Vall-llossera, M., Camps, A., Pablos, M., Entekhabi, D., and Piles, M.: Assessment of Multi-Scale SMOS and SMAP Soil Moisture Products across the Iberian Peninsula, Remote Sens., 12, 570, https://doi.org/10.3390/rs12030570, 2020.
Prigent, C. and Jimenez, C.: An evaluation of the synergy of satellite passive microwave observations between 1.4 and 36 GHz, for vegetation characterization over the Tropics, Remote Sens. Environ., 257, 112346, https://doi.org/10.1016/j.rse.2021.112346, 2021.
Rao, K., Anderegg, W. R., Sala, A., Martínez-Vilalta, J., and Konings, A. G.: Satellite-based vegetation optical depth as an indicator of drought-driven tree mortality, Remote Sensing of Environment, 227, 125-136, 2019.
Rascio, A., Platani, C., Scalfati, G., Tonti, A., and Di Fonzo, N.: The accumulation of solutes and water binding strength in durum wheat, Physiol. Plantarum, 90, 715–721, 1994.
Reichardt, K. and Timm, L. C.: Soil, plant and atmosphere, Springer Nature Switzerland, Cham, Switzerland, Springer Cham, ISBN 978-3-030-19322-5, 2014.
Ritchie, J. T.: Water dynamics in the soil-plant-atmosphere system, Plant Soil, 58, 81–96, 1981.
Ruggiero, C., Angelino, G., and Maggio, A.: Developmental regulation of water uptake in wheat, J. Plant Physiol., 164, 1170–1178, 2007.
Sadeghi, M., Gao, L., Ebtehaj, A., Wigneron, J. P., Crow, W. T., Reager, J. T., and Warrick, A. W.: Retrieving global surface soil moisture from GRACE satellite gravity data, J. Hydrol., 584, 124717, https://doi.org/10.1016/j.jhydrol.2020.124717, 2020a.
Sadeghi, M., Gao, L., Ebtehaj, A., Wigneron, J.-P., Crow, W. T., Reager, J. T., and Warrick, A. W.: Global estimates of land surface water fluxes from SMOS and SMAP satellite soil moisture data, J. Hydrometeorol., 21, 241–253, 2020b.
Sarto, M. V., M., Sarto, J. R. W., Rampim, L., Rosset, J. S., Bassegio, D., da Costa, P. F., and Inagaki, A. M.: Wheat phenology and yield under drought: a review, Austr. J. Crop Sci., 11, 941–946, 2017.
Schmugge, T. J. and Jackson, T. J.: A dielectric model of the vegetation effects on the microwave emission from soils, IEEE Trans. Geosci. Remote Sens., 30, 757–760, 1992.
Shukla, M. K.: Soil physics. An Introduction, CRC Press, Taylor and Francis Group, Boca Raton, FL, USA, ISBN 9781439888421, 2014.
Siddique, M. R. B., Hamid, A. I. M. S., and Islam, M. S.: Drought stress effects on water relations of wheat, Bot. Bull. Acad. Sin., 41, 35–39, 2000.
Slatyer, R. O. and Taylor, S. A.: Terminology in plant-and soil-water relations, Nature, 187, 922–924, 1960.
Smart, R. E. and Bingham, G. E.: Rapid estimates of relative water content, Plant Physiol., 53, 258–260, 1974.
Steduto, P., Hsiao, T. C., Fereres, E., and Raes, D.: Crop yield response to water, Rome: Food and Agriculture Organization of the United Nations, Report, 1028, ISBN 978-92-5-107274-5, 2012.
Steenpass, C., Vanderborght, J., Herbst, M., Šimůnek, J., and Vereecken, H.: Estimating soil hydraulic properties from infrared measurements of soil surface temperatures and TDR data, Vadose Zone J., 9, 910–924, 2010.
Topp, G. C., Davis, J. L., and Annan, A. P.: Electromagnetic determination of soil water content: measurements in coaxial transmission lines, in Water Resour. Res., 1, 574–582, https://doi.org/10.1029/WR016i003p00574, 1980.
Turner, N. C.: Measurement of plant water status by the pressure chamber technique, Irrigation Sci., 9, 289–308, 1988.
Turner, N. C. and Long, M. J.: Errors arising from rapid water loss in the measurement of leaf water potential by the pressure chamber technique, Funct. Plant Biol., 7, 527–537, 1980.
Tyree, M. T. and Zimmermann, M. H.: Xylem structure and the ascent of sap, Springer Science and Business Media, ISBN 9783662226292, 2013.
Ulaby, F. T. and El-Rayes, M.: Microwave dielectric spectrum of vegetation – Part II: Dual-dispersion model, IEEE Trans. Geosci. Remote Sens., 5, 550–557, 1987.
Ulaby, F. T. and Long, D. G.: Microwave radar and radiometric remote sensing, The University of Michigan Press, ISBN 9780472119356, 2013.
Van den Honert, T. H.: Water transport in plants as a catenary process, Discuss. Faraday Soc., 3, 146–153, 1948.
van Genuchten, M. T.: A Closed-form Equation for Predicting the Hydraulic Conductivity of Unsaturated Soils, Soil Sci. Soc. Am. J., 44, 892–898, https://doi.org/10.2136/sssaj1980.03615995004400050002x, 1980.
Wallace, J. S.: Water transport and leaf water relations in winter wheat crops, Doctoral dissertation, University of Nottingham, 1978.
Wallace, J. S. and Biscoe, P. V.: Water relations of winter wheat: 4. Hydraulic resistance and capacitance in the soil-plant system, J. Agr. Sci., 100, 591–600, 1983.
Wang, E. and Engel, T.: Simulation of growth, water and nitrogen uptake of a wheat crop using the SPASS model, Environ. Modell. Softw., 17, 387–402, 2002.
Ward, R. C. and Robinson, M. Principles of hydrology, 3rd Edn., McGraw-Hill Publishing Company, London, https://doi.org/10.1002/esp.3290160308, 2014.
White, C. A., Sylvester-Bradley, R., and Berry, P. M.: Root length densities of UK wheat and oilseed rape crops with implications for water capture and yield, J. Exp. Bot., 66, 2293–2303, 2015.
Wigneron, J.-P., Jackson, T.J., O'Neill, P., De Lannoy, G., de Rosnay, P. Walker, J.P., Ferrazzoli, P.,Mironov, V., Bircher, S., Grant J.P., Kurum, M., Schwank, M., Munoz-Sabater, J., Das, N., Royer, A., Al-Yaari, A., Al Bitar, A., Fernandez-Moran, R., Lawrence, H., Mialon, A., Parrens, M., Richaume, P., Delwart, S., and Kerr, Y.: Modelling the passive microwave signature from land surfaces: A review of recent results and application to the L-band SMOS and SMAP soil moisture retrieval algorithms, Remote Sens. Environ., 192, 238–262, 2017.
Xu, Xiangtao, Konings, A. G., Longo, M., Feldman, A., Xu, L., Saatchi, S., Wu, D., Wu, J., and Moorcroft, P.: Leaf surface water, not plant water stress, drives diurnal variation in tropical forest canopy water content, New Phytol., 231, 122–136, 2021.
Yang, S. J. and Jong, E. D.: Effect of soil water potential and bulk density on water uptake patterns and resistance to flow of water in wheat plants, Can. J. Soil Sci., 51, 211–220, 1971.
Zhang, T., Hou, M., Liu, L., and Tian, F.: Estimation of transpiration and canopy cover of winter wheat under different fertilization levels using thermal infrared and visible imagery. Comput. Electr. Agr., 165, 104936, https://doi.org/10.1016/j.compag.2019.104936, 2019.
Zhao, T., Shi, J., Entekhabi, D., Jackson, T. J., Hu, L., Peng, Z., Yao, P., Li, S., and Kang, C. S.: Retrievals of soil moisture and vegetation optical depth using a multi-channel collaborative algorithm, Remote Sens. Environ., 257, 112321, https://doi.org/10.1016/j.rse.2021.112321, 2021.
Zweifel, R. and Häsler, R.: Stem radius changes and their relation to stored water in stems of young Norway spruce trees, Trees, 15, 50–57, 2000.
Zweifel, R., Item, H., and Häsler, R.: Link between diurnal stem radius changes and tree water relations, Tree Physiol., 21, 869–877, 2001.
- Abstract
- Introduction
- Test site and experimental data
- Methodology of water dynamics estimation
- Relative water content (RWC) and vegetation water potential (VWP) from vegetation moisture (mg)
- Results
- Summary and discussion of concept
- Conclusions and outlook
- Data availability
- Author contributions
- Competing interests
- Disclaimer
- Special issue statement
- Acknowledgements
- Financial support
- Review statement
- References