the Creative Commons Attribution 4.0 License.
the Creative Commons Attribution 4.0 License.
 | 05 May 2022
Major processes of the dissolved cobalt cycle in the North and equatorial Pacific Ocean
Nathan Lanning
Allison Laubach
Jong-Mi Lee
Jessica Fitzsimmons
Mariko Hatta
William Jenkins
Phoebe Lam
Matthew McIlvin
Alessandro Tagliabue
Mak Saito
Over the past decade, the GEOTRACES and wider trace metal geochemical community has made substantial contributions towards constraining the marine cobalt (Co) cycle and its major biogeochemical processes. However, few Co speciation studies have been conducted in the North and equatorial Pacific Ocean, a vast portion of the world's oceans by volume and an important end-member of deep thermohaline circulation. Dissolved Co (dCo) samples, including total dissolved and labile Co, were measured at-sea during the GEOTRACES Pacific Meridional Transect (GP15) expedition along the 152∘ W longitudinal from 56∘ N to 20∘ S. Along this transect, upper-ocean dCo (σ0<26) was linearly correlated with dissolved phosphate (slope = 82±3, µmol : mol) due to phytoplankton uptake and remineralization. As depth increased, dCo concentrations became increasingly decoupled from phosphate concentrations due to co-scavenging with manganese oxide particles in the mesopelagic. The transect revealed an organically bound coastal source of dCo to the Alaskan Stream associated with low-salinity waters. An intermediate-depth hydrothermal flux of dCo was observed off the Hawaiian coast at the Loihi Seamount, and the elevated dCo was correlated with potential xs3He at and above the vent site; however, the Loihi Seamount likely did not represent a major source of Co to the Pacific basin. Elevated concentrations of dCo within oxygen minimum zones (OMZs) in the equatorial North and South Pacific were consistent with the suppression of oxidative scavenging, and we estimate that future deoxygenation could increase the OMZ dCo inventory by 18 % to 36 % over the next century. In Pacific Deep Water (PDW), a fraction of elevated ligand-bound dCo appeared protected from scavenging by the high biogenic particle flux in the North Pacific basin. This finding is counter to previous expectations of low dCo concentrations in the deep Pacific due to scavenging over thermohaline circulation. Compared to a Co global biogeochemical model, the observed transect displayed more extreme inventories and fluxes of dCo than predicted by the model, suggesting a highly dynamic Pacific Co cycle.
- Article
(5098 KB) - Full-text XML
- BibTeX
- EndNote


Cobalt (Co) is a necessary inorganic micronutrient for many phytoplankton and other forms of marine life but is one of the scarcest essential bioactive metals in the surface ocean. Many cyanobacteria, such as Synechococcus and Prochlorococcus, have an absolute requirement of Co (Saito et al., 2002; Sunda and Huntsman, 1995), while other phytoplankton require vitamin B12 for methionine synthesis, which contains Co as a metallic cofactor (Bertrand et al., 2013). Many metalloenzymes also use Co as a cofactor, including some forms of eukaryotic carbonic anhydrases which can substitute Co for zinc (Zn) (Kellogg et al., 2020; Price and Morel, 1990; Sunda and Huntsman, 1995). The uptake of Co by marine plankton coupled with the scavenging of cobalt onto oxide particles in the mesopelagic ocean gives dissolved Co (dCo) a “hybrid-type” geochemistry, characterized by both nutrient uptake and scavenging processes (Bruland and Lohan, 2003; Noble et al., 2008), which contributes to Co's short residence time in the water column (∼ 130 years) and keeps dCo at picomolar concentrations in the open oceans (Hawco et al., 2018; Saito and Moffett, 2002). Co has been predicted to be a co-limiting nutrient in some regions of the ocean, particularly areas with low Zn concentrations (Browning et al., 2017; Moore et al., 2013; Saito et al., 2002). Some of Co's biological influence is through vitamin B12, which has been found to be a co-limiting nutrient in regions like the Antarctic coastal seas (Bertrand et al., 2007; Gobler et al., 2007; Sañudo-Wilhelmy et al., 2006).
Major sources of Co to the marine environment include rivers and estuaries, coastal sediments, hydrothermal inputs, and dust deposition (Dulaquais et al., 2014a; Hawco et al., 2016; Noble et al., 2017). Major sinks of Co primarily require dCo to be transformed to the particulate phase (pCo) via uptake by phytoplankton or lithogenic scavenging before it is removed from the water column by particle export. Dissolved Co is principally scavenged to manganese (Mn) oxides via a microbially mediated co-oxidation (Hawco et al., 2018; Moffett and Ho, 1996; Noble et al., 2017). Internal cycling processes act as major sources of dCo from particulate matter via biomass remineralization and the build-up of dCo in oxygen minimum zones (OMZs). Dissolved Co tends to be elevated in OMZs due to the combined processes of biomass remineralization below the photic zone, suppressed Mn oxide scavenging in the anoxic environment, remobilization of scavenged Co via Mn oxide reduction, and reduced ventilation and mixing of the water mass (Hawco et al., 2016; Noble et al., 2017). Inputs of dCo from OMZs have been shown to be higher than previously expected, representing ∼ 27 % of the total marine Co flux (Hawco et al., 2018). Comparatively, the hydrothermal and eolian dust fluxes are predicted to be <3 % of the total Co source flux (Hawco et al., 2018; Swanner et al., 2014).
Speciation determines the bioavailability of dCo for its major loss processes: uptake by phytoplankton and scavenging by Mn-oxidizing bacteria. Dissolved Co is present in both a labile, “free” Co(II) species and a ligand-bound, “complexed” species. Most if not all organically complexed dCo is predicted to be Co(III) due to its high binding stability with ligands. Ligand-bound Co(III) is a strongly inert fraction of the dCo pool with a conditional stability constant >1016.8 (Saito et al., 2005). Organic Co(II)–ligand bonds are comparatively less stable since ligands have a higher affinity to divalent cations that are more abundant than Co such as Ni(II), making Co(II) ligand concentrations negligent (Baars and Croot, 2014). Labile dCo is considered to be more bioavailable to phytoplankton and Mn-oxidizing bacteria than the relatively inert ligand-bound dCo, but there is some evidence that cyanobacteria are able to produce extracellular organic ligands to stabilize ligand-bound dCo for uptake as a nutrient and to prevent its loss via scavenging (Bown et al., 2012; Saito et al., 2005).
The efforts of the GEOTRACES and wider biogeochemical community have greatly increased our understanding of the marine Co cycle on a basin-wide scale over the past decade, including in the Atlantic, Arctic, Southern Ocean, South Pacific and Mediterranean Sea (Bown et al., 2011, 2012; Bundy et al., 2020; Dulaquais et al., 2014a, b, 2017; Hawco et al., 2016; Noble et al., 2017). However, the distribution, sources and sinks of marine Co have not been widely characterized in the North and equatorial Pacific, leaving a vast section of the ocean understudied with regards to Co speciation and biogeochemical dynamics. The North Pacific Ocean is the largest ocean basin with the oldest, least ventilated deep-water mass that serves as the end-member for deep thermohaline circulation. Understanding the major biogeochemical features of the Co cycle in this basin, particularly within the Pacific deep end-member, is important to our understanding of the global Co cycle.
In this study, we examine the distribution of both total dissolved and labile dCo along the GEOTRACES GP15 Pacific Meridional Transect through the North and equatorial Pacific Ocean. This paper characterizes the major features present in the dCo GP15 transect and compares them to similar features found in other ocean basins where a higher density of dCo measurements has been reported. The observed dCo transect is then compared to output from a global biogeochemical Co model to assess and contextualize dCo features along the transect. This study area was influenced by many relevant sources and sinks within the Co cycle, including coastal and riverine fluxes, OMZs, hydrothermal vents, oligotrophic subtropical gyres, and the aged deep Pacific end-member, providing an ideal snapshot into the Pacific Co cycle and a representative model of global Co biogeochemical processes.
2.1 Study area and dissolved trace metal sample collection
North and equatorial Pacific seawater samples were collected on the GP15 expedition as part of the US GEOTRACES program (RR1814 and RR1815; 18 September–24 November 2018). Dissolved seawater was sampled along a transect that mostly followed the 152∘ W meridian from 56∘ N to 20∘ S, traveling from the Gulf of Alaska to Hawaii (Leg 1) and on to Tahiti, French Polynesia (Leg 2; Fig. 1). Trace-metal-dissolved seawater samples were collected using a 24-bottle trace-metal-clean “GEOTRACES Carousel” (GTC) equipped with 12 L GO-FLO bottles (General Oceanics) on a titanium frame and a Kevlar cable, as described in Cutter and Bruland (2012). Seawater from the GO-FLO bottles was subsampled in a trace-metal-clean van under positive pressure. Surface water samples (∼ 2 m depth) were collected from a trace-metal-clean towfish and pump while arriving at each station. Sampling locations included 25 full-depth stations and 10 demi stations where only the upper 1000 m was sampled. At Station 11, only a surface towfish sample was collected due to rough weather.
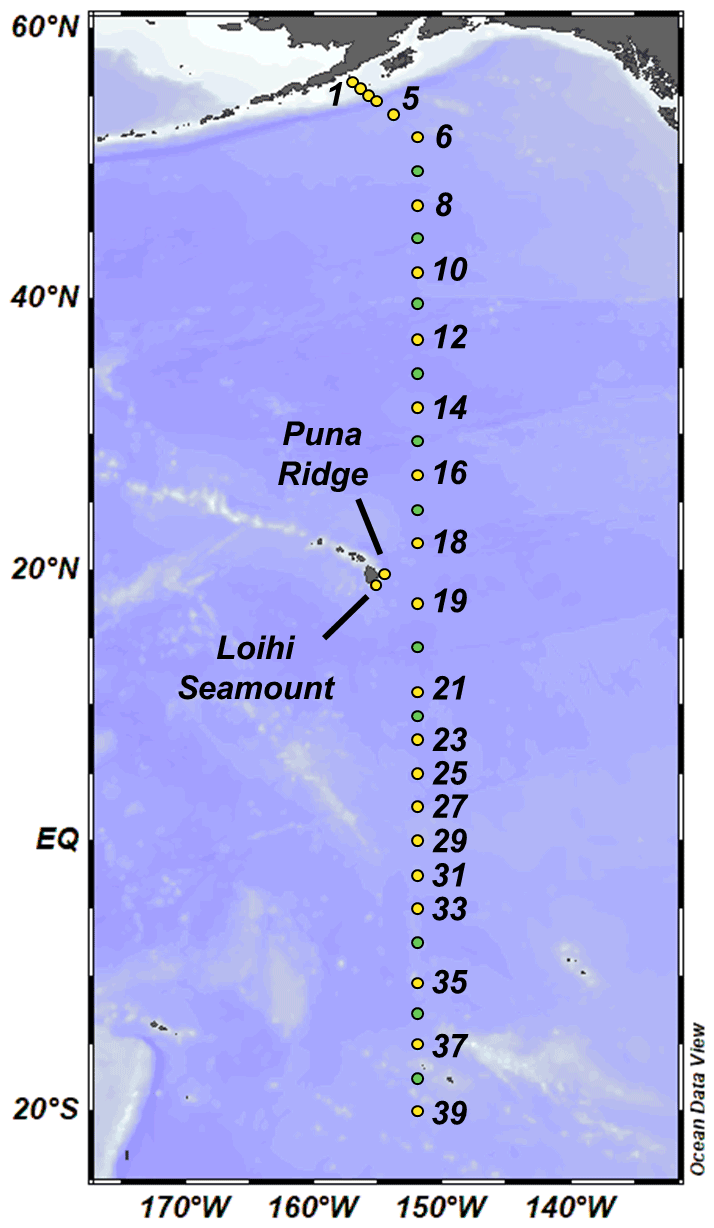
Figure 1GEOTRACES GP15 expedition track. Leg 1 (RR1814, September–October 2018) spanned between the Alaskan coast and Hawaii, and Leg 2 (RR1815, October–November 2018) spanned between Hawaii and 20∘ S. Yellow points represent full-depth stations, and green points represent demi stations where only the upper 1000 m was sampled. At Station 11, only a surface towfish (∼ 2 m) sample was collected.
Dissolved Co subsamples were filtered using a 0.2 µm AcroPak capsule and stored until analysis at 4 ∘C in 60 mL low-density polyethylene (LDPE) bottles (Nalgene) that had been soaked for 1 week in Citranox, an acidic detergent; rinsed with Milli-Q water (Millipore); soaked for 2 weeks in 10 % trace-metal-grade HCl (Optima); and rinsed with lightly acidic Milli-Q water (<0.1 % HCl). All Co values presented here were analyzed at sea, with replicates of all samples taken for dCo analysis in the laboratory, if needed.
Macronutrient samples were analyzed at sea within 24 h of recovery by the Ocean Data Facility (ODF) at Scripps Institution of Oceanography. The nutrient and hydrographic dataset can be found on the Biological and Chemical Oceanography Data Management Office (BCO-DMO) website (Leg 1: https://www.bco-dmo.org/dataset/777951, last access: 3 May 2022; Leg 2: https://www.bco-dmo.org/dataset/824867, last access: 3 May 2022). Macronutrient concentrations reported here have been converted from units of micromoles per kilogram (µmol kg−1) to micromolar by multiplying each sample by its calculated in situ density.
The depth of the mixed layer was determined for each station as the first depth at which the difference between the potential density (σθ) and reference density (σref) was greater than or equal to 0.125 kg m−3, where σref is the σθ at 10 m depth (Bishop and Wood, 2009; Ohnemus et al., 2017). In situ density, potential density and O2 solubility used to calculated apparent oxygen utilization (AOU) were determined via the Gibbs SeaWater (GSW) Oceanographic Toolbox in Python (https://teos-10.github.io/GSW-Python/, last access: 22 April 2021) (Mcdougall and Barker, 2011).
2.2 Dissolved total and labile Co analysis
Dissolved cobalt was determined by cathodic stripping voltammetry (CSV) as originally described by Saito and Moffett (2001) and modified by Hawco et al. (2016) and Saito et al. (2010). Measurement occurred shipboard inside a trace-metal-clean plastic “bubble” within 1 week of sample collection using the Metrohm 663 VA and μAutolabIII systems equipped with a hanging mercury drop working electrode. The reagents used for this method included (1) 0.1 M dimethylglyoxime (DMG; Sigma Aldrich), (2) 0.5 M N-(2-hydroxyethyl)piperazine-N-(3-propanesulfonic acid) (EPPS; Sigma Aldrich) buffer, (3) 1.5 M NaNO2 (Merck) and (4) a 25 pM CoCl2 (Fisher Scientific) standard made in September 2018 for this expedition. The DMG reagent was purified via recrystallization, and the EPPS and NaNO2 reagents were run through treated Chelex-100 resin columns (BioRad) to remove trace metal contaminates. The Chelex resin was prepared as described in Price et al. (1988, 1989), and reagents were purified as described in Saito and Moffett (2002).
For total dCo analysis, 0.2 µm filtered water samples were UV-irradiated in acid-washed quartz tubes for 1 h using a water-cooled UV irradiation system (Metrohm 705 UV Digestor) to destroy natural ligand-bound Co complexes. Then, 11 mL of sample seawater was aliquoted from the sample bottle into 15 mL acid-washed polypropylene vials, and 33 µL of the DMG reagent and 130 µL of the EPPS buffer was added to each vial. The samples were then processed on an autosampler (Metrohm 858 sample processor), which added 8.5 mL of the sample solution and 1.5 mL of the NaNO2 reagent to a Teflon cup for electrochemical analysis. The mercury electrode performed a fast linear sweep from −1.4 to −0.6 V at a rate of 5 V s−1, which reduced the Co bound in the Co(HDMG)2 complex from Co(II) to Co(0) and produced a Co reduction peak at −1.15 V with a height linearly proportional to the amount of dCo present in the sample. A standard addition curve was generated for each sample analyzed with four automated additions of the 25 pM CoCl2 standard. A type-I linear regression of the standard curve allowed for the calculation of the initial amount of Co present in the sample, as described in Saito and Moffett (2001). Triplicate technical replicates were run on every sample to determine the precision of the method. Duplicate depths from different rosette casts were run when available.
Labile dCo analysis was identical to the total dCo method described above except the samples were not UV-irradiated prior to analysis to preserve the sample's ligands, and labile samples were allowed to equilibrate with the DMG and EPPS reagents overnight (∼ 8 h) before CSV analysis. This equilibration step allows time for the labile dCo to bind to the DMG reagent via competitive ligand exchange (K>1016.8) and thus is defined relative to its thermodynamic behavior (Saito et al., 2005). These labile dCo measurements are not necessarily comparable to dCo measurements that are performed using non-electrochemical methods, which are sometimes described as labile. In particular, inductively coupled plasma mass spectrometry (ICP-MS) measurements of dCo where samples are not UV-irradiated prior to analysis gives consistently different results than this electrochemical method, likely due to differences in Co complex adsorption and/or exchange kinetics with metal-binding resins. As a result, ICP-MS labile Co measurements tend to be somewhat offset compared to electrochemical labile Co measurements (unpublished data). This offset is not yet well understood, but it indicates that the two methods are measuring different pools of the dCo inventory, which should be considered before comparing dCo values analyzed with different methodologies. The purpose of mentioning the offset in this study is to clarify the distinction between the dCo analytical methods for those who will use this dataset in the future, particularly as part of the GEOTRACES intermediate data product (IDP).
Peak heights were determined by ElectroChemistry Data SOFTware (ECDSOFT) when possible, and manual measurement of peaks was used when peak detection was unsuccessful by the available software. This hybrid approach was employed because the most updated version of Metrohm software at the time, Nova 2.0, no longer supported manual peak-picking of individual samples, and ECDSOFT did not always detect peaks from samples with low dCo concentrations. A pairwise sample t test was performed to compare the differences between the manual analysis method and the digital ECDSOFT analysis method as determined by selected samples that were analyzed using both methods (n=13, average difference = 0.9±2.7 pM). The two peak height analysis methods were found to be statistically equivalent (t=1.16, P=0.27).
The entire dCo dataset generated on the GEOTRACES GP15 expedition can be accessed online at https://www.bco-dmo.org/dataset/818383 (last access: 3 May 2022) (Leg 1) and https://www.bco-dmo.org/dataset/818610 (last access: 3 May 2022) (Leg 2).
2.3 Analytical blanks
Analytical blanks for each combination of reagent batches (a unique combination of DMG, EPPS and NaNO2 reagents) were measured to determine background Co contamination due to reagent impurities. Blanks were prepared in duplicate or triplicate with UV-irradiated surface seawater passed through a treated Chelex-100 resin bead column (Bio-Rad) to remove metal contaminants, then UV-irradiated again to ensure no excess Co ligands were present. Averaged analytical blank values were subtracted from the measured Co values determined with the respective reagent batch.
For the four reagent batches used on GP15, the analytical blanks were found to be 9.44 ± 0.56 pM (n=3), 9.68 ± 0.40 pM (n=2), 0.04 ± 2.14 pM (n=2) and 6.28 ± 0.84 pM (n=2; Table 1). For the third reagent batch (0.04 pM blank), no blank value was subtracted from the determined Co values because the standard deviation was greater than the measured blank Co. An analytical limit of detection for this method was calculated from the 9.44 ± 0.56 pM blank (3× blank standard deviation where n≥3) to be 1.7 pM.
Table 1Blanks, internal standard and GEOTRACES community intercalibration standards measured at sea during Co analysis.
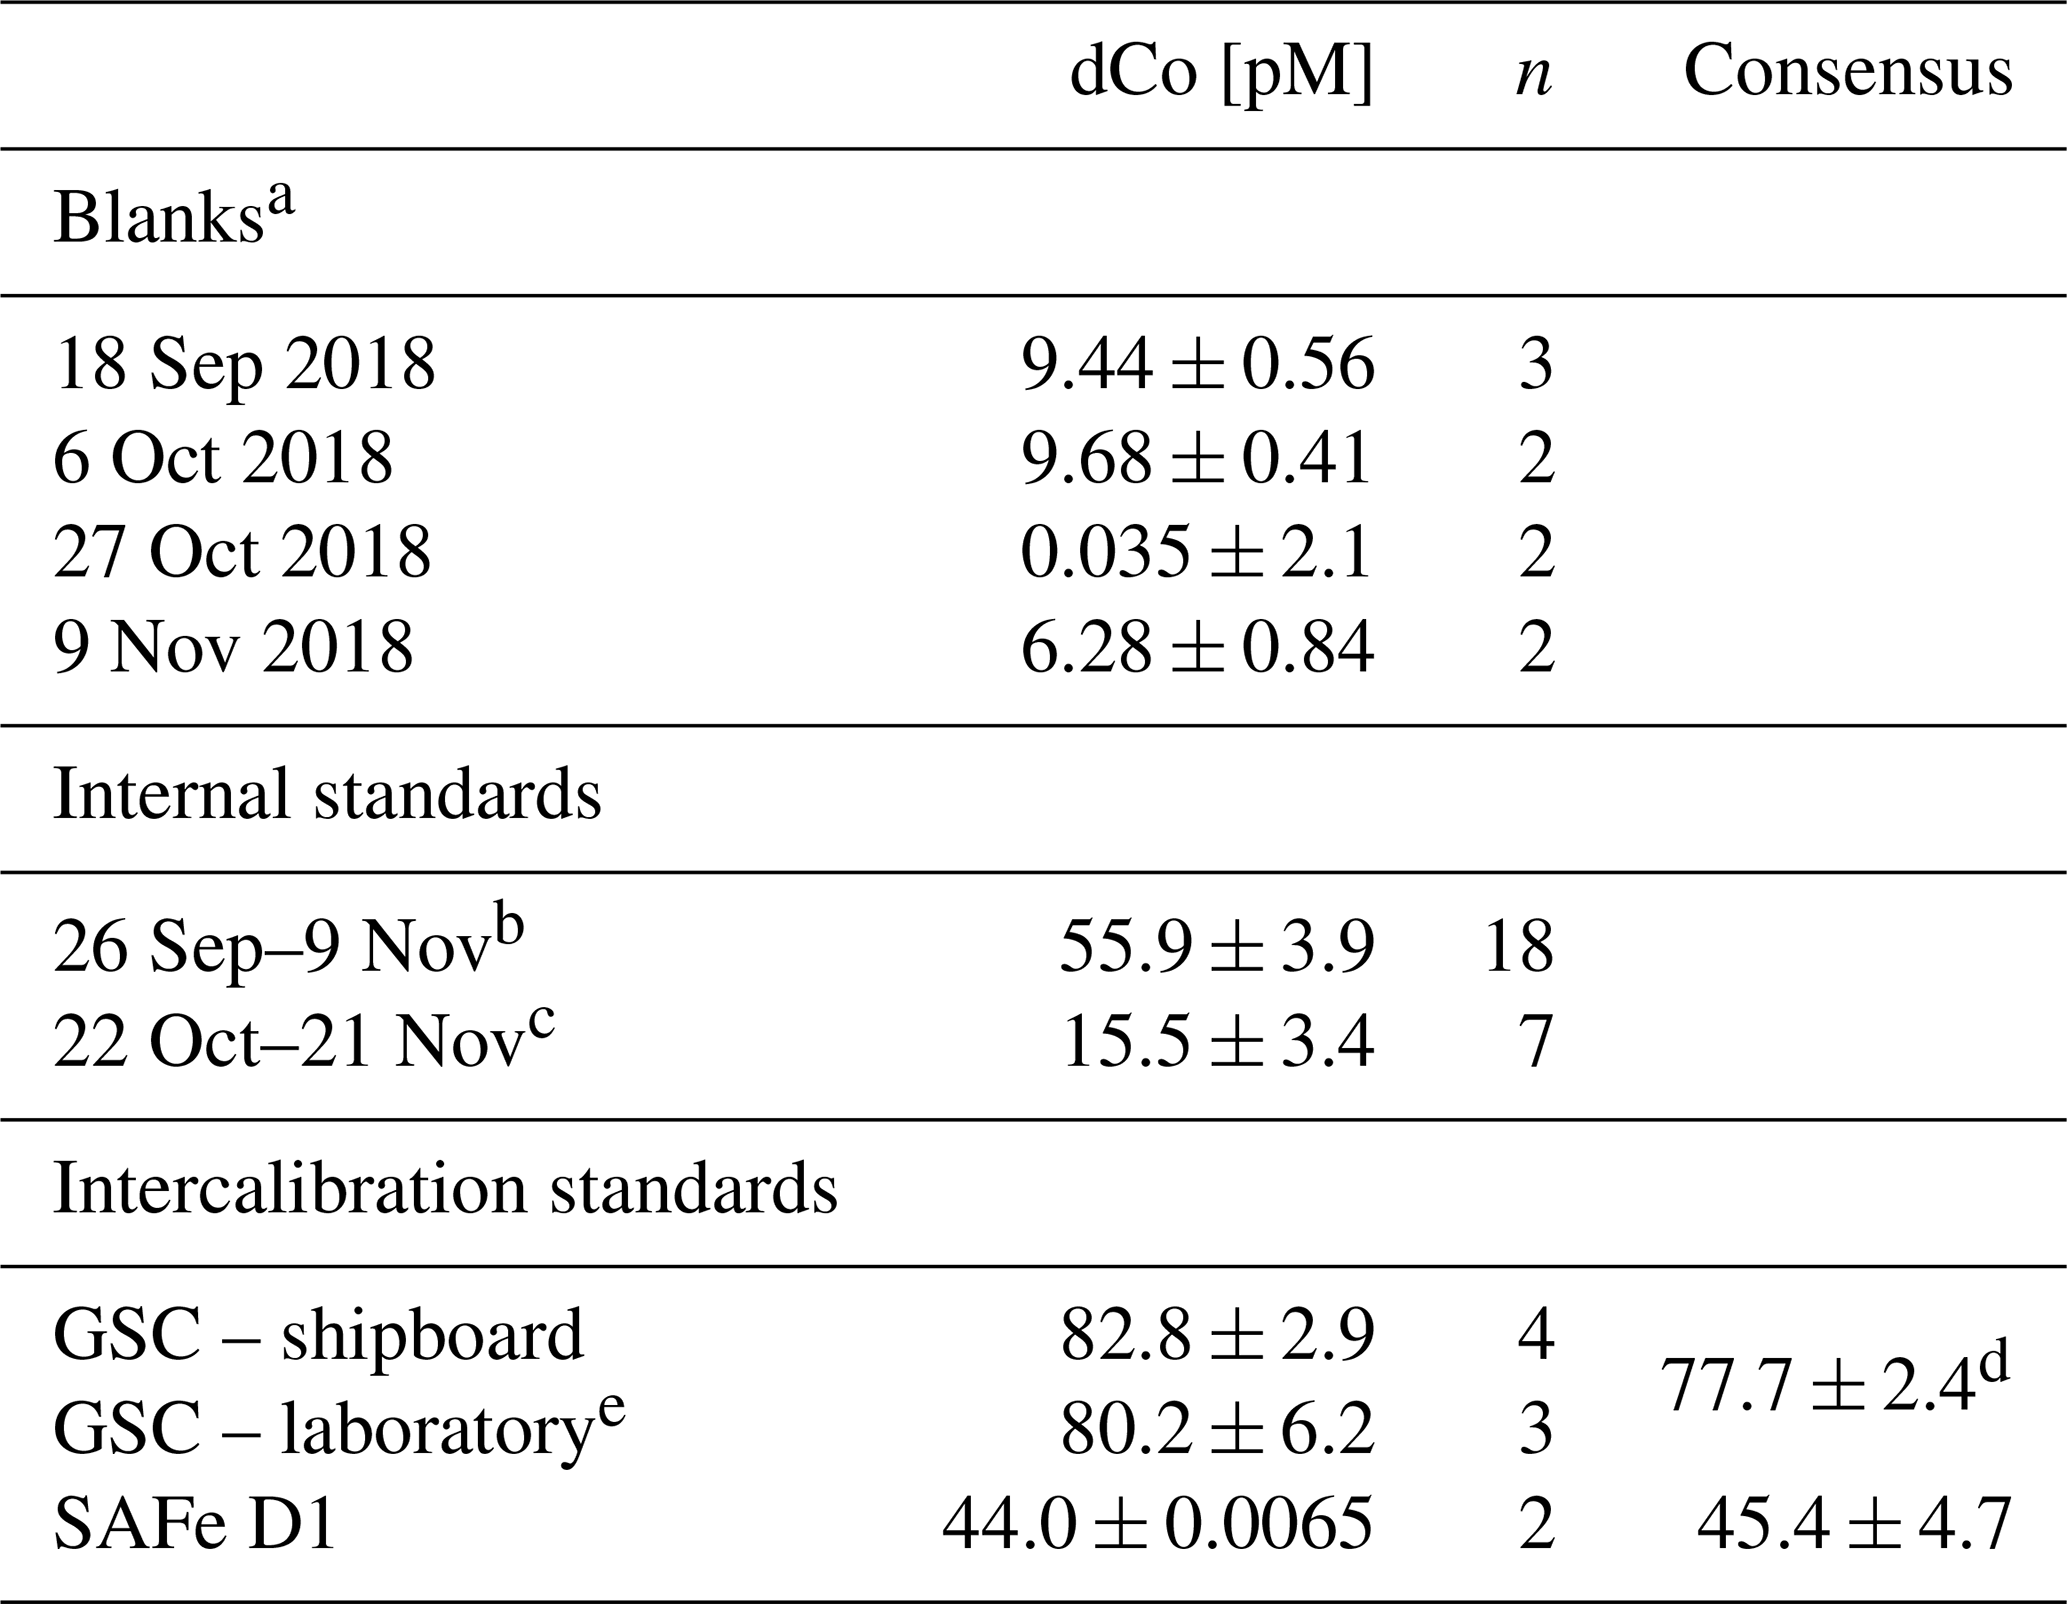
a Pacific seawater, chelexed to remove metals and UV-irradiated. b Surface North Pacific seawater, collected 26 September 2018. c South Atlantic seawater, collected on the CoFeMUG expedition, 2007. d From Hawco et al. (2016). Not an official consensus. e Analyzed August 2019 to November 2019.
2.4 Intercalibration and internal standards
While processing samples at sea, duplicate GEOTRACES community intercalibration standards – either GSC2 or D1 – were run at least once every 2 weeks (Table 1). All intercalibration standards are stored acidified, so samples were carefully titrated directly before analysis with negligible volumes of ammonia hydroxide (NH4OH) until they reached a pH of 7.5–8.2; then they were UV-irradiated and analyzed as a dCo sample. The D1 standard (44.0 ± 0.01 pM, n=2) was found to be within 1 standard deviation of the consensus value (46.6 ± 4.8 pM), and the GSC2 standard (82.8 ± 2.9, n=4) overlaps in its uncertainty range with the value reported in Hawco et al. (2016) (77.7 ± 2.4, 6.2 % difference). Additional GSC2 standards were run in the laboratory in August to November 2019 with a new reagent batch and displayed dCo concentrations of 80.2 ± 6.2 pM (n=3). No official community consensus for dCo in GSC2 currently exists.
To validate the consistency of the instrument, an internal standard was analyzed at least once every other day dCo samples were measured. Two internal standard batches were used during the expedition: the first created from UV-irradiated surface North Pacific seawater (dCo = 55.9 ± 3.9 pM, n=18) and the second created from UV-irradiated South Atlantic water collected on the 2007 GAc01 CoFeMUG expedition (dCo = 15.5 ± 3.4 pM, n=7; Table 1). To ensure Co analysis was consistent while transitioning between internal standards, both standard batches were measured during an overlap period of 2 weeks (22 October–9 November 2018).
Station 35 of the GP15 expedition was a crossover station with the GEOTRACES GP16 expedition in 2013 and was located at the same latitude and longitude as GP16 Station 36 (10.5∘ S, 152∘ W). A comparison of their dCo profiles shows good agreement between the two stations (Fig. 2), although an independent t test of the deep-dCo values (≥ 2000 m) does show a significant offset (5 pM) between the two crossover station profiles (, ). The GP15 measurements showed a deep (≥ 2000 m) dCo signal of 24.0 ± 2.6 pM (n=15), and the GP16 measurements showed a slightly higher deep-dCo signal of 29.1 ± 3.5 pM (n=19). The GP16 profile from 2013 also had a larger mesopelagic maximum between 500 and 1000 m than the GP15 profile, which may be due to seasonal or annual variability in the remineralization signal in the South Pacific Gyre. The 5 pM offset may be due to a small analytical offset or oceanographic variability, possibly related to the higher mesopelagic dCo concentrations observed in the GP16 profile. Although the two profiles have a small statistical difference at depth, their substantial overlap and similarity of geochemical features are good indications that our measurement of dCo on the GP15 expedition was robust and oceanographically consistent.

Figure 2(a) Dissolved Co, (b) salinity and (c) temperature profiles from a crossover station between the GEOTRACES GP15 Pacific Meridional Transect (PMT; November 2018; navy) and the GEOTRACES GP16 East Pacific Zonal Transect (EPZT; December 2013; teal) at 10.5∘ S, 152∘ W. Outliers are marked with an X.
2.5 Particulate metal and particulate organic carbon analysis
Samples for both particulate trace metal analysis and particulate organic carbon (POC) analysis were collected with dual-flow McLane Research in situ pumps (WTS-LV) at each full-depth station. Each McLane pump contained two filter holders: one outfitted with paired 1 µm quartz fiber (Whatman QMA) filters and 51 µm polyester prefilters (Sefar) and the other with paired 0.8 µm polyethersulfone (Pall Supor) filters and 51 µm polyester prefilters. Large particulate, total (LPT) samples were collected from the prefilters (>51 µm). Small particulate, total (SPT) samples were collected from the QMA filters (1–51 µm) and Supor filters (0.8–51 µm), depending on sample type; SPT trace metal and lithogenic samples were collected from the Supor filters, while SPT POC samples were collected from the QMA filters.
Particulate trace metal samples, including particulate Co (pCo) and particulate Mn (pMn), were digested using hot refluxing with hydrofluoric and nitric acids and measured via high-resolution ICP-MS. Particulate aluminum (pAl) and titanium (pTi) concentrations were used as tracers for lithogenic particles and were used to calculate a lithogenic correction for pCo and pMn, where the corrected values represent excess trace metals unaccounted for by a lithogenic source. The Co : Ti ratio between potential lithogenic end-members was less variable (RSD ∼ 27 %) than the Co : Al ratio (RSD ∼ 64 %), so measured pTi was used for lithogenic Co correction together with a molar Co : Ti ratio of 0.00306, which was the median Co : Ti ratio of four potential lithogenic end-members: upper and bulk continental crust (Taylor and McLennan, 1995), mid-ocean ridge basalt (Gale et al., 2013), and ocean island basalt 0.0306 (Hémond et al., 1994). For Mn, the Mn : Al ratio was less variable (RSD ∼ 36 %) than the Mn : Ti ratio (RSD ∼ 48 %) between lithogenic end-members, so measured pAl together with a molar Mn : Al ratio of 0.0086, the median of the four lithogenic end-members as referenced above, was used to correct for lithogenic Mn. Total particulate values were calculated by summing the SPT and LPT values.
POC samples were analyzed via combustion in an elemental analyzer after fuming with HCl to remove particulate inorganic carbon. A particulate sampling and analysis procedure can be found in more detail in Xiang and Lam (2020).
2.6 Excess 3He, dFe and dMn analysis at the Loihi Seamount
The collection, analysis and interpretation of helium (He) isotope and other noble gas samples along the GP15 transect and at the Loihi Seamount (Station 18.6) have been presented by Jenkins et al. (2020). Samples of 3He, 4He and Ne were collected from Niskin bottles on the Ocean Data Facility (ODF) CTD (conductivity–temperature–depth) rosette and not from the trace-metal-clean GEOTRACES CTD carousel (GTC) that supplied the dCo samples. Briefly, He isotopic ratios and abundances were determined by quantitative gas extraction and mass spectrometry as described in Jenkins et al. (2019). Dissolved He and neon (Ne) saturation anomalies were calculated as a function of temperature and salinity, and He isotope ratio anomalies were calculated relative to a marine atmospheric standard. The excess 3He anomaly (xs3He) was determined as the 3He unaccounted for by gas saturation, surface air injection, and diapycnal mixing (Jenkins et al., 2019).
The CTD cast discrepancy between the noble gas samples (ODF) and the dCo samples (GTC) is of particular note at the Loihi station because there was a clear offset in chemical composition between the two sampling casts, likely due to currents pushing the rosettes to differing locations within the heterogeneous vent environment of the seamount (see Sect. 4.3). The offset between the casts made a direct comparison between dCo and the xs3He associated with hydrothermal sources in the Loihi Seamount impossible. Instead, we used dissolved Fe (dFe) and dissolved Mn (dMn) samples taken from both the GTC and the ODF casts to estimate a “potential 3He anomaly” from the GTC cast, assuming the dFe : xs3He and dMn : xs3He ratios were consistent between the two casts. The ODF casts' trace metal : xs3He ratios were used to infer the potential xs3He concentration profile from GTC dFe and dMn concentrations. This calculation is explained in detail in Sect. 4.3.
This paper presents dFe and dMn data determined by flow injection analysis (FIA) for the ODF cast and ICP-MS for the GTC cast, as described in Jenkins et al. (2020). The two methods are in good agreement with each other, as shown in Fig. 3 of Jenkins et al. (2020).
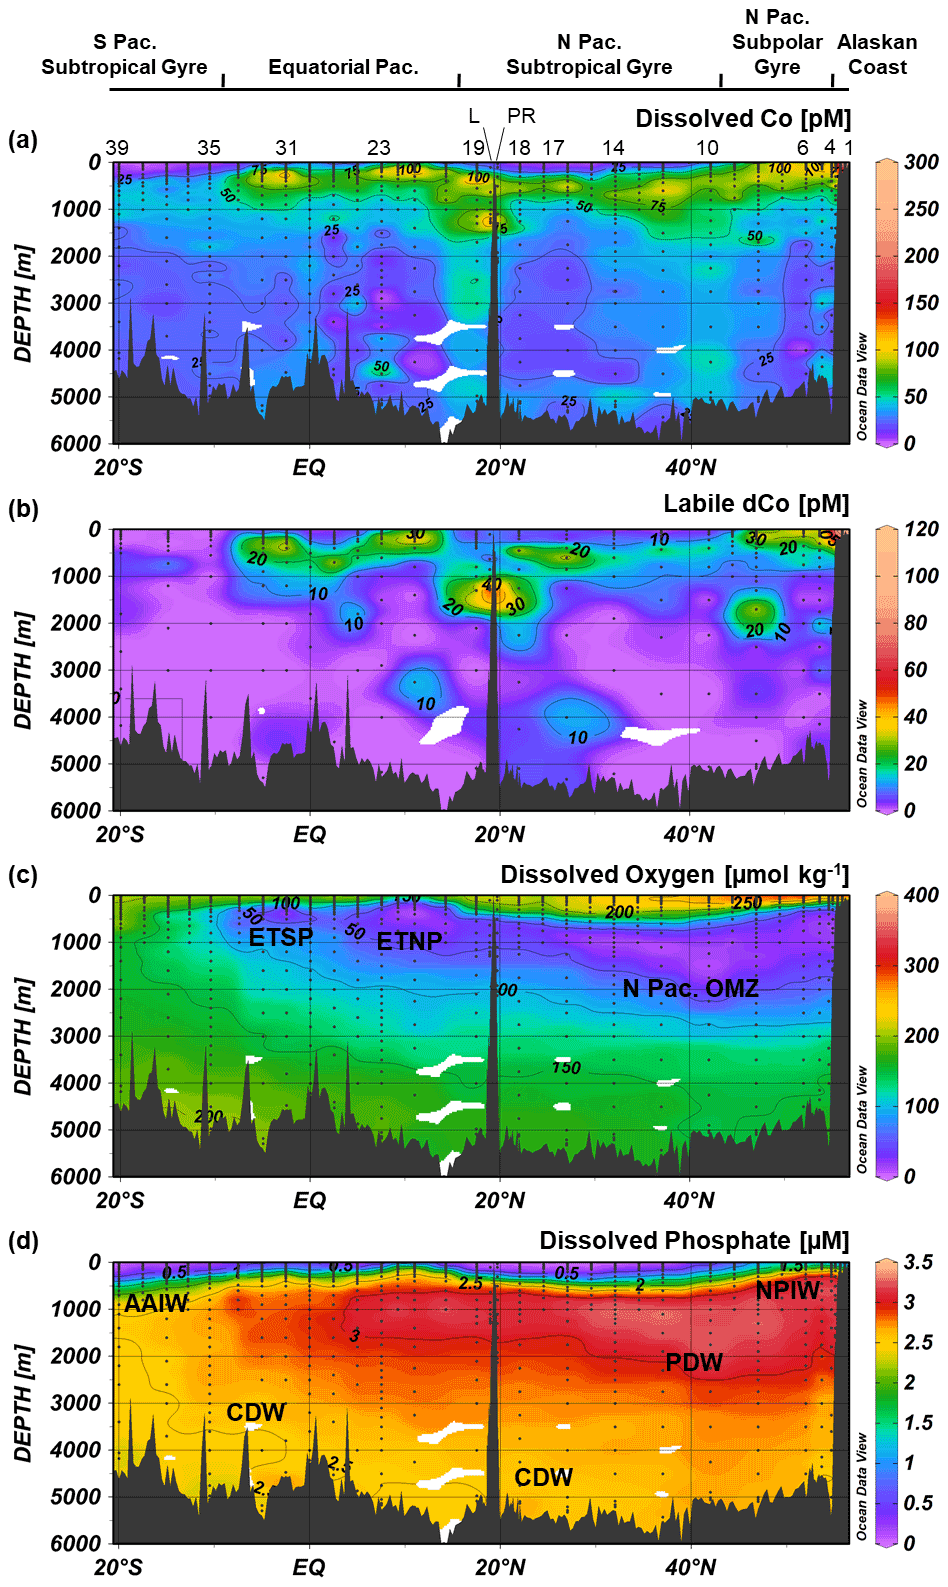
Figure 3Dissolved Co (a), labile dissolved Co (b), dissolved oxygen (c) and dissolved phosphate (d) transects along the GP15 cruise track. Select stations numbers are shown in panel (a), with the Loihi Seamount station labeled as “L” and the Puna Ridge station labeled as “PR”. The eastern tropical North Pacific (ETNP), eastern tropical South Pacific (ETSP) and North Pacific OMZs are labeled, as well as Antarctic Intermediate Water (AAIW), Circumpolar Deep Water (CDW), Pacific Deep Water (PDW) and North Pacific Intermediate Water (NPIW). Weighted-average gridding is used to interpolate between data points.
2.7 Pairing GP15 samples with existing radiocarbon data
To estimate sample conventional radiocarbon age, sample locations along the GP15 transect were matched with existing radiocarbon data from the Global Ocean Data Analysis Project (GLODAP) v2, 2019 merged and adjusted data product for the Pacific Ocean (https://www.glodap.info/index.php/merged-and-adjusted-data-product/, last access: 21 June 2020) (Key et al., 2015; Olsen et al., 2016, 2019). GP15 sample locations were paired with the closest GLODAP sample locations containing Δ14C data using their latitudinal, longitudinal and depth dimensions. Only GLODAP data points that were within 200 m depth and 500 km latitude–longitude distance from the original GP15 sample location were accepted. The conventional radiocarbon age of each deep sample (>3000 m) was calculated with the equation
where 8033 is the inverse of the 14C decay constant (λ; yr−1), and −67 ‰ is subtracted from the Δ14C value to correct for preformed Δ14C in the North Atlantic such that the newly formed North Atlantic Deep Water (NADW) is reset to an age of ∼ 0 years (Matsumoto, 2007). This radiocarbon age calculation has previously been used to calculate Co scavenging rates via thermohaline circulation (Hawco et al., 2018) and does not correct for the increase in anthropogenic radiocarbon due to nuclear weapons testing, the change in the atmospheric 14C due to increased use of anthropogenic fossil fuels via the Suess effect, or the mixing and ventilation of NADW with Antarctic Bottom Water (AABW) during ocean circulation. The lack of correction for ventilation during AABW formation is acceptable because most of the Δ14C and dCo in the deep Pacific is derived from NADW, not AABW (Hawco et al., 2018). The radiocarbon age calculated here is not the “natural” or “circulation” radiocarbon age and is only used to represent relative ages and ventilation of water masses in the deep Pacific Ocean.
2.8 Comparison to a cobalt biogeochemical model
The observational dCo concentrations from bottle samples along the GP15 transect were compared to the output of a published global Co biogeochemical model (Bundy et al., 2020; Richon and Tagliabue, 2021; Tagliabue et al., 2018). The Co model is embedded within the BYONIC version of the PISCES-v2 biogeochemical model (Richon and Tagliabue, 2021), which includes the simulation and circulation of a variety of tracers including dissolved phosphate (dPO4), nitrate, ammonium, silicic acid, Fe, copper (Cu), Zn, Mn and O2 as well as the resolution of different phytoplankton, zooplankton and particle pools. The Co biogeochemical model (Tagliabue et al., 2018) incorporates dCo, scavenged Co, diatom-associated Co, nanophytoplankton-associated Co, small particulate organic Co and large particulate organic Co. External input of Co is via dust, rivers and continental margins, with margin Co supply modulated by the overlying O2 content. The model output was gridded on a 1∘ × 1∘ latitude–longitude grid with 33 depth boundaries: 0, 10, 20, 30, 40, 50, 60, 70, 80, 90, 100, 110, 120, 135, 150, 175, 200, 250, 300, 500, 700, 1000, 1250, 1500, 2000, 2500, 3000, 3500, 4000, 4500, 5000 and 5500 m. Gridded points along the GP15 transect were extracted from the annual mean global model results and compared to the observed GP15 transect. In order to appropriately compare the two datasets, the dCo, O2 and dPO4 observed concentrations along the GP15 transect were binned on the same grid as the model (1∘ × 1∘ latitude–longitude with 33 depth boundaries), and the values of any observed data points that occupied the same bin were averaged.
2.9 Regression analysis
All linear regressions presented in this paper were made using a two-way (type-II) linear regression, with the exception of the standard addition curves used to calculate dCo concentrations (Sect. 2.2). Two-way regressions are more suitable for stoichiometric analysis than one-way (type-I) regressions because they allow for error in the x parameter as well as the y parameter and as such do not assume dependence between the x and y axes. The algorithm for the two-way regression was written into MATLAB (lsqfitma.m) by Ed Peltzer circa 1995 (Glover et al., 2011) and was rewritten as a Python 3 function for this paper (available at https://github.com/rebecca-chmiel/GP15, last access: 3 May 2022).
3.1 Hydrographic setting
The GEOTRACES GP15 expedition (Fig. 1) investigated a cross-section of the North and central Pacific basin that contained a wide range of ocean biogeochemical processes, including the North and South Pacific low-nutrient gyres, shelf- and riverine-associated sedimentary inputs along the Alaskan coast, hydrothermal vent inputs at the Hawaiian Loihi Seamount, and three oxygen minimum regions.
The GP15 transect crosses five major Pacific oceanographic provinces, including (1) the Alaskan coast (56–55∘ N; Stations 1–3), characterized by shallower depths, low-salinity surface waters and the coastal Alaskan Current (Reed, 1984; Stabeno et al., 1995); (2) the North Pacific subpolar gyre (54.6–44.5∘ N; Stations 4–9), an area of cyclonic upwelling and a high-nutrient, low-chlorophyll (HNLC) region generally considered to be iron (Fe)-limited (Boyd et al., 2004; Tsuda et al., 2005); (3) the North Pacific subtropical gyre (42–17.5∘ N; Stations 10–19), an anticyclonic oligotrophic gyre with low surface macronutrients and intermediate suboxic waters; (4) the equatorial Pacific (14.25∘ N–7.5∘ S; Stations 20–34), characterized by equatorial upwelling, subsurface equatorial currents, and the cross-sections of the eastern tropical North Pacific (ETNP) and eastern tropical South Pacific (ETSP); and (5) the South Pacific subtropical gyre (10.5–20∘ S; Stations 35–39), an oligotrophic anticyclonic gyre that is generally macronutrient-limited, particularly for nitrogen (N) (Bonnet et al., 2008).
Three distinct oxygen minimum zones (OMZs) were present in the GP15 transect: the tail ends of the ETNP and ETSP OMZs, around 5–15∘ N and 2–10∘ S, respectively, and the intermediate waters of the North Pacific (Fig. 3c). OMZs are created by a combination of oxygen consumption, often via remineralization of organic carbon, and poor water mass ventilation that forms a “shadow zone” of sluggish, isolated water (Karstensen et al., 2008; de Lavergne et al., 2017). In the ETNP and ETSP, shadow zones are created by Ekman upwelling along eastern Pacific margins of North and South America (Czeschel et al., 2011; Karstensen et al., 2008); these OMZs are wider and more depleted in O2 closer to the American continents where they are formed (Hawco et al., 2016; Stramma et al., 2008), and the GP15 transect captured a cross-section of the less O2-depleted tailings of the OMZs. In contrast, the massive North Pacific OMZ is created by the abyssal overturning of Pacific Deep Water (PDW) traveling northward via thermohaline circulation. When the dense PDW reaches the North Pacific, it is upwelled to mid-depth waters (<2500 m) and returns southward along intermediate isopycnal boundaries, creating a shadow zone of low circulation in the above waters (1000–2500 m) (de Lavergne et al., 2017). The combination of the shadow zone and the remineralization of organic carbon from upwelling-fueled phytoplankton blooms in the North Pacific subpolar gyre (Nishioka et al., 2020; Sarmiento et al., 2004) creates a large OMZ that stretches across the North Pacific transect at intermediate depths. The three Pacific OMZs alter the redox state and biogeochemistry of trace metals contained within them.
3.2 Dissolved cobalt distributions in the Pacific Ocean
During the GP15 expedition, 1024 samples were analyzed at sea for Co, including 715 total dCo measurements (hereafter simply dCo) from 36 stations and 309 labile dCo measurements from 22 stations. The resulting longitudinal transect (Figs. 3, 4) represents the second-largest Pacific dataset of dCo speciation measurements, after the GEOTRACES GP16 dataset (Hawco et al., 2016).

Figure 4Depth profiles of dissolved Co (navy circles) and labile dissolved Co (teal squares) along the GP15 Pacific transect. Suspected outliers are marked as an X.
Dissolved Co was depleted in the surface Pacific Ocean (Fig. 5) due to phytoplankton uptake and utilization. The towfish samples, the surface-most samples collected for dCo around 2 m depth, typically represented a dCo minimum in the profile. Towfish dCo values were lowest in the North and South Pacific subtropical gyres, where average surface dCo reached near-zero values of 1.4 ± 2 pM (n=10) and 0.7 ± 2 pM (n=5), respectively. The surface dCo values were comparatively larger in the North Pacific subpolar gyre and equatorial Pacific, with average surface dCo values of 50 ± 31 pM (n=5) and 8 ± 8 pM (n=10), respectively. The only exception to the observed dCo surface minimum was on the Alaskan coast; Stations 1 and 2, the most coastal stations in the Gulf of Alaska, exhibited dCo maxima at the surface. The highest concentrations of dCo observed in the Pacific transect occurred in the towfish sample of Station 1, which contained a dCo maximum of 576 pM (Fig. 4). This value is 2 orders of magnitude larger than the lowest observed surface values in the transect, highlighting the large and dynamic range of dCo within the Pacific. At this station, dCo was highest in the surface ocean and decreased with depth, a profile typical of a scavenged-type element with a substantial coastal source in the surface ocean.
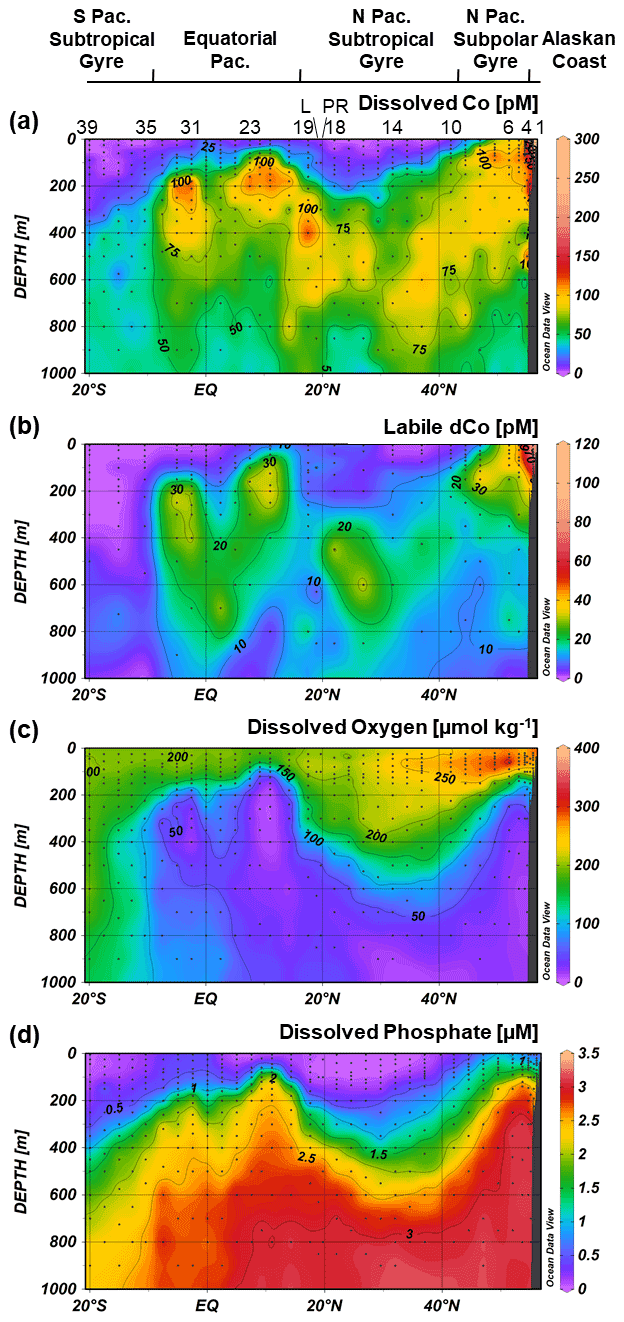
Figure 5Upper-ocean transects of dissolved Co (a), labile dissolved Co (b), dissolved phosphate (c) and dissolved oxygen (d) along the GP15 cruise track. Weighted-average gridding is used to interpolate between data points. Select station numbers are shown in panel (a), with the Loihi Seamount station labeled as “L” and the Puna Ridge station labeled as “PR”.
With the exception of the Alaskan coast and hydrothermally influenced stations, dCo profile maxima were observed in the mesopelagic ocean due to biomass-associated Co remineralization and re-dissolution. Excluding the Alaskan coast surface maxima, dCo maxima of 54 to 167 pM were observed in intermediate depths between 45 and 900 m (Fig. 6). This wide range of depths of the dCo remineralization maxima is associated with regional variation in mixed-layer depth and dCo build-up within OMZs. Within the poorly ventilated OMZ regions, elevated dCo plumes are formed when there is a source of dCo via remineralization in the mesopelagic but little to no loss of dCo via scavenging onto Mn oxide particles (see Sect. 4.4). The average dCo profile maximum was shallowest in the water column in the upwelling regions of the North Pacific subpolar gyre (76 ± 18 m, n=6) and the equatorial Pacific (210 ± 74 m, n=10), where the strongest influence from the North Pacific OMZ, ETNP and ETSP were located. In these regions, the dCo maxima were shallower than the dPO4 maxima that represent the base of the nutricline, indicating that Co distribution within OMZs is somewhat decoupled from P remineralization, which is consistent with our understanding of elevated dCo in OMZs. In contrast, the average dCo profile maximum reached deeper depths in the North and South Pacific subtropical gyres (580 ± 150 m, n=10 and 425 ± 75 m, n=3, respectively) than in the regions affected by OMZs. These deeper mesopelagic dCo maxima follow a deepening nutricline in the subtropics, which is indicative of the downwelling environment, low biomass and high light penetration of the gyres.
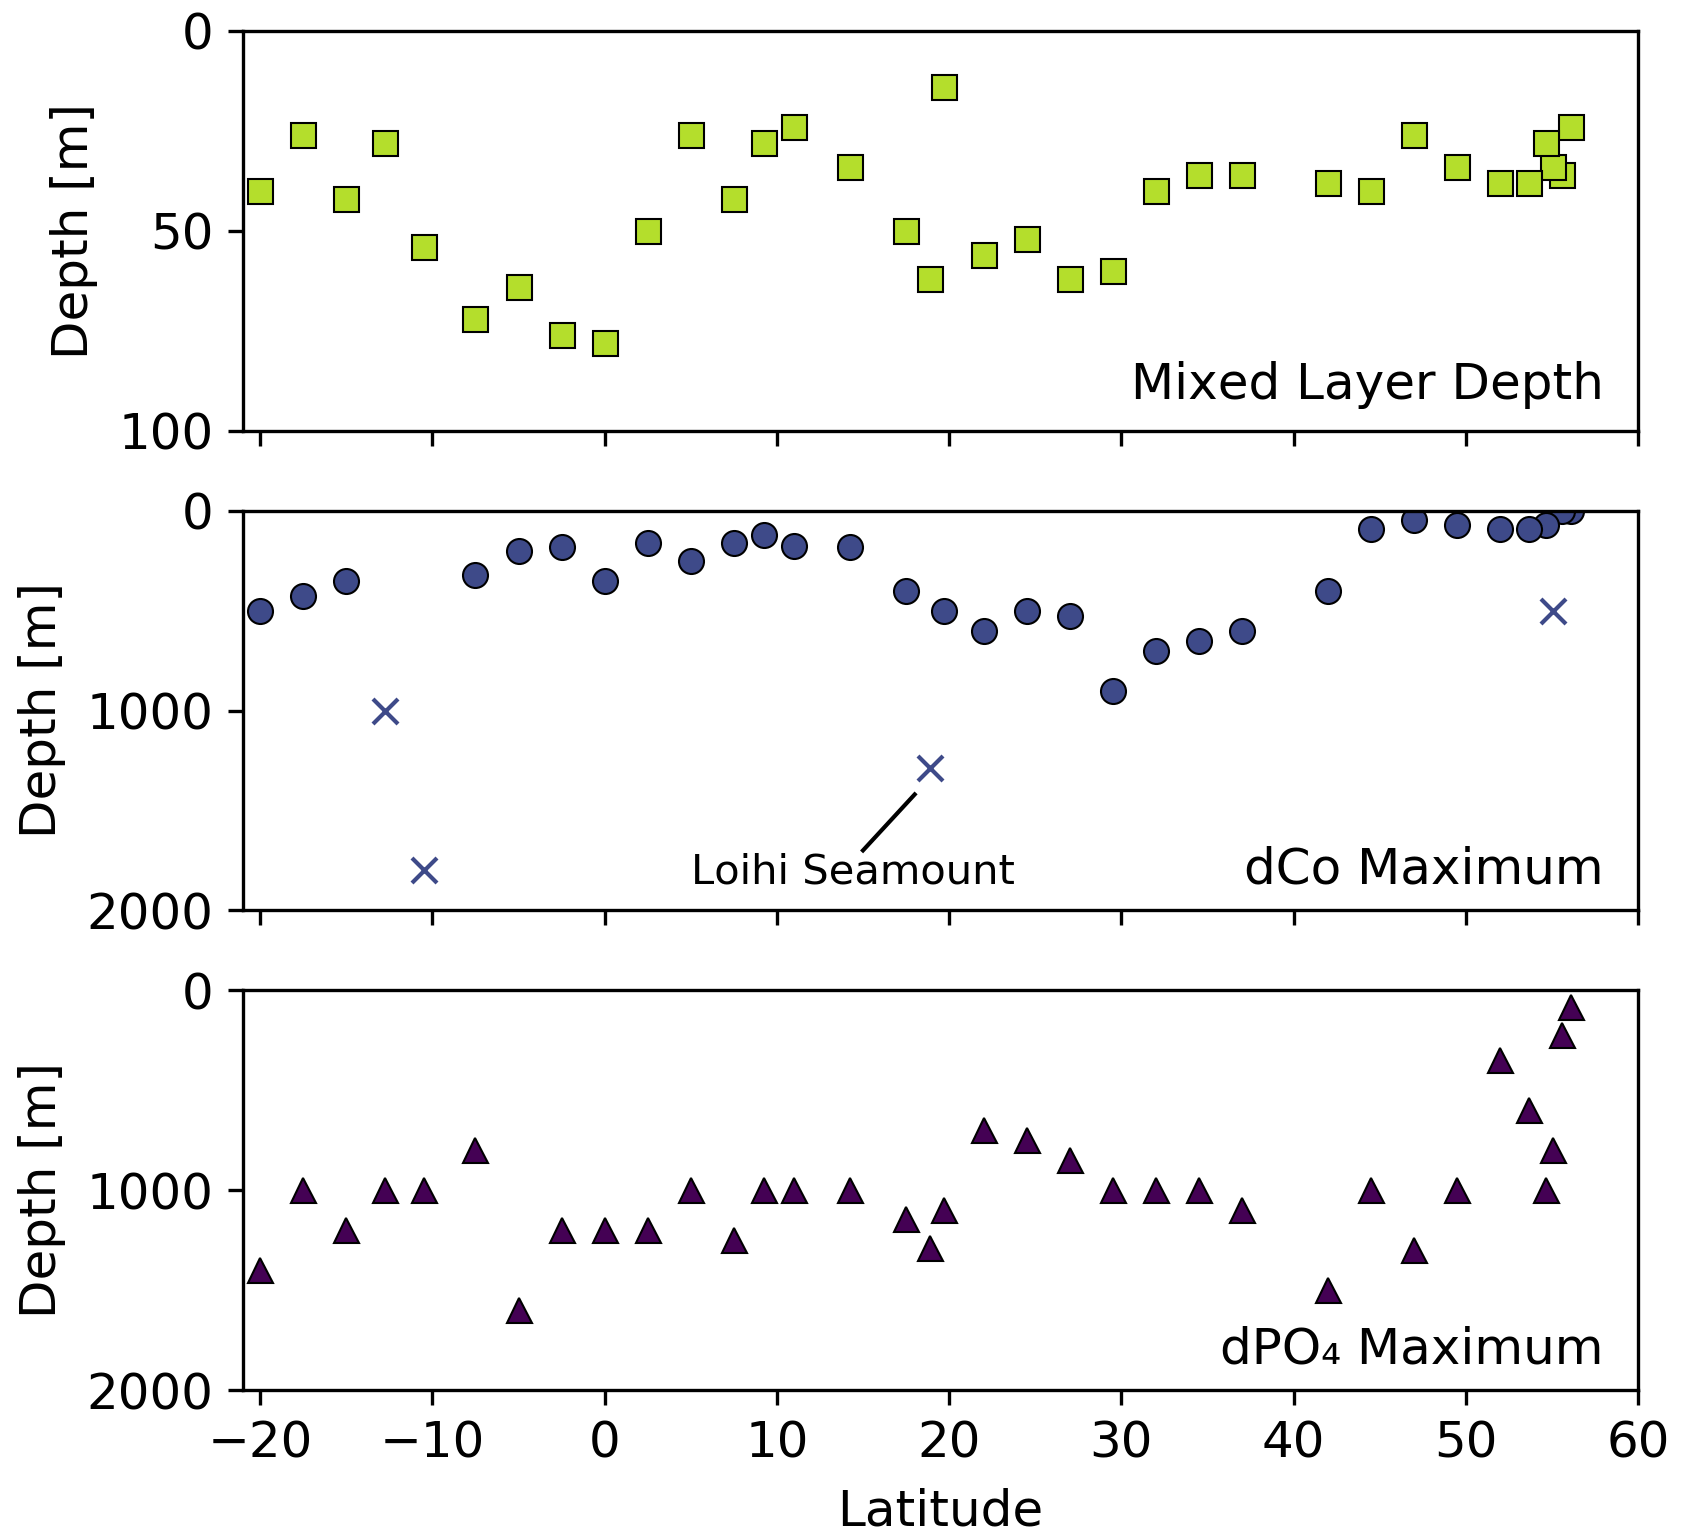
Figure 6Mixed-layer depth, depth of the dCo maximum and depth of the dPO4 maximum vs. latitude for the GP15 transect. Outlier dCo maxima depths are indicated with an X.
Scavenging of dCo within and below the mesopelagic ocean created low concentrations of dCo in the ocean interior. In the deep Pacific (depth ≥2000 m) the average dCo concentration was 27 ± 11 pM (n=166), with large regions of the deep Pacific consistently under 25 pM dCo, particularly in the South Pacific. In contrast, the Atlantic Ocean has greater deep-dCo concentrations on average (Dulaquais et al., 2014a; Noble et al., 2017; Wyatt et al., 2021), with the North and South Atlantic basins displaying deep-dCo concentrations of 57 ± 12 pM (n=166) and 40 ± 9 pM (n=184), respectively (Schlitzer et al., 2018). On GP15, dCo exhibited a heterogeneous distribution within the deep ocean, often with clear vertical regimes of elevated dCo that extend from the mesopelagic to the seafloor. For example, dCo is elevated at the Equator (Station 29), at 17.5∘ N off the coast of Hawaii (Station 19), and in the North Pacific from 32–47∘ N (Stations 14–8). These vertical regimes of elevated dCo are reminiscent of POC export dynamics and likely represent the stabilization of deep dCo in a ligand-bound speciation. This vertical phenomenon is further explored in Sect. 4.6.
3.3 Labile dissolved cobalt
Labile dCo followed similar distribution patterns as dCo (Figs. 3b, 5b). Labile dCo was strongly depleted in the surface and deep interior Pacific Ocean and was elevated in OMZs, coastal regions, the Loihi Seamount and the highly remineralized mesopelagic. The surface ocean south of the subpolar gyre contained exceptionally low concentrations of labile dCo, with average surface towfish samples (∼ 2 m depth) of the North Pacific subtropical gyre and equatorial Pacific displaying labile dCo values of 3 ± 5 pM (n=6) and 1 ± 3 pM (n=7), respectively. A total of 14 of the 21 surface towfish samples analyzed for labile dCo contained concentrations below the detection limit of 2 pM, including all three of the South Pacific subtropical gyre towfish samples. The deep interior Pacific (≥ 2000 m depth) also contained very low to undetectable concentrations of labile dCo, with an average concentration of 2 ± 5 pM and 43 of the 64 deep samples analyzed containing labile dCo concentrations below the detection limit. Like dCo, labile dCo was elevated in the mesopelagic, particularly in the cores of the tropical Pacific OMZ regions, where labile dCo reached a maximum of 49 pM in the ETNP and 56 pM in the ETSP. Labile dCo was depleted in the North Pacific OMZ compared to total dCo, indicating that a large portion of the dCo plume within that low-oxygen region was complexed by organic ligands.
The ratio of labile : total dCo in Pacific seawater was 0.33 ± 0.02 (R2=0.55, n=237; Fig. 7) when data points affiliated with coastal waters (Station 1), OMZs ([O2] <50 µmol kg−1) and hydrothermal activity (Station 18.6, where depth >1100 m) were excluded because they exhibited unique labile : total dCo ratios. This “background” Pacific ratio is identical to the ratio found in the South Pacific (0.33) on the GEOTRACES GP16 transect (Hawco et al., 2016). About two-thirds of dCo present in Pacific seawater existed in a strong ligand-bound speciation, likely as strong Co(III) complexes like vitamin B12 and similar biologically produced molecular species that are unable to exchange with strong ligands in experimental time frames. The other one-third of the dCo inventory existed as “free” or exchangeable, weakly bound Co(II) species that are considered more bioavailable and Mn-oxide-reactive (Baars and Croot, 2014; Saito et al., 2005). However, this 0.33 ratio was not consistent within all samples; of the 309 samples analyzed for labile dCo, 136 showed measurable total dCo but labile dCo values below the analytical limit of detection (2 pM), indicating near 100 % complexation. This caused the background seawater labile : total dCo slope to be depressed below the visual trend in higher labile and total dCo concentrations. Additionally, labile dCo values were found to be elevated compared to total dCo in the Loihi Seamount hydrothermal system and depressed with respect to total dCo near the Alaskan coast, indicating that the ratio of labile : total dCo varies among different dCo sources.

Figure 7Labile dCo vs. total dCo, with notable sources of dCo plotted in color, including Station 1 along the Alaskan coast (green squares), oxygen minimum zones where O2 concentrations are less than 50 µmol kg−1 (purple diamonds) and samples from within the Loihi Seamount vent plume (teal triangles). A theoretical 1:1 line (solid) and a linear regression of background Pacific seawater (dashed; slope = 0.33 ± 0.02, R2 = 0.55, n = 237) are shown. Points to the right of the trend line represent greater dCo complexation compared to background seawater, and points to the left of the trend line represent more labile, un-complexed Co pools compared to background seawater.
4.1 The dCo and dPO4 relationship depicts Co advection, uptake, remineralization and scavenging
The advection of dCo is an important driver of dCo distributions throughout the Pacific. In the deep ocean, CDW carries dCo north from the Southern Ocean to the North Pacific basin via thermohaline circulation, then partially upwells the dCo in the North Pacific basin, forming PDW. To either side of the Equator, dCo is advected at intermediate depths within the ETNP and ETSP OMZs by the North Equatorial Current and South Equatorial Current, carrying elevated concentrations of dCo from the continental margins to the pelagic Pacific Ocean (see Sect. 4.4) (Hawco et al., 2016). However, dCo's relatively short residence time, especially in the upper ocean and mesopelagic, allows other, more vertical processes such as biological uptake, remineralization and scavenging to overlap with the dCo advection signal. This overlap of horizontal (advection) and vertical processes determines the Pacific dCo distribution observed along the GP15 transect.
An analysis of dCo : dPO4 ratios allows us to distinguish between the role of dCo as a nutrient-type and scavenged-type element. When dCo is correlated with dPO4, its distribution is primarily controlled by biological uptake and remineralization as a micronutrient, and when dCo and dPO4 are decoupled, its distribution is primarily controlled by additional processes acting upon the dCo concentrations such as scavenging to oxide particles or an abiotic dCo source. These processes affecting dCo distributions can be depicted in dCo : dPO4 vector space, where Co- and PO4-coupled processes like phytoplankton nutrient uptake and remineralization result in vectors with positive slopes and opposite directionality, while decoupled processes like abiotic inputs and scavenging result in more vertical vectors that primarily show change in dCo concentration (Fig. 8a) (Noble et al., 2008; Saito et al., 2017). Co scavenging is also primarily a biologically mediated process by oxidizing bacteria (Moffett and Ho, 1996), so biotic scavenging of dCo would in theory draw down a relatively small amount of dPO4 via biological uptake. This is represented by a large negative dCo vector and a small negative dPO4 vector, the sum of which is shown in Fig. 8a.

Figure 8(a) A vector schematic showing the relationship between dCo and dPO4 concentrations and the effects of major oceanic processes on nutrient distribution. Biological uptake and remineralization can exhibit a range of stoichiometric relationships, depicted here by the blue shaded region. Adapted from Noble et al. (2008). (b) Observed dCo vs. dPO4 along the GP15 transect. Approximate positions of Circumpolar Deep Water (CDW) and Pacific Deep Water (PDW) are marked.
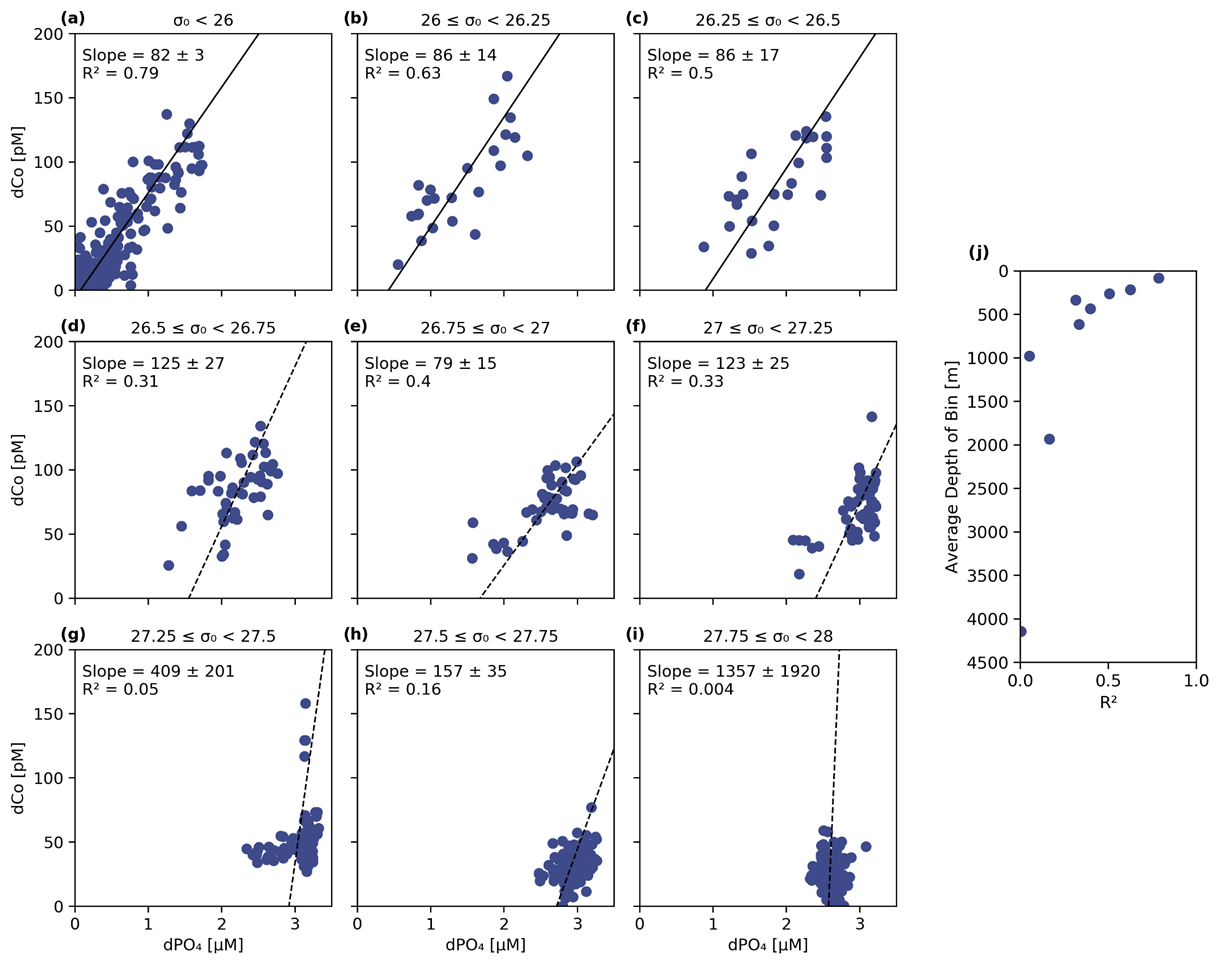
Figure 9(a–i) The dCo vs. dPO4 relationship sorted into nine isopycnal bins by potential density (σ0) with a linear best-fit trend line. The least dense samples (a) represent the surface ocean and phytoplankton dCo : dPO4 nutrient ratio (82 ± 3, µmol : mol; n = 218, R2= 0.79). The decreasing R2 (j) in denser isopycnal bins represents the decoupling of dCo and dPO4 at depth and increasing relevance of Co scavenging. Samples with [dCo] >200 pM and Stations 1 and 2 have been omitted from this analysis.
The dCo vs. dPO4 relationship along the GP15 transect contained a relatively linear stoichiometry in the upper ocean and a “curl” towards the bottom right of the plot driven by mesopelagic and deep samples (Fig. 8b). The linear section in the upper ocean (0 to ∼ 400 m) showed dCo distributions that were governed by phytoplankton uptake and remineralization, driving the coupling of dCo and dPO4 ecological stoichiometry. The curl in the dCo vs. dPO4 relationship occurred because of a shift in relative contributions of processes from remineralization to scavenging; the sum of the mesopelagic remineralization vector (increasing dCo and dPO4) and the scavenging vector (decreasing dCo, little change in dPO4) resulted in a vector sum towards the lower right, creating a curl towards low dCo and high dPO4 in DPW. The decoupling of dCo and dPO4 due to interior scavenging is a characteristic feature of Co's hybrid geochemistry and has been previously documented in the Pacific (Hawco et al., 2016), Atlantic (Noble et al., 2017; Saito et al., 2017) and Arctic oceans (Bundy et al., 2020). To this date, the Southern Ocean is the only major basin that does not display a strong dCo scavenging vector (Noble et al., 2013; Oldham et al., 2021; Saito et al., 2010). Below ∼ 2500 m, the dCo vs. PO4 relationship appeared to curl towards the origin. This phenomenon was driven by the mixing of water masses in the Pacific, namely the transition between the heavily remineralized PDW, characterized by exceptionally high dPO4, and the abyssal CDW, which contained relatively less dPO4 even at greater depths in the Pacific (Fig. 3d). Thus, both dCo and dPO4 were relatively depleted within the CDW mass compared to the intermediate PDW mass, creating a deep Pacific “curl” towards the origin in the deep dCo vs. dPO4 relationship. Note that mixing does not remove dCo or dPO4 from the system; the CDW and PDW masses simply contain different end-member dCo and dPO4 concentrations.
Table 2Isopycnal analysis results. Samples were binned by potential density (σ0), and as σ0 increased, the dCo : dPO4 relationship became more decoupled, as shown by the decreasing R2 value of the correlation. Error is given as standard deviations.
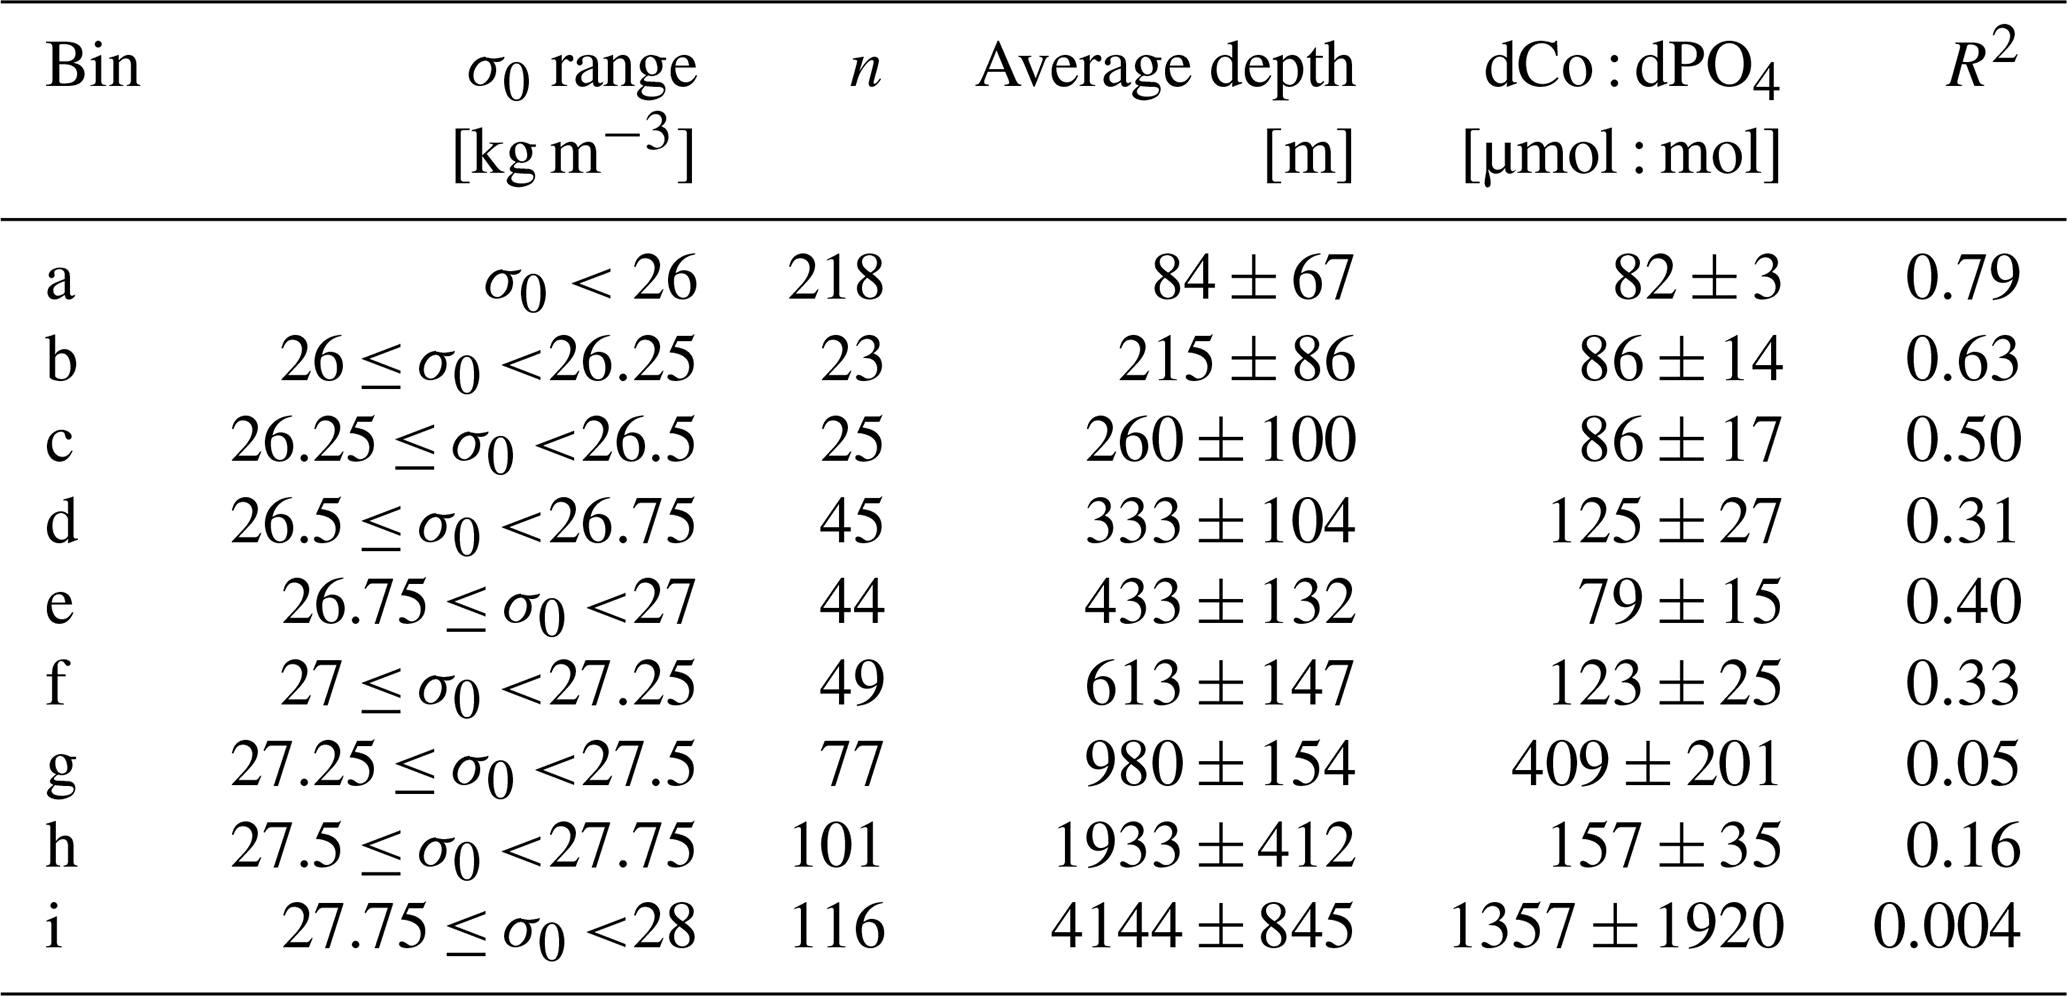
To further explore the dCo vs. dPO4 relationship with depth, sample points along the Pacific transect were divided into nine isopycnal bins by their potential density anomaly (σ0), an analysis described in Hawco et al. (2018) (Fig. 9 and Table 2 in this paper). Each bin contained sample points within a σ0 range of 0.25 kg m−3, with the exception of the least dense bin, which contained all samples with σ0<26 kg m−3. Stations 1 and 2, the Alaskan coastal stations, were removed from this analysis since they exhibited a clear surface abiotic source vector and a negative upper-ocean dCo : dPO4 correlation (see Sect. 4.2), indicating that the dCo : dPO4 relationship was not primarily driven by uptake and remineralization. Dissolved Co and dPO4 were positively correlated in the least dense bin (σ0<26 kg m−3; Fig. 9a), which represented the surface and upper ocean (depth range = 2–325 m, average depth = 84 ± 67 m). The dCo : dPO4 slope was 82 ± 3 (µmol : mol; n=218, R2=0.79), which is an estimate of the combined surface phytoplankton uptake stoichiometry and mesopelagic remineralization stoichiometry. This dCo : dPO4 slope is comparable to the upper-ocean stoichiometry reported in the South Pacific (69, µmol : mol; R2=0.89) (Hawco et al., 2016). In this study and the South Pacific study referenced, there appears to be one clear linear uptake and remineralization slope throughout the upper-ocean depth range. This is distinct from studies in the Atlantic Ocean where the upper dCo : dPO4 ratio varies with depth, and dCo : dPO4 slopes can be described as “accelerating” towards the surface ocean (Saito et al., 2017). High Atlantic dCo : PO4 surface stoichiometry values have been reported up to 544 (µmol : mol; depth = 40–136 m, R2=0.79) (Saito et al., 2017) and 560 (µmol : mol; depth = 5 m, R2=0.63) (Saito and Moffett, 2002), an order of magnitude higher than those reported in the Pacific and deeper Atlantic (27–67, µmol : mol, up to 200–900 m depth) (Dulaquais et al., 2014b; Noble et al., 2017; Saito et al., 2017). The extraordinarily high ecological stoichiometry in Atlantic surface samples has been attributed to strong drawdown of dPO4 in the upper ocean coupled with increased use of Co in metalloenzymes, which is hypothesized to substitute for Zn as a cofactor (Saito et al., 2017). This may be the case for alkaline phosphatase, an enzyme that cleaves phosphate groups from dissolved organic phosphorus molecules and is associated with P stress in phytoplankton (Cox and Saito, 2013; Quisel et al., 1996). Co has been shown to be the metallic cofactor for alkaline phosphatase in the hyperthermophile Thermotoga maritima (Wojciechowski et al., 2002), although Co substitution for Zn in marine cyanobacterial alkaline phosphatase is currently unconfirmed. The Pacific Ocean, in contrast, broadly shows less evidence for P limitation and more evidence for N and Fe stress in the oligotrophic gyres (Bonnet et al., 2008; Saito et al., 2014) and Fe and other trace metal stress in the upwelling regions of the subpolar gyre and equatorial Pacific (Boyd et al., 2004; Coale et al., 1996; Moore et al., 2013; Tsuda et al., 2005; Ustick et al., 2021). This difference in extent of P stress in the Pacific basin compared to the Atlantic was likely the reason for the more linear relationship between dCo and dPO4 throughout the upper Pacific Ocean.
As the σ0 bins increased in density, the correlations (R2) between dCo and dPO4 concentrations became less significant (Fig. 9j), indicating that dCo concentrations were becoming decoupled from dPO4 in the deep Pacific due to Co scavenging. In the second (b) and third (c) bins, the dCo : dPO4 slopes (86 ± 14 and 86 ± 17 (µmol : mol), respectively) are similar to that of the least dense bin (82 ± 3, µmol : mol), but the slope error increases, and the R2 value decreases at higher bin densities. Below the third density bin (σ0≥26.5 kg m−3), the R2 values of the correlations are extremely low, and the slope values should not be interpreted as meaningful. The deep-ocean density bins (Fig. 9g–i; average depths: 980 to 4144 m) displayed little dynamic range in dCo or dPO4, indicating little to no significant remineralization or scavenging signatures across the deep ocean despite the wide depth range represented by these bins. These findings are consistent with other studies that show that Mn oxide formation and dCo scavenging primarily occur along sharp density gradients in the mesopelagic and are not as significant in the ocean's deep interior, where scavenging occurs at a slower rate (Hawco et al., 2018; Saito et al., 2017; Sunda and Huntsman, 1988).
4.2 The Alaskan coast as a source of ligand-bound dCo
In the coastal Gulf of Alaska at Stations 1 and 2, the dCo and labile dCo profile maxima occurred at the ocean surface (∼ 2 m depth; Fig. 10c). This dCo distribution is similar to that of the Arctic Ocean, where high surface dCo concentrations of a similar magnitude and a scavenged-type profile have been attributed to riverine inputs from the surrounding continents and sedimentary inputs from the Arctic shelf (Bundy et al., 2020). The Station 1 towfish surface seawater sample contained the highest dCo and labile dCo measured in this study (576 and 102 pM, respectively) and displayed a noticeably low labile : total dCo ratio of 0.18, representing a source of predominantly ligand-bound, likely humic dCo to the surface water of the coastal Gulf of Alaska. In vector dCo vs. dPO4 space (Fig. 8a), this riverine input is represented by an upward abiotic source vector. Both dCo and labile dCo were negatively correlated with dPO4 (R2= 0.77 and R2= 0.57, respectively) and salinity (R2 = 0.81 and R2= 0.60, respectively; Fig. 10a, b). The correlation to salinity is a strong indication that dCo from a coastal freshwater end-member is mixing with the pelagic marine dCo inventory. This relationship is consistent with studies that found that riverine dCo was linearly coupled with salinity in the Arctic Ocean (Bundy et al., 2020), the Scheldt River estuary (Zhang et al., 1990), the Atlantic continental shelf off the northeastern US (Noble et al., 2017; Saito and Moffett, 2002) and the Amazon River output into the Atlantic (Dulaquais et al., 2014a). To estimate the dCo concentration of the riverine end-member, the linear dCo : salinity relationship was extrapolated to a salinity of 0, resulting in a dCo concentration of 13.3 ± 0.4 nM and a labile dCo concentration of 1.69±0.09 nM. This estimation assumes riverine dCo is mixing conservatively, which is unlikely to be true since other processes like scavenging and uptake are expected to occur at river mouths and coastal environments (de Carvalho et al., 2021). The negative correlation with dPO4 is striking since almost all other upper-ocean samples are positively correlated with dPO4 in the surface ocean due to nutrient uptake and remineralization (Sect. 4.1). Here, the negative dCo : dPO4 correlation is likely due to mixing as well; an end-member source of dCo at the surface with low dPO4 is mixing with an open-ocean end-member that contains relatively lower dCo and higher dPO4.
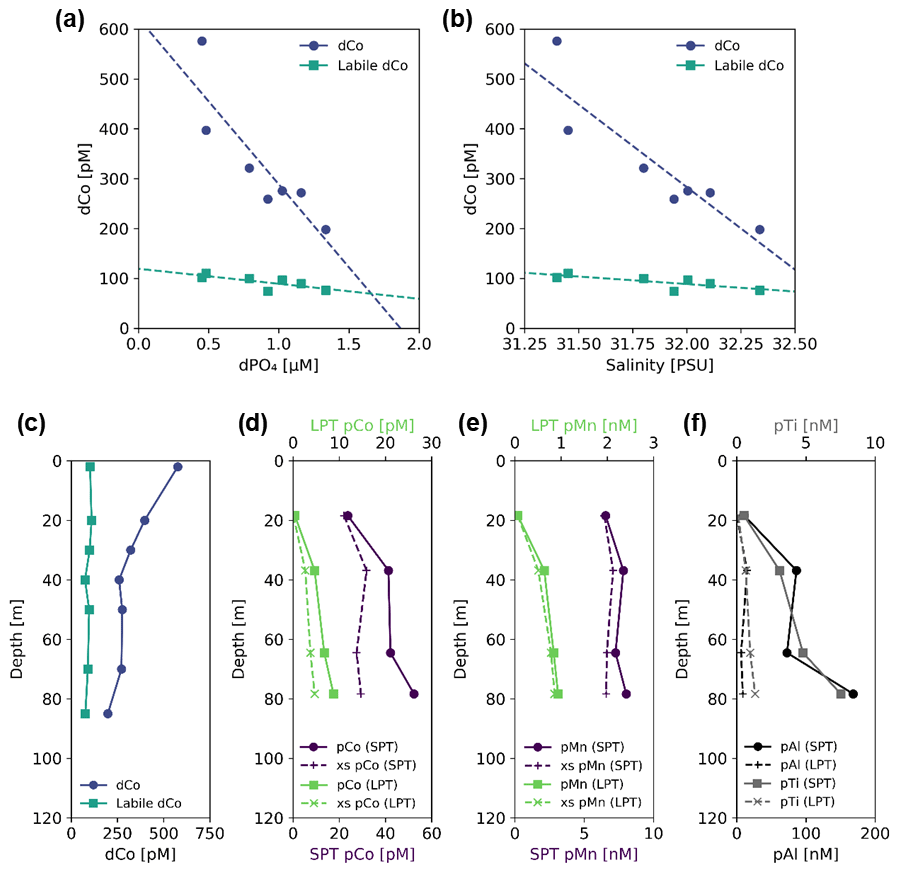
Figure 10Sample data and profiles from Station 1, a coastal station in the Gulf of Alaska (56.06∘ N, 156.96∘ W); (a) dCo and labile dCo vs. dPO4 show a significant negative correlation (slope = −430 ± 88, µmol : mol; R2= 0.77 and slope = −53 ± 18, µmol : mol; R2= 0.57, respectively); (b) dCo and labile dCo vs. salinity show a significant negative correlation (slope = −406 ± 73 pM PSU−1, R2= 0.81 and slope = −50 ± 15 pM PSU−1, R2= 0.60, respectively). Depth profiles of (c) dCo and labile dCo and of small particulate, total (SPT) and large particulate, total (LPT); (d) pCo and excess pCo (xs pCo); (e) pMn and excess pMn (xs pMn); and (f) pAl and pTi. Note the change in scale of the x axis between SPT and LPT (d, e) and between pAl and pTi (f).
Particulate Co, pMn, and the lithogenic tracers pAl and pTi were all elevated at depth, in stark contrast to the surface dCo maximum (Fig. 10d–f). The deep particulate metal maxima indicate the presence of a shelf-derived particulate flux that is distinct from the dCo riverine surface flux. In the open ocean, dCo and pCo typically mirror each other in the upper water column (Noble et al., 2017), with biological uptake of Co resulting in low surface dCo and high surface pCo. The opposite distribution was observed at Station 1, suggesting that dCo and pCo at this coastal station are more strongly influenced by external inputs rather than internal cycling, with higher surface dCo due to fresh riverine inputs and increasing pCo with depth due to sedimentary particle flux. Fe has been observed to behave similarly along the Alaskan coast, where terrestrial- and glacial-derived dFe is transported by rivers to the surface coastal ocean (Crusius et al., 2011; Schroth et al., 2014), while the continental margins are a source of redox-sensitive pFe to the subsurface Gulf of Alaska (Lam et al., 2006; Lam and Bishop, 2008).
The Alaskan coast thus acts as a source of both dCo and pCo to the coastal Gulf of Alaska, delivering a flux of Co to the Alaskan Stream, a westward-flowing coastal current along southwestern Alaska and the Aleutian Islands (Reed, 1984; Stabeno et al., 1995). We observed little evidence that elevated dCo distributions were advected off the shelf into the pelagic Gulf of Alaska; instead, much of the dCo inputs observed at Stations 1 and 2 appear isolated from the coastline via transport within the Alaskan Stream, and elevated surface dCo was not observed at Station 3 or beyond. This mechanism could work to isolate the HNLC region of the subpolar gyre from trace metal sources along the Alaskan coast and within the Alaskan Stream.
4.3 Hydrothermalism and the Loihi Seamount
Elevated dCo concentrations were observed at the Loihi Seamount (Station 18.6; 18.91∘ N, 155.26∘ W), with a dCo maximum of 158 pM and a labile dCo maximum of 87 pM at a depth of 1290 m. This maximum corresponded to a greater labile : total dCo ratio (0.55) compared to background Pacific Seawater (0.33; Fig. 7). An elevated dCo and labile dCo signature has previously been observed in the Hawaiian Kīlauea eruption of 2018 (Hawco et al., 2020), confirming previously observed dCo signals in the vicinity (Noble et al., 2008) and in the near-field plumes of the Juan de Fuca Ridge and the Atlantic Mid-Ocean Ridge (Metz and Trefry, 2000; Noble et al., 2017).
He isotopic samples were collected from the Ocean Data Facility CTD (ODF) cast and not from the GEOTRACES CTD carousel (GTC) that the dCo samples were collected from. At the Loihi Seamount, the two CTD casts were completed at the sample station with latitudinal and longitudinal precision to within ∼ 15 m and deployment within 1.5 h of each other. However, the casts appeared to sample different sections and/or locations within the hydrothermal plume, as indicated by anomalies in the dFe and dMn data collected from both casts. The GTC cast displayed trace metal (dCo, dFe, dMn) concentrations increasing towards the deepest sample at 1290 m, while trace metals (dFe, dMn) and xs3He from the ODF cast displayed a shallower maximum around 1200–1250 m (Fig. 11a–d). This offset is likely attributable to slight changes in the wire angle of the CTD casts and/or the natural heterogeneity of the hydrothermal plume. The Loihi Seamount sampling station was located near the center of Pele's Pit, a collapsed volcanic pit ∼ 200 m deep located towards the southern summit of the seamount. Pele's Pit contains several active hydrothermal vent fields within a radius of ∼ 100 m of the Loihi station, and the casts likely sampled a combined and heterogeneous hydrothermal signature from multiple vents (Clague et al., 2019; Jenkins et al., 2020).

Figure 11Profiles of (a) dCo, (b) dFe, (c) dMn and (d) excess 3He (xs3He) from the Loihi Seamount station (Station 18.6) from both the trace-metal-clean GEOTRACES CTD carousel (GTC; solid lines) and the general CTD from the Ocean Data Facility (ODF; dashed lines). To estimate xs3He values for the GTC cast, (f) the ODF cast's dFe : xs3He and dMn : xs3He ratios (7.6 ± 0.7 mol : µmol, R2 = 0.95 and 0.66 ± 0.06 mol : µmol, R2= 0.95, respectively) were used to predict (e) potential xs3He values with respect to the GTC dFe and dMn values. (g) The GTC dCo : potential xs3He ratios were 6 ± 1 mol : mmol (Fe-derived, R2= 0.78) and 7 ± 2 mol : mmol (Mn-derived, R2= 0.71). For the trace metal : xs3He regressions, only samples below 750 m were used to isolate the hydrothermal signal from surface processes. Error bars for potential xs3He (e, g) indicate the propagation of error from the regression slope in panel (f).
The offset between the GTC and ODF casts means that the dCo data and xs3He data could not be directly compared to show a hydrothermally associated dCo source from the vent system. Instead, the dFe and dMn profiles collected from both casts were used to calculate a “Potential xs3He” signal from the GTC cast; the dFe : xs3He and dMn:xs3He ratios from the ODF cast, measured via FIA, were calculated to be 7.6 ± 0.7 mol : µmol and 0.66 ± 0.06 mol : µmol, respectively (Fig. 11f). Samples from above 750 m were excluded in order to isolate the hydrothermal relationships from unassociated upper-ocean processes. Then, the GTC profile dFe and dMn values, measured via ICP-MS, were multiplied by the dissolved metal : xs3He ratio to find the potential xs3He profile for the GTC cast (Fig. 11e). This estimation assumed that the dFe : xs3He and dMn : xs3He ratios were consistent between all vents in Pele's Pit and thus are comparable between the two casts. Although this assumption is a reasonable one to make within Pele's Pit since all potential vent locations within the pit are sourced from the same sub-seafloor magma reservoir (Clague et al., 2019), and the trace metal vs. xs3He correlations at this station are reasonably linear (Fig. 11f; Jenkins et al., 2020, Fig. 4 therein), there is evidence to suggest trace metal hydrothermal ratios are more diverse and heterogeneous within vent fluids than previously expected (Kleint et al., 2019). Thus, any interpretation of the potential xs3He results should be considered within the limitations of this assumption of consistent trace metal : xs3He ratios between the two casts.
Dissolved Co was positively correlated with the potential 3He anomaly at the Loihi Seamount (Fig. 11g). The Fe-derived and Mn-derived GTC dCo : potential xs3He ratios were found to be similar to each other, with values of 6 ± 1 mol : mmol (R2= 0.78) from the Fe-derived estimate and 7 ± 2 mol : mmol (R2= 0.71) from the Mn-derived estimate. This correlation shows that there is a local dCo source from the Loihi Seamount that is clearly associated with hydrothermal activity and that the local dCo source is exported above the sill height of Pele's Pit (∼ 1100 m) to the surrounding water column. The 3He flux from the Loihi Seamount vent was estimated to be 10.4 ± 4 mol yr−1 during the GP15 expedition (Jenkins et al., 2020), suggesting a local Co flux of 6 ± 3 × 10⁴ mol Co yr−1 using the Fe-derived estimate or 7 ± 3 × 10⁴ mol Co yr−1 using the Mn-derived estimate. This local dCo source is one of the few hydrothermal Co flux observations that show transport of dCo from an active vent without directly sampling hot vent fluids. The estimated Co flux would represent 3 % to 4 % of the global hydrothermal Co flux, which has been estimated to be ∼ 2 × 10⁶ mol Co yr−1 (Swanner et al., 2014). This percentage is surprisingly high for one hydrothermal vent system, but it should be noted that the 3He flux at the Loihi Seamount was also estimated to be ∼ 2 % of the global deep hydrothermal flux (Jenkins et al., 2020) and that the majority of the hydrothermal dCo source is expected to be quickly scavenged.
The Loihi Seamount was the source of an eastward-flowing distal plume of elevated xs3He that stretched across an estimated 1 × 10¹² m2 area of the Pacific basin (Jenkins et al., 2020). Even though the GP15 transect did not capture the full extent of this hydrothermal plume, xs3He, dMn and dFe were found to be elevated at nearby stations (18, 19, and the Puna Ridge); when interpolated to the core plume depth of 1100 m, dFe and dMn showed a positive correlation with xs3He at distal stations (Jenkins et al., 2020, Fig. 6 therein). In contrast, dCo concentrations interpolated to 1100 m from distal stations (14–25) showed little correlation with xs3He (R2= 0.28), indicating that hydrothermally associated dCo was not likely to have been transported far within the plume. Although it is difficult to make assumptions about a plume that was not thoroughly sampled by the expedition track, this finding is consistent with the hypothesis that the majority of hydrothermally sourced dCo is scavenged before it is able to be transported far on a basin scale.
Hydrothermal vents are notoriously heterogenetic, and the variations in vent fluid metal compositions between individual vents, ocean basins and over time contribute to a relatively unconstrained dCo hydrothermal flux. Hydrothermalism has been considered a negligible source of Co to the marine system since labile dCo is particularly susceptible to scavenging. It has been estimated that hydrothermal activity contributes only ∼ 2.4 % of the total marine Co budget (Swanner et al., 2014). A more recent study to further constrain the global marine Co cycle adjusted this hydrothermal estimate to be only ∼ 0.3 % of the total marine Co flux when other dCo sources were added or increased (Hawco et al., 2018). Here, we observed local vertical transport of dCo to the surrounding water column, but not horizontal transport of dCo to the greater Pacific basin. Our findings corroborate the evidence that dCo from Pacific hydrothermal inputs is likely relatively local and minor.
4.4 Elevated dCo in oxygen minimum zones
The phenomenon of elevated dCo in O2-depleted regions has been documented throughout the global oceans, including in the North Atlantic, South Atlantic and South Pacific tropical OMZs (Baars and Croot, 2014; Hawco et al., 2016; Noble et al., 2012, 2017). These hotspots are created when there is a source of dCo to the mesopelagic via remineralization of sinking phytoplankton biomass and/or sedimentary flux processes but a suppressed sink of dCo via scavenging onto Mn oxide particles (Hawco et al., 2016). Manganese oxides are slow to form in OMZs due to the low-O2 conditions, and the reductive dissolution of advected manganese oxide particles is favored (Johnson et al., 1996; Sundby et al., 1986). Thus, dCo is able to build up in low-O2 regions within the mesopelagic and basin interior, creating plumes of dCo associated with OMZs (Hawco et al., 2016). As the elevated plume of dCo is advected to more oxic regions of the ocean, the dCo becomes vulnerable to oxic scavenging processes and can be quickly lost. Remaining elevated dCo then mixes with the surrounding oxic waters and forms a mixing line, creating a noticeable dCo : O2 correlation at OMZ depths. The dCo : O2 correlation observed in and around OMZs represents both this accumulation of dCo in low-oxygen waters and its advection and mixing into surrounding oxic waters.
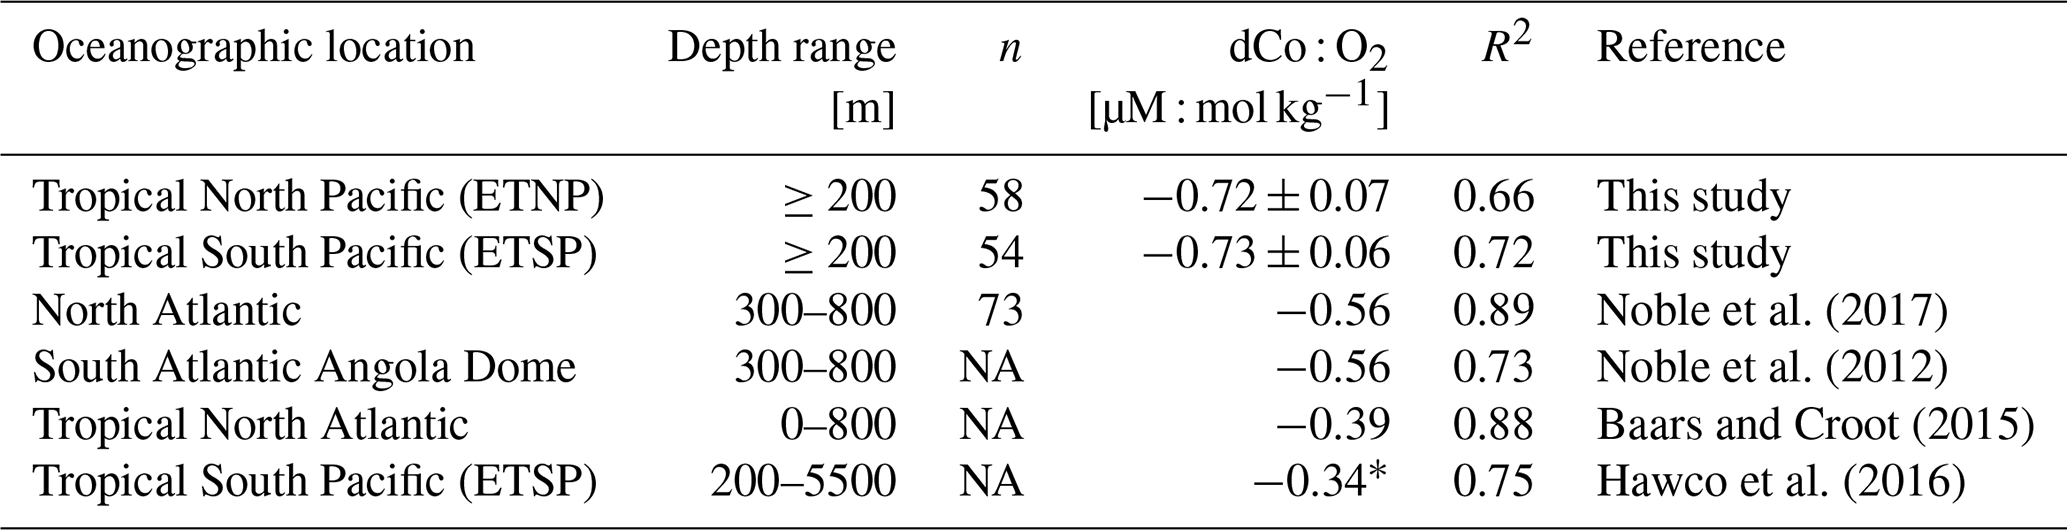
Within the ETNP (Fig. 12b; Stations 20–25) and ETSP (Fig. 12c; Stations 29–34), dCo and O2 are negatively correlated (R2= 0.66 and 0.72, respectively; Table 3). This linear relationship suggests that dCo is advected from the cores of the tropical OMZs, where dCo from the continental margin is concentrated within the low-O2 waters of the eastern boundary currents and then is transported westward through the pelagic Pacific. The dCo : O2 slopes within the ETNP and ETSP (−0.72 ± 0.07 and 0.73 ± 0.06 µM : mol kg−1, respectively) are higher than those observed in the North and South Atlantic, as well as those observed in the ETSP along the GP16 expedition transect (Table 3) (Baars and Croot, 2014; Hawco et al., 2016; Noble et al., 2012, 2017). However, the dCo : O2 values observed along the GP15 transect cannot necessarily be extrapolated to the entire ETSP or ETNP because the transect only captures the tail ends of the equatorial OMZs, where the O2 depletion and subsequent dCo enrichment are not as strong as they are further east along the margin of the Americas (Hawco et al., 2016). The higher dCo : O2 slopes observed in this study may be attributed to the expedition track sampling along the boundary of the OMZs, where O2 concentrations reach below 2 µmol kg−1, but dCo concentrations rapidly decrease in the surrounding oxic ocean. The persistence of the OMZ systems >5000 km from its core along the coast demonstrates the strength and geochemical influence of the tropical Pacific OMZs.
Table 3Dissolved Co vs. O2 correlation within OMZs in the Pacific GP15 transect (this study) and others.
* The dCo : O2 correlation was originally reported as −0.33 µM : M and was adapted to units of µM : mol kg−1 using a conversion of 1.025 kg L−1. NA: not available.
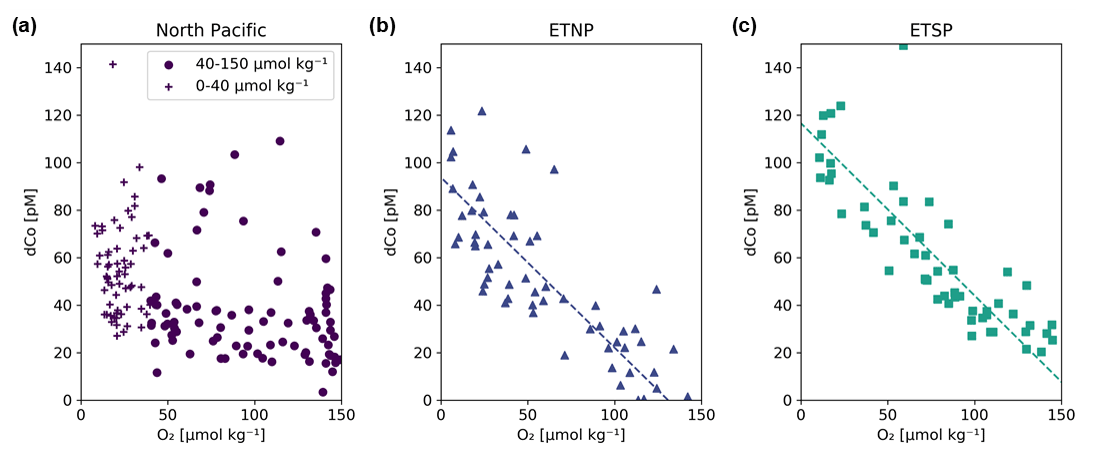
Figure 12Dissolved dCo vs. O2 relationships within the three Pacific OMZs. Data points from the North Pacific OMZ (a; Stations 3–18; ≥ 500 m depth) show a nonlinear trend where samples at O2<40 µmol kg−1 display a wide range of dCo values, likely due to remineralization and scavenging at shallow depths in the OMZ, and samples between 40–150 µmol kg−1 O2 displayed little correlation. Samples from the ETNP (b; Stations 20–25; ≥ 200 m depth) and ETSP (c; Stations 29–34; ≥ 200 m depth) show a linear relationship between dCo and O2 associated with advection from the eastern core of the OMZ. The ETNP displayed a dCo : O2 slope of −0.72 ± 0.07 µM : mol kg−1 (R2= 0.66, n = 58), and the ETSP displayed a dCo : O2 slope of −0.73 ± 0.06 µM : mol kg−1 (R2= 0.72, n = 54). See Appendix A for additional dCo : O2 analysis.
In contrast, the North Pacific OMZ showed little to no correlation between dCo and O2 (R2= 0.16), which was unexpected given the robust relationship of dCo and O2 in OMZs observed throughout the world. Instead, the North Pacific OMZ displayed relatively consistent dCo concentrations between 20–40 pM in samples between 40–150 µmol kg−1 O2 and a range of higher dCo concentrations where O2 fell below 40 µmol kg−1 (Fig. 12a). The more complex relationship between dCo and O2 in the North Pacific compared to the ETNP and ETSP suggests that multiple processes are affecting this relatively stagnant OMZ; the horizontal processes of advection and mixing likely drive the concentrations of dCo between 40–150 µmol kg−1, while the more vertical processes of remineralization and scavenging likely drive the higher range of dCo concentrations at lower O2 concentrations. These vertical processes are particularly visible in shallower samples where the OMZ intersects with the mesopelagic dCo maximum and its internal cycling source of dCo via remineralization (Fig. A1).
The North Pacific OMZ also lacks a single point source of dCo and pCo within its low-O2 waters compared to the coastal Co sources from the eastern boundary margins that are advected westward within the equatorial OMZs. In the ETNP and ETSP, coastal sedimentary dCo inputs are protected from scavenging, and margin pCo inputs are available for reduction and remobilization within the low O2 concentrations of the OMZ as this elevated dCo signal is advected from the coast to the pelagic ocean (Hawco et al., 2016). The North Pacific, in contrast, has a number of diffuse dCo sources from the surrounding continental margin and advection from the Kuroshio Extension current (Zheng et al., 2019), but there is little evidence that coastal sources are significantly transported to the pelagic North Pacific (Sect. 4.2). Additionally, the OMZ does not extend to the continental margin, and so any advected dCo source will be more vulnerable to loss via remineralization and scavenging as it travels between its coastal origin and the North Pacific OMZ. This lack of an intersection between the OMZ and a continental margin and the wide range of processes affecting dCo concentrations in this region are likely key reasons why we do not observe a simple linear correlation between dCo and O2 in the North Pacific.
4.5 Implications of deoxygenation on the Pacific dCo inventory
The extent and intensity of Pacific OMZs have been increasing over the past 50 years due to global ocean warming, and OMZs are predicted to continue to expand throughout the next century (Matear and Hirst, 2003; Stramma et al., 2008). The waters surrounding OMZs are predicted to have the greatest O2 loss rate; over a 50-year period, Stramma et al. (2008) estimated an O2 loss trend (ΔO) of −0.13 ± 0.32 µmol kg−1 yr−1 in the core of the equatorial Pacific OMZs (5∘ N to 5∘ S, 105 to 115∘ W), compared to a more negative ΔO of −0.19 ± 0.20 µmol kg−1 yr−1 farther west on the outskirts of the OMZs (5∘ N to 5∘ S, 165 to 175∘ W). Note that the ΔO estimates have a high error, which makes the prediction of future effects due to deoxygenation uncertain. The GP15 expedition passed between the locations of these two equatorial Pacific estimates, and it is reasonable to assume that ΔO within the equatorial OMZs at the longitude of the GP15 transect (152∘ W) falls somewhere between the two estimates.
Deoxygenation is expected to affect redox-sensitive trace element cycles in and around expanded OMZs. Compared to other trace metal cycles, the Co cycle may be notably affected by decreasing O2 concentrations because of its exceptionally small dissolved inventory; expanding OMZs are predicted to increase the dCo inventory and decrease the Co scavenging flux, representing a significant perturbation to the marine Co cycle. In the next 100 years, the dCo inventory is estimated to increase by ∼ 10 % in the South Atlantic OMZ (Noble et al., 2012) and by ∼ 20 % in the North Atlantic OMZ (Noble et al., 2017).
Using the O2 loss trends from Stramma et al. (2008) and the dCo : O2 linear trends calculated above, we estimated the increase to the dCo inventory within the 152∘ W cross-sectional transect of the ETNP and ETSP over the next 100 years (Table 4). Assuming the linear relationship observed between dCo : O2 will be constant over the next century, the dCo inventories within the equatorial Pacific OMZs are estimated to increase at a rate (ΔdCo Δt) of 0.068 to 0.11 pM yr−1. To predict the effect of this rate of dCo change in the Pacific, the upper-ocean (≥ 1000 m) dCo inventory was estimated over the stations within the ETNP and ETSP via trapezoidal integration of dCo station profiles over depth and latitude. The estimated dCo inventories were determined within upper-ocean boxes of the Pacific with a width of 1 m, a depth of 1000 m, and a length equal to the distance between the northernmost and southernmost stations affected by the OMZ along a longitude of 152∘ W (Table 4). The GP15 cross-section of the ETNP has a present dCo inventory (Ipresent) of 52 mol and is predicted to increase by 18 % to 26 % over the next 100 years, and the cross-section of the ETSP has an Ipresent of 38 mol dCo and is predicted to increase by 25 % to 36 %.
Table 4Predicted effects of deoxygenation on the dCo inventories (I) of the upper 1000 m of the eastern tropical North Pacific (ETNP) and eastern tropical South Pacific (ETSP) oxygen minimum zones (OMZs) along the GP15 transect at 152∘ W. For comparison, ΔdCo Δt was estimated using the dCo : O2 relationship from the GP16 expedition (Hawco et al., 2016). Ipresent represents the current dCo inventory integrated over the OMZ stations, and I100 yr represents the estimated change in the dCo inventory in 100 years. Vsection represents the volume of each GP15 section sampled, with a width of 1 m and a depth of 1000 m.
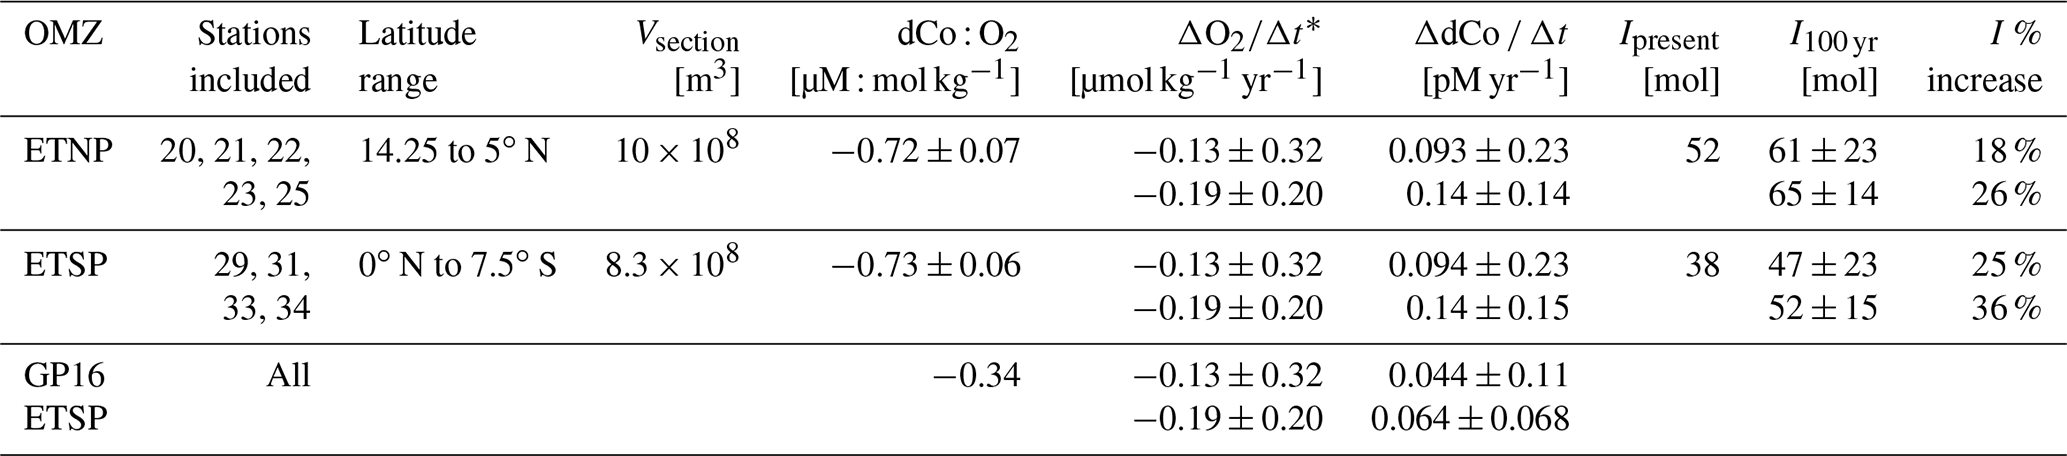
* Pacific deoxygenation trends (ΔO) are from Stramma et al. (2008, Table 1 therein). ΔO rates were estimated within the core of the Pacific equatorial OMZs (−0.13 ± 0.32 µmol kg−1 yr−1; 5∘ N to 5∘ S, 105 to 115∘ W) and along their western boundary (−0.19 ± 0.20 µmol kg−1 yr−1; 5∘ N to 5∘ S, 165 to 175∘ W).
This increase in the dCo inventory is similar to or higher than those predicted in the Atlantic, likely because the more pelagic regions of the OMZ captured by the GP15 transect are predicted to experience higher rates of deoxygenation than those closer to the coastal core of the equatorial OMZs. Similarly, the calculated ΔdCo Δt of the ETSP on the GP15 expedition is greater than is predicted when we use the dCo : O2 relationship from the GP16 expedition (−0.34 µM : mol kg−1), which estimates a ΔdCo Δt of 0.044 to 0.064 pM yr−1 using the same ΔO2 Δt values. The GP16 expedition sampled closer to the South American coastline and the core of the ETSP than the GP15, and so a less dramatic dCo increase trend may be more representative of the near-shore equatorial OMZs. Estimating the open-ocean OMZ trend appears particularly important as the low dCo inventory of the more pelagic South Pacific is acutely sensitive to deoxygenation, and the ETSP expansion could increase the dCo inventory at 152∘ W by as much as 36 % over the next 100 years.
We recognize these are simple back-of-the-envelope calculations, but they nevertheless may be useful to inform the direction, if not the exact magnitude, of future changes in dCo inventory. The estimates presented here all have a high error associated with their calculation, which stems from the uncertainty in the original ΔO rates from Stramma et al. (2008). The rates of Pacific deoxygenation and ocean warming are relatively unconstrained, making it difficult to predict the effects of global climate change on the Pacific Co cycle. Furthermore, the assumption that the dCo : O2 relationship will stay constant over the next 100 years of global change is not necessarily valid; excess dCo builds up in low-oxygen waters, and much of the observed dCo : O2 correlation can be considered a mixing line between the OMZ source and oxic waters. The dCo source of the equatorial OMZs is primarily unscavenged dCo advected from continental shelf margins, which is driven by the surface area of the shelf sediments exposed to low-O2 waters (Hawco et al., 2016). As the equatorial OMZs expand, the OMZ-shelf surface area will also expand, likely increasing the dCo source to the ETNP and ETSP. Thus, the dCo : O2 slope presented here could become more negative over time if the OMZ (dCo source) end-member increased, but the oxic (low dCo) end-member stayed similar or constant, leading to greater increases in the dCo Pacific inventory than estimated here. We recommend future modeling, experimental and observational work to better constrain the effect of deoxygenation on the oceanic Co inventories.
Although we did not observe a linear dCo : O2 relationship in the North Pacific OMZ (see Sect. 4.4), Stramma et al. (2008) estimate that the North Pacific has had a higher rate of O2 loss over the past 50 years than all other regions studied (−0.39 to −0.70 µmol kg−1 yr−1). Strong North Pacific deoxygenation trends may drive relatively large increases in the dCo inventory over the next century as O2 concentrations decrease, and the region becomes a source of dCo via Mn oxide reduction. Currently, the potential dCo trend in the North Pacific is difficult to estimate, but future deoxygenation could result in greater increases in the dCo inventory here than any other ocean basin. More research on the North Pacific OMZ and deoxygenation is required to determine the extent of future perturbation to the North Pacific Co cycle.
4.6 The presence of deep, stable dCo in the North Pacific
One of the most unexpected features in the GP15 dCo transect was the discovery of stable, ligand-bound dCo in the deep interior of the Pacific Ocean, particularly in the North Pacific basin. These higher dCo concentrations do not appear to be due to analytical error or blank correction error and instead appear to be robust evidence for the presence of complexed dCo below the mesopelagic that has been protected against scavenging. The discovery of elevated dCo in the North Pacific was unexpected since dCo has been shown to be scavenged along deep thermohaline circulation with deep-dCo concentrations decreasing with 14C age (Hawco et al., 2018). When deep GP15 samples (>3000 m) were paired with their nearest radiocarbon age measurement from the GLODAP database and compared to data from previous GEOTRACES expeditions (Fig. 13a–b, Table 5), many GP15 samples from the North Pacific appeared to deviate from the expected trend of decreasing dCo with water mass age. Deep samples along this transect are estimated to have a conventional radiocarbon age of 918–1645 years, with the intermediate North Pacific containing the oldest waters (>1600 years). The low ventilation of these deep waters can also be seen in the average AOU value at each station below 1000 m depth (Fig. 13e), which displays a steady increase in oxygen utilization with latitude along the transect. Thus, intermediate and deep North Pacific waters were expected to have the lowest, most depleted concentrations of dCo as they are the some of the oldest, least ventilated ocean waters in the world and have had a relatively long time frame to scavenge their available dCo. While many of the deep GP15 samples, particularly in the South and equatorial Pacific, fell along this predicted trend of slow but steady scavenging within aging water masses, many samples from the North Pacific were relatively high in dCo despite their age. This finding suggests a source of dCo to the deep North Pacific, superimposing a regional source process on top of a global circulation scavenging process.
Table 5Average conventional radiocarbon age, apparent oxygen utilization (AOU) and dCo of the deep Pacific Ocean (>3000 m depth). GP15 samples were matched with their nearest Δ14C and AOU observations from the GLODAP database.
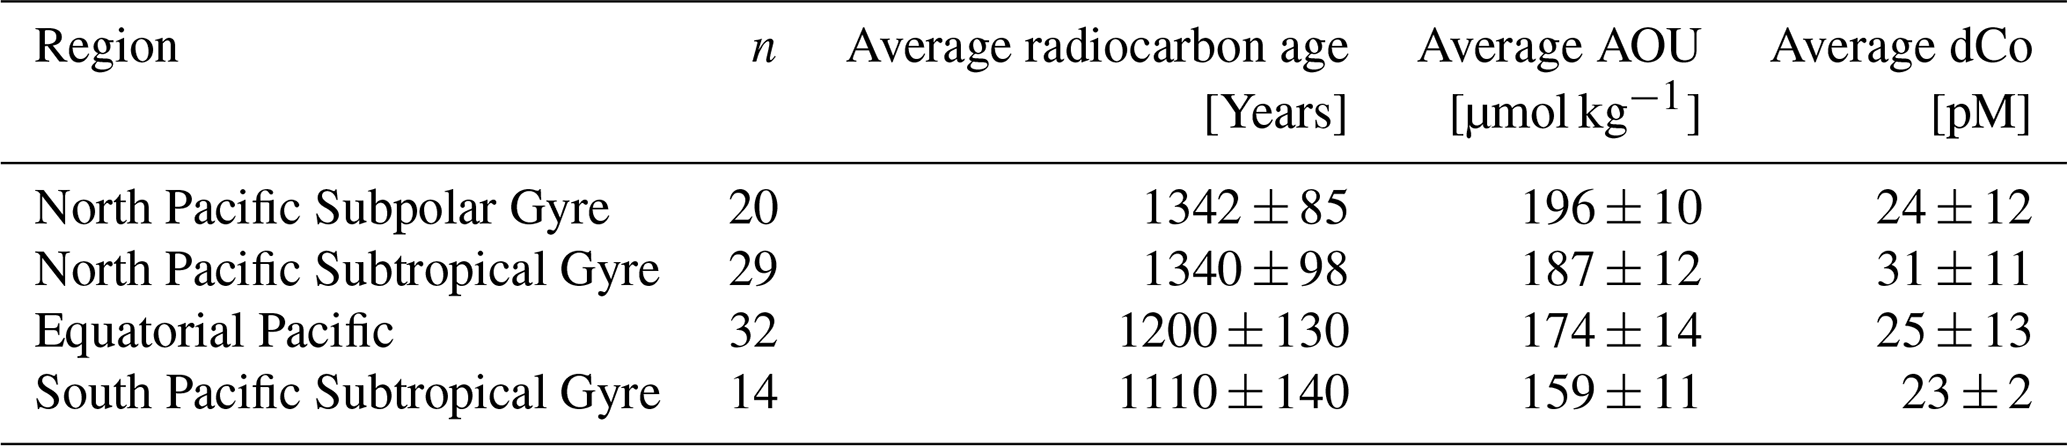
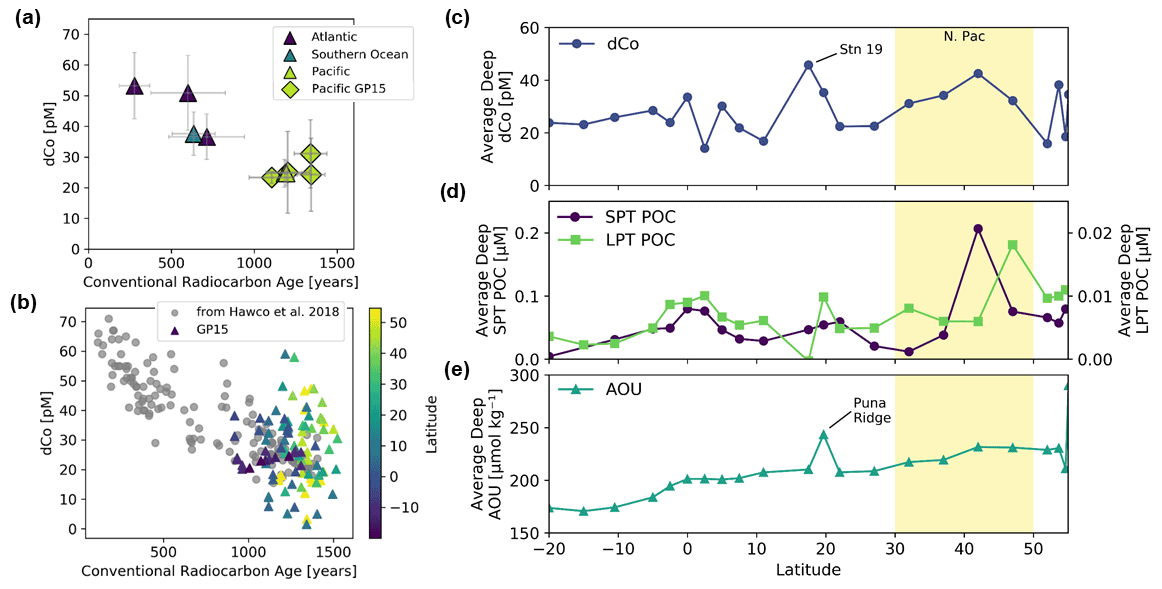
Figure 13(a) Average dCo concentrations vs. radiocarbon age of the deep ocean (≥ 3000 m) by oceanographic basin with error bars of standard deviation. Data from GEOTRACES expeditions other than GP15 (triangles) are from Hawco et al. (2018; Table 2 therein); (b) dCo vs. radiocarbon age of individual GEOTRACES dCo samples matched with their nearest GLODAP radiocarbon measurement. (c–e) Deep-ocean (≥ 1500 m), depth-weighted averages of dCo, small particulate, total (SPT) particulate organic carbon (POC), large particulate, total (LPT) POC and apparent oxygen utilization (AOU) for each deep-station profile. The yellow boxes highlight the region in the North Pacific where average deep dCo and POC are elevated. Note the order-of-magnitude difference between the scales of the POC y axes (d).
Little excess pCo or pMn was observed in the North Pacific, suggesting that few Mn oxide particles were present in this region (Fig. 14). As noted in Sect. 4.2, pCo and dCo phases often exhibit mirror distributions; where there is high dCo, there tends to be low pCo and vice versa. This finding is consistent with a low rate of Mn and Co scavenging in the mesopelagic and deep North Pacific. Additionally, POC concentrations were elevated at depth in the North Pacific subpolar gyre, and the elevated ligand-bound dCo observed in this region partially overlaps with this deep POC signal, although the deep-dCo signal extends farther south than the deep POC signal. Therefore, the unexpected deep-dCo signal may be associated with regional POC export.
Figure 14Total excess (lithogenically corrected) pCo (a), total excess (lithogenically corrected) pMn, (b) and total POC (c) transects along the GP15 cruise track. Total particulate values are summations of the small particulate, total (SPT) and large particulate, total (LPT) size fractions. Weighted-average gridding is used to interpolate between data points.
To better examine deep-ocean trends with latitude, the depth-weighted average deep-ocean (≥ 1500 m depth) concentrations of dCo and POC for each station were estimated using the equation
where xi represents the concentration value of each sample, zi represents the depth of each sample, and wi represents the weight assigned to each point as defined by the sample's distance from adjacent points in the station profile. The deep-ocean averages show consistently elevated inventories of dCo in the North Pacific (Fig. 13c). In the same region, there was dramatically elevated POC inventories at some stations. Average deep concentrations of SPT POC spiked to 0.21 µM at Station 10 (42∘ N, 152∘ W), while the average deep concentrations of LPT POC had a similar maximum of 0.018 µM a little farther north at Station 8 (47∘ N, 152∘ W; Fig. 13d).
One compelling explanation for the complexed deep-dCo presence is the wide North Pacific OMZ. Unlike the shallower equatorial OMZs of the Atlantic and Pacific, this low-oxygen zone stretches across the majority of the North Pacific mesopelagic. Although the dCo : O2 relationship is not as strong here as the equatorial OMZs, as described above, the low oxygen would still suppress the rate of dCo scavenging in the mesopelagic, where the majority of Mn oxide scavenging typically occurs (Sect. 4.4). Additionally, this region contains the transition zone chlorophyll front (TZCF), a stark transition in surface chlorophyll concentrations between the low-macronutrient subtropical gyre to the south and the iron-limited subpolar gyre to the north (Polovina et al., 2001, 2017). The TZCF seasonally migrates between 30 and 45∘ N and is characterized by elevated biological activity, a net CO2 uptake flux and a distinct CO2 sink (Juranek et al., 2012). On the GP15 expedition, prominent upper-ocean and mesopelagic POC export (2000 m export depth) was also observed via 230Th analysis in this region (Kenyon et al., 2022). High particulate export coupled with suppressed Mn oxide formation in the mesopelagic would carry biogenic particles and ligand-bound dCo associated with biomass, vitamin B12 and/or metalloproteins into the deep ocean, where the biogenic pCo is further remineralized by heterotrophs, releasing complexed dCo. The larger eukaryotes like diatoms and coccolithophores that are supported under nutrient-replete conditions in the TZCF (Juranek et al., 2012) are also prone to faster sinking velocities (Clegg and Whitfield, 1990), which would carry this regions' biogenic particles deeper into the water column.
The remineralization of vitamin B12 and its degradation products via eukaryotic cells could play an important role in this deep Co complexation process. Although eukaryotes cannot produce vitamin B12, the organisms often have high vitamin B12 quotas (Bertrand et al., 2013). Eukaryotic cell remineralization in the mesopelagic could be supplying functionally inert Co(III) ligands in the form of these B12 molecules to the mesopelagic and deep ocean. This process would protect the biogenic ligand-bound dCo from further scavenging as complexed dCo is less likely to be scavenged (Saito et al., 2005), and Mn oxide precipitation rates in the deep ocean are relatively slow (Hawco et al., 2018; Johnson et al., 1996; Sunda and Huntsman, 1988). More research is needed on this deep, stable dCo fraction in the Pacific to confirm this proposed mechanism, but we believe the unique OMZ and particle export dynamics in this region contribute to its existence.
4.7 Comparison to a global biogeochemical Co model
The global biogeochemical model was able to well replicate the major cycling features of dCo in the Pacific Ocean in general, including the scavenging-induced “curl” in the dCo vs. dPO4 relationship and the negative correlation between dCo and O2 throughout the transect (Fig. 15). It was also able to capture the major remineralization, scavenging, surface uptake and coastal source features observed along the GP15 transect (Fig. 16). The model was successful at replicating the major dCo surface features across the various Pacific oceanographic provinces, appropriately deepening the nutricline and predicting decreased dCo concentrations in the north and south subtropical gyres. The main differences between the observed and model dCo values can be attributed to both (1) differences in the O2 and dPO4 distributions that drive dCo distribution calculations and (2) the underestimation of some dCo flux intensities in the model.
Figure 15Nutrient relationships between dCo, dPO4 and O2 in (a)–(c) binned observed values and (d)–(f) model output values. Observed values have been binned and averaged by 1∘ latitude and 31 depth divisions to ensure comparability between the model and sample values. Note that O2 values are reported here in units of micromolar.
Figure 16(a–c) Model output of dCo, O2 and dPO4 distributions along the GP15 transect. (d–f) Differences between observed values and model outputs of dCo, O2 and dPO4 concentrations along the GP15 transect. Observed values have been binned and averaged by 1∘ latitude and 31 depth divisions to ensure comparability between the model and sample values. Note that O2 values are reported here in units of micromolar.
The model was successful at capturing the broad, basin-wide trends across the Pacific but did not always capture more local processes. It did not predict that the ETNP and ETSP OMZs would be present as far west as 152∘ W, far from the continental coastlines, and so did not recreate the low-O2 or elevated-dCo features observed in the GP15 transect. The model also never reached the lowest observed O2 concentrations within the North Pacific OMZ; the lowest O2 concentration it predicted in the North Pacific basin was 40 µM, while the lowest value observed within the North Pacific OMZ on the GP15 transect was 8 µM. Therefore, the biogeochemical model was able to replicate the dCo : O2 correlation driven by suppressed scavenging in OMZs across the transect but did not capture the more intense O2 minima observed and thus underestimates dCo concentrations within the ETNP, ETSP and North Pacific OMZs. Consistent with underestimating the extent of oxygen depletion, the remineralization flux supplying dPO4 to subsurface waters was lower in the model, shown by the positive values of observed dPO4 − model dPO4, particularly in the mesopelagic ocean. This underestimated remineralization flux also affected the modeled dCo supply to the mesopelagic via remineralization, causing a similar underestimation of dCo values in the model.
Our data suggest that the dCo cycle is more robust and dynamic than the model predicts, with observations of higher dCo concentrations from sources and lower dCo concentrations from sinks than are predicted by the model. The deep ocean, for example, appears to be a larger sink of dCo via scavenging than is predicted in the model. Below 2000 m depth, the average observed dCo concentration was 27 ± 11 pM, but the average model concentration was consistently ∼ 45 pM. This offset was driven by a parameterization of consistent ligand-bound dCo concentrations (Tagliabue et al., 2018), a pool of dCo that is known to be relatively inert. In the observed transect, we do not see these levels of ligand-bound dCo in the deep ocean, with the exception of the North Pacific as described above, which suggests that the complexed dCo pool in the Pacific interior is either smaller or not as inert as the model assumed. Additionally, the source of dCo from the Alaskan coast was observed to result in greater regional dCo values, implying a larger dCo coastal source than the model predicted. This is not too surprising as coastal fluxes are often varying and unpredictable in time and location, and a global model is not expected to replicate fine-scale regional variations in the Co cycle. However, the model included a coastal dCo source primarily from intermediate waters along the continental shelf where sediment resuspension is likely to occur, while we observed a surface dCo source primarily from coastal freshwater inputs. It is possible that the model underestimated the coastal flux of dCo from freshwater sources (see also Bundy et al., 2020).
Recognizing inconsistencies between expected model dCo distributions and observed transect dCo distributions is an effective way to test and improve upon the biogeochemical model's parameters. The parameterization of ligand-bound cobalt in the deep Pacific, for example, could be improved by decreasing the assumed concentration of inert, organically bound dCo in deep water masses. It should be noted that the biogeochemical model was optimized for the global ocean Co cycle and not specifically for the Pacific Ocean, which likely contextualizes much of the offset between the observed and model transects, particularly for inconsistencies within the O2 and PO4 distributions. The model also did not incorporate a hydrothermal vent source to the Pacific, which we concur is an appropriate omission on a basin scale. Future iterations of the Co biogeochemical model will consider the successes and inconsistencies presented here and continue to improve upon our conceptualization and parameterization of the marine cobalt cycle.
The GP15 transect highlighted major differences in the Co biogeochemical cycle between the Pacific and Atlantic oceans. The processes of phytoplankton uptake, remineralization and scavenging drove much of the dCo distribution patterns in the Pacific. Biological uptake of dCo generated a dCo : dPO4 stoichiometry of 82 ± 3 (µmol : mol) in the upper ocean. The Pacific Co cycle was heavily influenced by the poorly ventilated PDW that forms a wide OMZ across the North Pacific under a high-particle-export region. This aged water mass displayed a weaker dCo : O2 correlation than equatorial OMZs in the Atlantic and Pacific (Hawco et al., 2016; Noble et al., 2017). However, the North Pacific OMZ still appeared to suppress dCo scavenging such that elevated ligand-bound dCo was observed well below the mesopelagic. The deep, bound Co fraction was protected from scavenging outside of the mesopelagic, where most Mn-oxidizing bacteria are active. This finding represented a deviation from the expected thermohaline deep Co trend, which predicted that the North Pacific would exhibit the lowest concentration of deep dCo globally due to slow but steady Co scavenging over deep-ocean circulation (Hawco et al., 2018). Compared to a global ocean biogeochemical model, the observed dCo cycle (1) was more varied in distribution and (2) appeared more extreme in source and sink fluxes, indicating that the Pacific Co cycle is more dynamic than predicted by the model.
This study improves our understanding of dCo dynamics in the Pacific water column, but it should be mentioned that many are interested in Pacific Co biogeochemical cycling as it relates to Co scavenging and mineralization along the seafloor and the emerging deep-sea mining industry. When dCo is scavenged and removed from the water column in the form of pCo incorporated into Mn oxide particles, it sinks and forms vast regions of ferro-manganese oxide crusts and metal-rich nodules that accrete slowly along the seafloor (Aplin and Cronan, 1985). These nodules are formed from Mn oxide deposition over millennia and are rich in Co, Ni, Cd, Zn and rare earth elements (REEs) (Cameron et al., 1981; Hein et al., 2013). Such deposits are of interest to many because of the potential for deep-sea mining in the region, especially in the Clarion–Clipperton Zone of the central North Pacific basin. Here, international mining operations to extract Fe–Mn nodules along the seafloor could begin within the decade. The value of Co ore, which is currently only mined terrestrially, has been increasing in demand over the past 2 decades due to the metal's use in personal electronic devices and sustainable energy solutions like electric vehicle batteries, and many believe that mining the vast, concentrated deposits of Co on the Pacific seafloor could alleviate this demand (Hein et al., 2013). However, deep-sea mining and the potential heavy-metal rich sediment plumes it could create may have serious ramifications to the relatively fragile and unexplored benthic ecosystem in the region (Drazen et al., 2020; Fuchida et al., 2017; Sharma, 2011). Although the technology and facilities required to mine the deep sea have proven to be both complicated and expensive (Cameron et al., 1981), the potential new source of Co ore could, in theory, help support widespread adoption of electric vehicle fleets (Hein et al., 2013).
This work helps to establish a baseline for dCo distributions and features in the Pacific Ocean in light of future ocean warming and anthropogenic change expected to impact this region. Relative to other trace metals, the marine dCo inventory is among the smallest and is likely highly susceptible to regional mining and deoxygenation as anthropogenic sources of Co to the mesopelagic and deep ocean. The full scope of the impacts that expanding oxygen minima could have on metal biogeochemical cycles is still an open question, and more sophisticated modeling of the effects of deoxygenation on redox-sensitive trace elements is required.
Table A1Two-way regression statistics for the dCo vs. O2 relationship in the three Pacific OMZs, separated by O2 concentration (shown in Fig. A1c, g, k). In the North Pacific OMZ, samples at and below 500 m depth were included in the regression, and in the ETNP and ETSP, samples at and below 150 m depth were included. Note that R2 values of the regressions were particularly low within the North Pacific and low-[O2] ETNP.
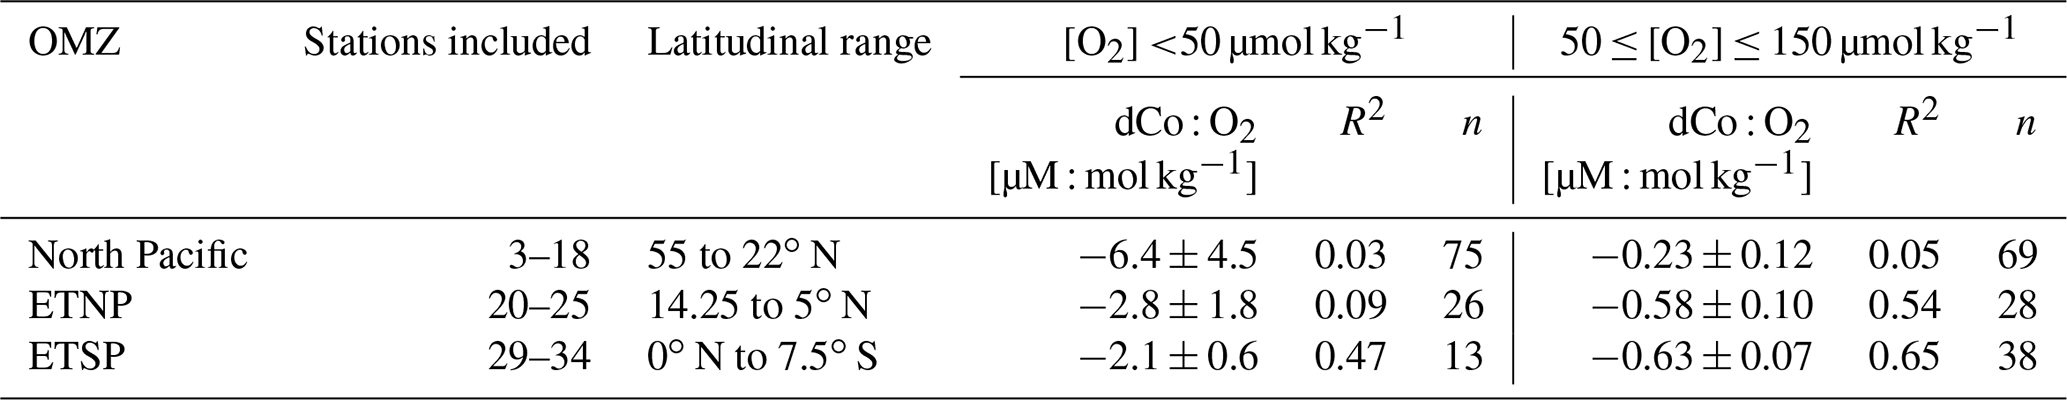

Figure A1Interpretations of the dCo : O2 relationship in the North Pacific (a–d; Stations 3–18), ETNP (e–h; Stations 20–25) and ETSP (i–l; Stations 29–34). Subplots (a), (e) and (i) show dCo vs. O2 where depth ≥ 500 m in the North Pacific and depth ≥ 200 m in the ETNP and ETSP. Subplots (b), (f) and (j) include shallower samples above the 500 m depth threshold in the North Pacific and 200 m depth threshold in the ETNP and ETSP. Subplots (c), (g) and (k) separate the dCo vs. O2 correlations by O2 concentration, with lower [O2] samples (<50 µmol kg−1) displaying more negative slopes than samples where 50 ≤ [O2] ≤ 150 µmol kg−1. This trend suggests that low-[O2] samples, which tend to occur at shallower depths, are affected by more vertical processes like remineralization and scavenging at the boundaries of the OMZ core compared to mid-[O2] samples, which are affected by more horizontal processes of advection and mixing. Two-way regression statistics are given in Table A1 above. Subplots (d), (h) and (l) include labile dCo concentrations and suggest that labile dCo might be more prevalent in the low-[O2] samples and could be scavenged in more oxic waters. The labile dCo concentrations appear to be affected by additional processes in the North Pacific.
Relevant Python code used for this study can be found at https://github.com/rebecca-chmiel/GP15 (Chmiel, 2022).
The GP15 expedition dCo dataset can be accessed online from the Biological and Chemical Oceanography Data Management Office (BCO-DMO) websites https://www.bco-dmo.org/dataset/818383 (Saito, 2021) (Leg 1) and https://www.bco-dmo.org/dataset/818610 (Saito, 2020) (Leg 2). The nutrient and hydrographic dataset can be found at https://www.bco-dmo.org/dataset/777951 (Casciotti et al., 2021a) (Leg 1) and https://www.bco-dmo.org/dataset/824867 (Casciotti et al., 2021b) (Leg 2).
RC collected and analyzed dCo samples and wrote the manuscript. MAS designed the study. MM helped analyze dCo samples. JF, MH and NL collected and analyzed dFe and dMn samples. PJL, AL and JML collected and analyzed particulate samples. WJJ analyzed He and Ne samples. AT designed and generated the geochemical model. All authors helped write the manuscript.
The contact author has declared that neither they nor their co-authors have any competing interests.
Publisher's note: Copernicus Publications remains neutral with regard to jurisdictional claims in published maps and institutional affiliations.
The authors thank the crew and science party of the R/V Roger Revelle on the GP15 expedition, including David Murline and chief scientists Karen Casciotti and Grey Cutter. We also thank Laramie Jensen, Brent Summers, Vinicius Amaral, Yang Xiang and Janelle Steffen for at-sea sample collection; Sophie Rojas and Nicholas Carracino for POC sample processing; the Ocean Data Facility at Scripps Institution of Oceanography for nutrient sample analysis; Natalie Cohen for assistance in handling and transporting samples; Matthew Charette, Stephanie Dutkiewicz and Nicholas Hawco for science and writing insights; and Deepa Rao and Jaclyn Saunders for Python coding assistance.
This research has been supported by the National Science Foundation (grant nos. OCE-1736599, OCE-1756138, OCE-1657781 and OCE-1736601) and the Horizon 2020 research and innovation program (BYONIC; grant no. 724289).
This paper was edited by Caroline P. Slomp and reviewed by David Janssen and one anonymous referee.
Aplin, A. C. and Cronan, D. S.: Ferromanganese oxide deposits from the Central Pacific Ocean, I. Encrustations from the Line Islands Archipelago, Geochim. Cosmochim. Ac., 49, 427–436, https://doi.org/10.1016/0016-7037(85)90034-1, 1985.
Baars, O. and Croot, P. L.: Dissolved cobalt speciation and reactivity in the eastern tropical North Atlantic, Mar. Chem., 173, 310–319, https://doi.org/10.1016/j.marchem.2014.10.006, 2014.
Bertrand, E. M., Saito, M. A., Rose, J. M., Riesselman, C. R., Lohan, M. C., Noble, A. E., Lee, P. A., and DiTullio, G. R.: Vitamin B12 and iron colimitation of phytoplankton growth in the Ross Sea, Limnol. Oceanogr., 52, 1079–1093, https://doi.org/10.4319/lo.2007.52.3.1079, 2007.
Bertrand, E. M., Moran, D. M., McIlvin, M. R., Hoffman, J. M., Allen, A. E., and Saito, M. A.: Methionine synthase interreplacement in diatom cultures and communities: Implications for the persistence of B12 use by eukaryotic phytoplankton, Limnol. Oceanogr., 58, 1431–1450, https://doi.org/10.4319/lo.2013.58.4.1431, 2013.
Bishop, J. K. B. and Wood, T. J.: Year-round observations of carbon biomass and flux variability in the Southern Ocean, Global Biogeochem. Cy., 23, GB2019, https://doi.org/10.1029/2008GB003206, 2009.
Bonnet, S., Guieu, C., Bruyant, F., Prášil, O., Van Wambeke, F., Raimbault, P., Moutin, T., Grob, C., Gorbunov, M. Y., Zehr, J. P., Masquelier, S. M., Garczarek, L., and Claustre, H.: Nutrient limitation of primary productivity in the Southeast Pacific (BIOSOPE cruise), Biogeosciences, 5, 215–225, https://doi.org/10.5194/bg-5-215-2008, 2008.
Bown, J., Boye, M., Baker, A., Duvieilbourg, E., Lacan, F., Le Moigne, F., Planchon, F., Speich, S., and Nelson, D. M.: The biogeochemical cycle of dissolved cobalt in the Atlantic and the Southern Ocean south off the coast of South Africa, Mar. Chem., 126, 193–206, https://doi.org/10.1016/j.marchem.2011.03.008, 2011.
Bown, J., Boye, M., and Nelson, D. M.: New insights on the role of organic speciation in the biogeochemical cycle of dissolved cobalt in the southeastern Atlantic and the Southern Ocean, Biogeosciences, 9, 2719–2736, https://doi.org/10.5194/bg-9-2719-2012, 2012.
Boyd, P. W., Law, C. S., Wong, C. S., Nojiri, Y., Tsunda, A., Levasseur, M., Takeda, S., Rivkin, R., Harrison, P. J., Strzepek, R., Gower, J., McKay, R. M., Abraham, E., Arychuk, M., Barwell-Clarke, J., Crawford, W., Crawford, D., Hale, M., Harada, K., Johnson, K., Kiyosawa, H., Kudo, I., Marchetti, A., Miller, W., Needoba, J., Nishioka, J., Ogawa, H., Page, J., Robert, M., Saito, H., Sastri, A., Sherry, N., Soutar, T., Sutherland, N., Taira, Y., Whitney, F., Wong, S.-K. E., and Yoshimura, T.: The decline and fate of an iron-induced subarctic phytoplankton bloom, Lett. Nat., 428, 549–553, https://doi.org/10.1029/2001jb001129, 2004.
Browning, T. J., Achterberg, E. P., Rapp, I., Engel, A., Bertrand, E. M., Tagliabue, A., and Moore, C. M.: Nutrient co-limitation at the boundary of an oceanic gyre, Nature, 551, 242–246, https://doi.org/10.1038/nature24063, 2017.
Bruland, K. W. and Lohan, M. C.: Controls of trace metals in seawater, in: Treatise on Geochemistry, Vol. 6, edited by: Elderfield, H., Holland H. D., and Turekian, K. K., Elsevier, 23–47, https://doi.org/10.1016/B0-08-043751-6/06105-3, 2003.
Bundy, R. M., Tagliabue, A., Hawco, N. J., Morton, P. L., Twining, B. S., Hatta, M., Noble, A. E., Cape, M. R., John, S. G., Cullen, J. T., and Saito, M. A.: Elevated sources of cobalt in the Arctic Ocean, Biogeosciences, 17, 4745–4767, https://doi.org/10.5194/bg-17-4745-2020, 2020.
Cameron, H., Georghiou, L., Perry, J. G., and Wiley, P.: The economic feasibility of deep-sea mining, Eng. Costs Prod. Econ., 5, 279–287, https://doi.org/10.1016/0167-188X(81)90019-7, 1981.
Casciotti, K. L., Cutter, G. A., and Lam, P. J.: Bottle file from Leg 1 (Seattle, WA to Hilo, HI) of the US GEOTRACES Pacific Meridional Transect (PMT) cruise (GP15, RR1814) on R/V Roger Revelle from September to October 2018, Biological and Chemical Oceanography Data Management Office (BCO-DMO), (Version 6) Version Date 2021-05-05 [data set], https://doi.org/10.26008/1912/bco-dmo.777951.6, 2021a.
Casciotti, K. L., Cutter, G. A., and Lam, P. J.: Bottle file from Leg 2 (Hilo, HI to Papeete, French Polynesia) of the US GEOTRACES Pacific Meridional Transect (PMT) cruise (GP15, RR1815) on R/V Roger Revelle from October to November 2018, Biological and Chemical Oceanography Data Management Office (BCO-DMO), (Version 5) Version Date 2021-05-05 [data set], https://doi.org/10.26008/1912/bco-dmo.824867.5, 2021b.
Chmiel, R.: “GP15”, Version Date 2022-03-15, GitHub [code], https://github.com/rebecca-chmiel/GP15, last access: 3 May 2022.
Clague, D. A., Paduan, J. B., Caress, D. W., Moyer, C. L., Glazer, B. T., and Yoerger, D. R.: Structure of Lo`ihi Seamount, Hawai'i and lava flow morphology from high-resolution mapping, Front. Earth Sci., 7, 58, https://doi.org/10.3389/feart.2019.00058, 2019.
Clegg, S. L. and Whitfield, M.: A generalized model for the scavenging of trace metals in the open ocean – I. Particle cycling, Deep-Sea Res., 37, 809–832, https://doi.org/10.1016/0198-0149(90)90008-J, 1990.
Coale, K. H., Johnson, K. S., Fitzwater, S. E., Gordon, R. M., Tanner, S., Chavez, F. P., Ferioli, L., Sakamoto, C., Rogers, P., Millero, F., Steinberg, Pa., Nightingale, P., Cooper, D., Cochlan, W. P., Landry, M. R., Constantinou, J., Rollwagen, G., Trasvina, A., and Kudela, R.: A massive phytoplankton bloom induced by an ecosystem-scale iron fertilization experiment in the equatorial Pacific Ocean, Nature, 383, 495–501, https://doi.org/10.1038/383495a0, 1996.
Cox, A. D. and Saito, M. A.: Proteomic responses of oceanic Synechococcus WH8102 to phosphate and zinc scarcity and cadmium additions, Front. Microbiol., 4, 387, https://doi.org/10.3389/fmicb.2013.00387, 2013.
Crusius, J., Schroth, A. W., Gassó, S., Moy, C. M., Levy, R. C., and Gatica, M.: Glacial flour dust storms in the Gulf of Alaska: Hydrologic and meteorological controls and their importance as a source of bioavailable iron, Geophys. Res. Lett., 38, L06602, https://doi.org/10.1029/2010GL046573, 2011.
Cutter, G. A. and Bruland, K. W.: Rapid and noncontaminating sampling system for trace elements in global ocean surveys, Limnol. Oceanogr. Method., 10, 425–436, https://doi.org/10.4319/lom.2012.10.425, 2012.
Czeschel, R., Stramma, L., Schwarzkopf, F. U., Giese, B. S., Funk, A., and Karstensen, J.: Middepth circulation of the eastern tropical South Pacific and its link to the oxygen minimum zone, J. Geophys. Res., 116, C01015, https://doi.org/10.1029/2010JC006565, 2011.
de Carvalho, L. M., Hollister, A. P., Trindade, C., Gledhill, M., and Koschinsky, A.: Distribution and size fractionation of nickel and cobalt species along the Amazon estuary and mixing plume, Mar. Chem., 236, 104019, https://doi.org/10.1016/j.marchem.2021.104019, 2021.
de Lavergne, C., Madec, G., Roquet, F., Holmes, R. M., and McDougall, T. J.: Abyssal ocean overturning shaped by seafloor distribution, Nature, 551, 181–186, https://doi.org/10.1038/nature24472, 2017.
Drazen, J. C., Smith, C. R., Gjerde, K. M., Haddock, S. H. D., Carter, G. S., Choy, C. A., Clark, M. R., Dutrieux, P., Goetze, E., Hauton, C., Hatta, M., Koslow, J. A., Leitner, A. B., Pacini, A., Perelman, J. N., Peacock, T., Sutton, T. T., Watling, L., and Yamamoto, H.: Midwater ecosystems must be considered when evaluating environmental risks of deep-sea mining, P. Natl. Acad. Sci. USA, 117, 17455–17460, https://doi.org/10.1073/pnas.2011914117, 2020.
Dulaquais, G., Boye, M., Middag, R., Owens, S., Puigcorbe, V., Buesseler, K., Masqué, P., de Baar, H. J. W., and Carton, X.: Contrasting biogeochemical cycles of cobalt in the surface western Atlantic Ocean, Global Biogeochem. Cy., 28, 1387–1412, https://doi.org/10.1002/2014GB004903, 2014a.
Dulaquais, G., Boye, M., Rijkenberg, M. J. A., and Carton, X.: Physical and remineralization processes govern the cobalt distribution in the deep western Atlantic Ocean, Biogeosciences, 11, 1561–1580, https://doi.org/10.5194/bg-11-1561-2014, 2014b.
Dulaquais, G., Planquette, H., L'Helguen, S., Rijkenberg, M. J. A., and Boye, M.: The biogeochemistry of cobalt in the Mediterranean Sea, Global Biogeochem. Cy., 31, 377–399, https://doi.org/10.1002/2016GB005478, 2017.
Fuchida, S., Yokoyama, A., Fukuchi, R., Ishibashi, J. I., Kawagucci, S., Kawachi, M., and Koshikawa, H.: Leaching of metals and metalloids from hydrothermal ore particulates and their effects on marine phytoplankton, ACS Omega, 2, 3175–3182, https://doi.org/10.1021/acsomega.7b00081, 2017.
Gale, A., Dalton, C. A., Langmuir, C. H., Su, Y., and Schilling, J.-G.: The mean composition of ocean ridge basalts, Geochem. Geophy. Geosy., 14, 489–518, https://doi.org/10.1029/2012GC004334, 2013.
Glover, D., Jenkins, W., and Doney, S.: Modeling Methods for Marine Science, Cambridge University Press, New York, ISBN 978-0521867832, 2011.
Gobler, C. J., Norman, C., Panzeca, C., Taylor, G. T., and Sañudo-Wilhelmy, S. A.: Effect of B-vitamins (B1, B12) and inorganic nutrients on algal bloom dynamics in a coastal ecosystem, Aquat. Microb. Ecol., 49, 181–194, https://doi.org/10.3354/ame01132, 2007.
Hawco, N. J., Ohnemus, D. C., Resing, J. A., Twining, B. S., and Saito, M. A.: A dissolved cobalt plume in the oxygen minimum zone of the eastern tropical South Pacific, Biogeosciences, 13, 5697–5717, https://doi.org/10.5194/bg-13-5697-2016, 2016.
Hawco, N. J., Lam, P. J., Lee, J. M., Ohnemus, D. C., Noble, A. E., Wyatt, N. J., Lohan, M. C., and Saito, M. A.: Cobalt scavenging in the mesopelagic ocean and its influence on global mass balance: Synthesizing water column and sedimentary fluxes, Mar. Chem., 201, 151–166, https://doi.org/10.1016/j.marchem.2017.09.001, 2018.
Hawco, N. J., Yang, S., Foreman, R. K., Funkey, C. P., Dugenne, M., White, A. E., Wilson, S. T., Kelly, R. L., Bian, X., Huang, K., Karl, D. M., and John, S. G.: Metal isotope signatures from lava-seawater interaction during the 2018 eruption of Kīlauea, Geochim. Cosmochim. Ac., 282, 340–356, https://doi.org/10.1016/j.gca.2020.05.005, 2020.
Hein, J. R., Mizell, K., Koschinsky, A., and Conrad, T. A.: Deep-ocean mineral deposits as a source of critical metals for high- and green-technology applications: Comparison with land-based resources, Ore Geol. Rev., 51, 1–14, https://doi.org/10.1016/j.oregeorev.2012.12.001, 2013.
Hémond, C., Devey, C. W., and Chauvel, C.: Source compositions and melting processes in the Society and Austral plumes (South Pacific Ocean): Element and isotope (Sr, Nd, Pb, Th) geochemistry, Chem. Geol., 115, 7–45, https://doi.org/10.1016/0009-2541(94)90143-0, 1994.
Jenkins, W. J., Lott, D. E. III, and Cahill, K. L.: A determination of atmospheric helium, neon, argon, krypton, and xenon solubility concentrations in water and seawater, Mar. Chem., 211, 94–107, https://doi.org/10.1016/j.marchem.2019.03.007, 2019.
Jenkins, W. J., Hatta, M., Fitzsimmons, J. N., Schlitzer, R., Lanning, N. T., Shiller, A., Buckley, N. R., German, C. R., Lott, D. E. III, Weiss, G., Whitmore, L., Casciotti, K., Lam, P. J., Cutter, G. A., and Cahill, K. L.: An intermediate-depth source of hydrothermal 3He and dissolved iron in the North Pacific, Earth Planet. Sci. Lett., 539, 116223, https://doi.org/10.1016/j.epsl.2020.116223, 2020.
Johnson, K. S., Coale, K. H., Berelson, W. M., and Gordon, R. M.: On the formation of the manganese maximum in the oxygen minimum zone, Geochim. Cosmochim. Ac., 60, 1291–1299, https://doi.org/10.1016/0016-7037(96)00005-1, 1996.
Juranek, L. W., Quay, P. D., Feely, R. A., Lockwood, D., Karl, D. M., and Church, M. J.: Biological production in the NE Pacific and its influence on air-sea CO2 flux: Evidence from dissolved oxygen isotopes and O2 Ar, J. Geophys. Res.-Ocean., 117, C05022, https://doi.org/10.1029/2011JC007450, 2012.
Karstensen, J., Stramma, L., and Visbeck, M.: Oxygen minimum zones in the eastern tropical Atlantic and Pacific oceans, Prog. Oceanogr., 77, 331–350, https://doi.org/10.1016/j.pocean.2007.05.009, 2008.
Kellogg, R. M., McIlvin, M. R., Vedamati, J., Twining, B. S., Moffett, J. W., Marchetti, A., Moran, D. M., and Saito, M. A.: Efficient zinc/cobalt interreplacement in northeast Pacific diatoms and relationship to high surface dissolved Co : Zn ratios, Limnol. Oceanogr., 65, 2557–2582, https://doi.org/10.1002/lno.11471, 2020.
Kenyon, J. A., Buesseler, K. O., Davidson, P., Pike, S. M., and Lam P. J.: 234Th as a tracer of particulate export and remineralization along the GEOTRACES Pacific Meridional Transect, in preparation, 2022.
Key, R. M., Olsen, A., van Heuven, S., Lauvset, S. K., Velo, A., Lin, X., Schirnick, C., Kozyr, A., Tanhua, T., Hoppema, M., Jutterström, S., Steinfeldt, R., Jeansson, E., Ishii, M., Perez, F. F., and Suzuki, T.: Global Ocean Data Analysis Project, Version 2 (GLODAPv2), ORNL/CDIAC-162, ND-P093, Oak Ridge National Laboratory, U.S. Department of Energy or the Carbon Dioxide Information Analysis Center, Oak Ridge, Tennessee, https://doi.org/10.3334/CDIAC/OTG.NDP093_GLODAPv2, 2015.
Kleint, C., Bach, W., Diehl, A., Fröhberg, N., Garbe-Schönberg, D., Hartmann, J. F., de Ronde, C. E. J., Sander, S. G., Strauss, H., Stucker, V. K., Thal, J., Zitoun, R., and Koschinsky, A.: Geochemical characterization of highly diverse hydrothermal fluids from volcanic vent systems of the Kermadec intraoceanic arc, Chem. Geol., 528, 119289, https://doi.org/10.1016/j.chemgeo.2019.119289.
Lam, P. J. and Bishop, J. K. B.: The continental margin is a key source of iron to the HNLC North Pacific Ocean, Geophys. Reseach Lett., 35, L07608, https://doi.org/10.1029/2008GL033294, 2008.
Lam, P. J., Bishop, J. K. B., Henning, C. C., Marcus, M. A., Waychunas, G. A., and Fung, I. Y.: Wintertime phytoplankton bloom in the subarctic Pacific supported by continental margin iron, Global Biogeochem. Cy., 20, GB1006, https://doi.org/10.1029/2005GB002557, 2006.
Matear, R. J. and Hirst, A. C.: Long-term changes in dissolved oxygen concentrations in the ocean caused by protracted global warming, Global Biogeochem. Cy., 17, 1125, https://doi.org/10.1029/2002gb001997, 2003.
Matsumoto, K.: Radiocarbon-based circulation age of the world oceans, J. Geophys. Res.-Ocean., 112, C09004, https://doi.org/10.1029/2007JC004095, 2007.
McDougall, T. J. and Barker, P. M.: Getting started with TEOS-10 and the Gibbs Seawater (GSW) Oceanographic Toolbox, SCOR/IAPSO WG127, ISBN 978-0-646-55621-5, 2011.
Metz, S. and Trefry, J. H.: Chemical and mineralogical influences on concentrations of trace metals in hydrothermal fluids, Geochim. Cosmochim. Ac., 64, 2267–2279, https://doi.org/10.1016/S0016-7037(00)00354-9, 2000.
Moffett, J. W. and Ho, J.: Oxidation of cobalt and manganese in seawater via a common microbially catalyzed pathway, Geochim. Cosmochim. Ac., 60, 3415–3424, https://doi.org/10.1016/0016-7037(96)00176-7, 1996.
Moore, C. M., Mills, M. M., Arrigo, K. R., Berman-Frank, I., Bopp, L., Boyd, P. W., Galbraith, E. D., Geider, R. J., Guieu, C., Jaccard, S. L., Jickells, T. D., La Roche, J., Lenton, T. M., Mahowald, N. M., Marañón, E., Marinov, I., Moore, J. K., Nakatsuka, T., Oschlies, A., Saito, M. A., Thingstad, T. F., Tsuda, A., and Ulloa, O.: Processes and patterns of oceanic nutrient limitation, Nat. Geosci., 6, 701–710, https://doi.org/10.1038/ngeo1765, 2013.
Nishioka, J., Obata, H., Ogawa, H., Ono, K., Yamashita, Y., Lee, K., Takeda, S., and Yasuda, I.: Subpolar marginal seas fuel the North Pacific through the intermediate water at the termination of the global ocean circulation, P. Natl. Acad. Sci. USA, 117, 12665–12673, https://doi.org/10.1073/pnas.2000658117, 2020.
Noble, A. E., Saito, M. A., Maiti, K., and Benitez-Nelson, C. R.: Cobalt, manganese, and iron near the Hawaiian Islands: A potential concentrating mechanism for cobalt within a cyclonic eddy and implications for the hybrid-type trace metals, Deep-Sea Res. Pt. II, 55, 1473–1490, https://doi.org/10.1016/j.dsr2.2008.02.010, 2008.
Noble, A. E., Lamborg, C. H., Ohnemus, D. C., Lam, P. J., Goepfert, T. J., Measures, C. I., Frame, C. H., Casciotti, K. L., DiTullio, G. R., Jennings, J., and Saito, M. A.: Basin-scale inputs of cobalt, iron, and manganese from the Benguela-Angola front to the South Atlantic Ocean, Limnol. Oceanogr., 57, 989–1010, https://doi.org/10.4319/lo.2012.57.4.0989, 2012.
Noble, A. E., Moran, D. M., Allen, A. E., and Saito, M. A.: Dissolved and particulate trace metal micronutrients under the McMurdo Sound seasonal sea ice: basal sea ice communities as a capacitor for iron, Front. Chem., 1, 25, https://doi.org/10.3389/fchem.2013.00025, 2013.
Noble, A. E., Ohnemus, D. C., Hawco, N. J., Lam, P. J., and Saito, M. A.: Coastal sources, sinks and strong organic complexation of dissolved cobalt within the US North Atlantic GEOTRACES transect GA03, Biogeosciences, 14, 2715–2739, https://doi.org/10.5194/bg-14-2715-2017, 2017.
Ohnemus, D. C., Rauschenberg, S., Cutter, G. A., Fitzsimmons, J. N., and Sherrell, R. M.: Elevated trace metal content of prokaryotic communities associated with marine oxygen deficient zones, Limnol. Oceanogr., 62, 3–25, https://doi.org/10.1002/lno.10363, 2017.
Oldham, V. E., Chmiel, R., Hansel, C. M., DiTullio, G. R., Rao, D., and Saito, M.: Inhibited manganese oxide formation hinders cobalt scavenging in the Ross Sea, Global Biogeochem. Cy., 35, e2020GB006706, https://doi.org/10.1029/2020GB006706, 2021.
Olsen, A., Key, R. M., van Heuven, S., Lauvset, S. K., Velo, A., Lin, X., Schirnick, C., Kozyr, A., Tanhua, T., Hoppema, M., Jutterström, S., Steinfeldt, R., Jeansson, E., Ishii, M., Pérez, F. F., and Suzuki, T.: The Global Ocean Data Analysis Project version 2 (GLODAPv2) – an internally consistent data product for the world ocean, Earth Syst. Sci. Data, 8, 297–323, https://doi.org/10.5194/essd-8-297-2016, 2016.
Olsen, A., Lange, N., Key, R. M., Tanhua, T., Álvarez, M., Becker, S., Bittig, H. C., Carter, B. R., Cotrim da Cunha, L., Feely, R. A., van Heuven, S., Hoppema, M., Ishii, M., Jeansson, E., Jones, S. D., Jutterström, S., Karlsen, M. K., Kozyr, A., Lauvset, S. K., Lo Monaco, C., Murata, A., Pérez, F. F., Pfeil, B., Schirnick, C., Steinfeldt, R., Suzuki, T., Telszewski, M., Tilbrook, B., Velo, A., and Wanninkhof, R.: GLODAPv2.2019 – an update of GLODAPv2, Earth Syst. Sci. Data, 11, 1437–1461, https://doi.org/10.5194/essd-11-1437-2019, 2019.
Polovina, J. J., Howell, E., Kobayashi, D. R., and Seki, M. P.: The transition zone chlorophyll front, a dynamic global feature defining migration and forage habitat for marine resources, Prog. Oceanogr., 49, 469–483, https://doi.org/10.1016/S0079-6611(01)00036-2, 2001.
Polovina, J. J., Howell, E. A., Kobayashi, D. R., and Seki, M. P.: The Transition Zone Chlorophyll Front updated: Advances from a decade of research, Prog. Oceanogr., 150, 79–85, https://doi.org/10.1016/j.pocean.2015.01.006, 2017.
Price, N. M. and Morel, F. M. M.: Cadmium and cobalt substitution for zinc in a marine diatom, Nature, 344, 658–660, https://doi.org/10.1038/344658a0, 1990.
Price, N. M., Harrison, G. I., Hering, J. G., Hudson, R. J., Nirel, P. M. V., Palenik, B., and Morel, F. M. M.: Preparation and chemistry of the artificial algal culture medium aquil preparation and chemistry of the artificial algal culture medium aquil, Biol. Oceanogr., 6, 443–461, https://doi.org/10.1080/01965581.1988.10749544, 1988/1989.
Quisel, J. D., Wykoff, D. D., and Grossman, A. R.: Biochemical characterization of the extracellular phosphatases produced by phosphorus-deprived Chlamydomonas reinhardtii, Plant Physiol., 111, 839–848, https://doi.org/10.1104/pp.111.3.839, 1996.
Reed, R. K.: Flow of the Alaskan Stream and its variations, Deep-Sea Res. Pt. A, 31, 369–386, https://doi.org/10.1016/0198-0149(84)90090-6, 1984.
Richon, C. and Tagliabue, A.: Biogeochemical feedbacks associated with the response of micronutrient recycling by zooplankton to climate change, Glob. Change Biol., 27, 4758–4770, https://doi.org/10.1111/gcb.15789, 2021.
Saito, M.: Dissolved Cobalt and Labile Cobalt from Leg 2 (Hilo, HI to Papeete, French Polynesia) of the US GEOTRACES Pacific Meridional Transect (PMT) cruise (GP15, RR1815) on R/V Roger Revelle from October to November 2018, Biological and Chemical Oceanography Data Management Office (BCO-DMO), (Version 1) Version Date 2020-07-15 [data set], https://doi.org/10.26008/1912/bco-dmo.818610.1, 2020.
Saito, M. A.: Dissolved Cobalt and Labile Cobalt from Leg 1 (Seattle, WA to Hilo, HI) of the US GEOTRACES Pacific Meridional Transect (PMT) cruise (GP15, RR1814) on R/V Roger Revelle from September to October 2018, Biological and Chemical Oceanography Data Management Office (BCO-DMO), (Version 2) Version Date 2021-05-05 [data set], https://doi.org/10.26008/1912/bco-dmo.818383.2, 2021.
Saito, M. A. and Moffett, J. W.: Complexation of cobalt by natural organic ligands in the Sargasso Sea as determined by a new high-sensitivity electrochemical cobalt speciation method suitable for open ocean work, Mar. Chem., 75, 49–68, https://doi.org/10.1016/S0304-4203(01)00025-1, 2001.
Saito, M. A. and Moffett, J. W.: Temporal and spatial variability of cobalt in the Atlantic Ocean, Geochim. Cosmochim. Ac., 66, 1943–1953, https://doi.org/10.1016/s0016-7037(02)00829-3, 2002.
Saito, M. A., Moffett, J. W., Chisholm, S. W., and Waterbury, J. B.: Cobalt limitation and uptake in Prochlorococcus, Limnol. Oceanogr., 47, 1629–1636, https://doi.org/10.4319/lo.2002.47.6.1629, 2002.
Saito, M. A., Rocap, G., and Moffett, J. W.: Production of cobalt binding ligands in a Synechococcus feature at the Costa Rica upwelling dome, Limnol. Oceanogr., 50, 279–290, 2005.
Saito, M. A., Goepfert, T. J., Noble, A. E., Bertrand, E. M., Sedwick, P. N., and DiTullio, G. R.: A seasonal study of dissolved cobalt in the Ross Sea, Antarctica: micronutrient behavior, absence of scavenging, and relationships with Zn, Cd, and P, Biogeosciences, 7, 4059–4082, https://doi.org/10.5194/bg-7-4059-2010, 2010.
Saito, M. A., McIlvin, M. R., Moran, D. M., Goepfert, T. J., DiTullio, G. R., Post, A. F., and Lamborg, C. H.: Multiple nutrient stresses at intersecting Pacific Ocean biomes detected by protein biomarkers, Science, 345, 1173–1177, https://doi.org/10.1126/science.1256450, 2014.
Saito, M. A., Noble, A. E., Hawco, N., Twining, B. S., Ohnemus, D. C., John, S. G., Lam, P., Conway, T. M., Johnson, R., Moran, D., and McIlvin, M.: The acceleration of dissolved cobalt's ecological stoichiometry due to biological uptake, remineralization, and scavenging in the Atlantic Ocean, Biogeosciences, 14, 4637–4662, https://doi.org/10.5194/bg-14-4637-2017, 2017.
Sañudo-Wilhelmy, S. A., Gobler, C. J., Okbamichael, M., and Taylor, G. T.: Regulation of phytoplankton dynamics by vitamin B12, Geophys. Res. Lett., 33, L04604, https://doi.org/10.1029/2005GL025046, 2006.
Sarmiento, J. L., Gruber, N., Brzezinski, M. A., and Dunne, J. P.: High-latitude controls of thermocline nutrients and low latitude biological productivity, Lett. Nat., 427, 56–60, https://doi.org/10.1038/nature02127, 2004.
Schlitzer, R., Anderson, R. F., Dodas, E. M., et al.: The GEOTRACES Intermediate Data Product 2017, Chem. Geol., 493, 210–223, https://doi.org/10.1016/j.chemgeo.2018.05.040, 2018.
Schroth, A. W., Crusius, J., Hoyer, I., and Campbell, R.: Estuarine removal of glacial iron and implications for iron fluxes to the ocean, Geophys. Res. Lett., 41, 3951–3958, https://doi.org/10.1002/2014GL060199, 2014.
Sharma, R.: Deep-sea mining: Economic, technical, technological, and environmental considerations for sustainable development, Mar. Technol. Soc. J., 45, 28–41, https://doi.org/10.4031/MTSJ.45.5.2, 2011.
Stabeno, P. J., Reed, R. K., and Schumacher, J. D.: The Alaska Coastal Current: Continuity of transport and forcing, J. Geophys. Res., 100, 2477–2485, https://doi.org/10.1029/94JC02842, 1995.
Stramma, L., Johnson, G. C., Sprintall, J., and Mohrholz, V.: Expanding oxygen-minimum zones in the tropical oceans, Science, 320, 655–658, https://doi.org/10.1126/science.1153847, 2008.
Sunda, W. G. and Huntsman, S. A.: Effect of sunlight on redox cycles of manganese in the southwestern Sargasso Sea, Deep-Sea Res. Pt. A, 35, 1297–1317, https://doi.org/10.1016/0198-0149(88)90084-2, 1988.
Sunda, W. G. and Huntsman, S. A.: Cobalt and zinc interreplacement in marine phytoplankton: Biological and geochemical implications, Limnol. Oceanogr., 40, 1404–1417, https://doi.org/10.4319/lo.1995.40.8.1404, 1995.
Sundby, B., Anderson, L. G., Hall, P. O. J., Iverfeldt, Å., van der Loeff, M. M. R., and Westerlund, S. F. G.: The effect of oxygen on release and uptake of cobalt, manganese, iron and phosphate at the sediment-water interface, Geochim. Cosmochim. Ac., 50, 1281–1288, https://doi.org/10.1016/0016-7037(86)90411-4, 1986.
Swanner, E. D., Planavsky, N. J., Lalonde, S. V., Robbins, L. J., Bekker, A., Rouxel, O. J., Saito, M. A., Kappler, A., Mojzsis, S. J., and Konhauser, K. O.: Cobalt and marine redox evolution, Earth Planet. Sc. Lett., 390, 253–263, https://doi.org/10.1016/j.epsl.2014.01.001, 2014.
Tagliabue, A., Hawco, N. J., Bundy, R. M., Landing, W. M., Milne, A., Morton, P. L., and Saito, M. A.: The role of external inputs and internal cycling in shaping the global ocean cobalt distribution: Insights from the first cobalt biogeochemical model, Global Biogeochem. Cy., 32, 594–616, https://doi.org/10.1002/2017GB005830, 2018.
Taylor, S. R. and McLennan, S. M.: The geochemical evolution of the continental crust, Rev. Geophys., 33, 241–265, https://doi.org/10.1029/95RG00262, 1995.
Tsuda, A., Kiyosawa, H., Kuwata, A., Mochizuki, M., Shiga, N., Saito, H., Chiba, S., Imai, K., Nishioka, J., and Ono, T.: Responses of diatoms to iron-enrichment (SEEDS) in the western subarctic Pacific, temporal and spatial comparisons, Prog. Oceanogr., 64, 189–205, https://doi.org/10.1016/j.pocean.2005.02.008, 2005.
Ustick, L. J., Larkin, A. A., Garcia, C. A., Garcia, N. S., Brock, M. L., Lee, J. A., Wiseman, N. A., Keith Moore, J., and Martiny, A. C.: Metagenomic analysis reveals global-scale patterns of ocean nutrient limitation, Science, 372, 287–291, https://doi.org/10.1126/science.abe6301, 2021.
Wojciechowski, C. L., Cardia, J. P., and Kantrowitz, E. R.: Alkaline phosphatase from the hyperthermophilic bacterium T. maritima requires cobalt for activity, Protein Sci., 11, 903–911, https://doi.org/10.1110/ps.4260102, 2002.
Wyatt, N. J., Milne, A., Achterberg, E. P., Browning, T. J., Bouman, H. A., Woodward, E. M. S., and Lohan, M. C.: Seasonal cycling of zinc and cobalt in the Southeast Atlantic along the GEOTRACES GA10 section, Biogeosciences, 18, 4265–4280, https://doi.org/10.5194/bg-18-4265-2021, 2021.
Xiang, Y. and Lam, P. J.: Size-fractionated compositions of marine suspended particles in the western Arctic Ocean: Lateral and vertical sources, J. Geophys. Res.-Ocean., 125, e2020JC016144, https://doi.org/10.1029/2020JC016144, 2020.
Zhang, H., van den Berg, C. M. G., and Wollast, R.: The determination of interactions of cobalt (II) with organic compounds in seawater using cathodic stripping voltammetry, Mar. Chem., 28, 285–300, https://doi.org/10.1016/0304-4203(90)90049-I, 1990.
Zheng, L., Minami, T., Konagaya, W., Chan, C. Y., Tsujisaka, M., Takano, S., Norisuye, K., and Sohrin, Y.: Distinct basin-scale-distributions of aluminum, manganese, cobalt, and lead in the North Pacific Ocean, Geochim. Cosmochim. Ac., 254, 102–121, https://doi.org/10.1016/j.gca.2019.03.038, 2019.