the Creative Commons Attribution 4.0 License.
the Creative Commons Attribution 4.0 License.
 | 06 May 2022
A nitrate budget of the Bohai Sea based on an isotope mass balance model
Shichao Tian
Birgit Gaye
Jianhui Tang
Yongming Luo
Wenguo Li
Niko Lahajnar
Kirstin Dähnke
Tina Sanders
Tianqi Xiong
Weidong Zhai
Kay-Christian Emeis
The Bohai Sea (BHS) is a semi-closed marginal sea impacted by one of the most populated areas of China. The supply of nutrients, markedly that of reactive nitrogen, via fluvial and atmospheric transport has strongly increased in parallel with the growing population. Therefore, it is crucial to quantify the reactive nitrogen input to the BHS and understand the processes and determine the quantities of nitrogen eliminated in and exported from the BHS. The nitrogen budget and in particular the internal sources and sinks of nitrate were constrained by using a mass-based and dual stable isotope approach based on δ15N and δ18O of nitrate (NO). Samples of water, suspended matter, and sediments were taken in the BHS in spring (March and April) and summer (July and August) 2018. The Yellow River (YR) was sampled in May and July to November, and Daliao River, Hai River, Luan River, and Xiaoqing River were sampled in November of 2018. In addition to nutrient, particulate organic carbon, and nitrogen concentrations, the dual isotopes of nitrate (δ15N and δ18O), δ15N of suspended matters, and sediments were determined. Based on the available mass fluxes and isotope data an updated nitrogen budget is proposed. Compared to previous estimates, it is more complete and includes the impact of interior cycling (nitrification) on the nitrate pool. The main nitrate sources are rivers contributing 19.2 %–25.6 % and the combined terrestrial runoff (including submarine fresh groundwater discharge of nitrate) accounting for 27.8 %–37.1 % of the nitrate input to the BHS, while atmospheric input contributes 6.9 %–22.2 % to total nitrate. An unusually active interior nitrogen cycling contributes 40.7 %–65.3 % to total nitrate via nitrification. Nitrogen is mainly trapped in the BHS and mainly removed by sedimentation (70.4 %–77.8 %), and only very little is exported to the Yellow Sea (YS) (only 1.8 %–2.4 %). At present denitrification is active in the sediments and removes 20.4 %–27.2 % of nitrate from the pool. However, a further eutrophication of the BHS could induce water column hypoxia and denitrification, as is increasingly observed in other marginal seas and seasonally off river mouths.
- Article
(7620 KB) - Full-text XML
-
Supplement
(758 KB) - BibTeX
- EndNote


Reactive nitrogen (Nr) is an essential nutrient of life on earth, but only a few organisms can fix nitrogen directly from the large atmospheric dinitrogen pool. Since the invention of the Haber–Bosch process the amount of fixed nitrogen (120 Tg N yr−1) has constantly grown, and since 2010 it has exceeded the natural terrestrial sources of reactive N of 63 Tg N yr−1 (Fowler et al., 2013). Hotspots of agricultural N fertilizer application shifted from the US and western Europe in the 1960s to eastern Asia in the early 21st century (Lu and Tian, 2017). In China, the Haber–Bosch process produces 37.1 Tg N yr−1, which is almost 3 times that of the biological N fixation of 12.0 Tg N yr−1. An estimated 32.0 Tg N yr−1 is produced for fertilizer (Gu et al., 2015), and China accounted for 29 % of the global ammonium production in 2018 (IFA, 2019). The leakage and volatilization of this man-made reactive nitrogen have strongly impacted limnic and marine ecosystems in China. Riverine reactive nitrogen discharged to the ocean from China was estimated at 5.4 Tg N yr−1 (Gu et al., 2015). The total load of Chinese major estuaries to coastal seas was about 9 % of the global river load for dissolved inorganic nitrogen (DIN) and 1.5 % of the global phosphate load (Smith et al., 2003; Liu et al., 2009).
The Bohai Sea (BHS) is a semi-enclosed basin with a surface area of 77 × 103 km2 and an average depth of 18 m (Chen, 2009; Su, 2001) that is heavily impacted by human activities in one of the most densely populated terrestrial catchments of the world. It exchanges salt water with the Yellow Sea (YS) through Bohai Strait, and the Yellow River (YR) is a major source of freshwater to BHS (Chen, 2009). During last 50 years, rising anthropogenic activity in the catchment induced severe environmental changes in the BHS, including increasing salinity, temperature, concentrations of DIN, and changes in stoichiometric nutrient ratios (Zhao et al., 2002; Zhang et al., 2004; Wang et al., 2019; Ning et al., 2010; Xin et al., 2019). DIN concentrations increased from 0.30 to 3.55 µmol L−1 in the time from 1982 to 2009, while phosphate (from 0.76 to 0.31 µmol L−1) and silicate (26.6 to 6.60 µmol L−1) concentrations significantly decreased so that increased about 30 times (Zhang et al., 2004; Liu et al., 2011). Phytoplankton nutrient limitation in the BHS switched from nitrogen to phosphorus in the period of the 1980s to the 1990s, and this limitation pattern persists until the present day (Xu et al., 2010; Liu et al., 2009; Wang et al., 2019).
The total annual water discharge of rivers into BHS is about 68.5 × 10⁹ m3 yr−1, of which the YR accounts for more than 75 % (Liu et al., 2011). The water exchange time of the YR estuary is only 0.1–0.2 d (Liu et al., 2009), which implies a fast transfer of nutrients into the open BHS, and many of these are trapped in Laizhou Bay (Fig. 1) (Zhang et al., 2004). The atmospheric deposition of nitrate (3.42 × 10⁹ mol yr−1) in BHS was modeled to be less than riverine nitrate (7.25 × 10⁹ mol yr−1), while more ammonium was supplied from atmospheric deposition (6.15 × 10⁹ mol yr−1) than from riverine input (0.93 × 10⁹ mol yr−1) in the 1990s (Zhang et al., 2004). BHS nitrate budgets reported during the last two decades were not completely constrained because crucial data, such as groundwater discharge or nitrification, were not available (Zhang et al., 2004; Liu et al., 2003, 2009, 2011). There are few published nutrient data from the BHS over the last decade, and the terms in the Nr budget of BHS concerning the quantities of Nr generated or eliminated by biogeochemical cycling within the basin have not been addressed.
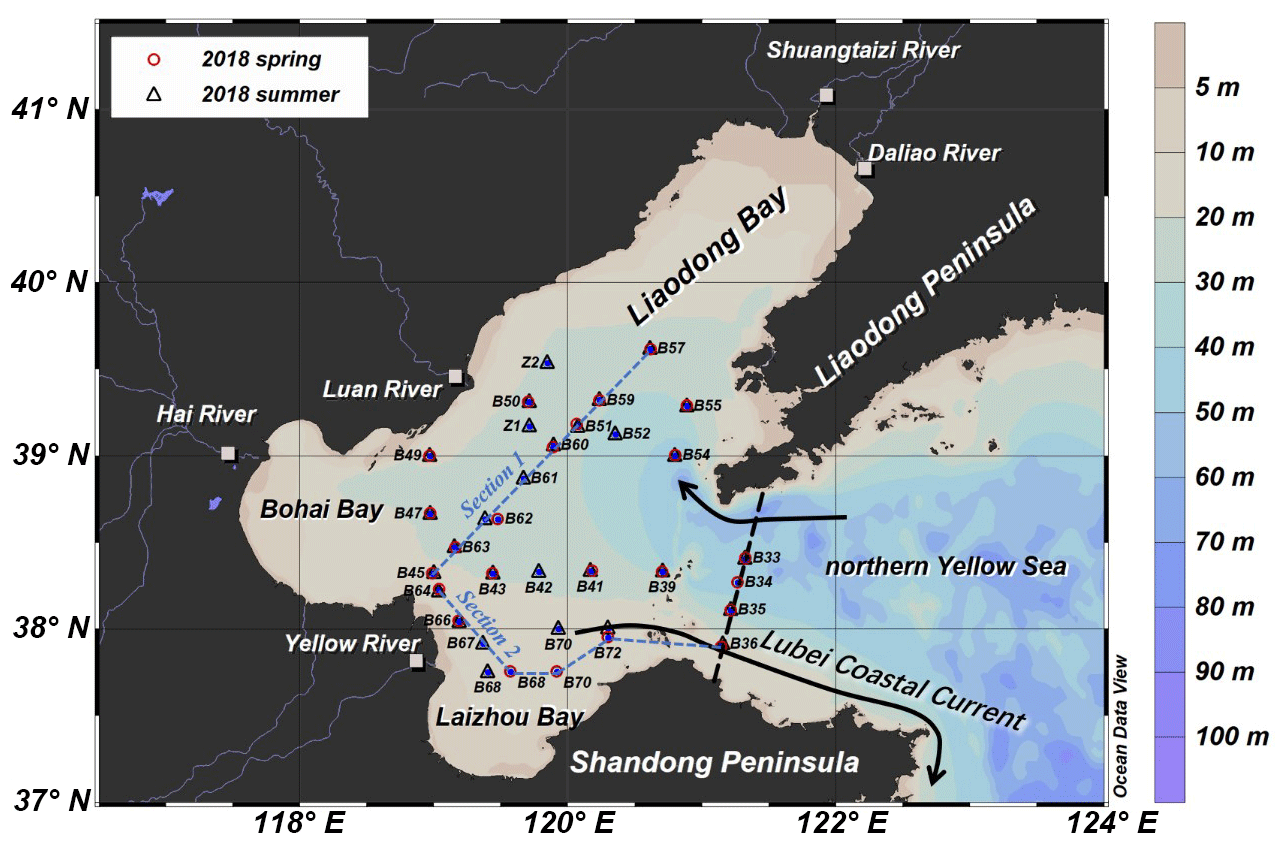
Figure 1Sampling sites in Bohai Sea and rivers (Xiaoqing River not shown). Open red circles stand for sampling sites in spring, and open blue triangles stand for sampling sites in summer; names of the sites are marked nearby. Black arrows stand for the most significant current flows in and out of the BHS. Dashed blue lines stand for two main sections, and the dashed black line stands for the boundary of our study area. (Base map sourced by Ocean Data View, https://odv.awi.de, Schlitzer, 2021)
The nitrogen budget and in particular the internal sources and sinks of nitrate can be constrained with a mass-based and dual stable isotope approach based on δ15N and δ18O of nitrate. The combination of data permits tracking of nitrate and quantification of internal cycling of inorganic nitrogen (Sigman et al., 2005; Wankel et al., 2006; Sugimoto et al., 2009; DiFiore et al., 2006; Montoya et al., 2002; Emeis et al., 2010). Stable isotopes of reactive nitrogen have been used to explore nitrogen sources in the eastern Chinese seas (Umezawa et al., 2014; Wang et al., 2016; S. M. Liu et al., 2017; Wu et al., 2019; Liu et al., 2020; Yu et al., 2021; Y. Li et al., 2019) and the Changjiang Estuary (Yu et al., 2015; Wang et al., 2017; Yang et al., 2018; Chen et al., 2013).
For this study, we analyzed water, suspended matter, and sediments in the Bohai Sea sampled during the spring and summer seasons for nutrient concentrations, carbon and nitrogen contents, dual isotopes (δ15N and δ18O) of nitrate, and δ15N of particulate nitrogen. The aim of the study is to characterize and quantify Nr sources and sinks, in particular those from internal cycling processes that have not been included in previous budgets (Zhang et al., 2004; Liu et al., 2003, 2009, 2011), to track the fate of Nr in the present Bohai Sea. The observation data presented here are the basis for a combined mass and isotope balance model, results of which will be a basis for future studies on the rising impact of fast-growing mega cities in the BHS catchment and their possible impact on the adjacent YS.
2.1 Sample collection
Research cruises were carried out on board R/V Dongfanghong 2 in spring and summer 2018 with 24 sampling sites in April and 25 sites in August, respectively (Fig. 1). Water samples were taken from several depths by 12 L Niskin bottles attached to a CTD rosette (911plus, Seabird, USA). The water samples for nutrients and isotope analysis were filtered using nucleopore polycarbonate filters (0.4 µm) with plastic Nalgene filtration units. The filtered water was collected in Falcon PE tubes (45 mL) as duplicates for measurements of nutrients and nitrate isotope analysis, frozen immediately (−20∘C), and kept frozen until analyses in the home laboratory in Germany. Between 1 to 8 L of water was filtered through pre-weighted GF/F filters (0.7 µm, Φ=47 mm, Sigma Aldrich) which had been pre-combusted at 450∘C for 4 h. The filters were subsequently dried on board under 45∘C for 24 h. Surface sediments were taken with a box corer, and surface samples were transferred into plastic bags with a metal spoon, frozen at −20∘C, and kept frozen until later analysis in the home lab.
YR water samples were taken from the Kaiyuan floating bridge in Lijin, located 44 km upstream of the river mouth. Samples were taken in the middle of the river course with a plastic reversing water sampler at 1 m under the surface. The water samples were filtered immediately for nutrient analysis and collection of suspended particles, and subsequently they were stored frozen until delivered to the home laboratory. Samples were taken monthly in May and July to November of 2018 from the YR and in November of the same year from Daliao River, Hai River, Luan River, and Xiaoqing River (Fig. 1).
2.2 Measurements of nutrients and nitrate isotopes
Nutrient concentrations were measured with an AutoAnalyzer 3 system (Seal Analytics) using standard colorimetric methods (Grasshoff et al., 2009). The relative error of duplicate sample measurements was below 1.5 % for NOx and phosphate (PO) concentrations, as well as below 0.3 % for ammonium. The detection limit was <0.05 µmol L−1 for NOx, >0.01 µmol L−1 for PO, and >0.013 µmol L−1 for ammonium.
Both δ15N and δ18O of nitrate (δ15N = [(15N 14N)sample (15N 14N)standard−1] × 1000 ‰, δ18O = [(18O 16O)sample (18O 16O)standard−1] × 1000 ‰) were determined following the denitrifier method (Sigman et al., 2001; Casciotti et al., 2002). Only the samples with nitrate concentrations >1.7 µmol L−1 were analyzed, and δ15N and δ18O were analyzed in one sample run. Water samples were injected into a suspension of the denitrifier Pseudomonas aureofaciens with injection volumes adjusted to yield 10 nmol N2O. The N2O gas was purged by helium into a GasBench II (Thermo Finnigan) for purification. Afterwards the N2O gas was analyzed by a Delta V Advantage and a Delta V Plus mass spectrometer. Samples were measured in duplicate, and the two international standards IAEA-NO (δ15N–NO ‰, δ18O–NO ‰) and USGS-34 (δ15N–NO ‰, δ18O–NO ‰) and an internal potassium nitrate standard were measured in each batch. The data were corrected by applying a bracketing correction (Sigman et al., 2009), and the standard deviations of the international and in-house standards were found to be ≤ 0.2 ‰ for δ15N and ≤ 0.5 ‰ for δ18O. The standard deviations of duplicate samples were in the same range. Nitrite affects the results and was removed following the protocol of Granger and Sigman (2009) whenever [NO] exceeded 5 % of the NOx pool. In all other cases, we report combined (nitrite + nitrate) values.
2.3 Measurements of suspended matters and sediments
The tared GF/F filters were weighed to calculate the amount of suspended particulate matter (SPM) per liter of water. Total carbon and nitrogen concentrations in SPM and sediment samples were measured by a Euro EA 3000 (Euro Vector SPA) elemental analyzer, and SPM samples with high carbon and nitrogen contents and sediments were acidified to measure organic carbon content. The precision of total and organic carbon determination is 0.05 %, that of nitrogen is 0.005 %, and the standard deviations are less than 0.08 for total and organic carbon and 0.02 for nitrogen. Nitrogen isotope ratios were determined with a FlashEA 1112 coupled to a MAT 252 (Thermo Fisher Scientific) isotope ratio mass spectrometer. The precision of nitrogen isotope analyses is better than 0.2 ‰, and the standard deviation is less than 0.03 ‰.
2.4 Measurements of dissolved oxygen
The dissolved oxygen (DO) samples were collected, fixed, and titrated on board following the Winkler procedure at an uncertainty level of <0.5 %. A small quantity of NaN3 was added during subsample fixation to remove possible interferences from nitrite (Wong, 2012). The DO saturation (DO %) was calculated from field-measured DO concentration divided by the DO concentration at equilibrium with the atmosphere which was calculated from temperature, salinity, and local air pressure, as per the Benson and Krause (1984) equation.
2.5 Hydrodynamic model of nutrient export from BHS to the Yellow Sea
The regional three-dimensional hydrodynamic Hamburg Shelf Ocean Model, HAMSOM (Backhaus, 1985), was applied in the East China Sea (23–45∘ N, 117–131∘ E) to calculate the water and nutrient transport through the Bohai Strait for the year 2018. The HAMSOM model has been applied to investigate the Bohai Sea physical circulation for several decades now and has been extensively validated in the Bohai Sea (Jia and Chen, 2021; Hainbucher et al., 2004; Huang et al., 1999). The spatial resolution of the model is 2′ (approx. 3.7 km) with 20 layers in the vertical direction, while the calculation time step is 3 min. The upper 50 m of the HAMSOM model are resolved by layers of 5 m thickness. The topography data (resolution of 2′) were obtained from marine navigation charts. The meteorological forcing was derived from an hourly ERA5 dataset with a spatial resolution of 0.25∘ (Copernicus Climate Change Service, 2017). The open-boundary SSH (sea surface height) and the boundary T and S data and for the initial T and S fields were extracted from the daily Mercator Ocean dataset (∘) (Lellouche et al., 2019). A total of 13 partial tides derived from the TPXO8-atlas v1 were superimposed onto the SSH along the open boundary (Egbert and Erofeeva, 2002). The observed monthly river discharges were available for the two largest rivers, i.e., Changjiang and YR (MWR, China, 2015–2018), while the inputs for the remaining rivers were derived from the WaterGAP dataset (0.5∘, monthly climatology) (Müller Schmied et al., 2014). The spin-up period of this model is 1 year.
Four sites on a north–south section through the Bohai Strait, i.e., B33, B34, B35, and B36, have been selected to represent the open boundary of the BHS (Fig. 1). The simulated SSH and current velocities (west–east component) were extracted along this section. In addition, nutrient concentrations were interpolated from the observed data at the four sites to the grid of the hydrodynamic model along the Bohai Strait section. Since the observational data just include spring and summer values, the mean value of nitrate in spring and summer had to be extrapolated to an entire year.
3.1 Hydrological properties and nutrients
3.1.1 Hydrological properties
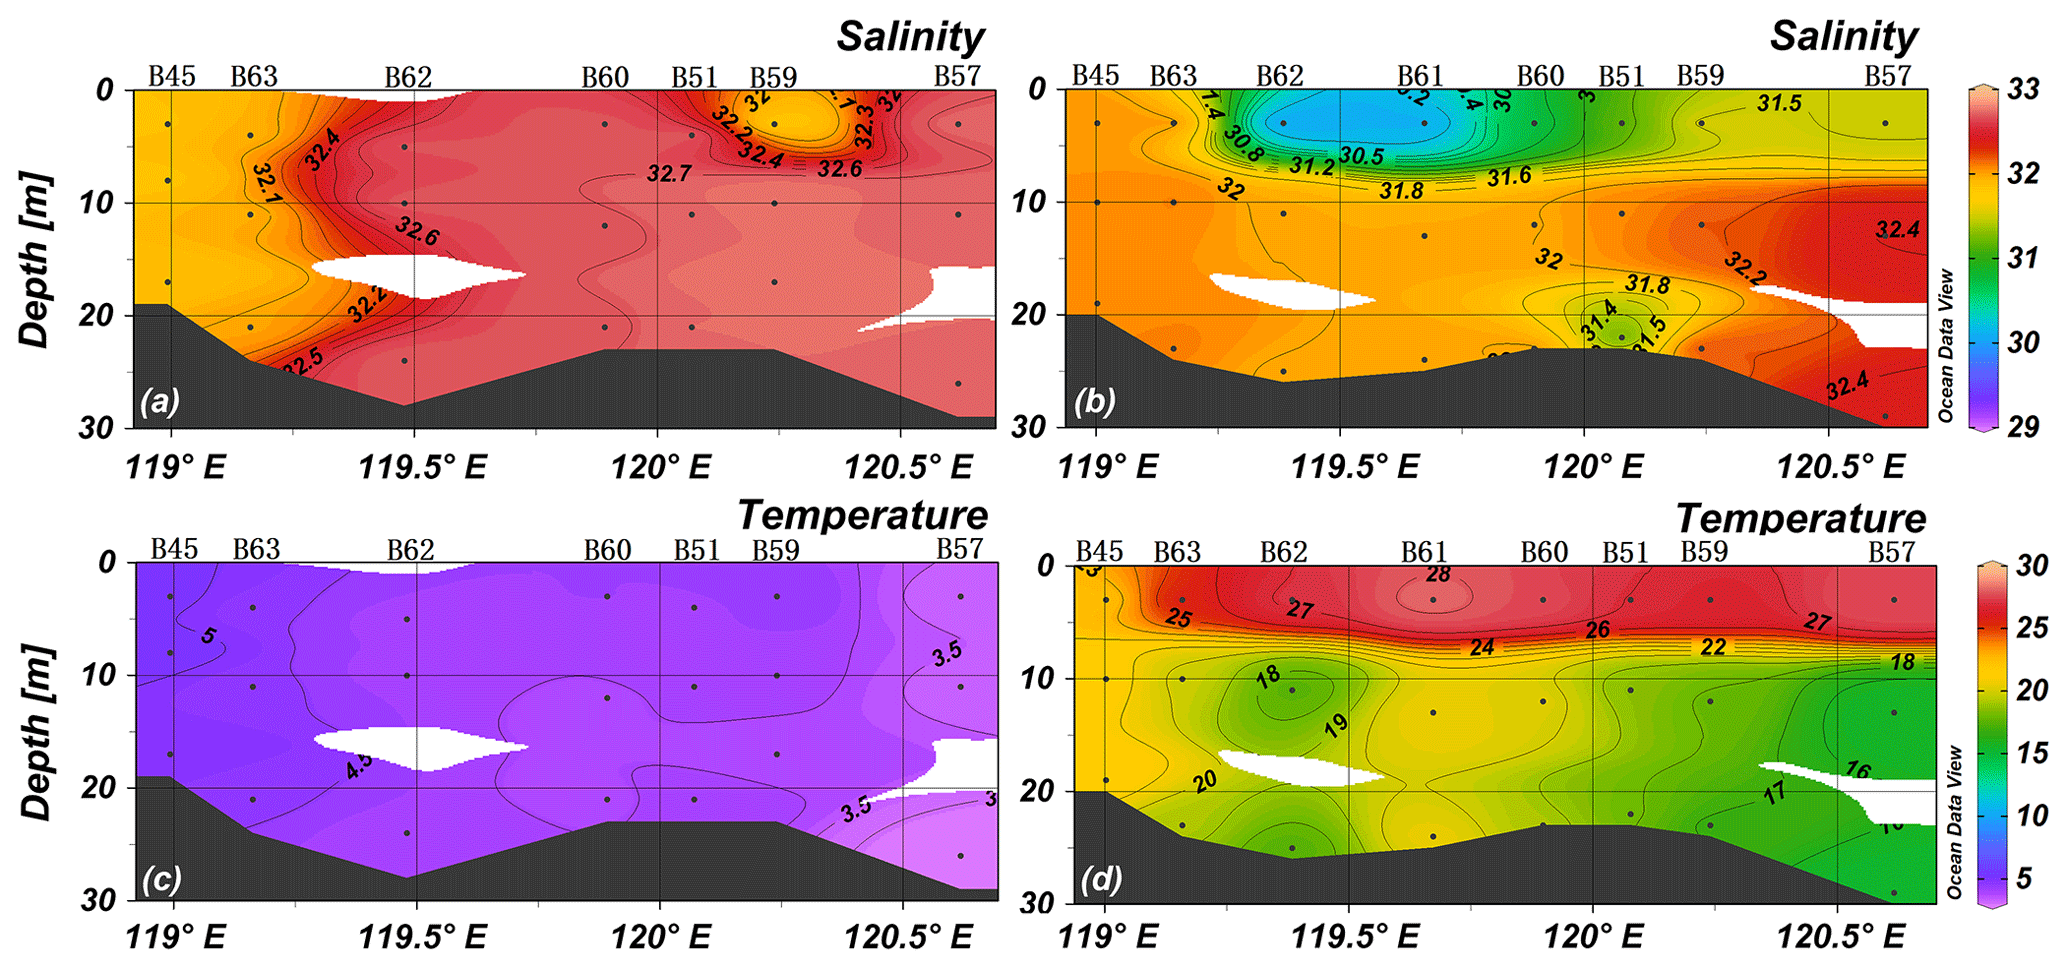
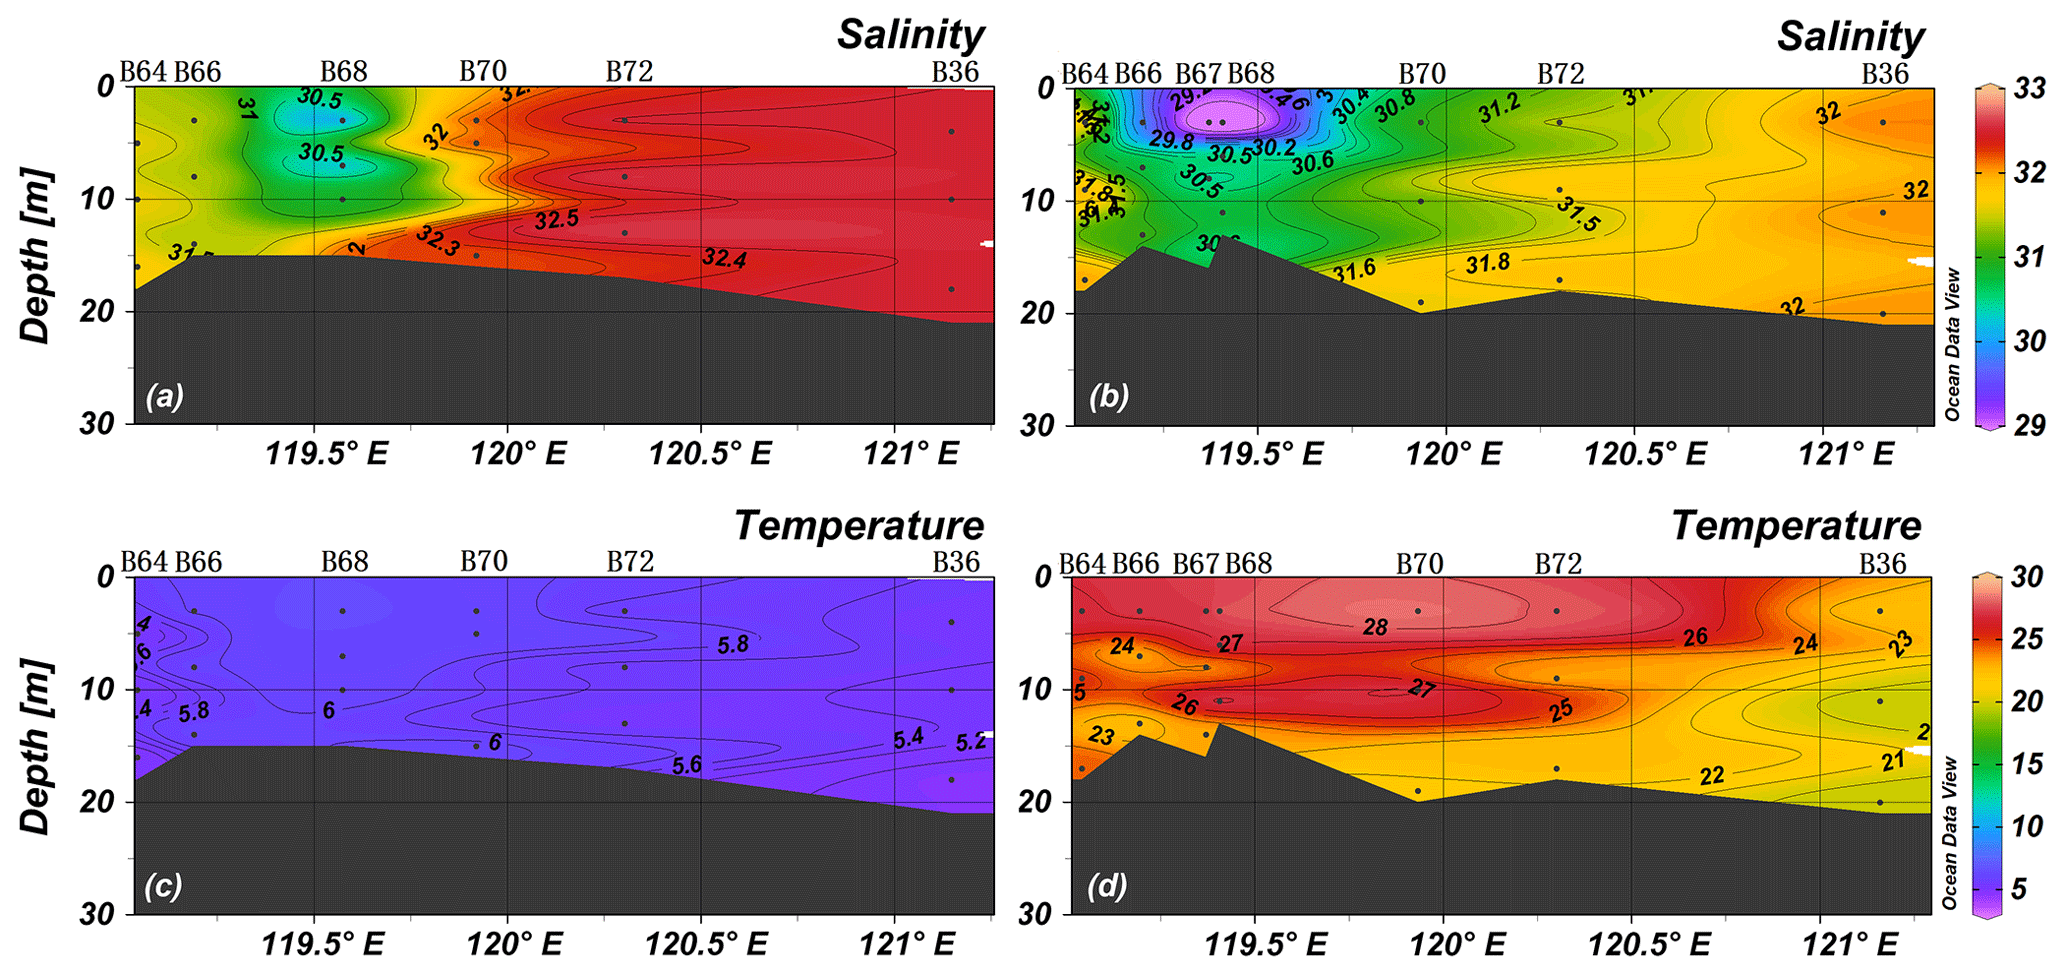
Averages of salinity and temperature in spring were 32.3 ± 0.5 (n=72) and 4.7 ± 0.8 ∘C (n=72), respectively, and the water column was vertically mixed (Figs. 2 and 3). The YR discharged relatively warm water, and the lowest salinity was observed in the southeast of the YR estuary (site B68, T>6∘C, S<31). Thus, the Yellow River diluted water (YRDW) is here defined as the water off the YR estuary with salinities lower than 31. In summer, averages of salinity and temperature were 31.6 ± 0.8 (n=88) and 22.4 ± 4.2 ∘C (n=88), respectively, and the surface layer was stratified. The YRDW extended to an even larger area than in spring caused by high river discharge. The YRDW turned northeast towards Liaodong Bay into the central BHS in the surface layer (T>27∘C, S<31).
The water column oxygen concentrations (see Supplement S1) in the study area in spring and summer were 10.27–11.47 and 3.84–8.86 mg L−1, respectively, and thus much higher than the threshold for water column denitrification (0.15 mg L−1) (Altabet, 2006). The detailed results of DO and other parameters are shown in Supplement S2.
3.1.2 Nutrient concentrations and distributions
Nutrient concentrations in spring were almost vertically uniform, consistent with temperatures and salinities, and no distinct nutricline was observed (Figs. 4 and 5). The prominent plume of low NO of the middle layer along stations B45 and B63 may mark the influence of water advected from more offshore sites with low NO concentration. The YR discharge is indicated by a nitrate maximum at station B68 (31.0 µmol L−1) and the lowest observed salinity (Fig. 5). Concentrations of NH were higher than 1 µmol L−1, PO concentrations were lower than 0.4 µmol L−1 adjacent to the YR estuary, and PO increased towards the central BHS (along section 1) and north of Shandong Peninsula (along section 2). The average concentrations of NO, NO, NH, and PO of all spring samples were 6.5 ± 5.8, 0.2 ± 0.2, 0.8 ± 0.5, and 0.4 ± 0.2 µmol L−1 (n=72), respectively.
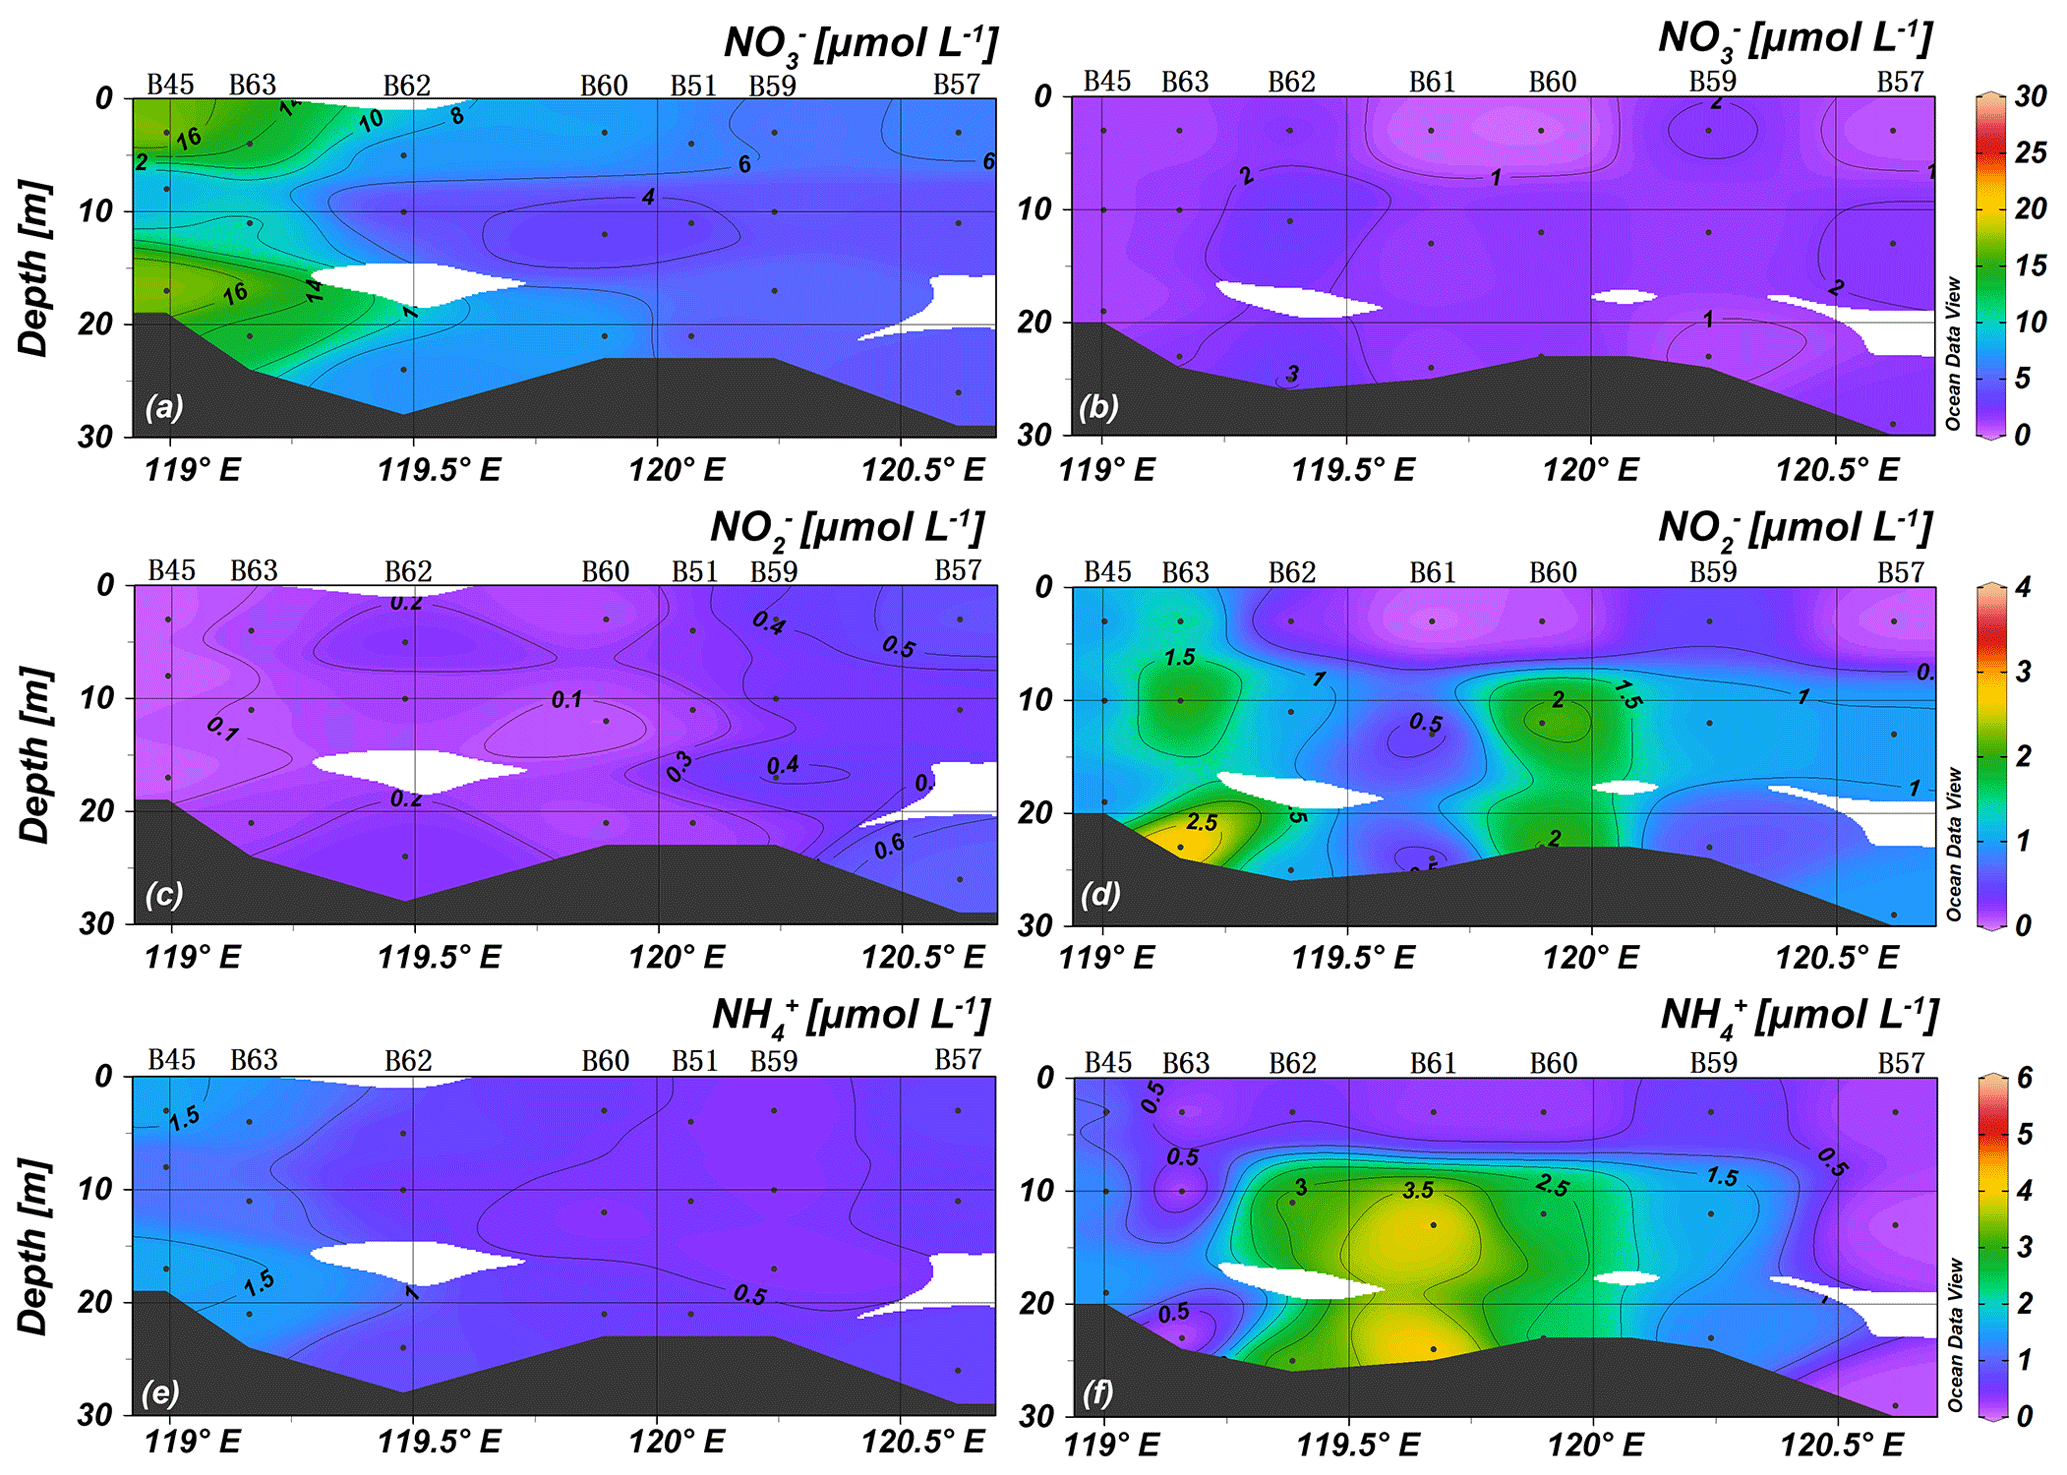
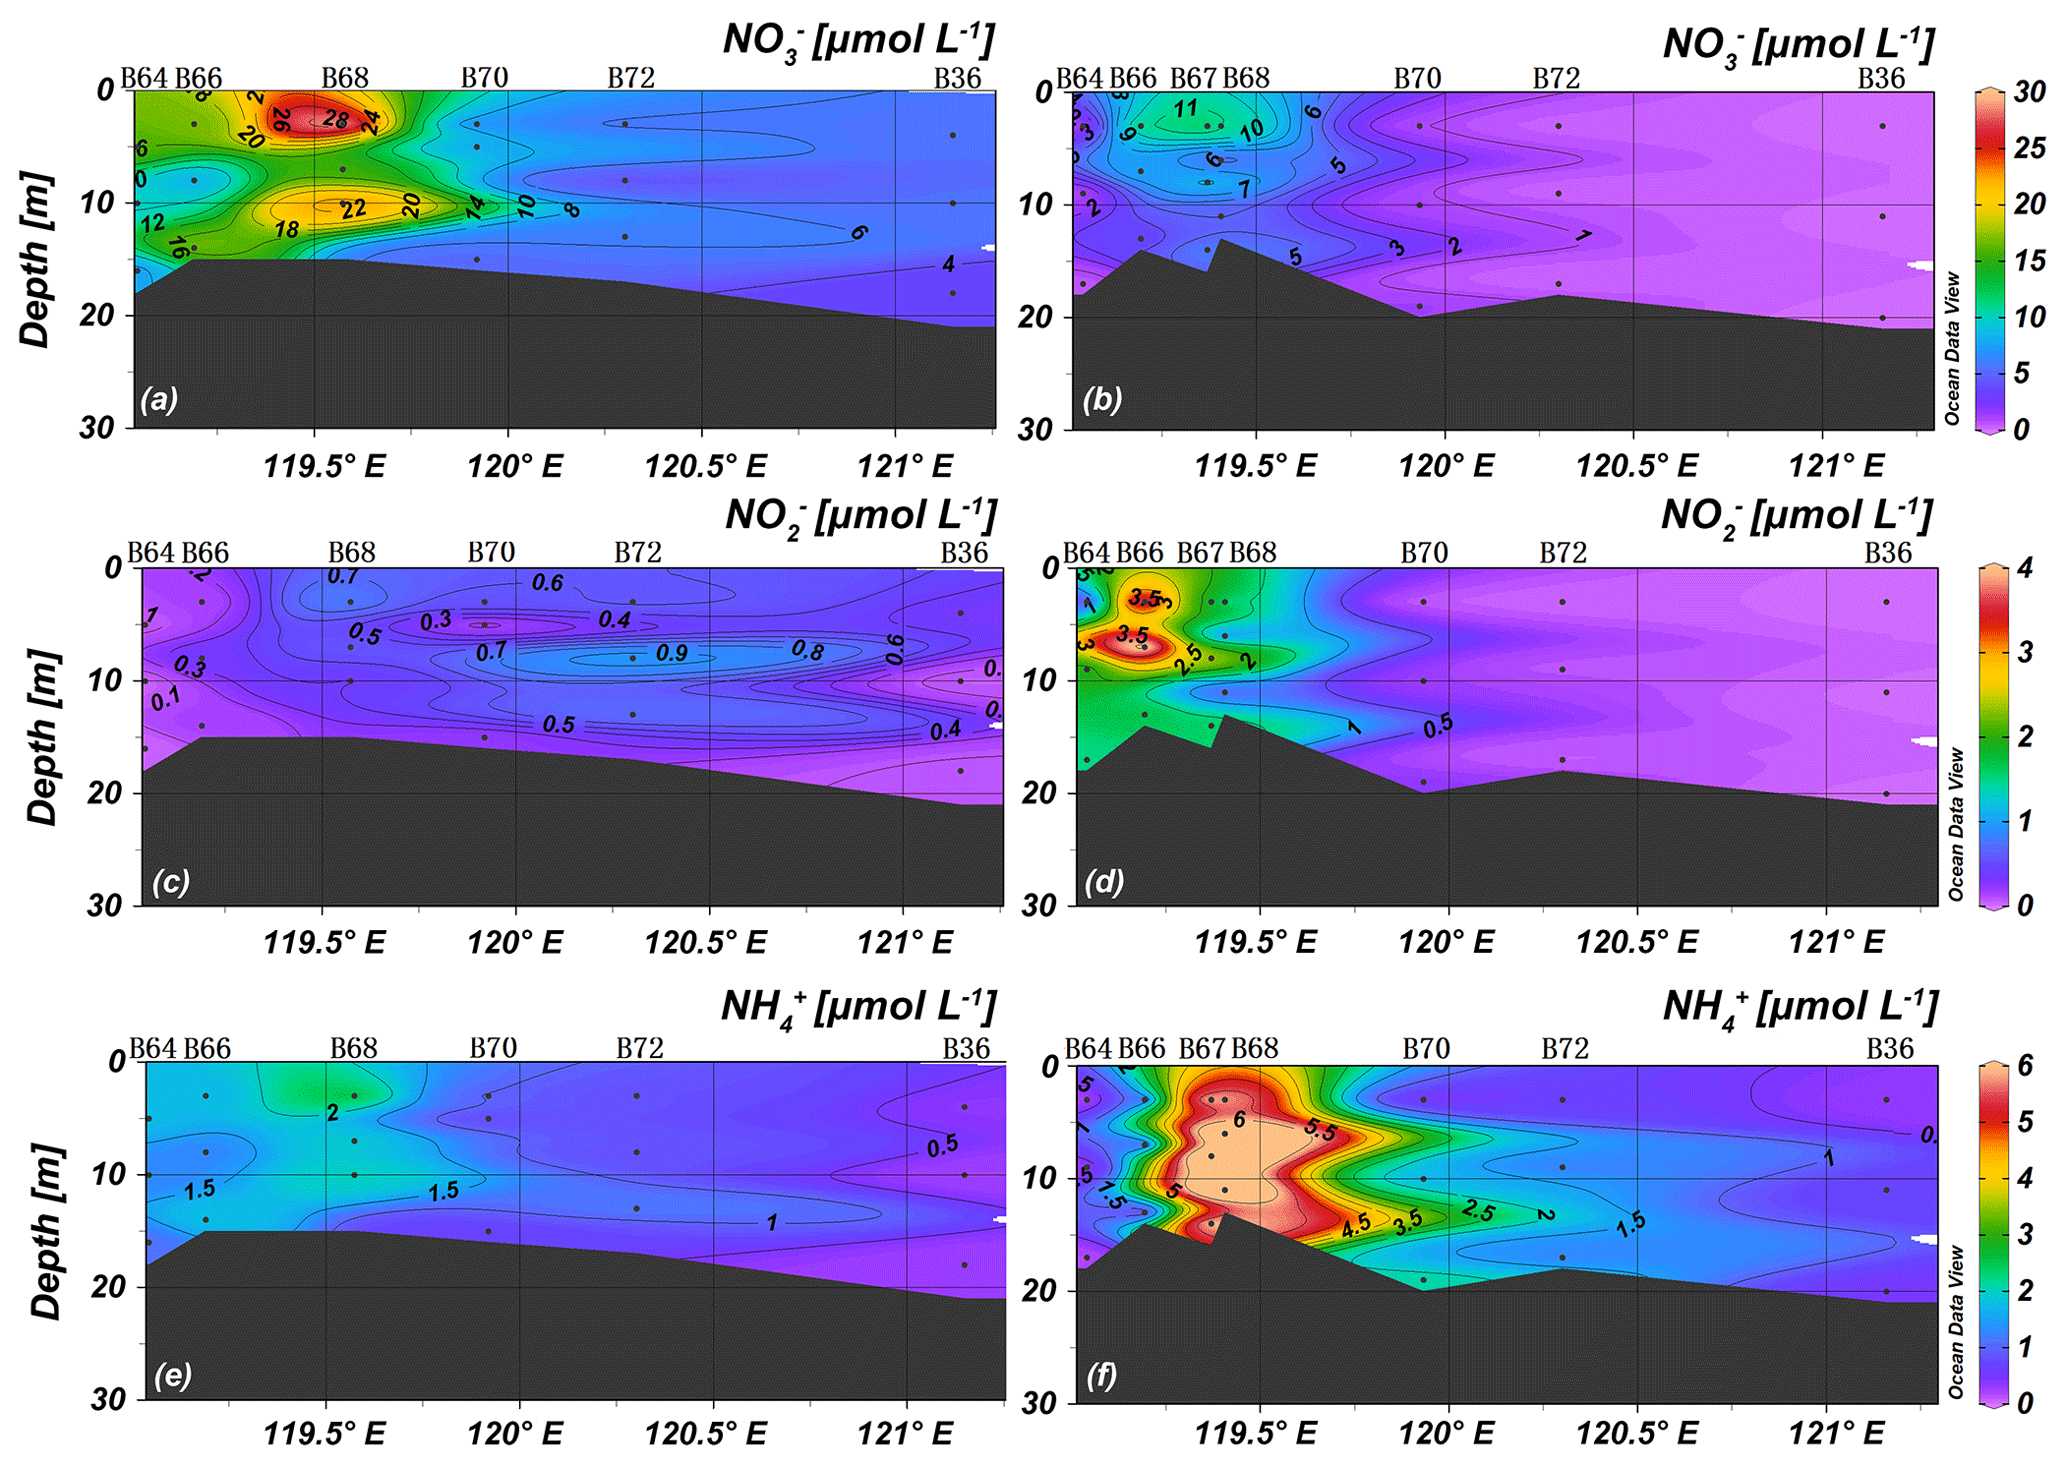
In summer, in the central BHS (section 1), the upper 10 m water layer was nutrient depleted, while concentrations were high in the lower layer (Fig. 4). NOwas almost depleted in the BHS except for stations B66 and B67 (included in section 2) located in the tongue of YRDW. NO and NH concentrations were higher than 2 and 5.5 µmol L−1, respectively, in the same area (Fig. 5). The average concentrations of NO, NO, NH, and PO of 1.9 ± 2.7, 0.8 ± 1.1, 1.6 ± 1.9, and 0.1 ± 0.1 µmol L−1 (n=85), respectively.
3.2 Dual isotopes of nitrate
In spring, the average values of δ15N and δ18O were 7.8 ± 1.4 ‰ and 12.0 ± 3.3 ‰ (n=52), and δ15N and δ18O ranged between 5.6 ‰ and 10.5 ‰ and 5.0 ‰ and 20.0 ‰, respectively. δ15N and δ18O were both vertically homogenous, corresponding to the vertical profile of salinity, temperature, and nitrate. Relatively high δ15N values were observed in the southwestern part of BHS including the areas adjacent to Bohai Bay and Laizhou Bay, which is consistent with high nitrate concentrations. The δ18O was inversely related to δ15N with low values near the YR estuary and high values in the northeast of the central BHS and north of Shandong Peninsula (Figs. 6 and 7).
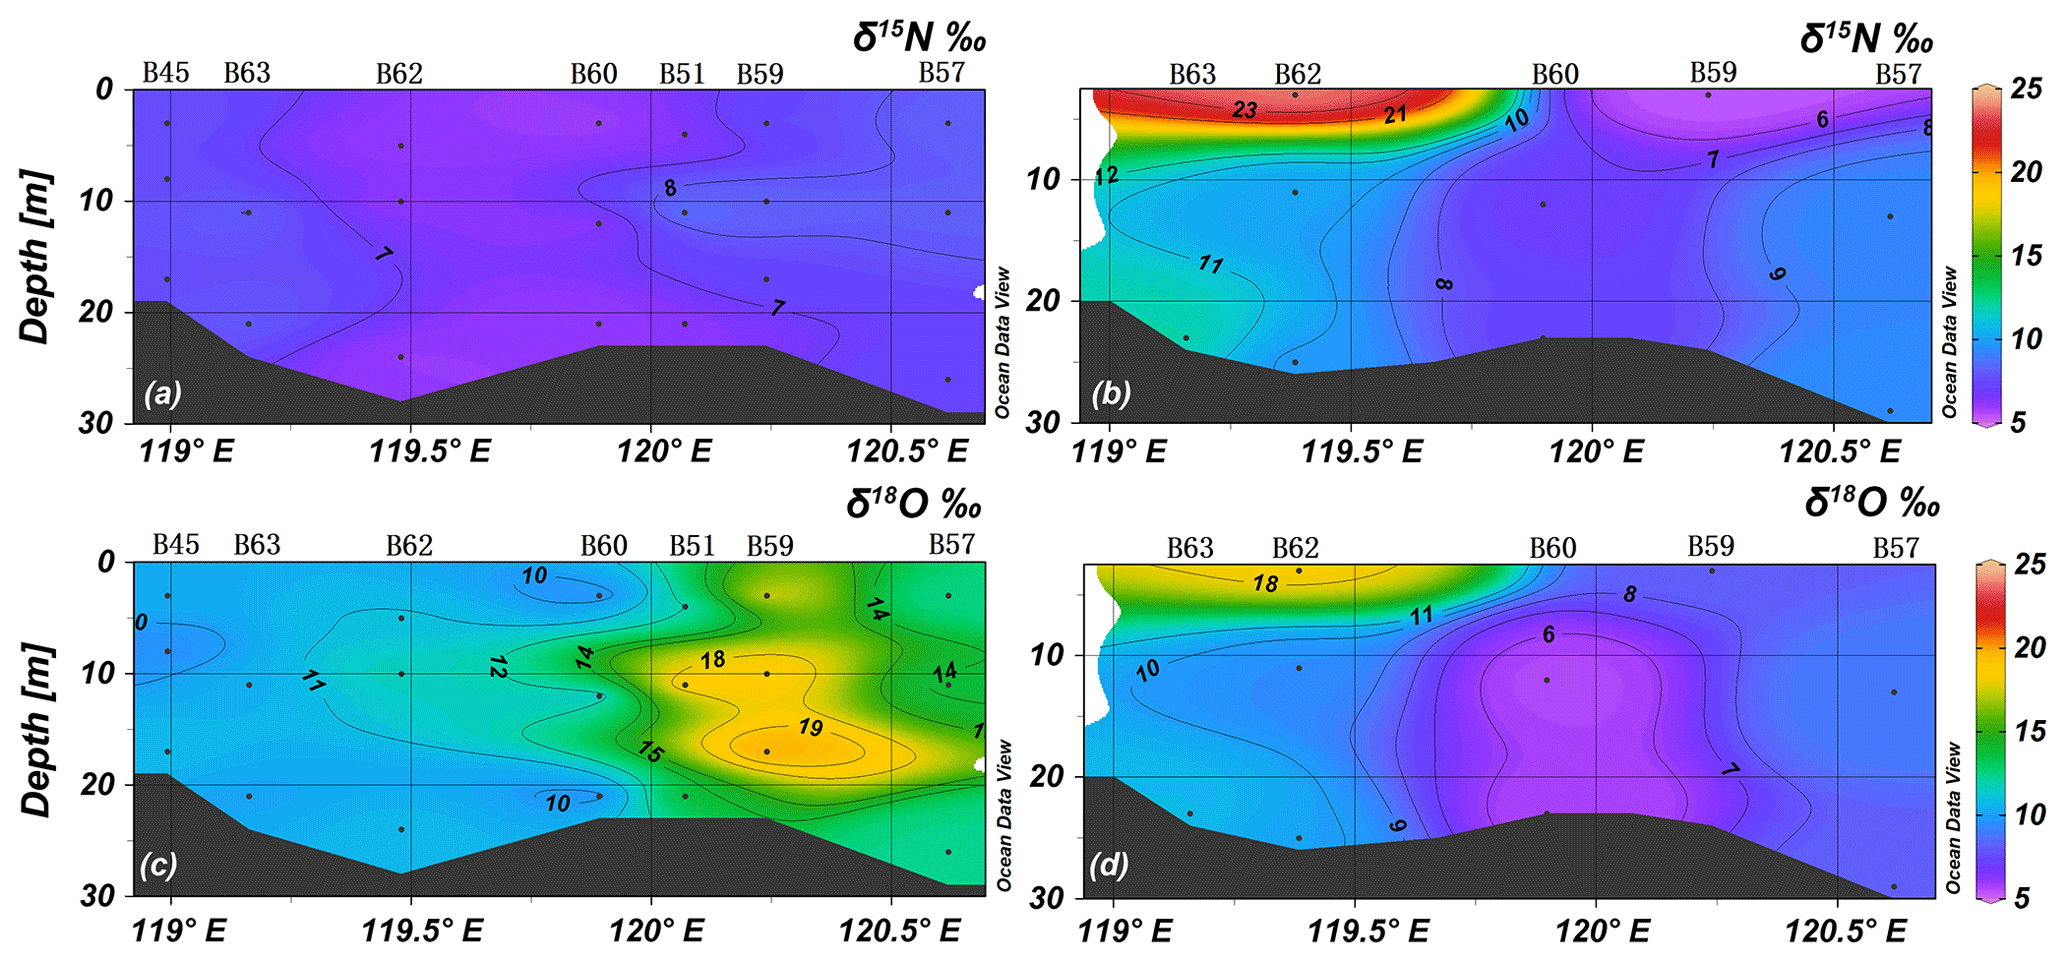

Due to the low nitrate concentration in summer, only a subset of samples could be analyzed, and most of these are from the YRDW that had [NO] > 1.7 µmol L−1. The average values of δ15N and δ18O were 9.9 ± 3.5 ‰ (n = 23) and 8.7 ± 3.3 ‰ (n=23), and they ranged between 3.5 ‰ and 23.9 ‰ and 3.1 ‰ and 18.4 ‰, respectively. The mean value of δ15N was higher than that of spring samples, whereas the δ18O value was lower. Relatively high δ15N and δ18O values of 23.9 ‰ and 18.4 ‰ were registered in the surface water of the YRDW (site B62) and decreased with water depths at increasing nitrate concentrations.
3.3 Suspended particulate matter
In spring suspended particulate matter (SPM) concentrations were mostly vertically homogenous along both transects with high values (>15 mg L−1) close to the YR mouth (see Supplement S3). Corg % and N % are inversely correlated with SPM concentrations, and high values occurred in the central BHS and north of Shandong Peninsula. In summer SPM concentrations were significantly higher than in spring, and maxima occurred in deep water off the YR (>30 mg L−1) and in the west part of the BHS. Corg % and N % maxima occur in surface waters in the eastern Laizhou Bay and the central BHS.
The average δ15N of SPM in spring was 4.8 ± 0.9 ‰ (n=14), with a maximum (>6.10 ‰, n=3) south of Luan River. The lowest values were observed in the southern Bohai Strait and northeast of the YR estuary. The other samples varied in a narrow range of 3.9 ‰–4.7 ‰ (n=11). In summer, the average of δ15N was 5.7 ± 0.8 ‰ (n=34) and ranged from 3.9 ‰ to 7.2 ‰. Systematic variation in δ15N of SPM was barely discernable and only exhibited a weak decline from the YR mouth into the northeastern BHS (section 1) and into the Bohai Strait (section 2) (see Supplement S3), thus tracking the salinity dilution gradient in the surface layer.
3.4 The discharge of the Yellow River
The water discharge of the year 2018 determined at the Lijin hydrography station was 333.8 × 10⁹ m3, which was by 14 % higher than the multi-year average of 292.8 × 10⁹ m3 (1952–2015) (MWR, China, 2019). The monthly mean discharge was 27.80 ± 20.21 × 10⁹ m3 per month (n=12), which was higher than the multi-year average value by 14 %–51 %, indicating that in the YR basin 2018 was a flood year. The water discharge maximum was from July to October (Fig. 8). During May to November in 2018 (no value for June), the mass fluxes of nitrate and phosphate increased with the water discharge of the YR, while the monthly fluxes of nitrite and ammonium exhibited an opposite trend. δ15N and δ18O of YR nitrate ranged from 9.1 ‰ to 10.9 ‰ and 1.1 ‰ to 3.0 ‰, respectively. The monthly mass-weighted average values of δ15N and δ18O were 9.9 ‰ and 1.9 ‰, respectively. δ15N and δ18O were positively correlated (δ18O = 1.04 × δ15N − 8.43, R2=0.85), as were δ15N and the monthly mass flux of nitrate (R2=0.63).
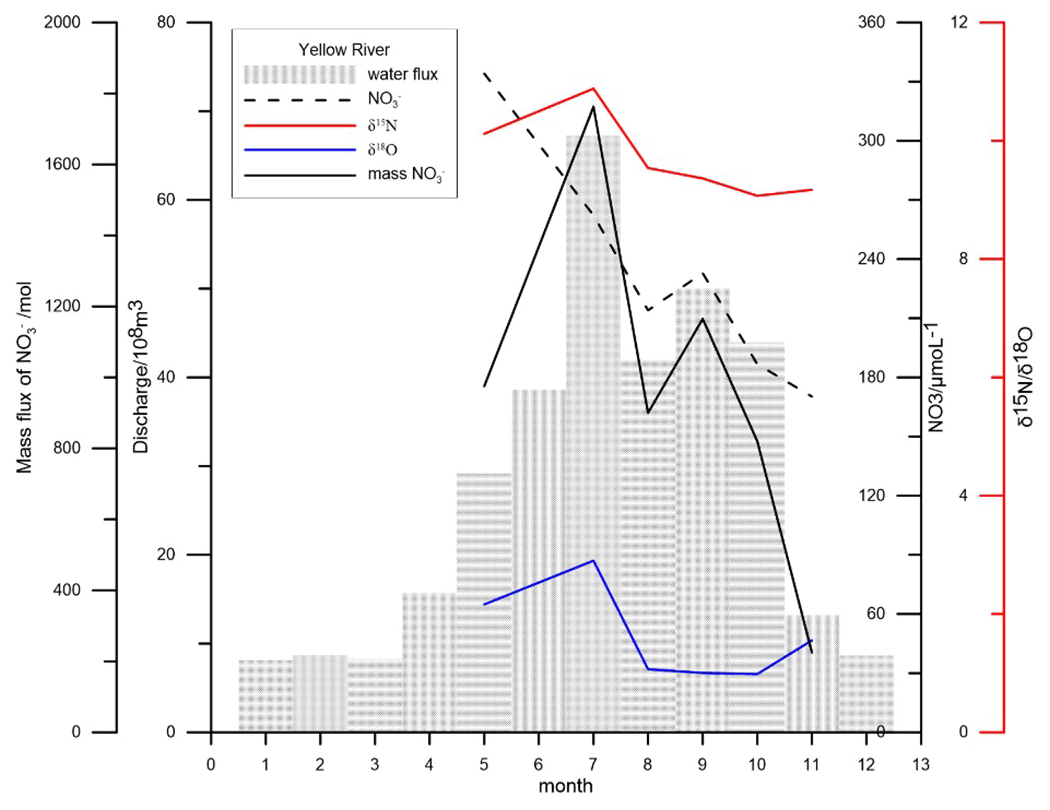
Figure 8Monthly variation in water flux (shadowed bar), nitrate concentration (dashed line), mass flux of nitrate (solid line), and dual nitrate isotopes (δ15N in upper solid red line and δ18O in lower solid blue line) of the YR in 2018. Water samples were collected monthly in May and July to November in Lijin, nitrate concentrations (µmol L−1) and dual isotopes (δ15N and δ18O, in per mil) were measured in home laboratory, and monthly water flux data (108 m3) are according to the YR Sediment Bulletin 2018 (http://www.yrcc.gov.cn/nishagonggao/2018/index.html#p=20, last access: 28 April 2022).
3.5 Nitrate exchange with the Yellow Sea
Based on current velocities and nutrient concentrations along the section crossing the Bohai Strait, the annual water and nitrate export from BHS to the YS in the year 2018 was calculated to 1.26 × 10⁻³ Sv (1 Sv = 106 m3 s−1) and 0.9 × 10⁹ mol yr−1, respectively. In this study, the exported nitrate is assumed to have the average isotope values of the BHS (δ15N = 8.9 ‰ and δ18O = 10.4 ‰).
Making use of the three-dimensional model (HAMSOM) results, it is also possible to determine a spatial distribution of the annual nutrient flux through the Bohai Strait section (Fig. 9). Positive values represent a nutrient flux out of the Bohai Sea, while negative ones indicate a flux into the Bohai Sea. The strongest nutrient export occurs at the southern part of the Bohai Strait, while the major import takes place in the upper 15 m in the northern Bohai Strait (Fig. 9).
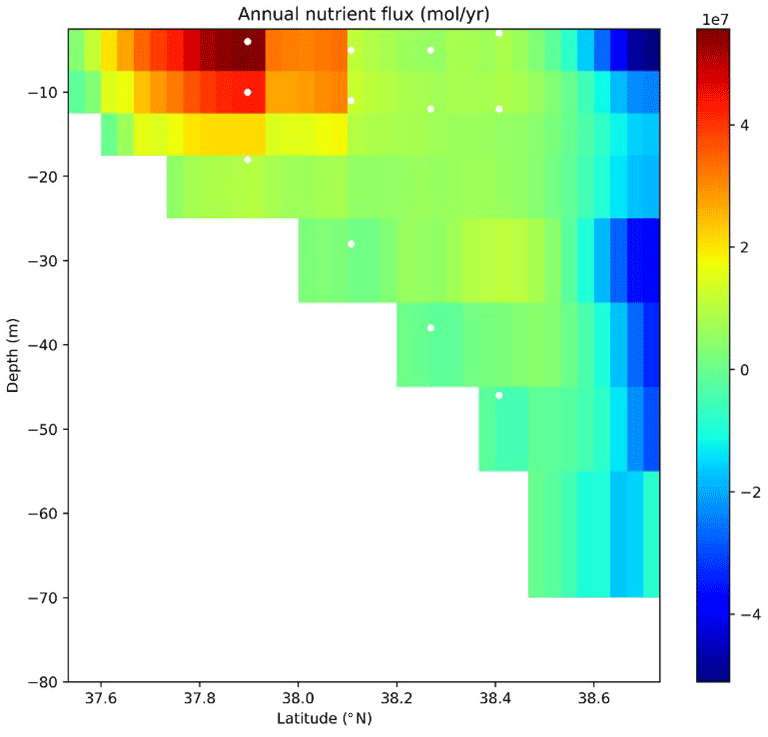
Figure 9Simulated net fluxes of nitrate (mol yr−1) in the Bohai Strait for the year 2018. White dots are the sampling sites, the color bar is the flux of nitrate (107 mol yr−1), and positive values stand for the export of nitrate from BHS to YS.
4.1 The hydrographic and nutrient characteristics in spring and summer
The sampling in early spring occurred during a season of low biological activity with the result that nutrients behaved almost conservatively (Wei et al., 2003; Tan and Shi, 2006). The YR discharged 333.8 × 10⁹ m3 water and 8.0 × 10⁹ mol nitrate to the Bohai Sea in 2018, accounting for 85 % and 84 % of water and nitrate discharge of all large rivers in the Bohai Sea, respectively. As is indicated by the negative correlations of NO (, p<0.01) and NH (, p<0.01) with salinity, the YR is one of the major sources of these nutrients in the BHS, whereas PO is contributed by the inflow of saline waters from the YS as indicated by the positive correlation with salinity (r=0.43, p<0.01). Concentrations of nitrate were relatively high in the southern Bohai Strait but low in its northern part, suggesting that in spring nitrate-rich water flows out of Bohai Strait along the northern shore of Shandong Peninsula in the LCC (Lubei Coastal Current), while nitrate-depleted water flows in from the northern YS via the northern strait. In summer, the water is stratified with the thermocline at about 8 m water depth and coinciding with halo- and nutriclines. Nutrients are depleted to trace amounts above the thermocline. In contrast to the other nutrients, phosphate concentrations did not increase with depth in the southwestern part of BHS (i.e. Bohai Bay and Laizhou Bay). Similar to the spring situation, salinity was weakly positively correlated with PO (r=0.29, p<0.05) and NO (r=0.32, p<0.05), whereas it was negatively correlated with NO (, p<0.01) and NH (, p<0.01), respectively. The average ratio in BHS in spring and summer was 28.2 ± 38.2 and 86.9 ± 126.3, respectively, implying that productivity in BHS was phosphorus limited. Thus, diazotrophic N2 fixation is excluded as a significant input of Nr because of high ratios.
4.2 The main sources and sinks of nitrate in the BHS
Most of the external and internal sources of nitrate to the BHS are characterized by distinct dual isotope values. These fingerprints combined with mass flux estimates are in the following used to constrain the mass and isotope budget of nitrate in the BHS. Specifically, the role of internal cycling processes can thus be quantified, which was lacking in previous budgets. In the following, each of the sources and sinks is described, along with isotope composition or isotope fractionation associated with cycling processes.
4.2.1 Riverine inputs
The main input from this source of BHS Nr is from the YR, and we calculated a nitrate input of the YR of 7.95 × 10⁹ mol yr−1, based on the annual average discharge (Yellow River Conservancy Commission of MWR, China, 2019) and the load-weighted nitrate concentration during our sampling period during the year 2018. The water discharge of the other seven important rivers (Hai River, Liao River, Daliao River, Luan River, Xiaoqing River, Daling River, and Xiaoling River) sums up to 59.86 × 10⁸ m3 yr−1 (MWR, China, 2019; Ma et al., 2004; Yu et al., 2018; Zhang et al., 2004). Nitrate fluxes of these rivers were calculated based on water discharge and our nitrate measurements in the YR, Hai River, Daliao River, Luan River, and Xiaoqing River. Owing to a lack of data on nitrate concentrations of Liao River, Daling River, and Xiaoling River and considering that these rivers drain basins adjacent to Daliao River, we assume that nitrate concentrations of these rivers were the same as those of the Daliao River. The total riverine input of nitrate summed up to 9.49 × 10⁹ mol.
The mass-weighted average annual values for δ15N and δ18O of nitrate in these rivers were 10.0 ‰ and 1.3 ‰, respectively, taken here to represent the river nitrate isotopic composition discharged into BHS.
4.2.2 Submarine groundwater input
The DIN supplied to BHS by submarine groundwater discharge (SGD) flux has been estimated to be 2–10 times the YR discharge (Luo and Jiao, 2016; Peterson et al., 2008; Wang et al., 2015). These fluxes of SGD are a mixture of submarine fresh groundwater discharge (SFGD) and recirculated saline groundwater discharge (RSGD) (Liu et al., 2011; Peterson et al., 2008; J. Liu et al., 2017), but only the freshwater component is relevant as a source for the budget.
The latest estimates of SGD for the BHS are 10.0 × 10⁹ m3 yr−1 (J. Liu et al., 2017) and 19.1 × 10⁹ m3 yr−1 (Wang et al., 2015). The nitrate concentration of SFGD is not documented, but the nitrate concentration of groundwater in the YR delta was 304.2 ± 254.2 µmol L−1 (Liu et al., 2011). For reducing the error of these indirectly measured data, we decided to use the value of 4.25 × 10⁹ mol yr−1 for the nitrate flux of SFGD, which is the averaged products of SFGD water fluxes and nitrate concentrations shown above. This value is only approximately 10 % of previous estimates of the input nitrate for SGD into BHS (Liu et al., 2011) due to the exclusion of RSGD.
Because of pollution and denitrification processes in soils, aquifers, and groundwater (Zhang et al., 2013; Chen et al., 2007; Soares, 2000), the values of δ15N and δ18O of nitrate in SFGD are more enriched than those of river runoff, and this is illustrated by the observed δ15N value of 20.2 ± 9.0 ‰ (n=19) of on-land groundwater near the YR delta (Chen et al., 2007). As there are as yet no reported δ15N values of SFGD and RSGD inputs, we decided to take this value as the signal of nitrate δ15N imported by SFGD into the BHS. There are no data available for δ18O of nitrate of SFGD, and we will discuss possible constraints in the box model discussion (Sect. 4.3.2).
4.2.3 Atmospheric deposition
Combined atmospheric input by wet and dry deposition ranged from 3.14 × 10⁹ to 3.42 × 10⁹ mol yr−1 (Zhang et al., 2004; Liu et al., 2003). We adopted the annual mass of NOx deposition for China of 6.2 Tg yr−1 (Zhao et al., 2017) and related this value to the area of the BHS, which results in an annual deposition of 3.6 × 10⁹ mol yr−1. Owing to a lack of directly measured data for atmospheric NOx in the BHS, we adopt 3.42 ± 2.29 × 10⁹ mol yr−1 (Zhang et al., 2004) as the atmospheric nitrate flux.
The nitrate δ15N values of PM2.5 (fine particulate matter suspended in the air) ranged from 3.5 ‰ to 17.8 ‰ in northern China (Fan et al., 2019; Zong et al., 2017; Song et al., 2020; Zhang et al., 2019), whereas nitrate δ15N of precipitation ranged from −2.5 ‰ to +0.9 ‰ (Zhang et al., 2008; Chang et al., 2019; Z. Li et al., 2019; Kim et al., 2019). Assuming that PM2.5 is the main component of dry deposition we use a δ15N value of 8.2 ‰ reported from Beihuangcheng island in Bohai Strait (Zong et al., 2017), while the wet deposition has a δ15N value of −2.35 ‰ (Chang et al., 2019). Wet deposition in BHS was estimated as 54 %–68 % of total deposition (Liu et al., 2003; Zhang et al., 2008; Zhao et al., 2017), resulting in a mass-weighted average of BHS atmospheric deposition ranging from 1.03 ‰ to 2.56 ‰, of which the arithmetic mean value of 1.80 ‰ is adopted here.
The nitrate δ18O of PM2.5 in BHS ranged from 65.0 to 88.1 ‰ (seasonally) (Zong et al., 2017), the value in Beijing is 88.3 ± 6.9 ‰ (Song et al., 2020), and it is 57.80 ± 4.23 ‰ in cloud samples of Shandong (Chang et al., 2019). For nitrate δ18O of dry deposition, we thus assume a mean value of 80.5 ‰ and that wet deposition has a δ18O of 57.8 ‰. These two estimates combined give a ratio of dry and wet deposition in the range of 65.8 ‰–68.0 ‰. The arithmetic mean value is 66.9 ‰, which we take to represent the δ18O of nitrate deposited from the atmosphere to the BHS.
The ammonium deposited from the atmosphere is assimilated by phytoplankton and is subsequently entrained into the N cycle via remineralization and nitrification or is nitrified directly in the water. Thus, the nitrified atmospheric ammonium is included here as a source bearing on δ15N of nitrate in the seawater. The ammonium deposition in BHS was 6.15 × 10⁹ mol yr−1, which is more than the nitrate deposition of 3.42 × 10⁹ mol yr−1 (Zhang et al., 2004).
The atmospheric ammonium has low δ15N values of −6.53 ‰ to −1.2 ‰ (Zhang et al., 2008; Chang et al., 2019). Given that the δ15N value of ammonium of the North China Plain is −1.2 ‰ ± 4.5 ‰ (Zhang et al., 2007) and that there is no obvious accumulation of ammonium in the surface layer in the observations, we assume that this isotope value is identical to the δ15N value of nitrified atmospheric ammonium.
The δ18O of nitrate from nitrification is roughly 1 ‰ higher than that of ambient H2O (Sigman et al., 2009; DiFiore et al., 2009; Casciotti et al., 2007; K. L. Casciotti et al., 2008). The δ18O of H2O in the BHS was reported as −0.67 ‰ ± 0.25 ‰ (n=10) (Kang et al., 1994; Wu, 1991), and thus the δ18O of the newly nitrified nitrate should be approximately 0.3 ‰.
4.2.4 Benthic fluxes
Nitrate diffusing from water to sediment
A latest number of benthic reactive nitrogen loss including denitrification and anammox for the BHS and northern YS is 3.5 × 10⁹ t N yr−1 (Zhang et al., 2018). Combining the area of the BHS and assuming that 82 % of benthic nitrogen loss was by denitrification, the denitrification flux calculates to 10.1 × 10⁹ mol yr−1. Globally, the sediment denitrification rate varies in the range of approximately 0.5 to 2 mmol m−2 d−1 (Devol, 2015), which is equivalent to 14.1 × 10⁹ to 28.2 × 10⁹ mol yr−1 in the BHS. We assume that diffusion is not accompanied by isotope fractionation (Devol, 2015) with the result that δ15N and δ18O of nitrate diffusing into the sediment are the same as the nitrate pool in BHS (8.9 ‰ and 10.4 ‰, respectively).
Ammonium diffusing from sediment to water
The processes of nitrogen cycling in sediments are complex and variable (Lehmann et al., 2004). The degradation of organic matter, nitrification, and assimilation are acting under aerobic conditions, whereas denitrification, anammox, and dissimilatory nitrate reduction to ammonium (DNRA) are observed under anaerobic conditions. When organic matter is degraded in the surface sediments, part of the produced ammonium diffuses into the overlying bottom water and subsequently is nitrified to nitrite and nitrate under aerobic condition. For our purpose only the nitrified ammonium bears on the seawater nitrate pool. The mean δ15N value of sediment in BHS was 5.4 ‰ (n=20), and according to the fractionation factor during organic matter remineralization of 2 ‰ (Möbius, 2013) and subsequent nitrification (see above), the δ15N and δ18O of nitrate efflux from the sediment are assumed to be 3.4 ‰ and 0.3 ‰, respectively.
4.2.5 Sedimentation
The mass flux of Nr sedimentation is unknown. In terms of the effects of Nr sedimentation on nitrate dual isotopes, phytoplankton organisms that assimilate nitrate from the dissolved phase are the main source of sinking particles with the result that the N and O will be removed from the nitrate pool following the assimilation fractionation factor. Sinking particles in the BHS have a δ15N of 5.2 ‰ (δ15Nsink) corresponding to the average values of spring and summer, which integrates multiple processes such as photosynthesis of phytoplankton, heterotrophic synthesis of bacteria, and heterotrophic degradation (remineralization).
There are no observed data of δ18O of nitrate removed from the pool during assimilation (δ18Osink), but this value can be estimated by the assimilation fractionation factor (18ε). The per mil fractionation factors ε of N (15ε) and O (18ε) in nitrate during assimilation are generally assumed to be around 5 ‰ so that 15ε : 18ε=1 : 1. Here we adopt the average of 15ε and 18ε as 5 ‰ (Granger et al., 2010; DiFiore et al., 2009; S. M. Liu et al., 2017; Wu et al., 2019; Umezawa et al., 2014; Wang et al., 2016) so that the δ18O of nitrate removed from the pool during assimilation (δ18Osink) should be 5.0 ‰ according to the δ18O (10.0 ‰) of the dissolved nitrate pool.
4.3 The nitrate budget in the BHS
A box model of the nitrate budgets for the Bohai Sea following the LOICZ approach (Zhang et al., 2004) balanced sources and sinks of nitrate in BHS and was updated by several other nitrate budgets for the BHS during the last two decades (Zhang et al., 2004; Liu et al., 2003, 2009, 2011). All were, in general, not completely constrained because of a lack of data on some important source or loss terms. We here associate the nitrate isotope compositions of pools, sources, and sinks of nitrogen with a box model of the BHS nitrate in order to improve the understanding of nitrate cycling in the BHS. Finally, based on the combined mass and isotope box model informed by new data on the isotopic composition of nitrate, surface sediment, and suspended particulate nitrogen in the water column discussed above, we propose an updated N budget that is internally consistent.
4.3.1 The nitrate budget based on mass fluxes and corresponding δ15N values
The sources of nitrate for BHS are river inputs, submarine fresh groundwater input, atmospheric deposition, and remineralization. The most important sinks are net export to the YS, sediment denitrification, and particulate matter sedimentation. Assuming the mass and N isotope of nitrate in the BHS are in steady state, the sources and sinks of nitrate follow Eqs. (1) and (2):
where the terms m with different subscripts refer to the corresponding nitrogen mass fluxes, matm refers to atmospherically deposited nitrate, mr refers to river nitrate, mN refers to nitrified ammonium deposited from the atmosphere, mSFGD refers to nitrate in submarine fresh groundwater discharge, and mntr refers to nitrification in the water column. In terms of sinks, mnet refers to the mass fluxes associated with net export of nitrate from BHS to the YS, msink refers to nitrate sedimenting from seawater as particulate N, and mdenitr refers to denitrification in the sediment. The unit of the mass fluxes is 109 mol. The “δ15N” refers to the δ15N value of the N mass flux with the same subscripts. As mentioned previously, the mass fluxes for mN, mntr, msink, and δ15Nntr are unknown and need to be constrained.
The range of δ15Nntr can be constrained by a simplified interior nitrate cycling model. Ammonium links particles and nitrate in this interior cycling, and there are two different sources of remineralized ammonium in seawater. One is ammonium diffusing from the sediment, and the other is the ammonification of PN in the water column. The ammonium from remineralization through both processes is then nitrified in the water column and is a source of nitrate. The average δ15N values of PN and sediments in the BHS in our study are 5.2 ‰ and 5.4 ‰, respectively. The fractionation factor of ammonification of PN and sediment as the first step of generating recycled nitrate is estimated at 3 ‰ (Sigman and Fripiat, 2019) and 2 ‰ (Möbius, 2013), respectively. The remineralized ammonium from PN and sediments thus should have δ15N values between 2.2 ‰ and 3.4 ‰.
The ammonium concentrations in the BHS are low in the water column in spring and in the surface layer in summer, indicating that the ammonium from PN mineralization is most likely completely converted to nitrate so that there is no fractionation effect for this step. Thus, the δ15N value of newly nitrified nitrate from complete nitrification of ammonium generated by PN mineralization is 2.2 ‰. In the case of incomplete nitrification, especially under the thermocline in summer, the newly nitrified nitrate has a δ15N of 0.2 ‰, given a net fractionation factor of nitrification (ammonium to nitrate) of 2 ‰ (Sigman and Fripiat, 2019). In our model below, the assimilation of ammonium originating from SPM remineralization was not included as its proportion is unknown in the BHS. The simplified model may thus underestimate the input of 15N-depleted nitrogen into the nitrate pool.
Ammonium diffusing out of the sediment will either be mixed into the euphotic layer and subsequently assimilated by the phytoplankton or nitrified in the water column. The accumulation of ammonium beneath the thermocline was a significant process in summer, as shown by the high nitrite and ammonium concentrations beneath the thermocline. The ratio of these two branching processes is not known in the BHS. If all of the ammonium from sediment is nitrified, the produced nitrate will have a δ15N of 3.4 ‰ (see above). If the ammonium is only partially nitrified (especially in summer beneath the thermocline), the produced nitrate will have a δ15N of 1.4 ‰ at a fractionation factor of nitrification of 2 ‰ (Sigman and Fripiat, 2019). Thus, the δ15N value of the nitrate produced by nitrification (δ15Nntr) of ammonium from sediment is in the range of 1.4 ‰–3.4 ‰.
Overall, combining the δ15N ranges of PN- and sediment-originated nitrate, the range of δ15N for newly nitrified nitrate is 0.2 ‰–3.4 ‰.
4.3.2 The coupled N and O budget box model of nitrate
Because the nitrate mass fluxes mN, mntr, and msink cannot be segregated only based on N mass budgets and δ15N values, we turn to the δ18O values of the sources and sinks of nitrate for further constraints. Equation (3) applies if we assume that the oxygen isotope composition of nitrate reflects the steady-state mass fluxes, as does δ15N of the nitrate pool:
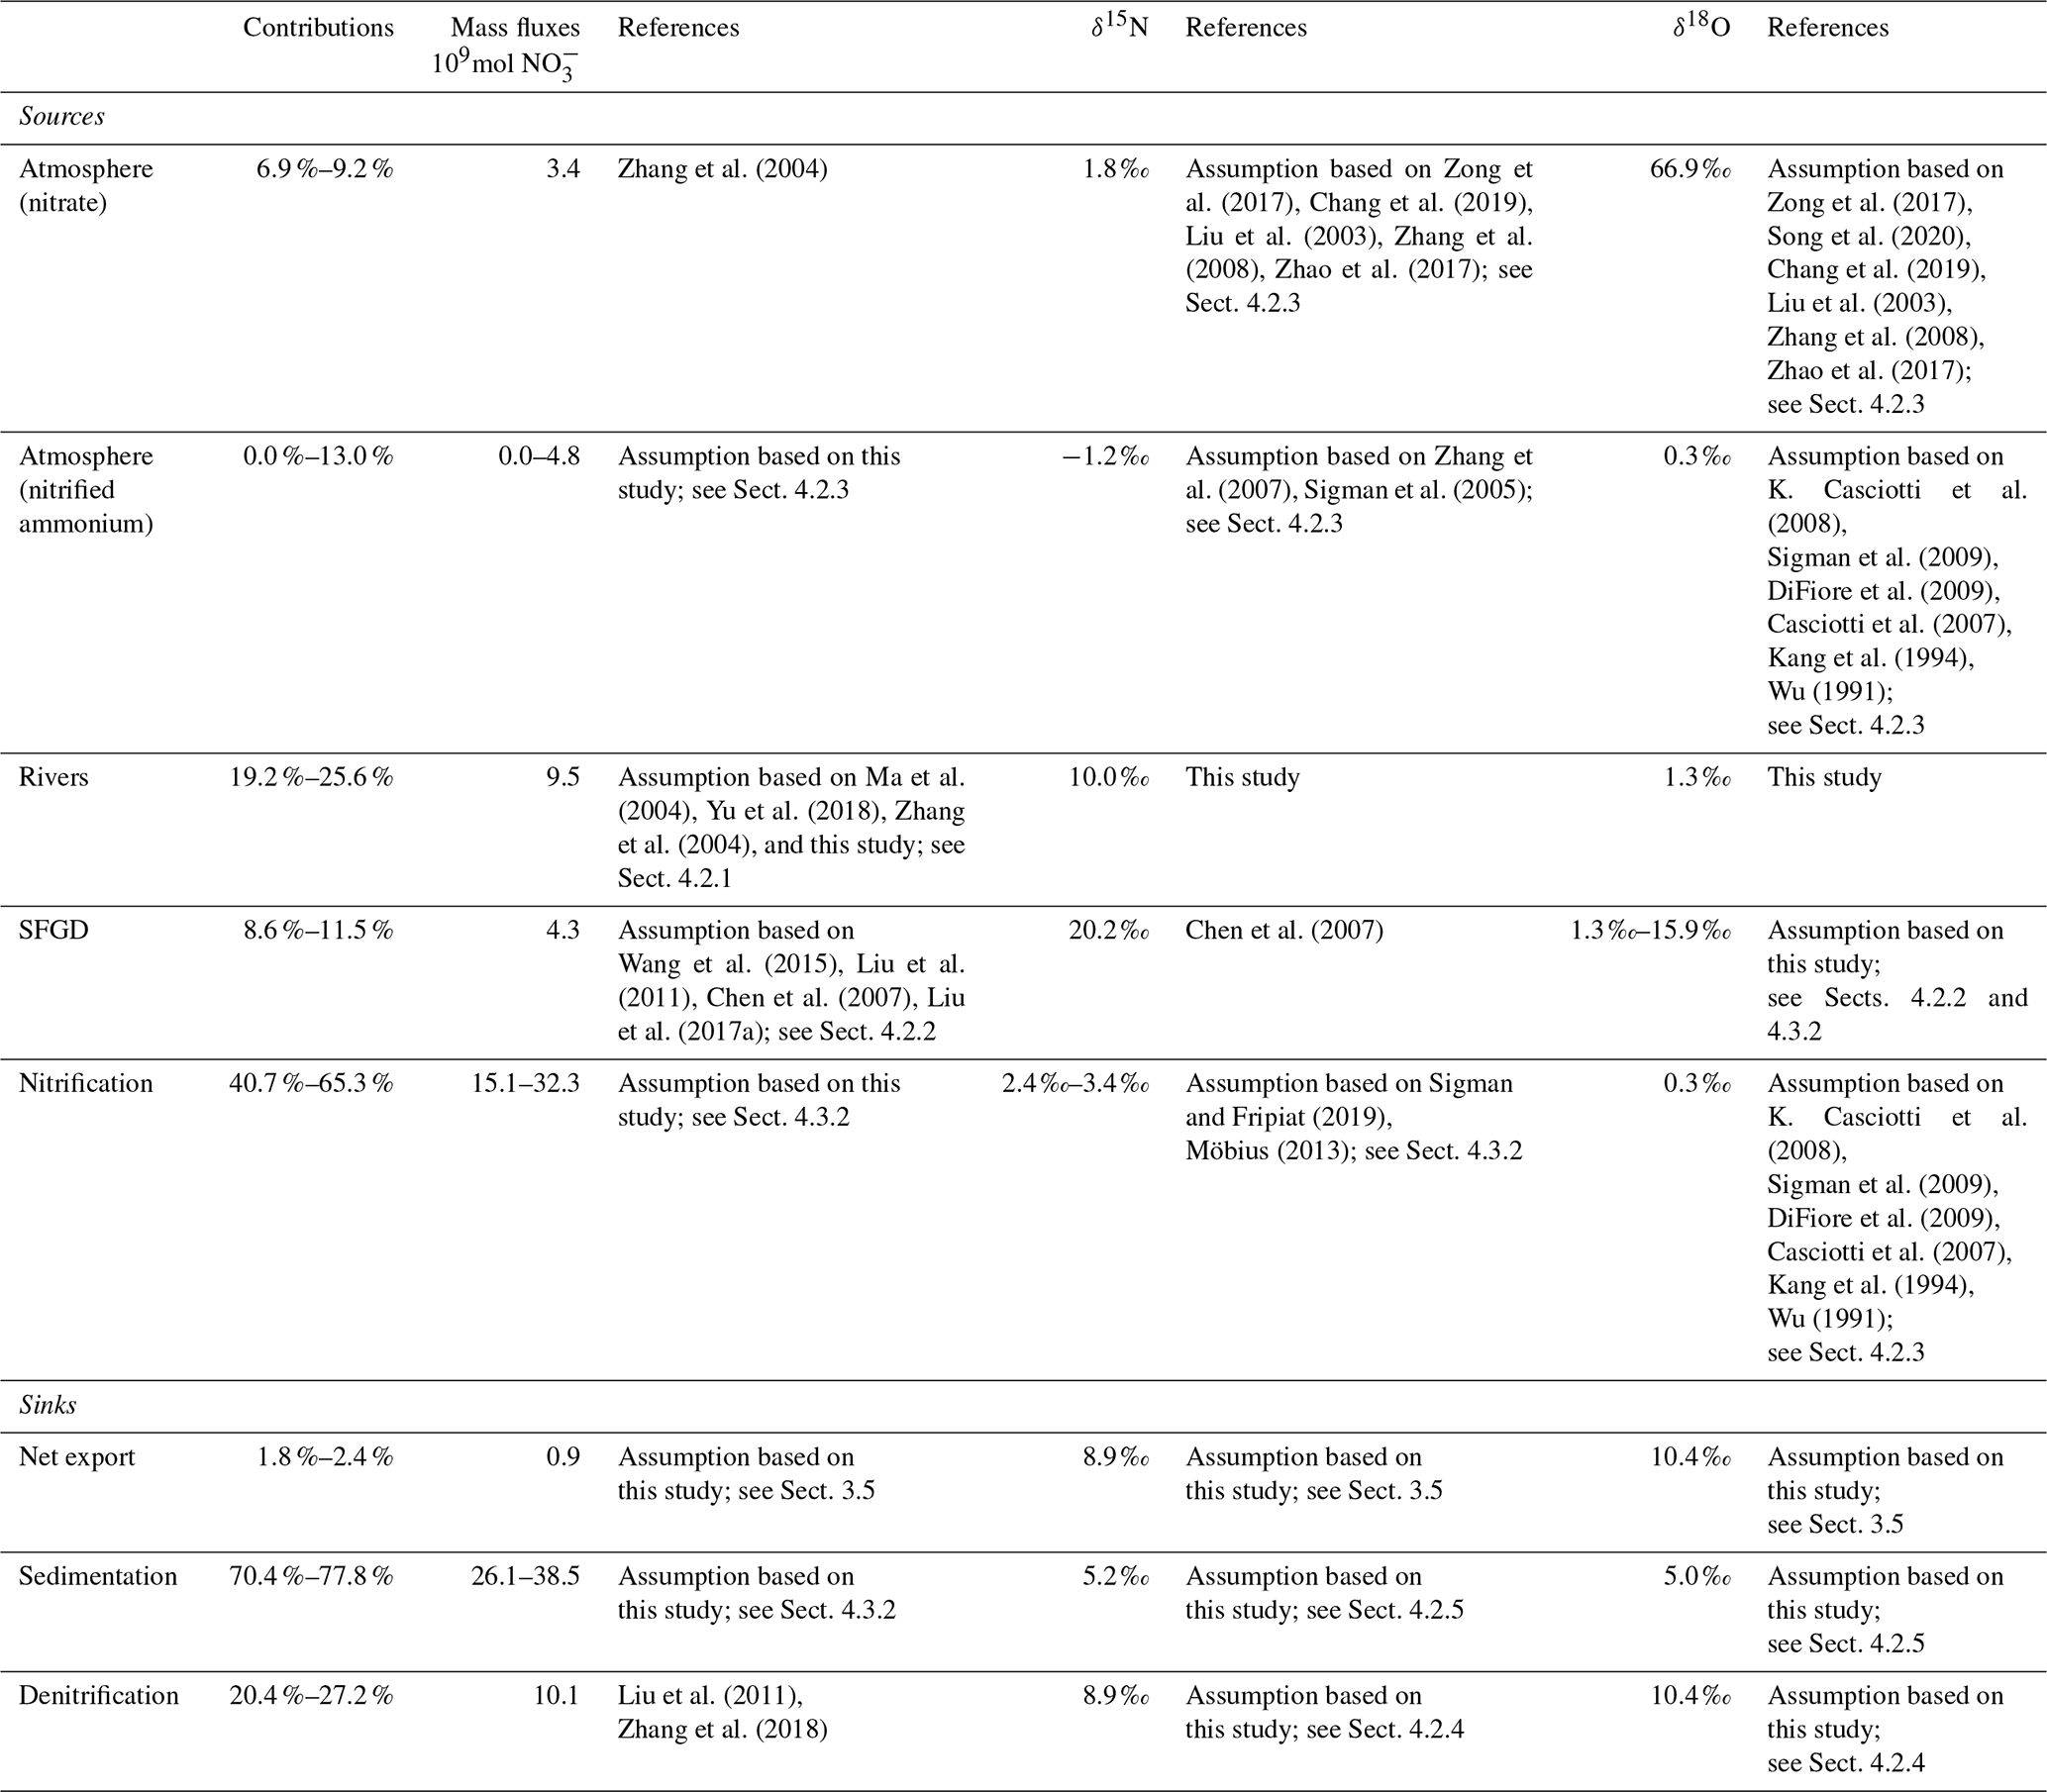
where the δ18O subscripts refer to the nitrate mass flux with the same subscripts. The δ18O of different sources and sinks are either fixed values or ranges of values in our own data, or those taken from the literature (Table 1).
According to Eqs. (1), (2), and (3), the unknown mass fluxes mN, mntr, and msink can be solved by a set of ternary linear equations including the three unknown terms, when appropriate boundary values of δ15Nntr and δ18OSFGD are chosen. δ15Nntr ranged from 0.2 ‰ to 3.4 ‰, as discussed in Sect. 4.3.1, whereas δ18OSFGD is a crucial term without any data or literature constraint. As the only constraint, δ18OSFGD is expected to be higher than the value of nitrate imported from the rivers (δ18Or=1.3 ‰) due to the fractionation associated with denitrification in the anaerobic aquifers (see Sect. 4.2.2). The results can be summed up in three different cases.
-
When setting the value of δ15Nntr to 3.4 ‰, we obtain estimates for mN that range from 0.00 to 4.83 × 10⁹ mol yr−1, for mntr in the range of 15.08 to 32.27 × 10⁹ mol yr−1, and msink in the range of 26.08 to 38.45 × 10⁹ mol yr−1. The corresponding values of δ18OSFGD range from 1.3 ‰ to 15.9 ‰, and the upper range of δ18OSFGD yields mN=0.0 due to the assumption that any mass flux must be equal to or greater than 0.
-
When we choose a δ15Nntr value of 3.2 ‰–2.4 ‰ to explore effects of the methodological error of δ15N for our isotope method (0.2 ‰; see Sect. 2.2), again under the premise that the mass fluxes are positive numbers, the result is mN, mntr, and msink estimates in a narrower range than when δ15Nntr is 3.4 ‰; these results are not shown.
-
The δ15Nntr values lower than 2.4 ‰ result in δ18OSFGD lower than 1.3 ‰, which is highly unlikely.
Thus, reasonable solutions only are reached when δ15Nntr is between 3.4 ‰ and 2.4 ‰. The results of the budget are shown in Fig. 10 and Table 1, respectively.
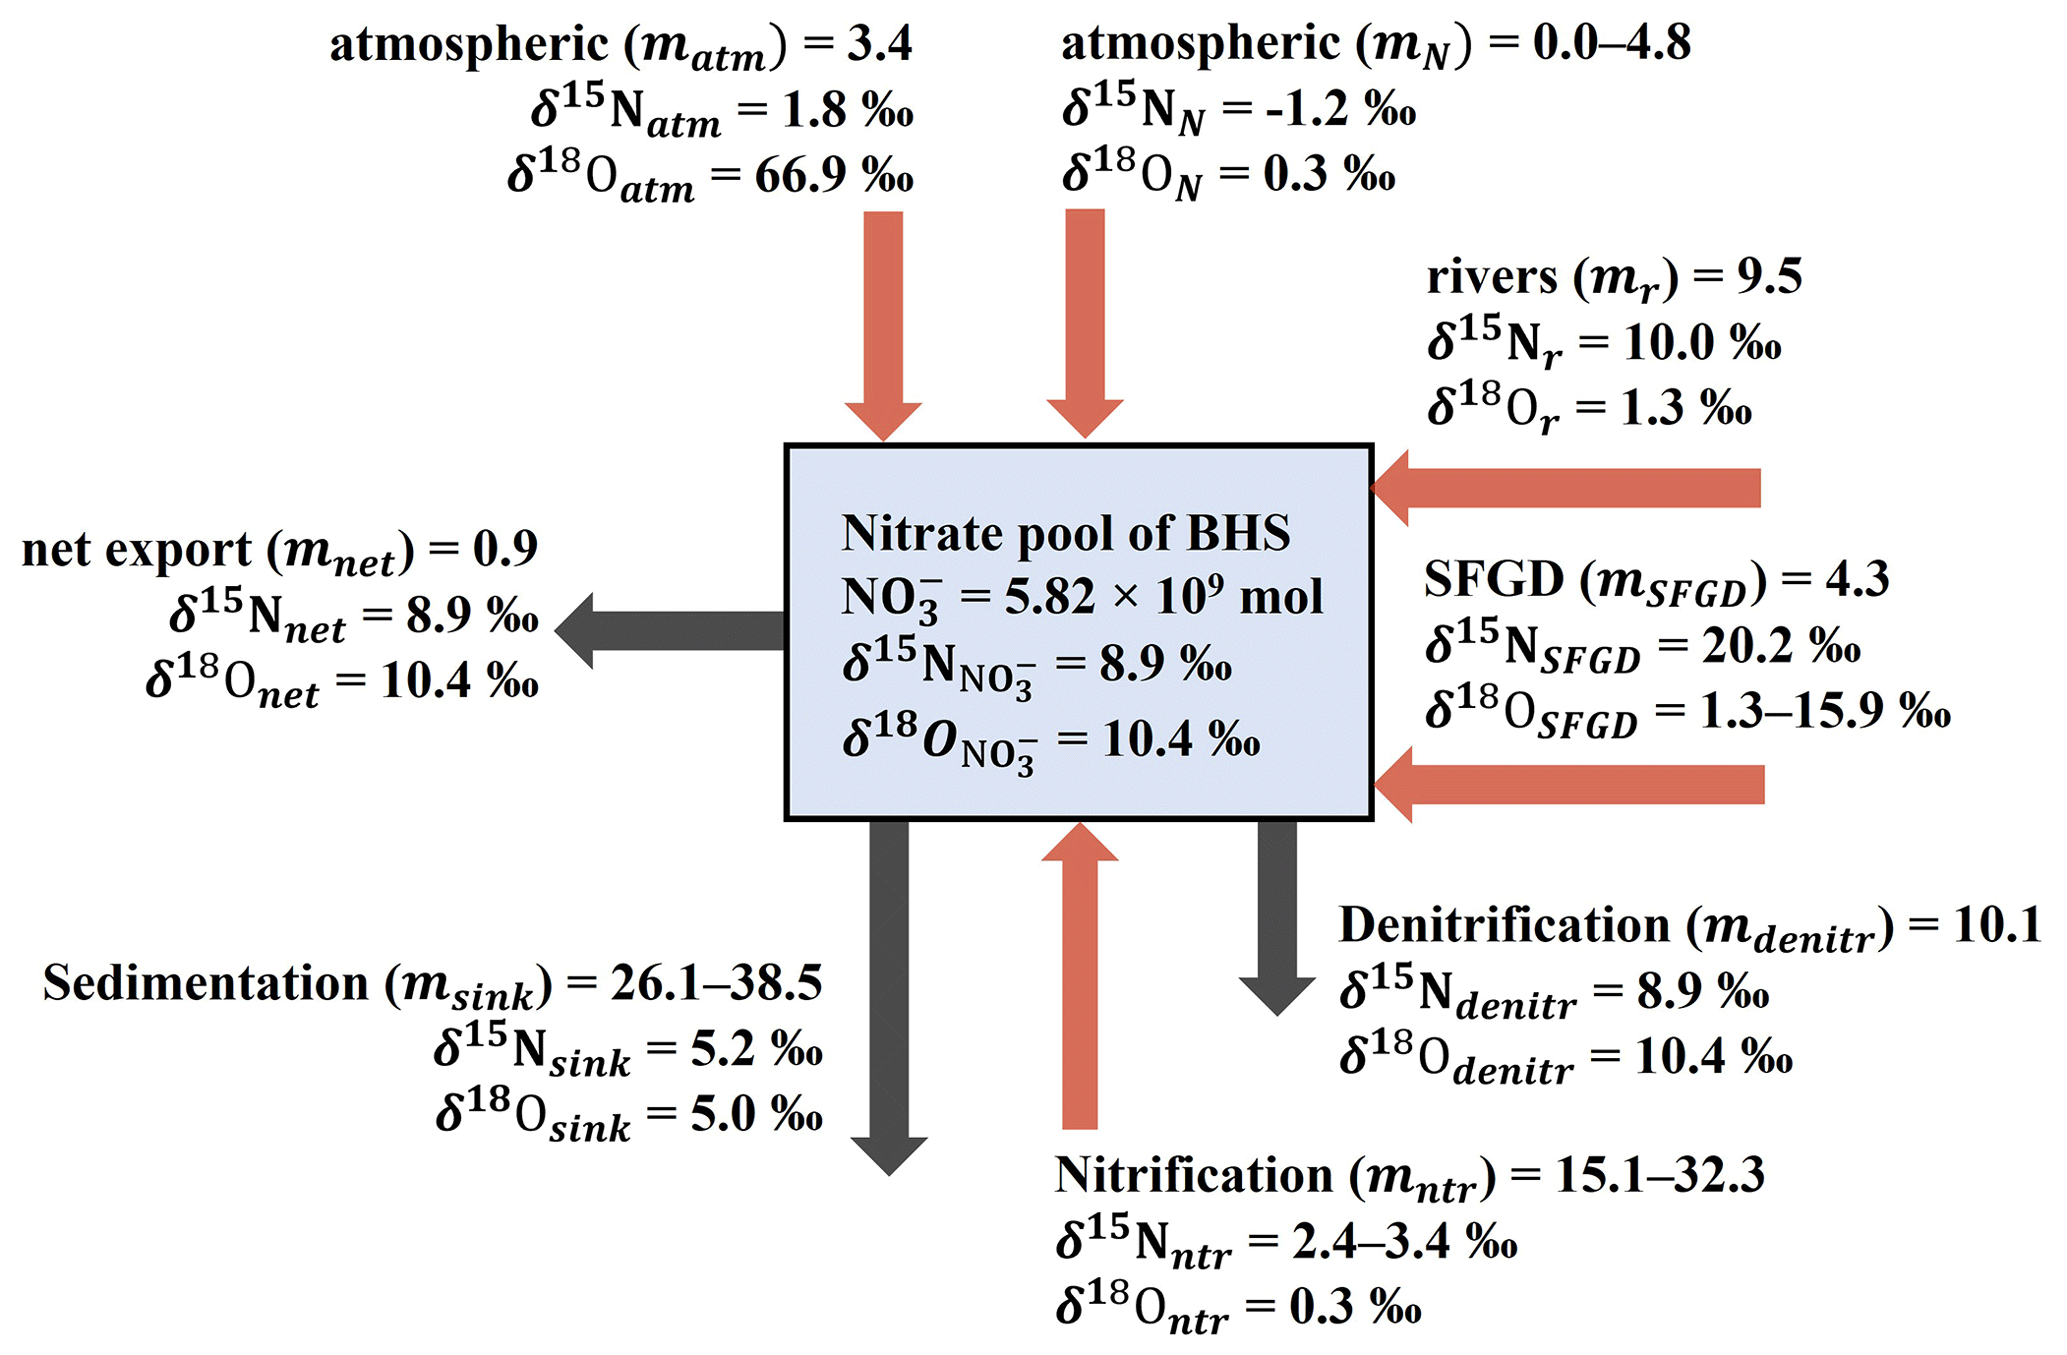
Figure 10The budgets and the corresponding dual isotope values of nitrate in the BHS in 2018. The terms included are discussed in the text in Sect. 4.3. The unit of mass flux is 109 mol yr−1.
Table 1Sources and sinks and the corresponding δ15N and δ18O values of nitrate in the BHS.
The mass flux of nitrate (mN) originating from the nitrification of atmospheric ammonium ranges from 0.00 to 4.83 × 10⁹ mol yr−1 and accounts for up to 79 % of the total ammonium deposition (6.15 × 10⁹ mol yr−1; Zhang et al., 2004). This in turn implies that most of the atmospherically deposited ammonium is directly assimilated rather than nitrified to nitrate. This agrees with phytoplankton preference to assimilate ammonium rather than nitrate (Glibert et al., 2016). The bulk of internal sources of nitrate originates from nitrification in the water column (from water column ammonification and ammonium diffusing from sediment). This single source (mntr) accounts for 40.7 %–65.3 % of the total sources of nitrate in BHS and appears to be much more important than in other coastal environments. For example, between 15 % and 27 % of productivity was supported by nitrified ammonium in the seawater in Monterey Bay (Wankel et al., 2007). Likewise, nitrification supplied 34 % of the surface nitrate in eastern Hainan Island, which like Monterey Bay is also an upwelling area (Chen et al., 2020). This indicates that nitrate regeneration by nitrification may play a more important role in shallow and land-input-dominated marginal seas than in upwelling-dominated marine settings.
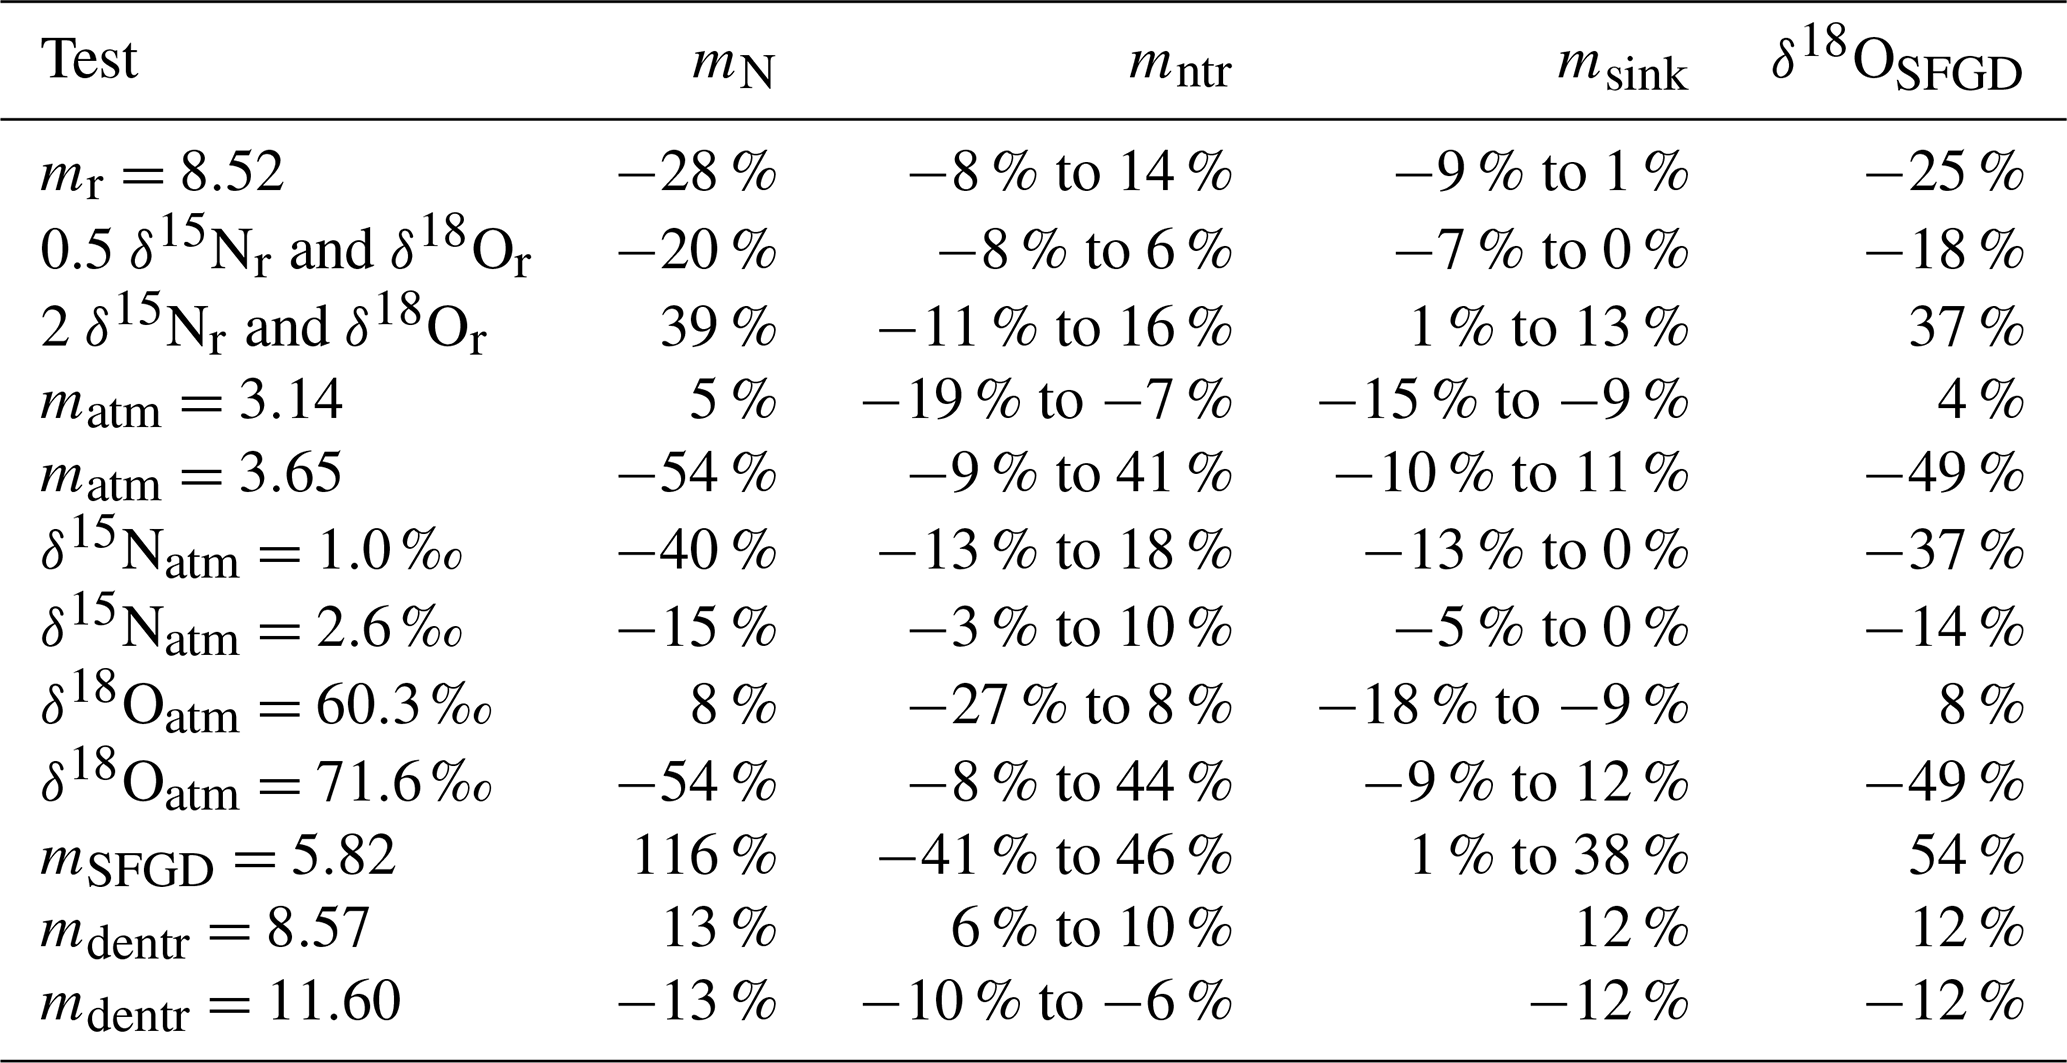
Table 2Results of sensitivity tests on mass fluxes and isotopes.
4.3.3 Assessment of model uncertainties
The uncertainties of the modeled nitrate mass and isotope budget lie essentially in some of the mass flux estimates and in possibly erroneous assumptions on values of δ15N and δ18O in some of the sources and sinks. In the sensitivity test, the three critical mass fluxes mN, mntr, and msink and the upper limit value of δ18OSFGD change correspondingly when only one single term or one group of terms change (i.e., mass flux or isotope value). Note that the lower limits of mN and δ18OSFGD are fixed as 0 ‰ and 1.3 ‰, respectively, so that only the relative deviations of their upper limits are discussed below. The results are given in relative deviation to our best estimates in the budget. In addition, the widest ranges of mass fluxes and δ18OSFGD are covered when δ15Nntr=3.4 ‰ in the standard budget; thus we only compare the deviations when δ15Nntr=3.4 ‰.
River input of nitrate is 9.49 × 10⁹ mol in the year 2018 as suggested above. Considering that the river fluxes are variable annually, we also adopt the multi-year average value (1952–2015) water discharge of the YR of 292.8 km3 instead of 333.8 km3 in 2018 (MWR, China, 2019). Hence the annual nitrate discharge is 8.52 × 10⁹ mol and is 10 % less than our preferred estimate; the resulting relative deviations are shown in Table 2. With respect to the isotope composition of the river nitrate, our observations suggest that the nitrate δ15N and δ18O of the YR changed little during the sampling period. On the other hand, the average values of nitrate δ15N and δ18O for rivers are mass weighted instead of arithmetic mean values so that a change in nitrate δ15N and δ18O for rivers with low nitrate discharges would induce little change in the average values. Considering the wide variations in the riverine dual nitrate isotopes around the BHS (Yu et al., 2021; Yue et al., 2013), we tested situations in which the dual nitrate isotope values of the smaller rivers are 0.5 and 2 times our observed values (Table 2: 0.5 δ15Nr and δ18Or, 2 δ15Nr and δ18Or). The results suggest that the budget is particularly sensitive to higher δ15Nr and δ18Or than assumed in our preferred model.
We consider the mass flux of atmospheric deposition of nitrate to be reliable because differences in estimates from previous studies are quite small. According to these previous estimates (Zhao et al., 2017; Liu et al., 2003), we adopt the minimum and maximum in mass flux of 3.14 × 10⁹ mol to 3.65 × 10⁹ mol for uncertainty estimates. For δ15Natm, we test the values 1.0 ‰ and 2.6 ‰ according to the variable proportion of wet/dry deposition with different δ15N endmembers. Likewise, δ18Oatm was varied in the range of 60.3 ‰–71.6 ‰.
The flux of SFGD into the BHS varies in the range of 2.68 × 10⁹ to 5.82 × 10⁹ mol, which is mainly due to the different SFGD water fluxes assumed in our budget. Only if mSFGD is assumed to be >2.90 × 10⁹ mol do the results match our assumption. When mSFGD=5.82 × 10⁹ mol, the relative deviations are large (Table 2), implying that our budget is very sensitive to mSFGD.
The flux of denitrification in the BHS has a confidence interval of 15 % (Zhang et al., 2018), resulting in the mdentr ranging from 8.57 × 10⁹ to 11.60 × 10⁹ mol. The results of tests with these two fluxes are shown in Table 2.
Overall, these tests indicate that mN and δ18OSFGD vary by ± 50 % and are particularly sensitive to uncertainties of the assumed endmembers, whereas the relative deviations of mntr and msink normally vary in the range of ± 20 %. Uncertainties will be significantly reduced if any of these terms can be constrained by further empirical studies.
4.3.4 Biogeochemical implications of the box model
In other coastal eutrophic regions, such as the North Sea, a high δ15N of river nitrate is reflected in a halo of high δ15N in surface sediments in offshore areas (Pätsch et al., 2010). In the Bohai Sea, such an isotopic halo of river-borne eutrophication is not observed despite similar water exchange rates of 1–2 years (Li et al., 2015; Serna et al., 2010) and similarly isotopically enriched river inputs. We speculate that the lack of a fingerprint of river nitrate in the δ15N of sediments of BHS may be masked by active nitrification and atmospheric deposition that rapidly eradicate and homogenize spatial gradients.
Despite the uncertainties that are related to the box model approach, combining mass and isotope budgets of nitrate sources and sinks is clearly superior to solely nitrate mass balance considerations, especially when it comes to segregating the anthropogenic nitrate and the recycled nitrate inputs. It is of note that the BHS does not appear to pass on significant amounts of nitrate to the adjacent northern YS with the result that the effects of excessive loading of this shallow mixing zone between land and ocean with anthropogenic nitrogen are mitigated by internal cycling processes.
Rivers contributed 19.2 %–25.6 % of the total nitrate input to the BHS, and the combined terrestrial runoff (including submarine discharge of nitrate with fresh groundwater) accounts for 27.8 %–37.1 %. Atmospheric input contributes 6.9 %–22.2 % of nitrate to the BHS. Nitrification contributes 40.7 %–65.3 % of the total nitrate, indicating an unusually active interior nitrogen cycling in the BHS. Nitrate was mainly trapped in the BHS, and only very little was exported to the YS (only 1.8 %–2.4 %). Furthermore, nitrate was rather assimilated than exported to the YS along the main transport pathway Lubei Coastal Current, effectively retaining Nr in BHS. Sedimentation trapped 70.4 %–77.8 % of nitrate inputs, whereas denitrification was only active in the sediments that removed 20.4 %–27.2 % of nitrate from the pool. Seasonal biogeochemical variations were observed in the BHS in that dissolved inorganic nitrogen increased during summer under the thermocline, implying significant biological regeneration. If the interior cycling increases, for instance fueled by increased terrestrial and atmospheric Nr inputs, respiration coupled to organic matter and N recycling will increase, and water column hypoxia could consequently spread in the future and compromise ecosystems in the BHS. Whether this will invigorate water column denitrification to balance the additional inputs is an open question, as is the capacity of BHS as a nitrate buffer between the growing source of Nr on land and the open ocean.
Nitrate was reduced to nitrite with a copperized cadmium column first. The nitrite ions reacted with sulfanilamide and N-1-naphthylethylendediamine (NEDD) to form red azo dye and then was measured at 520–560 nm. Phosphate determination followed the method of Murphy and Riley (Murphy and Riley, 1962). Under acid conditions a phosphomolybdic complex was formed of orthophosphate, antimony, and molybdate ions (Wurl, 2009). Followed by the reduction of ascorbic acid, the blue color complex was measured at 880 nm. The sample with ammonium is reacted with o-phthalaldehyde (OPA) at 75 ∘C in the presence of borate buffer and sodium sulfite to form a fluorescent species proportional to the ammonia concentration. The fluorescence is measured at 460 nm following excitation at 370 nm (Kérouel and Aminot, 1997). Silicate is reacted with ammonium molybdate to silicomolybdate and reduced in acidic solution to molybdenum blue by ascorbic acid (Grasshoff et al., 2009).
The data are available from the corresponding author upon request.
The supplement related to this article is available online at: https://doi.org/10.5194/bg-19-2397-2022-supplement.
BG and KCE designed the study. ST collected the samples on board. JT and YL supported the sampling on cruises and field trips. ST, NL, and TS analyzed samples. TX and WZ supplied the dissolved oxygen data. WL ran the HAMSOM model and calculated water mass exchanges. ST, BG, KCE, and KD interpreted the data. ST prepared the manuscript with input from all co-authors.
The contact author has declared that neither they nor their co-authors have any competing interests.
Publisher’s note: Copernicus Publications remains neutral with regard to jurisdictional claims in published maps and institutional affiliations.
The study was part of the project FINGBOYEL carried out within the MEGAPOL consortium and financed by the German Federal Ministry of Education and Research (BMBF). We thank the crew of the Chinese research vessel Dongfanghong 2 for their support of our work on board. We are indebted to Yuan Li from Yantai Institute of Coastal Zone Research for sampling the Yellow River. We thank Markus Ankele and Frauke Langenberg for their support of the nutrient and stable isotope analyses.
This research has been supported by the Bundesministerium für Bildung und Forschung (grant no. 03F07686B).
This paper was edited by Aninda Mazumdar and reviewed by three anonymous referees.
Altabet, M. A.: Isotopic tracers of the marine nitrogen cycle: present and past, in: Marine organic matter: biomarkers, isotopes and DNA, Springer, 251–293, https://doi.org/10.1007/698_2_008, 2006.
Backhaus, J. O.: A three-dimensional model for the simulation of shelf sea dynamics, Dtsch. Hydrogr. Zetischrift, 38, 165–187, https://doi.org/10.1007/BF02328975, 1985.
Benson, B. B. and Krause Jr., D.: The concentration and isotopic fractionation of oxygen dissolved in freshwater and seawater in equilibrium with the atmosphere 1, Limnol. Oceanogr., 29, 620–632, https://doi.org/10.4319/lo.1984.29.3.0620, 1984.
Casciotti, K., Trull, T., Glover, D., and Davies, D.: Constraints on nitrogen cycling at the subtropical North Pacific Station ALOHA from isotopic measurements of nitrate and particulate nitrogen, Deep-Sea Res. Pt. II, 55, 1661–1672, 2008.
Casciotti, K. L., Sigman, D. M., Hastings, M. G., Böhlke, J., and Hilkert, A.: Measurement of the oxygen isotopic composition of nitrate in seawater and freshwater using the denitrifier method, Anal. Chem., 74, 4905–4912, https://doi.org/10.1021/ac020113w, 2002.
Casciotti, K. L., Böhlke, J. K., McIlvin, M. R., Mroczkowski, S. J., and Hannon, J. E.: Oxygen isotopes in nitrite: Analysis, calibration, and equilibration, Anal. Chem., 79, 2427–2436, https://doi.org/10.1021/ac061598h, 2007.
Casciotti, K. L., Trull, T. W., Glover, D. M., and Davies, D.: Constraints on nitrogen cycling at the subtropical North Pacific Station ALOHA from isotopic measurements of nitrate and particulate nitrogen, Deep-Sea Res. Pt. II, 55, 1661–1672, https://doi.org/10.1016/j.dsr2.2008.04.017, 2008.
Chang, Y., Zhang, Y.-L., Li, J., Tian, C., Song, L., Zhai, X., Zhang, W., Huang, T., Lin, Y.-C., Zhu, C., Fang, Y., Lehmann, M. F., and Chen, J.: Isotopic constraints on the atmospheric sources and formation of nitrogenous species in clouds influenced by biomass burning, Atmos. Chem. Phys., 19, 12221–12234, https://doi.org/10.5194/acp-19-12221-2019, 2019.
Chen, C.-T. A.: Chemical and physical fronts in the Bohai, Yellow and East China seas, J. Mar. Syst., 78, 394–410, https://doi.org/10.1016/j.jmarsys.2008.11.016, 2009.
Chen, F., Chen, J., Jia, G., Jin, H., Xu, J., Yang, Z., Zhuang, Y., Liu, X., and Zhang, H.: Nitrate ä 15N and ä 18O evidence for active biological transformation in the Changjiang Estuary and the adjacent East China Sea, Acta Oceanol. Sin., 32, 11–17, https://doi.org/10.1007/s13131-013-0294-4, 2013.
Chen, F., Lao, Q., Zhang, S., Bian, P., Jin, G., Zhu, Q., and Chen, C.: Nitrate sources and biogeochemical processes identified using nitrogen and oxygen isotopes on the eastern coast of Hainan Island, Cont. Shelf Res., 207, 104209, https://doi.org/10.1016/j.csr.2020.104209, 2020.
Chen, J., Taniguchi, M., Liu, G., Miyaoka, K., Onodera, S.-I., Tokunaga, T., and Fukushima, Y.: Nitrate pollution of groundwater in the Yellow River delta, China, Hydrogeol. J., 15, 1605–1614, https://doi.org/10.1007/s10040-007-0196-7, 2007.
Copernicus Climate Change Service: ERA5: Fifth generation of ECMWF atmospheric reanalyses of the global climate, Copernicus Climate Change Service Climate Data Store (CDS), https://cds.climate.copernicus.eu/cdsapp#!/home (last access: 30 April 2022), 2017.
Devol, A. H.: Denitrification, Anammox, and N2 Production in Marine Sediments, Ann. Rev. Mar. Sci., 7, 403–423, https://doi.org/10.1146/annurev-marine-010213-135040, 2015.
DiFiore, P. J., Sigman, D. M., Trull, T. W., Lourey, M. J., Karsh, K., Cane, G., and Ho, R.: Nitrogen isotope constraints on subantarctic biogeochemistry, J. Geophys. Res.-Oean., 111, C08016, https://doi.org/10.1029/2005JC003216, 2006.
DiFiore, P. J., Sigman, D. M., and Dunbar, R. B.: Upper ocean nitrogen fluxes in the Polar Antarctic Zone: Constraints from the nitrogen and oxygen isotopes of nitrate, Geochem. Geophy. Geosy., 10, Q11016, https://doi.org/10.1029/2009GC002468, 2009.
Egbert, G. D., and Erofeeva, S. Y.: Efficient inverse modeling of barotropic ocean tides, J. Atmos. Ocean. Tech., 19, 183–204, https://doi.org/10.1175/1520-0426(2002)019<0183:EIMOBO>2.0.CO;2, 2002.
Emeis, K. C., Mara, P., Schlarbaum, T., Möbius, J., Dähnke, K., Struck, U., Mihalopoulos, N., and Krom, M.: External N inputs and internal N cycling traced by isotope ratios of nitrate, dissolved reduced nitrogen, and particulate nitrogen in the eastern Mediterranean Sea, J. Geophys. Res.-Biogeo., 115, G04041, https://doi.org/10.1029/2009JG001214, 2010.
Fan, M.-Y., Zhang, Y.-L., Lin, Y.-C., Chang, Y.-H., Cao, F., Zhang, W.-Q., Hu, Y.-B., Bao, M.-Y., Liu, X.-Y., Zhai, X.-Y., Lin, X., Zhao, Z.-Y., and Song, W.-H.: Isotope-based source apportionment of nitrogen-containing aerosols: A case study in an industrial city in China, Atmos. Environ., 212, 96–105, https://doi.org/10.1016/j.atmosenv.2019.05.020, 2019.
Fowler, D., Coyle, M., Skiba, U., Sutton, M. A., Cape, J. N., Reis, S., Sheppard, L. J., Jenkins, A., Grizzetti, B., Galloway, J. N., Vitousek, P., Leach, A., Bouwman, A. F., Butterbach-Bahl, K., Dentener, F., Stevenson, D., Amann, M., and Voss, M.: The global nitrogen cycle in the twenty-first century, Philos. T. R. Soc. B, 368, 20130164, https://doi.org/10.1098/rstb.2013.0164, 2013.
Glibert, P. M., Wilkerson, F. P., Dugdale, R. C., Raven, J. A., Dupont, C. L., Leavitt, P. R., Parker, A. E., Burkholder, J. M., and Kana, T. M.: Pluses and minuses of ammonium and nitrate uptake and assimilation by phytoplankton and implications for productivity and community composition, with emphasis on nitrogen-enriched conditions, Limnol. Oceanogr., 61, 165–197, https://doi.org/10.1002/lno.10203, 2016.
Granger, J. and Sigman, D. M.: Removal of nitrite with sulfamic acid for nitrate N and O isotope analysis with the denitrifier method, Rapid Commun. Mass Spectrom., 23, 3753–3762, https://doi.org/10.1002/rcm.4307, 2009.
Granger, J., Sigman, D. M., Rohde, M., Maldonado, M., and Tortell, P.: N and O isotope effects during nitrate assimilation by unicellular prokaryotic and eukaryotic plankton cultures, Geochim. Cosmochim. Ac., 74, 1030–1040, https://doi.org/10.1016/j.gca.2009.10.044, 2010.
Grasshoff, K., Kremling, K., and Ehrhardt, M.: Methods of seawater analysis, John Wiley & Sons, Cambridge University Press, https://doi.org/10.1017/S0025315400028216, 2009.
Gu, B., Ju, X., Chang, J., Ge, Y., and Vitousek, P. M.: Integrated reactive nitrogen budgets and future trends in China, P. Natl. Acad. Sci. USA, 112, 8792, https://doi.org/10.1073/pnas.1510211112, 2015.
Hainbucher, D., Hao, W., Pohlmann, T., Sündermann, J., and Feng, S.: Variability of the Bohai Sea circulation based on model calculations, J. Mar. Syst., 44, 153–174, https://doi.org/10.1016/j.jmarsys.2003.09.008, 2004.
Huang, D., Su, J., and Backhaus, J. O.: Modelling the seasonal thermal stratification and baroclinic circulation in the Bohai Sea, Cont. Shelf Res., 19, 1485–1505, https://doi.org/10.1016/S0278-4343(99)00026-6, 1999.
IFA: Short-Term Fertilizer Outlook 2019–2020, Versailles, 8, IFA Strategic Forum, https://api.ifastat.org/reports/download/12796 (last access: 30 April 2022), 2019.
Jia, B., and Chen, X. E.: Application of an ice-ocean coupled model to Bohai Sea ice simulation, J. Oceanol. Limnol., 39, 1–13, https://doi.org/10.1007/s00343-020-9168-8, 2021.
Kang, D.-J., Chung, C. S., Kim, S. H., Hong, G. H., and Kim, K.-R.: Oxygen isotope characteristics of seawaters in the Yellow Sea, La Mer, 32, 279–284, 1994.
Kérouel, R. and Aminot, A.: Fluorometric determination of ammonia in sea and estuarine waters by direct segmented flow analysis, Mar. Chem., 57, 265–275, https://doi.org/10.1016/S0304-4203(97)00040-6, 1997.
Kim, H., Park, G.-H., Lee, S.-E., Kim, Y.-i., Lee, K., Kim, Y.-H., and Kim, T.-W.: Stable isotope ratio of atmospheric and seawater nitrate in the East Sea in the northwestern Pacific ocean, Mar. Pollut. Bull., 149, 110610, https://doi.org/10.1016/j.marpolbul.2019.110610, 2019.
Lehmann, M. F., Sigman, D. M., and Berelson, W. M.: Coupling the 15N 14N and 18O 16O of nitrate as a constraint on benthic nitrogen cycling, Mar. Chem., 88, 1–20, https://doi.org/10.1016/j.marchem.2004.02.001, 2004.
Lellouche, J. M., Legalloudec, O., Regnier, C., Levier, B., Greiner, E., and Drevillon, M.: QUALITY INFORMATION DOCUMENT For Global Sea Physical Analysis and Forecasting Product, GLOBAL_ANALYSIS_FORECAST_PHY_001_024, EU Copernicus Marine Service, https://catalogue.marine.copernicus.eu/documents/QUID/CMEMS-GLO-QUID-001-024.pdf (last access: 30 April 2022), 2019.
Li, Y., Wolanski, E., and Zhang, H.: What processes control the net currents through shallow straits? A review with application to the Bohai Strait, China, Estuar. Coast. Shelf Sci., 158, 1–11, https://doi.org/10.1016/j.ecss.2015.03.013, 2015.
Li, Y., Yan, W., Wang, F., Lv, S., Li, Q., and Yu, Q.: Nitrogen pollution and sources in an aquatic system at an agricultural coastal area of Eastern China based on a dual-isotope approach, Environ. Sci. Pollut. Res., 26, 23807–23823, https://doi.org/10.1007/s11356-019-05665-2, 2019.
Li, Z., Walters, W. W., Hastings, M. G., Zhang, Y., Song, L., Liu, D., Zhang, W., Pan, Y., Fu, P., and Fang, Y.: Nitrate Isotopic Composition in Precipitation at a Chinese Megacity: Seasonal Variations, Atmospheric Processes, and Implications for Sources, Earth Space Sci., 6, 2200–2213, https://doi.org/10.1029/2019EA000759, 2019.
Liu, J., Du, J., and Yi, L.: Ra Tracer-Based Study of Submarine Groundwater Discharge and Associated Nutrient Fluxes into the Bohai Sea, China: A Highly Human-Affected Marginal Sea, J. Geophys. Res.-Oean., 122, 8646–8660, https://doi.org/10.1002/2017JC013095, 2017.
Liu, S., Hong, G.-H., Zhang, J., Ye, X., and Jiang, X.: Nutrient budgets for large Chinese estuaries, Biogeosciences, 6, 2245–2263, https://doi.org/10.5194/bg-6-2245-2009, 2009.
Liu, S. M., Zhang, J., and Jiang, W. S.: Pore water nutrient regeneration in shallow coastal Bohai Sea, China, J. Oceanogr., 59, 377–385, https://doi.org/10.1023/A:1025576212927, 2003.
Liu, S. M., Li, L. W., and Zhang, Z.: Inventory of nutrients in the Bohai, Cont. Shelf Res., 31, 1790–1797, https://doi.org/10.1016/j.csr.2011.08.004, 2011.
Liu, S. M., Altabet, M. A., Zhao, L., Larkum, J., Song, G. D., Zhang, G. L., Jin, H., and Han, L. J.: Tracing Nitrogen Biogeochemistry During the Beginning of a Spring Phytoplankton Bloom in the Yellow Sea Using Coupled Nitrate Nitrogen and Oxygen Isotope Ratios, J. Geophys. Res.-Biogeo., 122, 2490–2508, https://doi.org/10.1002/2016jg003752, 2017.
Liu, S. M., Ning, X., Dong, S., Song, G., Wang, L., Altabet, M. A., Zhu, Z., Wu, Y., Ren, J. L., and Liu, C. G.: Source Versus Recycling Influences on the Isotopic Composition of Nitrate and Nitrite in the East China Sea, J. Geophys. Res.-Ocean., 125, e2020JC016061, https://doi.org/10.1029/2020JC016061, 2020.
Lu, C. and Tian, H.: Global nitrogen and phosphorus fertilizer use for agriculture production in the past half century: shifted hot spots and nutrient imbalance, Earth Syst. Sci. Data, 9, 181–192, https://doi.org/10.5194/essd-9-181-2017, 2017.
Luo, X. and Jiao, J. J.: Submarine groundwater discharge and nutrient loadings in Tolo Harbor, Hong Kong using multiple geotracer-based models, and their implications of red tide outbreaks, Water Res., 102, 11–31, https://doi.org/10.1016/j.watres.2016.06.017, 2016.
Ma, S., Xin, F., Cui, Y., and Qiao, X.: Assessment of Main Pollution Matter Volume into the Sea from Yellow River and Xiaoqing Rive, Prog. Fish. Sci., 25, 47–51, https://doi.org/10.3969/j.issn.1000-7075.2004.05.009, 2004 (in Chines).
Möbius, J.: Isotope fractionation during nitrogen remineralization (ammonification): Implications for nitrogen isotope biogeochemistry, Geochim. Cosmochim. Ac., 105, 422–432, https://doi.org/10.1016/j.gca.2012.11.048, 2013.
Montoya, J. P., Carpenter, E. J., and Capone, D. G.: Nitrogen fixation and nitrogen isotope abundances in zooplankton of the oligotrophic North Atlantic, Limnol. Oceanogr., 47, 1617–1628, https://doi.org/10.4319/lo.2002.47.6.1617, 2002.
Müller Schmied, H., Eisner, S., Franz, D., Wattenbach, M., Portmann, F. T., Flörke, M., and Döll, P.: Sensitivity of simulated global-scale freshwater fluxes and storages to input data, hydrological model structure, human water use and calibration, Hydrol. Earth Syst. Sci., 18, 3511–3538, https://doi.org/10.5194/hess-18-3511-2014, 2014.
Murphy, J. and Riley, J. P.: A modified single solution method for the determination of phosphate in natural waters, Anal. Chim. Acta, 27, 31–36, 1962.
MWR, China: China Water Resources Bulletin, China Water & Power Press, Beijing, http://mwr.gov.cn/sj/tjgb/zghlnsgb/ (last access: 30 April 2022), 2015–2018.
MWR, China: China River Sediment Bulletin 2018, China Water & Power Press, http://mwr.gov.cn/sj/tjgb/zghlnsgb/201906/t20190618_1342326.html (last access: 30 April 2022), 2019.
Ning, X., Lin, C., Su, J., Liu, C., Hao, Q., Le, F., and Tang, Q.: Long-term environmental changes and the responses of the ecosystems in the Bohai Sea during 1960–1996, Deep-Sea Res. Pt. II, 57, 1079–1091, https://doi.org/10.1016/j.dsr2.2010.02.010, 2010.
Pätsch, J., Serna, A., Dähnke, K., Schlarbaum, T., Johannsen, A., and Emeis, K.-C.: Nitrogen cycling in the German Bight (SE North Sea)—Clues from modelling stable nitrogen isotopes, Cont. Shelf Res., 30, 203–213, https://doi.org/10.1016/j.csr.2009.11.003, 2010.
Peterson, R. N., Burnett, W. C., Taniguchi, M., Chen, J., Santos, I. R., and Ishitobi, T.: Radon and radium isotope assessment of submarine groundwater discharge in the Yellow River delta, China, J. Geophys. Res.-Oean., 113, C09021, https://doi.org/10.1029/2008JC004776, 2008.
Schlitzer, R.: Ocean Data View, https://odv.awi.de (last access: 30 April 2022), 2021.
Serna, A., Pätsch, J., Dähnke, K., Wiesner, M. G., Hass, H. C., Zeiler, M., Hebbeln, D., and Emeis, K.-C.: History of anthropogenic nitrogen input to the German Bight/SE North Sea as reflected by nitrogen isotopes in surface sediments, sediment cores and hindcast models, Cont. Shelf Res., 30, 1626–1638, https://doi.org/10.1016/j.csr.2010.06.010, 2010.
Sigman, D. M. and Fripiat, F.: Nitrogen Isotopes in the Ocean, in: Encyclopedia of Ocean Sciences (Third Edition), edited by: Cochran, J. K., Bokuniewicz, H. J., and Yager, P. L., Academic Press, Oxford, 263–278, https://doi.org/10.1016/B978-0-12-409548-9.11605-7, 2019.
Sigman, D. M., Casciotti, K. L., Andreani, M., Barford, C., Galanter, M., and Böhlke, J.: A bacterial method for the nitrogen isotopic analysis of nitrate in seawater and freshwater, Anal. Chem., 73, 4145–4153, https://doi.org/10.1021/ac010088e, 2001.
Sigman, D. M., Granger, J., DiFiore, P. J., Lehmann, M. M., Ho, R., Cane, G., and van Geen, A.: Coupled nitrogen and oxygen isotope measurements of nitrate along the eastern North Pacific margin, Global Biogeochem. Cy., 19, GB4022, https://doi.org/10.1029/2005GB002458, 2005.
Sigman, D. M., DiFiore, P. J., Hain, M. P., Deutsch, C., Wang, Y., Karl, D. M., Knapp, A. N., Lehmann, M. F., and Pantoja, S.: The dual isotopes of deep nitrate as a constraint on the cycle and budget of oceanic fixed nitrogen, Deep-Sea Res. Pt. I, 56, 1419–1439, https://doi.org/10.1016/j.dsr.2009.04.007, 2009.
Smith, S. V., Swaney, D. P., Talaue-Mcmanus, L., Bartley, J. D., Sandhei, P. T., McLAUGHLIN, C. J., Dupra, V. C., Crossland, C. J., Buddemeier, R. W., and Maxwell, B. A.: Humans, hydrology, and the distribution of inorganic nutrient loading to the ocean, Bioscience, 53, 235–245, https://doi.org/10.1641/0006-3568(2003)053[0235:HHATDO]2.0.CO;2, 2003.
Soares, M.: Biological denitrification of groundwater, Water, Air, Soil Pollut., 123, 183–193, 2000.
Song, W., Liu, X.-Y., Wang, Y.-L., Tong, Y.-D., Bai, Z.-P., and Liu, C.-Q.: Nitrogen isotope differences between atmospheric nitrate and corresponding nitrogen oxides: A new constraint using oxygen isotopes, Sci. Total Environ., 701, 134515, https://doi.org/10.1016/j.scitotenv.2019.134515, 2020.
Su, J.: A review of circulation dynamics of the coastal oceans near China, Acta Oceanol. Sin., 23, 1–16, https://doi.org/10.3321/j.issn:0253-4193.2001.04.001, 2001 (in Chinese).
Sugimoto, R., Kasai, A., Miyajima, T., and Fujita, K.: Transport of oceanic nitrate from the continental shelf to the coastal basin in relation to the path of the Kuroshio, Cont. Shelf Res., 29, 1678–1688, https://doi.org/10.1016/j.csr.2009.05.013, 2009.
Tan, S. and Shi, G.: Satellite-derived primary productivity and its spatial and temporal variability in the China seas, J. Geogr. Sci., 16, 447–457, https://doi.org/10.1007/s11442-006-0408-4, 2006.
Umezawa, Y., Yamaguchi, A., Ishizaka, J., Hasegawa, T., Yoshimizu, C., Tayasu, I., Yoshimura, H., Morii, Y., Aoshima, T., and Yamawaki, N.: Seasonal shifts in the contributions of the Changjiang River and the Kuroshio Current to nitrate dynamics in the continental shelf of the northern East China Sea based on a nitrate dual isotopic composition approach, Biogeosciences, 11, 1297–1317, https://doi.org/10.5194/bg-11-1297-2014, 2014.
Wang, J., Yu, Z., Wei, Q., and Yao, Q.: Long-term nutrient variations in the Bohai Sea over the past 40 years, J. Geophys. Res.-Oean., 124, 703–722, https://doi.org/10.1029/2018JC014765, 2019.
Wang, W., Yu, Z., Song, X., Wu, Z., Yuan, Y., Zhou, P., and Cao, X.: The effect of Kuroshio Current on nitrate dynamics in the southern East China Sea revealed by nitrate isotopic composition, J. Geophys. Res.-Oean., 121, 7073–7087, https://doi.org/10.1002/2016JC011882, 2016.
Wang, W., Yu, Z., Song, X., Wu, Z., Yuan, Y., Zhou, P., and Cao, X.: Characteristics of the δ15NNNO3 distribution and its drivers in the Changjiang River estuary and adjacent waters, Chin. J. Oceanol. Limnol., 35, 367–382, https://doi.org/10.1007/s00343-016-5276-x, 2017.
Wang, X., Li, H., Jiao, J. J., Barry, D. A., Li, L., Luo, X., Wang, C., Wan, L., Wang, X., and Jiang, X.: Submarine fresh groundwater discharge into Laizhou Bay comparable to the Yellow River flux, Sci. Rep.-UK, 5, 8814, https://doi.org/10.1038/srep08814, 2015.
Wankel, S. D., Kendall, C., Francis, C. A., and Paytan, A.: Nitrogen sources and cycling in the San Francisco Bay Estuary: A nitrate dual isotopic composition approach, Limnol. Oceanogr., 51, 1654–1664, https://doi.org/10.4319/lo.2006.51.4.1654, 2006.
Wankel, S. D., Kendall, C., Pennington, J. T., Chavez, F. P., and Paytan, A.: Nitrification in the euphotic zone as evidenced by nitrate dual isotopic composition: Observations from Monterey Bay, California, Global Biogeochem. Cy., 21, GB2009, https://doi.org/10.1029/2006GB002723, 2007.
Wei, H., Zhao, L., and Feng, S.: Annual cycle of phytoplankton biomass and primary production in the Bohai Sea simulated by a three-dimensional ecosystem model, Acta Oceanol. Sin., 25, 66–72, 2003 (in Chinese).
Wong, G. T.: Removal of nitrite interference in the Winkler determination of dissolved oxygen in seawater, Mar. Chem., 130, 28–32, https://doi.org/10.1016/j.marchem.2011.11.003, 2012.
Wu, S.: Oxygen isotope compositions of seawaters in the Huanghai (Yellow) Sea and the Bohai Sea, Sci. China Ser. B, 34, 327–337, http://www.cnki.com.cn/Article/CJFDTotal-JBXG199103008.htm (last access: 30 April 2022), 1991.
Wu, Z., Yu, Z., Song, X., Wang, W., Zhou, P., Cao, X., and Yuan, Y.: Key nitrogen biogeochemical processes in the South Yellow Sea revealed by dual stable isotopes of nitrate, Estuar. Coast. Shelf Sci., 225, 106222, https://doi.org/10.1016/j.ecss.2019.05.004, 2019.
Wurl, O.: Practical guidelines for the analysis of seawater, CRC press, ISBN 1420073079, 2009.
Xin, M., Wang, B., Xie, L., Sun, X., Wei, Q., Liang, S., and Chen, K.: Long-term changes in nutrient regimes and their ecological effects in the Bohai Sea, China, Mar. Pollut. Bull., 146, 562–573, https://doi.org/10.1016/j.marpolbul.2019.07.011, 2019.
Xu, S., Song, J., Li, X., Yuan, H., Li, N., Duan, L., and Sun, P.: Changes in nitrogen and phosphorus and their effects on phytoplankton in the Bohai Sea, China J. Oceanol. Limnol., 28, 945–952, https://doi.org/10.1007/s00343-010-0005-3, 2010.
Yang, Z., Chen, J., Li, H., Jin, H., Gao, S., Ji, Z., Zhu, Y., Ran, L., Zhang, J., and Liao, Y.: Sources of nitrate in Xiangshan Bay (China), as identified using nitrogen and oxygen isotopes, Estuar. Coast. Shelf Sci., 207, 109–118, https://doi.org/10.1016/j.ecss.2018.02.019, 2018.
Yellow River Conservancy Commission of MWR (China): Yellow River Sediment Bulletin 2018, in: Yellow River Conservancy Commission of MWR, China, Zhengzhou, 35 pp., http://www.yrcc.gov.cn/nishagonggao/2018/index.html#p=1 (last access: 30 April 2022), 2019 (in Chinese).
Yu, H., Yu, Z., Song, X., Cao, X., Yuan, Y., and Lu, G.: Seasonal variations in the nitrogen isotopic composition of dissolved nitrate in the Changjiang River estuary, China, Estuar. Coast. Shelf Sci., 155, 148–155, https://doi.org/10.1016/j.ecss.2015.01.017, 2015.
Yu, J., Zhang, W., Tan, Y., Zong, Z., Hao, Q., Tian, C., Zhang, H., Li, J., Fang, Y., and Zhang, G.: Dual-isotope-based source apportionment of nitrate in 30 rivers draining into the Bohai Sea, north China, Environ. Pollut., 283, 117112, https://doi.org/10.1016/j.envpol.2021.117112, 2021.
Yu, Q., Lou, A., Zhang, X., and Li, N.: Numerical Analysis on the Impact of Main River Runoff on the Plain Distribution in the Low-Salinity Area at North Liaodong Bay, Trans. Oceanol. Limnol., 2, 88–96, https://doi.org/10.13984/j.cnki.cn37-1141.2018.02.012, 2018 (in Chinese).
Yue, F.-J., Li, S.-L., Liu, C.-Q., Zhao, Z.-Q., and Hu, J.: Using dual isotopes to evaluate sources and transformation of nitrogen in the Liao River, northeast China, Appl. Geochem., 36, 1–9, https://doi.org/10.1016/j.apgeochem.2013.06.009, 2013.
Zhang, G., Zhang, J., and Liu, S.: Characterization of nutrients in the atmospheric wet and dry deposition observed at the two monitoring sites over Yellow Sea and East China Sea, J. Atmos. Chem., 57, 41–57, https://doi.org/10.1007/s10874-007-9060-3, 2007.
Zhang, J., Yu, Z., Raabe, T., Liu, S., Starke, A., Zou, L., Gao, H., and Brockmann, U.: Dynamics of inorganic nutrient species in the Bohai seawaters, J. Mar. Syst., 44, 189–212, https://doi.org/10.1016/j.jmarsys.2003.09.010, 2004.
Zhang, L., Song, L., Zhang, L., Shao, H., Chen, X., and Yan, K.: Seasonal dynamics in nitrous oxide emissions under different types of vegetation in saline-alkaline soils of the Yellow River Delta, China and implications for eco-restoring coastal wetland, Ecol. Eng., 61, 82–89, https://doi.org/10.1016/j.ecoleng.2013.09.065, 2013.
Zhang, X., Zhang, Q., Yang, A., Hou, L., Zheng, Y., Zhai, W., and Gong, J.: Incorporation of Microbial Functional Traits in Biogeochemistry Models Provides Better Estimations of Benthic Denitrification and Anammox Rates in Coastal Oceans, J. Geophys. Res.-Biogeo., 123, 3331–3352, https://doi.org/10.1029/2018JG004682, 2018.
Zhang, Y., Liu, X., Fangmeier, A., Goulding, K., and Zhang, F.: Nitrogen inputs and isotopes in precipitation in the North China Plain, Atmos. Environ., 42, 1436–1448, https://doi.org/10.1016/j.atmosenv.2007.11.002, 2008.
Zhang, Z., Zheng, N., Zhang, D., Xiao, H., Cao, Y., and Xiao, H.: Rayleigh based concept to track NOx emission sources in urban areas of China, Sci. Total Environ., 704, 135362, https://doi.org/10.1016/j.scitotenv.2019.135362, 2019.
Zhao, L., Wei, H., and Feng S.: Annual Cycle and Budgets of Nutrients in the Bohai Sea, Chinese J. Environ. Sci., 1, 29–37, https://en.cnki.com.cn/Article_en/CJFDTotal-QDHB200201006.htm, 2002
Zhao, Y., Zhang, L., Chen, Y., Liu, X., Xu, W., Pan, Y., and Duan, L.: Atmospheric nitrogen deposition to China: A model analysis on nitrogen budget and critical load exceedance, Atmos. Environ., 153, 32–40, https://doi.org/10.1016/j.atmosenv.2017.01.018, 2017.
Zong, Z., Wang, X., Tian, C., Chen, Y., Fang, Y., Zhang, F., Li, C., Sun, J., Li, J., and Zhang, G.: First Assessment of NOx Sources at a Regional Background Site in North China Using Isotopic Analysis Linked with Modeling, Environ. Sci. Technol., 51, 5923–5931, https://doi.org/10.1021/acs.est.6b06316, 2017.