the Creative Commons Attribution 4.0 License.
the Creative Commons Attribution 4.0 License.
 | 13 Jun 2022
Origin, transport, and retention of fluvial sedimentary organic matter in South Africa's largest freshwater wetland, Mkhuze Wetland System
Marc Steven Humphries
Matthias Zabel
David Sebag
Annette Hahn
Enno Schefuß
Sedimentary organic matter (OM) analyses along a 130 km long transect of the Mkhuze River from the Lebombo Mountains to its outlet into Lake St Lucia, Africa's most extensive estuarine system, revealed the present active trapping function of a terminal freshwater wetland. Combining bulk OM analyses, such as Rock-Eval®, and source-specific biomarker analyses of plant-wax n-alkanes and their stable carbon (δ13C) and hydrogen (δD) isotopic composition showed that fluvial sedimentary OM originating from inland areas is mainly deposited in the floodplain and swamp area of the wetland system but not in the downstream lake area. A distinctly less degraded OM signature, i.e., a considerably lower degree of transformation of unstable components (higher I index) and lower contribution of refractory and persistent fractions (lower R index) as well as recognizably higher δD values compared to samples from upstream sub-environments, characterizes surface sediments of Lake St Lucia. The offset in δD indicates that the contributing vegetation, although similar to upstream vegetation inputs in terms of photosynthetic pathway (δ13C) and alkane distribution pattern, experienced different hydrological growth conditions. The results suggest that under current conditions hinterland sedimentary OM is deposited throughout the wetland system up to the Mkhuze Swamps, which ultimately captures the transported OM. Consequently, samples from the downstream located Lake St Lucia show locally derived signals instead of integrated signals encompassing the river catchment. This finding raises important constraints for future environmental studies as the assumption of watershed-integrated signals in sedimentary archives retrieved from downstream lakes or offshore might not hold true in certain settings.
- Article
(4688 KB) - Full-text XML
- BibTeX
- EndNote


Lake St Lucia is the largest estuarine system in Africa and is of both local and international importance (Porter, 2013). It is a biodiversity hotspot and provides habitat for fish and wildlife and breeding grounds for birds. On this basis, it significantly supports national and international ecotourism as well as the regional economy (Whitfield and Taylor, 2009). Its functioning is highly dependent on a constant supply of freshwater. One of the major hydrological inputs into Lake St Lucia is the Mkhuze Wetland System, South Africa's largest freshwater wetland system, which accounts for about 56 % of the freshwater input to the lake (Stormanns, 1987). It is part of the iSimangaliso Wetland Park, which was declared a UNESCO World Heritage Site in 1999 (Taylor et al., 2006), was designated a Ramsar site in 1986 (Perissinotto et al., 2013), and is the world's oldest formally protected estuary (Whitfield and Taylor, 2009).
Wetlands act as filters by removing or retaining nutrients and anthropogenic pollutants (Reddy and Debusk, 1987). They also control sedimentation through deposition, resulting in less siltation in adjacent water systems (Johnston, 1991). The filtering function of wetlands is of particular interest because wetlands are considered to be either sources or sinks of organic carbon and therefore may increase carbon emissions from surface waters if they export organic carbon (OC) in substantial amounts to adjacent water systems and vice versa (e.g., Cole et al., 2007; Reddy and DeLaune, 2008; Mitsch and Gosselink, 2015). Factors controlling whether a wetland serves as a carbon source or sink are not yet fully understood, but wetland hydrology is considered to play a critical role. When a wetland's natural filter function is overstressed, the wetland and its beneficial functions can be reduced or destroyed (Hemond and Benoit, 1988; Junk and An, 2013). In the worst case, the wetland can become a source of pollutants and sediments that have been previously stored. The Mkhuze Wetland System, and in particular the Mkhuze Swamps, is supposedly such a filter for Lake St Lucia's water supply and therefore presumably provide the benefits mentioned above.
Like most wetlands, the Mkhuze Wetland System is affected by human interference. For instance, cattle grazing and use as agricultural land are reported to be of increasing importance for both sugarcane and eucalyptus cultivation (Neal, 2001). Human activities such as channel dredging (Mpempe and Tshanetshe canals) have also significantly altered the natural state (Neal, 2001; Barnes et al., 2002; Ellery et al., 2003). Such disturbances have the potential to cause alteration of vegetation and hydrologic conditions, as well as sediment balance and transport pathways. Such negative impacts have extensively been studied for the swamp system formerly present to the south of Lake St Lucia, the Mfolozi Swamps (Whitfield and Taylor, 2009; Taylor, 2013, and references therein).
Our study is, to the best of our knowledge, the first to examine the sources, transport, and fate of organic material in the Mkhuze Wetland System. The primary objectives of the study are (i) to characterize the sedimentary OM in the individual sub-areas of the system and (ii) to infer OM sources and transport as well as degradation of OM within the system. We, therefore, assume that rivers transport sedimentary material (if so) only downstream. In this context, signals observed in downstream areas can only originate from upstream areas through transport or from local sources. Thereby, we evaluate the current wetland's impact, especially of the Mkhuze Swamps on Lake St Lucia. To address the wetland's role in retaining sedimentary OM, we analyzed surface sediments along a 130 km long transect from the Mkhuze River channel to its mouth in Lake St Lucia, as well as extending into the northern part of Lake St Lucia.
The provided insights into the characteristics and transport of organic matter in a terminal wetland under subtropical climatic conditions, which also can be identified in other wetlands around the world, reveal potential implications for (paleo)environmental studies based on sedimentary archives from downstream areas.
To obtain qualitative information on OM characteristics, we applied a combination of methods. Bulk methods (bulk organic and Rock-Eval® analyses) characterize the entire OM and its degradation state but are limited in their specificity, whereas compound-specific analyses, such as the identification of lipid biomarkers (i.e., plant-wax-derived n-alkanes) and their compound-specific isotope composition, provide very specific information but reflect only a small proportion of OM.
2.1 Rock-Eval
Originally developed to provide information on the content of hydrocarbons and the kerogen type in sedimentary rocks, as well as determine the maturity of the kerogen (Disnar, 1994; Lafargue et al., 1998), Rock-Eval analysis has become an attractive and fast alternative for the analysis of organic matter in soils and sediments compared to conventional methods due to the lack of sample preparation (Disnar et al., 2003; Sebag et al., 2006). Rock-Eval analysis provides not only the quantity of organic carbon but also information on the elemental composition of the OM. In particular, the hydrogen index (HI; milligrams of HC per gram of TOC) and oxygen index (OI; milligrams of O2 per gram of TOC), which correlate with the classical elemental parameters of the and ratios known from van Krevelen diagrams (Espitalié et al., 1977, 1985), not only provide insights into the degree of degradation but also provide indications of OM origin. The representation of the HI against TOC allows the estimation of the soil OM quality, which is usually determined by the mineralization of the soil OM and the dilution by the mineral matrix. Fresh and fragmented litter usually shows high TOC levels (10 %–40 %) and HI values greater than 300 (Disnar et al., 2003). This results from the material consisting primarily of unconverted biopolymers such as lignin, cellulose, and hemicellulose. During degradation (oxidation) of the biopolymers, the HI decreases and the OI increases. Material consisting of a distinct composition of the dominant biopolymers, such as aquatic inputs, likewise shows distinct ranges of its HI values, which provide a rough source indication.
In addition, Rock-Eval provides information on the thermal stability of the immature OM (Disnar, 1982). The so-called S2 peak integrates the quantity of pyrolyzed emission products between 200 and 650 ∘C. Utilizing mathematical deconvolution determines individual peaks within the S2 peak. Fractions of OM differing in thermal stability are assignable to the resulting temperature intervals: (A1) 200–340 ∘C, thermally unstable biological macromolecules, like saccharides; (A2) 340–400 ∘C, stable biological macromolecules, like cellulose and/or lignin or polypeptides; (A3) 400–460 ∘C, immature geological macromolecules, like humic substances; (A4) 460–520 ∘C, refractory geological macromolecules; and (A5) 520–650 ∘C, highly refractory pool (Disnar et al., 2003; Sebag et al., 2006, 2016). Investigations of composts using 13C nuclear magnetic resonance (NMR) showed that the thermal stability separating the mentioned groups also correlates with the chemical stability (Albrecht et al., 2015). Based on this, Sebag et al. (2006) and Albrecht et al. (2015) developed indices based on the aforementioned temperature intervals, whereby the indices are defined as follows: R index (R is recalcitrant OM) = (A3 + A4 + A5), and I index (I is immature OM) = log10((A1 + A2)A3). However, Sebag et al. (2016) point out that due to their mathematical derivation, these indices cannot exactly indicate the quantity or identity of the chemical components in the OM, unlike the classic Rock-Eval parameters. We acknowledge that the four different temperature intervals cannot differentiate the entire spectrum of organic compounds and therefore refer to the thermal rather than chemical stability of OM (Sebag et al., 2016). Nevertheless, this sufficiently reflects the changes in the organic components during their transformation. On this basis, the R index and the I index describe the contribution of refractory and persistent fractions by pedogenic processes, as well as the degree of transformation of unstable components via decompositional processes (Sebag et al., 2016). Sebag et al. (2016) proposed the use of the diagram (I index vs. R index), which resembles the representation of the van Krevelen diagram (OI vs. HI). One of the most notable features of the diagram is the linear relationship between the two parameters (“decomposition regression line” or “humic trend”). During the decomposition of fresh OM, labile organic compounds are converted into their respective more stable counterparts, which are converted into either stable humic acids or components complexed by the mineral matrix. Samples are plotted along the linear relationship when the stabilization of OM from the progressive degradation of organic components is based on their biochemical stability. Samples are not plotted along this linear relationship in situations with OM mixture from different sources.
2.2 Plant waxes
In general, lipid biomarkers reflect only a small portion of the total OM but overcome problems of source specificity by having a specific origin. Plants, for instance, produce waxes to control their water balance and counteract external stressors, such as UV radiation and bacterial and fungus-based attacks (Jenks and Ashworth, 1999). These waxes enter the environment through physical processes, such as wind, precipitation, abrasion by particles, and when plants die or plant parts detach. The waxes contain a variety of molecules, including long-chain n-alkanes, which are very resistant to degradation (Poynter and Eglinton, 1991). Plant-wax-derived n-alkanes show homologous series with a strong odd-over-even chain-length dominance due to their biosynthesis (Eglinton and Hamilton, 1967) causing a high carbon preference index (CPI) for fresh plant waxes. Besides, different plant types show characteristic features in their n-alkane distribution patterns, such as aquatic plants showing dominant contributions of the n-alkanes C23 and C25 (Ficken et al., 2000; Baas et al., 2000; Liu et al., 2019), whereas grasses show distribution patterns dominated by the very long-chain n-alkanes C33 and C35 as well as C31 (Rommerskirchen et al., 2006; Vogts et al., 2012). The differing abundances and dominance of the “higher-plant” n-alkanes are generally resembled in the ACL (average chain length) parameter (Poynter and Eglinton, 1990). The homologues C29 and C27 seem to be mainly derived from tree-like vegetation (Vogts et al., 2009; Garcin et al., 2014; Zhang et al., 2021). However, both the C29 and the C31 n-alkane can reflect a mixed signal from trees and grasses. The distribution patterns of the contributing plant types are closely mirrored in topsoils (Carr et al., 2014). However, some studies have identified limitations of this approach and question the validity of distinctions by distribution patterns alone (e.g., Bush and McInerney, 2013; Jansen and Wiesenberg, 2017). Therefore, it is recommended to combine the information derived from n-alkane distribution patterns with additional proxies, such as compound-specific isotopic compositions (e.g., Hockun et al., 2016; Herrmann et al., 2016; Zhang et al., 2021).
2.3 Plant-wax compound-specific isotopes
The carbon and hydrogen in plant-wax n-alkanes derive from the carbon and hydrogen source the plants utilize for biomass metabolism, i.e., inorganic carbon and water. The isotopic composition of n-alkanes thus allows interpretation of either the metabolic process during biosynthesis or effects influencing the isotopic composition of the respective carbon and hydrogen sources (Sachse et al., 2012; Sessions, 2016; Diefendorf and Freimuth, 2017).
In the case of carbon, the effect of different photosynthetic metabolic pathways of different types of vegetation has the greatest influence on the compound-specific stable carbon (δ13C) of n-alkanes. Information on contributing photosynthetic plant types can be obtained from their compound-specific δ13C isotope compositions (Diefendorf and Freimuth, 2017). Waxes from C4 vegetation are isotopically enriched in 13C relative to waxes from C3 plants due to more effective photosynthetic carbon (CO2) fixation (Collins et al., 2011). Most tropical grasses are of C4 type, while all trees and shrubs are C3 plants. The occurrence of C4, i.e., 13C-enriched n-alkanes, in sediments has thus been attributed to contributions from grassy environments. However, plants from specific environments, such as specific Cyperaceae or Poaceae in swamps or salt-tolerant plants in saline settings, can also be of C4 type, complicating a simple interpretation of δ13C compositions (Schefuß et al., 2011). A complication arises when CAM plants are present. CAM plants produce variable and intermediate δ13C compositions but occur only in specific environments, such as in the Succulent Karoo Biome along the west coast of South Africa (Carr et al., 2014). The δ13C compositions of plant waxes also depend on environmental stress, such as water shortage. Under drought conditions, plants close their stomata to increase their water use efficiency, leading to 13C enrichment (Hou et al., 2007). δ13C compositions of plant waxes should thus only be interpreted in conjunction with other parameters.
The hydrogen isotope composition (δD) of plant waxes mainly depends on environmental controlling factors rather than biosynthetic mechanisms. The hydrogen that plants incorporate into their biomass originates from the water they absorb. The hydrogen isotope composition of this water mainly depends on the hydrogen isotope composition of precipitation and the hydrological status of the environment. Regarding the hydrogen isotope composition of rainfall, different effects can be distinguished (Gat, 1996). The continental and altitude effects describe the isotopic depletion with progressive rainout when moisture travels inland or uphill. The temperature effect describes the isotopic depletion with lower condensation temperatures. For the Mkhuze system, these effects result in plant waxes being isotopically depleted in hydrogen when derived from more inland or mountainous regions, whereas temperature variations play a negligible role. In contrast, the amount effect has a large influence leading to depleted hydrogen isotope compositions of rainfall under high-precipitation regimes (Dansgaard, 1964). Wetter areas are thus characterized by more depleted hydrogen isotope compositions of plant waxes. The latter effect is amplified by secondary isotope effects due to evaporation and transpiration. Water in soils, lakes, rivers, and wetlands may be isotopically enriched due to evaporation while also leaf water used for biosynthesis of waters may become isotopically enriched due to transpiration (Kahmen et al., 2013). Such isotopic enrichment due to evapotranspiration has, for instance, been observed in dry environments of South Africa (Herrmann et al., 2017; Strobel et al., 2021). Additionally, a slight dependency of δD composition of waxes occurs for different plant types (Sachse et al., 2012). Disentangling all processes affecting the δD of plant waxes may not always be possible in specific environments. Nevertheless, in combination these primary and secondary effects give an indication of the hydrological status of the contributing vegetation, i.e., about the general humidity of environments, especially when considered in conjunction with other parameters, as is done in this study.
3.1 Study site
The Mkhuze Wetland System (27.8∘ S, 32.5∘ E; Fig. 1), South Africa's largest freshwater wetland system (∼450 km2), is located in the northeastern coastal region of South Africa in the KwaZulu-Natal province. It is bordered by the Lebombo Mountain Range to the west and the Indian Ocean to the east and forms a mosaic of wetland types, including swamp forests, grassy swamps, and open water (pans) (Stormanns, 1987). This ecological heterogeneity and biotic diversity are of international conservation importance, and therefore the area is listed as a wetland of international importance by the Ramsar Convention.
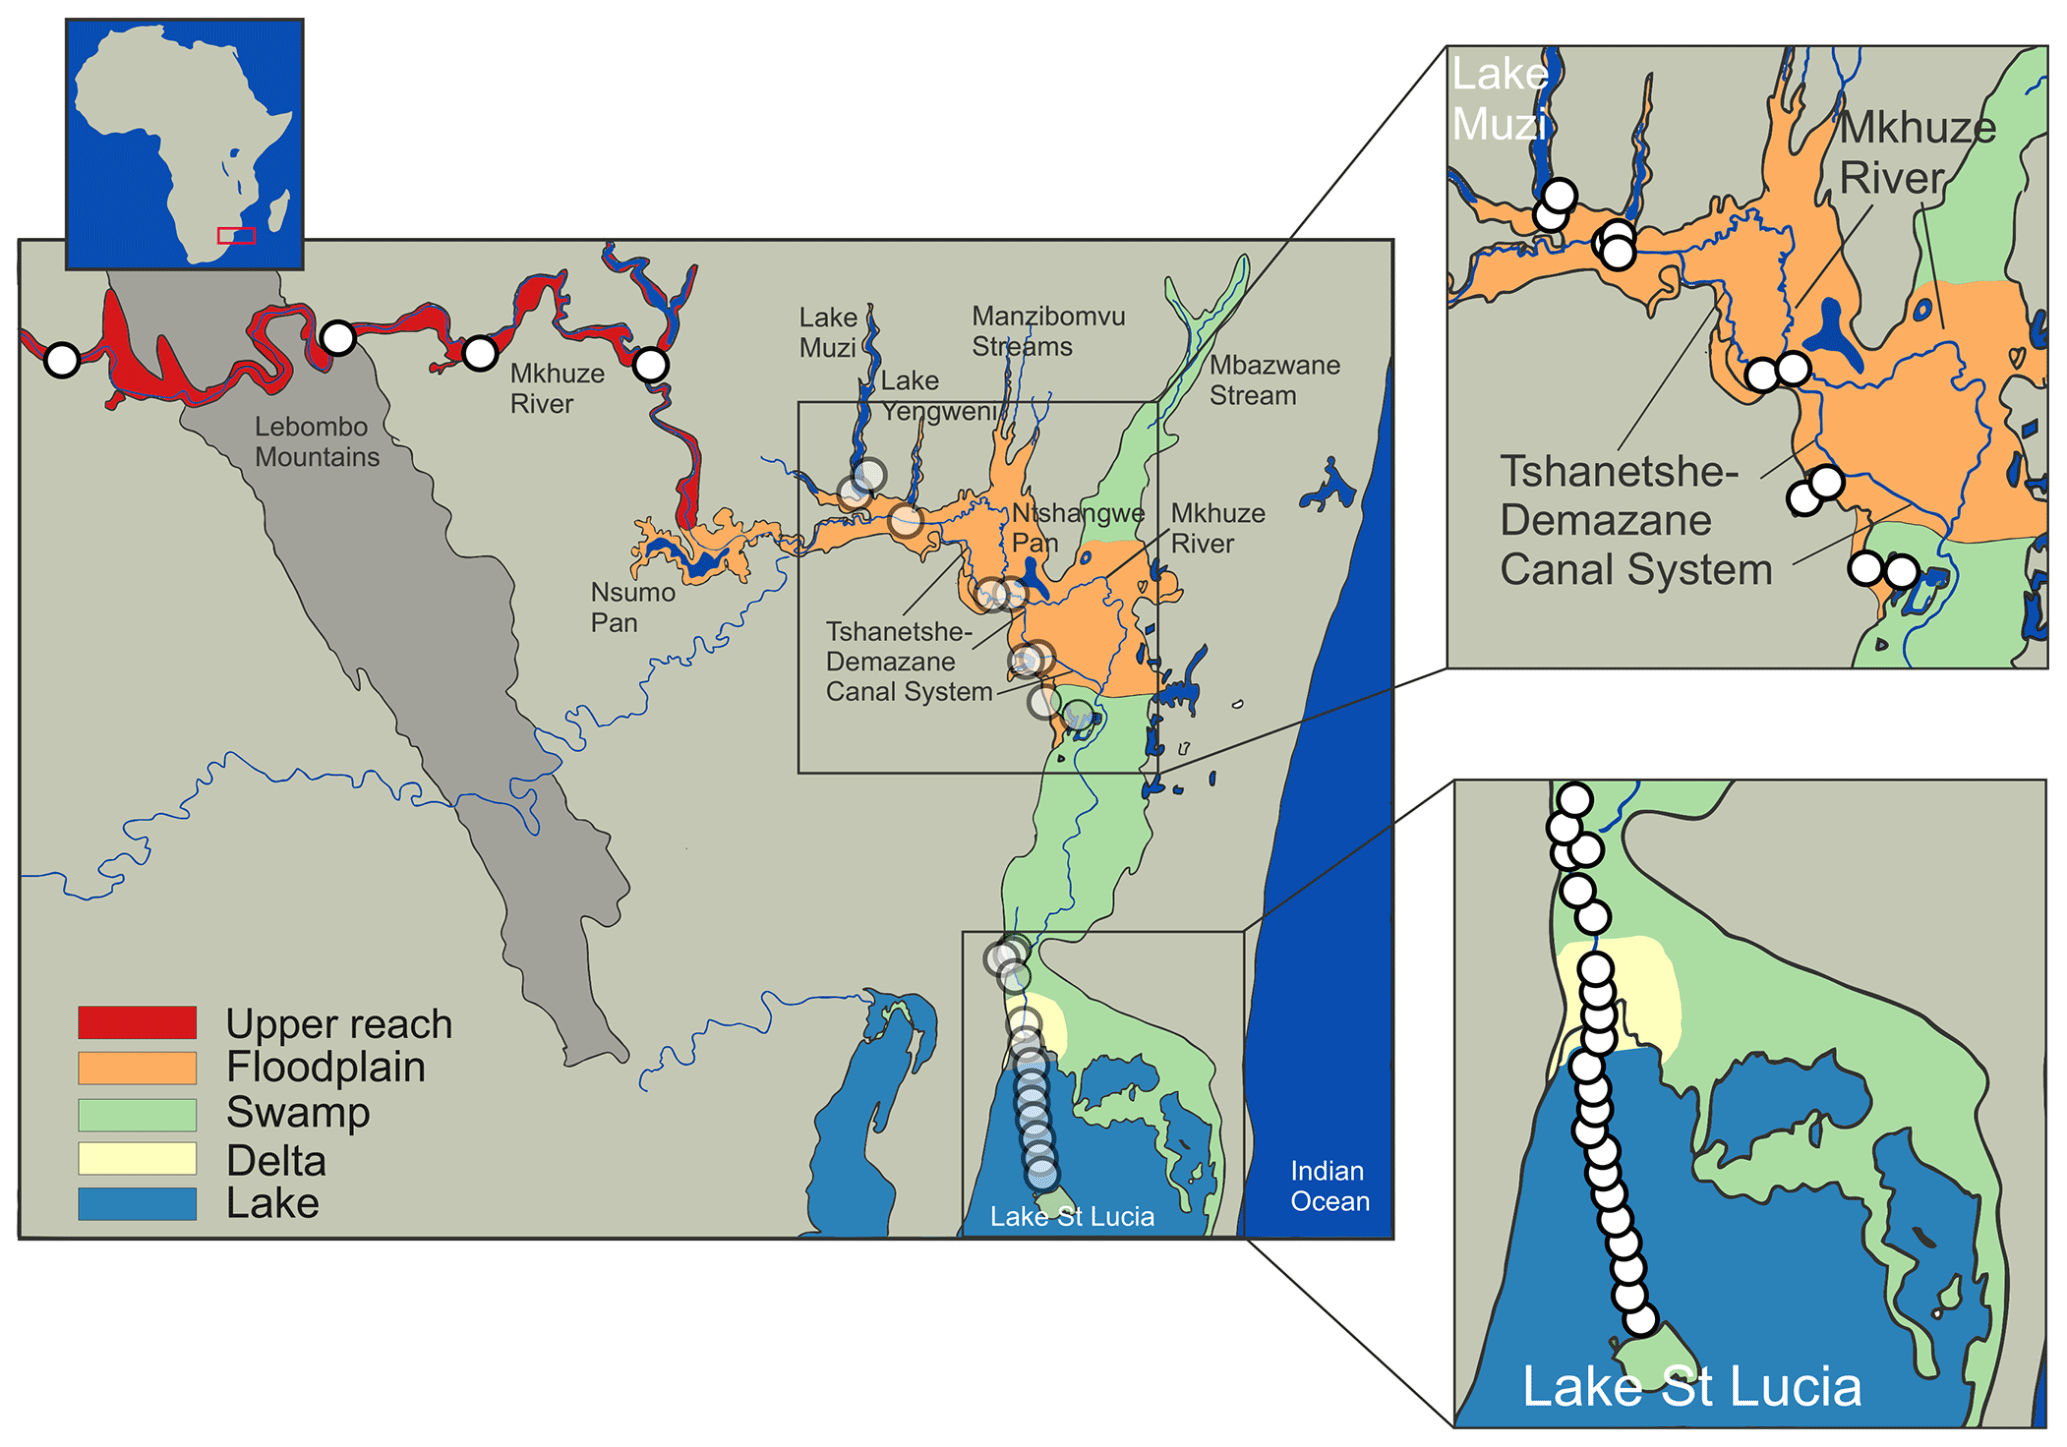
Figure 1Map of the Mkhuze catchment area. White circles represent sampling locations, and colored areas refer to the assigned sub-environments. Important geologic features, including watercourses and major lakes or pans, are named.
3.1.1 Hydrology, vegetation, and depositional sub-environments
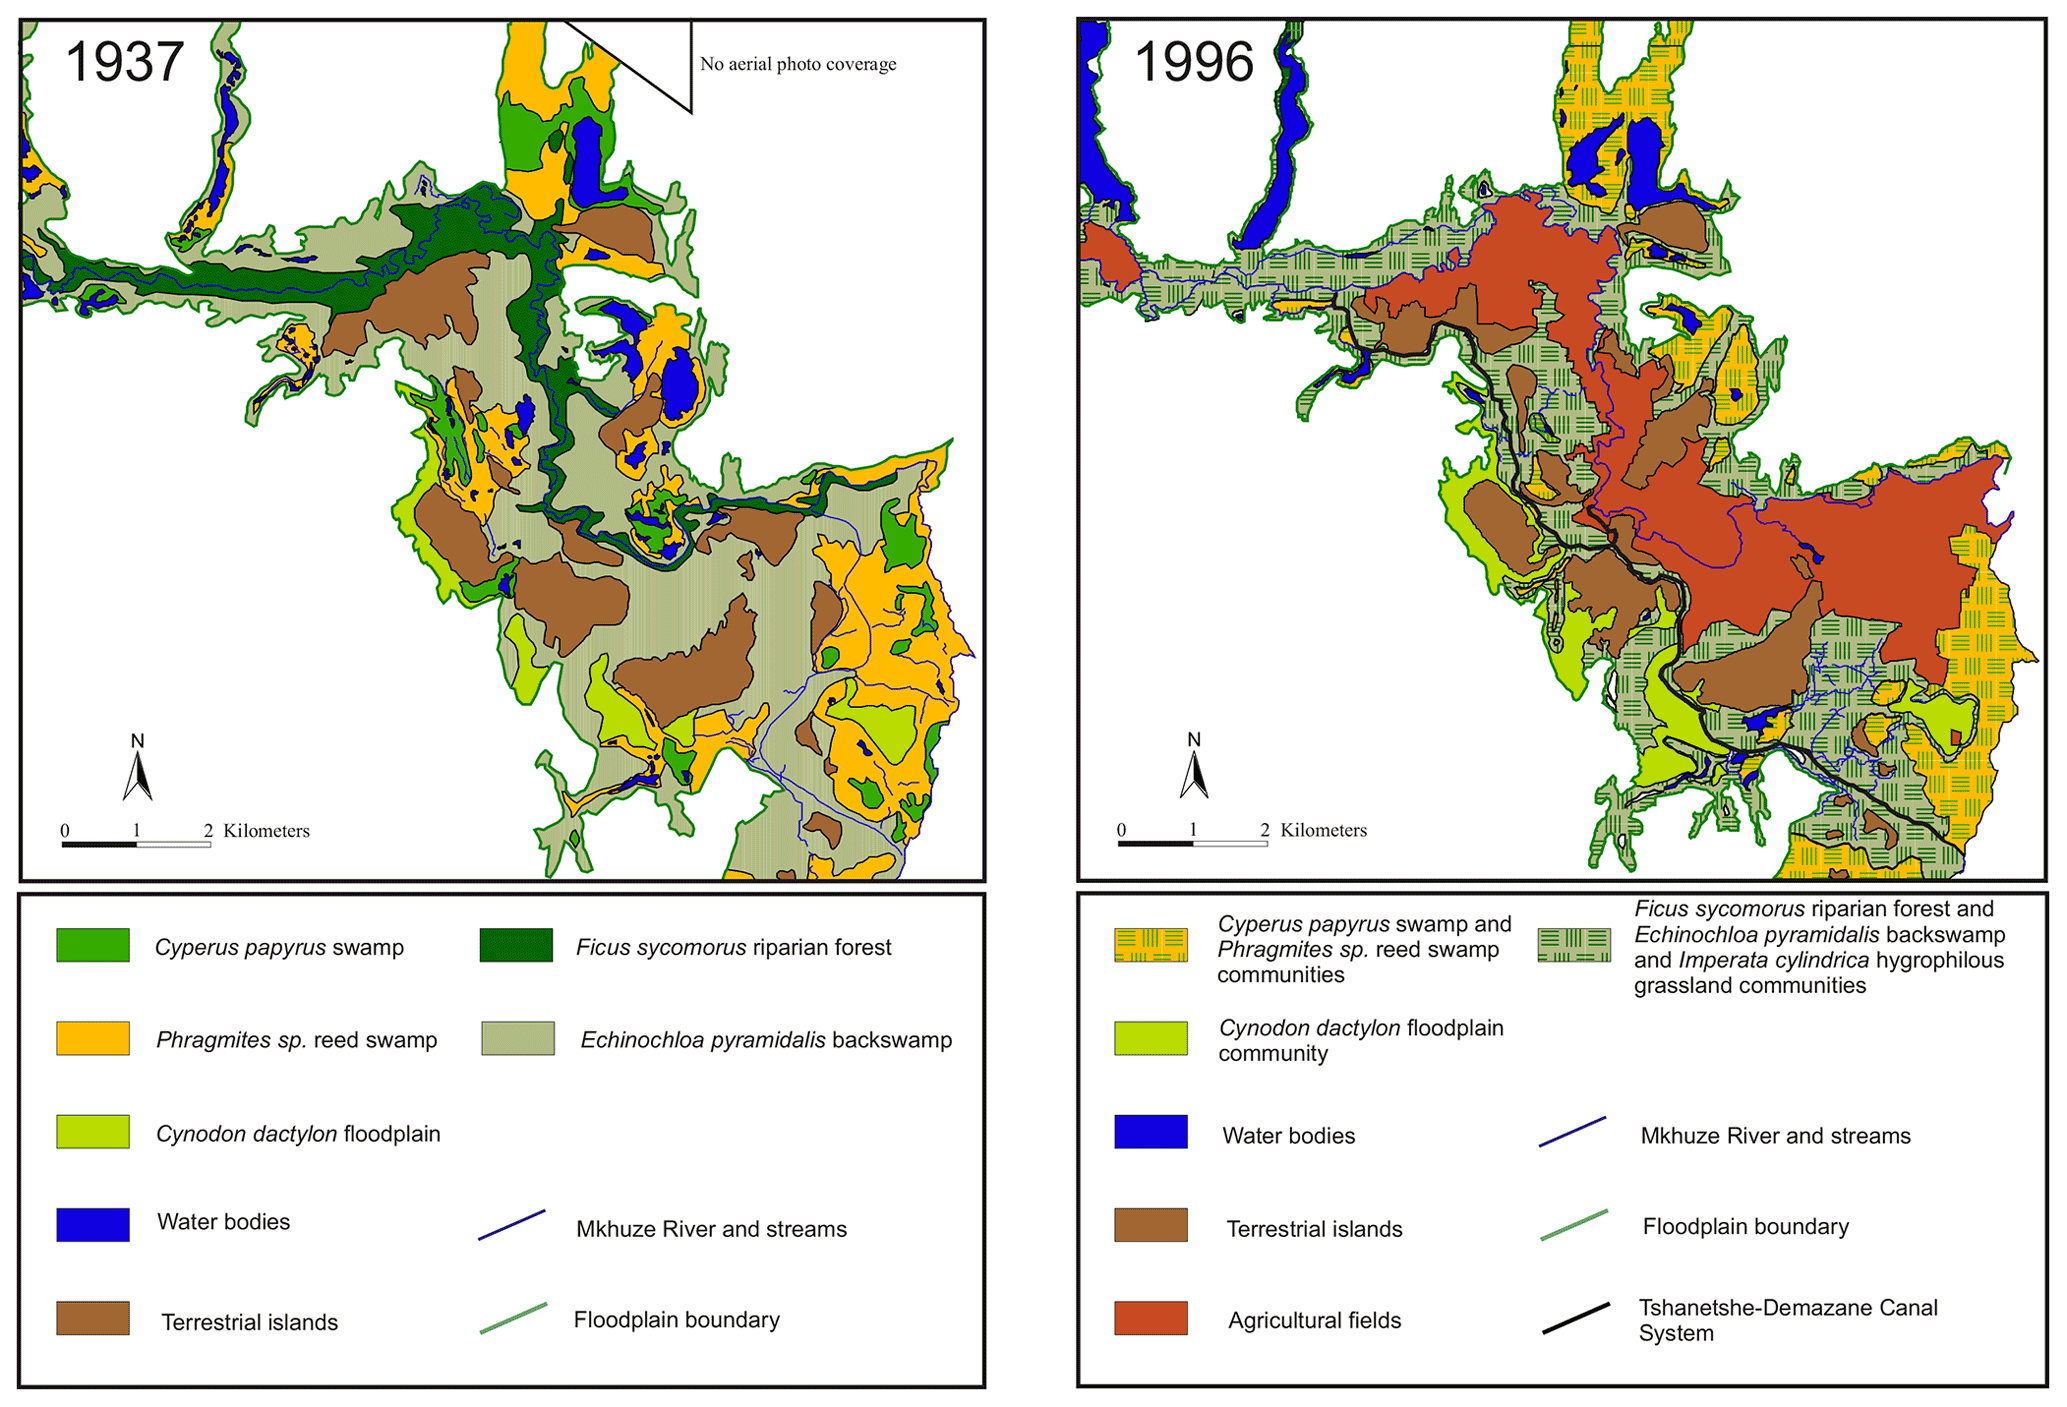
Two major hydrologic inflows supply water to the Mkhuze Wetland System, the Mkhuze River and Manzimbomvu streams, through local runoff, direct precipitation, or groundwater inflow (Ellery et al., 2003). The major tributary is the Mkhuze River, which originates east of Vryheid (∼125 km inland) and drains a catchment area of about 5250 km2 (see Fig. 2) consisting mainly of Cretaceous–Quaternary-aged sedimentary cover of the coastal plain (McCarthy and Hancox, 2000). The perennial river is fed primarily by direct precipitation and is characterized by a mean annual discharge of about 211×106 to 326×106 m3 (Hutchison and Pitman, 1973). Water flow varies greatly seasonally and interannually but is generally highest during the austral summer months and lowest to nonexistent during the winter months (McCarthy and Hancox, 2000). The river drains sedimentary strata of the Dwyka, Ecca, and lower Beaufort groups (Karoo Supergroup), as well as Pongola granites and rhyolites in the Lebombo Mountains (McCarthy and Hancox, 2000). It transports comparatively high amounts of sediment dominated by fine kaolinitic clays originating from Pongola granites and Karoo Supergroup sedimentary rocks (McCarthy and Hancox, 2000). The second hydrologic input is water from the groundwater-fed streams from the north (Manzimbomvu streams) (Stormanns, 1987; Barnes et al., 2002). Unlike discharge in the Mkhuze River, these streams are characterized by regular, persistent flow and transport negligible amounts of suspended sediment. The Mkhuze Wetland System can be divided into various sub-environments reflecting different depositional and geomorphological characteristics, namely the upper reach, the floodplain, the Mkhuze Swamps, and the outlet to Lake St Lucia. The upper reach (Fig. 1, red color) is the section extending from east of the Lebombo Mountain Range to Nsumo Pan. It is dominated by trees, such as Acacia xanthophloea and Ficus sycomorus, along the river course (Taylor, 1982b). The Mkhuze River in this area is a degrading river being largely confined to its channel (Alexander et al., 1986). Farther downstream, the river traverses a sandy coastal plain where it forms an extensive floodplain (Fig. 1, orange color) which is characterized by a variety of vegetation communities (Phragmites mauritianus reed swamp community, Imperata cylindrica hygrophilous grassland community, Echinochloa pyramidalis backswamp community, Ficus sycomorus riparian forest community distributed along the Mkhuze River, Cynodon dactylon floodplain community, Acacia xanthophloea woodland community, and the Nymphaea sp. aquatic community; Tinley, 1959; Neal, 2001; Fig. 3) and is partly used for agricultural purposes. During periods of high flow, the Mkhuze River overtops its banks and inundates the floodplain (Alexander, 1973). Flooding results in sediment deposition in the immediate vicinity of the channel due to slower flow velocity caused by riparian vegetation, resulting in the formation of natural levees (Stormanns, 1987; Neal, 2001; Ellery et al., 2011), as well as the recharge of pans located in the north–south-oriented fossil dune system. As a result, the Mkhuze River is a highly dynamic and rapidly aggrading system, characterized by relatively high sedimentation rates (0.25–0.50 cm yr−1; Humphries et al., 2010). Loss of water to the surrounding floodplain results in marked reductions in downstream channel size, and the Mkhuze River gradually loses definition before terminating in a large freshwater swamp, termed the Mkhuze Swamps (Fig. 1, green color). The Mkhuze Swamps function as an intermediate reservoir that fills with water during the summer and releases it into Lake St Lucia (Fig. 1, blue color) from the beginning of the dry season when the lake is no longer primarily fed by direct precipitation (Alexander, 1973; Taylor, 1982b). Dominant vegetation of the Mkhuze Swamps includes Cyperus papyrus, Phragmites mauritianus, and Echinochloa pyramidalis (Taylor, 1982b). On the levees Ficus sycomorus and Ficus trichopoda occur, whereas the pans are characterized by Nymphaea sp. (Taylor, 1982b). In the northern parts of Lake St Lucia nearly monospecific stands of the salt-tolerant Sporobolus virginicus can be found (Stormanns, 1987). Because Lake St Lucia is an extremely shallow lake (average depth ∼1 m), it is highly susceptible to evaporative losses (∼1380 mm yr−1; Hutchison and Pitman, 1973) and dependent on constant water supply from the swamp system.
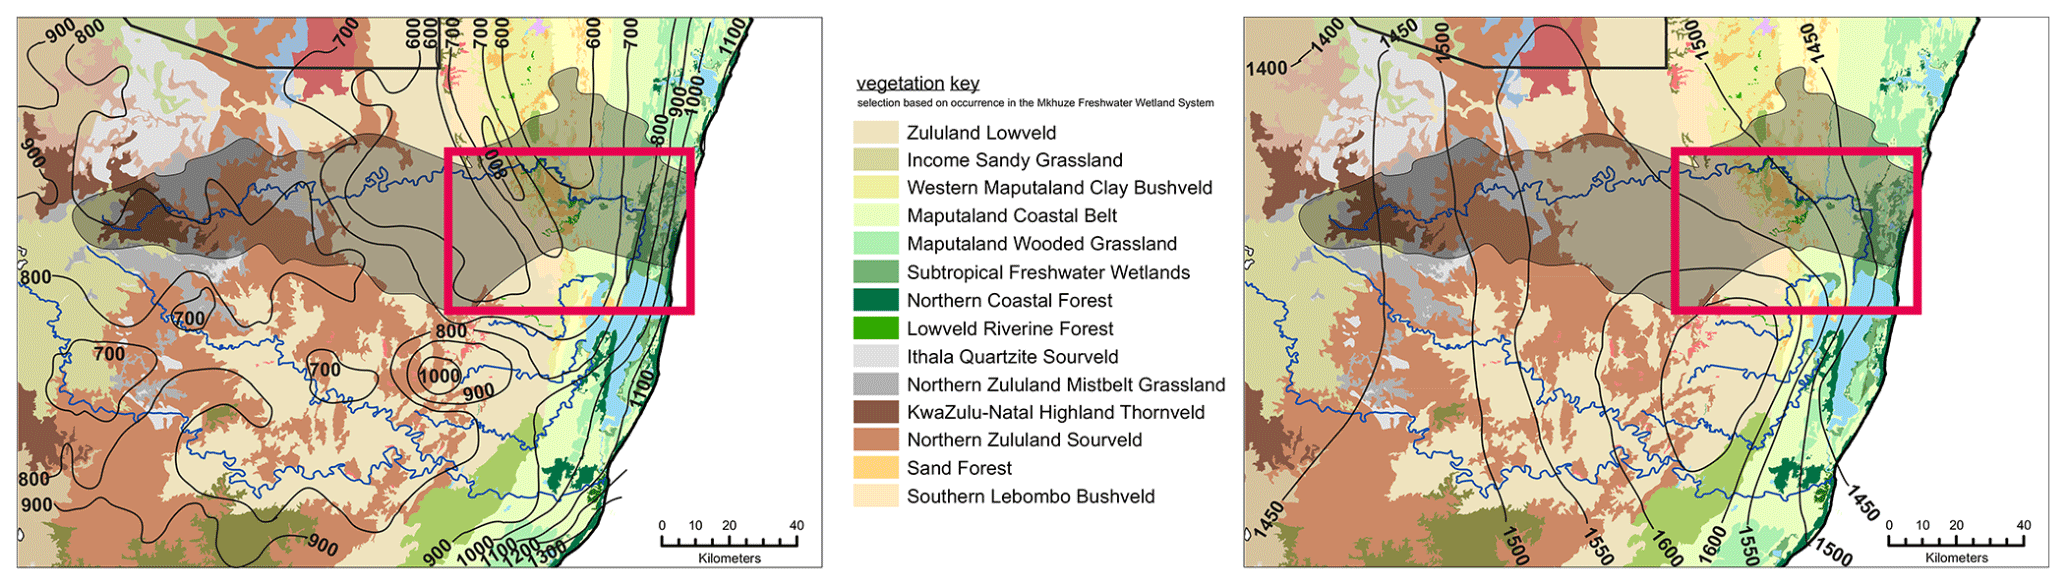
Figure 2The vegetation coverage in the surroundings of the Mkhuze Wetland System is shown. The figure displays the entire catchment area of the Mkhuze River (represented by the outlined, lightened area). The red rectangle indicates the extent of the study area (see Fig. 1). In addition to vegetation cover, precipitation isolines (left figure) and evaporation isolines (right figure, in mm yr−1) are overlaid (adopted from Taylor, 1982a).
3.1.2 Climate
The study area experiences a subtropical climate characterized by hot, humid summers and mild, dry winters and mean annual temperatures ranging from 21 to 23 ∘C (Rebelo and Low, 1996). The Mkhuze Wetland System lies within the summer rainfall zone of South Africa, with about 60 % of precipitation occurring during the austral summer months (November through March) in association with cold fronts moving northward along the coast (Watkeys et al., 1993). Precipitation gradually decreases from east to west (see Fig. 2; Van Heerden and Swart, 1986) from 1000 to 600 mm yr−1 (Hutchison, 1976; Maud, 1980). Flooding is highly variable and usually associated with cutoff-low-pressure systems that develop during December and January or with infrequent tropical cyclones. Evapotranspiration rates are considered relatively high, ranging from 80 mm per month in winter to 190 mm per month in summer (Watkeys et al., 1993).
3.1.3 Anthropogenically caused changes
The course of the Mkhuze River has been greatly altered by human intervention, beginning in the early 1970s. A prolonged drought (1968–1971) resulted in hypersaline conditions in Lake St Lucia (Ellery et al., 2003). The authorities attempted to increase the freshwater supply to the lake by excavating a canal (Mpempe Canal from near Mpempe Pan to 1 km south of Demazane Pan) (Neal, 2001). Flooding caused by Cyclone Domoina in 1984 resulted in severe erosion and the formation of a new stream between Tshanetshe Pan and Mpempe Pan (Taylor, 1986). Additional dredging of a channel (Tshanetshe Canal) in 1986 by a local farmer (Neal, 2001) resulted in the fact that today much of the Mkhuze River water is diverted through the Tshanetshe–Demazane Canal System (Stormanns, 1987; Neal, 2001; Barnes et al., 2002; Ellery et al., 2003). Scientific evaluation of the actions taken and their consequences for the system has been overwhelmingly negative (e.g., Alexander, 1973; Taylor, 1982b). However, Ellery et al. (2003) not only provide a detailed description of the channelization processes in the Mkhuze Wetland System to which the reader is referred but also emphasize that the alteration of the Mkhuze River flow would also likely have occurred naturally. One aspect which is attributed to the channelization processes is a change in vegetation cover. It is reported that formerly extensive stands of Cyperus papyrus within the floodplain area were reduced in extension and partly replaced by species which are tolerant to frequent inundation instead of permanently flooded conditions, such as Cyperus natalensis and Echinochloa pyramidalis (Stormanns, 1987; Neal, 2001).
3.2 Sampling
Collection of samples took place during a single field campaign in November–December 2018. Ten plant samples were collected. If possible, replicate plant species were sampled at various sampling sites within the system. The different species were selected based on the occurrence of large cohorts in the field or based on high reported occurrences in previous studies (Stormanns, 1987; Neal, 2001; see also Fig. 3), but not all major plant communities mentioned could successfully be sampled during the field campaign. Sampled species include aquatic plants from the Nymphaeaceae family (n=2) as well as the aquatic plant Phragmites australis (n=2) growing on both dry and flooded soils; two species of wetland grasses, namely Vossia cuspidata (n=2) and Cynodon dactylon (n=2); and two representatives of the Cyperaceae family, namely Cyperus papyrus (n=1) and Cyperus alternifolius (n=1). A total of 41 surface sediment samples (uppermost 10 cm) were collected along the course of the Mkhuze River and a transect extending into North Lake (northern part of Lake St Lucia, Fig. 1). The collection of sediment samples was conducted under permit from Ezemvelo KZN Wildlife and iSimangaliso Wetland Park Authority. Because of the limited number of samples due to the difficult accessibility of the sampling area, the results should be considered qualitatively rather than quantitatively.
3.3 Laboratory analyses
All surface sediments were freeze-dried. A sieved (<212 µm) sub-sample of approximately 100 mg was removed for classical bulk parameter analysis, and the residual sample was ground and sub-sampled for analyses. All glassware was combusted at 450 ∘C for 5 h prior to use.
3.3.1 Bulk organic matter analyses
The dry, sieved surface sediment was re-wetted with Milli-Q water, and approximately 20 mL of hydrochloric acid (10 %) was added. After 12 h, the acidic solution was decanted and the sample was centrifuged at 1000 rpm for 5 min. The supernatant liquid was then removed with a pipette. The washing procedure was repeated (four to five times) until a pH of 5 was reached, and the decalcified sediment was freeze-dried. Bulk organic analyses for determining total carbon and nitrogen content and bulk carbon isotope signatures were performed at MARUM, University of Bremen. About 10 mg of decalcified samples was wrapped in a tin capsule and analyzed with an elemental analyzer (EA)–continuous-flow isotope ratio mass spectrometer (IRMS) (Thermo Finnigan Flash EA 2000 coupled to a Delta V Plus IRMS). The combustion oven (filled with quartz wool, chromium oxide, and silvered cobaltous–cobaltic oxide), in which C- and N-containing compounds are oxidized, was operated at 999 ∘C. This was followed by reduction of the resulting nitrogen gases in the reduction reactor (filled with quartz wool and copper-reduced granulate) operated at 680 ∘C. Water formed was removed in a water trap (filled with magnesium perchlorate). Finally, N2 and CO2 were separated chromatographically (using an IRMS steel separation column for NC; length 300 cm, o.d. 6 mm, i.d. 5 mm, kept at 40 ∘C) and transferred on-line to the IRMS via a Conflow IV interface. Helium as carrier gas and oxygen as oxidation reagent were used at flow rates of 100 and 200 mL min−1, respectively. Primary standardization of the Delta V Plus IRMS was based on duplicate injections of a reference gas standard from a laboratory tank. The CO2 reference gas (δ13C = 34.17 ‰ ± 0.1 ‰ vs. Vienna Pee Dee Belemnite (VPDB), 5.0 V ± 0.5 V at 44) was calibrated using IAEA-CH-6 international standards. Quantification of total nitrogen and organic carbon was achieved by external standard calibration using peak areas that yielded a linear five-point calibration curve. Repeated analysis of an internal laboratory standard cross-referenced to the certified IAEA-CH-6 international standard yielded a precision and accuracy of 0.2 ‰ for each. Sample concentration data are reported blank corrected.
Thermal analyses were performed at the IFP Energies Nouvelles lab (Rueil-Malmaison, France) using a Rock-Eval® 6 device (Vinci Technologies). About 80 mg of freeze-dried ground sample was pyrolyzed in an inert atmosphere (N2) by heating from 200 to 650 ∘C at 25 ∘C min−1; then residual carbon was combusted in air from 300 to 850 ∘C at 20 ∘C min−1 (Espitalie et al., 1985; Disnar et al., 2003). Gases released were monitored by a flame ionization detector (FID) for hydrocarbon (HC) compounds, and by infrared (IR) detectors for CO and CO2. Total organic carbon (TOC in wt %), mineral carbon (MinC in wt %), the hydrogen index (HI in milligrams of HC per gram of TOC), and the oxygen index (OI in milligrams of CO2 per gram of TOC) were calculated by integrating the amounts of HC, CO, and CO2 produced during thermal cracking and combustion of OM or thermal decomposition of carbonates between defined temperature limits (Behar et al., 2001; Lafargue et al., 1998). Since cracking temperature of organic compounds depends on their structural stability, the thermal status of OM was characterized by combining the R index (i.e., relative contribution of most thermally stable HC pools) and I index (i.e., ratio between thermally labile and resistant HC pools; details are in Sebag et al., 2016). As it is derived from a mathematical construct, if the gradual decomposition of labile compounds is its main driver, OM composition can be described as a continuum from biological tissues to a mixture of organic constituents derived from OM decomposition and plotted along a linear regression line (called the “decomposition line”; Malou et al., 2020) in the diagram of the I index vs. R index (called hereafter diagram; Albrecht et al., 2015). However, situations with OM mixture from different sources or where decomposition is so intense that it even affects the more thermally stable pools may generate a distribution diverging from the decomposition line. In addition, since decomposition temperature of carbonates depends on their composition, examination of CO2 and CO thermograms enables us to identify the carbonate minerals present in the mineral matrix (Pillot et al., 2014; Sebag et al., 2018).
3.3.2 Determination of n-alkane concentrations
Extraction of plant-wax-derived n-alkanes from surface sediments was carried out using a Dionex Accelerated Solvent Extractor 200 (three cycles – 5 min, 100 ∘C, 1000 psi). The internal standard (ISTD) squalane was added prior to extraction. A mixture of dichloromethane and methanol (9:1, v:v) served as extraction solvent. Recovered total lipid extracts (TLEs) were desulfurized with activated copper for 12 h. Plant samples were cut into small pieces resembling all parts of the plant and extracted by using ultrasonic homogenizers and a sequence of methanol, dichloromethane : methanol (1:1, v:v), and dichloromethane as extraction solvents (5 min each at room temperature). Solvents were combined, and the ISTD was added. Saponification of all TLEs was carried out using 0.1 M potassium hydroxide solution in methanol : water (9:1, v:v) at 85 ∘C for 2 h, and neutral fractions were extracted with hexane. The apolar fraction was retrieved by column separation using deactivated silica (1 % H2O in hexane) and hexane followed by removal of unsaturated components via column chromatography on silver-nitrate-impregnated silica using hexane to yield the saturated hydrocarbon fraction.
Analyses were performed using a FOCUS gas chromatograph coupled to a flame ionization detector (GC-FID). The GC oven hosted a Restek Rxi-5ms capillary column (30 m × 250 µm × 0.25 µm). The inlet temperature was set to 260 ∘C, and splitless injection mode was used. The GC oven was set at 60 ∘C, held for 2 min, increased to 150 ∘C with a heating rate of 20 ∘C min−1, and subsequently followed by an increase of 4 ∘C min−1 to the final temperature of 320 ∘C, which was held for 11 min. Quantification of the long-chain n-alkanes was performed by external standard calibration using the peak areas. The external standard used for this purpose contains n-alkanes (C19 to C34) at a concentration of 10 ng µL−1 each and was measured repeatedly after all six samples, achieving a relative standard deviation of <9.2 %. A blank sample containing only the internal standard (ISTD) and a double blank sample not containing the ISTD were also measured to ensure that no contamination occurred during the sample preparation and measurement. Recovery of the ISTD was 74.6 % ± 15.4 % on average for all samples and blanks.
3.3.3 Stable isotope analyses of n-alkanes
Compound-specific δ13C values of the long-chain n-alkanes were determined using a TRACE GC Ultra equipped with an Agilent HP-5ms capillary column (30 m × 250 µm × 0.25 µm) coupled to a Finnigan MAT 252 IRMS via a combustion interface (operation at 1000 ∘C). The GC oven temperature was set at 120 ∘C, held for 3 min, raised to the final temperature of 320 ∘C at a heating rate of 5 ∘C min−1, and then held for 15 min. CO2 was used as the reference gas. All samples were measured in duplicate if sufficient material was available, and values are given in per mil VPDB. Standard deviations of replicate analyses of all odd-numbered n-alkanes analyzed (C23 to C35) were less than 0.25 ‰(C23,0.10 ‰ ± 0.07 ‰; C25, 0.07 ‰ ± 0.05 ‰; C27, 0.08 ‰ ± 0.06 ‰; C29, 0.06 ‰ ± 0.06 ‰; C31, 0.09 ‰ ± 0.06 ‰; C33, 0.07 ‰ ± 0.06 ‰; C35, 0.08 ‰ ± 0.06 ‰). Accuracy and precision were determined by analyses of an external n-alkane standard calibrated against the A4-Mix isotope standard (Arndt Schimmelmann, Indiana University) and measured repetitively every six samples. The precision (% RSD) and accuracy (bias compared to the offline value determined via elemental analysis) of the internal standard (δ13C ‰ ± 0.3 ‰) were 1.6 % and −0.27‰, respectively. Compound-specific stable hydrogen isotope δD values were determined using a TRACE GC Ultra (column and temperature program are the same as for δ13C) coupled to a Finnigan MAT 253 IRMS via a pyrolysis reactor (operating at 1420 ∘C). H2 was used as the reference gas, and all samples were measured as duplicates when sufficient sample volume was available. Reported values are in per mil Vienna Standard Mean Ocean Water (VSMOW). Standard deviations of replicate analyses of all n-alkanes analyzed (C23 to C35) were less than 3 ‰(C25, 1.0 ‰ ± 0.59 ‰; C27, 1.08 ‰ ± 0.67 ‰; C29, 0.49 ‰ ± 0.54 ‰; C31, 0.46 ‰ ± 0.46 ‰; C33, 0.62 ‰ ± 0.46 ‰; C35, 0.68 ‰ ± 0.56 ‰). Accuracy and precision were determined by analyses of an external n-alkane standard calibrated against the A4-Mix isotope standard (Arndt Schimmelmann, Indiana University) measured repeatedly every six samples. The precision (% RSD) and accuracy (bias compared to the offline value) of the internal standard (δD ‰ ± 3 ‰) were 1.4 % and 0.03 ‰, respectively. The H3 factor was repeatedly measured and gave a value of 4.8 ± 0.1 over the whole measurement series.
3.4 Distributional parameters of n-alkanes
The carbon preference index (CPI) and the average chain length (ACL) were adapted from Cooper and Bray (1963) and Poynter and Eglinton (1990), respectively. The following calculations were made:
Carbon preference index.
Average chain length.
Relative concentration (contribution) [%].
3.5 Statistical analyses
All statistical analyses were performed using R software (R version 4.0.3 and RStudio version 1.4.1103). To test whether statistically significant differences occurred between the sub-environments, the Kruskal–Wallis test was performed using the stat_cor_mean() function of the “ggpubr” package (version 0.4.0). When the p value indicated that differences (p<0.05) between sub-environments were evident, the test was supplemented with a pairwise Wilcoxon rank sum test (base package “stats”) to determine which sub-environments had significant differences between them. The Benjamini and Hochberg “BH” method was used to adjust p values. Correlation coefficients were calculated by using the stat_cor function with the default Pearson method of the ggpubr package (version 0.4.0). Box-and-whisker plots were generated using the “ggplot2” system (version 2.3.3.3) of the “tidyverse” package (version 1.3.0) and ggpubr (version 0.4.0) and the geom_boxplot() function implemented here. Here, the median of the respective data is shown as a solid line and the lower and upper hinges correspond to the first (25th percentile) and third (75th percentile) quartiles. The lower/upper whisker extends from the lower/upper hinge to the smallest/largest value if it is not smaller/larger than 1.5 times the interquartile range from the hinge. Otherwise, the respective data point is drawn as a single point representing an outlier. For the principal component analysis (PCA) performed, missing values of the data set were first imputed using the impute.PCA() function and applying the regularized iterative PCA algorithm of the “missMDA” package (version 1.18). Subsequently, the actual PCA calculations were performed by using the prcomp() function (base package stats).
4.1 Chemical parameters of bulk organic matter
Total organic carbon (TOC), as a measure of organic matter (OM) content, increased in surface sediments from the upper reach to the swamp sub-environment, where samples contained the highest amounts of TOC, ranging from 0.9 % to 8.1 % (Table 1 and Fig. 4). Higher variance is observed for the upper reach, floodplain, and swamp sub-environment, compared to very narrow ranges of values in the delta (1.4 %–1.8 %) and lake sub-environment (1.4 %–1.7 %). Samples from the floodplain and swamp sub-environments show significantly higher ratios compared to the other sub-environments (p<0.05, Table 1). To estimate the total amount of plant-wax input to the sub-environments, the sum of the concentrations of all long-chain odd-numbered n-alkanes was considered (Table 1 and Fig. 4). When normalized to sample mass, delta and lake samples contained significantly lower amounts of plant-wax-derived lipids compared to swamp samples (p<0.005). However, when normalized to organic carbon, no significant differences were detected between any of the sub-environments investigated (p>0.05). Bulk OM δ13C shows more depleted values in the samples from the upper reach and the swamp sub-environments than in the other sub-environments, but statistical evidence is present only for the distinction between the swamp sub-environment on the one hand and the delta and lake sub-environments on the other (p<0.05).
Table 1Chemical parameters of sedimentary bulk organic matter: total organic carbon content (TOC) in % dry weight (DW), carbon-to-nitrogen ratio (), summed concentration of medium to very long-chain plant-wax-derived n-alkanes normalized to dry weight, and organic carbon (OC), and bulk organic carbon isotopic composition in per mil in reference to Vienna Pee Dee Belemnite.
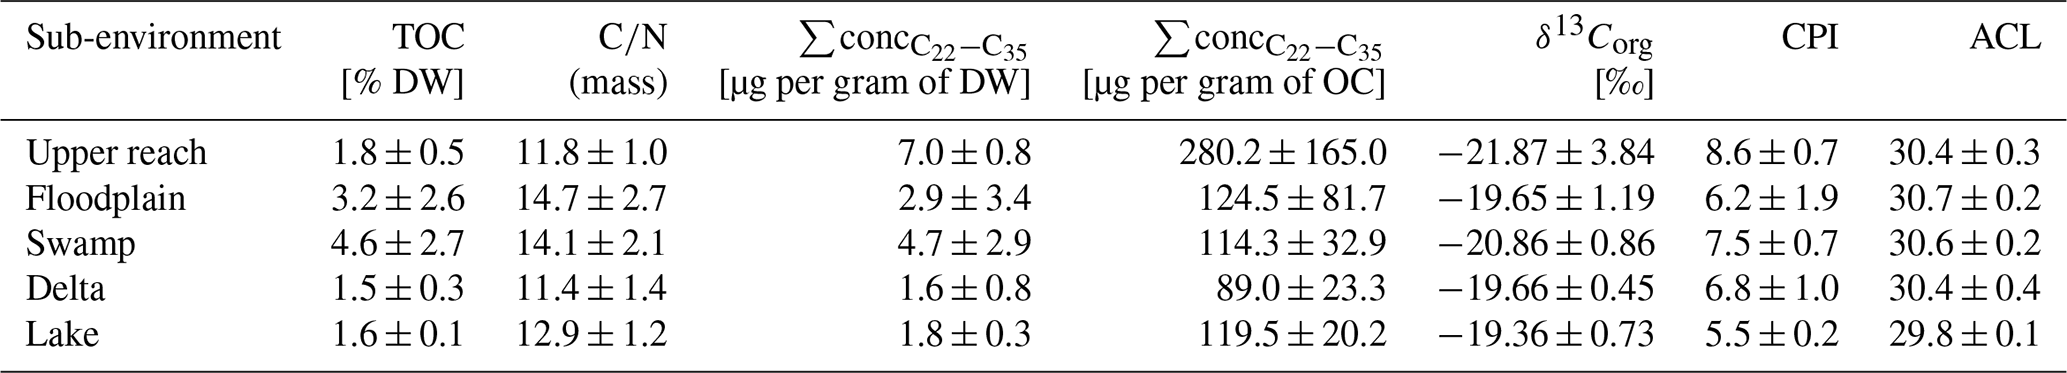
Displayed are the median and the median absolute deviation of analyzed parameters. For CPI and ACL, the averages and standard deviations are displayed.
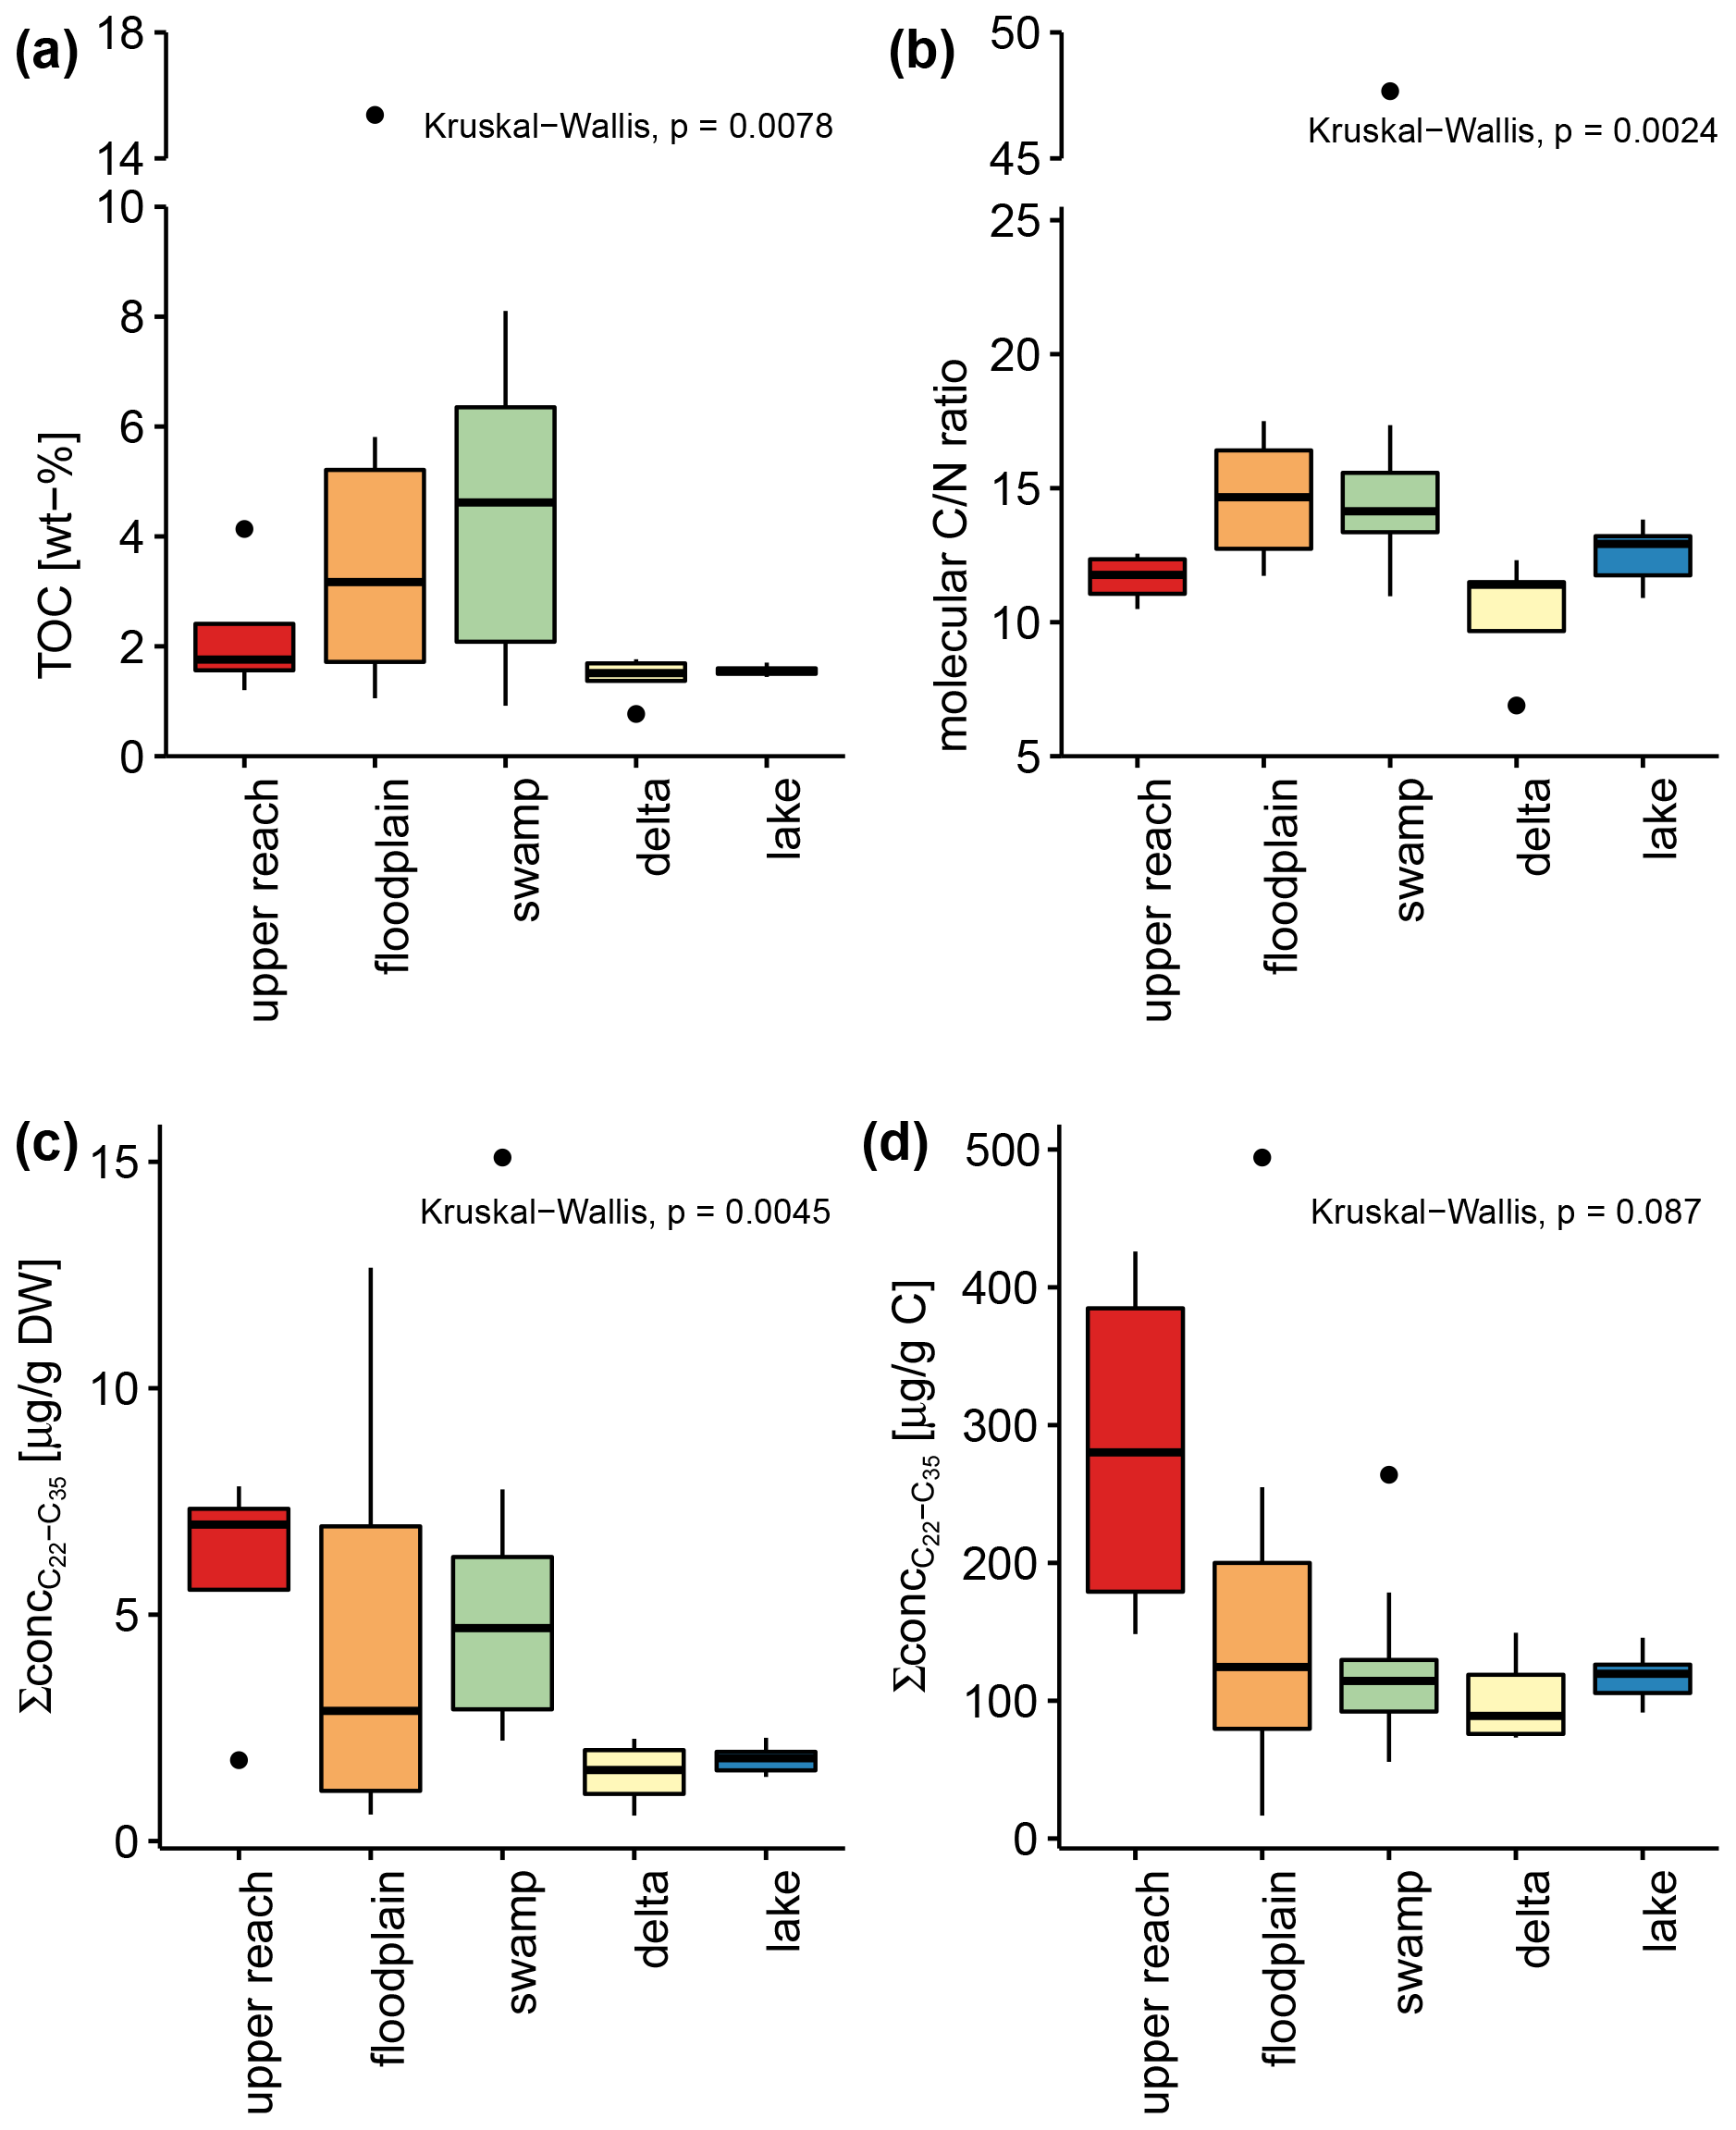
Figure 4Box-and-whisker plots show total organic carbon content as a percent of dry weight (a), carbon-to-nitrogen ratios (b), summed concentration of long-chain n-alkanes normalized to dry weight (c), and summed concentration of long-chain n-alkanes normalized to organic carbon (d) of all surface sediments. The colors of each box refer to the assigned sub-environments of the Mkhuze Wetland System. Note that the y axis of (a) and (b) is broken.
4.2 Thermal analysis of bulk organic matter
The HI values show a decreasing trend from the upstream (ca. 115 mg HC per gram of TOC for upper reach and 100 mg HC per gram of TOC for floodplain; Fig. 5a) to the downstream sub-environments (ca. 75 mg HC per gram of TOC for swamp and delta; ca. 60 mg HC per gram of TOC for lake; Fig. 5a). The range around the mean value is generally small (ca. 25 mg HC per gram of TOC), except for floodplain samples which displayed a high variability, ranging between ca. 50 and 135 mg HC per gram of TOC (Fig. 5a). The R-index values show a comparable pattern with decreasing mean values from upstream (>0.60 for upper reach and floodplain; Fig. 5b) to downstream sub-environments (<0.60 for swamp, delta, and lake; Fig. 5b). The highest values were measured in floodplain samples (>0.65, Fig. 5b), while swamp samples displayed the highest variance, splitting into two groups (ca. 0.55 and 0.65, Fig. 5b). The I-index values revealed an inverse pattern with low values in upstream sub-environments (ca. 0.1 for upper reach and floodplain, Fig. 5c), high values for the downstream sub-environments (ca. 0.3 for delta and lake, Fig. 5c), and swamp samples divided into two groups (ca. 0.06 and 0.22, Fig. 5c).
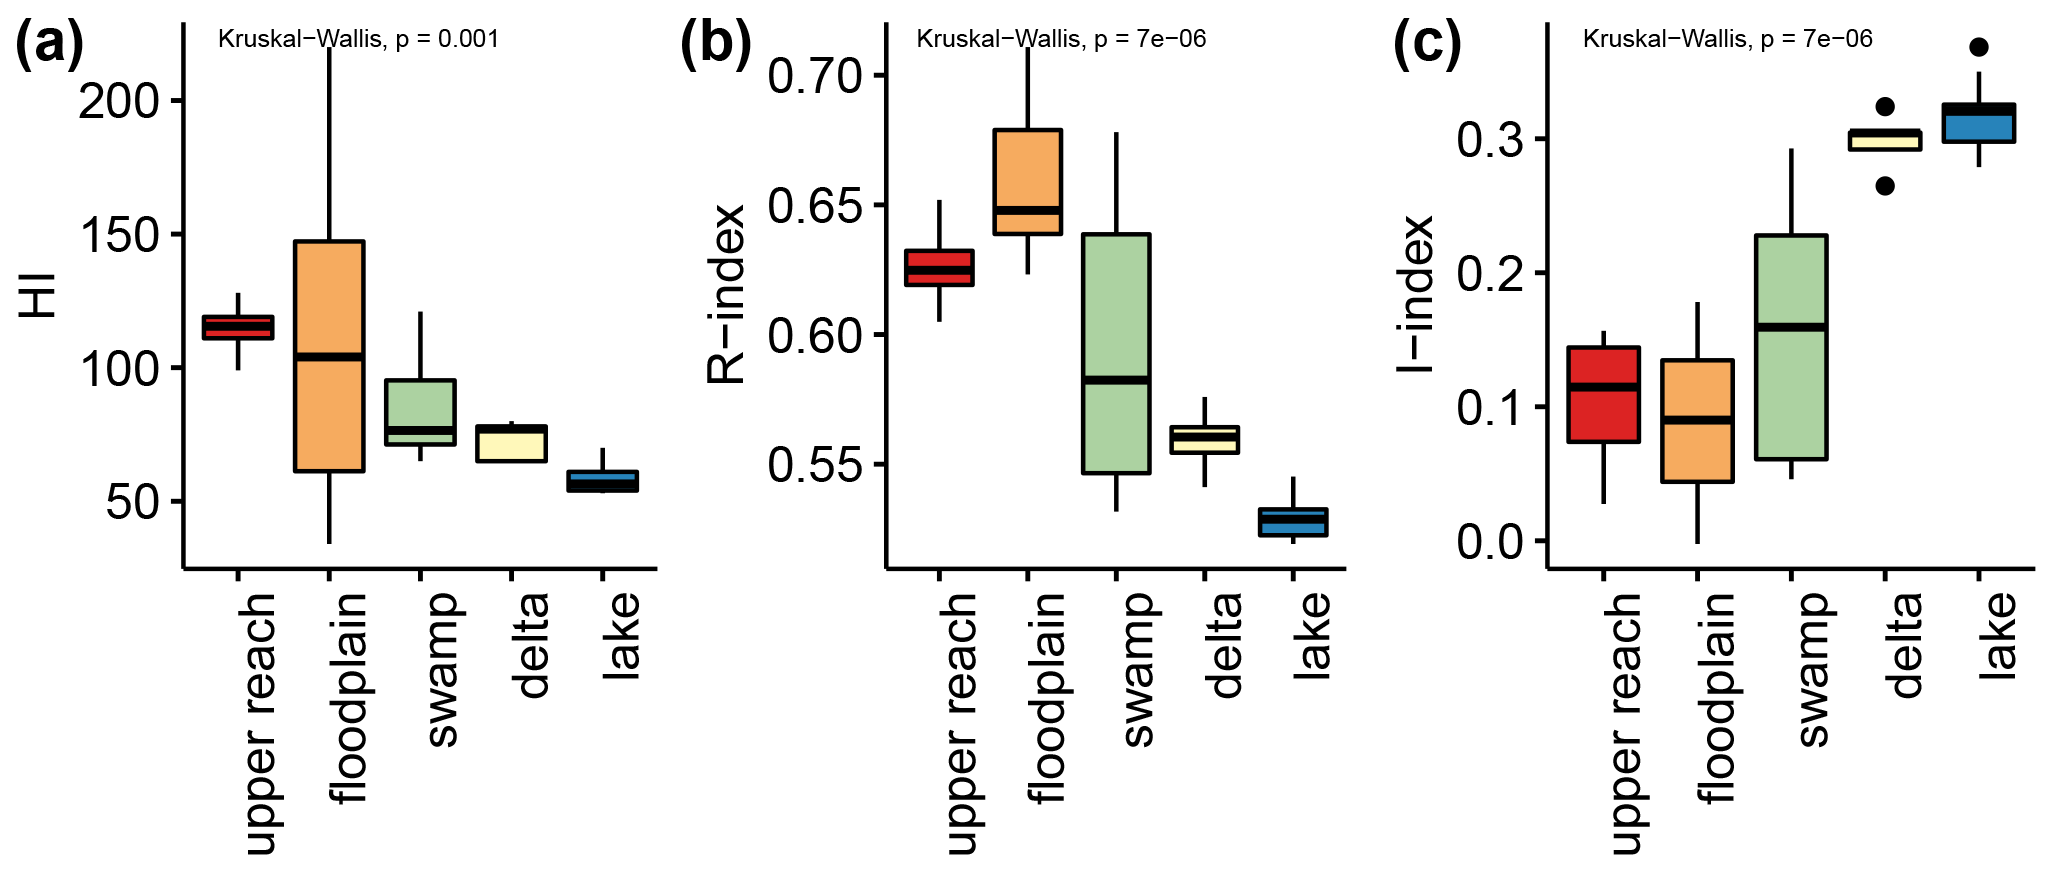
Figure 5Displayed are the indices determined by Rock-Eval analyses. The hydrogen Index (HI, a), R index (b), and I index (c), as introduced by Sebag et al. (2016), are displayed grouped by assigned sub-environments (see Fig. 1 and Sect. 3.1.1) of the Mkhuze Wetland System.
In the diagram (Fig. 6) the studied samples are projected onto the decomposition line describing the linear relationship between R and I when the gradual decomposition of the most labile constituents controls the OM transformation (i.e., stabilization). Lake and delta samples contain the most labile OM (R<0.57 and I>0.25, Fig. 6) while upper reach and floodplain samples contain the most stable OM (R>0.62 and I<0.25, Fig. 6) with swamp samples falling in between these extremes (Fig. 6). It is important to highlight that floodplain and swamp samples display high dispersion around the decomposition line in comparison with the strong correlation (R2>0.9) usually observed for composts, litters, and topsoils (Albrecht et al., 2015; Sebag et al., 2016).
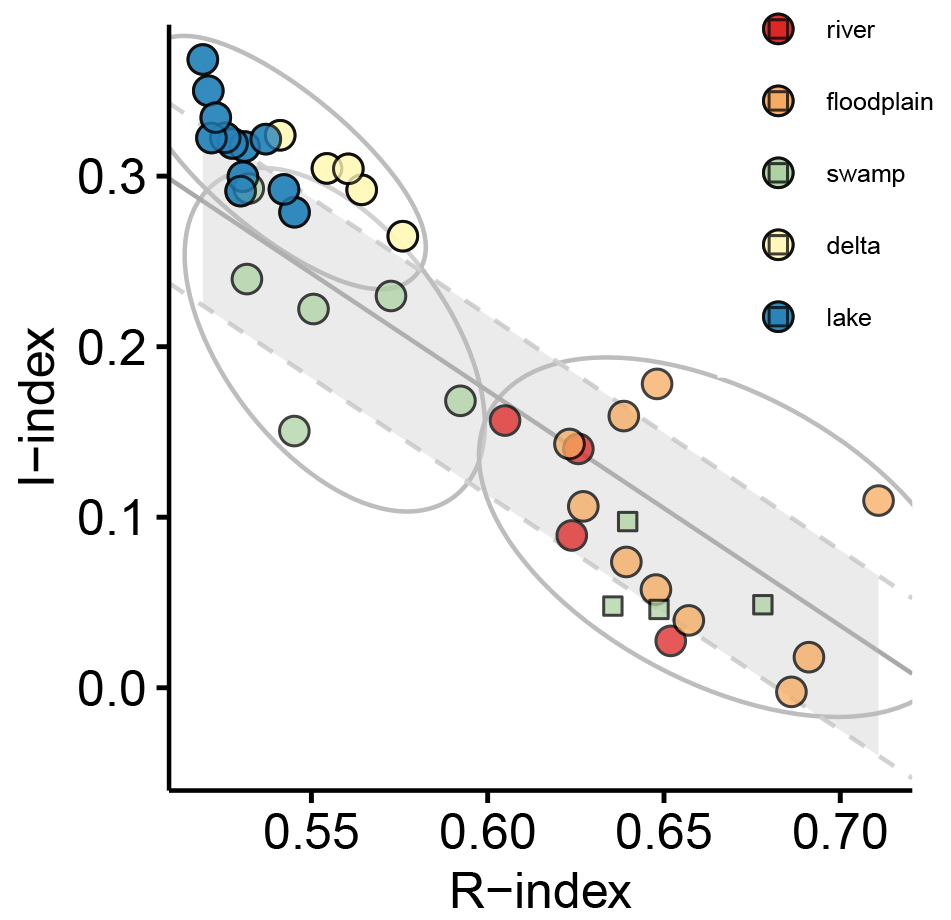
Figure 6 diagram. Symbol colors reflect the sub-environment (see Fig. 1 and Sect. 3.1.1) origin of the sedimentary organic matter: red denotes upper reach; orange denotes floodplain; green denotes swamp; yellow denotes delta; blue denotes lake. The grey-shaded area bordered by dashed grey lines refers to the linear regression describing the continuum from biological tissue to a mixture of decomposition constituents (decomposition line; Malou et al., 2020). Green circles and squares denote splitting up of swamp samples into groups of differing degradation state, while grey-bordered ellipses indicate more general splitting of the data set into groups regardless of their depositional origin.
4.3 Distribution patterns and stable carbon isotopic composition of n-alkanes
All surface sediment samples analyzed contained long-chain, odd-numbered n-alkanes (C23 to C35). The carbon preference index (CPI) has average values of 6.8 ± 1.5 for all surface sediments, confirming that n-alkanes originated from plant waxes due to the characteristic odd-over-even dominance. The CPI of the collected plant samples was 11.4 ± 6.4. The average chain length (ACL) for surface sediment samples was 30.2 ± 0.5, reflecting the high proportion of longer-chain n-alkanes, and 29.6 ± 1.9 for plant samples.
4.3.1 Plant samples
The sampled plants can be distinguished from each other based on their relative n-alkane distribution patterns and corresponding δ13C signatures. Aquatic plants belonging to the Nymphaeaceae family (common water lilies) show a symmetrical distribution around the two dominant n-alkanes C27 (31.2 % ± 0.7 %) and C29 (33.0 % ± 4.8 %) (Fig. 7a). Similarly, P. australis (common reed), an emergent aquatic plant species, also shows high concentration of the C27 n-alkane (22.1 % ± 1.2 %), but the dominance of C29 (41.9 % ± 9.9 %) determines the n-alkane distribution pattern (Fig. 7b). Based on their stable carbon isotope signatures, these aquatic plants are classified as C3 plants (Nymphaeaceae, δ13C ‰ ± 0.61 ‰; P. australis, δ13C ‰ ± 0.55 ‰). The C4 (δ13C ‰) wetland sedge C. papyrus (common papyrus, Fig. 7c) shows a symmetrical distribution around the dominant n-alkane C31 (31.9 %) accompanied by comparatively similar contributions of the n-alkanes C29 (19.5 %) and C33 (12.8 %). It is striking that the sum of the relative concentrations of the long-chain, odd-numbered n-alkanes is just over 70 %; the remainder is accounted for by the respective even-numbered n-alkanes, of which C32 (15.3 %) has the largest share. The distribution pattern of another Cyperaceae species, namely the C3 (δ13C ‰) plant C. alternifolius (umbrella papyrus, Fig. 7d), is characterized by predominantly the C31 n-alkane (66.1 %). Wetland grasses, such as C4 (δ13C ‰ ± 0.21 ‰) plant V. cuspidata (hippo grass, Fig. 7e), exhibit co-dominant concentrations of the n-alkanes C27 (27.9 % ± 0.9 %) and C29 (26.8 % ± 2.3 %) homologues going along with the occurrence of the very long-chain n-alkanes C31 (11.7 % ± 1.6 %), C33 (8.9 % ± 2.5 %), and C35 (9.4 % ± 1.5 %). Cynodon dactylon (bermuda grass, Fig. 7f), another C4 (δ13C ‰ ± 0.06 ‰) wetland grass, is clearly determined by the low dispersion around the dominant very long-chain n-alkane C33 dictating the appearance of the distribution with a 56.7 % ± 8.8 % share (C31=23.5 % ± 11.8 %, and C35=8.1 % ± 6.5 %).
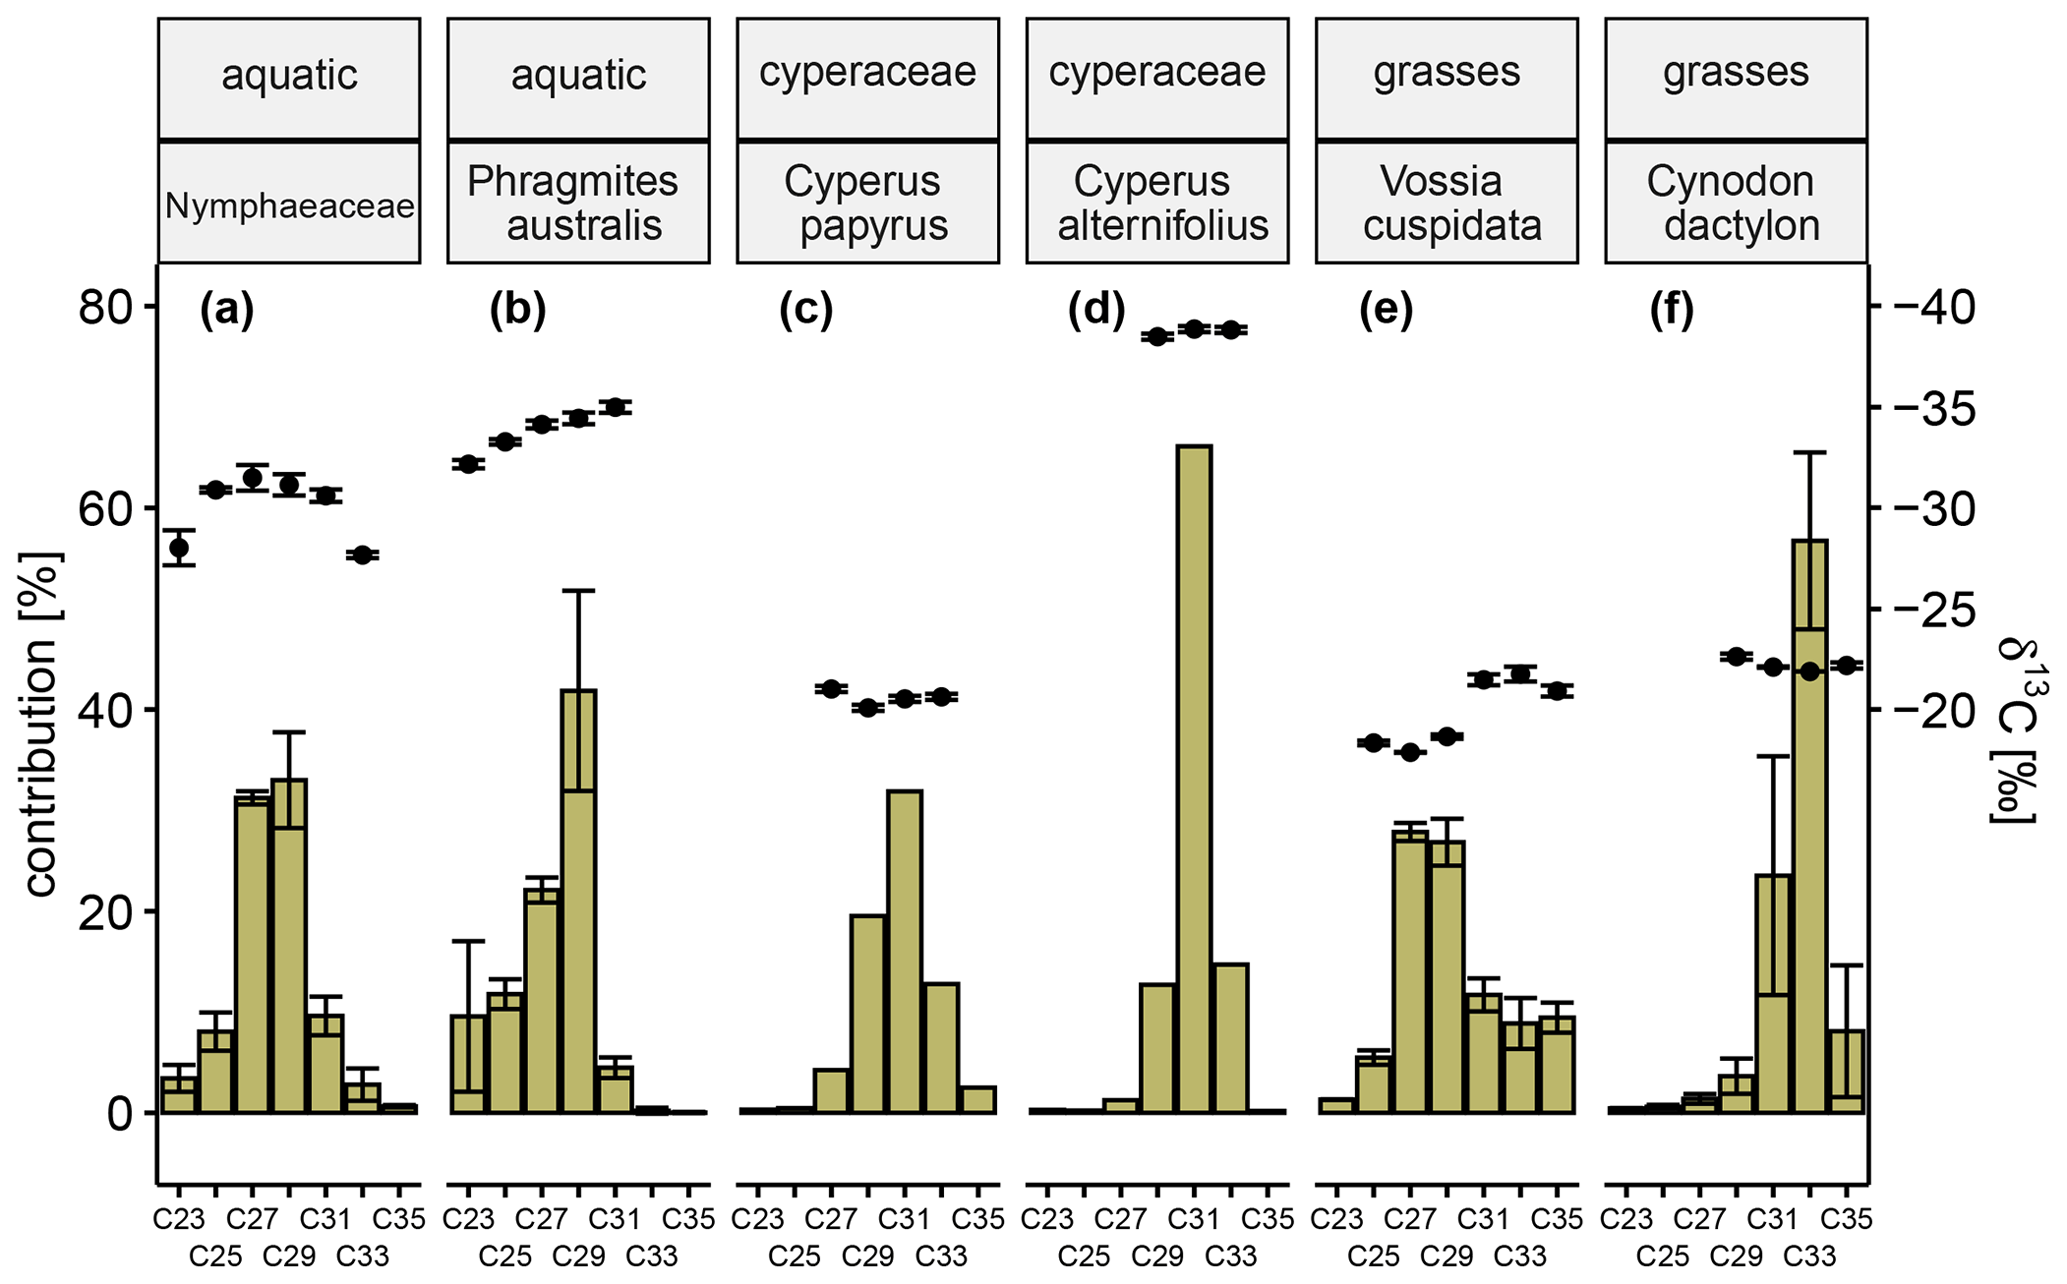
Figure 7Green-colored bars show the relative concentration of long-chain, odd-numbered n-alkanes (C23–C25) of Nymphaeaceae (a), Phragmites australis (b), Cyperus papyrus (c), Cyperus alternifolius (d), Vossia cuspidata (e), and Cynodon dactylon (f). Black circles represent corresponding carbon isotope values in reference to Vienna Pee Dee Belemnite (‰ VPDB) of each n-alkane. Error bars represent the respective standard deviation. When several representatives of one species were analyzed (a, b, e, f), the error bars reflect natural heterogeneity, while for the others they reflect the analytical uncertainty. When the analytical errors in repeated measurements are below 0.3 ‰, the intra-laboratory long-term error (± 0.3 ‰) is displayed instead. The same routine applies to n-alkanes if no repeated measurement was possible due to insufficient sample quantity.
4.3.2 Surface sediments
Figure 8 shows the relative concentrations of n-alkanes and their stable isotopic signatures for carbon and hydrogen in surface sediments within each sub-environment of the Mkhuze Wetland. For simplicity, not all individual n-alkanes are displayed, but a reduced representation is shown. For reduction, the individual n-alkanes are grouped so that only the parameters of their representatives are shown to illustrate the exemplary trends. This grouping was made on the basis of visual criteria (trends across the wetland system) and verified by statistical means. The results of a principal component analysis (not shown) provide information about variables that contain redundant information. For further validation, the coefficients of the linear correlation between the individual variables were used. All methods show that the following grouping is justified: (i) the parameters shown for the C25 n-alkane also reflect trends in the C23 n-alkane (contribution R2=0.72, p<0.001; δ13C R2=0.91, p<0.001); (ii) the parameters shown of the C29 n-alkane also reflect the trends of the C31 n-alkane (contribution R2=0.61, p<0.001; δ13C R2=0.86, p<0.001; δD R2=0.66, p<0.001); and (iii) the presented parameter trends of the C33 n-alkane are also representative of the C35 n-alkane (contribution R2=0.55, p<0.001; δ13C R2=0.95, p<0.001). The C27 homologue shows a correlation with both C25 (δ13C R2=0.90, p<0.001; δD R2=0.78, p<0.001) and C29 (δ13C R2=0.90, p<0.001; δD R2=0.82, p<0.001) for the stable isotope values but no stronger correlation in terms of relative contribution to any of the homologues (R2<0.5). The medium-chain n-alkanes C23 and C25 show an increasing contribution downstream (upper reach → floodplain → swamp → delta → lake), the contribution of C25 ranging from 1.5 % ± 0.3 % in the upper reach sub-environment to 5.4 % ± 0.9 % in the lake sub-environment (Fig. 8a). The corresponding stable carbon isotope signatures show a mixed signal (Fig. 8d) with enhanced influence of C3 vegetation in the upper reach and swamp sub-environments, respectively (Fig. 8d). δD values show similar ranges for the upper reach to the swamp sub-environment with a slight decrease in mean values downstream and more enriched values in samples from the delta and lake sub-environment (Fig. 8g). The long-chain n-alkanes C29 and C31 show similar contributions to all sub-environments (C29,13.6 % ± 2.1 %; C31,22.1 % ± 2.1 %), except for a significantly stronger contribution in the upper reach samples (C29,18.4 % ± 2.1 %; C31,28.8 % ± 3.1 %; p<0.05; Fig.8b). The corresponding stable carbon isotope signatures show a stronger influence of C3 vegetation (Fig. 8e). Decreasing mean δD values were observed from the upper reach sub-environment (mean δD ‰, Fig. 8h) to the swamp sub-environment (mean δD ‰, Fig. 8h). The hydrogen isotopic composition of the long-chain n-alkanes in the downstream lake sub-environment (Fig. 8h) was in contrast significantly higher (mean δD ‰) compared to the swamp and floodplain sub-environments (p<0.05). The very long-chain n-alkanes C33 and C35 contribute on average 22.6 % ± 3.8 % (C33) and 6.5 % ± 1.7 % (C35) to all sub-environments, with a maximum contribution in samples from the swamp region (C33, 27.6 % ± 7.5 %; C35, 8.8 % ± 1.2 %; Fig. 8c). Carbon isotopic values of the very long-chain n-alkanes show a large C3 vegetation influence in the upper reach sub-environment and large variance in the floodplain sub-environment associated with a strong C4 influence that decreases slightly thereafter (Fig. 8f). The hydrogen isotopic composition was similar across all sub-environments, apart from the lake samples, which were characterized by elevated values (Fig. 8i).
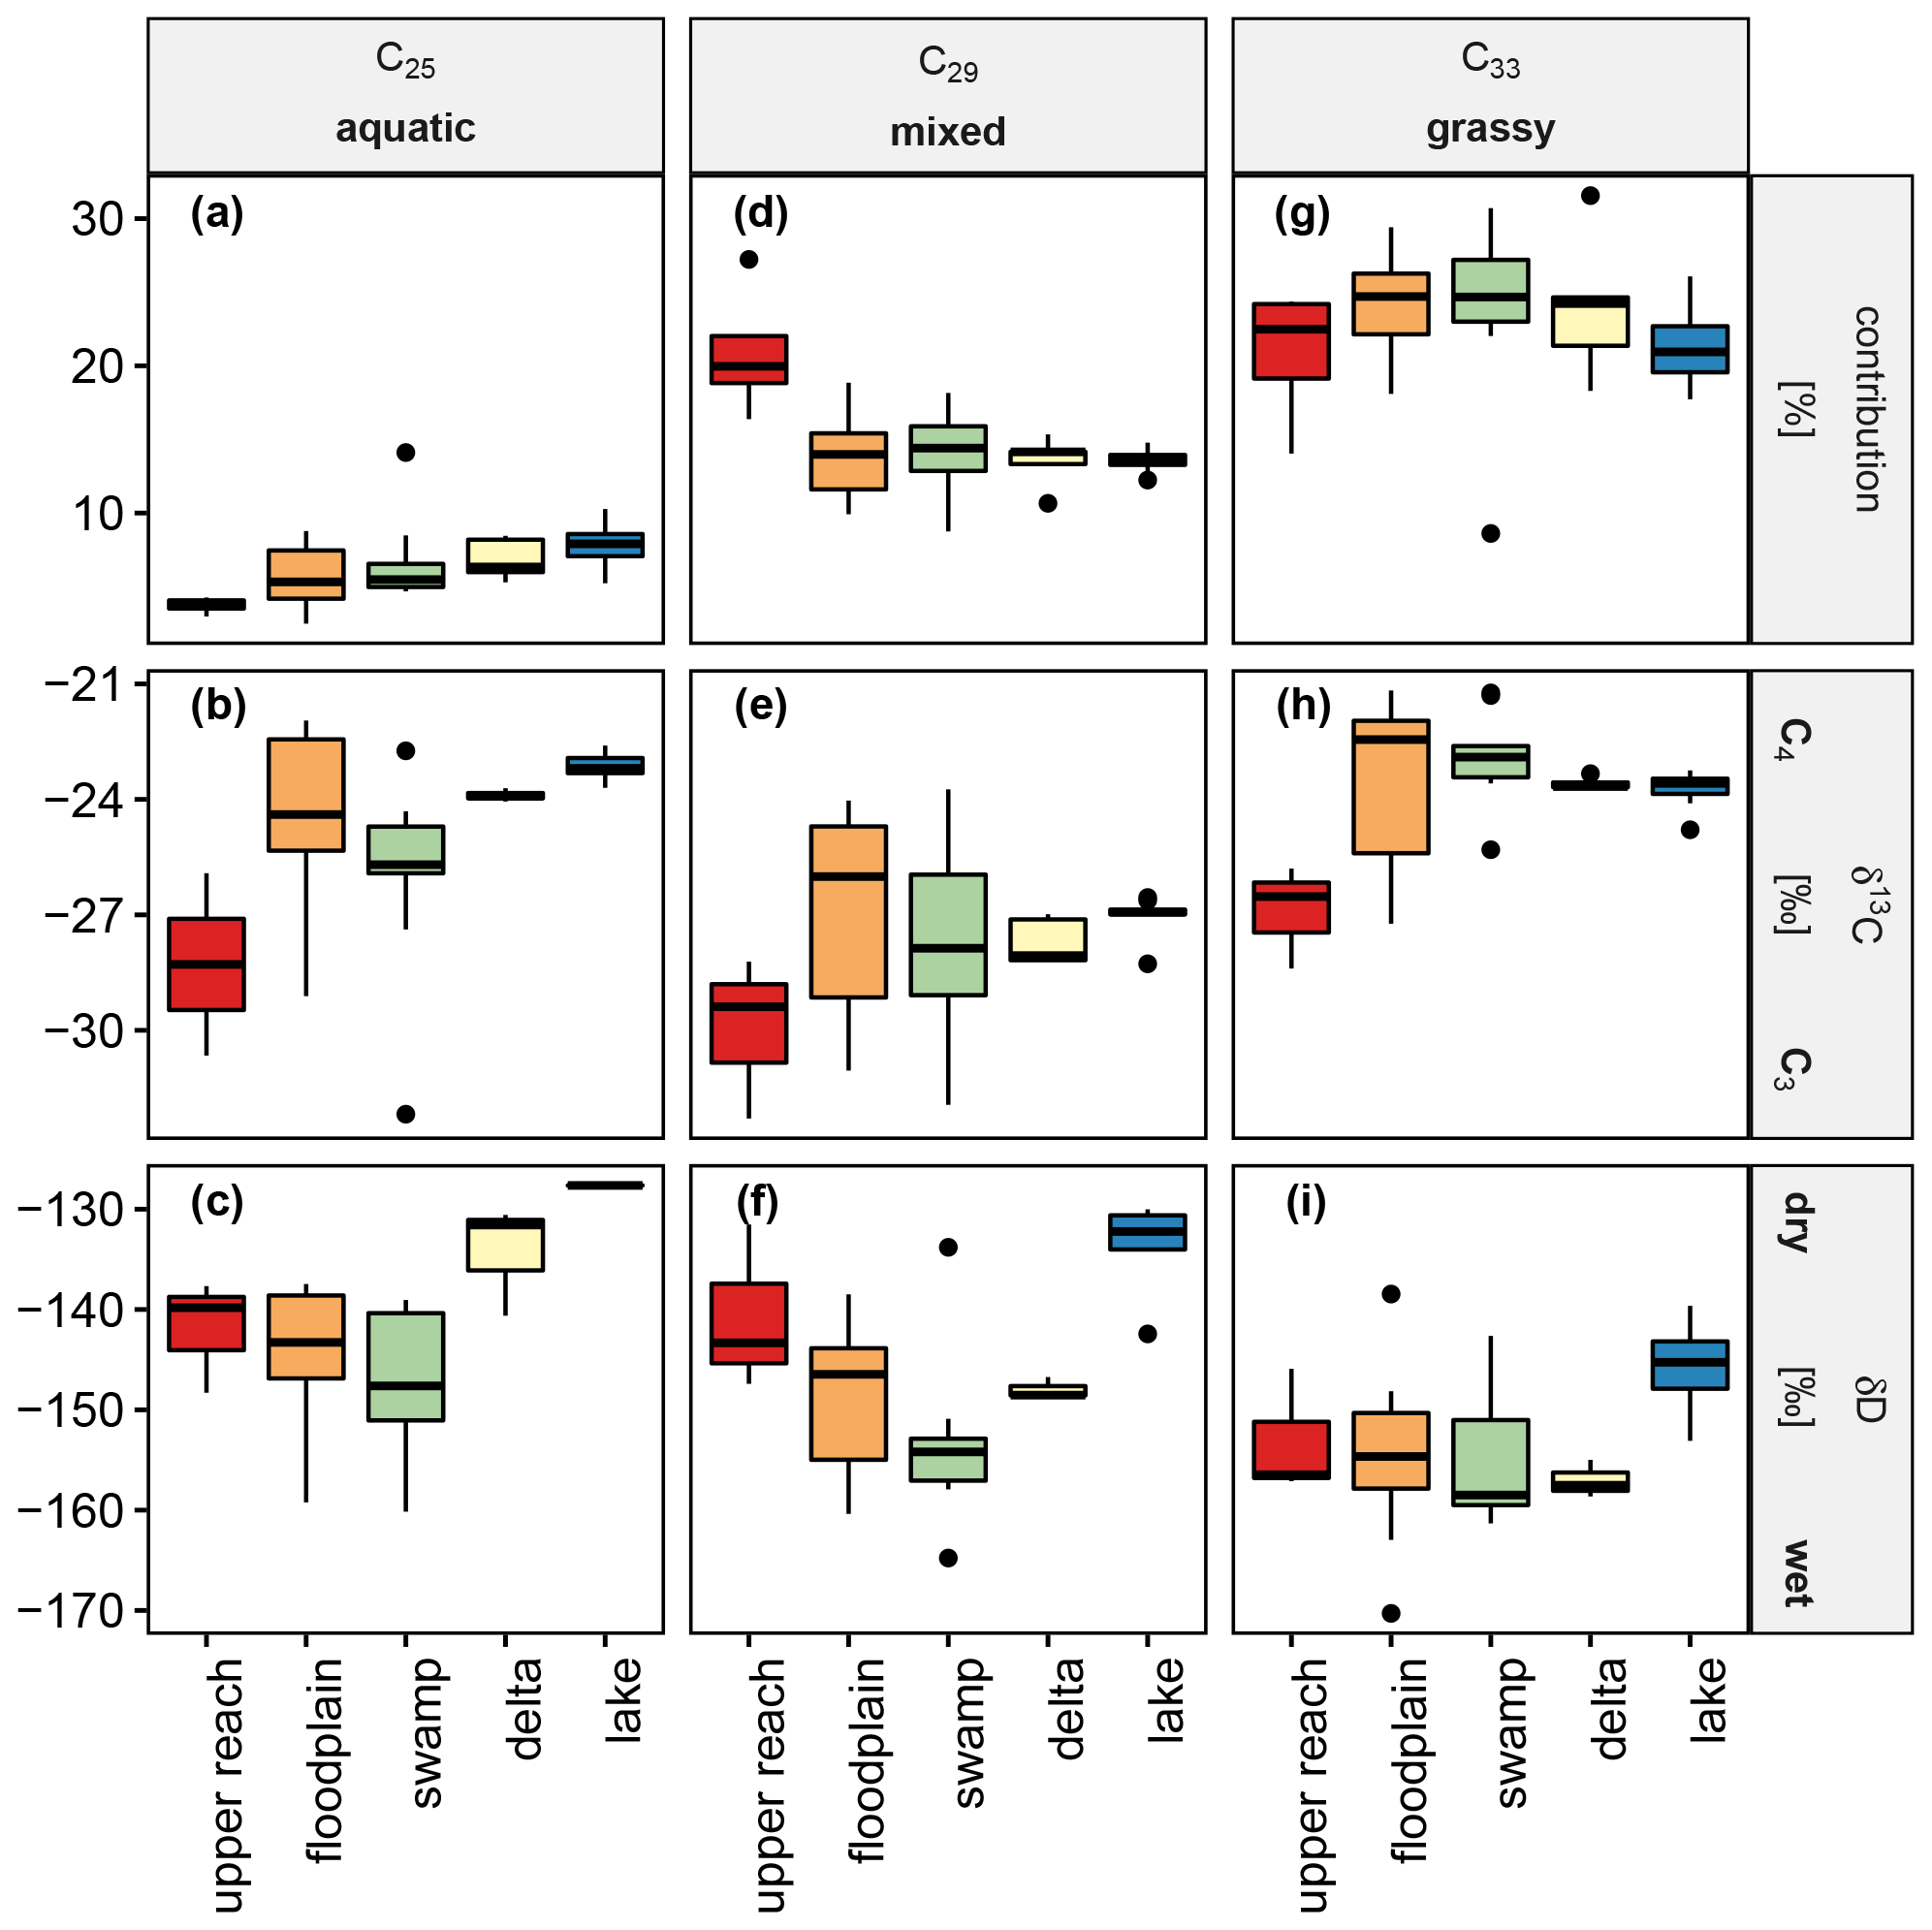
Figure 8Box-and-whisker plots show the relative concentration in percent (a, d, g), carbon isotope signatures with respect to VPDB in per mil (b, e, h) and hydrogen isotope signatures with respect to VSMOW in per mil (c, f, i) of the n-alkanes C25, C29, and C33 as representatives of the groups of n-alkanes classified as aquatic, mixed, and grassy.
5.1 Plants n-alkane distribution patterns as indicators of variable hydrological conditions
Differences in n-alkane distribution patterns between plant species have previously been observed in numerous studies (Ficken et al., 2000; Carr et al., 2014; Badewien et al., 2015; Liu et al., 2018). We are aware that the use of n-alkane distribution patterns to distinguish plant species and chemotaxonomic fingerprinting approaches is more controversial when transferring findings from one area to another, as it has been shown that variations can also occur within specific species and even between plant parts of the same species (Bush and McInerney, 2013). Because all investigated plants, however, are from the same system and, when possible, multiple plants of the same species were sampled in different sub-environments of the wetland system, we believe that influences such as variability due to different climatic growing conditions and intra-species variability are small. Although this study investigates a rather small plant sample set, the obtained data show very good agreement with the literature (as discussed in more detail in the following text). For this reason, we are confident that the assignment of specific n-alkanes as marker compounds provides realistic indicators of inputs of dominantly occurring plants when performing intra-system comparisons especially when combined with information provided by compound-specific isotope analyses.
Aquatic plant species such as the floating Nymphaea spp. (common water lily) and the emergent wetland sedge P. australis (common reed) are primarily found in stagnant or slow-flowing waters. These two C3 plants (Fig. 7a and b) show elevated concentrations of the medium-chain n-alkanes (C23 and C25), while all other investigated plants show no or negligible concentrations (Fig. 7c to f). The occurrence of the medium-chain n-alkanes, although in previous studies reported as predominant alkanes of the respective distribution patterns (Baas et al., 2000; Ficken et al., 2000; Liu et al., 2019), therefore seems to be explicitly indicative of aquatic plant types. The riparian zone along the Mkhuze River is dominated by typical woody plants of riparian forests, such as A. xanthophloea (fever tree) and F. sycomorus (sycamore fig) (Neal, 2001). While no representative of these species was sampled in this study, woody plants, such as trees, are generally well studied (Vogts et al., 2009). Tropical C3 trees are typically characterized by high C29 and C31 n-alkane contributions (in sum >75 %), while the adjacent homologues show concentration mainly below 5 %. Especially the C29 n-alkane was recently described as “a responsive sensor” of tropical tree vegetation (Zhang et al., 2021), which further corroborates its earlier observed tree bias (Garcin et al., 2014). However, we pursue identifying alkane homologues which are present in certain plant types and absent or only very low concentrated in others so that they can serve as marker compounds for system-specific vegetation types. For this reason and given the high contributions of this alkane to nearly all displayed distribution patterns, we decided to regard the C29 and C31 n-alkane as more of an integrated signal which possibly originates from a diverse range of plants.
The wetland sedges C. papyrus (Papyrus; C4) and C. alternifolius (Umbrella papyrus; C3) (Fig. 7c and d) predominantly produce C31 n-alkanes, a finding consistent with the limited data available (Collister et al., 1994). Their natural occurrence is restricted to permanently flooded soils, whereas C4 wetland grasses such as V. cuspidata (hippopotamus grass) or Cynodon dactylon (Bermuda grass) (Fig. 7e and f) are mostly tolerant of intermittent soil flooding and other disturbances (Holm et al., 1977), so they generally occur widely. Like many (sub)tropical grasses these plant types are characterized by the presence of the very long-chain n-alkanes (C33 and C35) (Rommerskirchen et al., 2006; Vogts et al., 2012), which cannot be found in relevant concentrations in the other investigated plants (Fig. 7).
5.2 Spatial comparison of organic matter characteristics in surface sediments
Clear differences between the individual sub-environments of the Mkhuze Wetland System become evident by comparing the organic matter characteristics with respect to stability, degree of degradation, primary contributing vegetation, and its hydrological growth conditions. That these differences sometimes appear small in absolute values is attributable to the system itself. The discussed sub-environments (see Sect. 3.1.1) cannot be separated from each other by sharp boundaries, but rather the transitions are shown to be gradual in their ecological manifestations. That the characteristics of the OM differ despite this gradual transformation underscores the importance of the individual environments to the system.
5.2.1 Upper reach of the Mkhuze River
Bulk organic matter in surface sediments of the upper reach is generally low in concentration (see Table 1 and Fig. 4a) and shows geochemical and thermal characteristics of degraded OM (HI ≅ 120 mg per gram of TOC, =11.8 ± 1.0; Figs. 5a and 4b), which can be related to an advanced decomposition of thermally labile constituents (R≅0.63; I=0.15; linear distribution within the limits of the decomposition line in the diagram; Fig. 6). The concentration of n-alkanes from plant waxes per dry weight and organic carbon is highest in the surface sediments of the upper reach (Table 1 and Fig. 4c–d), suggesting relative enrichment due to OM degradation. The relative contribution of long-chain n-alkanes C29 and C31 (Fig. 8d) is also highest while carrying the lowest carbon isotopic signature (Fig. 8e) of all sub-environments. Recently, it was shown that especially the C29 n-alkane might serve as a responsive sensor for tropical tree vegetation (Zhang et al., 2021). Regarding the upper reaches and despite the C29 cluster serving as integrated signal from all plant contributions, the strong deviation of the relative contribution and carbon isotopic composition of this cluster in comparison with all other sub-environments suggests that sedimentary OM of the upper reach is indeed dominated by inputs of woody plant sources. OM in the surface sediments of the upper reach therefore reflects allochthonous contributions from the hinterland, since the Mkhuze River is primarily lined with riparian forests (Neal, 2001). These trees do not tolerate flooding or water-saturated soil conditions, so they are found on the elevated channel levees. This interpretation of the hinterland as an origin is further supported by the stable hydrogen isotopes of the respective n-alkanes, particularly evident in C29 (Fig. 8f). The relatively enriched δD values suggest that the plants producing them were exposed to relatively dry conditions during their growth phase. These dry conditions are met to a large extent in the hinterland, considering that the precipitation gradient across the Mkhuze Wetland System is nearly halved from 1000 mm yr−1 in the east near the coast to 600 mm yr−1 at the Lebombo Mountains (Maud, 1980; Fig. 2).
5.2.2 Floodplain
Bulk organic matter in surface sediments of the floodplain is characterized by high variability in both quantity (TOC, Table 1 and Fig. 4a) and quality (HI, R and I indices, Fig. 5a–c). It splits into three groups: the first one corresponds to samples poor in OM (TOC <1.5 %) and in hydrocarbon compounds (HI <80 mg HC per gram of TOC). A second group corresponds to samples rich in OM (TOC >5 %) and hydrocarbon compounds (HI > 150 mg HC per gram of TOC). The third group presents an intermediate situation (TOC ≈ 2 %–3 %, HI ≈ 100 mg HC per gram of TOC). An explanation could consider that this gradual evolution corresponds to a more or less advanced degradation of the sedimentary OM. However, the I index does not support this interpretation, since the samples with the lowest HI present the least advanced degree of decomposition of thermally labile compounds (I>0.1) and conversely. In addition, floodplain samples show a wide dispersion in the diagram (Fig. 6), which excludes a gradual decomposition. By analogy with previous work on soils, such nonlinear signatures would rather be associated with OM mixtures of varying quality and origin, which is consistent with such a heterogeneous depositional environment.
Mixing of OM is further corroborated by the plant-wax concentration per dry weight and organic carbon (Table 1 and Fig. 4c–d) showing great variances and therefore that n-alkanes are partly relatively enriched during not only degradation of OM but also inputs of fresh organic material, which is in line with elevated ratios (Fig. 4b). High variability is also evident in the relative contributions of the n-alkanes (Fig. 8a, d, g) and the corresponding isotopic signatures (Fig. 8b, e, h), suggesting a mixture of OM of different origin. The floodplain of the Mkhuze Wetland System is characterized by a mosaic of different smaller wetland types, ranging from the locally distinct river channel to seasonally flooded areas to permanent (open) water bodies. The ecologically complex and variable diversity is reflected in all the parameters. However, it is noteworthy that, despite this predominant scatter, the strongest input of C4 vegetation is clearly observed in floodplain sedimentary organic matter (Fig. 8b, e, h). This cannot be explained solely by the occurrence of C4 grasses such as Cynodon dactylon or Echinochloa pyramidalis, which are recognized as important floodplain vegetation communities (Neal, 2001), since the “grassy” n-alkane input is not significantly higher than in the downstream swamp (Fig. 8g). In addition, Neal (2001) describes the floodplain being increasingly used for growing crops, such as the C4 crops sugarcane or corn (Fig. 3), which could explain the particularly strong C4 signal.
5.2.3 Swamp
The bulk organic matter in surface sediments of the swamp sub-environment is similarly characterized by high variability in both quantity (TOC, Table 1 and Fig. 4a) and quality (HI, R and I indices, Fig. 5a–c). As for floodplain samples, swamp samples show high dispersion depending on their OM and hydrocarbon content with both contents decreasing downstream, suggesting a more or less advanced degradation of the sedimentary OM. Similarly to the floodplain sub-environment, the I index opposes this assumption, as the samples with the lowest HI (HI <75) correspond to the least advanced degree of decomposition (I>0.2), pointing towards a mixture of OM related to overprinting of fluvially introduced OM by in situ-produced OM. The diagram, while samples are globally aligned with the decomposition line, also reveals two distinct clusters (Fig. 6 green circles and squares) showing a degraded and much less degraded signature, respectively. These results indicate that the swamp sub-environment contains a wide range of situations, such as those similar to upstream (upper reach, floodplain) and downstream (delta, lake) sub-environments, and therefore reflects a transitional sub-environment. Furthermore, the organic matter is characterized by comparatively high ratios, i.e., corroborating the addition of in situ-produced organic matter to the samples. This is also seen in the summed concentration of n-alkanes normalized to dry weight (Fig. 4c) being very high, while those normalized to organic carbon (Fig. 4d) are rather low, which is attributed to fresh organic matter inputs.
A similar pattern to that for the bulk organic matter can also be observed in the plant-wax data. While the n-alkane distribution closely resembles that of the floodplain (Fig. 8a, d, g), the corresponding carbon isotope signatures (Fig. 8b, e, h) show a slightly lower influence of C4 vegetation and rather a mixed signal with slightly increasing C3 vegetation influence downstream. This can be explained by the increased input of the locally dominant vegetation into the sedimentary organic matter (overprinting), although to a moderate extent. The Mkhuze Swamps are dominated by the C3 wetland sedge P. australis (Fig. 7b) occurring along the eastern margin and large stands of the C4 wetland grass Cynodon dactylon (Fig. 7f) at the western side of the river channel. Limited overprinting of fluvially transported OM by local vegetation is further supported by the slightly lighter hydrogen isotopic composition of the respective n-alkanes (Fig. 8c, f, i) indicating only slightly wetter growth conditions in the swamp area compared to the floodplain although water availability is much more persistent within the swamp area.
5.2.4 Delta and lake
The organic matter of the lake and delta samples shows striking differences when compared with that of the upstream sub-environments of the Mkhuze Wetland System. The bulk organic matter in surface sediments shows a homogeneous signature with the lowest contents in OM (TOC <1.6 %, Table 1 and Fig. 4a) and hydrocarbon compounds (HI < 80 mg HC per gram of TOC, Fig. 5a) of all sub-environments and a high degree of preservation of thermally labile fractions (I>0.3, partly in the upper limit of the decomposition line). These results differ drastically from the OM results of the upstream sub-environments, but they do not reflect aquatic autochthonous contributions (as indicated by the low HI). Although the sources of this OM are probably terrestrial, it is not detrital (allochthonous) OM, reworked from the catchment area, but rather a proximal (para-autochthonous) contribution.
In contrast to bulk OM, the relative contribution of all marker n-alkane clusters (aquatic, mixed, and grassy) (Fig. 8a, d, g) and their corresponding signatures (Fig. 8b, e, h) are not significantly different from the upstream sub-environments. This implies that the sources of plant waxes regarding vegetation type are similar or possibly even the same as upstream. However, considering that the scatter of the compound-specific carbon isotopic composition correlates with the diversity of contributing vegetation types (Magill et al., 2019), the narrow spread of stable and bulk carbon isotope signatures (Fig. 8b, e, h and Table 1) suggests that a more restricted range of plant types contributes to lake surface sediments. The associated hydrogen isotopic signatures (Fig. 8c, f, i) indicate that the contributing plants, although very similar to the upstream sub-environments, experienced completely different hydrological conditions during growth. The n-alkanes in the lake surface sediments have a higher median δD compared to that of the upstream swamp by about 10 ‰ (C31) to 20.0 ‰ (C29). There are several scenarios which could explain these significantly higher δD values. Considering that the upstream swamp area and the sampled lake transect are located in the same longitudinal range, the variation in sedimentary δD is therefore reflecting neither variation in precipitation amount nor isotopic depletion due to inland movement of water vapor, like in the case of the upper reach sub-environment. Given the geomorphological and climatic characteristics of Lake St Lucia (shallow average depth, large surface area, strong wind regime, and high evaporation rates and salinity), the higher hydrogen isotope signatures of the sedimentary n-alkanes in the lake probably resulted from a dominant contribution of vegetation, which uses the lake's water as a dominant water source. Considering that not only the hydrogen isotopic composition of sedimentary plant-wax-derived n-alkanes but also the previously discussed bulk parameters show striking differences compared to the swamp area more or less excludes the concept of a contribution of a sole unknown “end-member” which alters all mentioned variables except relative n-alkane concentration and their carbon isotopic composition although only minimally contributing. All in all, the most reasonable explanation is that the majority of the organic matter in the lake area is not derived from the upstream sub-environments, although this might be unexpected.
5.3 Transport of sedimentary organic matter in the Mkhuze Wetland System
Characterization of organic matter in surface soils and sediments in terms of its stability, degree of decomposition, and source vegetation, as well as the hydrological conditions in the sub-environments of the Mkhuze Wetland System, allows us to evaluate transport pathways. Plant-wax lipids are hydrophobic and associated with the mineral component of sediments (Hedges and Keil, 1995; Keil et al., 1997; Wiesenberg et al., 2010). Thus, the transport and identification of sources and sinks are not exclusive to the organic component of the sediment. In the Mkhuze Wetland System, sedimentary organic matter derived from the Mkhuze River catchment (hinterland) is primarily deposited on the floodplain but also reaches the Mkhuze Swamps. Under present conditions, Lake St Lucia does not receive significant quantities of sedimentary material from the hinterland or material exported from the Mkhuze Swamps. Cores retrieved from Lake St Lucia (Benallack et al., 2016) and the Mkhuze River bayhead delta (Humphries et al., 2020) indicate that sedimentary infilling commenced 6000–7000 years ago when the main oceanic inlets at Lake St Lucia sealed in response to rising sea levels during the Holocene transgression. This deposited sediment gave rise to the establishment of the current Mkhuze Swamps which currently act as an effective trap, preventing the rapid siltation of the lake. An exception might be large disruptive events (severe droughts or strong floods) which occur occasionally and could induce erosion of the swamp or bypassing of its filter capacity. The high concentration of plant waxes in the upper reach of the Mkhuze River is due to low-flow conditions during the sampling campaign. During the spring season, the river typically has low or even no flow (McCarthy and Hancox, 2000), resulting in the deposition of suspended sediment in the riverbed. The upper reach samples collected in this study thus likely reflect the “undiluted” hinterland signal (highly degraded, stable, C3, most likely of woody origin). During periods of high flow, transported fluvial OM is deposited along the river channel and on the floodplain by bank overtopping (Neal, 2001; Ellery et al., 2011). The even greater stability of the organic matter in the floodplain illustrates this depositional process (Fig. 5b). Proportions of the organic matter found in the Mkhuze Swamps are characteristically similar to that of the floodplain, so we assume that some suspended material is transported into and deposited in this sub-environment. This is clearly shown in the R index vs. I index diagram (Fig. 6), which shows several clusters of samples: (i) high R index, low I index (upper reach, floodplain, swamp subset); (ii) low R index, medium I index (swamp subset); and (iii) low R index, high I index (lake and delta samples). Surface sedimentary OM from the delta and, in particular, the lake is significantly different from the upstream sub-environments. As discussed in the previous section, not only does Lake St Lucia experience a significantly lower input of sedimentary organic matter and plant waxes, but also the deposited material does not originate from the upstream sub-environments through which the Mkhuze River flows but most likely from the shoreline around the lake.
Analyzed signals from the lake area are thus local in origin and reflect locally occurring eco(hydro)logical conditions. Characteristics of transported hinterland signals predominate only in the upstream areas (upper reach, floodplain, swamp), although in the floodplain and the Mkhuze Swamps slight overprinting by locally introduced signals can be observed. Based on these findings, we suggest that the Mkhuze Swamps ultimately capture material transported by the Mkhuze River and consequently the integrated signals encompassing the river catchment, at least under current climatic and environmental conditions.
5.4 Local ecological implications
The identification of the Mkhuze Swamps as the ultimate sink for suspended OM from the Mkhuze River confirms previous studies that the Mkhuze Wetland System, specifically the floodplain and swamp, acts as an efficient filter upstream of Lake St Lucia (Taylor, 1982b; Stormanns, 1987). The current active filtering and trapping function of high sediment loads, including organic sedimentary organic load from the Mkhuze River, may prevent the otherwise rapid siltation of Lake St Lucia. OM in the surface sediments of Lake St Lucia originates primarily from lakeshore vegetation, as indicated by the lake transect data shown in comparison with upstream areas of the system. However, some studies (Taylor, 1982b) assume that the Mkhuze Swamps, in their function as freshwater reservoirs (“sponges”) (Alexander, 1973), are also responsible for input of OM, serving as a potential energy source in Lake St Lucia. Our data on particulate organic matter contradict this assumption, showing that sedimentary particulate OM is presently not transported from the hinterland nor exported directly from the swamp. In contrast, OM export from wetlands occurs primarily through the export of dissolved organic matter (DOM; Cole et al., 2007), which accounts for about 90 % of total OM (Reddy and DeLaune, 2008). In saline waters, like Lake St Lucia, DOM is likely to flocculate (Ardón et al., 2016). Assuming that OM is exported in dissolved form from the Mkhuze Swamps, it should thus be detectable in the lake transect surface samples, but this was not observed in this study. In part, this could be due to the fact that a significant proportion of DOC may be removed by sorption onto precipitating oxides when sediments contain substantial amounts of aluminum and iron metal oxides (McKnight et al., 1992), as is the case in upstream sub-environments. With the employed methods we cannot confirm either any particulate OC or DOC export from the Mkhuze Wetland System into Lake St Lucia. The present study is the first examining sedimentary OM transport within the Mkhuze Wetland System, revealing that OM is indeed transported even to the Mkhuze Swamps and is not just deposited near the river channel and on the floodplain. Three processes might play a role for transport of material into the swamps: (i) the ongoing eastward progression of the floodplain (McCarthy and Hancox, 2000), (ii) transport during severe flood events caused by cyclones and cutoff lows, or (iii) channelization having an impact on the transport efficiency. The transport path of the Mkhuze River has been dramatically shortened by channelization (see Sect. 3.1.3). As a result, most of the Mkhuze River water now flows through the Tshanetshe–Demazane Canal System (Stormanns, 1987; Neal, 2001; Barnes et al., 2002; Ellery et al., 2003), which may have altered sediment transport. A shift in the area of deposition of material transported by the Mkhuze River is likely to affect the local vegetation distribution, i.e., causing a shift in the ecological zones by altered substrate conditions. In general, however, the Mkhuze Wetland System overall appears to exhibit high resilience against natural and/or anthropogenically induced changes. The severe drought of 2016, which led to the drying of large parts of Lake St Lucia, does not seem to have had any lasting impact on the filtering function of the swamps. Likewise, the establishment of the canal system also does not appear to have caused lasting damage to the filtering function of the Mkhuze Swamps.

Figure 9The figure shows a schematic summary of the characteristics and transport pathways of organic material in a terminal or flow-through wetland system under low-flow conditions. The vegetation types shown (trees, wetland sedges, grasses, and aquatic species) indicate the prominently occurring vegetation in each sub-environment of the Mkhuze Wetland System. Arrows indicate OM input and deposition, with thickness of arrows corresponding to OM quantity assumptions and colors corresponding to OM quality characteristics (dark brown: more degraded; light brown: less degraded, spatially different origin).
5.5 Fate of sedimentary organic matter in wetlands
In comparison with humid-region (tropical and temperate) wetlands, the Mkhuze Wetland System exhibits distinctive characteristics that reflect the low ratio between precipitation and potential evapotranspiration characterizing the region (Fig. 2). High evaporative demand and transmission losses from the river to the surrounding floodplain result in marked declines in both channel width and channel depth downstream (Humphries et al., 2010). Downstream decreases in discharge and stream power result in a gradual decline in the ability of the Mkhuze River to transport particulate material, ultimately terminating in the Mkhuze Swamps. Although typically unusual, such downstream changes appear to be distinctive features of wetlands found in sub-humid and semi-arid regions of the world (Tooth and McCarthy, 2007) and are likely an important reason why the Mkhuze Wetland System acts as such an efficient trap for organic material. Most large tropical and temperate river systems are associated with wetlands (Wetzel, 2001; Ward et al., 2017) along their river courses. For example, studies conducted on the Cuvette Congolaise (Runge, 2007), a large wetland system traversed by the Congo River, indicate that fluvially transported particulate OM signals from upstream sources are seasonally overprinted by storage and release of particulates in and from the wetlands (Hemingway et al., 2016, 2017). Depending on variable climatic conditions throughout the year, the Cuvette Congolaise wetlands may thus show a similar trapping function of transported material to the Mkhuze Wetland System under relatively dry conditions while showing increased export from material at higher water flows (Hemingway et al., 2017). Wetlands may thus switch from a trapping function to export of carbon depending on hydrological conditions and seasonal climatic changes. These differential trapping and export functions of wetlands need to be considered when reconstructing climatic changes based on sedimentary archives recovered from terminal lakes and offshore archives. Depending on the activity and efficiency of wetlands, material from more upstream areas will be effectively masked by wetlands depending on their hydrologic state and can even be overprinted be wetland export of OM or OM input from downstream areas. Such a process has been suggested for the transport of OM in the Amazon River system, where Andean material is effectively overprinted by lowland sources from rainforests, floodplains, and wetlands (Quay et al., 1992; Blair et al., 2004). In such cases, reconstructing environmental changes in the integrated watershed using offshore archives may thus not be possible. Wetland systems with an active trapping function effectively change the transported OM, so signals detected in offshore archives instead reflect specific sections of the river catchment. Other sediment-related proxies may also be affected by wetland trapping, so such geomorphological settings could have a much stronger influence than is often assumed. Combining environmental analyses with specific markers released from wetlands, on the other hand, allows an assessment of the hydrologic changes that lead to inefficient OM trapping and degradation of wetlands (e.g., Schefuß et al., 2016). In addition, carbon sequestration and the ability of wetlands to act as carbon sinks are considered to play an important role in the global carbon budget. There is concern that global warming may alter the hydrological balance of wetlands, releasing significant amounts of carbon to the atmosphere through direct oxidation processes or to adjacent water bodies through erosion of wetland soils, as has been observed for the Cuvette Congolaise and elsewhere (Hemingway et al., 2017). In certain cases, extreme weather events, which are expected to become more frequent as the global climate changes, have also been shown to promote the release of DOC from wetlands (Rudolph et al., 2020). It is likely that particulate material would also be exported by excessive flooding, as is similarly observed by increased flushing of terrestrial carbon into river systems (Bianchi et al., 2013). Thus, the trapping function of wetlands, overridden by overloading, would just as likely contribute to increased carbon dioxide emissions to the atmosphere through turnover of exported OM in adjacent waters.
We present a spatial assessment of TOC concentrations, OM composition (δ13C, , HI, R index, I index), n-alkane distributions, and their respective compound-specific stable carbon (δ13Cn-alkane) and hydrogen (δDn-alkane) isotope compositions along an approx. 130 km long transect of the Mkhuze River and plant-wax data from locally dominant plant species to constrain the origin and transport pathways of OM through and within the sub-environments of the Mkhuze Wetland System, South Africa. Our results indicate that degraded OM originating from the hinterland is deposited primarily on the floodplain of the Mkhuze River and partially in the downstream swamp. The Mkhuze Swamps currently efficiently trap OM under low-flow conditions, so they neither release hinterland material nor export swamp-derived OM to Lake St Lucia (Fig. 9).
The surface sediments in the upper reach show allochthonous inputs from the Mkhuze River basin. OM concentrations are low and show a degraded signature associated with a C3 woody source vegetation which experienced relatively dry growing conditions. Sedimentary OM in the floodplain and swamp exhibits high variability in both source signatures and degradation status, thus reflecting environmental diversity. A mixture of degraded OM from the hinterland and fresh OM of local origin characterizes samples from the floodplain area. In addition, the most pronounced C4 signatures are encountered and attributed to agricultural use of the floodplain. OM from surface samples in the Mkhuze Swamps also shows a degraded signature but reflects increasing inputs of local wetland sedges and wetland grasses. In contrast, OM from Lake St Lucia shows completely different characteristics, such as much lower concentrations and much less degradation due to proximal terrestrial inputs rather than reworked catchment-derived or aquatic contributions. Plant-wax data confirm these findings, pointing to lake shoreline vegetation as the main source.
This study shows that traversed or terminal wetlands under certain conditions, such as low flow – in this case a result of climatic factors, i.e., with evaporation exceeding precipitation – can capture OM so efficiently that transport from upstream areas does not occur and downstream OM originates almost exclusively from the immediate vicinity. We emphasize that such wetlands, as geomorphological features within river systems, can impact environmental studies, which assume watershed-integrated signals based on terminal sediments. In addition, disturbances, e.g., by extreme weather events, which are assumed to become more frequent under global climate change, are likely to affect the trapping function of wetlands and thus increase export of previously stored OM, leading to an increase in carbon emissions through turnover of exported OM in adjacent water bodies.
The research data are available at PANGAEA: https://doi.org/10.1594/PANGAEA.935586 (Gensel, 2021)
MZ, ES, AH, and MSH conceptualized the project; MZ and ES directed the project and acquired financial support for the project leading to this publication; DS characterized the samples with Rock-Eval analysis and interpreted related results; JG performed sample preparation and measurements, processed the data, and drafted the manuscript; MSH and JG designed figures; JG took the lead in writing the manuscript. All authors provided critical feedback and helped shape it.
The contact author has declared that neither they nor their co-authors have any competing interests.
Publisher’s note: Copernicus Publications remains neutral with regard to jurisdictional claims in published maps and institutional affiliations.
We would sincerely like to thank Letitia Pillay, Archibold Buah-Kwofie, and Lucky for their expertise, support, and energetic assistance in obtaining the material studied. Additionally, we particularly thank Lucky for his assistance in communicating with the local landowners. We thank Marcus Elvert and Hendrik Reuter for their contributions to previous versions of the paper. This study would also not have been possible without the help of technicians Ralph Kreutz and Jenny Wendt of MARUM – Center for Marine Environmental Sciences. We thank them for their support in chemical analyses and thank student assistant Abdullah Saeed Khan for assisting in bulk organic matter analyses. We thank Marion Bamford and Frank Neumann for their support and help with identifying the plant samples. We are grateful to Daniel Pillot and Herman Ravelojaona (IFPEN) for their technical and scientific support in Rock-Eval® analysis, a trademark registered by IFP Energies Nouvelles. The anonymous reviewers as well as the associate editor Sebastian Naeher are thanked very much for their critical comments and constructive advice that helped to improve this publication. Moreover, we thank the GeoB Core Repository at MARUM and PANGAEA for archiving the sediments and data used in this work. We thank Ezemvelo KZN Wildlife and iSimangaliso Wetland Park Authority for permitting us to work at Lake St Lucia. Samples were collected under the registered project, “A multi-proxy investigation into past and present environmental change at Lake St Lucia”.
This work was financially supported by the German Federal
Ministry of Education and Research (BMBF, Bonn, Germany) under the
project “Tracing Human and Climate impacts in South Africa” (TRACES),
project number 03F0798A.
The article processing charges for this open-access publication were covered by the University of Bremen.
This paper was edited by Sebastian Naeher and reviewed by two anonymous referees.
Albrecht, R., Sebag, D., and Verrecchia, E.: Organic matter decomposition: bridging the gap between Rock–Eval pyrolysis and chemical characterization (CPMAS13C NMR), Biogeochemistry, 122, 101–111, https://doi.org/10.1007/s10533-014-0033-8, 2015. a, b, c, d
Alexander, W. J. R.: Some comment on the diversion of the Mkuze river in Lake St. Lucia, Tech. rep., https://saeis.saeon.ac.za/Document/2051 (last access: 24 May 2022), 1973. a, b, c, d
Alexander, W. J. R., Stormanns, C., and Breen, C.: Some aspects of the hydrology of the Mkuze Swamp system, in: Proceedings of the Greater Mkuze Swamp System Symposium and Workshop, Institute of Natural Resources, Pietermaritzburg, pp. 4–7, https://saeis.saeon.ac.za/Document/2093 (last access: 02 June 2022), 1986. a
Ardón, M., Helton, A. M., and Bernhardt, E. S.: Drought and saltwater incursion synergistically reduce dissolved organic carbon export from coastal freshwater wetlands, Biogeochemistry, 127, 411–426, 2016. a
Baas, M., Pancost, R., Van Geel, B., and Sinninghe Damsté, J. S.: A comparative study of lipids in Sphagnum species, Org. Geochem., 31, 535–541, https://doi.org/10.1016/S0146-6380(00)00037-1, 2000. a, b
Badewien, T., Vogts, A., and Rullkötter, J.: n-Alkane distribution and carbon stable isotope composition in leaf waxes of C3 and C4 plants from Angola, Org. Geochem., 89–90, 71–79, https://doi.org/10.1016/j.orggeochem.2015.09.002, 2015. a
Barnes, K., Ellery, W. N., and Kindness, A.: A preliminary analysis of water chemistry of the Mkuze Wetland System, KwaZulu-Natal: A mass balance approach, Water SA, 28, 1–12, https://doi.org/10.4314/wsa.v28i1.4861, 2002. a, b, c, d
Behar, F., Beaumont, V., and Penteado, H. L. D. B.: Rock-Eval 6 technology: performances and developments, Oil Gas Sci. Technol., 56, 111–134, 2001. a
Benallack, K., Green, A. N., Humphries, M. S., Cooper, J. A., Dladla, N. N., and Finch, J. M.: The stratigraphic evolution of a large back-barrier lagoon system with a non-migrating barrier, Mar. Geol., 379, 64–77, https://doi.org/10.1016/j.margeo.2016.05.001, 2016. a
Bianchi, T. S., Garcia-Tigreros, F., Yvon-Lewis, S. A., Shields, M., Mills, H. J., Butman, D., Osburn, C., Raymond, P., Shank, G. C., DiMarco, S. F., Walker, N., Reese, B. K., Mullins-Perry, R., Quigg, A., Aiken, G. R., and Grossman, E. L.: Enhanced transfer of terrestrially derived carbon to the atmosphere in a flooding event, Geophys. Res. Lett., 40, 116–122, https://doi.org/10.1029/2012GL054145, 2013. a
Blair, N. E., Leithold, E. L., and Aller, R. C.: From bedrock to burial: The evolution of particulate organic carbon across coupled watershed-continental margin systems, Mar. Chem., 92, 141–156, https://doi.org/10.1016/j.marchem.2004.06.023, 2004. a
Bush, R. T. and McInerney, F. A.: Leaf wax n-alkane distributions in and across modern plants: Implications for paleoecology and chemotaxonomy, Geochim. Cosmochim. Ac., 117, 161–179, https://doi.org/10.1016/j.gca.2013.04.016, 2013. a, b
Carr, A. S., Boom, A., Grimes, H. L., Chase, B. M., Meadows, M. E., and Harris, A.: Leaf wax n-alkane distributions in arid zone South African flora: Environmental controls, chemotaxonomy and palaeoecological implications, Org. Geochem., 67, 72–84, https://doi.org/10.1016/j.orggeochem.2013.12.004, 2014. a, b, c
Cole, J. J., Prairie, Y. T., Caraco, N. F., McDowell, W. H., Tranvik, L. J., Striegl, R. G., Duarte, C. M., Kortelainen, P., Downing, J. A., Middelburg, J. J., and Melack, J.: Plumbing the global carbon cycle: Integrating inland waters into the terrestrial carbon budget, Ecosystems, 10, 171–184, https://doi.org/10.1007/s10021-006-9013-8, 2007. a, b
Collins, J. A., Schefuß, E., Heslop, D., Mulitza, S., Prange, M., Zabel, M., Tjallingii, R., Dokken, T. M., Huang, E., MacKensen, A., Schulz, M., Tian, J., Zarriess, M., and Wefer, G.: Interhemispheric symmetry of the tropical African rainbelt over the past 23 000 years, Nat. Geosci., 4, 42–45, https://doi.org/10.1038/ngeo1039, 2011. a
Collister, J. W., Rieley, G., Stern, B., Eglinton, G., and Fry, B.: Compound-specific δ13C analyses of leaf lipids from plants with differing carbon dioxide metabolisms, Org. Geochem., 21, 619–627, https://doi.org/10.1016/0146-6380(94)90008-6, 1994. a
Cooper, J. E. and Bray, E. E.: A postulated role of fatty acids in petroleum formation, Geochim. Cosmochim. Ac., 27, 1113–1127, 1963. a
Dansgaard, W.: Stable isotopes in precipitation, Tellus, 16, 436–468, https://doi.org/10.3402/tellusa.v16i4.8993, 1964. a
Diefendorf, A. F. and Freimuth, E. J.: Extracting the most from terrestrial plant-derived n-alkyl lipids and their carbon isotopes from the sedimentary record: A review, Org. Geochem., 103, 1–21, 2017. a, b
Disnar, J.-R.: Étude expérimentale de la fixation de divers métaux sur une matière organique sédimentaire d'origine algaire: maturation thermique des composés formés, PhD thesis, https://tel.archives-ouvertes.fr/tel-00586303 (last access: 2 June 2022), 1982. a
Disnar, J. R.: Determination of maximum paleotemperatures of burial (MPTB) of sedimentary rocks from pyrolysis data on the associated organic matter: basic principles and practical application, Chem. Geol., 118, 289–299, https://doi.org/10.1016/0009-2541(94)90182-1, 1994. a
Disnar, J. R., Guillet, B., Keravis, D., Di-Giovanni, C., and Sebag, D.: Soil organic matter (SOM) characterization by Rock-Eval pyrolysis: Scope and limitations, Org. Geochem., 34, 327–343, https://doi.org/10.1016/S0146-6380(02)00239-5, 2003. a, b, c, d
Eglinton, G. and Hamilton, R. J.: Leaf epicuticular waxes, Science, 156, 1322–1335, https://doi.org/10.1126/science.156.3780.1322, 1967. a
Ellery, W. N., Dahlberg, A. C., Strydom, R., Neal, M. J., and Jackson, J.: Diversion of water flow from a floodplain wetland stream: an analysis of geomorphological setting and hydrological and ecological consequences, J. Environ. Manage., 68, 51–71, 2003. a, b, c, d, e, f
Ellery, W. N., Grenfell, S. E., Grenfell, M. C., Humphries, M. S., and Barnes, K. B.: The wetlands, in: Ecology and Conservation of Estuarine Ecosystems: Lake St. Lucia as a Global Model, May 2019, chap. 6, edited by: Perissinotto, R., Stretch, D. D., and Taylor, R. H., Cambridge University Press, 95–112, https://doi.org/10.1017/CBO9781139095723.008, 2011. a, b
Espitalié, J., Laporte, J., Madec, M., Marquis, F., Leplat, P., Paulet, J., and Boutefeu, A.: Méthode rapide de caractérisation des roches mètres, de leur potentiel pétrolier et de leur degré d'évolution, Rev. Inst. Fr. Pet, 32, 23–42, 1977. a
Espitalie, J., Deroo, G., and Marquis, F.: Rock-Eval pyrolysis and its applications (part one), Oil Gas Sci. Technol., 40, 563–579, 1985. a
Espitalié, J., Deroo, G., and Marquis, F.: La pyrolyse Rock-Eval et ses applications, Deuxième partie, Rev. I. Fr. Petrol., 40, 755–784, 1985. a
Ficken, K. J., Li, B., Swain, D. L., and Eglinton, G.: An n-alkane proxy for the sedimentary input of submerged/floating freshwater aquatic macrophytes, Org. Geochem., 31, 745–749, 2000. a, b, c
Garcin, Y., Schefuß, E., Schwab, V. F., Garreta, V., Gleixner, G., Vincens, A., Todou, G., Séné, O., Onana, J. M., Achoundong, G., and Sachse, D.: Reconstructing C3 and C4 vegetation cover using n-alkane carbon isotope ratios in recent lake sediments from Cameroon, Western Central Africa, Geochim. Cosmochim. Ac., 142, 482–500, https://doi.org/10.1016/j.gca.2014.07.004, 2014. a, b
Gat, J. R.: Oxygen and hydrogen isotopes in the hydrologic cycle, Annu. Rev. Earth Planet. Sc., 24, 225–262, https://doi.org/10.1146/annurev.earth.24.1.225, 1996. a
Gensel, J., Humphries, M., Zabel, M., Sebag, D., Hahn, A., and Schefuß, E.: Bulk organic matter composition, n-alkane distribution patterns, and compound-specific stable isotope compositions of modern surface sediments and plants of South Africa's largest freshwater wetland, PANGAEA [data set], https://doi.org/10.1594/PANGAEA.935586, 2021. a
Hedges, J. I. and Keil, R. G.: Sedimentary organic matter preservation: an assessment and speculative synthesis – a comment, Mar. Chem., 49, 81–115, https://doi.org/10.1016/0304-4203(95)00011-F, 1995. a
Hemingway, J. D., Schefuß, E., Dinga, B. J., Pryer, H., and Galy, V. V.: Multiple plant-wax compounds record differential sources and ecosystem structure in large river catchments, Geochim. Cosmochim. Ac., 184, 20–40, https://doi.org/10.1016/j.gca.2016.04.003, 2016. a
Hemingway, J. D., Schefuß, E., Spencer, R. G., Dinga, B. J., Eglinton, T. I., McIntyre, C., and Galy, V. V.: Hydrologic controls on seasonal and inter-annual variability of Congo River particulate organic matter source and reservoir age, Chem. Geol., 466, 454–465, https://doi.org/10.1016/j.chemgeo.2017.06.034, 2017. a, b, c
Hemond, H. F. and Benoit, J.: Cumulative Impacts o n Water Quality Functions of Wetlands, Environ. Manage., 12, 639–653, 1988. a
Herrmann, N., Boom, A., Carr, A. S., Chase, B. M., Granger, R., Hahn, A., Zabel, M., and Schefuß, E.: Sources, transport and deposition of terrestrial organic material: A case study from southwestern Africa, Quaternary Sci. Rev., 149, 215–229, https://doi.org/10.1016/j.quascirev.2016.07.028, 2016. a
Herrmann, N., Boom, A., Carr, A. S., Chase, B. M., West, A. G., Zabel, M., and Schefuß, E.: Hydrogen isotope fractionation of leaf wax n-alkanes in southern African soils, Org. Geochem., 109, 1–13, https://doi.org/10.1016/j.orggeochem.2017.03.008, 2017. a
Hockun, K., Mollenhauer, G., Ling, S., Hefter, J., Ohlendorf, C., Zolitschka, B., Mayr, C., Lücke, A., and Schefuß, E.: Using distributions and stable isotopes of n-alkanes to disentangle organic matter contributions to sediments of Laguna Potrok Aike, Argentina, Org. Geochem., 102, 110–119, https://doi.org/10.1016/j.orggeochem.2016.10.001, 2016. a
Holm, L. G., Plucknett, D. L., Pancho, J. V., and Herberger, J. P.: The world's worst weeds. Distribution and biology, University press of Hawaii, ISBN: 0824802950, 1977. a
Hou, J., D'Andrea, W. J., MacDonald, D., and Huang, Y.: Evidence for water use efficiency as an important factor in determining the δD values of tree leaf waxes, Org. Geochem., 38, 1251–1255, https://doi.org/10.1016/j.orggeochem.2007.03.011, 2007. a
Humphries, M., Green, A., Higgs, C., Strachan, K., Hahn, A., Pillay, L., and Zabel, M.: High-resolution geochemical records of extreme drought in southeastern Africa during the past 7000 years, Quaternary Sci. Rev., 236, 106294, https://doi.org/10.1016/j.quascirev.2020.106294, 2020. a
Humphries, M. S., Kindness, A., Ellery, W. N., Hughes, J. C., and Benitez-Nelson, C. R.: 137Cs and 210Pb derived sediment accumulation rates and their role in the long-term development of the Mkuze River floodplain, South Africa, Geomorphology, 119, 88–96, https://doi.org/10.1016/j.geomorph.2010.03.003, 2010. a, b
Hutchison, I. P. G.: The hydrology of the St. Lucia system, in: St. Lucia scientific advisory council workshop meeting at Charters Creek, Charters Creek, 15–17 February 1976, https://saeis.saeon.ac.za/Document/2092 (last access: 2 June 2022), 1976. a
Hutchison, I. P. G. and Pitman, W. V.: St. Lucia Lake Research Report. Volume 1: Climatology and hydrology of the St. Lucia Lake system, Tech. rep., 1973. a, b
Jansen, B. and Wiesenberg, G. L. B.: Opportunities and limitations related to the application of plant-derived lipid molecular proxies in soil science, SOIL, 3, 211–234, https://doi.org/10.5194/soil-3-211-2017, 2017. a
Jenks, M. A. and Ashworth, E. N.: Plant epicuticular waxes: function, production, and genetics, Horticultural Reviews, 23, 1–68, 1999. a
Johnston, C. A.: Sediment and nutrient retention by freshwater wetlands: Effects on surface water quality, Crit. Rev. Env. Contr., 21, 491–565, https://doi.org/10.1080/10643389109388425, 1991. a
Junk, W. J. and An, S.: Current state of knowledge regarding the world's wetlands and their future under global climate change: a synthesis, Aquat. Sci., 75, 151–167, https://doi.org/10.1007/s00027-012-0278-z, 2013. a
Kahmen, A., Hoffmann, B., Schefuß, E., Arndt, S. K., Cernusak, L. A., West, J. B., and Sachse, D.: Leaf water deuterium enrichment shapes leaf wax n-alkane δD values of angiosperm plants II: Observational evidence and global implications, Geochim. Cosmochim. Ac., 111, 50–63, https://doi.org/10.1016/j.gca.2012.09.004, 2013. a
Keil, R. G., Mayer, L. M., Quay, P. D., Richey, J. E., and Hedges, J. I.: Loss of organic matter from riverine particles in deltas, Geochim. Cosmochim. Ac., 61, 1507–1511, https://doi.org/10.1016/S0016-7037(97)00044-6, 1997. a
Lafargue, E., Marquis, F., and Pillot, D.: Rock-Eval 6 applications in hydrocarbon exploration, production, and soil contamination studies, Rev. I. Fr. Petrol., 53, 421–437, 1998. a, b
Liu, H., Liu, Z., Zhao, C., and Liu, W.: n-Alkyl lipid concentrations and distributions in aquatic plants and their individual δD variations, Science China Earth Sciences, 62, 1441–1452, 2019. a, b
Liu, J., An, Z., and Liu, H.: Leaf wax n-alkane distributions across plant types in the central Chinese Loess Plateau, Org. Geochem., 125, 260–269, https://doi.org/10.1016/j.orggeochem.2018.09.006, 2018. a
Magill, C. R., Eglinton, G., and Eglinton, T. I.: Isotopic variance among plant lipid homologues correlates with biodiversity patterns of their source communities, PLoS ONE, 14, 1–17, https://doi.org/10.1371/journal.pone.0212211, 2019. a
Malou, O. P., Sebag, D., Moulin, P., Chevallier, T., Badiane-Ndour, N. Y., Thiam, A., and Chapuis-Lardy, L.: The Rock-Eval® signature of soil organic carbon in arenosols of the Senegalese groundnut basin. How do agricultural practices matter?, Agr. Ecosyst. Environ., 301, 107030, https://doi.org/10.1016/j.agee.2020.107030, 2020. a, b
Maud, R. R.: The climate and geology of Maputaland, in: Studies on the Ecology of Maputaland, chap. 1, edited by: Bruton, M. N. and Cooper, K. H., Rhodes University/Natal Branch of the Wildlife Society of southern Africa, 1–7, 1980. a, b
McCarthy, T. S. and Hancox, P. J.: Wetlands, in: The Cenozoic of Southern Africa, chap. 15, edited by: Partridge, T. C. and Maud, R. R. M., Oxford University Press, New York, ISBN: 0195125304, 2000. a, b, c, d, e, f
McKnight, D. M., Bencala, K. E., Zellweger, G. W., Aiken, G. R., Feder, G. L., and Thorn, K. A.: Sorption of dissolved organic carbon by hydrous aluminum and iron oxides occurring at the confluence of Deer Creek with the Snake River, Summit County, Colorado, Environ. Sci. Technol., 26, 1388–1396, 1992. a
Mitsch, W. J. and Gosselink, J. G.: Wetlands, 5th edn., John Wiley & Sons, https://doi.org/10.1108/rr-09-2015-0230, 2015. a
Neal, M. J.: The vegetation ecology of the lower Mkuze river floodplain, Northern KwaZulu-Natal: a landscape ecology perspective., Ph. D. thesis, University of Natal-Durban, http://hdl.handle.net/10413/4685 (last access: 24 May 2022), 2001. a, b, c, d, e, f, g, h, i, j, k, l, m, n, o, p
Perissinotto, R., Stretch, D. D., and Taylor, R. H.: Ecology and conservation of estuarine ecosystems: Lake St. Lucia as a global model, Cambridge University Press, Online ISBN: 9781139095723, https://doi.org/10.1017/CBO9781139095723, 2013. a
Pillot, D., Deville, E., and Prinzhofer, A.: Identification and quantification of carbonate species using Rock-Eval pyrolysis, Oil Gas Sci. Technol., 69, 341–349, 2014. a
Porter, R. N.: South Africa's first world heritage site, in: Ecology and Conservation of Estuarine Ecosystems: Lake St. Lucia as a Global Model, chap. 1, Perissinotto, R., Stretch, D. D., and Taylor, R. H., Cambridge University Press, New York, 1–21, Online ISBN: 9781139095723, https://doi.org/10.1017/CBO9781139095723, 2013. a
Poynter, J. and Eglinton, G.: 14. Molecular composition of three sediments from hole 717c: The Bengal fan, in: Proceedings of the Ocean Drilling Program: Scientific results, distal Bengal Fan, 02 July 1987–19 August 1987, 116, 155–161, https://doi.org/10.2973/odp.proc.sr.116.151.1990, 1990. a, b
Poynter, J. and Eglinton, G.: The biomarker concept - strengths and weaknesses, Fresen. J. Anal. Chem., 339, 725–731, https://doi.org/10.1007/BF00321733, 1991. a
Quay, P. D., Wilbur, D., Richey, J. E., Hedges, J. I., Devol, A. H., and Victoria, R.: Carbon cycling in the Amazon River: Implications from the 13C compositions of particles and solutes, Limnol. Oceanogr., 37, 857–871, https://doi.org/10.4319/lo.1992.37.4.0857, 1992. a
Rebelo, A. G. and Low, A. B.: Vegetation of South Africa, Lesotho and Swaziland, Department of Environmental Affairs and Tourism, ISBN: 9780621173161, 1996. a
Reddy, K. R. and Debusk, T. A.: State-of-the-art utilization of aquatic plants in water pollution control, Water Sci. Technol., 19, 61–79, 1987. a
Reddy, K. R. and DeLaune, R. D.: Biogeochemistry of wetlands: science and applications, CRC press, ISBN: 978-1-56670-678-0, 2008. a, b
Rommerskirchen, F., Plader, A., Eglinton, G., Chikaraishi, Y., and Rullkötter, J.: Chemotaxonomic significance of distribution and stable carbon isotopic composition of long-chain alkanes and alkan-1-ols in C4 grass waxes, Org. Geochem., 37, 1303–1332, https://doi.org/10.1016/j.orggeochem.2005.12.013, 2006. a, b
Rudolph, J. C., Arendt, C. A., Hounshell, A. G., Paerl, H. W., and Osburn, C. L.: Use of Geospatial, Hydrologic, and Geochemical Modeling to Determine the Influence of Wetland-Derived Organic Matter in Coastal Waters in Response to Extreme Weather Events, Frontiers in Marine Science, 7, 1–18, https://doi.org/10.3389/fmars.2020.00018, 2020. a
Runge, J.: The Congo River, Central Africa, in: Large Rivers: Geomorphology and Management, edited by: Gupta, A., Wiley Blackwell, 293–309, ISBN: 9780470723722, https://doi.org/10.1002/9780470723722.ch14, 2007. a
Sachse, D., Billault, I., Bowen, G. J., Chikaraishi, Y., Dawson, T. E., Feakins, S. J., Freeman, K. H., Magill, C. R., McInerney, F. A., and Van Der Meer, M. T. J.: Molecular paleohydrology: interpreting the hydrogen-isotopic composition of lipid biomarkers from photosynthesizing organisms, Annu. Rev. Earth Pl. Sc., 40, 221–249, 2012. a, b
Schefuß, E., Kuhlmann, H., Mollenhauer, G., Prange, M., and Pätzold, J.: Forcing of wet phases in southeast Africa over the past 17 000 years, Nature, 480, 509–512, https://doi.org/10.1038/nature10685, 2011. a
Schefuß, E., Eglinton, T. I., Spencer-Jones, C. L., Rullkötter, J., De Pol-Holz, R., Talbot, H. M., Grootes, P. M., and Schneider, R. R.: Hydrologic control of carbon cycling and aged carbon discharge in the Congo River basin, Nat. Geosci., 9, 687–690, https://doi.org/10.1038/ngeo2778, 2016. a
Sebag, D., Disnar, J. R., Guillet, B., Di Giovanni, C., Verrecchia, E. P., and Durand, A.: Monitoring organic matter dynamics in soil profiles by 'Rock-Eval pyrolysis': Bulk characterization and quantification of degradation, E. J. Soil Sci., 57, 344–355, https://doi.org/10.1111/j.1365-2389.2005.00745.x, 2006. a, b, c
Sebag, D., Verrecchia, E. P., Cécillon, L., Adatte, T., Albrecht, R., Aubert, M., Bureau, F., Cailleau, G., Copard, Y., Decaens, T., Disnar, J. R., Hetényi, M., Nyilas, T., and Trombino, L.: Dynamics of soil organic matter based on new Rock-Eval indices, Geoderma, 284, 185–203, https://doi.org/10.1016/j.geoderma.2016.08.025, 2016. a, b, c, d, e, f, g, h
Sebag, D., Garcin, Y., Adatte, T., Deschamps, P., Ménot, G., and Verrecchia, E. P.: Correction for the siderite effect on Rock-Eval parameters: application to the sediments of Lake Barombi (southwest Cameroon), Org. Geochem., 123, 126–135, 2018. a
Sessions, A. L.: Factors controlling the deuterium contents of sedimentary hydrocarbons, Org. Geochem., 96, 43–64, 2016. a
Stormanns, C.: An inventory and assessment of the conservation value of the Mkuze Swamp System, National Conservation Resources, CSIR, Pretoria, 1987. a, b, c, d, e, f, g, h, i, j
Strobel, P., Bliedtner, M., Carr, A. S., Frenzel, P., Klaes, B., Salazar, G., Struck, J., Szidat, S., Zech, R., and Haberzettl, T.: Holocene sea level and environmental change at the southern Cape – an 8.5 kyr multi-proxy paleoclimate record from Lake Voëlvlei, South Africa, Clim. Past, 17, 1567–1586, https://doi.org/10.5194/cp-17-1567-2021, 2021. a
Taylor, R., Kelbe, B., Haldorsen, S., Botha, G. A., Wejden, B., Väret, L., and Simonsen, M. B.: Groundwater-dependent ecology of the shoreline of the subtropical Lake St. Lucia estuary, Environ. Geol., 49, 586–600, https://doi.org/10.1007/s00254-005-0095-y, 2006. a
Taylor, R. H.: St. Lucia Estuary: the aquatic environment, the physical and chemical characteristics, St. Lucia Research Review, 42–56, 1982a. a
Taylor, R. H.: The Mkuze Swamps, St. Lucia Research Review, 201–210, 1982b. a, b, c, d, e, f, g
Taylor, R. H.: The past and present human involvement in the Mkuze swamp system, in: Proceedings of the greater Mkuze swamp system symposium and workshop, Institute of Natural Resources, Report, 22, 1986. a
Taylor, R. H.: Management history, in: Ecology and conservation of estuarine ecosystems: Lake St. Lucia as a global model, May 2019, chap. 2, edited by: Perissinotto, R., Stretch, D. D., and Taylor, R. H., Cambridge University Press, 21–46, https://doi.org/10.1017/CBO9781139095723.004, 2013. a
Tinley, K.: a preliminary report on the ecology of the Pongola and Mkuze flood plains, 1959. a
Tooth, S. and McCarthy, T. S.: Wetlands in drylands: geomorphological and sedimentological characteristics, with emphasis on examples from southern Africa, Progress in Physical Geography: Earth and Environment, 31, 3–41, https://doi.org/10.1177/0309133307073879, 2007. a
Van Heerden, I. L. and Swart, D. H.: St. Lucia Research: An assessment of past and present geomorphological and sedimentary processes operative in the St. Lucia Estuary and environs, a technical research report, vol. 569, Marine Geoscience and Sediment Dynamics Divisions, National Research, https://saeis.saeon.ac.za/Document/1725 (last access: 2 June 2022), 1986. a
Vogts, A., Moossen, H., Rommerskirchen, F., and Rullkötter, J.: Distribution patterns and stable carbon isotopic composition of alkanes and alkan-1-ols from plant waxes of African rain forest and savanna C3 species, Org. Geochem., 40, 1037–1054, https://doi.org/10.1016/j.orggeochem.2009.07.011, 2009. a, b
Vogts, A., Schefuß, E., Badewien, T., and Rullkötter, J.: n-Alkane parameters from a deep sea sediment transect off southwest Africa reflect continental vegetation and climate conditions, Org. Geochem., 47, 109–119, https://doi.org/10.1016/j.orggeochem.2012.03.011, 2012. a, b
Ward, N. D., Bianchi, T. S., Medeiros, P. M., Seidel, M., Richey, J. E., Keil, R. G., and Sawakuchi, H. O.: Where Carbon Goes When Water Flows: Carbon Cycling across the Aquatic Continuum, Frontiers in Marine Science, 4, 1–27, https://doi.org/10.3389/fmars.2017.00007, 2017. a
Watkeys, M. K., Mason, T. R., and Goodman, P. S.: The rôle of geology in the development of Maputaland, South Africa, J. Afr. Earth Sci., 16, 205–221, https://doi.org/10.1016/0899-5362(93)90168-P, 1993. a, b
Wetzel, R. G.: Sediments and microflora, in: Limnology: lake and river ecosystems, chap. 21, Elsevier, 631–664, https://doi.org/10.1016/b978-0-08-057439-4.50025-3, 2001. a
Whitfield, A. K. and Taylor, R. H.: A review of the importance of freshwater inflow to the future conservation of Lake St. Lucia, Aquat. Conserv., 19, 838–848, 2009. a, b, c
Wiesenberg, G. L., Dorodnikov, M., and Kuzyakov, Y.: Source determination of lipids in bulk soil and soil density fractions after four years of wheat cropping, Geoderma, 156, 267–277, https://doi.org/10.1016/j.geoderma.2010.02.026, 2010. a
Zhang, D., Beverly, E. J., Levin, N. E., Vidal, E., Matia, Y., and Feakins, S. J.: Carbon isotopic composition of plant waxes, bulk organics and carbonates from soils of the Serengeti grasslands, Geochim. Cosmochim. Ac., 311, 316–331, https://doi.org/10.1016/j.gca.2021.07.005, 2021. a, b, c, d