the Creative Commons Attribution 4.0 License.
the Creative Commons Attribution 4.0 License.
 | 22 Jun 2022
Update of a biogeochemical model with process-based algorithms to predict ammonia volatilization from fertilized cultivated uplands and rice paddy fields
Siqi Li
Wei Zhang
Xunhua Zheng
Yong Li
Shenghui Han
Rui Wang
Kai Wang
Zhisheng Yao
Chunyan Liu
Chong Zhang
Accurate simulation of ammonia (NH3) volatilization from fertilized croplands is crucial to enhancing fertilizer-use efficiency and alleviating environmental pollution. In this study, a process-oriented model, CNMM–DNDC (Catchment Nutrient Management Model–DeNitrification–DeComposition), was evaluated and modified using NH3 volatilization observations from 44 and 19 fertilizer application events in cultivated uplands and paddy rice fields in China, respectively. The major modifications for simulating NH3 volatilization from cultivated uplands were primarily derived from a peer-reviewed and published study. NH3 volatilization from cultivated uplands was jointly regulated by wind speed, soil depth, clay fraction, soil temperature, soil moisture, vegetation canopy, and rainfall-induced canopy wetting. Moreover, three principle modifications were made to simulate NH3 volatilization from paddy rice fields. First, the simulation of the floodwater layer and its pH were added. Second, the effect of algal growth on the diurnal fluctuation in floodwater pH was introduced. Finally, the Jayaweera–Mikkelsen model was introduced to simulate NH3 volatilization. The results indicated that the original CNMM–DNDC not only performed poorly in simulating NH3 volatilization from cultivated uplands but also failed to simulate NH3 volatilization from paddy rice fields. The modified model showed remarkable performances in simulating the cumulative NH3 volatilization of the calibrated and validated cases, with drastically significant zero-intercept linear regression of slopes of 0.94 (R2 = 0.76, n = 40) and 0.98 (R2 = 0.71, n = 23), respectively. The simulated NH3 volatilization from cultivated uplands was primarily regulated by the dose and type of the nitrogen fertilizer and the irrigation implementation, while the simulated NH3 volatilization from rice paddy fields was sensitive to soil pH; the dose and depth of nitrogen fertilizer application; and flooding management strategies, such as floodwater pH and depth. The modified model is acceptable to compile regional or national NH3 emission inventories and develop strategies to alleviate environmental pollution.
- Article
(3424 KB) - Full-text XML
-
Supplement
(2693 KB) - BibTeX
- EndNote


Synthetic fertilizer application, as the second-largest contributor to ammonia (NH3) emissions after livestock production, accounts for approximately 30 % to 50 % of anthropogenic NH3 emissions (Behera et al., 2013; Bouwman et al., 1997; Huang et al., 2012; Paulot et al., 2014). The great quantity of NH3 volatilized from agricultural fields contributes to low nitrogen use efficiency for crops (Chien et al., 2009; Mariano et al., 2019; Zhu et al., 1989). The subsequent dry and wet deposition to terrestrial ecosystems results in the acidification and eutrophication of natural ecosystems (e.g., Anderson et al., 2008; Bobbink et al., 1998; Li et al., 2016) and is also considered an indirect source of nitrous oxide (Martin et al., 2004; Schjørring, 1998). Recently, NH3 in the atmosphere has played a vital role in aerosol formation during several haze periods, which has attracted great attention (e.g., Felix et al., 2013; Kong et al., 2019; Liu et al., 2018; Savard et al., 2017).
Many studies have attempted to estimate NH3 loss from fertilized croplands using biogeochemical process models, i.e., DeNitrification–DeComposition (DNDC; Dubache et al., 2019; Dutta et al., 2016; Giltrap et al., 2017; Michalczyk et al., 2016), water and nitrogen management (WNMM; Park et al., 2008), and Community Earth System Model (CESM; Riddick et al., 2016; Vira et al., 2020). However, these models do not distinguish between the simulation modules of NH3 volatilization for cultivated uplands and rice paddy fields but rather use the same algorithm (Cannavo et al., 2008; Li, 2016). It is worth emphasizing that the mechanisms of NH3 volatilization are completely different between cultivated uplands and rice paddy fields due to the presence of floodwater over rice paddy soils. Recent studies also indicate that estimating NH3 emissions without considering rice cultivation results in large uncertainties (Riddick et al., 2016; Xu et al., 2019). In particular, some studies have shown that NH3 volatilization rates from rice paddy fields are not lower than those of upland crops (Zhou et al., 2016), which also indicates the different mechanisms of NH3 volatilization between cultivated uplands and rice paddy fields. Therefore, using separate modules to simulate NH3 volatilization from cultivated uplands and rice paddy fields is necessary for the accurate estimation of NH3 emissions.
Given the totally different mechanisms of NH3 volatilization between cultivated uplands and rice paddy fields, the influencing factors affecting NH3 volatilization from cultivated uplands are different from those of rice paddy fields. The dose, type, and application methods of nitrogen fertilizer have been confirmed as the primary factors affecting NH3 volatilization from cultivated uplands (e.g., Liu et al., 2003; Roelcke et al., 2002; Zhang et al., 1992). Moreover, several studies have reported that irrigation and precipitation exert a complicated influence (stimulated or inhibited) on NH3 volatilization from cultivated uplands (e.g., Han et al., 2014; Holcomb et al., 2011; Sanz-Cobena et al., 2011). However, the depth and pH of surface floodwater, which are unique characteristics of rice paddy fields, were found to be the major factors influencing NH3 volatilization from rice paddy fields (Bowmer and Muirhead, 1987; Hayashi et al., 2006; Jayaweera and Mikkelsen, 1991). A comprehensive discussion of the influencing factors affecting NH3 volatilization from cultivated uplands and rice paddy fields is crucial for providing suggestions to further improve the performance of process-based biogeochemical models in simulating NH3 volatilization from cropland soils and offer specific and pertinent policy advice for the reduction in NH3 loss.
A previous study established a scientific algorithm for the DNDC model to simulate NH3 volatilization from cultivated uplands, which performed well under validation with independent cases of cultivated uplands from China (Li et al., 2019). However, no biogeochemical model has achieved simulations of NH3 volatilization from rice paddy fields using a process-oriented algorithm, although a classical and extensively used model, i.e., the Jayaweera–Mikkelsen model (J–M model), exists (Jayaweera and Mikkelsen, 1990a; Li et al., 2008; Wang et al., 2016; Zhan et al., 2019).
The Catchment Nutrient Management Model–DeNitrification–DeComposition (CNMM–DNDC) model, established by coupling the core carbon and nitrogen biogeochemical processes of DNDC (e.g., decomposition, nitrification, denitrification, and fermentation) to the distributed hydrologic framework of CNMM, is one of the latest versions of DNDC (Zhang et al., 2018). The CNMM–DNDC has been gradually developing into a comprehensive and reliable process-oriented biogeochemical model that performs well in terms of simulating the complex hydrologic and biogeochemical processes of a subtropical catchment with various landscapes (Zhang et al., 2018), the nitrous oxide and nitric oxide emissions from a subtropical tea plantation (Zhang et al., 2020), and the NO leaching processes of black soils in northeastern China (Zhang et al., 2021). However, the rationality of the CNMM–DNDC's scientific processes in simulating NH3 volatilization from fertilized croplands is still lacking in terms of a thorough assessment. In particular, CNMM–DNDC and other widely used biogeochemical models (e.g., DNDC) do not consider floodwater over rice paddy soils when simulating NH3 volatilization but rather directly adopt the scientific processes and algorithms applied in NH3 volatilization from cultivated uplands to predict NH3 volatilization from rice paddy fields (Li, 2016; Zhang et al., 2018).
Based on the above deficiencies, the authors hypothesized that the CNMM–DNDC is able to simulate NH3 volatilization following the application of synthetic nitrogen fertilizers to cultivated uplands and flooded rice paddy fields. To test this hypothesis, this study evaluated and modified the CNMM–DNDC's scientific processes for simulating NH3 volatilization from cropland soils using 44 and 19 fertilizer application events from cultivated uplands and rice paddy fields in China, respectively. The objectives of this study were to (i) evaluate the performance of the CNMM–DNDC in simulating the observed NH3 volatilization following synthetic nitrogen application to cultivated uplands, (ii) introduce thoroughly tested and validated scientific algorithms simulating NH3 volatilization from cultivated uplands into the CNMM–DNDC, (iii) adopt widely applied process-based algorithms (J–M model) into the modified CNMM–DNDC, (iv) assess the performance of the modified model to simulate NH3 volatilization from flooded rice paddy fields using collected reliable observations, and (v) identify the major factors affecting NH3 volatilization from cultivated uplands and rice paddy fields to offer suggestions for further improving the model performance.
2.1 Model introduction and modifications
2.1.1 Brief introduction of the CNMM–DNDC
The CNMM–DNDC model was originally established by Zhang et al. (2018). In the original CNMM–DNDC, the core biogeochemical processes (including decomposition, nitrification, denitrification, and fermentation) of DNDC (Li, 2016; Li et al., 1992) were incorporated into the distributed hydrologic framework of CNMM (Li et al., 2017). Based on comprehensive observations, the CNMM–DNDC was initially tested in a subtropical catchment, which showed credible performances in simulating the yields of crops, emissions of greenhouse gases (i.e., methane and nitrous oxide), emissions of nitrogenous pollutant gases (i.e., nitric oxide and NH3), and hydrological nitrogen losses by leaching and NO discharge in streams for different land uses (including forests and arable lands cultivated with maize, wheat, oil rape, or rice paddy) (Zhang et al., 2018). Subsequently, Zhang et al. (2020) modified the CNMM–DNDC by adding tea-growth-related processes that may induce a soil pH reduction, and this modified model performed well in simulating the emissions of nitrous oxide and nitric oxide from a subtropical tea plantation plot. Moreover, the CNMM–DNDC performed well in simulating the NO leaching process of black soils in northeastern China (Zhang et al., 2021). However, during model preparation and operation for the simulation of NH3 volatilization, the authors found that the present model version, using a complicated and obscure R programming script to prepare the ARC GRID ASCII data format of site- and plot-scale inputs, was time-consuming and confusing. Therefore, an easy-to-operate and standardized version of the model needed to be established.
The new standard version of the model was built without changing the original key scientific modules; however, the complicated R programming script was converted into a simple Excel spreadsheet to prepare the model inputs, which is easy for beginners to use. The site-scale and regional-scale simulations were separated. In the site-scale simulation used in this study, the authors hypothesized a flat terrain region with a 5 × 5 grid, and thus, the solar radiation was not affected by topography. Therefore, the simulation of any grid was the same and could be regarded as the representative simulation results of the study region. If the users were only interested in the simulation of a field site experiment or could only provide the input data based on the site or plot scale, then they would not need to provide any information about the topography and stream of their study region which was necessary for the regional-scale simulation. The site-scale simulation, which was used in this study, is convenient for model validation, saves time in terms of model operation, and is easy to use for beginners.
2.1.2 Modifications for simulating NH3 volatilization from cultivated uplands
In the original CNMM–DNDC model, the direct processes involved in the calculation of NH3 volatilization from cultivated uplands included ammonium bicarbonate (ABC) decomposition, urea hydrolysis, and NH3 volatilization (Fig. S1 in the Supplement). Among them, ABC decomposition was regulated by soil pH and soil depth; urea hydrolysis was affected by soil temperature and soil organic carbon; and NH3 volatilization from cultivated uplands was simply determined by the regulating factors of wind speed, soil depth, and soil temperature (Tables S1 and S2). Moreover, other synthetic fertilizers' dissolution and organic manure mineralization were involved in the original model. The modifications of the new version of the CNMM–DNDC for simulating NH3 volatilization from cultivated uplands were mainly adapted from Li et al. (2019). Compared to the original CNMM–DNDC, three major modifications were conducted. First, the soil temperature parameter (fT) of the urea hydrolysis function was recalibrated, and the effect of soil moisture on urea hydrolysis (fSM) was newly added. Second, the regulatory effect of soil temperature on ABC decomposition (fTs_ABC) was parameterized. Finally, the effects of the original parameters of soil temperature and moisture on NH3 volatilization were recalibrated, and the effects of the clay fraction, plant standing, and canopy wetting on NH3 release to the atmosphere were newly parameterized (Fig. S1). The above-mentioned calibration and parameterization were conducted by Dubache et al. (2019) and Li et al. (2019). Therefore, the NH3 flux from cultivated uplands (flux_(NH3)uplands) was jointly determined by the regulating factors of wind speed (fwind, 0–1), soil temperature (ftemp, 0–1), soil moisture (fwater, 0–1), soil depth (fdepth, 0–1), clay fraction (fclay, 0–1), vegetation canopy (fcanopy, 0–1), and rainfall-induced canopy wetting (frain, 0–1), as shown in Eq. (1). Each factor was defined as a dimensionless fraction within 0–1. NH3(l) refers to the dissolved NH3 in the liquid phase of upland soils. Among these regulating factors, fdepth was calculated by the number of soil layers in Li et al. (2019), where the thickness of the soil layer was set as the value of the saturated hydraulic conductivity. However, in the CNMM–DNDC, the simulated soil layers and their corresponding thicknesses were set to be freely defined by users. The algorithm of fdepth from Li et al. (2019) was inappropriate for this study. Therefore, fdepth was revised using the thickness of the soil layer based on Eq. (2), wherein dsoil denotes the depth of the simulated soil layer. The calibration cases with fertilizer application depth were used for the calibration of fdepth. Moreover, the time step of the CNMM–DNDC was 3 h, but the time step was 1 d in the DNDC model. So the ratio of time steps of the two models (Tlayer with the value of 8) was involved in Eq. (1). Nevertheless, the deviation of the two models derived from the different time steps existed, as shown in Table S3. To solve the deviation, a time-step parameter (fTstep) was introduced into Eq. (1), which was calculated at 0.75 in this study using the calibration cases with surface broadcast (n = 21). The zero-intercept linear regression was applied for model calibration. We provided the calibration of fTstep in Fig. S2 as an instance. Table S1 listed the algorithms of the original and modified model in simulating NH3 volatilization from cultivated uplands. The descriptions and units of the symbols used in Table S1 were listed in Table S2.
2.1.3 Modifications for simulating NH3 volatilization from rice paddy fields
The original CNMM–DNDC failed to simulate NH3 volatilization from rice paddy fields because it lacked the capability to simulate the surface-water-flooded layer over rice paddy fields. Given the presence of floodwater over rice paddy soils, the mechanisms of NH3 volatilization are different between cultivated uplands and rice paddy fields. However, CNMM–DNDC and other widely used biogeochemical models (e.g., DNDC) adopted scientific processes and algorithms applied in simulating NH3 volatilization from fertilized cultivated uplands to calculate NH3 volatilization from rice paddy fields without considering floodwater over soils (Cannavo et al., 2008; Li, 2016). Therefore, floodwater over rice paddy soils was added to the modified CNMM–DNDC. To add this component, the modified CNMM–DNDC adopted the Jayaweera–Mikkelsen model (i.e., J–M model), based on the two-film theory of mass transfer (Jayaweera and Mikkelsen, 1990a), which is one of the most widely applied process-based models for simulating NH3 volatilization from rice paddy fields. The J–M model consists of two processes (Fig. 1): (i) the chemical processes of NH ions and aqueous NH3 (NH3(aq)) equilibrium in floodwater and (ii) the volatilization processes of NH3(aq) transfer in the form of NH3 gas (NH3(air)) across the water–air interface to the atmosphere (Reaction R1); kd (first-order; s−1) and ka (second-order; L mol−1 s−1) refer to the dissociation and association rate constants for NH–NH3(aq) equilibrium, respectively; kvN (first-order; s−1) refers to the volatilization rate constant of NH3(aq).
According to the above theories, the change rate of the NH concentration in floodwater ([NH]w, mol L−1) due to NH3 volatilization (Ra, mol L−1 s−1) can be estimated by Eq. (3) as a function of [NH]w, H+ concentration in floodwater ([H+]w, mol L−1), kd, ka and kvN.

Figure 1Mechanism of the Jayaweera–Mikkelsen model introduced into the modified CNMM–DNDC; kd and ka refer to the dissociation and association rate constants for NH–NH3 chemical equilibrium, respectively; klN and kgN refer to the exchange constants for NH3 in the liquid and gas films, respectively. ClNi and CgNi refer to the average concentrations of NH3 at the interface in the liquid and gas films, respectively. NH3(aq) and NH3(air) refer to the average concentration of NH3 in aqueous and gas phases, respectively.
The dynamic changes in [H+]w and [NH]w are calculated by the CNMM–DNDC instead of the field experiment described in Jayaweera and Mikkelsen (1990a).
In the modified CNMM–DNDC, the pH of the floodwater, which is the negative logarithm of [H+]w, is related to the initial pH of water for flooding and that of surface soil. When the floodwater depth is less than 0.04 m, the pH of the floodwater is equal to the mean of the initial pH of water for flooding and that of surface soil, both of which are the inputs of the modified model. Otherwise, the pH of the floodwater is equal to the initial pH of the water for flooding. On the one hand, [H+]w is regulated by urea hydrolysis in floodwater, the algorithm of which was derived from that of urea hydrolysis affecting soil pH in the model. On the other hand, many studies have found that a marked diurnal fluctuation in floodwater pH is associated with algal photosynthesis, which was elevated with solar radiation (De Datta, 1995; Fillery and Vlek, 1986). Therefore, a ratio of the daytime solar shortwave radiation effect on algal photosynthesis (Rslr; 0–1) was established by the authors using Eq. (4) as a quadratic function of the simulation time (t; 06:00 to 21:00 LT (UTC+8) with a 3 h interval) of a day. Rslr at the other moments with no or extremely little solar radiation in a day was set as 0. The effect of algal growth (falg) on floodwater pH was calculated by Eq. (5), where the adjusted coefficient (kalg; 0–1) was calibrated to 0.75 or 0.6 when the floodwater depth was no more than or more than 0.04 m, respectively. The floodwater pH of (t+1) was modified by the floodwater pH of t and falg using Eq. (6), which was set as no more than 10.
When fertilizers (e.g., urea) are applied to the rice paddy fields, they are first allocated to the floodwater and soil layers according to the ratio of the floodwater depth and the application depth of fertilizer in the modified CNMM–DNDC. Subsequently, [NH]w increases with urea hydrolysis, and ABC decomposition occurs in the floodwater. In the modified model, the calculation of urea hydrolysis in floodwater refers to that in the upland soils (Dubache et al., 2019) by removing the influencing factors of soil organic carbon and soil moisture. Therefore, urea hydrolysis in floodwater is only determined by the floodwater temperature. To simplify the calculation, the floodwater temperature is arbitrarily set equal to the temperature in the first soil layer in the modified model. Given that ABC decomposition in floodwater was not involved in the original CNMM–DNDC, this study directly adopted the algorithm of ABC decomposition in upland soils used in Li et al. (2019), and this process was regulated by soil temperature, pH, and the applied depth of fertilizer. However, ABC decomposition in floodwater is different from that in upland soils; i.e., the ABC concentration is uniformly distributed in the floodwater, and the effect factors (i.e., temperature, pH, and depth) applied should be those of floodwater rather than those of soil. Therefore, this study ignored the effect of soil depth and retained the effect of floodwater temperature and pH on ABC decomposition in floodwater.
For each simulation time step, the NH in the floodwater and the first soil layer experiences uniform mixing and exchange. Then, NH is transported in soil layers, accompanied by organic nitrogen mineralization, consumption via plant uptake, nitrification, volatilization of NH3, and adsorption and desorption by clay (Li, 2016; Li et al., 1992, 2019).
The variables kd, ka, and kvN in Eq. (3) are determined by the environmental factors, i.e., the temperature and the depth of floodwater (Jayaweera and Mikkelsen, 1990a). As shown in Eq. (7), ka is affected by its relationship with floodwater temperature (Tf; K) based on Alberty (1983):
kd is derived from the relationship with the equilibrium constant for NH–NH3(aq) (K) and ka (Eq. 8):
K is calculated as a function of the floodwater temperature (Eq. 9) derived from Jayaweera and Mikkelsen (1990a):
TheNH3 volatilization rate constant (kvN) is estimated by the law of conservation of mass, which is considered in the system of NH3 transfer across the air–water interface. By dimensional analysis, kvN is determined by Eq. (10), based on the ratio of the floodwater depth (d; m) and the overall mass-transfer coefficient for NH3 (KON; cm h−1):
According to the two-film theory, based on Fick's first law and Henry's law, KON is determined by Eq. (11) using the exchange constant for NH3 in the gas and liquid phases (kgN and klN, respectively) and the non-dimensional Henry's constant (HnN). As described by Jayaweera and Mikkelsen (1990a), HnN is a function of Tf, which can be calculated by Eq. (12), whereas kgN and klN are dependent on the wind speed measured at a height of 8 m (U8; m s−1), which can be calculated using Eqs. (13)–(14). U8 can be determined using the model input of wind speed measured at a height of 10 m (U10; m s−1), based on Eq. (15) derived from Jayaweera and Mikkelsen (1990a).
Finally, the 3 h cumulative flux of NH3 volatilization (flux_(NH3)rice; kg N ha−1 3 h−1) is calculated by Eq. (16) using Ra, d, and the simulation time step based on the molar mass of N (∼ 14 g mol−1) and the conversion coefficient from square meters to hectares (1 m2 = 1 × 10⁻⁴ ha).
The CNMM–DNDC with the above modifications is hereinafter referred to as the modified CNMM–DNDC.
2.2 Brief description of the field sites and treatments
Two field observation datasets of NH3 volatilization using micrometeorological methods or wind tunnel techniques, which were measured in cultivated uplands and flooded rice paddy fields of China, respectively, were collected from published peer-reviewed articles. For the dataset of cultivated uplands, the collected field observations were conducted at seven experimental sites, including Dongbeiwang (DBW) in Beijing; Fengqiu with cultivated uplands (FQU) in Henan; Guangchuan (GC), Luancheng (LC), and Quzhou (QZ) in Hebei; Yanting (YT) in Sichuan; and Yongji (YJ) in Shanxi (Fig. 2). The datasets were directly inherited from Li et al. (2019). The upland sites involved in this study were calcareous soils cultivated with summer maize and winter wheat. The 44 cases of synthetic-fertilizer-application events in cultivated uplands (Table S4) involved various fertilizer types (including urea, ammonium bicarbonate (ABC), ammonium sulfate, and complex fertilizer), a wide range of applied fertilizer doses (60–348 kg N ha−1), and various agricultural management practices (e.g., broadcast or deep point placement of fertilizer(s) alone or fertilization coupled with irrigation). For the rice paddy field dataset, field observations were collected at five experimental sites, including Changshu (CS) and Danyang (DY) in Jiangsu, Fengqiu with rice paddy fields (FQP) in Henan, Shenzhen (SZ) in Guangdong, and Yingtan (YTA) in Jiangxi (Fig. 2), and these sites were cultivated with summer rice and winter wheat or double rice (Table 1). In total, 19 (P1–P19) synthetic-fertilizer-application events were included in these measurements, covering different fertilizer types, including urea and ABC; fertilizer doses in the range of 41–162 kg N ha−1; and various agricultural management practices (e.g., broadcasting or broadcasting followed by tillage; Tables 1 and 2). In addition, the other auxiliary variables, e.g., temperature, pH, and ammonium (NH) concentration of the floodwater, measured in the rice paddy experimental sites during the NH3 volatilization measurement periods were also collected for model calibration and validation.

Figure 2Location of the experimental field sites involved in this study. The sites are Changshu (CS), Danyang (DY), Dongbeiwang (DBW), Fengqiu (FQ), Guangchuan (GC), Luancheng (LC), Quzhou (QZ), Shenzhen (SZ), Yanting (YT), Yingtan (YTA), and Yongji (YJ).
Table 1Descriptive information of the studied experimental sites of rice paddy fields for model evaluation, including site name, experimental year (Year), crop rotation (Crop), fertilizer type (Type) and dose (Dose; kg N ha−1), measurement method for ammonia volatilization (Method), number of fertilization cases (Number), and reference (Ref.).
a The sites are Changshu (CS), Danyang (DY), Fengqiu with rice paddy fields (FQP), Shenzhen (SZ), and Yingtan (YTA). b The presented crop rotation types are rice–wheat (RW) and double rice (DR). c ABC is the abbreviation of ammonium bicarbonate. d The presented methods for the measurement of ammonia volatilization are wind tunnel (WT) and micrometeorological technique (MM).
Table 2Observed and simulated cumulative ammonia volatilization during the measurement periods, model biases, and management practices of individual fertilizer application cases in the rice paddy fields.
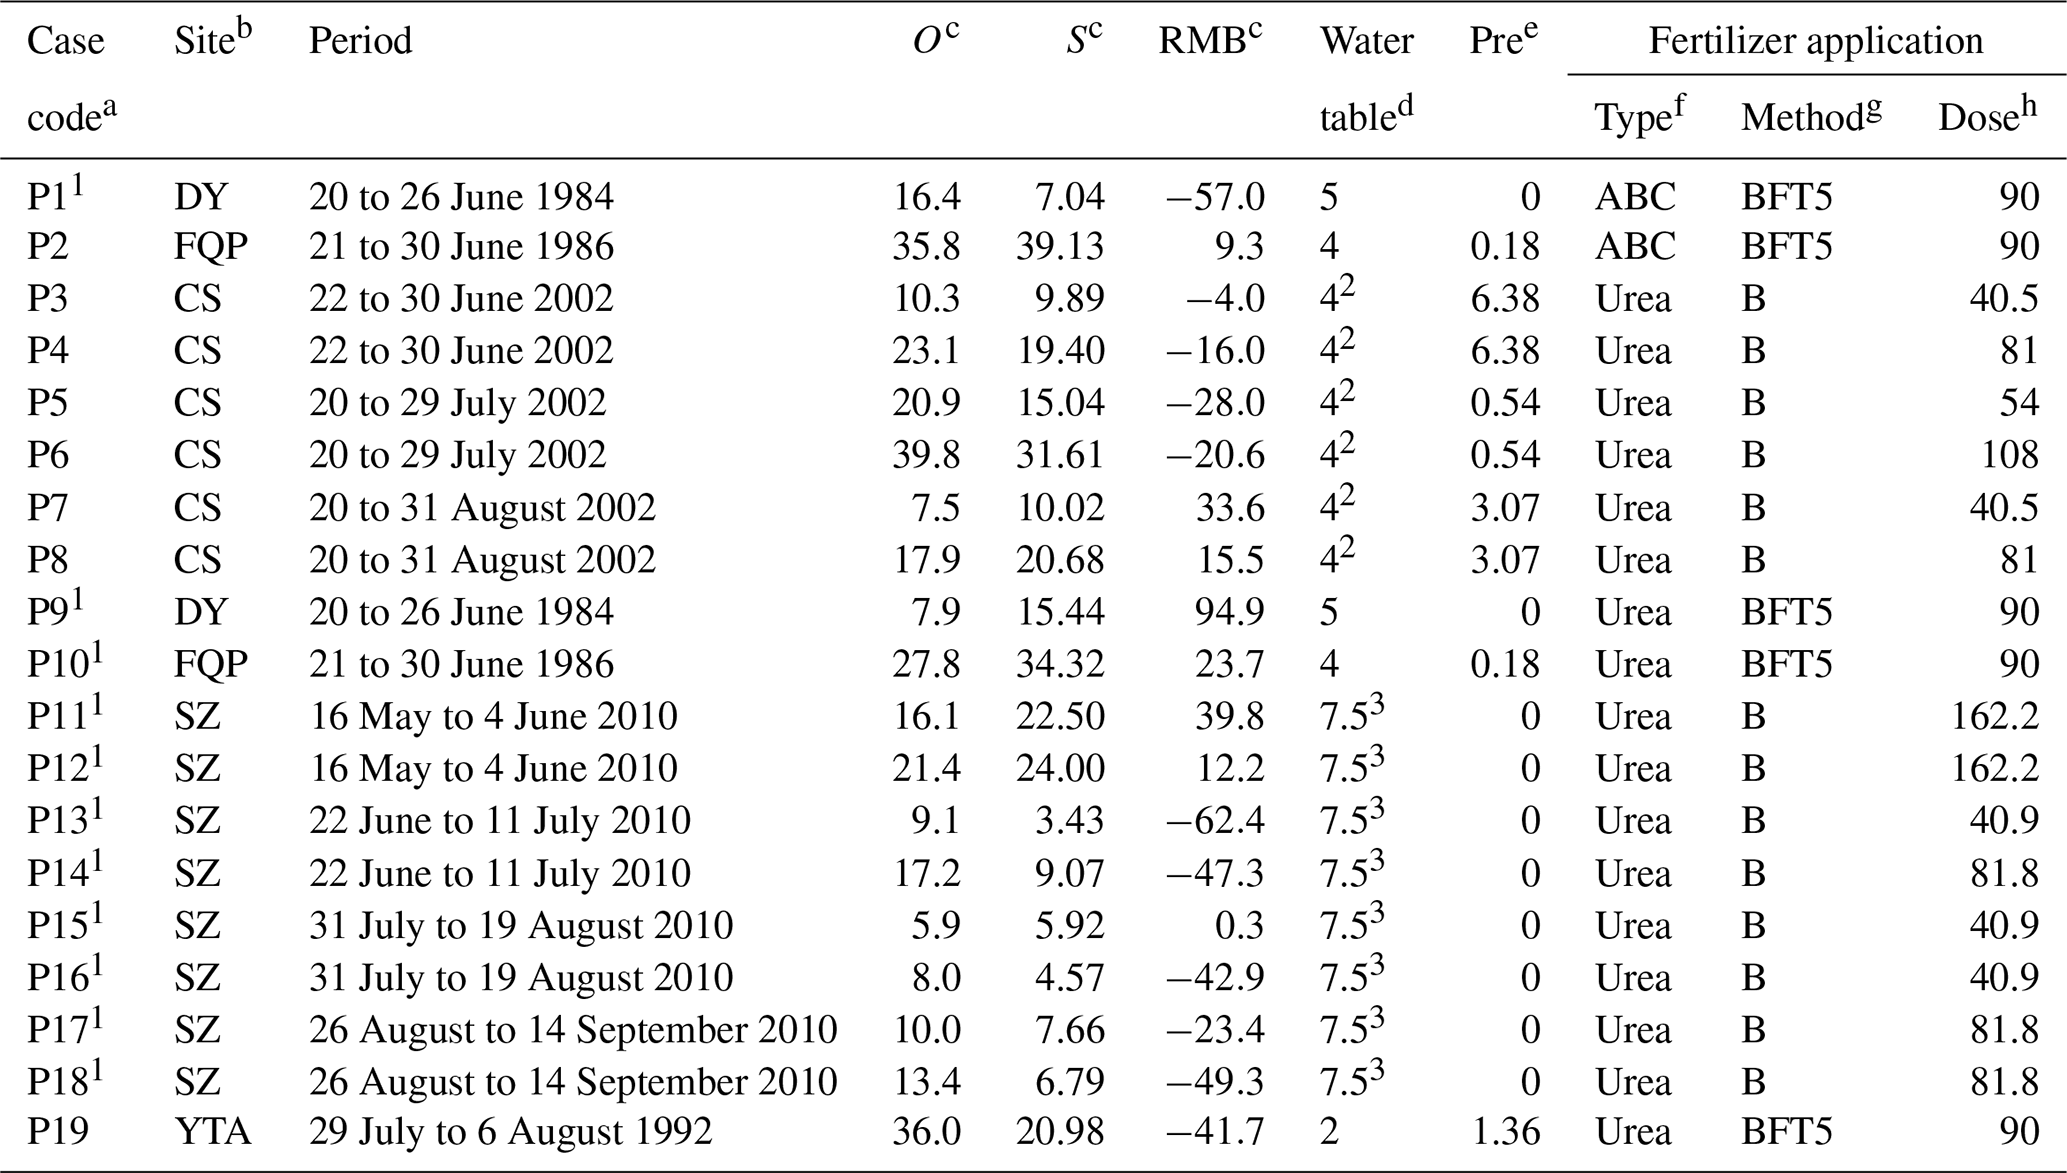
a P1 to P19 encode the experimental cases following individual application events of synthetic nitrogen fertilizers; the superscript “1” marks the cases with the ammonia observations referring to the model calibration. b The sites are Changshu (CS), Danyang (DY), Fengqiu with rice paddy fields (FQP), Shenzhen (SZ), and Yingtan (YTA). c O and S are the cumulative NH3 volatilization (kg N ha−1) observed and simulated by the modified CNMM–DNDC, respectively; RMB is the relative model bias (%) of the modified model, which was determined as the relative difference between the simulated and observed values. d The depth of floodwater table (cm). For the cases with “2” and “3”, the exact depth of the floodwater table was not reported. The floodwater table depth of the cases with “2” was arbitrarily set as the traditional depth of the floodwater table of the DY site, which was located in the same region. The floodwater depths of the cases with “3” were set by model calibration. e “Pre” denotes total rainfall (cm) during the experimental period(s). f ABC is the fertilizer type of ammonium bicarbonate. g The application methods are surface broadcast (B) and broadcast followed by tillage (BFT). The figures following BFT are the depth in soil (cm). h Unit: kg N ha−1.
2.3 Model preparation and operation
2.3.1 Input data formatting
The input data of the modified CNMM–DNDC used in this study included the meteorological conditions of the study area (e.g., 3-hourly average air temperature, Tair; precipitation, P; wind speed, W; solar radiation, R; relative humidity, RH), the necessary soil properties of individual layers (e.g., soil clay and sand fraction; organic carbon, SOC; bulk density, BD; pH), crop parameters (e.g., crop type; thermal degree days for maturity, TDDs; nitrogen content; plant height; and root depth), and the implemented management practices (e.g., plant and harvest dates and methods and/or amounts of individual management practices including fertilization, tillage, irrigation, and flooding).
For the meteorological data inputs, the reported 3-hourly meteorological data from the weather station at the experimental site were used. If these data were not available, then data from the adjacent weather station in the China Meteorological Administration (CMA; http://data.cma.cn, last access: 16 July 2020) were adapted by referring to the reported average or maximum values (Table S5, Text S1).
The necessary inputs of surface soil properties at the individual upland sites for the modified model were derived from Li et al. (2019), whereas those at the individual rice paddy sites are shown in Table S6. If the observed surface soil properties were not available, then the values were provided using the methods of Li et al. (2019). The soil clay and sand fraction and pH in the deep layers were set to be consistent with those in the surface soil. Depending on the SOC at the surface soil, the modified CNMM–DNDC calculated the SOC in the deep layers using the algorithms involved in Li (2016), and the BD in the deep layers was estimated using the SOC value in the corresponding layers based on the algorithms shown in Li (2016). Other soil properties (e.g., field capacity, wilting point, and saturated hydraulic conductivity) were estimated using the pedo-transfer functions of Li et al. (2019).
The CNMM–DNDC contains a library of crop parameters. However, to ensure the normal growth of the crop(s), the model's default values for the crop TDDs at the individual sites were adapted by the multiyear (at least 5 years) average of the sums of daily air temperatures during the growing season.
Agricultural management practice information included in the CNMM–DNDC input was organized on a daily scale. The management practice information for the cases of cultivated uplands was derived from Li et al. (2019), whereas that for the cases of rice paddy fields is listed in Table S7. It is worth noting that the information input for the cases of rice paddy fields required the start and end dates of the individual flooding events accompanied by the corresponding pH and depth of floodwater as model inputs. The default value of the initial floodwater pH at all sites was set at 7.0 due to a lack of observations. The cases in DY, FQP, and YT had reported floodwater depth observations, and the cases of CS without floodwater depth observations were arbitrarily set to the traditional floodwater depth (0.04 m) of the DY site, which was located in the same region. For the SZ cases without floodwater depth observations, given that no site is adjacent to the Pearl River Delta region, where SZ is located, the floodwater depth of the SZ site was calculated at 0.075 m.
2.3.2 Model operation
To reduce the influences of initial model inputs, the model simulation consists of a spin-up period conducted for at least 5 years (depending on the availability of the model inputs) and the corresponding experimental period. The sources of the daily meteorological data for the spin-up period and the following simulation for cultivated uplands and rice paddy field sites were derived from Li et al. (2019) and listed in Table S8, respectively. The cases for model calibration were identified on the basis of covering as many climate conditions, soil properties, and management practices as possible. Therefore, for the simulation of NH3 from urea application on cultivated uplands and rice paddy fields, 26 typical cases of DBW, FQU, and QZ and 10 typical cases of DY, FQP, and SZ were used for model calibration. Regarding the simulation of NH3 from the ABC application on cultivated uplands and rice paddy fields, three typical cases of DBW and YT and one typical DY case were conducted for model calibration. The remaining 23 independent cases were provided for model validation.
2.4 Sensitivity analysis
Sensitivity analysis was adopted to investigate model inputs and improved parameters in the modified CNMM–DNDC that simulates NH3 volatilization following fertilizer application. U37 in QZ and P4 in CS were chosen as the baseline cases to assess the model's behavior in simulating NH3 volatilization from cultivated uplands and rice paddy fields, respectively. One reason for this selection was that U37 and P4 were geographically located near the center of the region for cultivated upland and rice paddy cases, respectively. Another reason was that the selected cases implement general Chinese management practices. The authors altered only one item at a time by keeping the others constant. Meteorological variables (i.e., 3-hourly averages of Tair, R, and W, 3-hourly totals of P during measurement periods of NH3 volatilization), soil properties (i.e., soil clay fraction, pH, SOC content, and BD), and field management practices (i.e., water management (irrigation water amount or depth of floodwater) and nitrogen fertilization type, dose, and depth) were involved in the sensitivity test of model inputs. The model input items of the 3-hourly average of W and R and 3-hourly totals of P during the measurement periods of NH3 volatilization as well as the soil clay fraction, SOC content, nitrogen fertilization dose, and depth of floodwater were altered by a range from −30 % to +30 % with an interval of 10 %. Soil BD and pH, with narrow amplitudes in situ, were altered within the ranges of 1.17 to 1.47 (U37) and 0.89 to 1.19 (P4) with an interval of 0.05 and within the ranges of 7.3 to 8.9 (U37) and 6.2 to 8.1 (P4) with an interval of 0.3, respectively. The 3-hourly average Tair during the measurement period of NH3 volatilization was altered within the range of −3 to +3 ∘C with an interval of 1 ∘C. The irrigation water amount and nitrogen fertilization depth and type were respectively set as 0.2, 0.5, and 5 cm; 5, 10, and 15 cm; and ABC and ammonium-based nitrogen (N) fertilizers excluding ABC. The corresponding baselines and lower and upper bounds of the above model inputs involved in the sensitivity analysis are listed in Table S9. In addition, the parameters added and revised for simulating NH3 volatilization from cultivated uplands were involved in the sensitivity analysis of improved parameters, including fSM and fT in the process of urea hydrolysis; fTs_ABC in the process of ABC decomposition; and ftemp, fclay, fwater, fdepth, fcanopy, and frain in the process of liquid NH3 volatilization. The parameters in Eq. (3) for simulating NH3 volatilization from rice paddy fields were involved in the sensitivity analysis of improved parameters, including kd, ka, and kvN. And falg, a newly introduced factor effect on floodwater pH, was also involved in the sensitivity analysis of improved parameters for simulating NH3 volatilization from rice paddy fields. In each sensitivity analysis, an improved parameter was altered by a range from −30 % to +30 % by an interval of 10 %, with the others remaining constant. The sensitivity analysis of fTs_ABC was conducted for the U4 case in QZ with ABC application. The change ratios of cumulative NH3 volatilization during the measurement periods between the lower and upper and baseline simulations were applied as the quantitative evaluation index for the sensitivity analysis (Abdalla et al., 2020).
2.5 Evaluation of model performance and statistical analysis
The index of agreement (IA), Nash–Sutcliffe index (NSI), and relative model bias (RMB) as well as slope, significance level, and coefficient of determination (R2) of the zero-intercept linear regression (ZIR) between the observed (O) and simulated (S) values were applied to quantitatively assess the performance of the original and modified models. The algorithms of these statistical metrics refer to Li et al. (2019). If the slope and R2 of the zero-intercept linear regression as well as the IA and NSI values are closer to 1, then the model performance is better. The SPSS Statistics 19.0 client (SPSS Inc., Chicago, USA) software package was used for the multiple regression analysis. The Origin 8.0 (OriginLab Ltd., Guangzhou, China) software package was used for graph drawing.
3.1 Ammonia volatilization from cultivated uplands
The observed cumulative NH3 volatilization (CAV) in all the cases of cultivated uplands during the measurement periods totaled 0.6–127.7 kg N ha−1 (mean: 27.5 kg N ha−1). The corresponding CAVs simulated by the original and modified CNMM–DNDC totaled 0.5–94.1 kg N ha−1 (mean: 33.2 kg N ha−1) and 0.8–115.2 kg N ha−1 (mean: 27.8 kg N ha−1), respectively (Table S4). The original CNMM–DNDC performed poorly in simulating all the observed cumulative NH3 volatilization cases, showing an acceptable IA (0.55), an unacceptable NSI (−1.49), and an insignificant ZIR (slope = 1.11 and R2 = 0.06) (data not shown).
Table 3Statistical indices for evaluating the performance of the modified CNMM–DNDC in simulating daily and cumulative ammonia (NH3) fluxes from ammonium bicarbonate (ABC) and urea (including other fertilizer types) applications for the independent calibration (Cal) and validation (Val) cases in uplands and rice paddy fields.
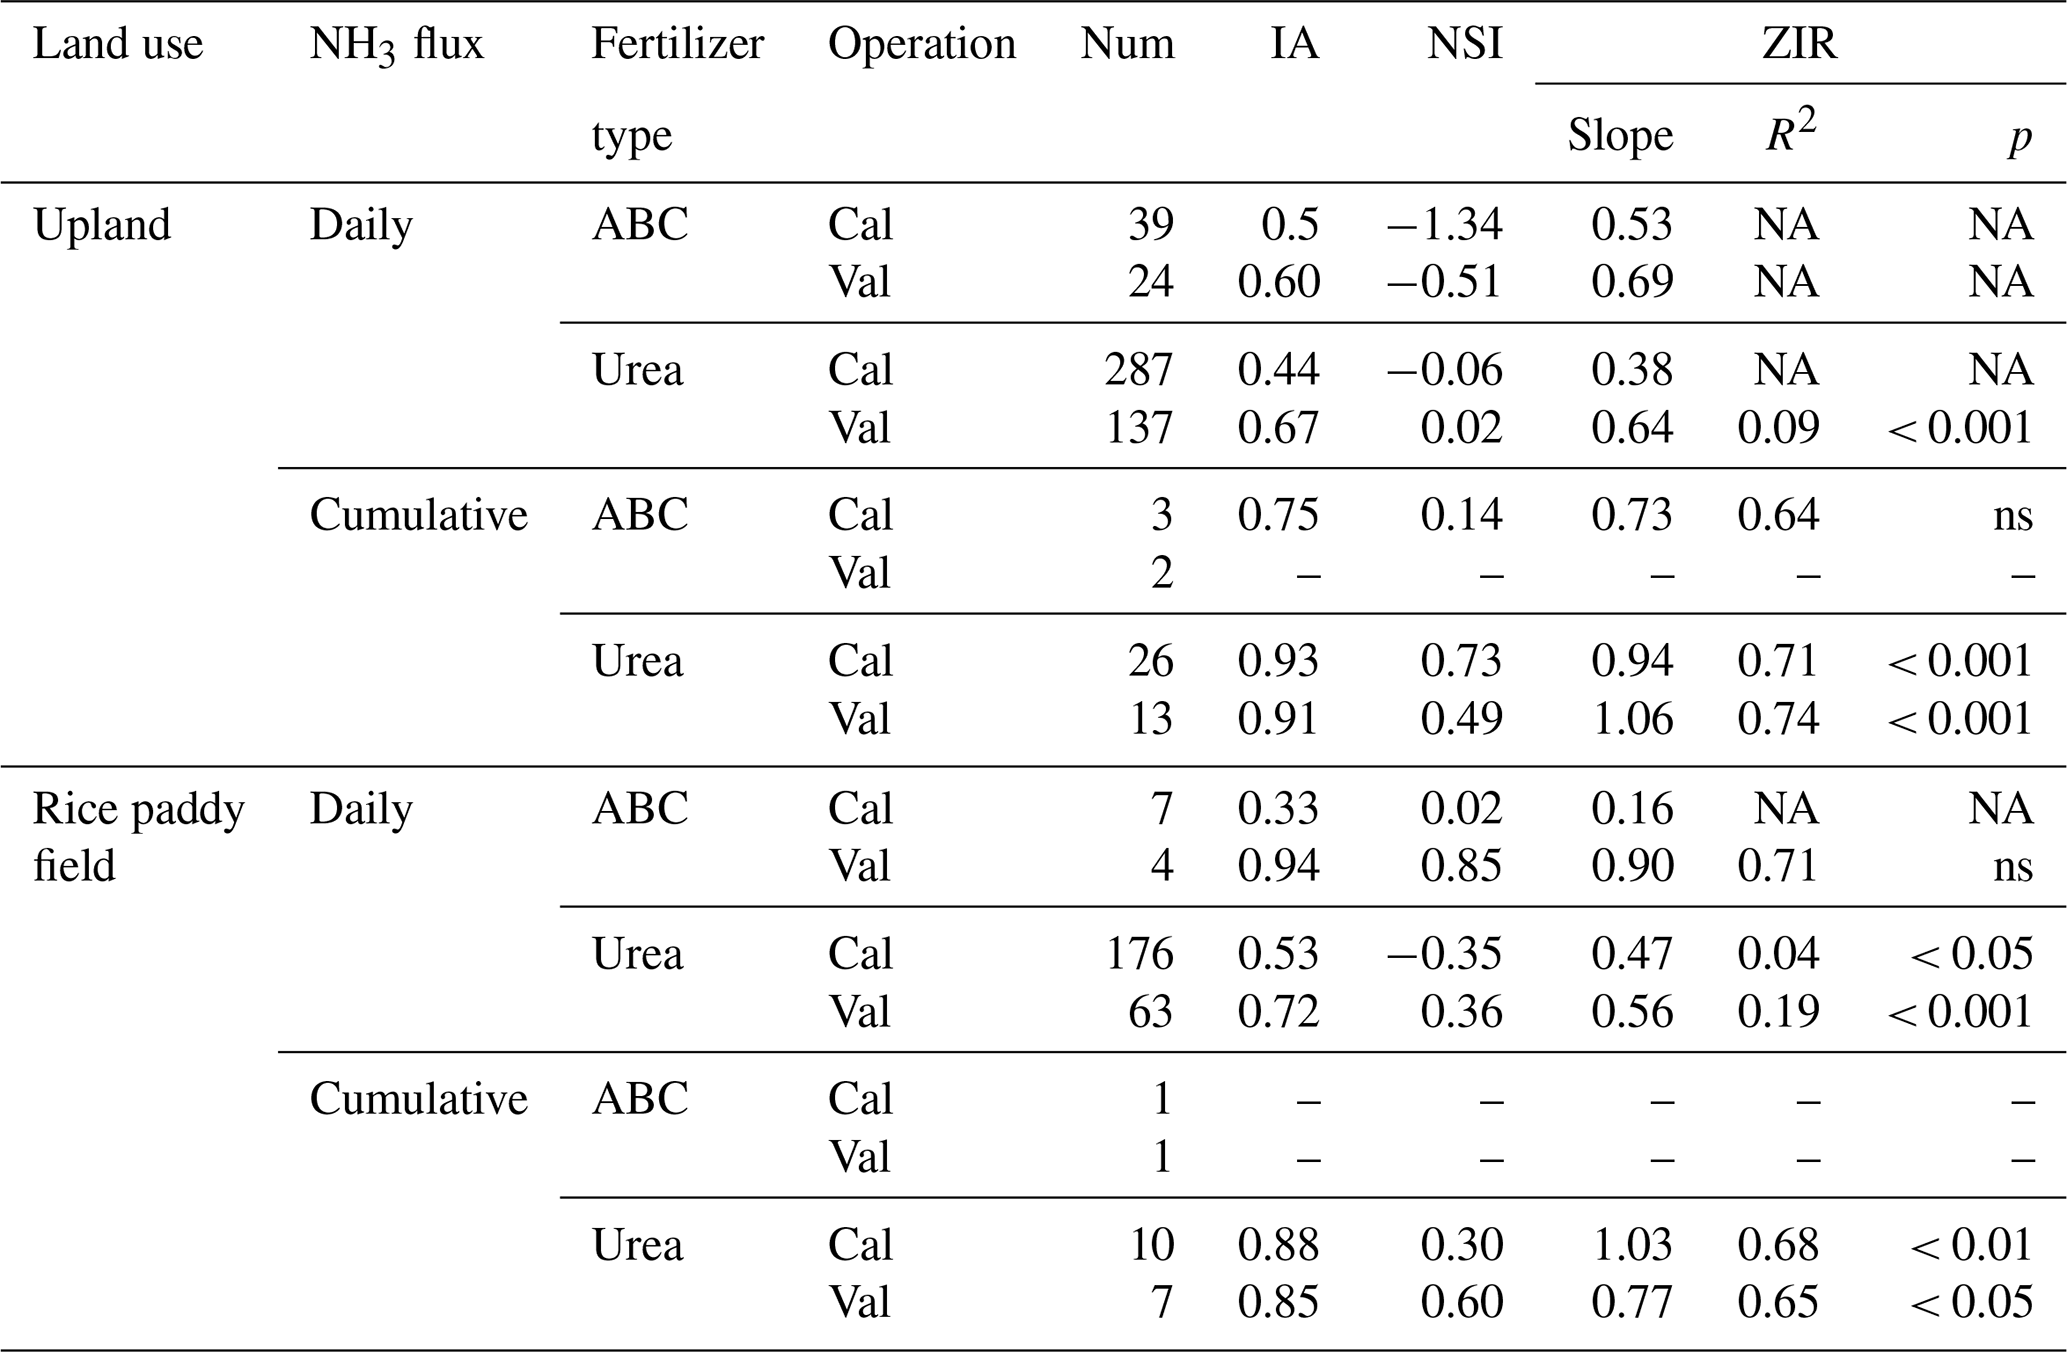
The statistical indices are the index of agreement (IA); Nash–Sutcliffe index (NSI); and the slope, determination coefficient (R2), and significance level (p) of the zero-intercept univariate linear regression (ZIR) of observations against simulations. “Not available” (NA) indicates a negative R2 and a suffering F test. “Not significant” (ns) indicates a ZIR with p > 0.05. Num is the abbreviation of sample number.
In this study, several modifications were conducted to improve the CNMM–DNDC performance in simulating NH3 volatilization from cultivated uplands. Regarding either the typically calibrated or independently validated cases, the modified CNMM–DNDC did not perform well in simulating daily NH3 fluxes, with low IA and unacceptable NSI values (Table 3). This result was probably because the simulated NH3 dynamic peak time could not absolutely be matched to the observed peak time, although the modified model captured the observed NH3 dynamic trend. For the three only typically calibrated ABC cases, the modified model performed marginally well in simulating CAVs, showing a good IA (0.75) but a low NSI (0.14) and an insignificant ZIR (R2 = 0.64) (Table 3). However, the modified model showed a perfect performance in simulating CAVs of both the calibrated and validated urea cases, with IA values (0.93 and 0.91) close to 1, acceptable NSI values (0.73 and 0.49), and significant ZIRs (R2 = 0.71 with slope = 0.94 and R2 = 0.74 with slope = 1.06) (Table 3). Regarding the CAVs of all the individual cases of cultivated uplands, the modified model reported an |RMB| of 1.0–307.8 % (mean: 69.8 %; Table 2), with only 16 % (7 of 44) of cases suffering from an |RMB| larger than 100 %.
3.2 Ammonia volatilization from rice paddy fields
Figures 3, 4, and 5 illustrated the observed and simulated NH3 volatilization and auxiliary variables (e.g., temperatures, pH, and NH concentrations of floodwater) in each rice paddy case. The cases with the same observed variables were associated in a figure for unified formatting. The observed CAVs in all cases of rice paddy fields (2 and 17 cases for ABC and urea applications, respectively) during the measurement periods totaled 5.9–39.8 kg N ha−1 (mean: 18.1 kg N ha−1; Table 2), with fertilizer application doses of 40.5–162.2 kg N ha−1 (mean: 81.4 kg N ha−1). Given the lack of the capacity to simulate the water-flooded layer over rice paddy fields, the original CNMM–DNDC could not simulate NH3 volatilization from rice paddy fields. The corresponding CAVs simulated by the modified CNMM–DNDC totaled 3.4–39.1 kg N ha−1 (mean: 16.2 kg N ha−1; Table 2). Regarding the CAVs of all the individual cases of rice paddy fields, the modified model demonstrated an |RMB| of 0.3 %–94.9 % (mean: 32.7 %; Table 2), and none of the 19 cases showed an |RMB| larger than 100 %. With regard to the only two ABC cases, the simulated daily NH3 fluxes generally matched the observations of the typically calibrated and independently validated cases (P1 and P2, respectively), although the simulated peak emissions of the first day for P1 were lower than the observations (Fig. 3e–f). For P1 and P2, the corresponding statistical indices showed that IA values were 0.33 and 0.94, the NSI values were 0.02 and 0.85, and the ZIR slopes were 0.16 (R2 and p values not available, n = 7) and 0.90 (R2 = 0.71, not significant, n = 4), respectively (Table 3). The observed and simulated daily NH3 fluxes due to urea application in the individual cases are illustrated in Fig. 4c–f and Fig. 5i–k, respectively. As the figures demonstrate, the temporal NH3 flux variation pattern simulated by the modified model generally followed that observed in the field. Regarding the simulations of the 10 typically calibrated and 7 independently validated urea cases, the modified model did not show good performance in terms of the daily NH3 flux, with IA values of 0.53 and 0.72, NSI values of −0.35 and 0.36, and ZIR slopes of 0.47 (R2 = 0.04, p < 0.05, n = 176) and 0.56 (R2 = 0.19, p < 0.001, n = 63), respectively (Table 3). However, the modified CNMM–DNDC performed extremely well in simulating CAVs of the calibrated and validated urea cases, showing good IA values of 0.88 and 0.85, acceptable NSI values of 0.30 and 0.60, and significant ZIR slopes of 1.03 (R2 = 0.68, n = 10) and 0.77 (R2 = 0.65, n = 7), respectively (Table 3).
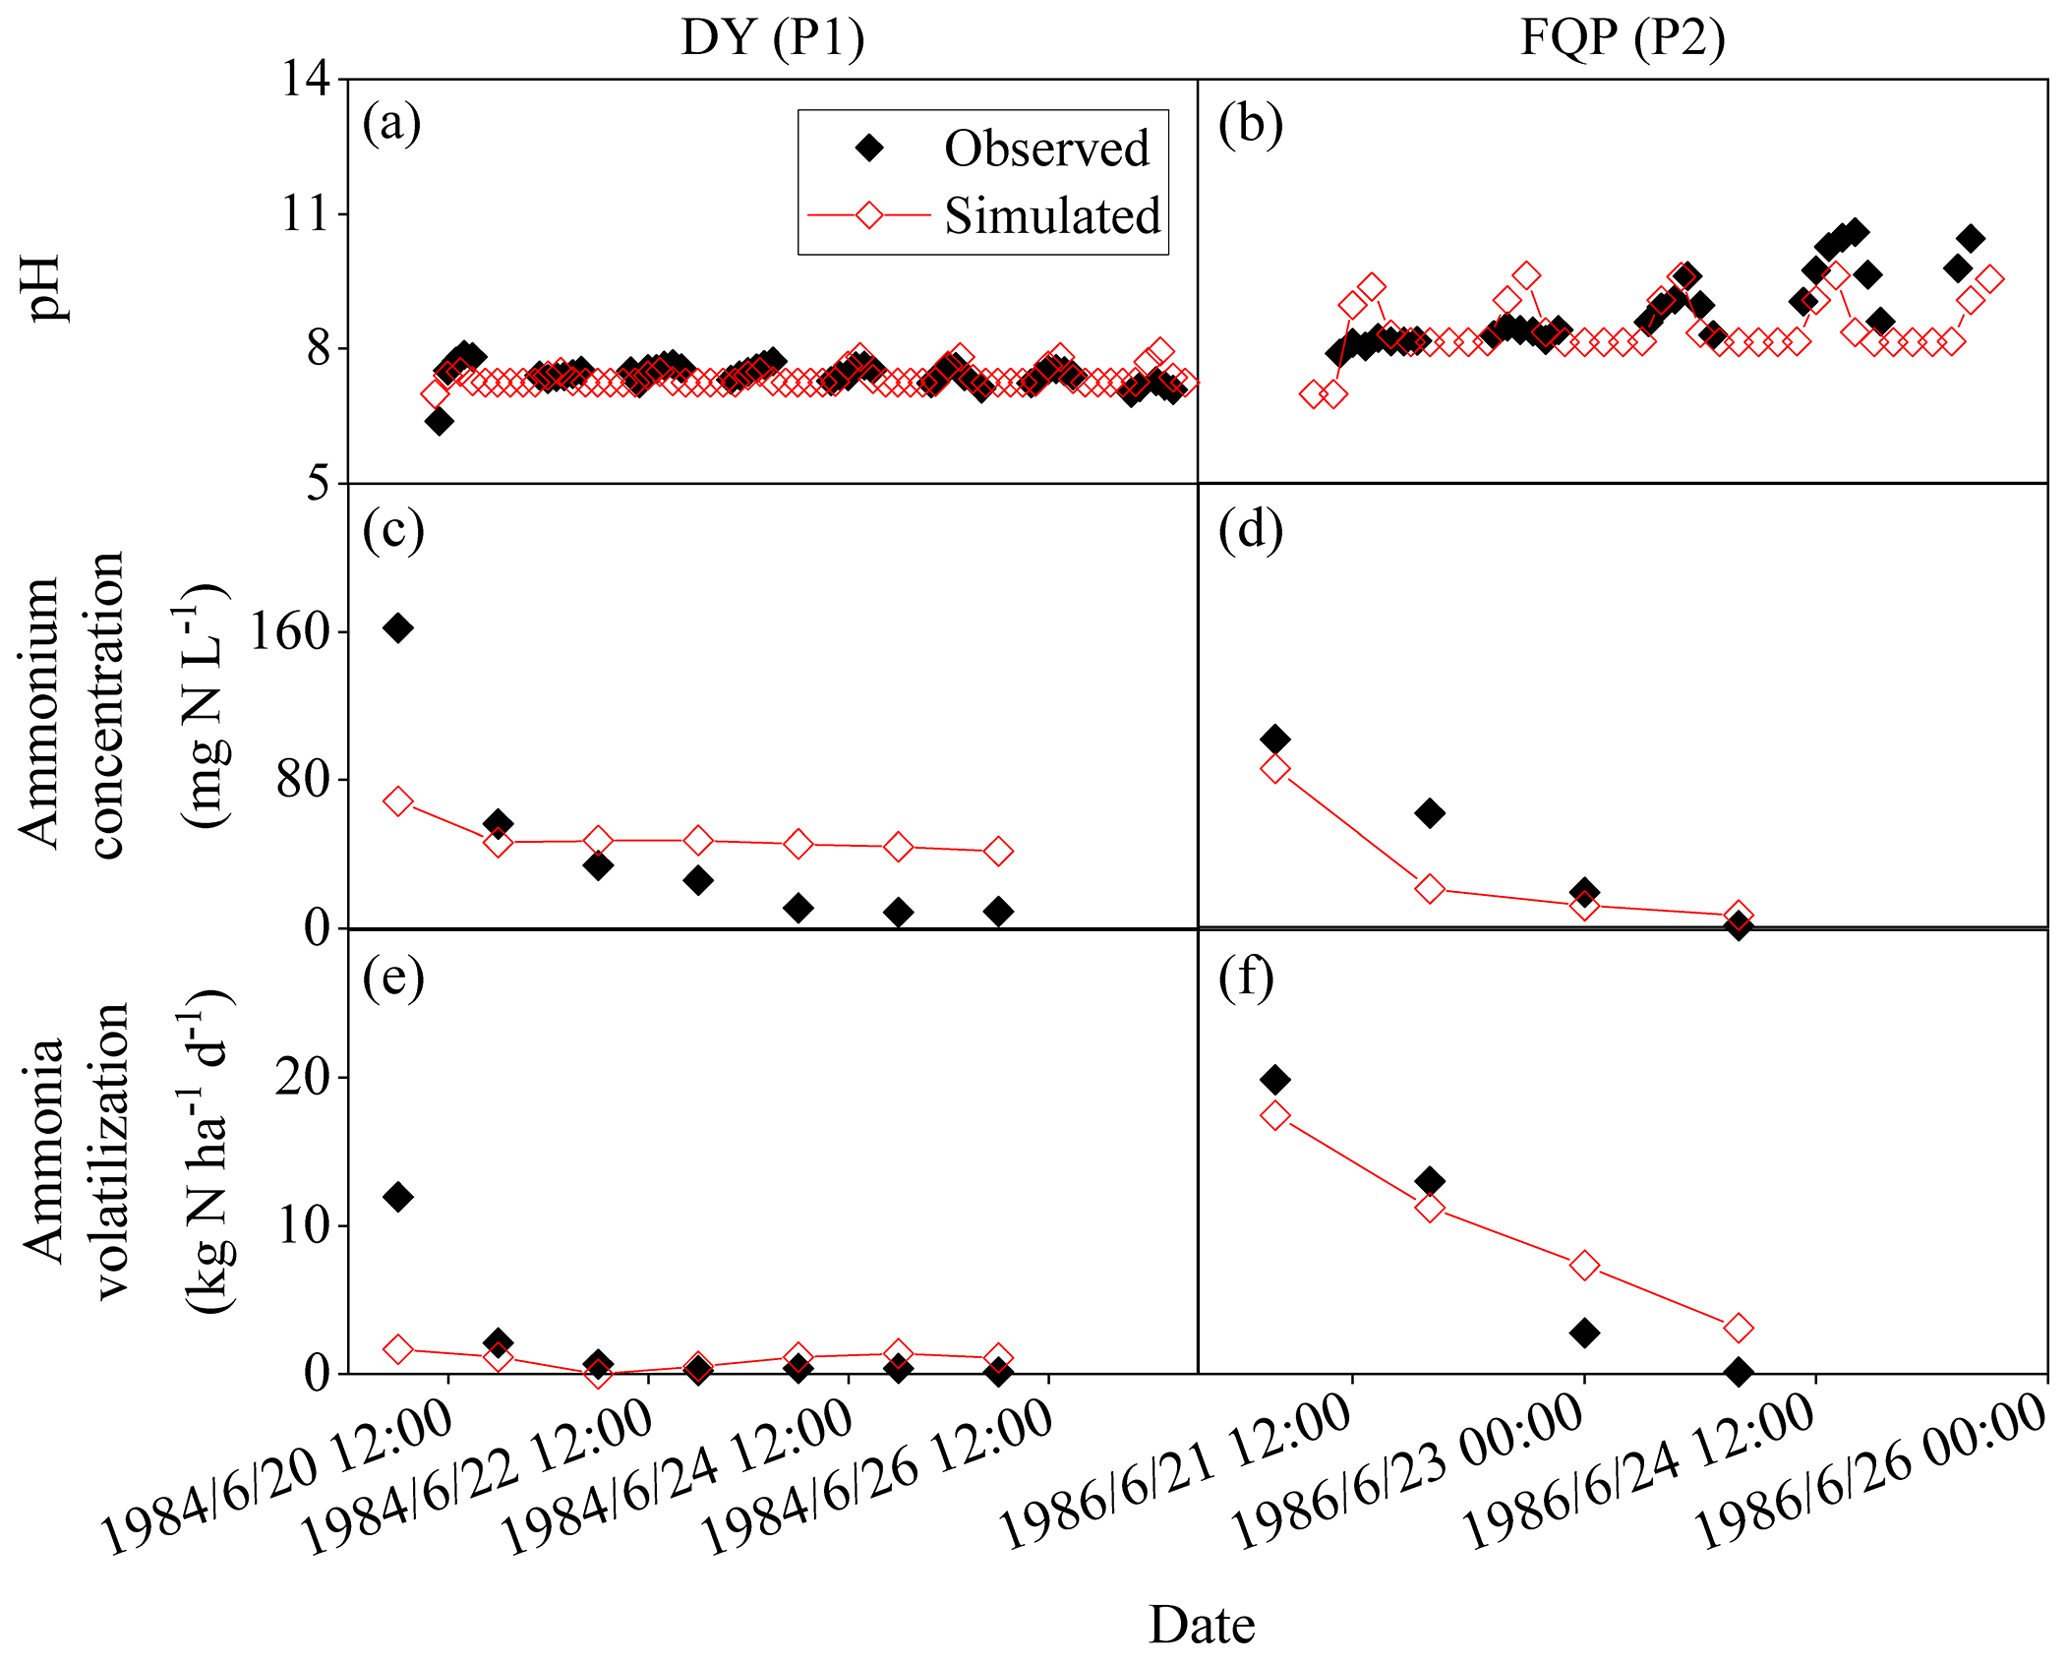
Figure 3Observed and simulated pH and ammonium concentrations of floodwater and daily ammonia volatilization from the ammonium carbonate application for DY and FQP. The definitions of the case codes refer to Table 2. The sites are Danyang (DY) and Fengqiu with rice paddy fields (FQP).

Figure 4Observed and simulated ammonium concentrations of floodwater and daily ammonia volatilization from the urea application for CS and SZ. The definitions of the case codes refer to Table 2. The sites are Changshu (CS) and Shenzhen (SZ).
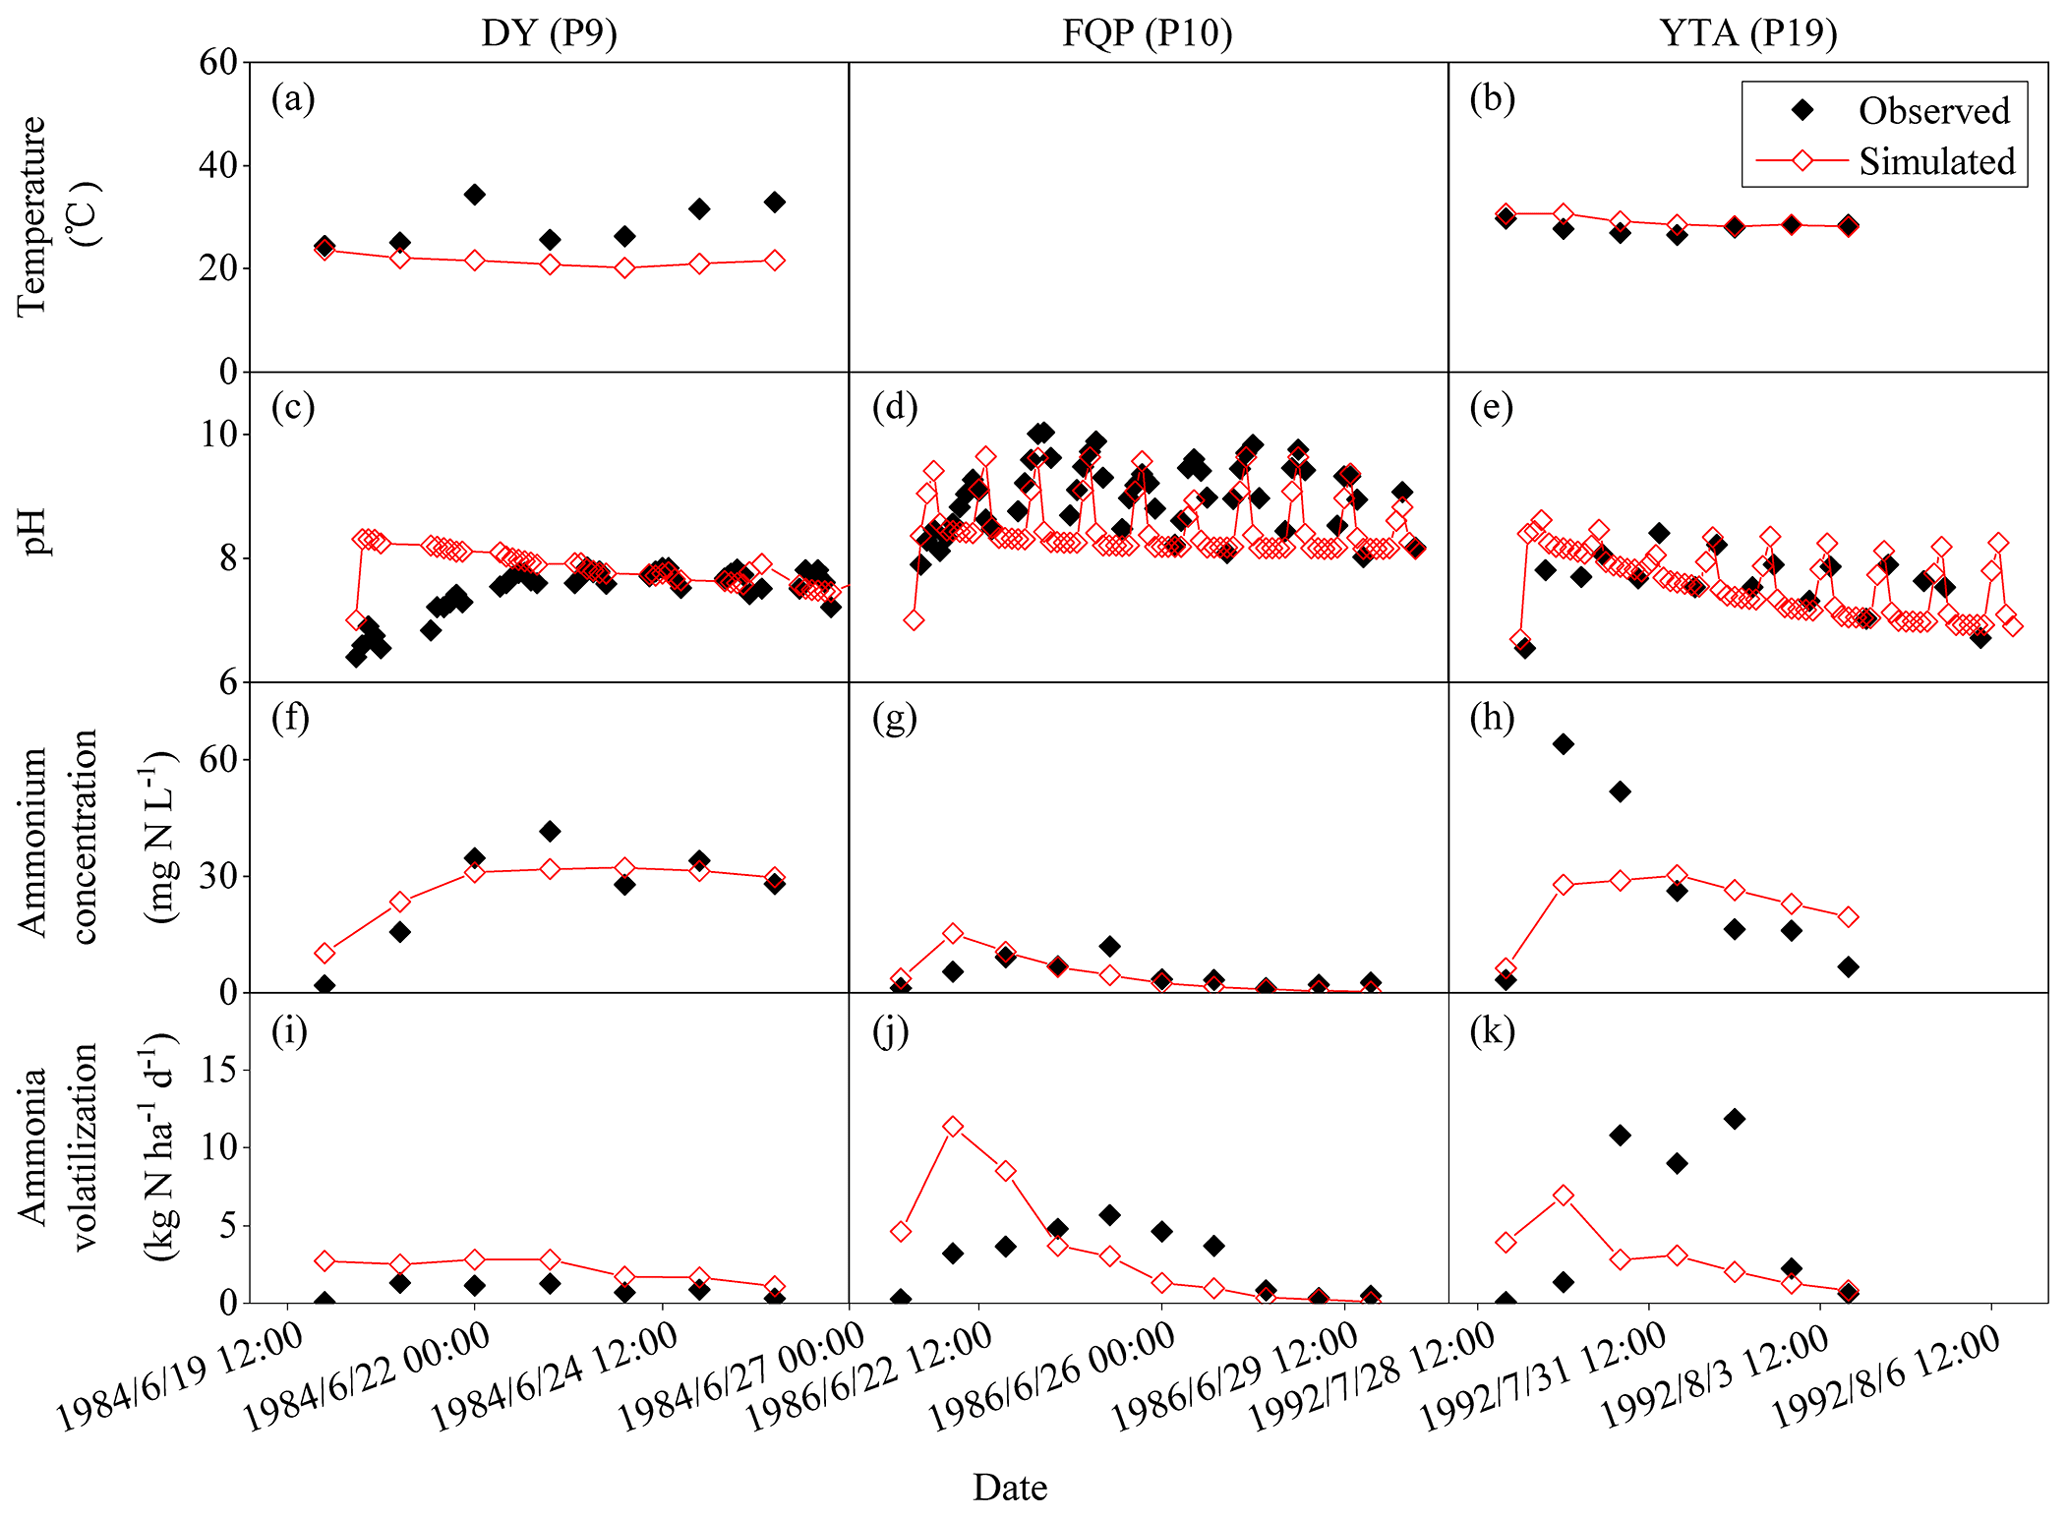
Figure 5Observed and simulated temperatures; pH and ammonium concentrations of floodwater; and daily ammonia volatilization from the urea application for DY, FQP, and YTA. The definitions of the case codes refer to Table 2. The sites are Danyang (DY), Fengqiu with rice paddy fields (FQP), and Yingtan (YTA).
3.3 Model performance in terms of other auxiliary variables in rice paddy fields
Table 4 lists the statistical indices used to evaluate the performance of the modified CNMM–DNDC in the simulation of floodwater temperatures, pH values, and NH concentrations when the model was calibrated and validated. The modified model generally captured the trends in floodwater temperature (Fig. 5a–b), although the simulated floodwater temperatures of several certain days for P9 were lower than the observations. The modified CNMM–DNDC, which introduced the effect of algal growth on floodwater pH, generally simulated the observed daily elevated floodwater pH resulting from algal photosynthetic activity (Figs. 3a–b and 5c–e). The simulation of calibrated (P1, P9, and P10; Figs. 3a and 5c–d) and validated cases (P2 and P19; Figs. 3b and 5e) of floodwater pH resulted in good IA values of 0.83 and 0.79, acceptable NSI values of 0.55 and 0.36, and ZIRs with significant R2 values of 0.55 (slope = 1.00, n = 147) and 0.36 (slope = 1.01, n = 45), respectively. The simulated and observed daily NH concentrations in the floodwater of the ABC and urea cases are illustrated in Figs. 3c–d, 4a–b, and 5f–h. Compared to the observed floodwater NH concentrations of the ABC cases, the model simulation underestimated the peak concentration on the first day after ABC application for the P1 case but captured the peak concentration of the P2 case (Fig. 3c–d). The modified CNMM–DNDC generally captured the observed temporal pattern in the daily NH concentrations during the observation periods following urea application, although discrepancies existed in the magnitudes of some cases; e.g., the model overestimated the floodwater NH concentration in the P7 and P8 cases (Fig. 4a–b) and underestimated that in the P6 (Fig. 4b) and P19 cases (Fig. 5h). Significant ZIRs between the simulated and observed daily floodwater NH concentrations of the typically calibrated and independently validated cases yielded significant slopes of 1.03 (R2 = 0.48, n = 24) and 0.74 (R2 = 0.34, n = 55), the IA values were 0.78 and 0.68, and the NSI values were 0.48 and 0.25, respectively (Table 4).
Table 4Statistical indices for evaluating the performance of the CNMM–DNDC in simulating the daily temperature (T), pH, and ammonium concentration (NH) in floodwater for the calibration (Cal) and validation (Val) cases.

The statistical indices are the index of agreement (IA); Nash–Sutcliffe index (NSI); and the slope, determination coefficient (R2), and significance level (p) of the zero-intercept univariate linear regression (ZIR) of observations against simulations. “Not available” (NA) indicates a negative R2 and a suffering F test. “Not significant” (ns) indicates a ZIR with p > 0.05. “Num” is the abbreviation of sample number. The definitions of the case codes refer to Table 2.
3.4 Summary for the performance of CNMM–DNDC in simulating NH3 volatilization
To sum up, as Fig. 6 shows, with regard to the simulations of all 40 typically calibrated and 23 independently validated cases of cultivated uplands and rice paddy fields by the modified model, significant zero-intercept linear relationships between the simulated and observed CAVs were found, with slopes of 0.94 (R2 = 0.76) and 0.98 (R2 = 0.71), respectively. In general, the above results indicated that the modifications made in this study obviously improved the performance of the CNMM–DNDC in simulating NH3 volatilization following applications of synthetic nitrogen fertilizers to cultivated upland and rice paddy soils. Nevertheless, the simulated CAV from cultivated upland cases with fertilizer application depth (U6, U20, and U44) and irrigation/precipitation (U16, U22, and U26) by the modified model resulted in the RMB larger than 150 %. With regard to the cases in the rice paddy fields, the simulations of the modified model with an absolute value of RMB larger than 50 % occurred in the P1, P9, and P13 cases. The modified model resulted in the largest RMB of 94.9 % between the observed and simulated CAV that occurred in the urea case of P9, which was located in DY under cloudy conditions. The ABC case of P1 with RMB of −57 % suffered from a serious underestimation of NH concentration in the floodwater (Fig. 3). For the cases in SZ, the modified CNMM–DNDC generally underestimated NH3 volatilization from almost all cases with low N dose but overestimated NH3 volatilization from the cases with high N dose.
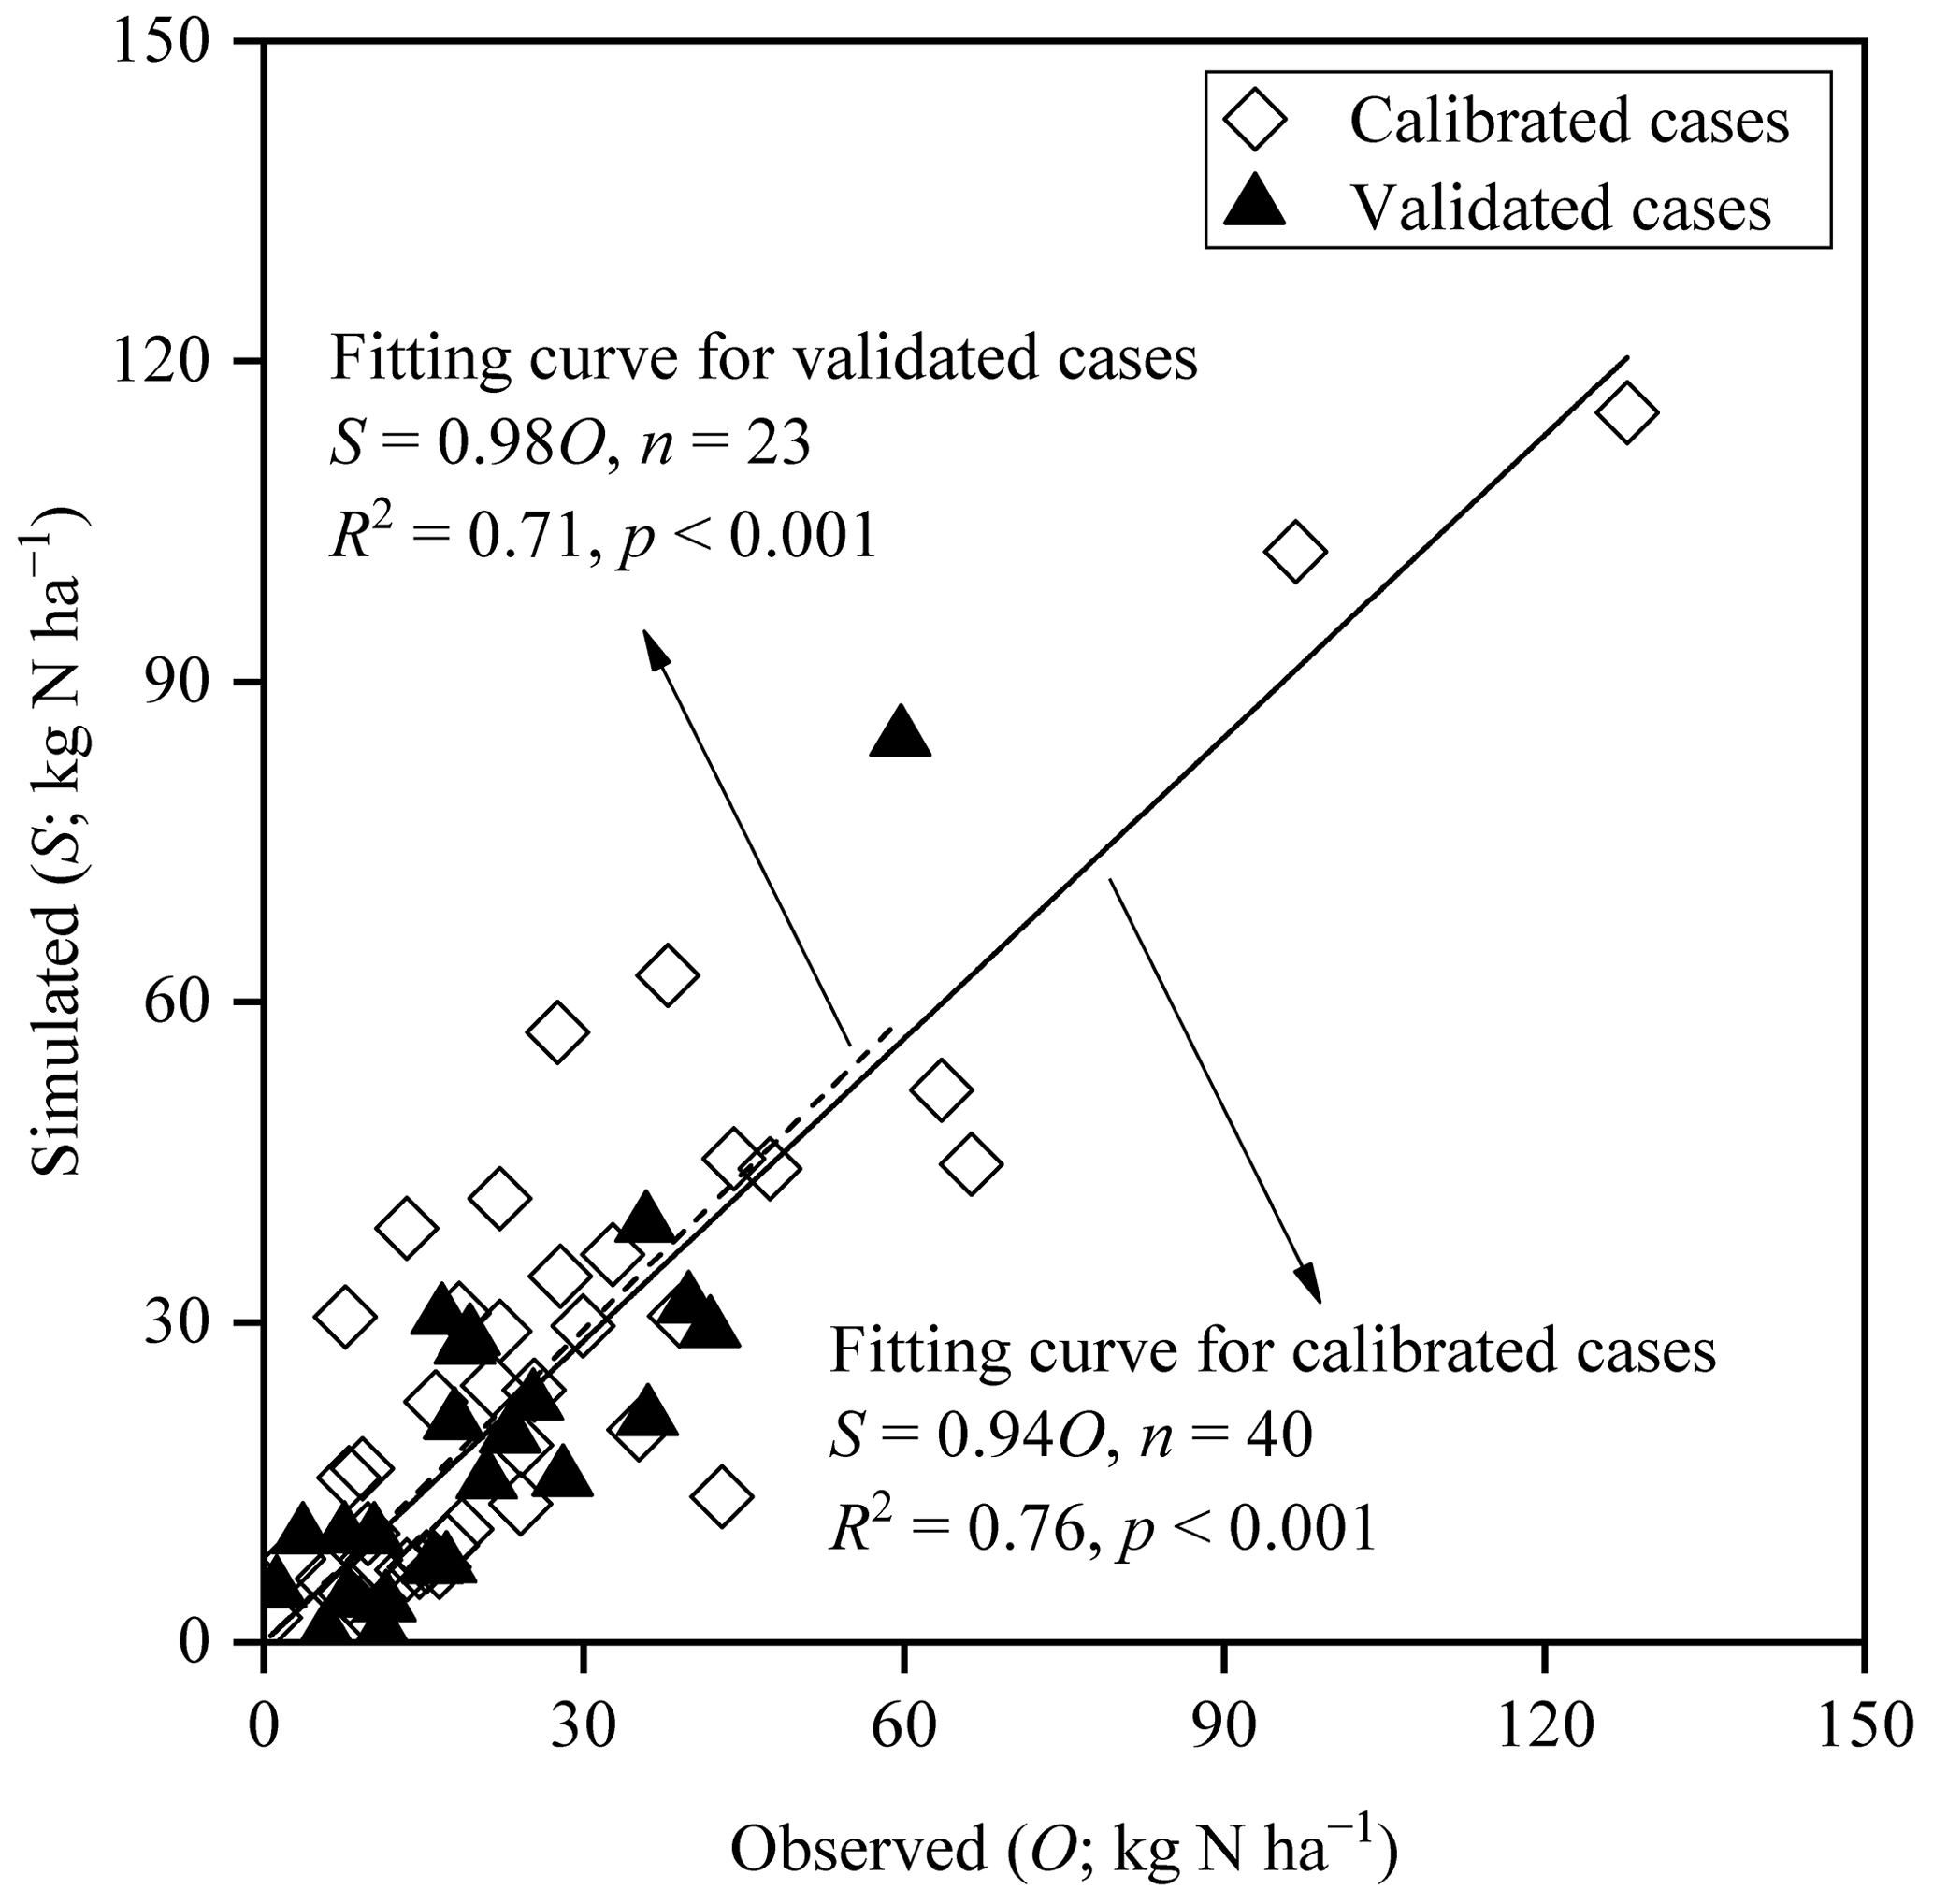
Figure 6Comparison between the observed and simulated cumulative ammonia volatilization from the individual fertilization events across all calibrated and validated cases of upland and rice paddy fields; n, p, and R2 denote the sample size, significance level, and coefficient of determination for the zero-intercept linear regression, respectively.
3.5 Sensitivity of model inputs and improved parameters in simulating NH3 volatilization
The sensitivity analysis of model input items indicated that NH3 volatilization from cultivated uplands was primarily regulated by field management practices (Fig. 7a). The changes in N dose, the different N types, and the implementation of irrigation had considerable effects on NH3 volatilization from cultivated uplands. In addition, a fertilization depth of 15 cm resulted in a −23 % change in NH3 volatilization, and the increase in irrigation amount had an inhibitory effect on NH3 volatilization. Moreover, in comparison to other soil properties, the changes in soil SOC had a greater influence (−19 % to 16 %) on NH3 volatilization. Among all considered meteorological variables, NH3 volatilization from cultivated uplands appeared to be the most sensitive response to changes in air temperature (Fig. 7a). However, NH3 volatilization from rice paddy soils was sensitive to changes in fertilization and floodwater management, which increased with N dosage and decreased with the depth of fertilizer application and that of floodwater (Fig. 7b). For all soil variables considered in the sensitivity analysis, only the changes in soil pH had a great influence on NH3 volatilization from rice paddy fields. In addition, NH3 volatilization from rice paddy soils decreased with solar radiation. With regard to the sensitivity analysis of the improved parameters (Fig. 8), NH3 volatilization from cultivated uplands showed more sensitivity to the reduction in the improved parameters than to the increase in those. Generally, as the improved parameters reduced, NH3 volatilization from cultivated uplands decreased. Moreover, NH3 volatilization from rice paddy fields displayed a complicated response to the change in the improved parameters involved in the process of NH3 volatilization from rice paddy fields. For instance, no matter whether ka increased or decreased, the NH3 volatilization decreased, while NH3 volatilization increased with increasing kd. The above results indicated that the modifications in simulating NH3 volatilization from either cultivated uplands or rice paddy fields were effective and feasible.
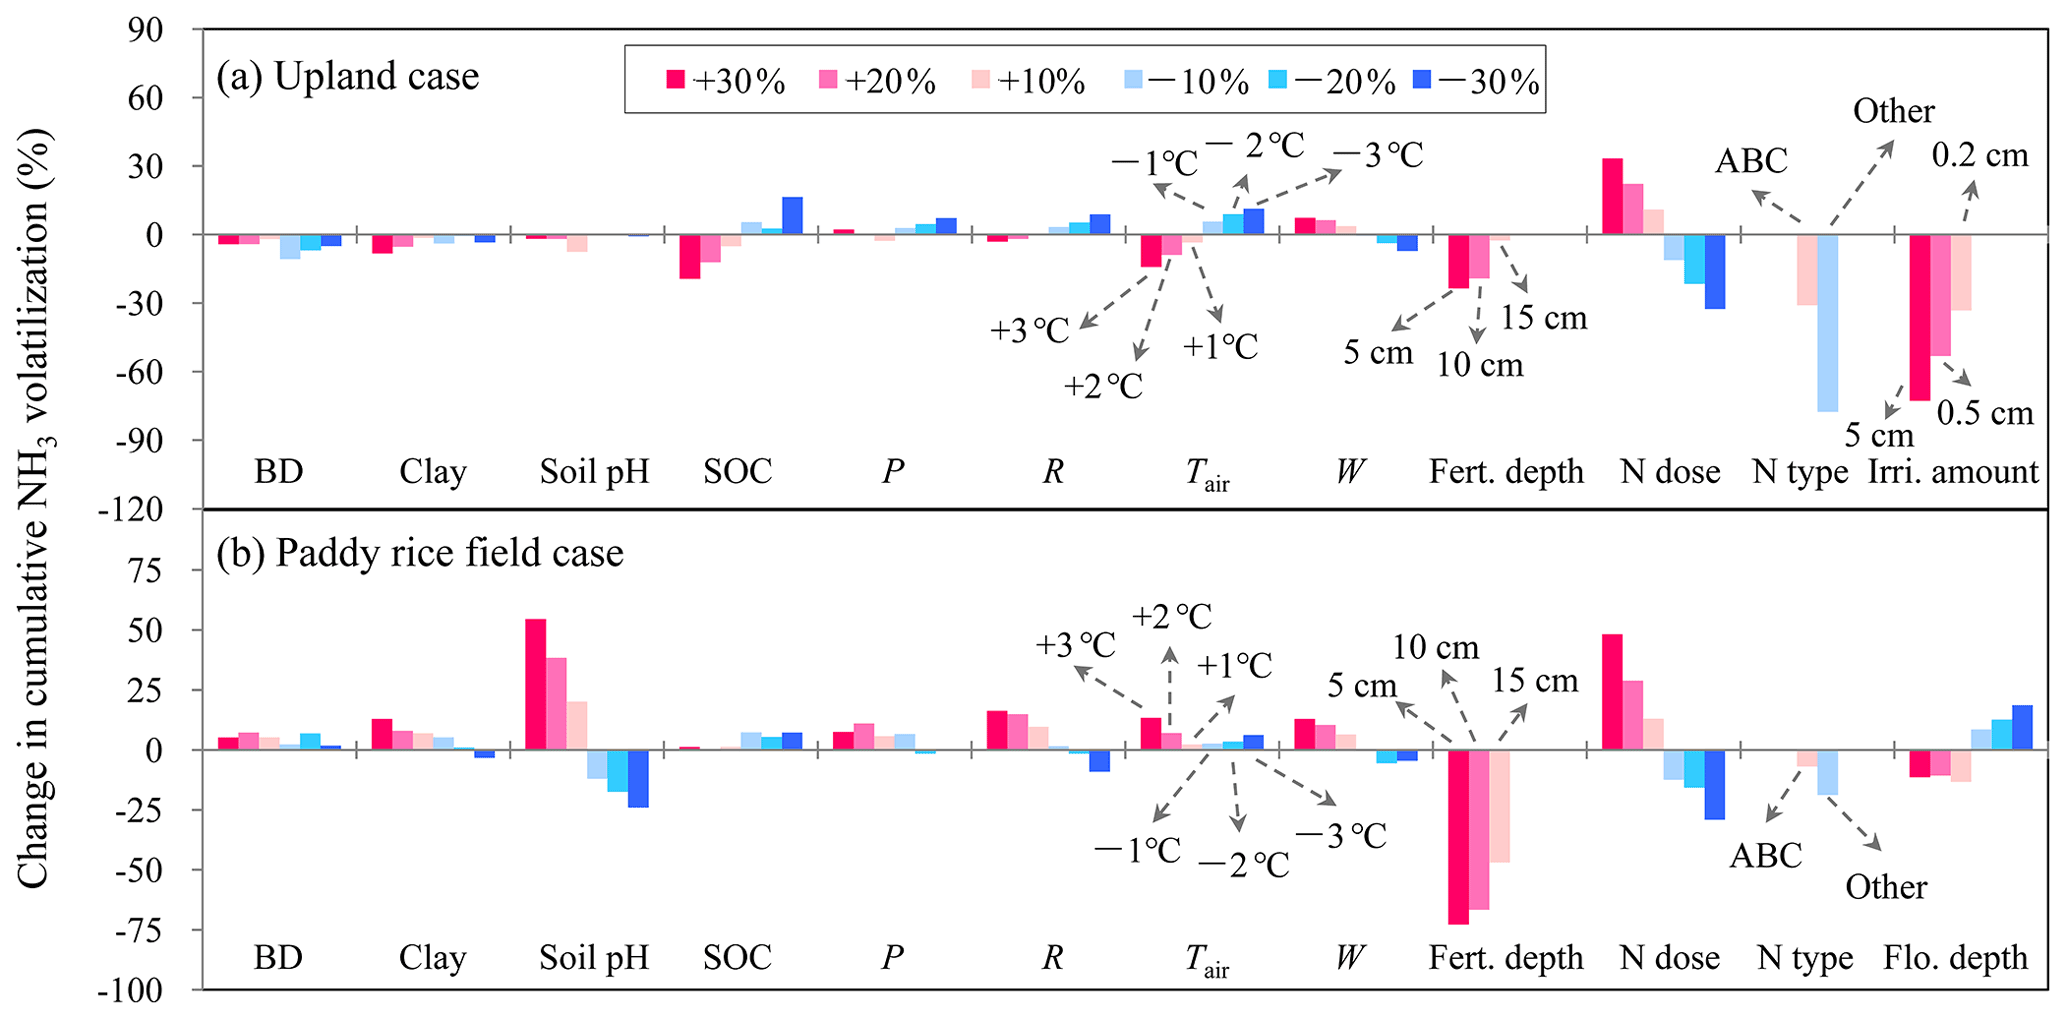
Figure 7Sensitivity analysis of the modified CNMM–DNDC in simulating cumulative ammonia (NH3) volatilization from uplands and rice paddy fields during the measurement periods through change input factors. The investigated input factors include 3-hourly averages of air temperature (Tair) and wind speed (W); 3-hourly totals of precipitation (P) and solar radiation (R) during individual measurement periods of NH3 volatilization; soil clay fraction, pH, organic carbon (SOC) content and bulk density (BD); irrigation water amount (Irri. amount) and floodwater depth (Flo. depth); and nitrogen fertilization depth, dose, and type (Fert. depth, N dose, and N type, respectively). The N types include ammonium bicarbonate (ABC) and other ammonium-based nitrogen fertilizers (Other). The legends within the frame apply to all the subfigures and all the factors without notes highlighted by arrows.
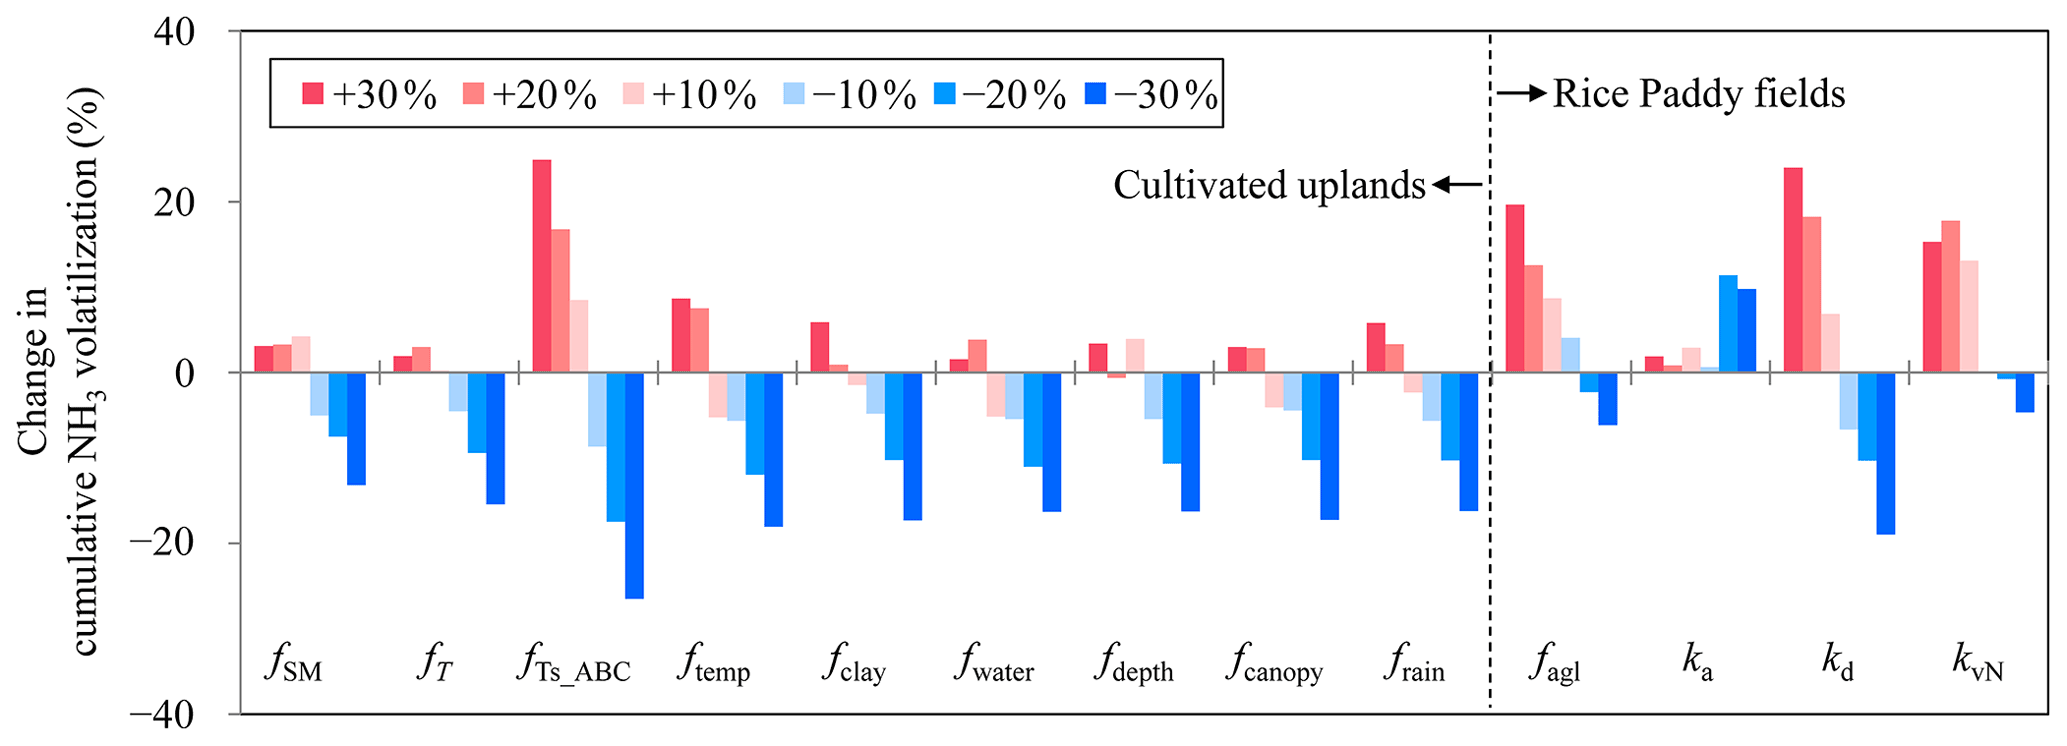
Figure 8Sensitivity analysis on the improved parameters of the modified CNMM–DNDC model in simulating cumulative ammonia (NH3) volatilization from cultivated uplands and rice paddy fields. The improved parameters for simulating NH3 volatilization from cultivated uplands involved in the sensitivity analysis include effect of soil moisture and soil temperature on urea hydrolysis (fSM and fT); effect of soil temperature on ammonium bicarbonate decomposition (fTs_ABC); and effect of soil temperature, soil clay content, soil moisture, soil depth, dry canopy, rain wetting canopy on NH3 volatilization (ftemp, fclay, fwater, fdepth, fcanopy, and frain). The improved parameters for simulating NH3 volatilization from rice paddy fields involved in the sensitivity analysis include the effect of algal growth on floodwater pH (falg), the dissociation and association rate constants for NH–NH3(aq) equilibrium (kd and ka), and the volatilization rate constant of NH3(aq) (kvN).
4.1 Model performance in simulating NH3 volatilization from cultivated uplands
The mechanism of NH3 volatilization in the modified CNMM–DNDC is mainly inherited from that in the DNDC model modified by Li et al. (2019). The simulated rate of NH3 flux is jointly determined by the regulating factors of wind speed, soil depth, clay fraction, soil temperature, soil moisture, vegetation canopy, and rainfall-induced canopy wetting. We found that the complicated management practices bring obstacles to modeling. Across all the cases of cultivated uplands (Table S4), the simulations of the modified CNMM–DNDC with an RMB larger than 150 % occurred in the cases with fertilizer application depth (U6 with broadcast followed by tillage (BFT) 20 cm, U20 with BFT 5 cm, and U44 with deep point placement 5–10 cm) and irrigation/precipitation (U16 with 4–6 cm irrigation, U22 with 4–6 cm irrigation, and U26 with 0.8 cm irrigation and 3.69 cm precipitation). Among all the cases with fertilizer application depth or irrigation/precipitation (38 total cases), 16 % (6 cases) had an RMB greater than 150 %.
This result might be because the model could not simulate well the inhibition mechanisms of some situations of fertilization depth and water-adding events' effect on NH3 volatilization. Moreover, Li et al. (2019) also reported that irrigation/precipitation during the measurement periods had a complex effect (e.g., reduction and stimulation) on NH3 volatilization following nitrogen fertilizer application in cultivated uplands, and determining this information is still a considerable challenge in NH3 simulations by biogeochemical models. At the same time, Li et al. (2019) also found that the doses and depths of the fertilizer applications jointly accounted for 43 % (p < 0.001) of the variance in the observed CAVs. The results demonstrated that the simulated NH3 volatilization from cultivated uplands following nitrogen fertilizer application accompanied by deep or mixed placement or irrigation/precipitation by the modified model still had some deviation from the observations, and more synchronous observations of NH3 volatilization and other auxiliary variables (e.g., soil moisture, NH concentration, and nitrogen uptake by crops) in these situations are urgently needed to further revise the CNMM–DNDC.
4.2 Model performance in simulating NH3 volatilization from rice paddy fields
In this study, four improvements in the pH of floodwater were involved in the modified CNMM–DNDC. First, floodwater over rice paddy soil was added, which enabled the simulation of floodwater pH in the modified model. Second, the modified model used the initial pH of floodwater and the pH of the surface soil to calculate the floodwater pH. The above two improvements allowed the introduction of the J–M model into the modified CNMM–DNDC. The present relatively reliable biogeochemical models rarely involve floodwater over rice paddy soil when simulating NH3 volatilization from rice paddy fields, which is not in accordance with the natural state. Third, when urea was applied to the surface floodwater, the subsequent urea hydrolysis reaction could increase the floodwater pH, and this process was added to the modified model by referring to the algorithms applied in the original model for upland soils (Sect. 2.1.2). Finally, the effect of algal growth on floodwater pH was introduced into the modified model by calculating the ratio of the solar shortwave radiation effect on algal photosynthesis. In detail, under cloudy conditions in DY (P9), only 9 % of the applied urea N was observed to be lost as NH3 from the rice paddy soil, while up to 40 % of the applied urea N was observed to be lost under high-solar-radiation conditions in YTA (P19) (Cai et al., 1992).
However, the modified CNMM–DNDC overestimated the emissions from DY but underestimated those from YTA, which could be attributed to the overestimation of the pH during the first 3 observation days in DY and the underestimation of NH concentrations in YTA (Fig. 5). In addition, algal blooms only appeared on the surface of calm water; thus, a number of factors, such as irrigation, heavy rain, strong wind, and drainage, could hamper the growth of algae (Cao et al., 2013). Due to the basal dressing followed by irrigation (Gong et al., 2013), which inhibited the reproduction of algae in SZ (P11 and P12 cases), the observed NH3 emissions accounted for only 10 %–13 % of the applied nitrogen. Unfortunately, the aforementioned factors that reduced algal growth were not introduced into the modified CNMM–DNDC because of limited reports, which resulted in an overestimation of NH3 emissions of 6.4 and 2.6 kg N ha−1 for P11 and P12 in SZ cases with a high rate of urea application, respectively. More observational data on the effect of algal growth on floodwater pH and subsequent NH3 volatilization are needed to improve the simulation of the modified model on NH3 volatilization from rice paddy fields.
Therefore, the modified CNMM–DNDC with the introduction of a floodwater layer, as well as the corresponding processes, into the simulation of NH3 volatilization provided a more scientific algorithm for the simulation of NH3 loss from rice paddy fields, thereby enabling the simulation of the pH and NH concentration of floodwater. However, the depth of surface floodwater was kept at a constant value (such as the average depth of the floodwater) for each flooding event in the modified model, but this operation was inconsistent with the field states. The floodwater depth actually changed with real-time evaporation and precipitation. Therefore, a module for calculating the dynamics of floodwater depth driven by real-time evaporation and precipitation is needed to better simulate the effect of floodwater depth on NH3 volatilization. The results of this study suggest that accurate field measurements and a corresponding reliable simulation of floodwater depth are crucial for the simulation of NH3 volatilization by the modified CNMM–DNDC.
4.3 Differences between NH3 volatilization from cultivated uplands and rice paddy fields
NH3 volatilization from soil–plant upland systems is an extremely complex process (Freney and Simpson, 1983; Sommer et al., 2004). It is obvious that soil properties play an important role in regulating NH3 volatilization from cultivated uplands, as has been reported by a great number of studies (e.g., Duan and Xiao, 2000; Lei et al., 2017; Martens and Bremner, 1989). In addition, NH3 volatilization from cultivated uplands was simultaneously regulated by the complicated management practices. As the sensitivity analysis indicated, NH3 volatilization from cultivated uplands was primarily regulated by the dose, type, and application depth of N fertilizer and water management (Fig. 7a).
With regard to NH3 volatilization from rice paddy fields, floodwater pH has been considered one of the primary factors affecting NH3 volatilization from rice paddy fields (Fillery et al., 1984; Hayashi et al., 2006; Jayaweera and Mikkelsen, 1991). As floodwater pH increases, the equilibrium of NH ions and NH3(aq) in floodwater transfers in the direction of NH3(aq) formation, which will increase the potential for subsequent NH3 volatilization (Jayaweera and Mikkelsen, 1990a; Sommer et al., 2004). Previous studies have also shown that the stimulation of NH3 volatilization from rice paddy fields is affected by algal growth, which largely contributes to the elevation of floodwater pH resulting from algal photosynthetic activity (Buresh et al., 2008; Fillery and Vlek, 1986; Mikkelsen et al., 1978).
The addition of a suitable photosynthetic inhibitor also controlled the pH of the floodwater, implying that the increase in pH was caused by algal growth (Bowmer and Muirhead, 1987). In addition, many studies have found that the depth of surface floodwater has a substantial influence on NH3 volatilization (Fillery et al., 1984; Freney et al., 1988; Hayashi et al., 2006). The sensitivity analysis of this study also indicated that NH3 volatilization from rice paddy fields was sensitive to changes in the depth of surface floodwater (Fig. 7b). Jayaweera and Mikkelsen (1990b) demonstrated that the volatilization rate of NH3 decreases as the depth of floodwater increases despite the small difference in meteorological factors and soil physicochemical properties. The reducing effects might be attributed to the following mechanisms. First, with increasing floodwater depth, the concentration of NH in floodwater decreases (Cai et al., 1986). Many studies have found that a lower concentration of NH in floodwater contributes to the reduced potential of NH3 volatilization in paddy fields (Bhagat et al., 1996; Hayashi et al., 2006; He et al., 2014; Liu et al., 2015; Song et al., 2004). Observations based on wind tunnel experiments showed that the NH3 loss decreased from 14.6 to 4.5 mg L−1 as the depth of floodwater increased from 6.4 to 21.3 cm, while other environmental conditions were similar (Jayaweera et al., 1990). Second, a reduction in the depth of floodwater increases the volatilization rate constant of NH3(aq) (kvN), thus increasing NH3 volatilization from floodwater.
According to the above results, the regulatory factors affecting NH3 volatilization from rice paddy fields were demonstrated to be different from those from cultivated uplands, which was also supported by previous research (Tian et al., 2001; Zhao et al., 2009). NH3 volatilization from cultivated uplands was primarily influenced by the regulatory factors of soil properties and field management practices. However, given the existence of floodwater over rice paddy field soils, NH3 volatilization from rice paddy fields was additionally affected by flooding management strategies, such as floodwater pH and depth. Therefore, the mechanisms and algorithms applied in simulating NH3 volatilization from cultivated uplands are not appropriate for simulating NH3 volatilization from rice paddy fields. In the modified CNMM–DNDC, NH3 volatilization following nitrogen fertilizer application in cultivated uplands was based on first-order kinetics. However, the modified CNMM–DNDC adopted the J–M model, which was based on the two-film theory of mass transfer, to calculate NH3 volatilization following nitrogen fertilizer application in rice paddy field soils. The results suggest that the application of two different mechanisms according to the distinguished properties of cultivated uplands and rice paddy fields to simulate NH3 volatilization is necessary for process-based biogeochemical models, such as the CNMM–DNDC used in this study.
All of the model output used to produce the figures can be obtained from the Supplement, and all of the observed datasets used in this study were collected from published peer-reviewed articles. The code and executive program of the modified model can be obtained from https://doi.org/10.6084/m9.figshare.19388756.v3 (Li, 2022).
The supplement related to this article is available online at: https://doi.org/10.5194/bg-19-3001-2022-supplement.
XZ, YL, and WZ contributed to developing the idea and methodology of this study. SL arranged the research data, improved and implemented the model simulation, and prepared the paper with contributions from all co-authors. RW, KW, and CZ contributed to collecting and maintaining the research data. SH, CL, and ZY analyzed study data and verified the results.
The contact author has declared that neither they nor their co-authors have any competing interests.
Publisher’s note: Copernicus Publications remains neutral with regard to jurisdictional claims in published maps and institutional affiliations.
This research has been supported by the Chinese Academy of Sciences (grant no. ZDBS-LY-DQC007), the National Key Scientific and Technological Infrastructure project “Earth System Science Numerical Simulator Facility” (EarthLab), the National Natural Science Foundation of China (grant no. 41907280), and the China Postdoctoral Science Foundation (grant no. 2019M650808).
This paper was edited by Ben Bond-Lamberty and reviewed by two anonymous referees.
Abdalla, M., Song, X., Ju, X., Topp, C. F. E., and Smith, P.: Calibration and validation of the DNDC model to estimate nitrous oxide emissions and crop productivity for a summer maize-winter wheat double cropping system in Hebei, China, Environ. Pollut., 262, 114199, https://doi.org/10.1016/j.envpol.2020.114199, 2020.
Alberty, R. A.: Physical chemistry, 6th edn., John Wiley & Sons, New York, ISBN 0-471-09284-3, 1983.
Anderson, D. M., Burkholder, J. M., Cochlan, W. P., Glibert, P. M., Gobler, C. J., Heil, C. A., Kudela, R. M., Parsons, M. L., Rensel, J. E. J., Townsend, D. W., Trainer, V. L., and Vargo, G. A.: Harmful algal blooms and eutrophication: Examining linkages from selected coastal regions of the United States, Harmful Algae, 8, 39–53, https://doi.org/10.1016/j.hal.2008.08.017, 2008.
Behera, S. N., Sharma, M., Aneja, V. P., and Balasubramanian, R.: Ammonia in the atmosphere: a review on emission sources, atmospheric chemistry and deposition on terrestrial bodies, Environ. Sci. Pollut. R., 20, 8092–8131, https://doi.org/10.1007/s11356-013-2051-9, 2013.
Bhagat, R. M., Bhuiyan, S. I., and Moody, K.: Water, tillage and weed interactions in lowland tropical rice: a review, Agr. Water Manage., 31, 165–184, https://doi.org/10.1016/0378-3774(96)01242-5, 1996.
Bobbink, R., Hornung, M., and Roelofs, J. G. M.: The effects of air-borne nitrogen pollutants on species diversity in natural and semi-natural European vegetation, J. Ecol., 86, 717–738, https://doi.org/10.1046/j.1365-2745.1998.8650717.x, 1998.
Bouwman, A. F., Lee, D. S., Asman, W. A. H., Dentener, F. J., VanderHoek, K. W., and Olivier, J. G. J.: A global high-resolution emission inventory for ammonia, Global Biogeochem. Cy., 11, 561–587, https://doi.org/10.1029/97gb02266, 1997.
Bowmer, K. H. and Muirhead, W. A.: Inhibition of algal photosynthesis to control pH and reduce ammonia volatilization from rice floodwater, Fertil. Res., 13, 13–29, https://doi.org/10.1007/BF01049799, 1987.
Buresh, R., Ramesh Reddy, K., and van Kessel, C.: Nitrogen Transformations in Submerged Soils, in: Nitrogen in Agricultural Systems, edited by: Schepers, J. S. and Raun, W. R., John Wiley & Sons, Ltd., 401–436, https://doi.org/10.2134/agronmonogr49.c11, 2008.
Cai, G., Zhu, Z., Trevitt, A., Freney, J. R., and Simpson, J. R.: Nitrogen loss from ammonium bicarbonate and urea fertilizers applied to flooded rice, Fertil. Res., 10, 203–215, https://doi.org/10.1007/BF01049350, 1986.
Cai, G., Peng, G., Wang, X., and Zhu, J.: Ammonia volatilization from urea applied to acid paddy soil in southern china and its control, Pedosphere, 2, 345–354, 1992.
Cannavo, P., Recous, S., Parnaudeau, V., and Reau, R.: Modeling N dynamics to assess environmental impacts of cropped soils, Advances in Agronomy, 97, Academic Press, 131–174, https://doi.org/10.1016/S0065-2113(07)00004-1, 2008.
Cao, Y., Tian, Y., Yin, B., and Zhu, Z.: Proliferation of algae and effect of its on fertilizer–N immobilization in flooded paddy field, J. Plant Nutr. Fertil. Sc., 19, 111–116, https://doi.org/10.11674/zwyf.2013.0113, 2013.
Chien, S. H., Prochnow, L. I., and Cantarella, H.: Recent developments of fertilizer production and use to improve nutrient efficiency and minimize environmental impacts, chap. 8, Advances in Agronomy, 102, Academic Press, 267–322, https://doi.org/10.1016/S0065-2113(09)01008-6, 2009.
De Datta, S. K.: Nitrogen transformations in wetland rice ecosystems, Fertil. Res., 42, 193–203, https://doi.org/10.1007/bf00750514, 1995.
Duan, Z. and Xiao, H.: Effects of soil properties on ammonia volatilization, Soil Sci. Plant Nutr., 46, 845–852, 2000.
Dubache, G., Li, S., Zheng, X., Zhang, W., and Deng, J.: Modeling ammonia volatilization following urea application to winter cereal fields in the United Kingdom by a revised biogeochemical model, Sci. Total Environ., 660, 1403–1418, https://doi.org/10.1016/j.scitotenv.2018.12.407, 2019.
Dutta, B., Congreves, K. A., Smith, W. N., Grant, B. B., Rochette, P., Chantigny, M. H., and Desjardins, R. L.: Improving DNDC model to estimate ammonia loss from urea fertilizer application in temperate agroecosystems, Nutr. Cycl. Agroecosys., 106, 275–292, https://doi.org/10.1007/s10705-016-9804-z, 2016.
Felix, J. D., Elliott, E. M., Gish, T. J., McConnell, L. L., and Shaw, S. L.: Characterizing the isotopic composition of atmospheric ammonia emission sources using passive samplers and a combined oxidation-bacterial denitrifier approach, Rapid Commun. Mass Sp., 27, 2239–2246, https://doi.org/10.1002/rcm.6679, 2013.
Fillery, I. R. P. and Vlek, P. L. G.: 4. Reappraisal of the significance of ammonia volatilization as an N loss mechanism in flooded rice fields, Fertil. Res., 9, 79–98, https://doi.org/10.1007/BF01048696, 1986.
Fillery, I. R. P., Simpson, J. R., and Dedatta, S. K.: Influence of field environment and fertilizer management on ammonia loss from flooded rice, Soil Sci. Soc. Am. J., 48, 914–920, https://doi.org/10.2136/sssaj1984.03615995004800040043x, 1984.
Freney, J. R. and Simpson, J. R.: Gaseous loss of nitrogen from plant-soil systems, Dev. Plant Soil Sci., 9, 1–32, https://doi.org/10.1007/978-94-017-1662-8, 1983.
Freney, J. R., Trevitt, A. C. F., Muirhead, W. A., Denmead, O. T., Simpson, J. R., and Obcemea, W. N.: Effect of water depth on ammonia loss from lowland rice, Fertil. Res., 16, 97–107, https://doi.org/10.1007/bf01049767, 1988.
Giltrap, D., Saggar, S., Rodriguez, J., and Bishop, P.: Modelling NH3 volatilisation within a urine patch using NZ-DNDC, Nutr. Cycl. Agroecosys., 108, 267–277, https://doi.org/10.1007/s10705-017-9854-x, 2017.
Gong, W., Zhang, Y., Huang, X., and Luan, S.: High–resolution measurement of ammonia emissions from fertilization of vegetable and rice crops in the Pearl River Delta Region, China, Atmos. Environ., 65, 1–10, https://doi.org/10.1016/j.atmosenv.2012.08.027, 2013.
Han, K., Zhou, C., and Wang, L.: Reducing ammonia volatilization from maize fields with separation of nitrogen fertilizer and water in an alternating furrow irrigation system, J. Integr. Agr., 13, 1099–1112, https://doi.org/10.1016/s2095-3119(13)60493-1, 2014.
Hayashi, K., Nishimura, S., and Yagi, K.: Ammonia volatilization from the surface of a Japanese paddy field during rice cultivation, Soil Sci. Plant Nutr., 52, 545–555, https://doi.org/10.1111/j.1747-0765.2006.00053.x, 2006.
He, Y., Yang, S., Xu, J., Wang, Y., and Peng, S.: Ammonia volatilization losses from paddy fields under controlled irrigation with different drainage treatments, Sci. World J., 2014, 417605, https://doi.org/10.1155/2014/417605, 2014.
Holcomb III, J. C., Sullivan, D. M., Horneck, D. A., and Clough, G. H.: Effect of irrigation rate on ammonia volatilization, Soil Sci. Soc. Am. J., 75, 2341–2347, https://doi.org/10.2136/sssaj2010.0446, 2011.
Huang, X., Song, Y., Li, M., Li, J., Huo, Q., Cai, X., Zhu, T., Hu, M., and Zhang, H.: A high-resolution ammonia emission inventory in China, Global Biogeochem. Cy., 26, GB1030, https://doi.org/10.1029/2011gb004161, 2012.
Jayaweera, G. R. and Mikkelsen, D. S.: Ammonia volatilization from flooded soil systems – a computer-model. I. Theoretical aspects, Soil Sci. Soc. Am. J., 54, 1447–1455, https://doi.org/10.2136/sssaj1990.03615995005400050039x, 1990a.
Jayaweera, G. R. and Mikkelsen, D. S.: Ammonia volatilization from flooded soil systems – a computer-model. II. Theory and model results, Soil Sci. Soc. Am. J., 54, 1456–1462, https://doi.org/10.2136/sssaj1990.03615995005400050040x, 1990b.
Jayaweera, G. R. and Mikkelsen, D. S.: Assessment of ammonia volatilization from flooded soil systems, Adv. Agron., 45, 303–356, https://doi.org/10.1016/S0065-2113(08)60044-9, 1991.
Jayaweera, G. R., Paw U., K. T., and Mikkelsen, D. S.: Ammonia volatilization from flooded soil systems: a computer model. III. Validation of the model, Soil Sci. Soc. Am. J., 54, 1462–1468, https://doi.org/10.2136/sssaj1990.03615995005400050041x, 1990.
Kong, L., Tang, X., Zhu, J., Wang, Z., Pan, Y., Wu, H., Wu, L., Wu, Q., He, Y., Tian, S., Xie, Y., Liu, Z., Sui, W., Han, L., and Carmichael, G.: Improved inversion of monthly ammonia emissions in China based on the Chinese ammonia monitoring network and ensemble Kalman filter, Environ. Sci. Technol., 53, 12529–12538, https://doi.org/10.1021/acs.est.9b02701, 2019.
Lei, T., Guo, X., Ma, J., Sun, X., Feng, Y., and Wang, H.: Kinetic and thermodynamic effects of moisture content and temperature on the ammonia volatilization of soil fertilized with urea, Int. J. Agr. Biol. Eng., 10, 134–143, https://doi.org/10.25165/j.ijabe.20171006.3232, 2017.
Li, C.: Biogeochemistry: Scientific fundamentals and modelling approach, Tsinghua University Press, Beijing, ISBN 978-7-302-41265-6, 2016.
Li, C., Frolking, S., and Frolking, T. A.: A model of nitrous-oxide evolution from soil driven by rainfall events. 1. Model structure and sensitivity, J. Geophys. Res.-Atmos., 97, 9759–9776, https://doi.org/10.1029/92jd00509, 1992.
Li, H., Han, Y., and Cai, Z.: Modeling the ammonia volatilization from common urea and controlled releasing urea fertilizers in paddy soil of Taihu region of China by Jayaweera–Mikkelsen model, Environ. Sci., 29, 1045–1052, https://doi.org/10.1007/BF01049507, 2008.
Li, S.: Code and executive program_data for bg_2022, figshare [code], https://doi.org/10.6084/m9.figshare.19388756.v3, 2022.
Li, S., Zheng, X., Zhang, W., Han, S., Deng, J., Wang, K., Wang, R., Yao, Z., and Liu, C.: Modeling ammonia volatilization following the application of synthetic fertilizers to cultivated uplands with calcareous soils using an improved DNDC biogeochemistry model, Sci. Total Environ., 660, 931–946, https://doi.org/10.1016/j.scitotenv.2018.12.379, 2019.
Li, Y., Schichtel, B. A., Walker, J. T., Schwede, D. B., Chen, X., Lehmann, C. M. B., Puchalski, M. A., Gay, D. A., and Collett Jr., J. L.: Increasing importance of deposition of reduced nitrogen in the United States, P. Natl. Acad. Sci. USA, 113, 5874–5879, https://doi.org/10.1073/pnas.1525736113, 2016.
Li, Y., Shen, J., Wang, Y., Gao, M., Liu, F., Zhou, P., Liu, X., Chen, D., Zou, G., Luo, Q., and Ma, Q.: CNMM: a grid-based spatially-distributed catchment simulation model, China Science Press, Beijing, ISBN 978-7-03-049714-7, 2017.
Liu, J., Ding, P., Zong, Z., Li, J., Tian, C., Chen, W., Chang, M., Salazar, G., Shen, C., Cheng, Z., Chen, Y., Wang, X., Szidat, S., and Zhang, G.: Evidence of rural and suburban sources of urban haze formation in China: a case study from the Pearl River Delta region, J. Geophys. Res.-Atmos., 123, 4712–4726, https://doi.org/10.1029/2017jd027952, 2018.
Liu, T., Fan, D., Zhang, X., Chen, J., Li, C., and Cao, C.: Deep placement of nitrogen fertilizers reduces ammonia volatilization and increases nitrogen utilization efficiency in no-tillage paddy fields in central China, Field Crops Res., 184, 80–90, https://doi.org/10.1016/j.fcr.2015.09.011, 2015.
Liu, X., Ju, X., Zhang, F., Pan, J., and Christie, P.: Nitrogen dynamics and budgets in a winter wheat–maize cropping system in the North China Plain, Field Crops Res., 83, 111–124, https://doi.org/10.1016/S0378-4290(03)00068-6, 2003.
Mariano, E., de Sant Ana Filho, C. R., Bortoletto-Santos, R., Bendassolli, J. A., and Trivelin, P. C. O.: Ammonia losses following surface application of enhanced-efficiency nitrogen fertilizers and urea, Atmos. Environ., 203, 242–251, https://doi.org/10.1016/j.atmosenv.2019.02.003, 2019.
Martens, D. A. and Bremner, J. M.: Soil properties affecting volatilization of ammonia from soils treated with urea, Commun. Soil Sci. Plan., 20, 1645–1657, https://doi.org/10.1080/00103628909368173, 1989.
Martin, S. T., Hung, H.-M., Park, R. J., Jacob, D. J., Spurr, R. J. D., Chance, K. V., and Chin, M.: Effects of the physical state of tropospheric ammonium-sulfate-nitrate particles on global aerosol direct radiative forcing, Atmos. Chem. Phys., 4, 183–214, https://doi.org/10.5194/acp-4-183-2004, 2004.
Michalczyk, A., Kersebaum, K.C., Heimann, L., Roelcke, M., Sun, Q. P., Chen, X. P., and Zhang, F. S.: Simulating in situ ammonia volatilization losses in the North China Plain using a dynamic soil-crop model, J. Plant Nutr. Soil Sc., 179, 270–285, https://doi.org/10.1002/jpln.201400673, 2016.
Mikkelsen, D. S., Datta, S. K. D., and Obcemea, W. N.: Ammonia volatilization losses from flooded rice soils, Soil Sci. Soc. Am. J., 42, 725–730, https://doi.org/10.2136/sssaj1978.03615995004200050043x, 1978.
Park, K. D., Lee, D. W., Li, Y., Chen, D., Park, C. Y., Lee, Y. H., Lee, C. H., Kang, U. G., Park, S. T., and Cho, Y. S.: Simulating ammonia volatilization from applications of different urea applied in rice field by WNMM, Korean J. Crop Sci., 53, 8–14, 2008.
Paulot, F., Jacob, D. J., Pinder, R. W., Bash, J. O., Travis, K., and Henze, D. K.: Ammonia emissions in the United States, European Union, and China derived by high-resolution inversion of ammonium wet deposition data: Interpretation with a new agricultural emissions inventory (MASAGE_NH3), J. Geophys. Res.-Atmos., 119, 4343–4364, https://doi.org/10.1002/2013jd021130, 2014.
Riddick, S., Ward, D., Hess, P., Mahowald, N., Massad, R., and Holland, E.: Estimate of changes in agricultural terrestrial nitrogen pathways and ammonia emissions from 1850 to present in the Community Earth System Model, Biogeosciences, 13, 3397–3426, https://doi.org/10.5194/bg-13-3397-2016, 2016.
Roelcke, M., Li, S., Tian, X., Gao, Y., and Richter, J.: In situ comparisons of ammonia volatilization from N fertilizers in Chinese loess soils, Nutr. Cycl. Agroecosys., 62, 73–88, https://doi.org/10.1023/a:1015186605419, 2002.
Sanz-Cobena, A., Misselbrook, T., Camp, V., and Vallejo, A.: Effect of water addition and the urease inhibitor NBPT on the abatement of ammonia emission from surface applied urea, Atmos. Environ., 45, 1517–1524, https://doi.org/10.1016/j.atmosenv.2010.12.051, 2011.
Savard, M. M., Cole, A., Smirnoff, A., and Vet, R.: ä15N values of atmospheric N species simultaneously collected using sector – based samplers distant from sources isotopic inheritance and fractionation, Atmos. Environ., 162, 11–22, https://doi.org/10.1016/j.atmosenv.2017.05.010, 2017.
Schjørring, J. K.: Atmospheric ammonia and impacts of nitrogen deposition: Uncertainties and challenges, New Phytol., 139, 59–60, https://doi.org/10.1046/j.1469-8137.1998.00173.x, 1998.
Sommer, S. G., Schjoerring, J. K., and Denmead, O. T.: Ammonia emission from mineral fertilizers and fertilized crops, in: Advances in Agronomy, edited by: Sparks, D. L., Academic Press, 82, 557–622, https://doi.org/10.1016/S0065-2113(03)82008-4, 2004.
Song, Y., Fan, X., Lin, D., Yang, L., and Zhou, J.: Ammonia volatilization from paddy fields in the Taihu lake region and its influencing factors, Acta Pedologica Sinica, 41, 265–269, https://doi.org/10.11766/trxb200306090216, 2004.
Tian, G., Cai, Z., Cao, J., and Li, X.: Factors affecting ammonia volatilization from a rice–wheat rotation system, Chemosphere, 42, 123–129, https://doi.org/10.1016/S0045-6535(00)00117-X, 2001.
Vira, J., Hess, P., Melkonian, J., and Wieder, W. R.: An improved mechanistic model for ammonia volatilization in Earth system models: Flow of Agricultural Nitrogen version 2 (FANv2), Geosci. Model Dev., 13, 4459–4490, https://doi.org/10.5194/gmd-13-4459-2020, 2020.
Wang, H., Hu, Z., Lu, J., Liu, X., Wen, G., and Blaylock, A.: Estimation of ammonia volatilization from a paddy field after application of controlled-release urea based on the modified Jayaweera-Mikkelsen model combined with the Sherlock-Goh model, Commun. Soil Sci. Plan., 47, 1630–1643, https://doi.org/10.1080/00103624.2016.1206120, 2016.
Xu, R., Tian, H., Pan, S., Prior, S. A., Feng, Y., Batchelor, W. D., Chen, J., and Yang, J.: Global ammonia emissions from synthetic nitrogen fertilizer applications in agricultural systems: Empirical and process-based estimates and uncertainty, Global Change Biol., 25, 314–326, https://doi.org/10.1111/gcb.14499, 2019.
Zhan, X., Chen, C., Wang, Q., Zhou, F., Hayashi, K., Ju, X., Lam, S. K., Wang, Y., Wu, Y., Fu, J., Zhang, L., Gao, S., Hou, X., Bo, Y., Zhang, D., Liu, K., Wu, Q., Su, R., Zhu, J., Yang, C., Dai, C., and Liu, H.: Improved Jayaweera-Mikkelsen model to quantify ammonia volatilization from rice paddy fields in China, Environ. Sci. Pollut. R., 26, 8136-8147, https://doi.org/10.1007/s11356-019-04275-2, 2019.
Zhang, S., Cai, G., Wang, X., Xu, Y., Zhu, Z., and Freney, J. R.: Losses of urea-nitrogen applied to maize grown on a calcareous Fluvo-Aquic soil in North China Plain, Pedosphere, 2, 171–178, https://doi.org/10.1109/34.142909, 1992.
Zhang, W., Li, Y., Zhu, B., Zheng, X., Liu, C., Tang, J., Su, F., Zhang, C., Ju, X., and Deng, J.: A process-oriented hydro-biogeochemical model enabling simulation of gaseous carbon and nitrogen emissions and hydrologic nitrogen losses from a subtropical catchment, Sci. Total Environ., 616, 305–317, https://doi.org/10.1016/j.scitotenv.2017.09.261, 2018.
Zhang, W., Yao, Z., Zheng, X., Liu, C., Wang, R., Wang, K., Li, S., Han, S., Zuo, Q., and Shi, J.: Effects of fertilization and stand age on N2O and NO emissions from tea plantations: a site-scale study in a subtropical region using a modified biogeochemical model, Atmos. Chem. Phys., 20, 6903–6919, https://doi.org/10.5194/acp-20-6903-2020, 2020.
Zhang, W., Li, S., Han, S., Xie, H., Lu, C., Sui, Y., Rui, W., Liu, C., Yao, Z., and Zheng, X.: Less intensive nitrate leaching from Phaeozems cultivated with maize generally occurs in northeastern China, Agr. Ecosyst. Environ., 310, 107303, https://doi.org/10.1016/j.agee.2021.107303, 2021.
Zhao, X., Xie, Y., Xiong, Z., Yan, X., Xing, G., and Zhu, Z.: Nitrogen fate and environmental consequence in paddy soil under rice-wheat rotation in the taihu lake region, China, Plant Soil, 319, 225–234, https://doi.org/10.1007/s11104-008-9865-0, 2009.
Zhou, F., Ciais, P., Hayashi, K., Galloway, J., Kim, D. G., Yang, C., Li, S., Liu, B., Shang, Z., and Gao, S.: Re-estimating NH3 emissions from Chinese cropland by a new nonlinear model, Environ. Sci. Technol., 50, 564–572, https://doi.org/10.1021/acs.est.5b03156, 2016.
Zhu, Z., Cai, G., Simpson, J. R., Zhang, S., Chen, D., Jackson, A. V., and Freney, J. R.: Processes of nitrogen loss from fertilizers applied to flooded rice fields on a calcareous soil in north–central China, Nutr. Cycl. Agroecosys., 18, 101–115, https://doi.org/10.1007/BF01049507, 1989.