the Creative Commons Attribution 4.0 License.
the Creative Commons Attribution 4.0 License.
 | 22 Jun 2022
Effects of climate change in European croplands and grasslands: productivity, greenhouse gas balance and soil carbon storage
Raphaël Martin
Katja Klumpp
Raia Silvia Massad
Knowledge of the effects of climate change on agro-ecosystems is fundamental to identifying local actions aimed to maintain productivity and reduce environmental issues. This study investigates the effects of climate perturbation on the European crop and grassland production systems, combining the findings from two specific biogeochemical models. Accurate and high-resolution management and pedoclimatic data were employed. Results have been verified for the period 1978–2004 (historical period) and projected until 2099 with two divergent intensities: the Intergovernmental Panel on Climate Change (IPCC) climate projections, Representative Concentration Pathway (RCP) 4.5 and RCP8.5. We have provided a detailed overview of productivity and the impacts on management (sowing dates, water demand, nitrogen use efficiency). Biogenic greenhouse gas balance (N2O, CH4, CO2) was calculated, including an assessment of the gases' sensitivity to the leading drivers, and a net carbon budget on production systems was compiled. Results confirmed a rise in productivity in the first half of the century (+5 % for croplands at +0.2 t DM ha−1 yr−1, +1 % for grasslands at +0.1 t DM ha−1 yr−1; DM denotes dry matter), whereas a significant reduction in productivity is expected during the period 2050–2099, caused by the shortening of the length of the plant growing cycle associated with rising temperatures. This effect was more pronounced for the more pessimistic climate scenario (−6.1 % for croplands and −7.7 % for grasslands), for the Mediterranean regions and in central European latitudes, confirming a regionally distributed impact of climate change. Non-CO2 greenhouse gas emissions were triggered by rising air temperatures and increased exponentially over the century, often exceeding the CO2 accumulation of the explored agro-ecosystems, which acted as potential C sinks. The emission factor for N2O was 1.82 ± 0.07 % during the historical period and rose to up to 2.05 ± 0.11 % for both climate projections. The biomass removal (crop yield, residues exports, mowing and animal intake) converted croplands and grasslands into net C sources (236 ± 107 Tg CO2 eq. yr−1 in the historical period), increasing from 19 % to 26 % during the climate projections, especially for RCP4.5. Nonetheless, crop residue restitution might represent a potential management strategy to overturn the C balance. Although with a marked latitudinal gradient, water demand will double over the next few decades in the European croplands, whereas the benefit in terms of yield (+2 % to +10 % over the century) will not contribute substantially to balance the C losses due to climate perturbation.
- Article
(8277 KB) - Full-text XML
-
Supplement
(9015 KB) - BibTeX
- EndNote


Agriculture is facing major challenges in meeting growing food demand while limiting soil degradation and air and water pollution and adapting to the impacts of climate change (Chaudhary et al., 2018; Olesen, 2017). The agricultural sector is the main source of non-CO2 anthropogenic greenhouse gases (GHGs) and is responsible for 78.6 % of nitrous oxide (N2O) and 39.1 % of methane (CH4) emissions worldwide (IPCC, 2018). Agricultural practice, which directly affects soil, plants and the atmosphere, represents a strategic lever to counteract climate change by mitigating GHG emissions and fostering soil C storage (Chabbi et al., 2017; Smith et al., 2008), achieving long-term (i.e. 2100) climate objectives (Fuss et al., 2016; Minasny et al., 2017; Smith et al., 2013).
Evaluating the impacts of climate on agricultural production at local, regional and global scales is still a challenge nowadays (Fitton et al., 2019; Olesen and Bindi, 2002). The main source of uncertainty comes from the representation of agro-ecosystems in models' frameworks or from the approaches used to upscale data networks and local experiments to regional scales (Ewert et al., 2011; Hansen and Jones, 2000; Tubiello et al., 2007). Notwithstanding that, it is commonly recognised that a decrease in crop yields is expected towards the middle and the end of the century, with reductions extending to more than 10 % in some regions of the world (Challinor et al., 2014). A decline in productivity is likely to be combined with an increase in the interannual yield variability due to climate extremes (Dono et al., 2016), with a strong latitudinal gradient (Rosenzweig et al., 2013). In the Northern Hemisphere, which will benefit from the lengthening of the growing season, milder temperatures and wet conditions in the coming decades, crop and grassland production levels are expected to increase (Yang et al., 2015). Conversely, lower latitudes are going to face a rise in drought frequencies with a decline in winter rainfall, accompanied by a potential decline in productivity (Stagge et al., 2017). This geographical divide would lead to intensification of farming systems in northern regions, such as northern Europe, and to extensification in southern regions, such as the Mediterranean Basin (Olesen and Bindi, 2012).
In line with the commitment to the Paris Agreement and the European Green Deal, the European Union (EU) set the objective to cut net GHG emissions by at least 55 % by 2030 compared to 1990 levels. In addition, the EU aims to become climate neutral by 2050 (EC, 2020). These ambitious targets contrast with the agricultural emissions which have stagnated or even increased in the past few years (EEA, 2020). Reducing emissions in agriculture is imperative and implies the use of tailored management options in crop and grassland systems. These options should aim to increase the efficiency of fertilisers, irrigation and feeding strategies; improve the management of crop residues, tillage and drainage; and increase crop diversification in time and space (Aguilera et al., 2013; Conant et al., 2017; Cowan et al., 2016; De Antoni Migliorati et al., 2015; Li et al., 2016; Smith et al., 2008; Smith, 2016; Voglmeier et al., 2019). While there are a consistent number of experimental data regarding the effects of management options at the field scale, robust quantifications of the effects of climate change on actual crop and grassland production systems at the regional scale are still scarce. Concurrently, the need to develop and implement higher-tier methodologies to be applied at fine spatial scales is growing nowadays (Smith, 2012).
Dynamic simulation models are suitable tools to evaluate the multifaceted effects of climate change across agricultural production systems such as croplands and grasslands (Brilli et al., 2017; Ehrhardt et al., 2018; Sándor et al., 2018). Models are able to isolate the contribution of single or combined factors, trace the evolution of the system components, and observe the aptitude of agricultural strategies to mitigate impacts. More recently, process-based models conceived for site-scale representation have been applied at the regional scales to, for example, calculate national GHG inventories (Smith, 2013) or build statistical models (Del Grosso et al., 2009; Haas et al., 2013). The main challenges to carrying out spatial assessments are represented by the availability and resolution of the input data (Lugato et al., 2014, 2017), by the biases introduced into the aggregation or disaggregation of these data in homogeneous spatial areas (Constantin et al., 2019; Hansen and Jones, 2000), and by the model validity regarding spatial-scale change (Hoffmann et al., 2016). Furthermore, the simulation of agricultural production with climate projections introduces an additional degree of uncertainty that can be reduced with a sound evaluation of historical data (Rosenzweig et al., 2013), as proposed in this study.
This research aims to investigate, by means of process-based simulation models, the contribution and the impacts of climate change in European crop and grassland production systems up to the year 2100. The analysis focuses on plant productivity and the balance of biogenic GHGs (N2O, CH4, CO2), outlining a detailed carbon budget for current agro-ecosystems and with two climate scenarios, one intermediate and one pessimistic. Through a high spatial resolution and detailed management representation, this study provides projections of key agro-ecosystem variables in the near and long term to support the identification of possible actions to maintain productivity and reduce environmental impacts.
This study was realised by using two agro-ecosystem models, CERES-EGC (Crop Environment Resource Synthesis – Environnement et Grandes Cultures) (Gabrielle et al., 2005) for cropping systems and the Pasture Simulation (PaSim) model (Riedo et al., 1998) for grassland–livestock systems. These models were run at a spatial resolution of 0.25∘, which is equivalent to an aggregation to a squared cell (or “simulation unit”) of 27.78 km sides. Each simulation unit has characteristic soil properties, agricultural management and daily meteorological data. The 0.25∘ grid has been identified to attain an adequate distribution of the spatial variability in the input data, to attain representativeness of local effects on a European scale and to limit computational burdens (Hoffmann et al., 2016; Constantin et al., 2019). Two distinct periods of temporal aggregation have been considered.
The “historical period”, based on meteorological records, measured soil and management data, outlines the effects of current management on the agro-ecosystems, and is useful for testing the reliability of both models. The “climate scenarios”, based on the same as the historical management practices, trace the near- and long-term impacts of climate change on the systems under study. These two different aggregation periods are compared to each other to highlight the effects of climate change on the studied systems. Long-term projections are mainly provided to assess the impacts of current management on soil organic carbon storage and GHG emissions.
2.1 Models
The CERES-EGC model was used to simulate croplands in Europe. CERES-EGC is a process-based biogeochemical model in the soil–plant–atmosphere domain adapted from CERES (Jones and Kiniry, 1986). The model is designed to simulate C and N dynamics; heat transfer; and water exchanges from soil, plants and the atmosphere. It works at a daily time step designed to the field scale. Inputs require meteorological and management data as forcing variables and soil and crop data as factors. Meteorological data are constituted by daily minimum and maximum temperature, precipitation, global solar radiation, and wind speed. Management includes tillage, irrigation, fertilisation, information on sowing and incorporation of crop residues. Soil is divided into sublayers with specific depth, physical and chemical characteristics. Simulated crop species include maize (grain and fodder), soft wheat, durum wheat, rye, oat, barley, rapeseed, sorghum, sunflowers, pea, sugar beet and soybean, with the possibility of selecting specific varieties.
Soil C and N dynamics in the ploughed layer are simulated by means of the NCSOIL model (Molina et al., 1983; Nicolardot et al., 1994), which is a nested module in CERES-EGC. NCSOIL computes nitrification, immobilisation and mineralisation of N; the decomposition of soil organic matter (SOM) after incorporation of crop residues; and SOM formation. The module works with a series of specific pools, three pools for crop residues (easily fermentable carbohydrates, cellulose and lignin) and four endogenous pools (zymogenous and microbial biomass, active and passive humus), where CO2 is released from the decomposition of each pool. N uptake by plants is calculated through a specific supply–demand scheme depending on mineral nitrogen availability and root length density. CERES-EGC includes the model NOE (Hénault et al., 2005) for simulating N2O emissions from denitrification and nitrification processes in the topsoil (0–20 cm depth). Denitrification and nitrification are computed from a soil-specific potential rate limited by unitless factors related to soil water content, soil temperature and substrate content (nitrates, NO3, and ammonium, NH4, for denitrification and nitrification, respectively). Ammonia (NH3) volatilisation is calculated in a detailed module, while plant growth is simulated according to the crop-specific genetic potential and the photosynthetically active solar radiation absorbed by the canopy. Potential dry matter production is constrained by air temperatures, soil water availability and the N deficit.
PaSim is a biogeochemical process-based model able to simulate C, N and water dynamics in the plant–soil–atmosphere–livestock grassland system (Calanca et al., 2007). Five interacting sub-models of soil biology and physics, microclimate, vegetation, and grazing herbivores constitute the model structure. The model runs on a daily (or hourly) time step, and inputs require soil property data, management and meteorological characteristics (global solar radiation, minimum and maximum air temperature, relative humidity, wind speed, precipitation, and atmospheric CO2 concentration). The soil is described in six sublayers, allowing us to parameterise different soil depths with site-specific soil physical and chemical characteristics. Management includes grazing, mowing and N fertilisation. Grazing is considered a dairy or suckling system managed by grazing periods with specific stocking density and live weight. Indoor periods are not simulated. Vegetation cover is considered a homogeneous cover with a fixed legume fraction. The vegetation cover comprises the root system and three shoot compartments (laminae, sheaths and stems, and ears) divided into age classes. Soil C dynamics (based on the CENTURY model; Parton et al., 1994) are computed in five pools: a structural and a metabolic pool for fresh organic carbon (plant residues) and an active, a slow and a passive pool for the microbially processed organic carbon. Photosynthetic C is allocated in plant (root and shoot) and can be lost as CO2 by ecosystem respiration and as CH4 through enteric fermentation.
Soil N inputs are represented by atmospheric N deposition, symbiotic N2 fixation, mineral or organic fertilisation, animal faeces, and urine. These inputs, together with the nitrogen mineralised from the organic carbon pools, constitute the mineral N pool. N availability for plants is reduced by losses via processes of immobilisation, NO3 leaching, NH3 volatilisation, nitrification and denitrification. N2O emissions from nitrification and denitrification depends on substrate availability (NO3 or NH4). These emissions are modulated by factors controlling the effects of soil temperature and water content. Furthermore, the release of N2O produced in the soil towards the atmosphere is calculated with a resistance model in the rooting zone and plant canopy (Schmid et al., 2001).
CERES-EGC and PaSim were selected for this evaluation at the regional scale since they have been calibrated and evaluated in different conditions worldwide (Brilli et al., 2017; Ehrhardt et al., 2018; Sándor et al., 2018) and in Europe, i.e. France, Denmark, Germany, Italy, Sweden and the UK for CERES-EGC (Rolland et al., 2008; Lehuger et al., 2009; Wattenbach et al., 2010; Drouet et al., 2011; Lehuger et al., 2011; Goglio et al., 2013; Ferrara et al., 2021; Haas et al., 2021) and France, Germany, Hungary, Ireland, Italy, Portugal, Spain, the Netherlands and the UK for PaSim (Lawton et al., 2006; Calanca et al., 2007; Gottschalk et al., 2007; Vuichard et al., 2007; Ma et al., 2015; Sándor et al., 2016). These models are suitable to simulate a number of crops and rotations, mown or grazed grasslands, and the effects of management practices on plant–soil–atmosphere–livestock. Besides, they are able to simulate GHG emissions and the carbon budget at the field scale through the C assimilated from photosynthesis; C emitted into the atmosphere from autotrophic and heterotrophic respirations; C recycled (dung, plant residues) or introduced from external sources (fertilisers, soil improvers); and, finally, the C exported from the system by production activities. CO2 fertilisation was not simulated for croplands (see S4 in the Supplement). Furthermore, the two models used in this study do not represent potential impacts of air pollution and pest and disease effects on plant production.
2.2 Input dataset
2.2.1 Climate data
Historical and climate projection data were used in this study to analyse the likely effect on GHGs, production and soil C stocks in European production systems. We selected two of the four climate scenarios, or Representative Concentration Pathways (RCPs), adopted by the Intergovernmental Panel on Climate Change (IPCC) for the Fifth Assessment Report (AR5) (IPCC, 2013), one intermediate, RCP4.5, and one pessimistic, RCP8.5.
Climate data were provided by the Earth system model HadGEM2-ES (Collins et al., 2011) downscaled to a horizontal grid of a 0.5∘ side resolution, in the framework of the Inter-Sectoral Impact Model Intercomparison Project (ISI-MIP; Warszawski et al., 2014). Since the spatial resolution of the climatic data is larger than the size selected for the simulation units (0.25∘), four adjacent simulation units were subjected to the same meteorological data. Data were not downscaled to maintain data representativeness and have been shaped for the European surface (29.0 to 71.5∘ latitude and −24.0 to 45.5∘ longitude). The HadGEM2-ES model provided daily values of minimum and maximum air temperatures, total precipitation, air specific humidity, short-wave radiation, and near-surface wind speed for the period 1951–2099. Based on these data, input variables for each model were assigned. The simulation protocol consists of a historical dataset, from 1978–2004, constituted in accordance with the HadGEM2-ES model using the historical record of climate forcing factors (Jones et al., 2011) and, from 2005–2099, the two climate projections RCP4.5 and RCP8.5.
2.2.2 Soil data
Soil data were obtained from the European Soil Database (ESDB; Hiederer, 2013). The ESDB is composed of 1 km × 1 km raster files containing topsoil (0 to 30 cm) and subsoil (30 cm to maximum soil depth) data of clay, silt, sand, gravel and soil organic carbon (SOC) content; bulk density; and maximum root depth. Soil pH for the topsoil was derived at the same spatial detail from the ESDB dataset provided by Reuter et al. (2008). To define the soil characteristics for each spatial simulation unit, the most recurrent soil was selected, based on the above-mentioned characteristics. Organic soils with SOC content greater than 30 kg C m−2 were excluded (3.4 % of the total simulation units), as well as forest soil. Specific soil inputs were calculated for both models on the basis of the elementary characteristics (see Supplement S1 for details). For both models, a fixed number of six soil layers was established with a thickness defined as a function of the maximum soil depth.
2.2.3 Crop data
Crop species as well as N fertilisation amount were provided in the framework of the GHG-Europe project (EU FP7; Wattenbach et al., 2015) at a spatial resolution of 1 km × 1 km grid. These data are based on the regional statistics of crop distribution (NUTS2 or NUTS0) of the European statistical office (Eurostat, 2019a) and FAOSTAT (2022) databases and on the simulation of the CAPRI model (Common Agricultural Policy Regionalised Impact; Britz and Witzke, 2008; see Leip et al., 2008). The amount of nitrogen fertilisation was provided per crop species at a 1 km × 1 km resolution, while the repartition between mineral and organic nitrogen forms was provided at the NUTS2 scale.
Crop successions were available for the period 1976–2010. We only considered the crop successions from the time interval 1978–2010 since some of the crop species used in the first 2 discarded years were never reused over the time series and represented less than 1 % of the crops in the database (i.e. summer cereal mixes without triticale; other cereals including triticale, winter barley, flax and hemp; and set aside). The two most frequent crop successions were selected as a reference for each simulation unit. Two crop successions from the database were able to cover, on average, up to 93 % of the total agricultural area of each simulation unit. Based on this aggregation, the simulated crops were summer/spring soft wheat, winter soft wheat, durum wheat, summer/spring barley, grain maize, fodder maize, rapeseed, sunflowers, pulses, oat and sugar beet. Crop rotations also included winter rye and potato, which were not explicitly parameterised in the CERES-EGC model and were substituted with specific varieties of soft wheat for rye and of sugar beet for potato. To define the crop species in the period 1951–2099, primary and secondary successions were replicated for all the years preceding and succeeding the time interval of available data (1978–2010). Furthermore, the most adapted and calibrated crop varieties were designated as a function of the latitude, based on previous research and modellers' experience by using the CERES-EGC crop database.
Based on a crop-specific time window and a minimum and maximum threshold temperature, specific sowing dates were defined for each species and year in each simulation unit. Crop-specific windows were extracted from the assessments of USDA (1994) and Sacks (2010), selecting the minimum and the maximum typical sowing span over Europe, whereas threshold temperatures were extracted from Steduto et al. (2012). Due to their wide range, the time windows have not been modified over time. The sowing date was set as the earliest possible within the time window, when minimum and maximum temperatures were higher and lower, respectively, than the thresholds. An additional constraint of no precipitation for 3 consecutive days was applied to consider farmers' practice concerning access to the field. If a suitable sowing date was not identified, a fixed date was imposed in the middle of the time window. Residues were managed based on crop species exporting half (50 %) of the aboveground cereal straw and 80 % of the fodder maize and removing 20 % from the residues of all the other crop types (harvesting losses), including grain maize (Scarlat et al., 2019). Typical sowing crop densities were imposed based on Steduto et al. (2012).
The fertilisation amount for each crop is defined as the yearly mean dose designated for that crop within the most frequent succession of the simulation unit. Dose fractionation and fertilisation dates were established based on the crop type and the sowing date, total nitrogen amount, and mineral and organic repartition (see Supplement S2 for details). Organic fertilisers used in this study have a fixed C : N ratio of 25.
Irrigation was automatically supplied to the simulation units defined as “irrigable”, based on the European agricultural area for the year 2016. An irrigable area is defined as an area equipped for irrigation that exceeds 5 % of the total utilised agricultural area (Eurostat, 2019b). This share represents 36 % of the simulation units and is mainly concentrated in the Mediterranean area; southern France and north-west France; the Netherlands; and some regions in Denmark, Germany and the UK. The irrigation volume was distributed automatically at the rate of 10 mm d−1 when the soil available water content was below 90 %. This means that non-irrigated crops potentially have access to irrigation water. Even if in the coming decades the global irrigated area is not expected to grow further due to water scarcity and limited land (Turral et al., 2011), to account for a possible increase in the irrigable share moving towards 2100, a management scenario to observe the maximum potential irrigation water demand for today's crops grown in Europe was simulated and discussed. This management is evaluated over the century by the two scenarios i_RCP4.5 and i_RCP8.5 and provides access to irrigation water for the entire European agricultural area.
2.2.4 Grassland and livestock data
Grassland data considered permanent grassland and rainfed temporary grassland. Nitrogen fertiliser application for European grasslands in a 0.25∘ side resolution grid was estimated on the basis of regional and national statistics (Eurostat) and the CAPRI model (Leip et al., 2008). Data were generated combining fertilisation management and nitrogen doses, together with the number of mowing events, animal loads, quantities of mineral fertilisers and/or organic nitrogen, and the fraction of legumes. Mowing dates were defined from temperature using thermal sums (500 degree days from 1 January) with a base of 5 ∘C. Cutting was performed once such thermal sums were obtained. Fertilisation events occurred 3 d after mowing. Grazing started 30 d after the first mowing event and ended either at the end of the year or at the first freezing period of 5 consecutive days. Livestock were represented in the model only by cattle. Livestock densities (LSU ha−1, where LSU denotes livestock units) were obtained from 0.05∘ side regional statistics (Wint and Robinson, 2007), multiplying the total number of animals per surface unit to 0.8, 0.1 and 0.1 for cattle, sheep and goats, respectively. Finally, LSU density distribution was aggregated to the 0.25∘ side grid. As for cutting and fertilisation, if no thermal sums were reached, then no events were performed. Biomass production is considered the sum of the grazer intake and the cut biomass. For each simulation unit, livestock is only fed by grass (i.e. no external feed is considered). If the amount of daily aboveground biomass is not sufficient for grazing animals, animals are moved from the pasture. In this study we simulate livestock as they contribute to N cycling and thus are an important source of nitrogen in grassland, although we do not discuss here their production.
2.2.5 Model spin-up and computation
CERES-EGC and PaSim were first initialised with the soil C content taken from the ESDB for the year 2013, along with the other chemical and physical soil parameters. Then, for croplands, an equilibrium was set through a spin-up run using the weather period from 1951–1977, assuming that the cultivated area during this period was likely to have been continuously cultivated with the same crop successions. Equilibrium was reached before 1971 for all the pixels with an estimation error lower than 0.1 % of the relative variation in the soil C balance in 5 years. For grasslands, we first let the simulation drift for each pixel from 1840 based on HadGEM2-ES weather data. Subsequently, transformation rules were applied to move from past towards current management practices; i.e. from 1901–1950, a low intensification management level with no mineral fertilisation and cut at 900 degree days was applied. From 1951–2010, there was a gradual management intensification up to achieving the target levels (linear increase in quantities, progressive earlier shift in the cutting date). In this period, mineral nitrogen fertilisation was applied, starting with a low level in 1951. Finally, from 2010–2099, constant management according to the protocol come into effect.
A total of 86 724 runs divided into two land uses (8861 units for arable, with two climate scenarios, two crop rotations and two irrigation scenarios, and 7918 units for grasslands, with two climate scenarios) were simulated on a dedicated server.
Finally, simulations from cropland and grassland were merged by reporting outputs to the corresponding share of arable and permanent grasslands into each simulation unit. These shares were provided by the CORINE Land Cover inventory for the year 2018.
2.3 Greenhouse gas exchange and balance
To assess the net greenhouse gas exchange (NGHGE) of the agro-ecosystems investigated, the contribution of the biogenic GHGs (CO2, N2O, CH4) is combined and normalised to grams of CO2 equivalent (g CO2 eq.) by using the relative global warming potential (γgas) at the 100-year time horizon (298 for N2O, 25 for CH4 and 1 for CO2; IPCC, 2018), following the approach presented by Soussana et al. (2007).
The net ecosystem production (NEP) is the amount of organic C available for net ecosystem C storage, export or loss in an ecosystem, in terms of CO2. NEP represents the difference between the gross primary production – or photosynthesis – and the ecosystem respiration, which is the sum of the autotrophic respiration and heterotrophic respiration (HR); ruminant respiration from grasslands ecosystems is not accounted for in the HR term. Conventionally, a negative value of NEP indicates an uptake of CO2 by the system, whereas a positive value is a release towards the atmosphere.
The annual net greenhouse gas balance (NGB) is calculated on the basis of Ammann et al. (2020) by including the export of C by harvested biomass (crop yield, mowing and animal intake), the export as crop residues and the import of C by manure (organic fertilisers and the excreta from grazers).
Since livestock do not graze throughout the whole year, their contribution to the carbon balance is represented by the intake of biomass, enteric fermentation (CH4) and C in excreta. Carbon emissions from farm operations (i.e. tractor emissions), erosion and leaching processes, fire, or off-farm emissions (i.e. fertiliser manufacture, barns) are not included in the C budget; the effects of volatile organic compounds and CH4 emissions from manure and from soil are considered negligible as well. Moreover, the C exported from animal production (body mass increase and milk production) is neglected in NGB calculation (e.g. Chang et al., 2015).
3.1 Cropland and grassland production
3.1.1 Model validation
Simulated crop yields during the historical period ranged between 1.4 and 44.8 t ha−1 (at standard humidity) and were in good agreement with EU statistics reported in the Eurostat database (Eurostat, 2020) for the time span 1978–2004 (Fig. 1a; the time span considered represents the original crop rotation data and complies with the beginning of the climate scenarios). Root mean square error (RMSE) was equal to 2.24 t ha−1 and mean absolute error (MAE) to 1.32 t ha−1, and the modelling efficiency (Nash and Sutcliffe, E) scored 0.96. Simulations with CERES-EGC overestimated the yields for grain maize, wheat, rye, oat, soybean and sunflowers. Potato, pulses, rapeseed, fodder maize, barley and sugar beet were slightly underestimated. The relative RMSE (RRMSE) for each crop, individually, ranged from 12.8 % to 38.6 % (Table S3 in the Supplement). Furthermore, reducing the simulation period to 1994–2004 to limit the effect of the crop annual genetic gain on measured data, the statistics above described were not significantly modified (data not reported). The comparison between simulated and Eurostat statistics at the country level (NUTS0) for the period 1978–2004 gave fitting results (R2=0.92, p<0.01; RMSE = 5.58 t ha−1; MAE = 3.18 t ha−1; E = 0.84) shown in Fig. S2.

Figure 1(a) Simulated crop yields compared with Eurostat statistics in the period 1978–2004. Each point represents the yearly yield over the EU for each crop; yields are reported as standard humidity. (b) Grassland production compared to Smit et al. (2008) for the period 1995–2004. Point size represents the standard deviation (SD) of the simulated production.
Representative data for grassland production are still scarce at the EU level. Smit et al. (2008) computed the production of permanent grassland (pastures and meadows) across Europe based on national and international statistics for the period 1995–2004. The productivity simulated with PaSim (Fig. 1b) and aggregated to the NUTS2 level (257 regions in this study) showed a significant positive correlation (R2=0.68, p<0.05) with the statistics reported by Smit et al. (2008), following the environmental stratification of Europe (Metzger et al., 2005). Compared to these statistics, PaSim scored a RMSE of 2.37 t DM ha−1 yr−1 (where DM denotes dry matter), a MAE of 2.04 t DM ha−1 yr−1 and a negative E (−0.34). Simulated productivity was generally overestimated in the Mediterranean area (+55 %; representing 16 % of the surface) and eastern Europe (+20 %; representing 25 % of the surface). The overestimation in these areas is also verified by other modelling interpretations (Van Oijen et al., 2014; Chang et al., 2015, 2017; Blanke et al., 2018) and is due to the gap between potential (maximum) simulated productivity and real harvest data. A slight underestimation of the simulated production was recorded for the Atlantic North zone (−15 %; representing 8 % of the surface). Finally, livestock density and distribution were in line with the Eurostat findings at the country scale for the period 1995–2004, ranging from 0 to 1.35 LSU ha−1 (mean 0.34 LSU ha−1). Livestock densities were higher in Belgium, the Netherlands, Denmark and Ireland and in some regions of Germany, France, Italy and Spain, as also reported by Lesschen et al. (2011). Further details regarding grassland productivity are reported in the Supplement S3.
3.1.2 Effects of climate change scenarios on productive systems
Our results showed increasing cropland and grassland production in Europe during the historical scenarios (Fig. 2). Production was positively correlated with the increasing air temperatures over this period. The Mann–Kendall test highlighted a positive linear increase (p<0.01) in the mean annual maximum air temperature (0.05 ∘C yr−1) and minimum air temperature (0.04 ∘C yr−1), as well as in solar radiation (0.02 MJ m−2 yr−1).
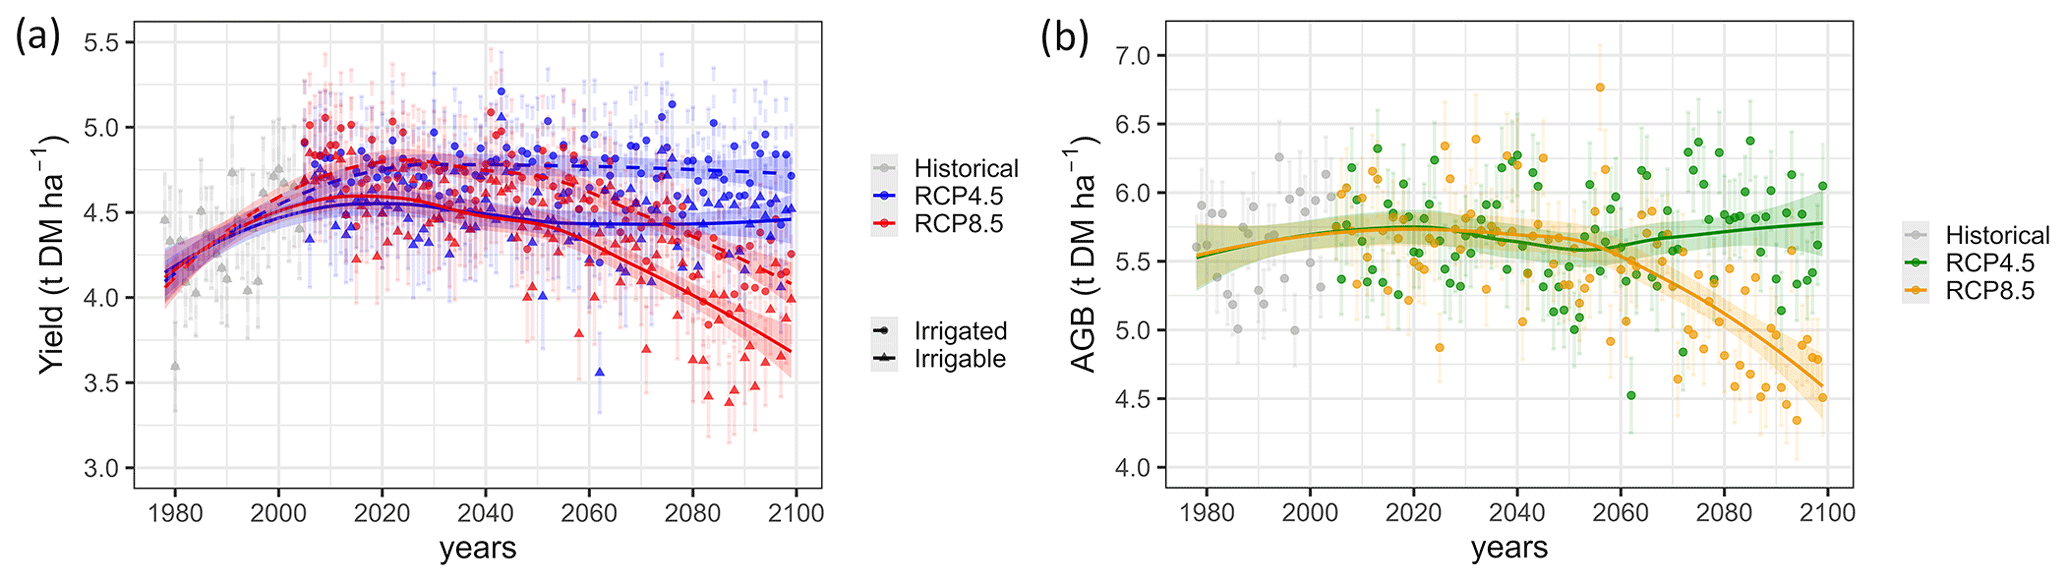
Figure 2(a) Crop yield trends in Europe from 1978 to 2099 with the two climatic scenarios RCP4.5 and RCP8.5 and two irrigation conditions following the irrigable agricultural area in Europe or extending the irrigation to all the arable lands (i_RCP4.5 and i_RCP8.5); all crops confounded. (b) Grassland yield reported as aboveground biomass (AGB), which is the sum of biomass mowed and ruminant intake.
Crop production in Europe assumed a positive yearly increase during the historical period (18.1 kg DM ha yr−1; Fig. 2a), which persisted until 2020, reaching 4.6 t DM ha−1 (average 2005–2020). Crop production rose in the first half of the century for both climatic scenarios (+5 %, or +0.2 t DM ha−1 yr−1 compared to the average of the historical period; Table 1), even if the rate of increase slowed over time, especially from 2020–2050. In the second part of the century, crop production remained stable for the RCP4.5 scenario (+2.2 % compared to the average of the historical period), while a reduction of −6.1 % is forecasted for the RCP8.5 scenario; this decline reached −13 % at the end of the century (period 2080–2099). The extension of irrigation to all European croplands promotes crop production, which gained +10 % in the first half of the century for both i_RCP4.5 and i_RCP8.5. In the second part of the century crop production was sustained at the same value only for RCP4.5, while irrigation was able to mitigate the projected yield decline forecasted for the RCP8.5 scenario (+2 % compared to the historical period).
Table 1Emissions of N2O and CH4, the net ecosystem production (NEP; for the sign convention, negative values represent a stock of carbon), and productivity from grassland and croplands. Between brackets is the standard deviation.
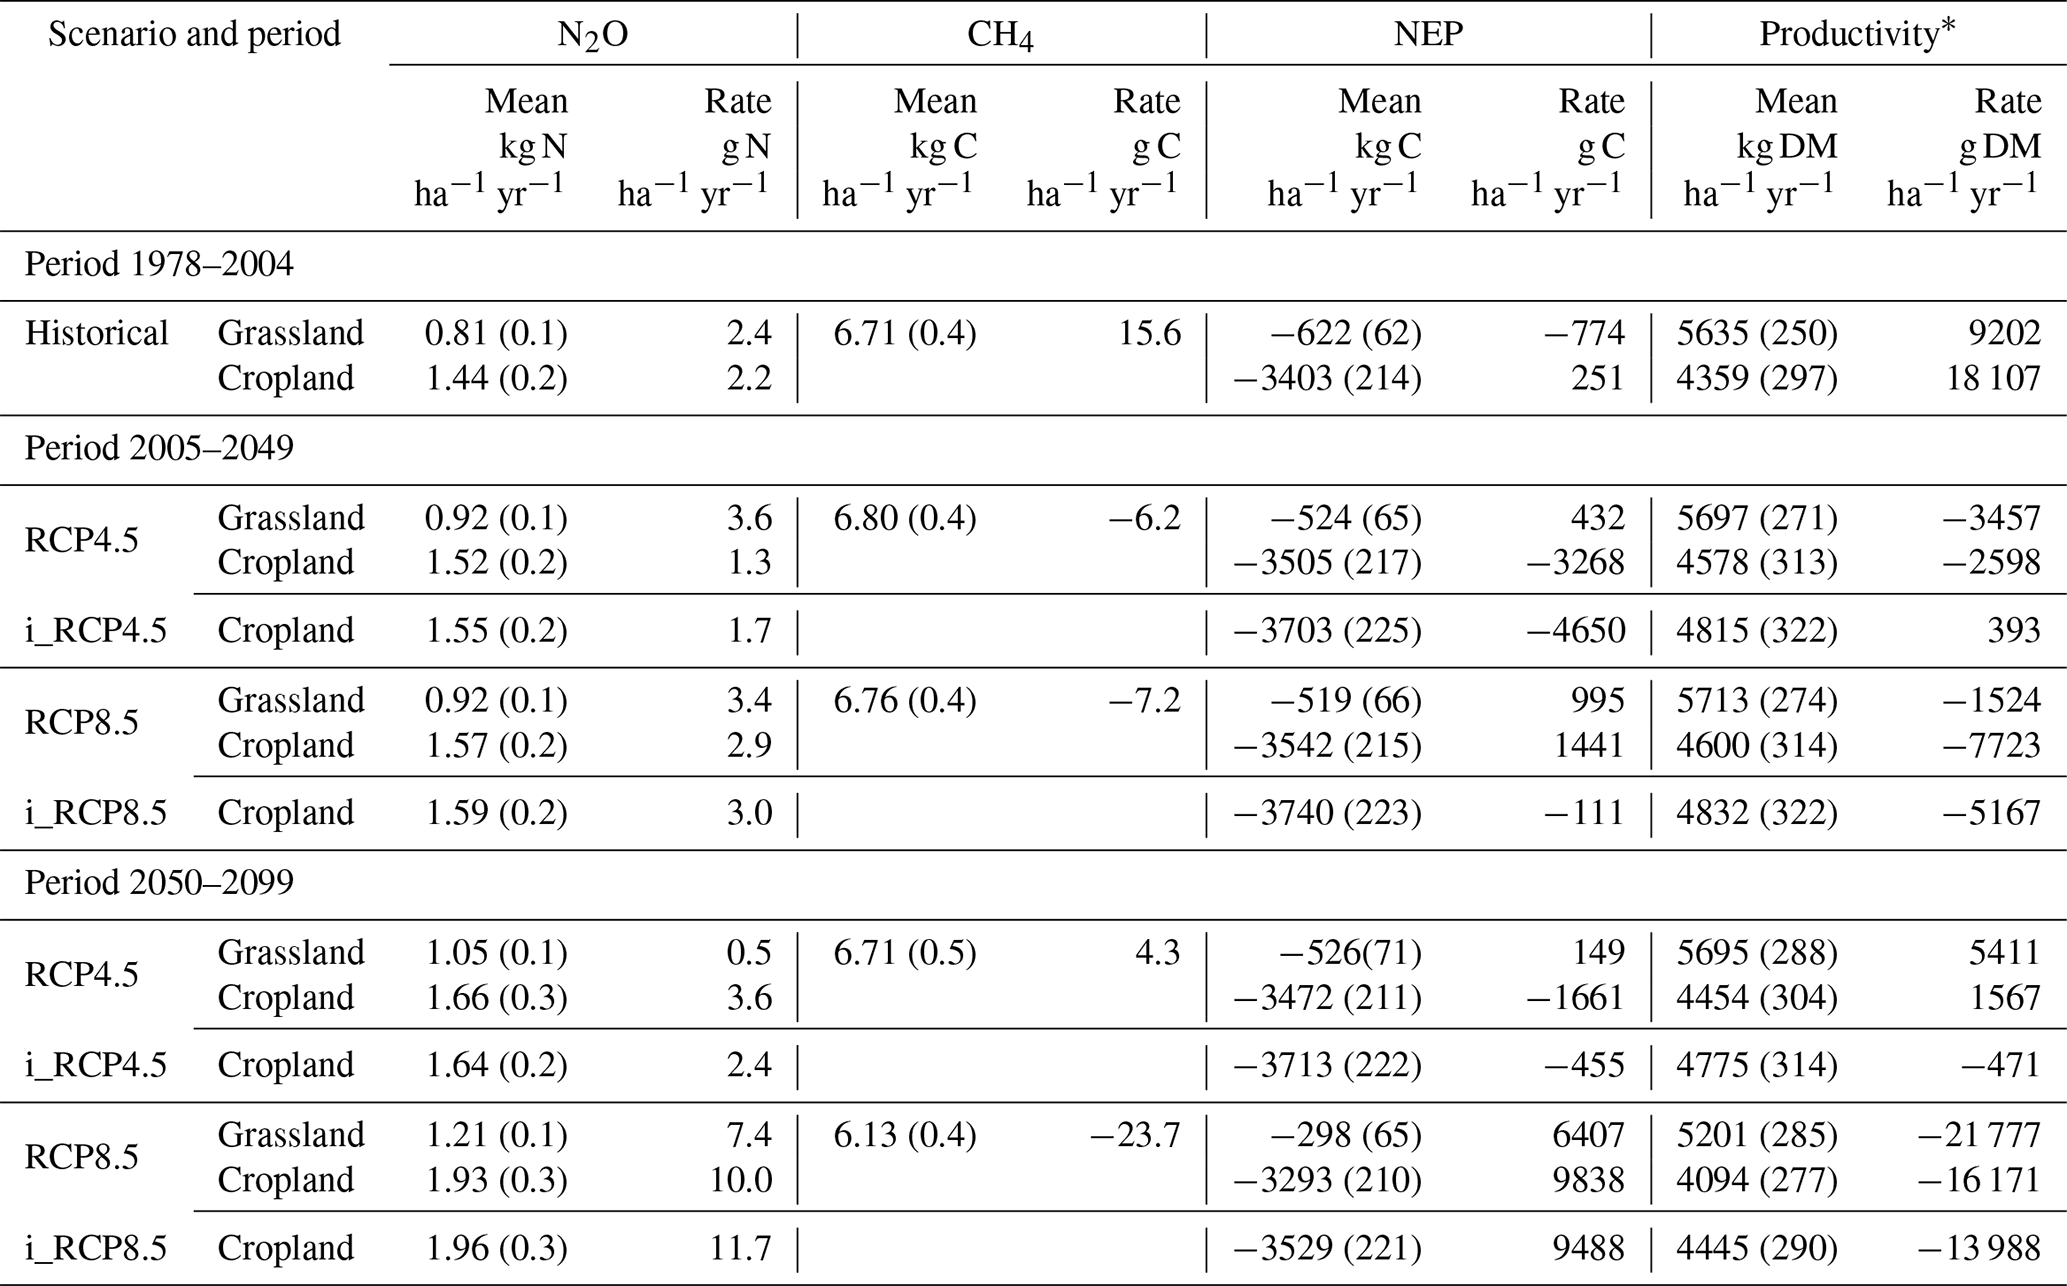
* Yield for croplands and the sum of harvested biomass and animal intake for grasslands.
Crop production showed a clear trend over latitudes and over time. During the historical period, crops were more productive in low latitudes (<45∘; mean yield of 6.87 t DM ha−1 yr−1) than in mid-latitudes (45 to 55∘) (−25 %, p>0.05, or 5.15 t DM ha−1 yr−1) and higher latitudes (>55∘) (−46 %, p>0.05, or 3.69 t DM ha−1 yr−1). These gaps were reduced during the climate scenarios (see Table S1 in Supplement). At low latitudes, yields were slightly lower than the historical period in the first half of the century (−2 %), undergoing severe reductions towards the end of the century (−4 % and −11 % for RCP4.5 and RCP8.5, respectively). Moving to mid-latitudes, crop production increased in the first part of the century for both climatic scenarios (+5 %), remained at about the same level for RCP4.5 in the second part of the century and decreased (−8 %) for RCP8.5. High latitudes were characterised by a general increase in production towards the end of the century (from +8 % to +14 %) for both climate scenarios.
The yields of the two most cultivated crops in terms of area in Europe, grain maize and winter soft wheat, were not negatively affected by climate perturbations in the first half of the century with the RCP4.5 scenario, while a slight increase is expected in the RCP8.5 scenario for grain maize (+2 %; average 2030–2049) and a decrease for winter soft wheat (−4 %). Drastic reductions are projected for grain maize yield at the end of the century for both climate scenarios (−5 % in RCP4.5 and −19 % for the RCP8.5, average 2080–2099). Conversely, production is expected to increase for winter soft wheat for RCP4.5 (up to +8 %), and a slight decline (−1 %) is forecasted for RCP8.5 (Fig. S3a, b). The adoption of irrigation for all European croplands increased the productivity of grain maize compared to the irrigable scenario (+8 % towards the mid-century for both irrigated scenarios; +13 % and +16 % towards the end of the century for i_RCP4.5 and i_RCP8.5, respectively). On the other hand, small yield increases are expected with the irrigation scenario for winter soft wheat.
Figure 3 shows the length of the growing season for grain maize and winter soft wheat, underlining a consistent reduction during both climatic scenarios. The crop growing cycle considers that sowing dates were modulated according to climatic conditions. Compared to the historical period, in the middle of the century there was a general reduction in the growing season of −8 d for grain maize (−12, −5 and +9 d for low, middle and high latitudes, respectively) and −20 d for winter soft wheat (−20, −19 and −6 d for low, middle and high latitudes, respectively). This trend remained constant for the RCP4.5 scenario approaching 2100, whereas it worsened for RCP8.5, with averaged reductions of −27 and −36 d for grain maize and winter wheat, respectively. Severe reductions are expected at middle and low latitudes for grain maize (−34 and −24 d) and at middle and high latitudes for winter soft wheat (−49 and −38 d). The length of the growing cycle for all the simulated crops, except for potato and sugar beet, was reduced by 12 d in the middle of the century and by 19 d in the second part of the century (Fig. S4). Conversely, potato and sugar beet showed an extension of the length of the cropping cycle over time in both climate scenarios, especially towards the end of the century.
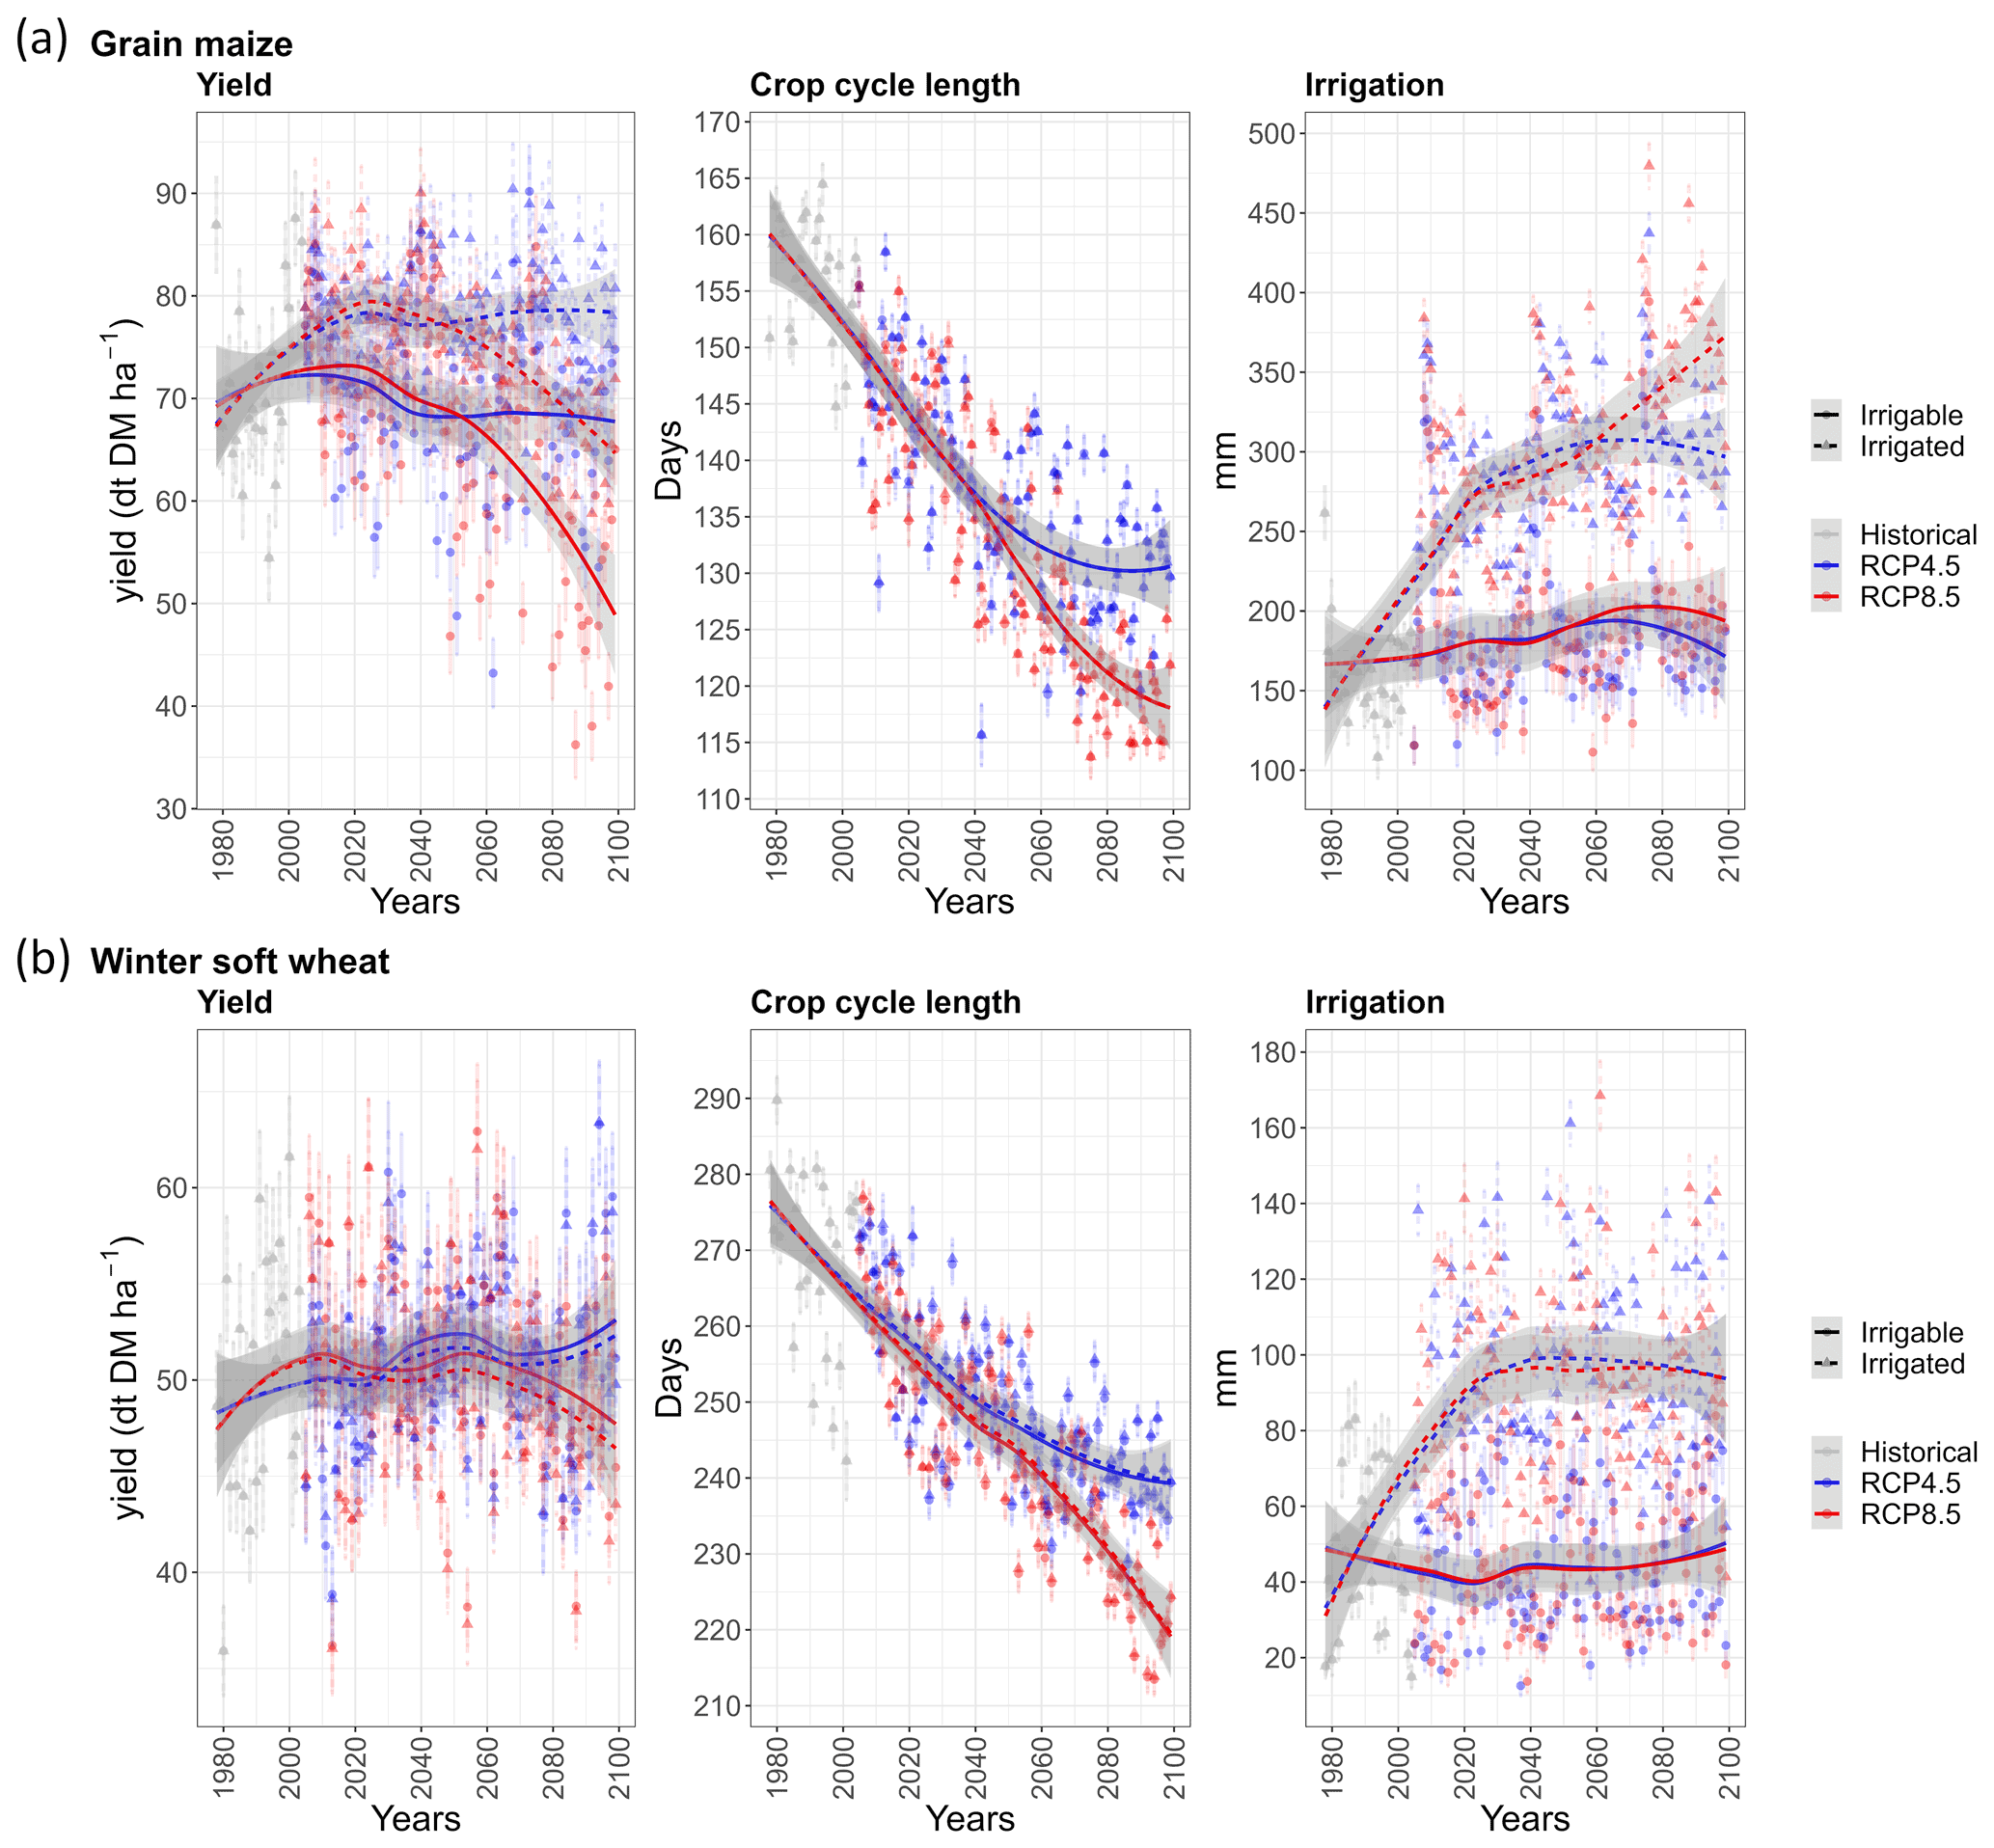
Figure 3Yield, length of the cropping season and irrigation needed over the cropping cycle for grain maize (a) and winter soft wheat (b) in the two climatic scenarios RCP4.5 and RCP8.5; the figure shows results for the irrigable agricultural area in Europe and the extension of the irrigation to all the European arable area (scenarios i_RCP4.5 and i_RCP8.5).
Considering the mild climate projections, positive yield increases from +4 % to +20 % are expected for durum and soft wheat, soybean, rye, and spring wheat for low latitudes and towards the end of the century. On the other hand, grain and fodder maize, potato, barley, sugar beet, pulses, and oat are affected by substantial reductions (from −1 % to −44 %). The extension of irrigation was able to increase yields for the more water-demanding crops (grain and fodder maize, sunflowers, sugar beet, and potato) with increases of more than +10 %. At mid-latitudes strong reductions, in the range of −2 % to −17 %, are expected for a large part of the main European crops (durum and soft wheat, potato, rapeseed, barley, soybean, spring soft wheat, sugar beet, and sunflowers), whereas fodder maize and winter rye were projected to increase (+30 % and +9 %, respectively). High latitudes displayed reductions in yields for pulses and barley (−22 % and −11 %, respectively) and an increase (+7 % up to +100 % and over) for rapeseed, sugar beet, potato, grain and fodder maize. The extension of irrigation to all European croplands will not cause discernible improvement for middle and high latitudes for i_RCP4.5, while a substantial reduction in yields is projected for all the crops in i_RCP8.5.
With the irrigation scenario, irrigation was applied to 93 % of all the simulation units, doubling the volumes needed to fulfil the evapotranspiration deficit (160 mm yr−1 in the first half of the century) compared to the historical period (82 mm yr−1). Then, water volumes needed in the second half of the century were less for i_RCP4.5 (114 mm yr−1) and greater for i_RCP8.5 (176 mm yr−1). Compared to the scenario with the actual irrigable surface, these volumes increased by more than 2 and 5 times at middle and high latitudes and only by +30 % at low latitudes, indicating that the extension of irrigable areas became an essential to guarantee adequate levels of crop production, especially in the Mediterranean regions.
Grassland productivity showed a trend over time similar to that of croplands (Fig. 2b; Table 1). Compared to the historical period, grassland productivity slightly increased until 2020 and declined towards the middle of the century, with an average production of 5.6 t DM ha−1 (average 2030–2049). Biomass productivity is maintained during the progress of the RCP4.5 scenario (+1 %, or +0.1 t DM ha−1 yr−1), whereas an averaged reduction of about 0.45 t DM ha−1 (−7.7 % compared to the historical period) is expected for the RCP8.5 scenario in the second part of the century. During the historical period, grassland productivity at low latitudes was 4.58 t DM ha−1 yr−1 and resulted in about 30 % lower levels compared to both middle and high latitudes, with higher production concentrated in north-west Europe. A substantial increase in production was observed towards 2050 for both low latitudes (+6 % for RCP4.5 and +7 % for RCP8.5) and high latitudes (+12 % and +15 % for RCP4.5 and RCP8.5, respectively; Fig. S3c and Table S1 in the Supplement). Moving to the end of the century, grass production increased further compared to the historical period, especially for RCP4.5 (+11 % and +22 % for low and high latitudes, respectively), while a less marked increase is expected for RCP8.5 (+1 % and +13 % for low and high latitudes, respectively). At central European latitudes, characterised by a higher livestock density than low and high latitudes (+42 % and +13 %, respectively), productivity was reduced by 5 % in the first part of the century. Towards the end of the century, this reduction remains at the same level for RCP4.5, while it was more pronounced for RCP8.5 (−24 %).
3.2 GHG emissions
3.2.1 N2O emissions
N2O emissions for croplands increased sharply for both climate scenarios during the century (Fig. 4a). During the historical period, a constant growth of the emissions is observed at the rate of 2.2 g N-N2O ha−1 yr−1, with a mean value of 1.44 kg N-N2O ha−1 yr−1 (Table 1). This rate decreased to 1.3 g N-N2O ha−1 yr−1 in the first half of the century for the RCP4.5 scenario, while a rise to 2.9 g N-N2O ha−1 yr−1 is forecasted for the RCP8.5 scenario. In the second part of the century, the rate of N2O emissions nearly tripled for both climate scenarios compared to the emission in the first half of the century. RCP4.5 reached a value of 1.69 kg N-N2O ha−1 towards the end of the century (average 2080–2099), whereas the RCP8.5 scenario reached 2.09 kg N-N2O ha−1 in the same period. The extension of irrigation to all European croplands amplified the emission rates in the first half of the century for both i_RCP4.5 and i_RCP8.5, increasing the emissions of 0.03 and 0.02 kg N-N2O ha−1 yr−1, respectively, compared with the irrigable scenario. In the second part of the century, emission rates decreased for i_RCP4.5 (−0.02 kg N-N2O ha−1 yr−1) compared with the irrigable scenario, whereas they continued to grow (+0.03 kg N-N2O ha−1 yr−1) for i_RCP8.5. Interestingly, the interannual variance of N2O emissions increased from the historical period to the first half of the century (+0.02 kg N-N2O ha−1 yr−1) and continued for the second part of the century (+0.08 and +0.14 kg N-N2O ha−1 yr−1 for RCP4.5 and RCP8.5, respectively), while the extension of irrigation contributes to reducing this variance in the second part of the century for both i_RCP4.5 and i_RCP8.5 scenarios (−0.05 and −0.03 kg N-N2O ha−1 yr−1).
N2O emissions from grasslands showed a similar trend over the years to that for croplands (Fig. 4b), characterised by lower rates. During the historical period, the emissions increased at a rate of 2.4 g N-N2O ha−1 yr−1, reaching a mean value of 0.81 kg N-N2O ha−1 yr−1 (Table 1). This rate rose to about 3.5 g N-N2O ha−1 yr−1 during the first half of the century; afterwards the two different climate scenarios showed different trends. RCP4.5 was characterised by a significant reduction in the emission rate to 0.5 g N-N2O ha−1 yr−1, while the rate tripled for RCP8.5, which reached a mean emission of 1.32 kg N-N2O ha−1 yr−1 at the end of the century (average 2080–2099). A total emission of 1.05 kg N-N2O ha−1 yr−1 is expected for RCP4.5 in the same integration period.
Total N2O emissions from croplands and grasslands were reported for the surface allocated for arable crops and permanent grasslands for each simulation unit (Fig. 5). Emissions ranged between 0 and 2.5 kg N ha−1 yr−1 during the historical period and were concentrated in hotspots, such as northern Italy, north-east Germany and Poland, southern England, Bulgaria, eastern Romania, the Scandinavian Peninsula, and north-western Spain and Portugal. During the climatic projections, a general worsening of N2O emissions is observed, reaching up to and often over 1 kg N ha−1 yr−1, especially towards the end of the century and for the strongest climatic scenario. An average emission of 1.02 kg N-N2O ha−1 yr−1 (corresponding to 0.163 Mt N-N2O yr−1) was emitted during the historical period. This amount rose to 1.06 and 1.08 kg N-N2O ha−1 yr−1 (0.166 and 0.170 Mt N-N2O yr−1) in the first half of the century for RCP4.5 and RCP8.5, respectively. In the second half of the century total N2O emissions assumed a further increase to 1.11 and 1.13 kg N-N2O ha−1 yr−1 (0.169 and 0.174 Mt N-N2O yr−1) for RCP4.5 and RCP8.5, respectively. The representation of separate emissions of N2O from croplands and grasslands in Europe is shown in Fig. S5a and b.
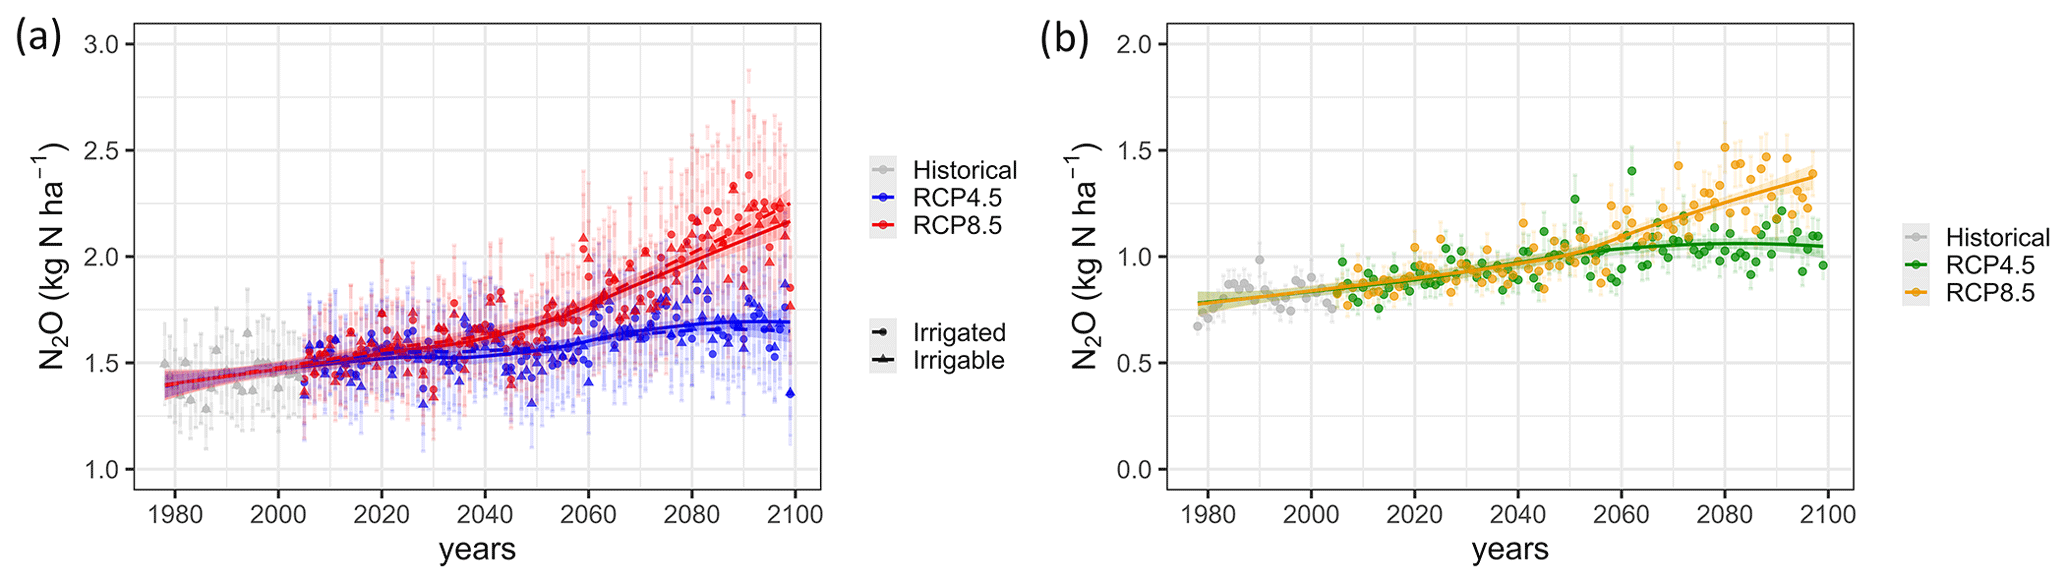
Figure 4N2O emissions (kg N ha−1 yr−1) for (a) croplands and (b) grassland with two climate change scenarios (RCP4.5 and RCP8.5). N2O emissions for croplands consider two irrigation conditions, following the irrigable agricultural area in Europe or extending the irrigation to all the arable lands (i_RCP4.5 and i_RCP8.5).
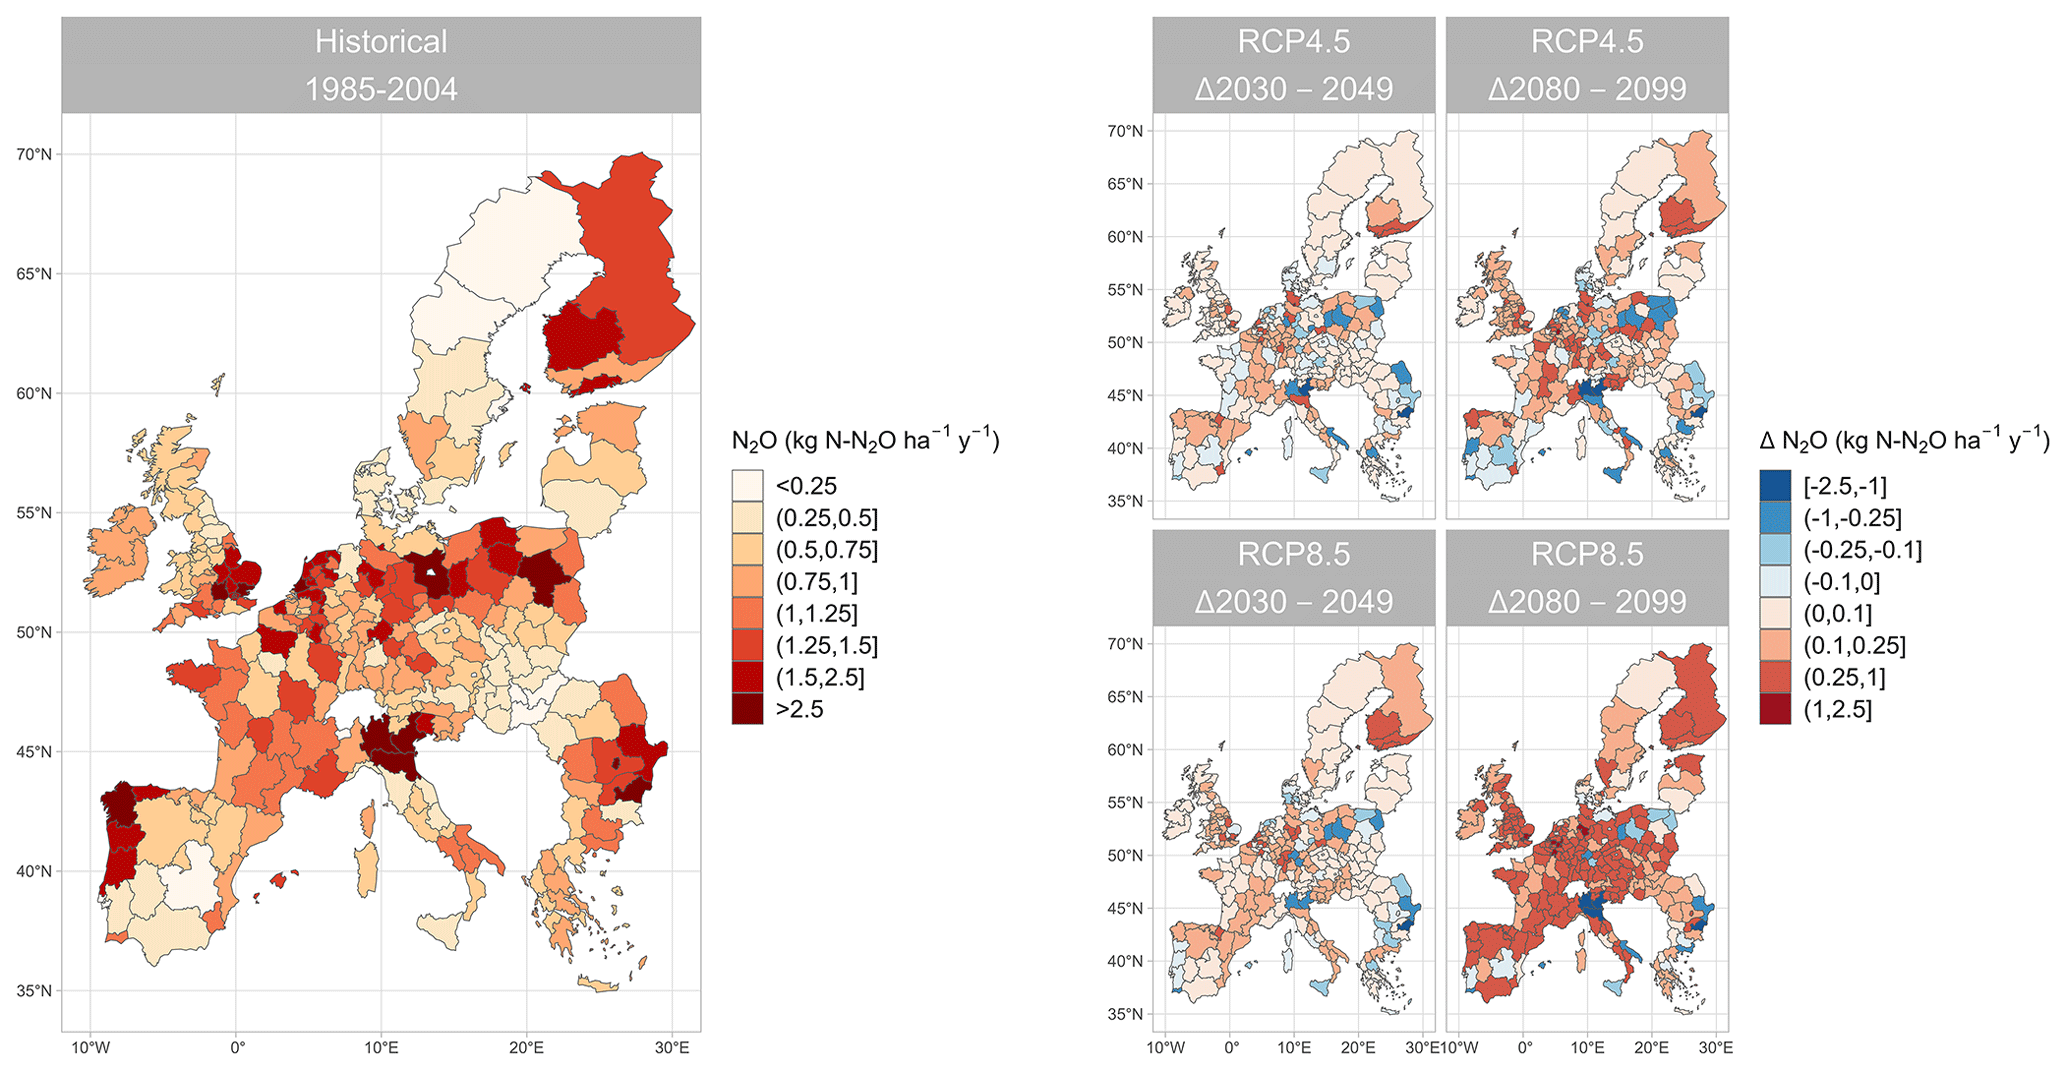
Figure 5N2O emissions for croplands and grasslands in European administrative regions (NUTS2). Emissions are reported for the historical period (1985–2004) and difference Δ from the middle (2030–2049) and the end (2080–2099) of the century for the two climatic scenarios RCP4.5 and RCP8.5. N2O emissions are reported for cropland with the irrigable scenario (see the text).
The N2O emission factor (EF), defined as the ratio between the N emitted as N2O from croplands and grasslands and the N introduced into the system (not including the N added by animal excretion, crop residue, atmospheric deposition, soil mineralisation and fixation), had the same trend as described for N2O over time. During the historical period the averaged EF for croplands was 1.88 ± 0.32 %, while the EF for grasslands was 1.99 ± 0.16 %; see Fig. S6a and b.
Combining cropland and grassland emissions over each simulation unit, the resulting EF was 1.82 ± 0.07 % during the historical period, which rose to 1.90 ± 0.09 % for RCP4.5 and 1.94 ± 0.09 % for RCP8.5 in the first half of the century. The EF was 2.02 ± 0.11 % and 2.05 ± 0.11 % for RCP4.5 and RCP8.5, respectively, in the second part of the century. The spatial distribution of EF values at the NUTS2 scale, as shown in Fig. 6, varies from 0.1 % to over 5 % in the historical period, assuming variations of ± 1 % in RCP4.5 and up to ± 10 % in RCP8.5. The European hotspots were the same described for the N2O emissions.
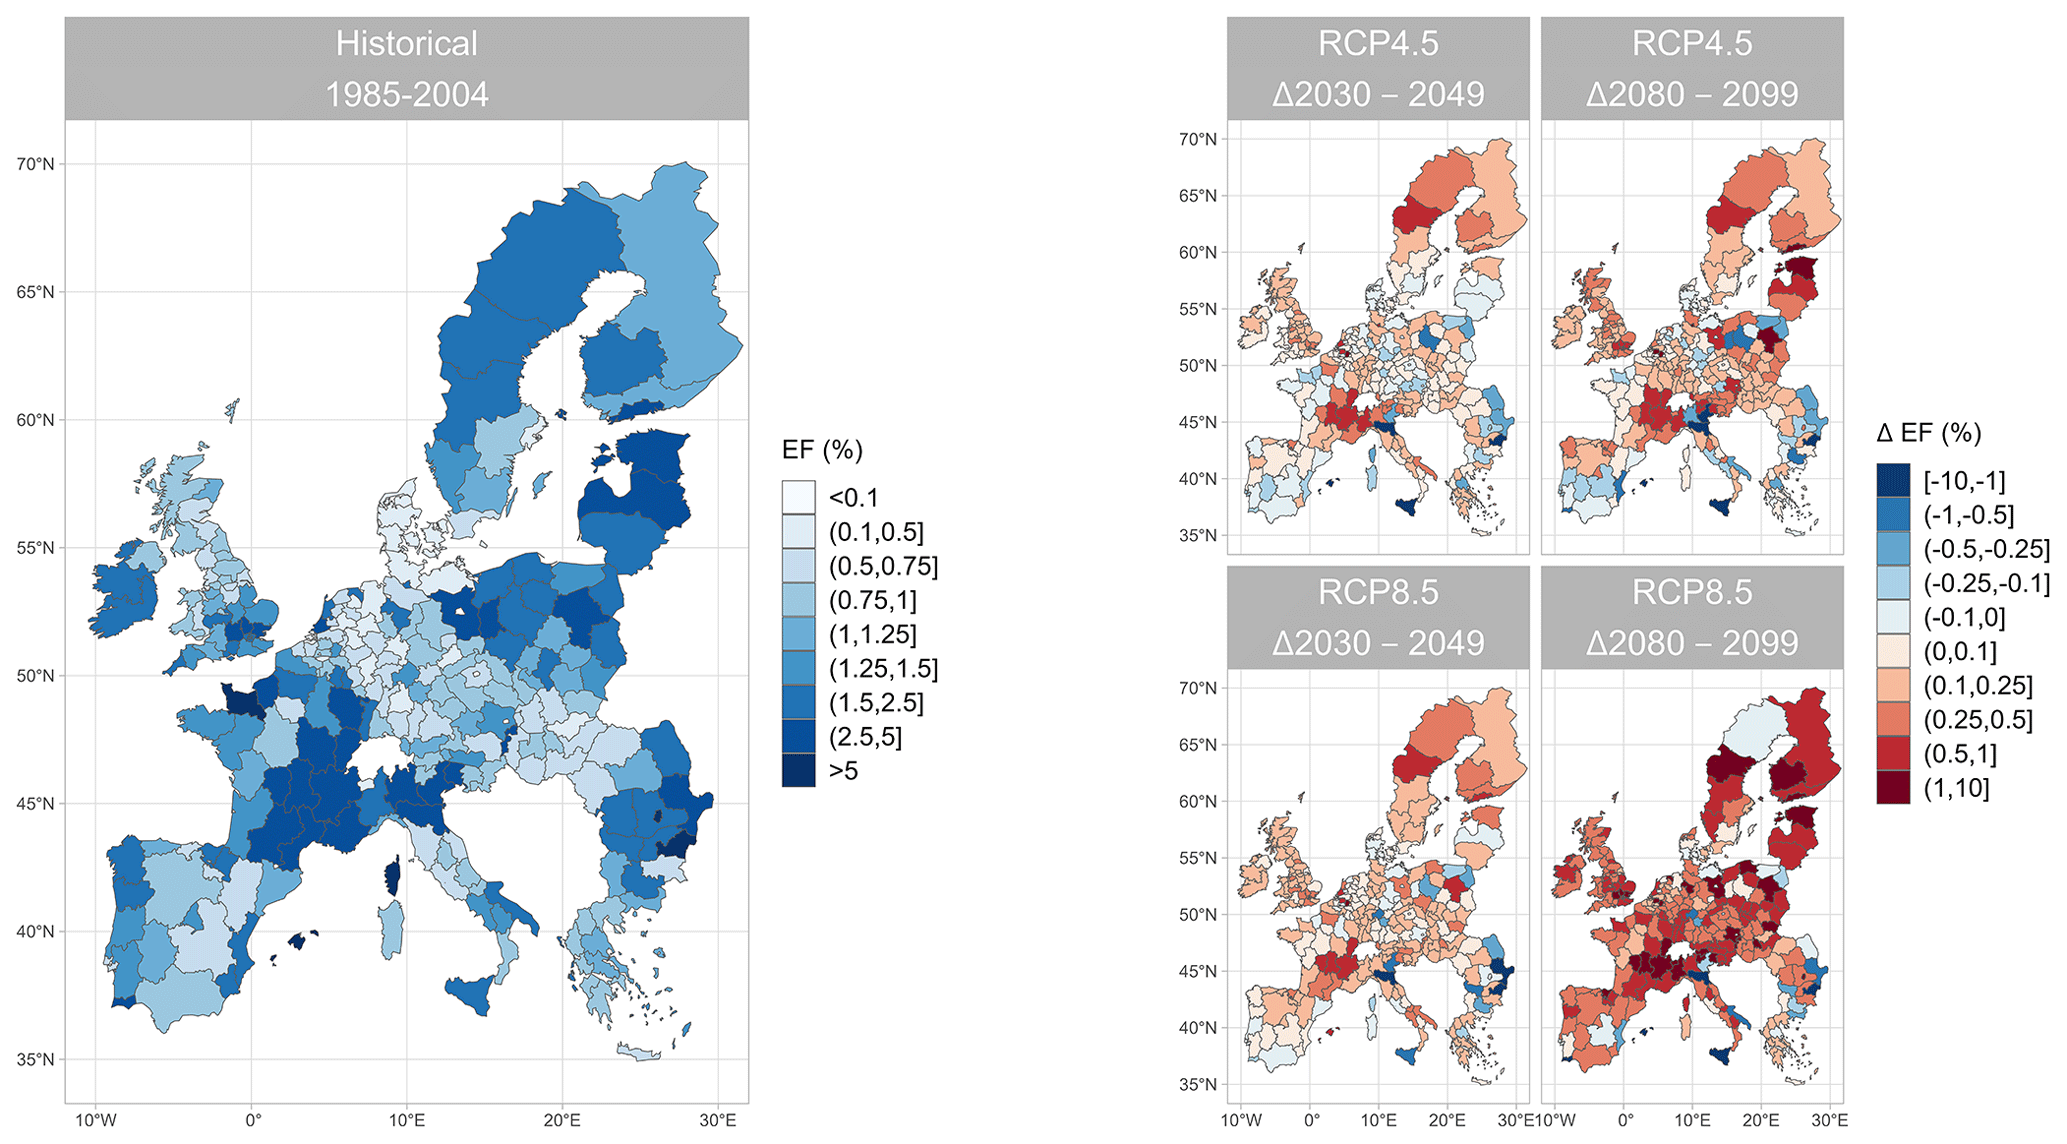
Figure 6The N2O emission factor (EF %) for croplands and grasslands in European administrative regions (NUTS2). The EF is reported for the historical period (1985–2004) and the difference Δ from the middle (2030–2049) and the end (2080–2099) of the century for the two climatic scenarios RCP4.5 and RCP8.5. The EF is calculated as the ratio between the N emitted as N2O from croplands (irrigable scenario) and grasslands and the N introduced into the system as fertiliser (not including the N added by animal excretion, crop residue, atmospheric deposition, soil mineralisation and fixation).
The specific EF for the simulated crops, calculated in the period from sowing (including pre-sowing management) to the sowing of the next crop in a succession (excluding pre-sowing management), ranged from 0.9 % to 3.4 % in the historical period and is shown in Fig. 7. EFs towards the middle and the end of the century rose for all the crops, with a greater impact for the RCP8.5 scenario, except for winter soft wheat, which exhibited lower EF values over the century, and soybeans, which presented a low EF at the end of the century for RCP8.5 compared to the mild scenario. Figure 7 also shows the EF for N2O for grasslands, which assumed an increasing behaviour over the course of the century and according to the strength of climate scenarios.
3.2.2 CH4 emissions
The emissions of CH4 from enteric fermentation are shown in Fig. 8. During the historical period, a mean emission of 6.71 kg C-CH4 ha−1 yr−1 was observed, with a rate of 15.6 g C-CH4 ha−1 yr−1 (Table 1). The emission rate halved in the first part of the century, increased slightly in the second part of the century for RCP4.5 (4.3 g C-CH4 ha−1 yr−1) and strongly decreased for the RCP8.5 scenario (−23.7 g C-CH4 ha−1 yr−1). Emissions towards the end of the year were 6.73 kg C-CH4 ha−1 yr−1 for RCP4.5 (average 2080–2099) and 5.74 kg C-CH4 ha−1 yr−1 for RCP8.5 in the same period. The averaged CH4 emissions per head ranged from 2.99 kg CH4 per head per year in the historical period to 3.03 and 3.01 kg CH4 per head per year in the first half of the century for RCP4.5 and RCP8.5, respectively. In the second half of the century a reduction to 2.98 and 2.73 kg CH4 per head per year is expected for RCP4.5 and RCP8.5, respectively. The spatial distribution of CH4 emissions at the NUTS2 scale (Fig. 9) ranged from 0 to over 20 kg C-CH4 ha−1 yr−1 in the historical period and was concentrated in the north-western part of Europe. During the climate projections, methane emissions assumed wide variations, in the range of ± 11.5 kg C-CH4 ha−1 yr−1, with increases mostly in northern Europe.
3.2.3 Carbon fluxes
Results are presented with the sign convention indicating CO2 accumulation as negative, and CO2 losses as positive. Net ecosystem production (NEP) for European croplands showed an accumulation of CO2 in the historical period (−3403 kg C-CO2 ha−1 yr−1) and a clear intensification until 2050 (about +3 %). Rates were contrasting for RCP4.5, with −3.27 kg C-CO2 ha−2 yr−1, and for RCP8.5, with +1.44 kg C-CO2 ha−2 yr−1 (Fig. 10a; Table 1). In the second part of the century, a net divergence is expected, with CO2 accumulation for RCP4.5 (rate of −1.66 kg C-CO2 ha−1 yr−1) and a marked decrease for RCP8.5 (rate of +9.84 kg C-CO2 ha−1 yr−1). Extending the irrigation area over all European croplands, taking advantage of irrigation volumes according to crop needs and soil water status, produced a proportional increase in CO2 accumulation in the climatic scenarios for both the first half of the century (+6 %, or about +236 kg C-CO2 ha−1 yr−1) and the second half (+7 %, or about +321 kg C-CO2 ha−1 yr−1). At low European latitudes and for the historical period, NEP for croplands was 4359 kg C-CO2 ha−1 yr−1, higher than middle and high latitudes (−11 % and −50 %). NEP at low latitudes is expected to increase moving towards 2050 (+3 %) for both RCP4.5 and RCP8.5 (Fig. S7a; Table S1). This trend is inverted towards the end of the century for the RCP4.5 scenario (−1 %) and becomes more severe for RCP8.5 (−8 %). At central European latitudes there is an accumulation of CO2 in the first part of the century for both climate scenarios (+9 %), which is maintained for RCP4.5 towards the end of the century and tends to be released (−3 %) for the RCP8.5 scenario.
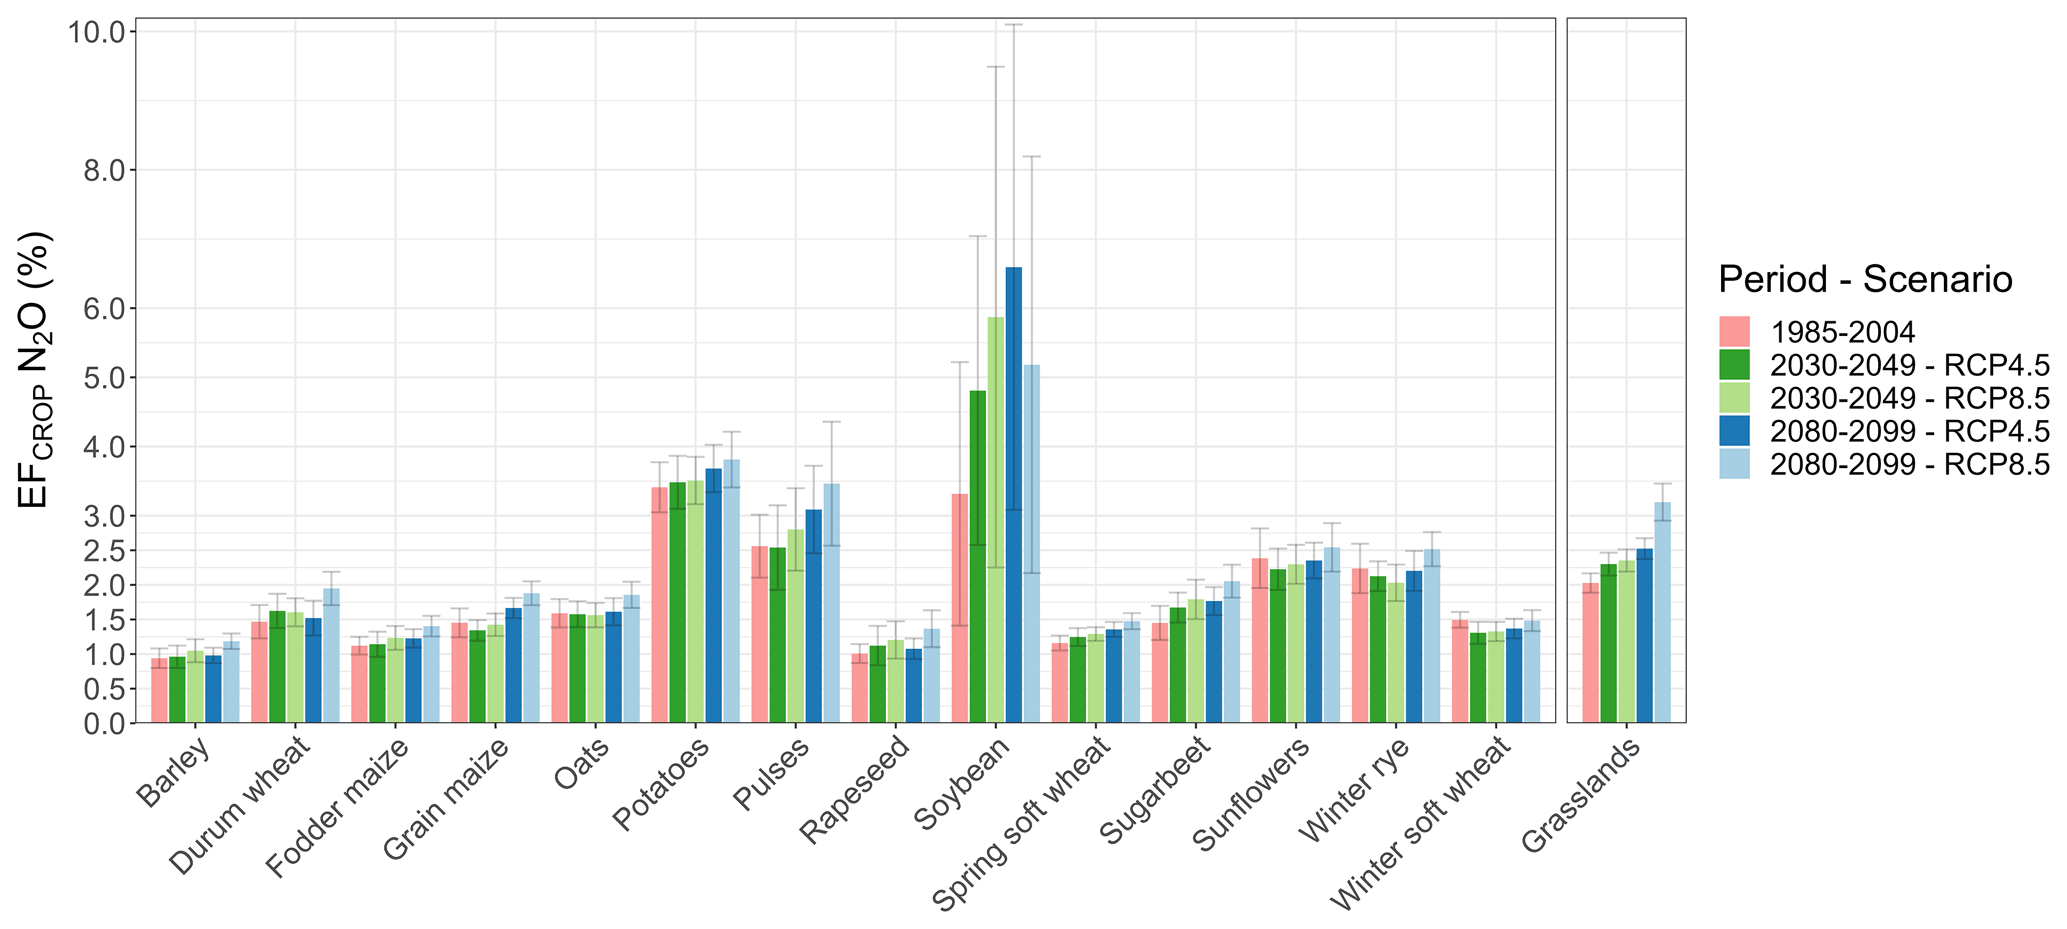
Figure 7The emission factor (EF) for N2O (%) for the different crops and grasslands for the historical period (1985–2004), towards the mid-century (2030–2049) and towards the end of the century (2080–2099), for the two climatic scenarios RCP4.5 and RCP8.5. The EF is the ratio between the N emitted as N2O from crops and grasslands and the N applied as fertiliser.
Compared to central European latitudes, higher latitudes showed a tendency to store more CO2 for the RCP4.5 scenario with respect to the historical period (+5 % in the middle of the century and +9 % at the end of the century), whereas a tendency to release CO2 is forecasted for the RCP8.5 scenario, especially towards the end of the century (−5 %). The extension of irrigation to all European areas showed clear CO2 losses for all latitudes.
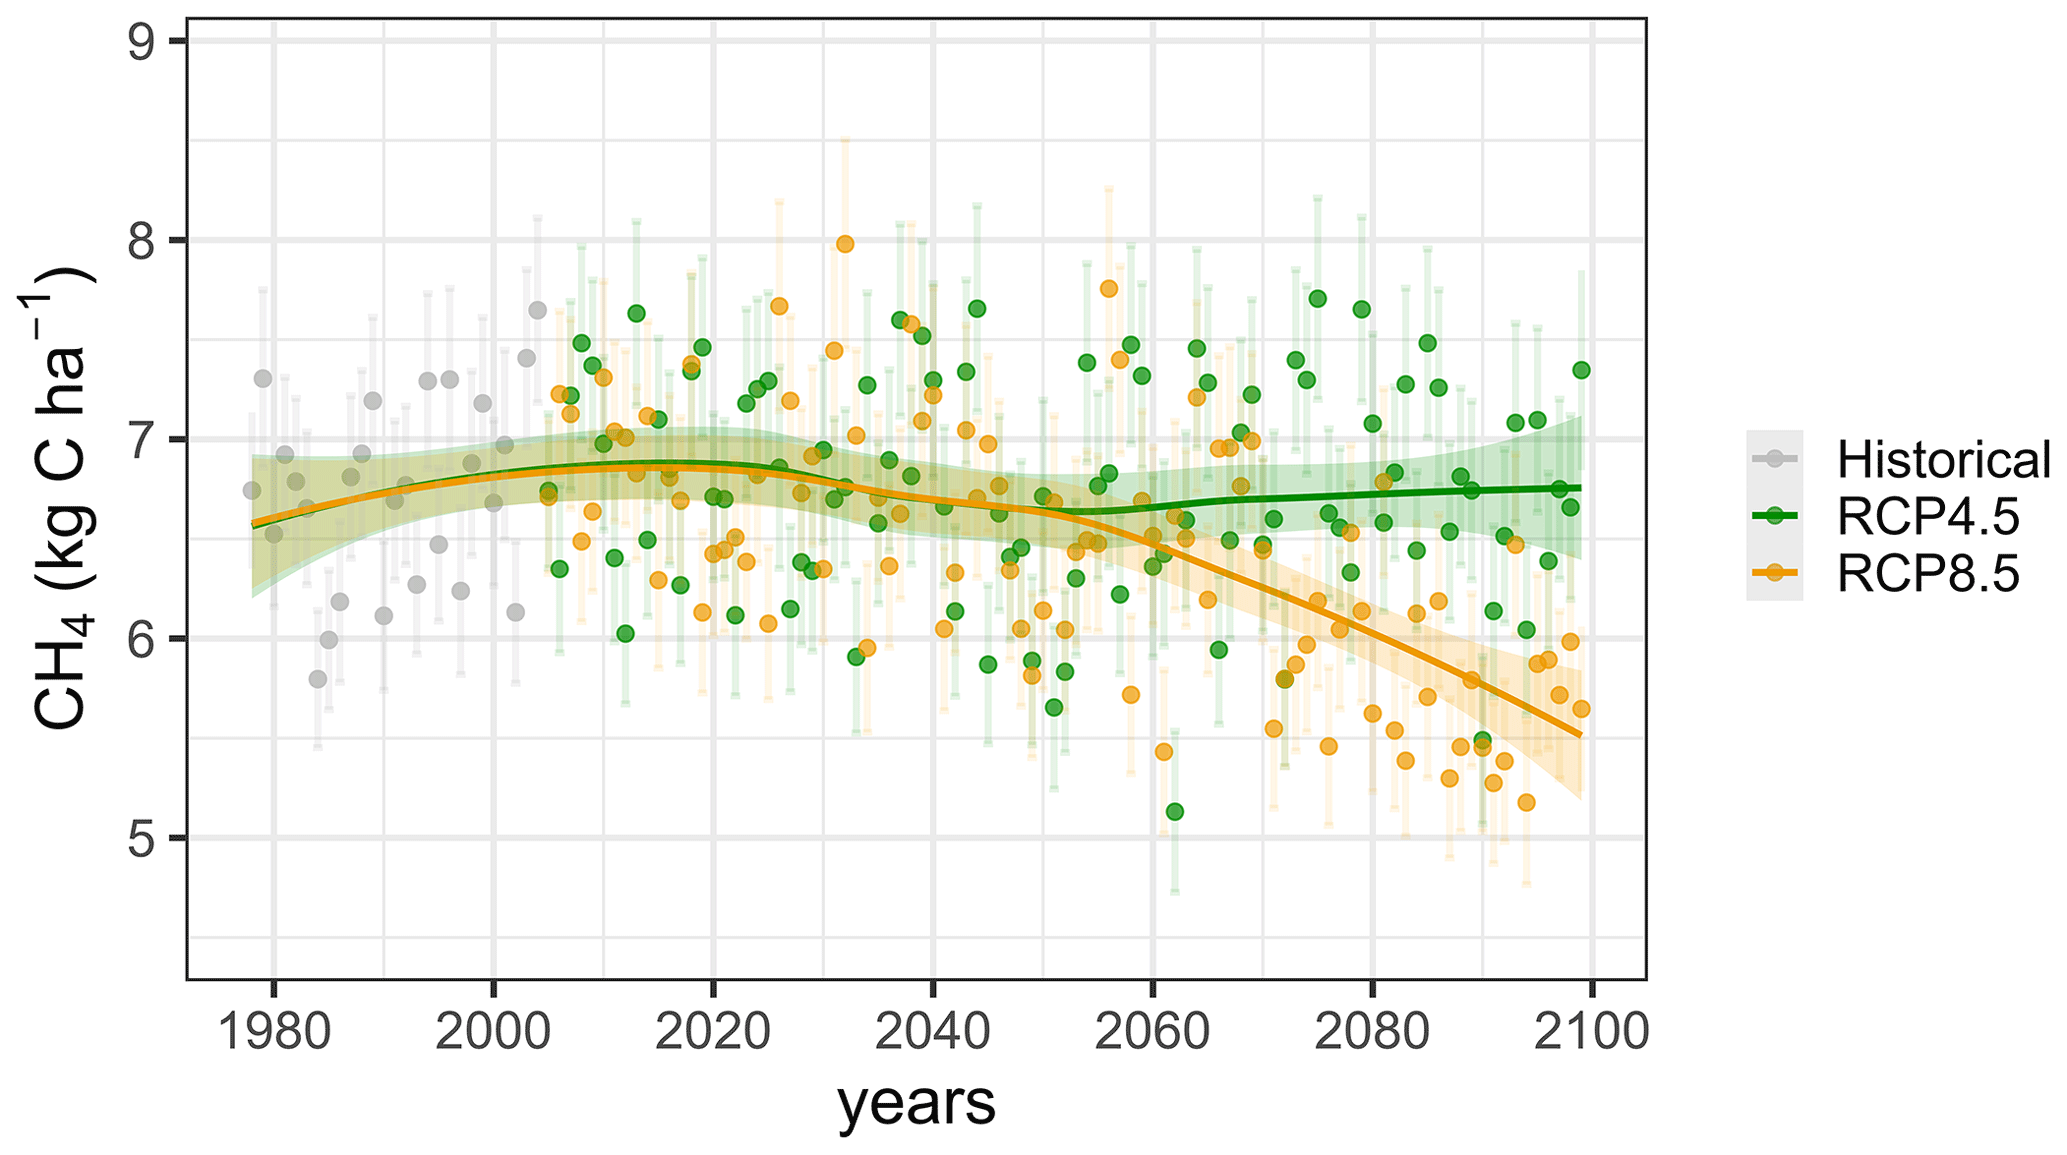
Figure 8CH4 emissions (kg C-CH4 ha−1 yr−1) from enteric fermentation in grasslands with two climate change scenarios (RCP4.5 and RCP8.5).
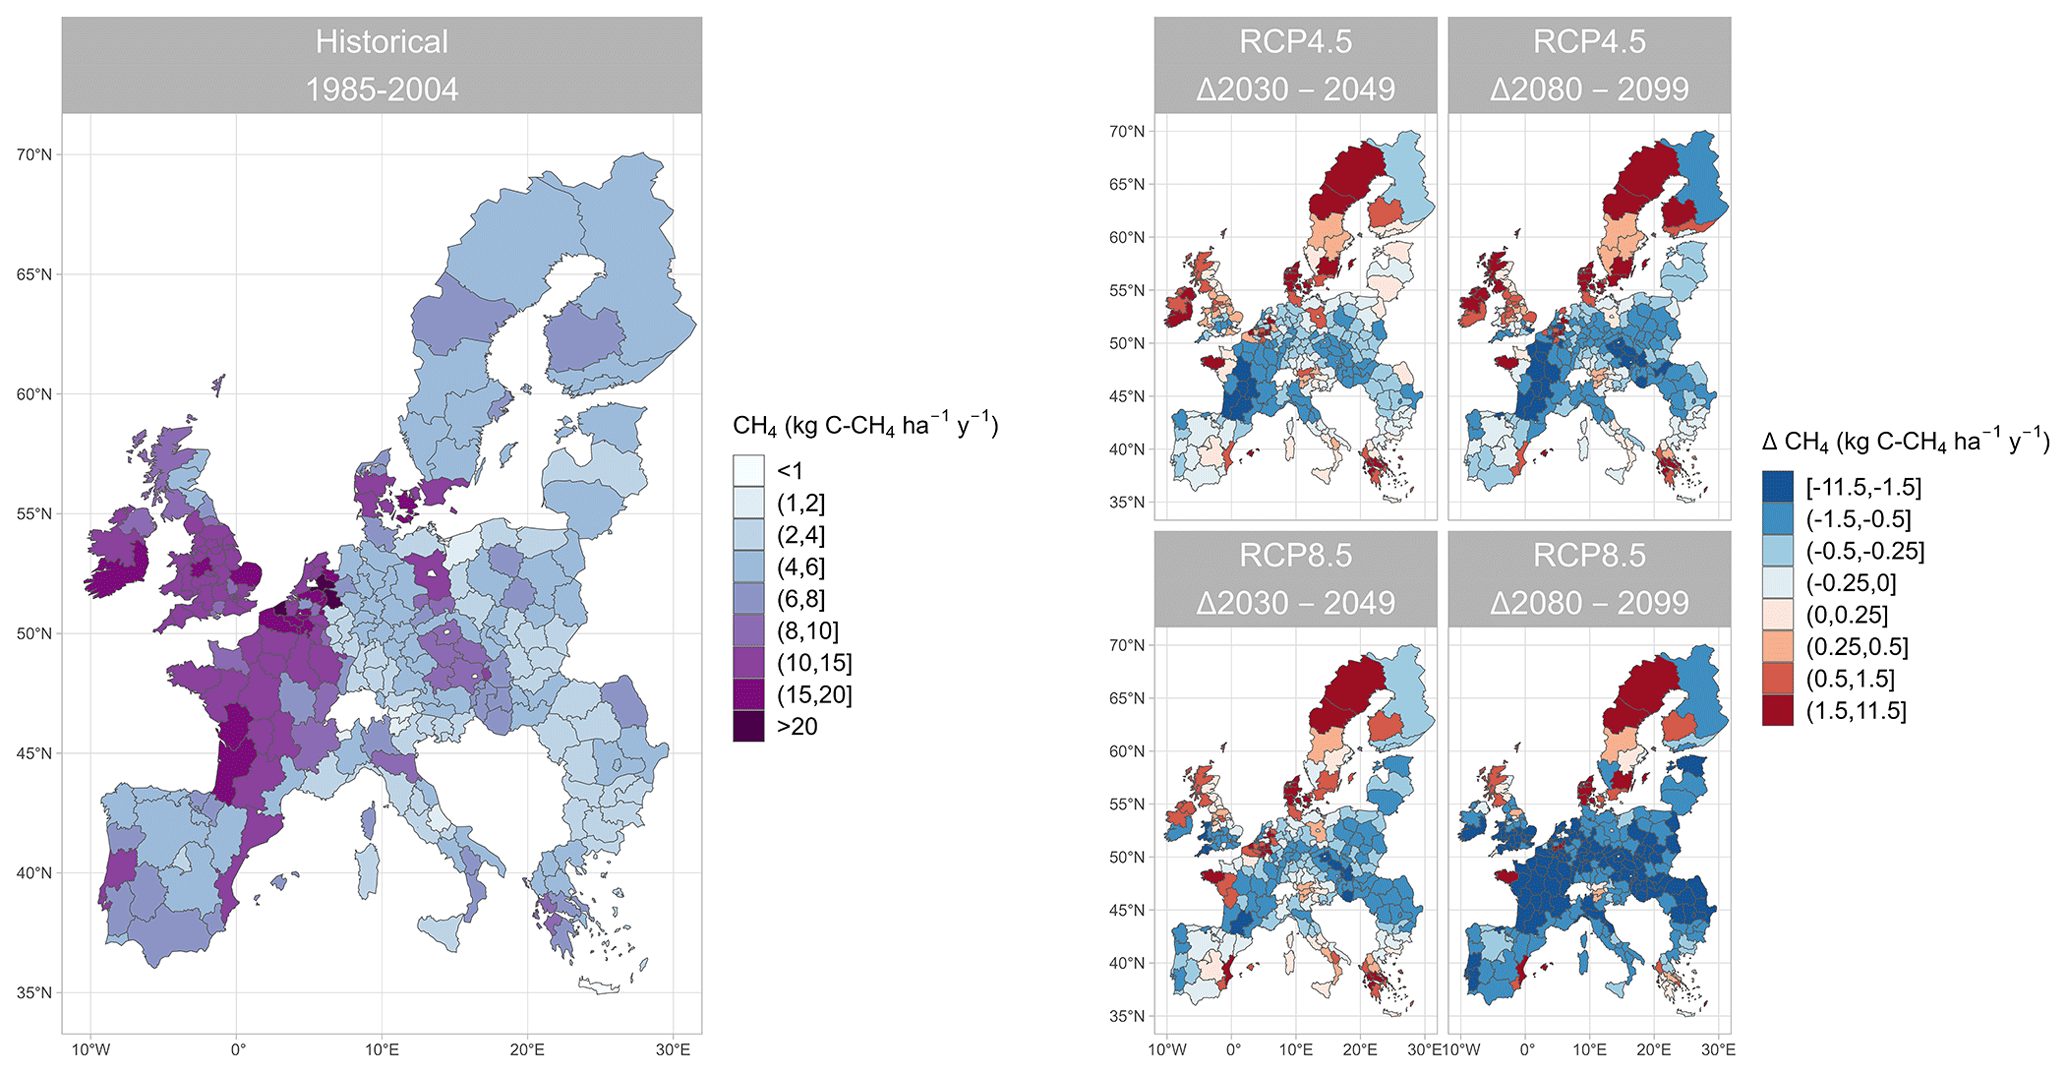
Figure 9CH4 emissions for grasslands in European administrative borders (NUTS2). Emissions are reported for the historical period (1985–2004) and difference Δ from the middle (2030–2049) and the end (2080–2099) of the century for the two climatic scenarios, RCP4.5 and RCP8.5.
NEP in grasslands indicated a clear trend towards CO2 accumulation in the system during the historical period (−622 kg C-CO2 ha−1 yr−1) with a rate of −0.77 kg C ha−1 yr−1 (Fig. 10b; Table 1). Approaching 2050 a slight imbalance and a tendency to release CO2 are observed for both climate scenarios (around 100 kg C-CO2 ha−1 yr−1). Approaching 2100, the amount of CO2 potentially stored in the system is maintained for RCP4.5, while a clear release of CO2 is forecasted for the scenario without adaptation to climate change (324 kg C-CO2 ha−1 yr−1), projecting a potential loss of 50 % of the CO2 stored annually in the historical period. A potential release of CO2 was also projected for RCP4.5 for low latitudes, both in the middle (−7 %) and towards the end of the century (−16 %), compared to the historical period (−631 kg C-CO2 ha−1 yr−1; Table S1). Higher decreases are forecasted for RCP8.5 for the lower latitudes, −13 % and −37 % in the first and the second half of the century, respectively. Conversely, grasslands tend to stock more CO2 in high latitudes during the historical period (−960 kg C-CO2 ha−1 yr−1, double compared to low latitudes) and become a further CO2 sink for the climate scenarios for the middle of the century (+2 %). For the second half of the century RCP4.5 increased the stock (+3 %), while RCP8.5 became negative (−31 %) towards the end of the century. The intermediate latitudes, corresponding to central Europe, displayed a strong susceptibility to CO2 release in both climatic scenarios, ranging between −19 % and −31 % for RCP4.5 in the middle and at the end of the century, respectively, and becoming more negative (<−50 %) for the RCP8.5 scenario (Fig. S7b).
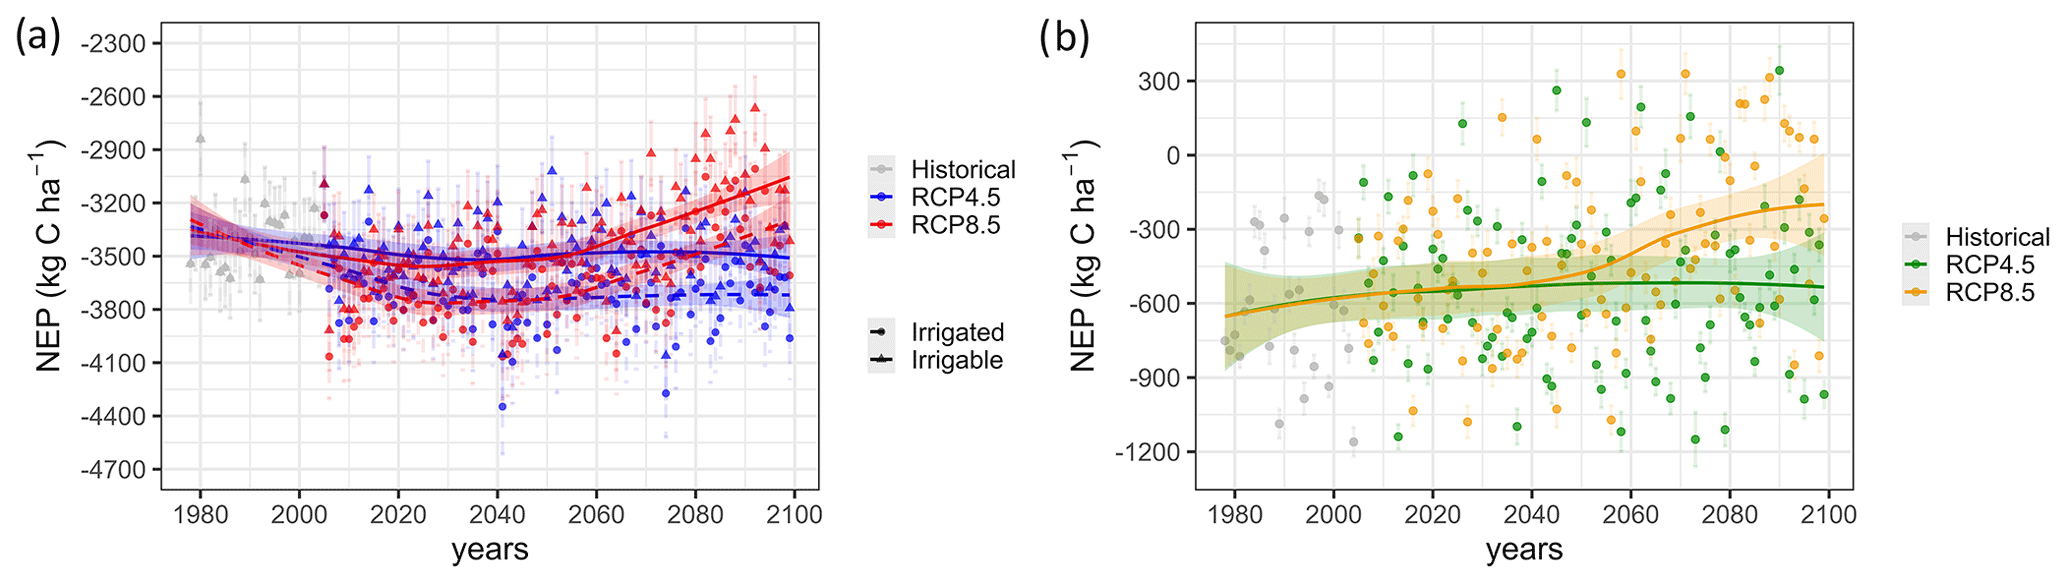
Figure 10Net ecosystem production (NEP; kg C ha−1) for croplands (a) and grasslands (b), with two climate change scenarios (RCP4.5 and RCP8.5). Croplands reported two irrigation conditions following the irrigable agricultural area in Europe or extending the irrigation to all the arable lands (scenarios i_RCP4.5 and i_RCP8.5).
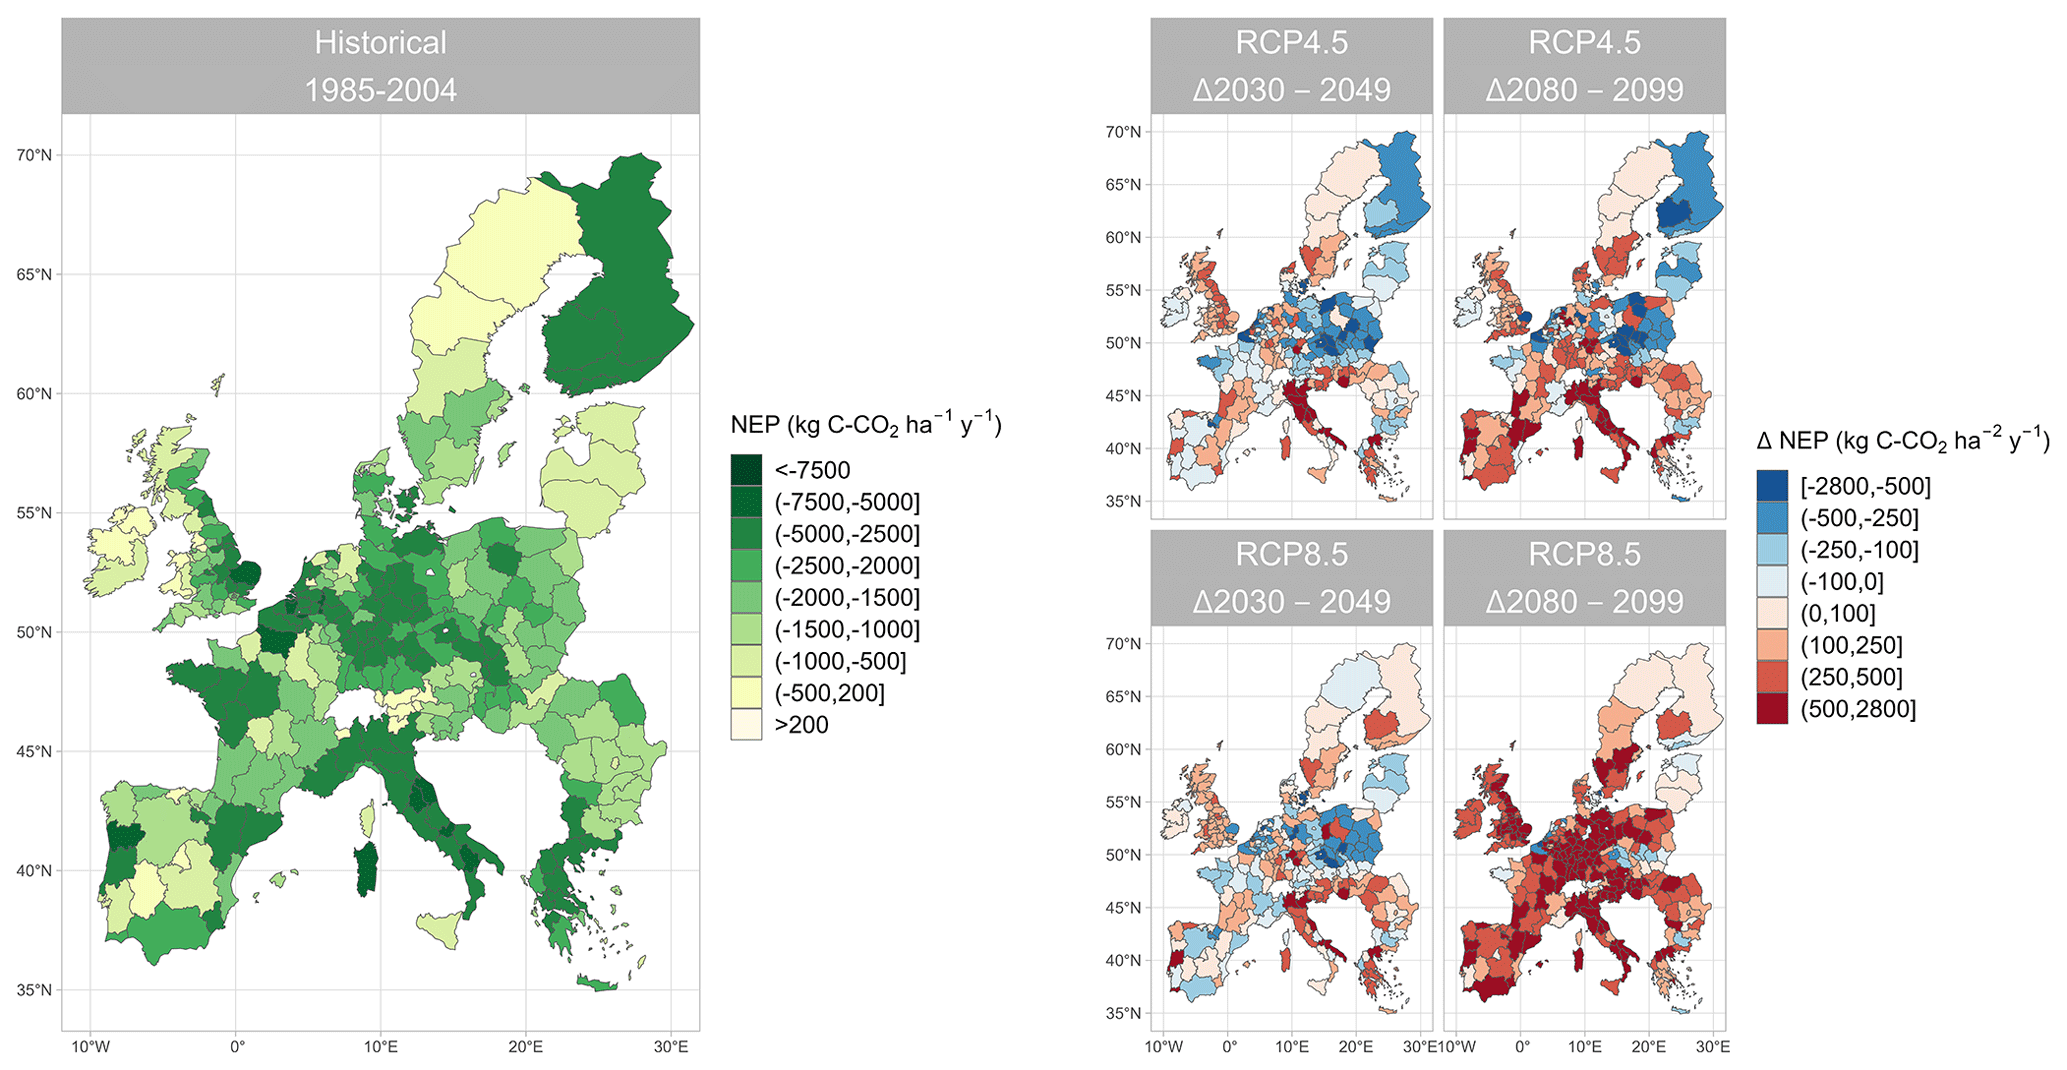
Figure 11Net ecosystem production (NEP) for croplands and grasslands in European administrative borders (NUTS2). Results are reported for the historical period (1985–2004) and difference Δ from the middle (2030–2049) and the end (2080–2099) of the century for the two climatic scenarios RCP4.5 and RCP8.5. NEP for croplands is reported with the irrigable scenario (see the text).
NEP of the European cropland and grasslands system, obtained reporting emissions from the surface allocated to arable crops and permanent grasslands in each simulation unit, is shown in Fig. 11. During the historical period, NEP varied between −7500 and +200 kg C-CO2 ha−1 yr−1 within the European regions. Climate projections showed variation of up to ± 2800 kg C-CO2 ha−1 yr−1 from the historical values, indicating a tendency to store less CO2 in the first half of the century, especially for the Mediterranean regions. CO2 stock is further reduced in central European latitudes towards the end of the century for the RCP4.5 scenario and showed a strong reduction in all regions during RCP8.5. A total of −1241 Tg CO2 eq. yr−1 was stocked over Europe during the historical period (corresponding to −1865 kg C-CO2 ha−1 yr−1). This amount rose in the first half of the century (−1232 Tg CO2 eq. yr−1 for RCP4.5 and −1244 Tg CO2 eq. yr−1 for RCP8.5) and further increased in the second half of the century for both climatic scenarios (−1176 Tg CO2 eq. yr−1 for RCP4.5 and −1073 Tg CO2 eq. yr−1 for RCP8.5) (Table 2).
Table 2The net greenhouse gas exchange (NGHGE) and net greenhouse gas budget (NGB) in Europe during the historical and two climate change scenarios. The elements of the budget are reported: N2O, CH4 and the net ecosystem production (NEP; for the sign convention, negative values represent a stock of carbon). Results are in Tg CO2 eq. yr−1. Between brackets is standard deviation.
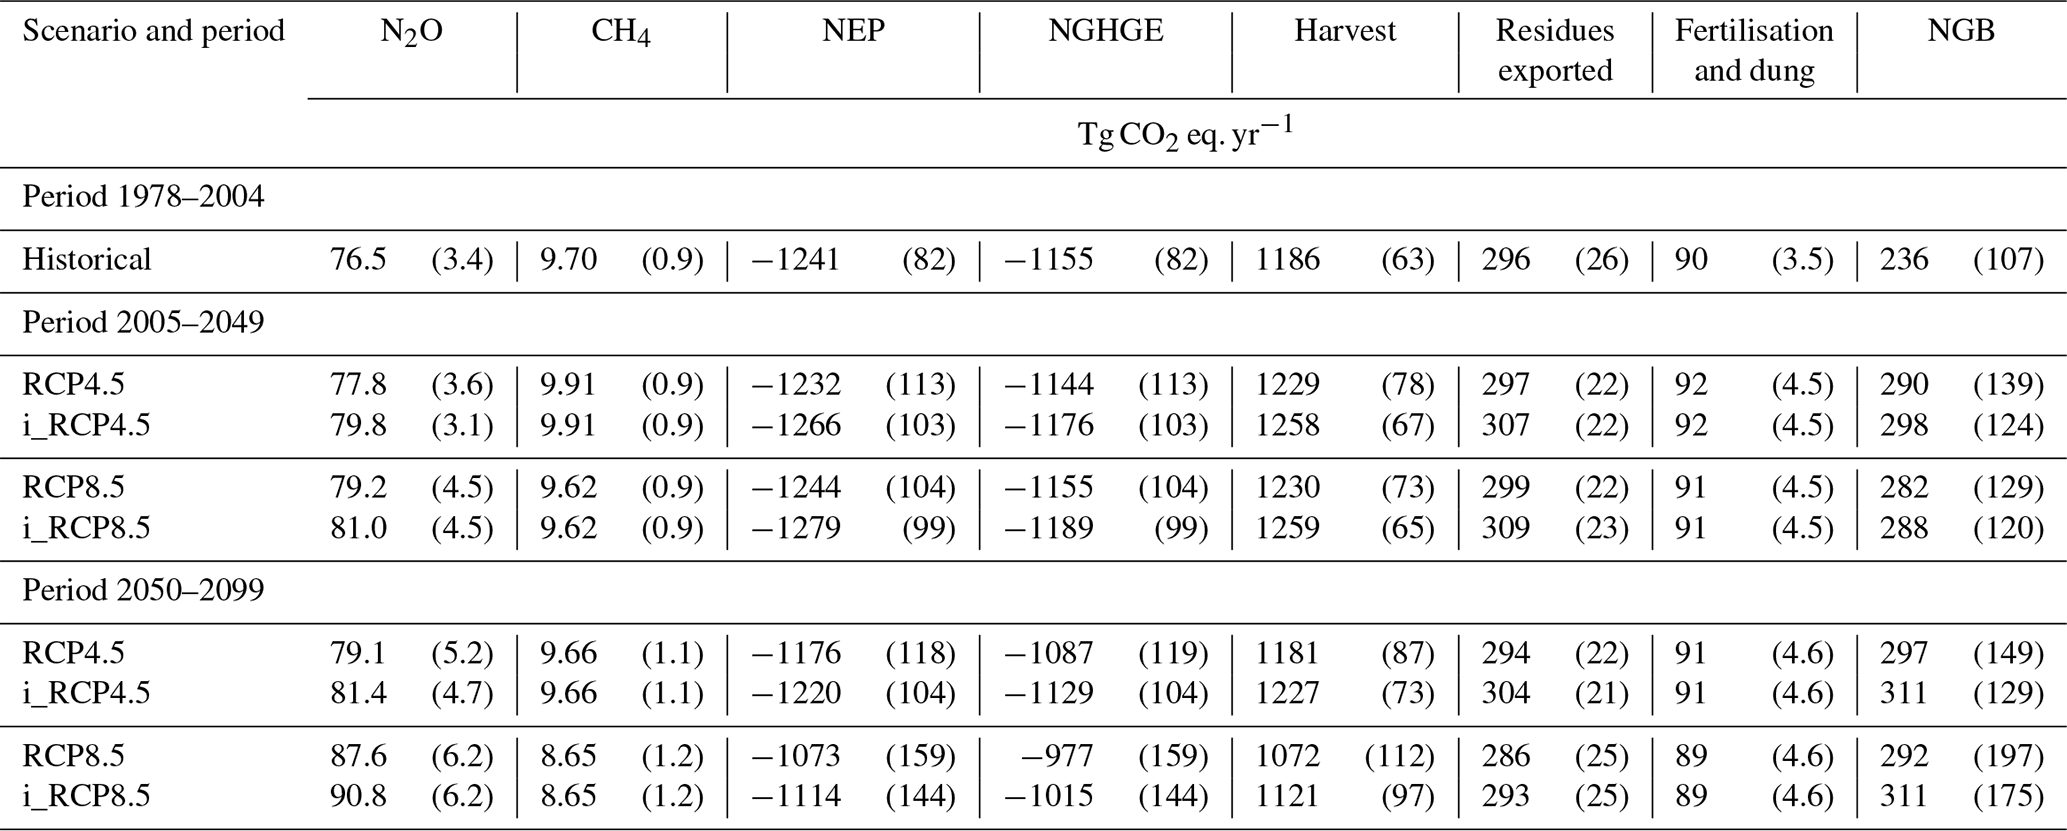
The NGHGE still indicated a potential capacity of the European production systems to store −1155 ± 82 Tg CO2 eq. yr−1 as the average during the historical period. N2O and CH4 were able to offset the NEP by 6.2 % and 0.8 %, respectively. In the first half of the century, the NGHGE assumed a slight reduction for RCP4.5, indicating a potential C stock, whereas it remained substantially unvaried for RCP8.5. In the second part of the century the NGHGE increased for both RCP4.5 (−1087 ± 119 Tg CO2 eq. yr−1) and RCP8.5 (−997 ± 159 Tg CO2 eq. yr−1), indicating a decline in C accumulation. The extension of irrigation to all European agricultural surfaces highlights a further potential to stock C of about 3 % to 4 %, mainly due to the greater NEP values.
NGB indicated losses from European agricultural surfaces in the range of 2367 ± 107 Tg CO2 eq. yr−1 for the historical period (Table 2). Losses increased both in the first and the second half of the century and for both climate scenarios, being higher for RCP4.5 (−23 % and −26 % for the first and the second part of the century) than RCP8.5 (−19 % and −24 % for the first and the second part of the century). The extension of irrigation to the whole of Europe, which support productivity and biomass removals as well as the greenhouse gas emissions, increased the net C losses (−26 % and −22 % in the first part of the century for RCP4.5 and RCP8.5, respectively, and −32% for the second part of the century for both scenarios).
4.1 Production
Results from this study confirmed that the effects of climate change, implying shifts in the temperature, precipitation and plant growing length among other factors, represent a serious drawback to plant production.
Air temperature. Our findings pointed out that the increase in air temperature during the climate scenarios was negatively correlated with productivity, leading to persistent reductions in biomass production in both grasslands and croplands. This behaviour is also confirmed by previous studies (e.g. Challinor et al., 2014; Lobell and Tebaldi, 2014; Olesen and Bindi, 2002; Zhang et al., 2017) and was more pronounced for the more pessimistic climate scenario (−0.15 and −0.29 t DM ha−1 yr−1 ∘C−1 for RCP4.5 and RCP8.5, respectively, in the 2050–2099 period). Effects on crop yields ranged from +5 % to −11 % for every degree (∘C) of rising air temperature from 2005–2100. This effect remained negative throughout most of the projected climate scenarios (−1 % and −5 %, for RCP4.5 and RCP8.5, respectively, in the period 2025–2099), as also reported by recent studies using modelling and multi-modelling approaches (e.g. Asseng et al., 2015; Bassu et al., 2014; Zhao et al., 2017; Yang et al., 2019). The extension of irrigable areas to all European croplands reduced the dependence of daily maximum and minimum air temperatures on crop production (Fig. S8). This leads to the assumption that even with access to water (no limitation on irrigation of the European cropping surfaces), biomass production will decline due to increasing air temperatures, as reported by Minoli et al. (2019). This can also be seen from the trend of biomass projections in Fig. 2, considering an increase in temperatures over time. Interestingly, grassland productivity assumed a less pronounced correlation with air temperature during climate scenarios compared to croplands (Fig. 12). The climatic scenario RCP8.5, characterised by a strong reduction in grassland production in the second half of the century, showed a significant negative correlation with minimum and maximum daily air temperatures (), whereas null correlation is observed for RCP4.5. Furthermore, crop yields were significantly correlated with minimum and maximum air temperatures (r=0.64 and r=0.57, respectively) compared to grasslands, which did not show such a dependence (r=0.1 for both minimum and maximum air temperatures), highlighting a greater sensitivity of the CERES-EGC model to air temperatures compared to PaSim.
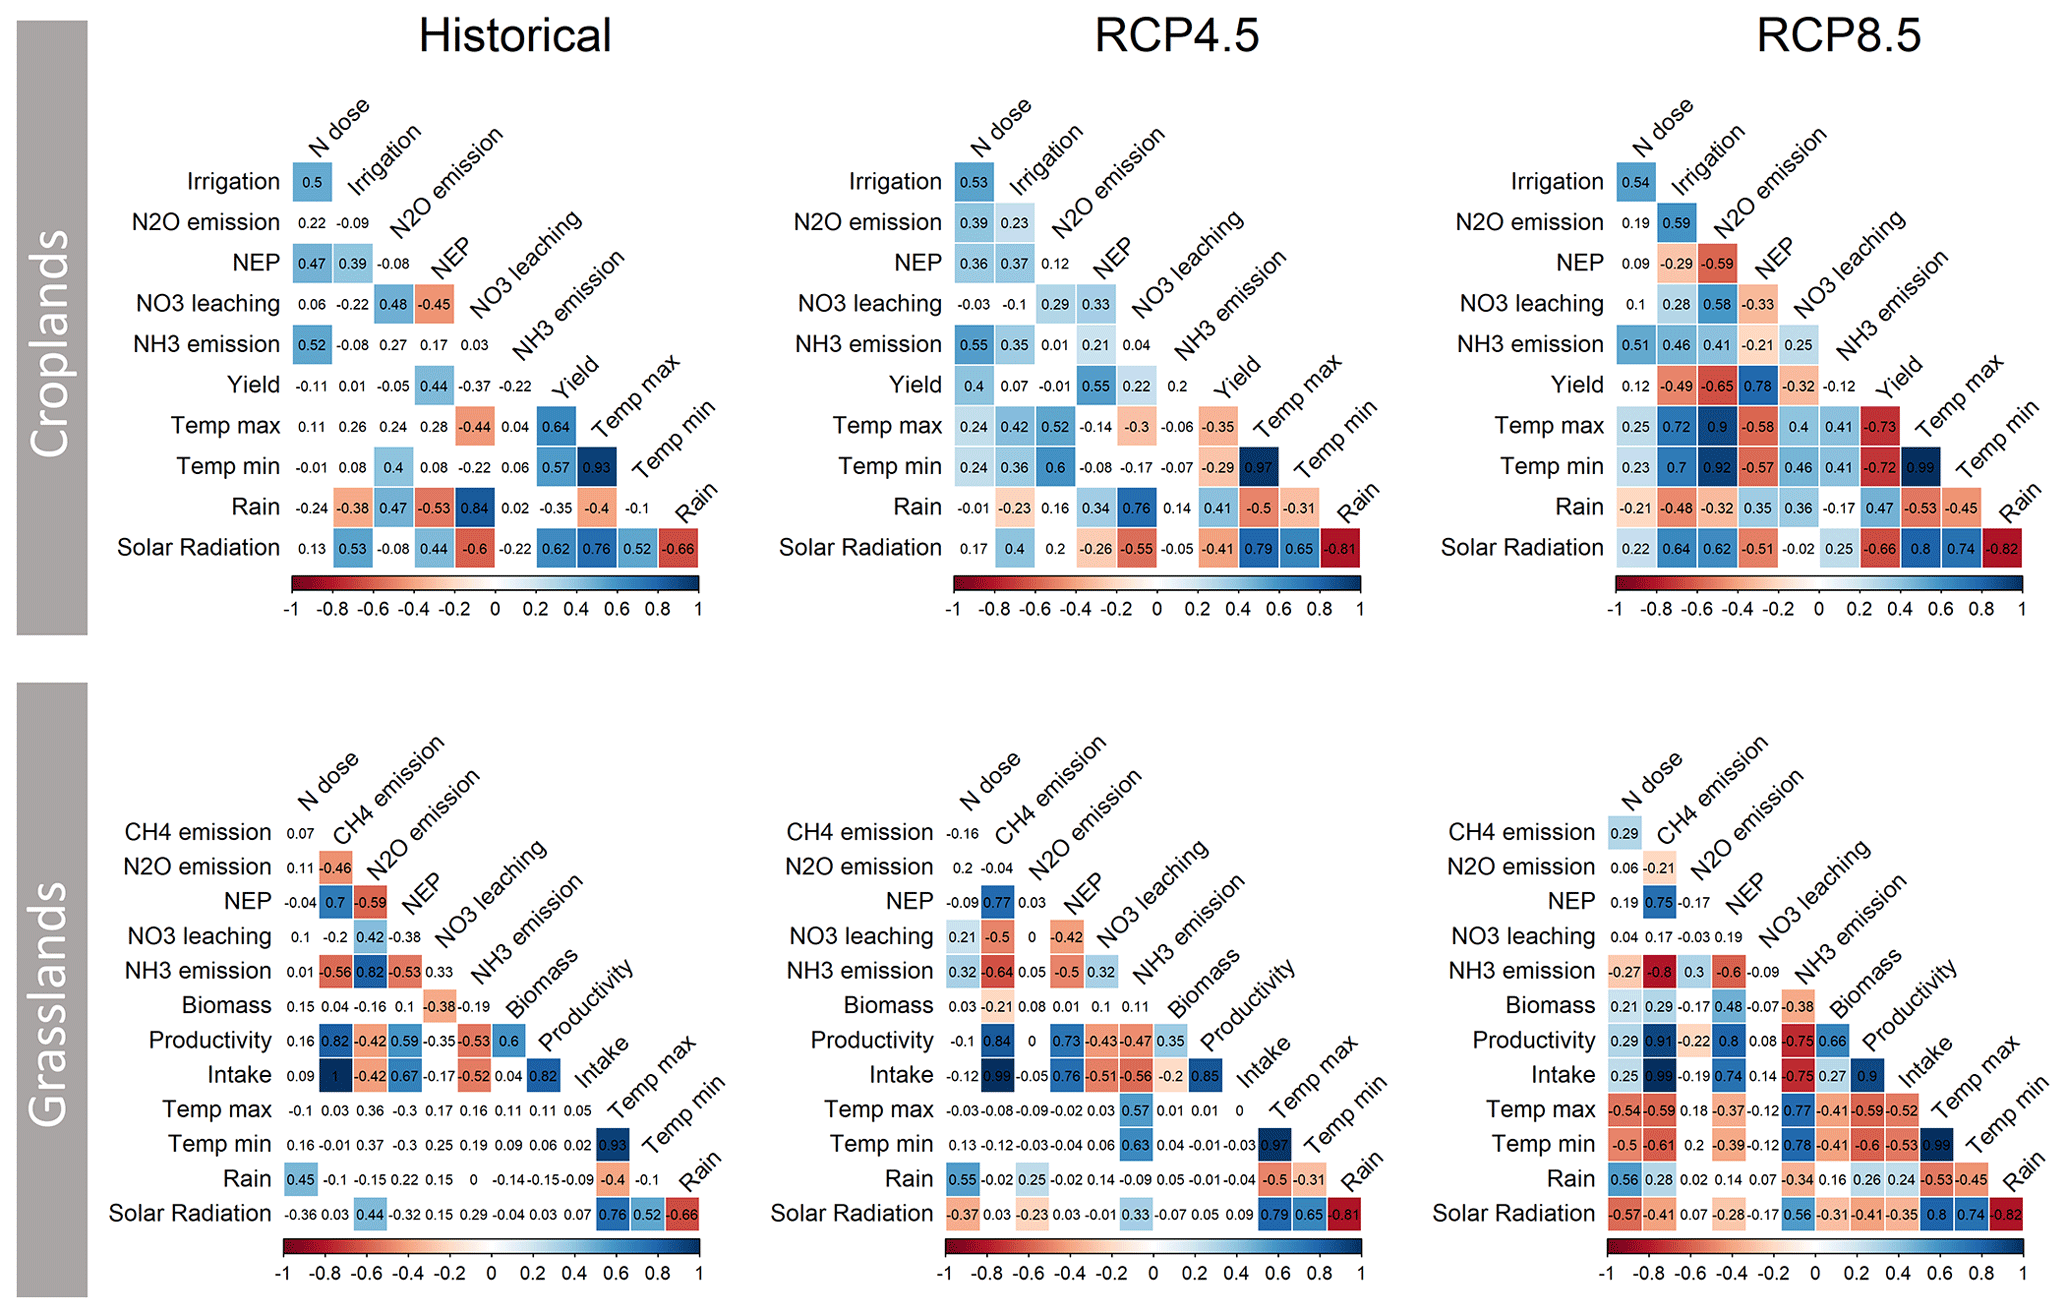
Figure 12Correlation matrixes for croplands and grasslands considering the most interesting indicators for the objectives of this study. Correlation is presented for the historical period (1978–2004) and for the RCP4.5 and RCP8.5 scenarios. For croplands the irrigable scenario is shown here, while the results for the irrigated scenario are shown in Fig. S8. Coloured squares mean significant results (p value < 0.05).
Precipitation. Results confirmed that rainfall has a significant positive effect for both crop production (r=0.41 and 0.13 for RCP4.5 and RCP8.5, respectively) and grassland production (r=0.26 in RCP8.5; r is null for RCP4.5). Compared to the historical period, a reduction in precipitation was predicted in the first half of the century for both scenarios (−2.1 mm yr−1 for RCP4.5 and −0.74 mm yr−1 for RCP8.5; p<0.01), whereas in the second half of the century rainfall increases in RCP4.5 (+1.2 mm yr−1; p<0.01) and decreases in RCP8.5 (−0.59 mm yr−1; p<0.01). This effect was more pronounced for low latitudes (−1.2 and −2.3 mm yr−1 for RCP4.5 and RCP8.5, respectively; p<0.01) compared to high latitudes where the rainfall tends to increase during the century (+0.26 and +0.1 mm yr−1 in RCP4.5 and RCP8.5, respectively, with respect to the historical period; p<0.5). This reduction in the cumulated precipitation will negatively affect the productivity with the climate change scenarios, as also confirmed by Hsu et al. (2012) for grasslands and by Olesen et al. (2011) for croplands.
Length of crop growing cycle. Apart from increases in temperature and reduction in precipitation, our simulation highlighted that crop yield is affected by the shortening of the length of the growing cycle, as confirmed by, for example, Bassu et al. (2014) and Tao and Zhang (2011). As detailed in our results, with a multi-model approach Bassu et al. (2014) predicted a general reduction in the growing cycle length for maize, especially in central Europe. A reduction from 6 to 22 d for maize cultivation in RCP4.5 and up to 8–29 d in RCP8.5 was also forecasted by de Souza et al. (2019) for Brazil conditions using DSSAT-CERES-Maize. Moreover, the consistent reduction in maize production observed with the climate scenarios in our study is most probably due to the shorter growing period (−8 to −22 d), characteristic of the spring crops. Concerning wheat, the magnitude of reduction in the length of growing cycle is consistent with the findings of Yang et al. (2019) for the Mediterranean area, who forecasted up to −26 d with the STICS model compared to −22 d of our simulations.
Our findings confirmed that climate change will have a regionally distributed impact (Howden et al., 2007; Challinor et al., 2014; Parry et al., 2005; Lobell and Tebaldi, 2014) even in the scenario that includes mitigation measures to offset climate change (RCP4.5), creating the opportunity to the design cropping systems with multiple crops in a year. Multiple cropping can represent a viable alternative in regions with long growing seasons and where water (rain or irrigation) and solar radiation are not limiting factors (Mueller et al., 2015; Waha et al., 2020), as well as where cardinal temperature requirements for crop and varieties are met. Furthermore, our study confirm that a certain number of actual crops and varieties could be cultivated in Europe, even in the worst climate projection. These crops could potentially yield higher production than today, especially at high latitudes, while an overall reduction in crop production is forecasted for low European latitudes.
Finally, the production levels of cropland and grasslands are in line with the available historical data (see Sect. 3.1.1) and the recent – albeit scarce – literature, making this study coherent and representative. Regarding the climatic projections, yields estimated with the DayCent model (Lugato et al., 2018) for the RCP4.5 scenario in the period 2015–2099 reported an average over Europe of 4.34 t DM ha−1 yr−1 (ranging from 3.69 to 4.90 t DM ha−1 yr−1), which is in line with our estimation of 4.49 t DM ha−1 yr−1 (ranging from 3.55 to 5.49 t DM ha−1 yr−1) predicted for the same period and climate projection. Assessing the effects of climate change in the European croplands and grasslands, our study can provide support for the identification of climate-smart practices. Among these, the modulation of crop sowing dates and the implementation of irrigation represent possible solutions in the short to medium term to prevent water stress (Lehmann et al., 2013).
Sowing date. Shifting sowing dates represents a promising adaptation to overcome yield drops (Olesen et al., 2012). Accordingly, our results showed that earlier sowing dates are expected for spring-sown crops under future climate scenarios compared to historical dates. Differences between historical and future sowing dates ranged from 0 to −5 d for both RCP4.5 and RCP8.5 scenarios approaching 2050, whereas at the 2100 horizon earlier sowing dates are predicted with differences of −5 and −7 d for RCP4.5 and RCP8.5, respectively. This evidence shows that climate change allows significantly more advanced sowing in Europe, as confirmed by the review of Tubiello and Rosenzweig (2008). For winter-sown crops, sowing dates are extended in a range from +5 to +9 d moving towards 2050 and to +13 d at the end of the century for RCP4.5. These increases were greater in RCP8.5, ranging from +7 to +13 d moving towards 2050 and reaching +19 d moving towards 2100. The extension of irrigation in all simulated crops in Europe had a negligible influence on the length of the crop cycles, as discussed by Minoli et al. (2019), despite an increasing demand of water over the course of the century.
Irrigation. Water demand has been shown to increase by +6 % during the first half of the century, to slightly decrease in the second half for RCP4.5 (−2 %) and to increase again for RCP8.5 (+23 %). These variations are in line with the results of the multi-model approach used by Wada et al. (2013) analysing the uncertainty in the response of different hydrological models over Europe. These authors showed a decrease in water demand for irrigation moving towards 2100 in Europe of <5 % for RCP4.5 and a rise of >20 % for RCP8.5. Furthermore, from our study we observed that water demand assumes a strong regional variation in Europe, with low latitudes needing 227 mm yr−1 on average over the historical period (mean 1985–2004), which is an order of magnitude higher than mid-latitudes (29 mm yr−1) and high latitudes (9 mm yr−1). These proportions between the latitudes remained unvaried over the course of the century, whereas middle and high latitudes displayed a +20 % increase in the evapotranspiration deficit approaching 2050 (mean 2030–2049) compared to the historical period, in both climate scenarios. This phenomenon observed for low latitudes is strictly related to climate perturbation (i.e. a strong increase in air temperature and reduction in rainfall), which increased crop water demand (Olesen et al., 2011). Furthermore, the increase in water demand even in middle and high latitudes confirms that irrigation needs to be supplied even for the crops that are now commonly rainfed (e.g. spring and winter soft wheat, spring barley, sunflowers, rapeseed). By 2100, the volumes of water needed for European croplands were largely reduced to below the quantities observed during the historical period, especially for low latitudes. These findings underline that even with high availability of irrigation water, the reduction in the crop growing cycle for the actual crop varieties – which sharpens towards the end of the century – is a more decisive factor to determine drops in crop yields. This is more evident for grain maize, the most water-demanding crop (Fig. 3), which needs an additional +35 mm yr−1 (average over Europe) to support production by 2050 compared to the historical period. Approaching 2100 water demand for grain maize remains identical to the historical period for RCP4.5, while it is increased (+25 mm yr−1) for RCP8.5. Conversely, water demand for winter soft wheat remained constant throughout the century for both RCP4.5 and RCP8.5 scenarios, whereas i_RCP4.5 and i_RCP8.5 scenarios confirmed an increasing water demand of about 50 mm (average over Europe; Fig. 3), as also confirmed by Yang et al. (2019) for the Mediterranean regions.
4.2 Effect of climate on N2O and CH4 emissions
N2O. The estimation and the projection of N2O emissions in the historical and the climate change scenarios improved upon previous studies over Europe. Lugato et al. (2017) estimated averaged emissions ranging from 1.18 to 2.63 kg N-N2O ha−1 yr−1 in the period 2010–2014 for both cropland and grassland production systems with the DayCent model. In comparison with Lugato et al. (2017), we found similar results for the Mediterranean latitudes (about 1 kg N-N2O ha−1 yr−1), while we predicted significantly lower emissions for central Europe (1.1 kg N-N2O ha−1 yr−1, this study), as well as at higher latitudes (0.96 kg N ha−1 yr−1, this study), compared to the 3 kg N-N2O ha−1 yr−1 forecasted by Lugato et al. (2017). Indeed, lower emissions at high latitudes were also observed by other studies (e.g. World Bank, 2021; Eurostat, 2017; Stehfest and Bouwman, 2006; Wells et al., 2018). Other research studies in the field were also within the range of our results; e.g. Reinds et al. (2012) estimated emissions ranging from 1.1 to 2.4 kg N-N2O ha−1 yr−1 for arable lands for the year 2000, and de Vries et al. (2011) estimated 0.27 and 0.38 Mt N-N2O yr−1 for fertilisers and manure and from grazing, respectively. Recently estimation by Eurostat (2017) reported values of 0.39 Mt N-N2O yr−1 (184.8 Tg CO2 eq.) for the year 2015 based on a lower-tier methodology, while our study reports a lower value equal to 0.17 Mt N-N2O yr−1 (80 Tg CO2 eq.) for the same year. Based on global inventories, Tian et al. (2020) reported emissions from European agriculture on the order of 0.51 Mt N-N2O yr−1 for the decade 2007–2016, which are significantly higher than those found in this present study (0.17 Mt N-N2O yr−1) for the same period. In addition, the estimation by Tian et al. (2020) also included manure management and aquaculture and suffers from high uncertainties given by the quality of the data and statistics used as input and, foremost, by the use of default emission factors. Regarding climate projection studies, Lugato et al. (2018) quantified N2O emissions for croplands in the RCP4.5 scenario, reporting losses of 1.81 and 1.77 kg N-N2O ha−1 yr−1 for the first and the second part of the century, respectively. These estimations were comparable to, although slightly higher than, the emissions for croplands issued from our study, both for the first part (1.53 ± 0.23 kg N ha−1 yr−1) and for the second part (1.66 ± 0.28 kg N ha−1 yr−1) of the century.
Our study highlighted that crop type is a significant determinant of the EFs of fertilisers, with most of the cereals having a low EF (barley, fodder maize, soft spring wheat and rapeseed; mean of 1.1 %) and pulses, soybean and potato a high one (mean EF of 3.1 %) during the 1985–2004 integration period. The highest EF for leguminous crops indicates that the management of fertilisation for these crops or for the rotation itself can be improved. Finally, information about crop-specific EFs turns out to be useful to design improved crop successions and to compile emission inventories (Myrgiotis et al., 2019). However, our results were higher than the 1 % default value defined by the IPCC guidelines for the N applied to agricultural soils, mainly because we considered only the N applied as fertiliser. Anyway, this default factor shows large uncertainties at local to regional scales due to the scarcely captured dependence on spatial diversity of the management, pedoclimatic, and soil physical and biochemical conditions (Leip et al., 2011; Reay et al., 2012; Shcherbak et al., 2014; Cayuela et al., 2017), which, however, are considered in our study. We observed that N2O emitted from croplands had a significant (p<0.05) and positive correlation with rainfall (r=0.47), as well as minimum and maximum air temperatures during the historical period (Fig. 12). The correlation with the minimum and maximum air temperatures increased significantly depending on the climatic scenarios (r>0.5 for RCP4.5, and r>0.9 for RCP8.5; Fig. 12), while the relation to rain became negative for RCP8.5 (). This trend inversion is probably connected to the strict dependency of N2O emissions on the length of the crop growing period rather than the yearly cumulated rainfall, which can occur outside of the cultivation period, as also stated by Shcherbak et al. (2014). Accordingly, the correlation from N2O and the irrigation amount, which occurs during the cultivation period, rose in the climate scenarios (r=0.23 and r=0.59 for RCP4.5 and RCP8.5, respectively). The rise in the projected temperature in the climate scenarios displays a latitudinal impact with N2O emissions, which is directly correlated at middle and high latitudes for croplands (r>0.5 for RCP4.5, and r>0.9 for RCP8.5) and at low latitudes for grasslands (r>0.45 for RCP8.5 and r>0.75 for RCP4.5). Precipitation in the mild climate has a direct influence on N2O emissions (r=0.25) at mid-latitudes for both production systems and also at high latitudes for croplands. Precipitation is anticorrelated with the N2O emissions in the RCP8.5 scenario at middle and high latitudes for croplands and at low latitudes for grasslands. Moreover, N2O emissions from cropland and grasslands were both positively correlated with soil clay content (r>0.5, p<0.01; data not reported) for values lower than 32 %, as higher clay content can promote complete denitrification (Weitz et al., 2001).
CH4. Methane emissions were mainly concentrated in the European regions with the highest density of grazing animals, as also observed by Vuichard et al. (2007). The values of the emissions simulated for the historical period (6.71 ± 0.4 kg C-CH4 ha−1 yr−1) were in the range of the experimental trials from central European grasslands (−2 to 108 kg C-CH4 ha−1 yr−1) discussed by Hörtnagl et al. (2018) and lower than the findings of Soussana et al. (2007), who reported typical emissions of 41 kg C-CH4 ha−1 yr−1 with animal densities comparable to our study. Our simulations were slightly lower than the simulations of Chang et al. (2015), which found emissions in a range of 18.7 ± 7.9 kg C-CH4 ha−1 yr−1 (period 1961–2010) over Europe with the ORCHIDEE-GM model, and lower than Vuichard et al. (2007) with an average of 108 kg C-CH4 ha−1 yr−1 (period 1994–2003) using the PaSim model but with a higher stocking rate. CH4 emissions decreased towards the end of the century, especially in the scenario RCP8.5 (−9 % compared to the historical period), due to reduced biomass productivity of grasslands that lessened the intake of animals (Fig. 2) and the stocking density, which declined to −8 % compared to RCP4.5 in the last decade of the century. Reduction in the stocking density was also foreseen by Chang et al. (2015). With regard to climatic changes, the rise in temperatures and the reduction in rainfall could directly act on reducing protein content and forage digestibility (process not simulated at the moment), possibly leading to reduced N2O losses from manure and urine in pastures. However, this mechanism could be offset by an increase in CH4 losses (Wilkinson and Lee, 2017).
Nitrogen use efficiency (NUE). We observed an increase in the NUE for the European croplands, especially for the mild climate change projection. In fact, compared to the historical period, in the RCP4.5 scenario there is a reduction in the correlation between N2O and the other N losses (NO3 and NH3) and crop yield (Fig. 12). At the same time, there is an intensification of dependence on the N dose. Indeed, with a constant amount of N applied in the rotations over the simulated years, both NO and NH3 losses were reduced over the century (data not reported) and crop yields increased until – at least – 2050. This indicates a potential increase in the NUE. Our findings were supported by the study of Kanter et al. (2016), who observed an increase in the NUE by 2050 related to the forecasted increasing yields. The improvement in NUE indicates a key factor to reduce negative environmental effects and mitigate GHG emissions (Maaz et al., 2021). UNEP (2013) indicated that NUE improvement could reduce N2O emissions by more than 30 % by 2050 in the RCP8.5 scenario. On the other hand, our results indicate that in the RCP8.5 scenario the correlation between N2O emissions and the N dose is lost, and a significant negative correlation (p<0.05) between yield and other nitrogen losses took place, indicating a reduction in NUE. This lack of a relationship is most probably connected to the interannual variability in N2O emissions in the strongest climate scenario and in the second part of the century. Higher NUE is typical of low latitudes in Europe, which benefit from generally higher yield and lower N losses compared to the middle and high latitudes (Sutton et al., 2011). Improving actual agronomic practices to increase crop yield or reduce reactive N losses has a direct and positive impact on the NUE (Lassaletta et al., 2014; Myrgiotis et al., 2019). In this context, irrigation represents a fundamental intensification practice to counteract the effects of climate change on crop production. In our case, the extension of the irrigation to all cropping systems in Europe significantly decreased N losses (−5 % for NO3 leaching and −4 % for NH3 emissions, on average, for both i_RCP4.5 and i_RCP8.5 scenarios) and contributed to increasing crop yields (Fig. 2), leading to a potential increase in NUE.
Regarding grasslands, we observed a weak relationship between N2O emissions and applied doses of N as fertiliser. This is mainly due to the calculation of the doses of N, which is a function of the specific animal load, the legume fraction, mowing events, and the available quantity of mineral and/or organics fertilisers for each simulation unit. During the historical period, N2O emissions were positively correlated with NO3 and NH3 losses and negatively correlated with production, representing a potentially low NUE. Moreover, N2O emissions in grassland are anticorrelated with CH4 emissions. CH4 emissions are rather positively related to biomass production and livestock intake. Therefore, poor biomass production could potentially lead to increased N2O emissions, due to low NUE, and thus decreased CH4 losses, due to low livestock intake. Surprisingly, N2O emissions in grasslands were weakly correlated with meteorological variables, especially minimum and maximum air temperatures, whereas a relation to rain and solar radiation is noticeable for RCP4.5 and is not evident for RCP8.5. As observed for croplands, the relation between N2O and NH3 emissions is positive, especially for the RCP8.5 scenario, indicating a potential reduction in the NUE.
4.3 Potential carbon stock
NEP. The NEP represents a simple indicator of carbon storage potential since it does not account for C removal in terms of yield, animal intake or crop residues. Our results concerning croplands confirmed a net potential storage of C during the historical period (−3403 ± 214 kg C-CO2 ha−1 yr−1) and are directly comparable with those of Kutsch et al. (2010), who observed fluxes of −2400 ± 1130 kg C-CO2 ha−1 yr−1 based on field measurements in multiple sites in Europe. During climate scenarios, a significant decline in C uptake was predicted for the northern cropping systems (British Isles, Scandinavian Peninsula) and the Mediterranean area. This is most probably due to the increase in soil heterotrophic respiration caused by climatic factors and to a potential reduction in NEP (Fig. S9), respectively, as also reported by Kirschbaum (1995). Further decreasing values of NEP (towards a carbon stock) are evident in central and north-eastern Europe, especially in the first part of the century. A substantial increase in NEP in croplands was predicted towards the end of the century for the RCP8.5 scenario. This increase is most probably related to low levels of heterotrophic respiration (i.e. microbial respiration due to decomposition processes of soil organic matter) associated with partial soil coverage (e.g. no cover crops) of the simulated crop successions, as reported by Emmel et al. (2018).
Lower average NEP values were observed in grassland systems compared to croplands. This is related to the continuous removal of biomass by grazers; the generally higher SOC content in the topsoil; long-term land use (Morais et al., 2019); and the higher heterotrophic respiration that characterises these soils, especially when extensively managed (Bahn et al., 2008). This evidence has also been described by Chang et al. (2015), who simulated an average of −570 ± 210 kg C-CO2 ha−1 yr−1 between 1961 and 2010 for Europe, slightly lower in absolute value than the mean value simulated by our study of −622 ± 62 kg C-CO2 ha−1 yr−1 in the historical period (Table 1).
In general, areas where the heterotrophic respiration is enhanced by climatic drivers or by a high amount of SOC would lead to lower NEP values (Chang et al., 2017). This is the case for the north-east of France and the British Isles, while for the Scandinavian Peninsula and north-east Europe, which are characterised by low C and low heterotrophic respiration, NEP reached higher values. These results underline that in view of expected increasing productivity by 2050, storing additional (new) carbon will be more challenging in areas with high SOC levels (Hassink and Whitmore, 1997), mainly due to high levels of heterotrophic respiration. Finally, grasslands remained a potential sink for C during the historical period, which is in line with experimental measurements performed in the last 2 decades, e.g. −2470 ± 670 kg C-CO2 ha−1 yr−1 reported by Soussana et al. (2007) and from −910 to −17 830 kg C-CO2 ha−1 yr−1 reported by Hörtnagl et al. (2018).
N2O emissions were able to offset (reduce) the C sequestration potential of croplands. Offsets were on the order of 5.4 % (184 kg C-CO2 ha−1 yr−1) for the historical period and the first part of the century and rose up to 6.1 % and 7.5 % in the second part of the century for RCP4.5 and RCP8.5, respectively. The extension of irrigation to all European arable lands reduced these gaps thanks to the increased values of NEP (offsets of 5.4 % and 7.1 % for i_ RCP4.5 and i_RCP8.5). Even though few data are available in the literature regarding the CO2 storage potential for croplands (Emmel et al., 2018), our results confirmed that croplands may act as a potential sink of C when C exports by harvest are neglected (Buysse et al., 2017; Ceschia et al., 2010). N2O and CH4 emissions in grassland systems were able to offset NEP during the historical period by 17 % and 1 %, respectively. These results are partially compatible with the studies reported by Soussana et al. (2010), who displayed offsets over Europe of 34 % and 10 % for N2O and CH4, respectively. During climate projections, offsets rise to 22 % for N2O and 1.2 % for CH4 moving towards 2050 for both RCP4.5 and RCP8.5. In the second part of the century N2O emissions offset the potential carbon sequestration by 26 % and 52 % for RCP4.5 and RCP8.5, respectively, while the offset potential of CH4 ranged between 1.2 % and 1.9 % for RCP4.5 and RCP8.5, respectively.
4.4 GHG emission budget
The NGB, calculated by subtracting the other non-gaseous C fluxes (i.e. exports by harvest and crop residues, imports by manure) from NGHGE, indicated that European agricultural surfaces are a net C source. The most important components that determined these losses were the C exports – yield (FC-harvest) and crop residues (FC-residues) – which varied proportionally to the NEP in the various climatic projections; i.e. the lower the NEP, the lower the yields. For both cropland and grasslands, CO2 storage potential (estimated from NEP) provided the largest term in the net greenhouse gas exchange (NGHGE), as also confirmed by Jones et al. (2016). Non-CO2 GHGs, despite being high especially in the RCP8.5 scenario towards the end of the century, have a minor impact on differentiating the two climatic scenarios, although they represent an important component in the overall carbon balance at the European scale (see Table 2). The values of NGB highlight that inputs of C into the system, such as organic fertilisers (two-thirds of the component FC-manure), or actions aimed to recycle a portion of biomass in the field, such as crop residue management, are essential to improve the overall C budget to move towards net storage, as also reported by Ceschia et al. (2010) and Buysse et al. (2017). Moreover, our findings show that the contribution of the exported crop residues corresponded roughly to the whole carbon deficit in Europe. Therefore, crop residue could play a key role in land-based mitigation of anthropogenic emissions, as also reported by Stella et al. (2019) and Haas et al. (2022). This is in line with the “4 per 1000” initiative (Rumpel et al., 2019) promoting the maintenance of soil fertility as a key to achieve GHG mitigation strategies. In addition to the spatial diversity observed in the European agricultural area, the achievement of this goal depends on the complexity of the rural, economic and political structure of the territories (Amundson and Biardeau, 2018). Local policies can be supported by simulation tools such as those used in this study, bearing in mind that their effectiveness can be affected by the omission of large variances given by varied characteristics of small extents (see Sect. 4.5). Finally, irrigation management extended to all European cropping land led to slightly higher C deficits because it is able to increase the stored C (NEP 3 %), but it also increases the removal of crop residues (FC-residues) and the emission of non-CO2 GHGs (up to +4 %).
4.5 Uncertainty, limitations and novelty
The extension of field-scale models to regional scales faces several challenges associated with the representation of the systems under study, which can affect the confidence of the model outputs (Challinor et al., 2014; Folberth et al., 2019).
Input data. The input requirement for dynamic crop and grassland models for large and heterogeneous areas is difficult to fulfil (Therond et al., 2011). While soil and climate inputs are directly available from European databases at different spatial resolutions, details on crop and grassland management (e.g. type and number of inputs, timing of operation, tillage system, crop varieties) are less readily available and represent an important source of uncertainty (Molina-Herrera et al., 2016). In our assessment we used a dataset for cropland constituted by statistical data of crop rotations resulting from a spatial distribution of crops at the NUTS2 scale and by crop succession likelihoods, on a high-resolution scale (1 km × 1 km). This dataset does not include details about intercropping, cover crops, management or crop growth parameters. The absence of plant phenological development data, for instance, is a relevant source of uncertainty in regional assessments (Minoli et al., 2019). This information defines crop growth and the length of the growing season, influencing biogeochemical cycles at different scales and becoming key for future projections. To deal with this lack of information, we calculated crop-specific sowing and fertilisation dates as a function of climate (Ramirez-Villegas et al., 2015), together with the uses of different crop varieties following a latitudinal gradient to fulfil the thermal unit need, N doses and the crop-specific residue management, aiming to reduce the uncertainty in input data (Hansen and Jones, 2000). Furthermore, the use of two different crop rotations per simulation unit attempted to cover a range of uncertainties existing below the spatial resolution of 0.25∘, which, however, cannot be assumed to be fully covered by the range of setups presented here. Another limitation of this and other regionalised studies is the deviation in the representation of the quantities within the administrative units, which is related to the scarcity of management data with a fine spatial resolution. For example, the amounts of fertiliser to be distributed in cropping systems which are provided at a regional level show little heterogeneity within the boundaries of the region itself and can mark a sharp transition between adjacent regions. Regarding model parameterisation, in the present work the CERES-EGC model used fixed parameters issued from a calibration over different sites in Europe (Lehuger et al., 2010, 2011; goodness of fit, R2 is 0.59 to 0.76 for NEP; error of prediction reduced by 6 %–40 % for N2O compared with the model's standard parameters). Grasslands, as previously reported, were simulated with a parameter set resulting from a multi-site calibration for a network of European grasslands (i.e. flux tower network; see Ma et al., 2015; goodness of fit, R2 is 0.4 to 0.9). Likewise, PaSim follows adaptive management based on climate. Since the information concerning the input data is already the result of a scaling process, an uncertainty analysis concerning the input data is not suitable here (Hansen and Jones, 2000).
Calibration of models. To fulfil the task of calibration over large areas, data representing the spatial and temporal variation in models' parameters are required. Although both models have been calibrated and verified with direct observations under various pedoclimatic and management conditions at the field scale, comprehensive studies aimed at calibrating these and other models with spatially extensive time series are still scarce (Balkovič et al., 2013; Lehuger et al., 2010; Lugato et al., 2010; Vuichard et al., 2007). Data aggregation over the same extent can be used to assess model representations, even if they do not represent the field-scale conditions for which the models have been originally calibrated (Lugato et al., 2017; Therond et al., 2011; van der Velde et al., 2009), exposing models to a broader range of conditions (e.g. weather and soil characteristics). Indeed, dealing with lacking and heterogeneous input data requires different procedures of downscaling and upscaling for the different data types, which potentially contribute to feeding the uncertainty in the representation. Consequently, projecting responses of regional models under future climate scenarios requires careful understanding of input and model uncertainty (Asseng et al., 2013; Challinor et al., 2009). This is the reason why the two periods of temporal aggregation considered in the present study, historical and climate scenarios, provide outcomes with different levels of confidence. In the historical period, results are obtained based on the spatial aggregation of real (statistical) data by means of models parameterised with current soil, climate and management conditions. The outcomes of the climate scenarios deal with the uncertainty related to the sensitivity of the model parameters and their algorithms to climate variables, which is expected to be different due to the diverging intensities of the two climate projections and the different conditions in the near and the long term (2100). For this reason, direct comparisons between the two aggregation periods should be made but with caution.
Model validation. Data quality and availability also prevent the validation of regional-scale models, even if the literature reports some effort (Challinor et al., 2009; Faivre et al., 2004; Niu et al., 2009). Comparing the model outputs with statistical data aggregated at the regional scale (production) allowed us to obtain indications about the magnitude of simulated variables at the same spatial extent. Furthermore, assessing the ranges of the model outputs, e.g. yield, with measured data and over Europe (R2=0.92, p<0.01, for croplands, Fig. S1; R2=0.68, p<0.05, for grasslands, Fig. 1), as well as other modelling interpretations (even if grounded on different approaches), contributed decidedly to increasing the reliability of our estimations.
The literature includes similar studies aiming to estimate crop and/or grassland production, GHG emissions, and carbon storage at the European scale. Lugato et al. (2014) created a database, based on EU statistics, of soil, climate and land use for grassland and cropland to simulate SOC with the CENTURY model, which worked at a monthly time step. This dataset was subsequently enhanced with the direct soil observation network over Europe (LUCAS – Land Use and Cover Area frame Survey) to estimate N2O emissions from cropland with the DayCent model, at a daily and long-term resolution (Lugato et al., 2017). Finally, these authors used an effective method of filling and scaling the simulated results by means of a meta-model, although adding a potential additional source of uncertainty. Regarding grasslands, Chang et al. (2015) used the ORCHIDEE-GM model (which contains the management equations derived from PaSim) to simulate the greenhouse gas balance in Europe, later extending their analysis with climate change scenarios (Chang et al., 2017). Blanke et al. (2018) improved the LPJ-GUESS global model to be applied to grasslands and to estimate the carbon and nitrogen balance with future climate scenarios. Compared to the studies mentioned above, our work combined two state-of-the-art models specific to the systems under study, producing both separate and joint results on croplands and grasslands. The novelty of this work is also based on the use of dynamic management with specific crop rotations, instead of exploring one crop or a few crops (e.g. Sansoulet et al., 2014; Yang et al., 2019), and the work was conducted at a finer spatial resolution than, for example, that of Vuichard et al. (2007) with the PaSim model or Leip et al. (2008) with DNDC and agrees with the resolution used by Chang et al. (2015) for grassland. Recent studies at an ever finer spatial scale have been proposed over France with the STICS model (Launay et al., 2021). Albeit aggregated in gridded simulation units, our work considered a variety of pedoclimatic conditions over Europe and is not based on an extrapolation of a few points or on a single European area (Ceschia et al., 2010; Kutsch et al., 2010; Myrgiotis et al., 2019; Soussana et al., 2010).
Finally, knowing and controlling the sources of uncertainty from regional applications could be a key to improving decision support tools for the design of policies. In this context, providing a range of possible outcomes, the application of multi-model ensemble (Ehrhardt et al., 2018; Martre et al., 2015; Sándor et al., 2018; Rosenzweig et al., 2013) at a regional scale could represent a valuable tool to tackle this source of uncertainty. Increasing the spatial resolution of the input dataset we used (e.g. weather and management data) could also represent a key to further reduce uncertainties from input data in future large-scale applications (Folberth et al., 2019; Hoffmann et al., 2016; Stella et al., 2019).
In this study we presented the combined spatial analysis of two specific models for crops and grassland to quantify the effects of climate change on European agricultural systems. Results clearly showed that production will be stable in the first half of the century, while a strong reduction will occur during the second half of the century, especially at low latitudes and mainly due to a reduction in the length of the growing cycle. Non-CO2 greenhouse gas emissions were triggered by rising temperatures, increasing significantly in the second part of the century. At the European scale, both grasslands and croplands are potential carbon sinks, although this potential is reduced by the negative effects of climate change on productivity. Biomass removal from the agricultural surfaces (yield, hay and animal intake), combined with the removal of crop residues, shifts the balance towards a net loss. In this framework, the introduction of carbon with fertilisers and dung was not able to counterbalance this removal of C, while the positive effect on the carbon stock offered by the return of crop residues needs to be further investigated, together with the potential shift in the net greenhouse gas balance. Our study highlighted that further carbon storage in areas already characterised by high SOC levels will be more challenging in the future. The extension of irrigation to all European croplands indicated a significant increase in water demand over the next few decades for most of the European croplands, whereas the benefit in terms of crop yield will not contribute substantially to filling the gap of carbon losses. Our findings show that productivity, GHG emissions and changes in the soil C stock have a heterogeneous spatial distribution over Europe. This underlines the need for targeted agricultural policies at the territorial scale aimed at avoiding the risk of significant reductions in productivity and mitigating the negative effects of climate change, foremost expected in the second half of the century. Accordingly, this transformational adaptation has to deal with socio-economic and political dynamics, as well as land suitability (Fischer et al., 2005; Chaudhary et al., 2018; Martin-Lopez et al., 2019). This work provides a database on cultivation and management of cropland and grassland at a detailed spatial level. Data can be improved to reduce uncertainty and increase the resolution and further exploited to test different management options, new or new combinations of agro-ecosystem models, climate projections, crop varieties, or floristic compositions to support future action to maintain or enhance agricultural sustainability.
The datasets generated and/or analysed during the current study are available from the corresponding author on reasonable request.
The supplement related to this article is available online at: https://doi.org/10.5194/bg-19-3021-2022-supplement.
Conceptualisation was by MC, RM, KK and RSM. Data curation was by MC and RM. Formal analysis was by MC and RM. Funding acquisition was by RM, KK and RSM. Investigation was by MC, RM, KK and RSM. Methodology was by MC, RM, KK, and RSM. Project administration was by MC, RM, KK and RSM. Software was by MC and RM. Validation was by MC, RM, KK and RSM. Visualisation was by MC. Writing – original draft preparation was by MC. Writing – review and editing was by MC, RM, KK and RSM.
The contact author has declared that neither they nor their co-authors have any competing interests.
Publisher’s note: Copernicus Publications remains neutral with regard to jurisdictional claims in published maps and institutional affiliations.
We would like to thank Benoït Gabrielle (INRAE), Gianni Bellocchi (INRAE) and Jean-Louis Drouet (INRAE), who provided valuable support to this work.
This research has been supported by FP7 Environment (ANIMALCHANGE – AN Integration of Mitigation and Adaptation options for sustainable Livestock production under climate CHANGE (grant no. 266018)), the FACCE ERA-GAS project ResidueGas and the ADEME project AEGES.
This paper was edited by Ivonne Trebs and reviewed by two anonymous referees.
Aguilera, E., Lassaletta, L., Sanz Cobeña, A., Garnier, J., and Vallejo Garcia, A.: The potential of organic fertilizers and water management to reduce N2O emissions in Mediterranean climate cropping systems, Agr. Ecosyst. Environ., 164, 32–52, https://doi.org/10.1016/j.agee.2012.09.006, 2013.
Ammann, C., Neftel, A., Jocher, M., Fuhrer, J., and Leifeld, J.: Effect of management and weather variations on the greenhouse gas budget of two grasslands during a 10-year experiment, Agr. Ecosyst. Environ., 292, 106814, https://doi.org/10.1016/j.agee.2019.106814, 2020.
Amundson, R. and Biardeau, L.: Opinion: Soil carbon sequestration is an elusive climate mitigation tool, P. Natl. Acad. Sci. USA, 115, 11652–11656, https://doi.org/10.1073/pnas.1815901115, 2018.
Asseng, S., Ewert, F., Martre, P., Rötter, R. P., Lobell, D. B., Cammarano, D., Kimball, B. A., Ottman, M. J., Wall, G. W., White, J. W., and Reynolds, M. P.: Rising temperatures reduce global wheat production, Nat. Clim. Change, 5, 143–147, https://doi.org/10.1038/nclimate2470, 2015.
Bahn, M., Rodeghiero, M., Anderson-Dunn, M., Dore, S., Gimeno, C., Drösler, M., Williams, M., Ammann, C., Berninger, F., Flechard, C., and Jones, S.: Soil respiration in European grasslands in relation to climate and assimilate supply, Ecosystems, 11, 1352–1367, https://doi.org/10.1007/s10021-008-9198-0, 2008.
Balkovič, J., van der Velde, M., Schmid, E., Skalský, R., Khabarov, N., Obersteiner, M, Stürmer, B., and Xiong, W.: Pan-European crop modelling with EPIC: implementation, up-scaling and regional crop yield validation, Agr. Syst., 120, 61–75, https://doi.org/10.1016/j.agsy.2013.05.008, 2013.
Bassu, S., Brisson, N., Durand, J.-L., Boote, K., Lizaso, J., Jones, J.W., Rosenzweig, C., Ruane, A. C., Adam, M., Baron, C., Basso, B., Biernath, C., Boogaard, H., Conijn, S., Corbeels, M., Deryng, D., De Sanctis, G., Gayler, S., Grassini, P., Hatfield, J.L., Hoek, S., Izaurralde, C., Jongschaap, R., Kemanian, A.R., Kersebaum, K.C., Kim, S.-H., Kumar, N.S., Makowski, D., Müller, C., Nendel, C., Priesack, E., Pravia, M.V., Sau, F., Shcherbak, I., Tao, F., Teixeira, E., Timlin, D., and Waha, K.: How do various maize crop models vary in their responses to climate change factors?, Glob. Change Biol., 20, 2301–2320, https://doi.org/10.1111/gcb.12520, 2014.
Blanke, J., Boke-Olén, N., Olin, S., Chang, J., Sahlin, U., Lindeskog, M., and Lehsten, V.: Implications of accounting for management intensity on carbon and nitrogen balances of European grasslands, PLoS One, 13, e0201058, https://doi.org/10.1371/journal.pone.0201058, 2018.
Brilli, L., Bechini, L., Bindi, M., Carozzi, M., Cavalli, D., Conant, R., Dorich, C. D., Doro, L., Ehrhardt, F., Farina, R., Ferrise, R., Fitton, N., Francaviglia, R., Grace, P., Iocola, I., Klumpp, K., Léonard, J., Martin, R., Massad, R. S., Recous, S., Seddaiu, G., Sharp, J., Smith, P., Smith, W. N., Soussana, J.-F., and Bellocchi, G.: Review and analysis of strengths and weaknesses of agro-ecosystem models for simulating C and N fluxes, Sci. Total Environ., 598, 445–470, https://doi.org/10.1016/j.scitotenv.2017.03.208, 2017.
Britz, W. and Witzke, H.: CAPRI Model Documentation 2008: Version 2, Institute for Food and Resource Economics, University of Bonn, Germany, http://www.capri-model.org/docs/capri_documentation.pdf (last access: last access: 17 June 2022), 2008.
Buysse, P., Bodson, B., Debacq, A., De Ligne, A., Heinesch, B., Manise, T., Moureaux, C., and Aubinet, M.: Carbon budget measurement over 12 years at a crop production site in the silty-loam region in Belgium, Agr. Forest Meteorol., 246, 241–255, https://doi.org/10.1016/j.agrformet.2017.07.004, 2017.
Calanca, P., Vuichard, N., Campbell, C., Viovy, N., Cozic, A., Fuhrer, J., and Soussana, J. F.: Simulating the fluxes of CO2 and N2O in European grasslands with the Pasture Simulation Model (PaSim), Agr. Ecosyst. Environ., 121, 164–174, https://doi.org/10.1016/j.agee.2006.12.010, 2007.
Cayuela, M. L., Aguilera, E., Sanz-Cobena, A., Adams, D.C., Abalos, D., Barton, L., Ryals, R., Silver, W. L., Alfaro, M. A., Pappa, V. A., Smith, P., Garnier, J., Billen, G., Bouwman, L., Bondeau, A., and Lassaletta, L.: Direct nitrous oxide emissions in Mediterranean climate cropping systems: emission factors based on a meta-analysis of available measurement data, Agr. Ecosyst. Environ., 238, 25–35, https://doi.org/10.1016/j.agee.2016.10.006, 2017.
Ceschia, E., Beziat, P., Dejoux, J. F., and Aubinet, M.: Management effects on net ecosystem carbon and GHG budgets at European crop sites, Agriculture, 139, 363–383 , 2010.
Chabbi, A., Lehmann, J., Ciais, P., Loescher, H. W., Cotrufo, M. F., Don, A., SanClements, M., Schipper, L., Six, J., Smith, P., and Rumpel, C.: Aligning agriculture and climate policy, Nat. Clim. Change, 7, 307–309, https://doi.org/10.1038/nclimate3286, 2017.
Challinor, A. J., Ewert, F., Arnold, S., Simelton, E., and Fraser, E.: Crops and climate change: progress, trends, and challenges in simulating impacts and informing adaptation, J. Exp. Bot., 60, 2775–2789, https://doi.org/10.1093/jxb/erp062, 2009.
Challinor, A. J., Watson, J., Lobell, D. B., Howden, S. M., Smith, D. R., and Chhetri, N.: A meta-analysis of crop yield under climate change and adaptation, Nat. Clim. Change, 4, 287–291, https://doi.org/10.1038/nclimate2153, 2014.
Chang J., Ciais P., Viovy N., Soussana J.-F., Klumpp K., and Sultan B.: Future productivity and phenology changes in European grasslands for different warming levels: Implications for grassland management and carbon balance, Carbon Balance Manag., 12, 1–21, https://doi.org/10.1186/s13021-017-0079-8, 2017.
Chang, J., Viovy, N., Vuichard, N., Ciais, P., Campioli, M., Klumpp, K., Martin, R., Leip, A., and Soussana, J.-F.: Modeled changes in potential grassland productivity and in grass-fed ruminant livestock density in Europe over 1961–2010, PLoS ONE, 10, e0127554, https://doi.org/10.1371/journal.pone.0127554, 2015.
Chaudhary, A., Gustafson, D., and Mathys, A.: Multi-indicator sustainability assessment of global food systems, Nat. Commun. 9, 848, https://doi.org/10.1038/s41467-018-03308-7, 2018.
Collins, W. J., Bellouin, N., Doutriaux-Boucher, M., Gedney, N., Halloran, P., Hinton, T., Hughes, J., Jones, C. D., Joshi, M., Liddicoat, S., Martin, G., O'Connor, F., Rae, J., Senior, C., Sitch, S., Totterdell, I., Wiltshire, A., and Woodward, S.: Development and evaluation of an Earth-System model – HadGEM2, Geosci. Model Dev., 4, 1051–1075, https://doi.org/10.5194/gmd-4-1051-2011, 2011.
Conant, R. T., Cerri, C. E. P., Osborne, B. B., and Paustian, K.: Grassland management impacts on soil carbon stocks: A new synthesis, Ecol. Appl., 27, 662–668, https://doi.org/10.1002/eap.1473, 2017.
Constantin, J., Raynal, H., Casellas, E., Hoffmann, H., Bindi, M., Doro, L., Eckersten, H., Gaiser, T., Grosz, B., Haas, E., Kersebaum, K.-C., Klatt, S., Kuhnert, M., Lewan, E., Maharjan, G.R., Moriondo, M., Nendel, C., Roggero, P.P., Specka, X., Trombi, G., Villa, A., Wang, E., Weihermüller, L., Yeluripati, J., Zhao, Z., Ewert, F., and Bergez, J.-E.: Management and spatial resolution effects on yield and water balance at regional scale in crop models, Agr. Forest Meteorol., 275, 184–195, https://doi.org/10.1016/j.agrformet.2019.05.013, 2019.
Cowan, N. J., Levy, P. E., Famulari, D., Anderson, M., Drewer, J., Carozzi, M., Reay, D. S., and Skiba, U. M.: The influence of tillage on N2O fluxes from an intensively managed grazed grassland in Scotland, Biogeosciences, 13, 4811–4821, https://doi.org/10.5194/bg-13-4811-2016, 2016.
De Antoni Migliorati, M., Bell, M., Grace, P. R., Scheer, C., Rowlings, D. W., and Liu, S.: Legume pastures can reduce N2O emissions intensity in subtropical cereal cropping systems, Agr. Ecosyst. Environ., 204, 27–39, https://doi.org/10.1016/j.agee.2015.02.007, 2015.
de Souza, T. T., Silva Antolin, S. L., Bianchini, V., Pereira, R., Moura Silva, E., and Marin, F.: Longer crop cycle lengths could offset the negative effects of climate change on Brazilian maize, Bragantia, 78, 622–631, https://doi.org/10.1590/1678-4499.20190085, 2019.
de Vries, W., Leip, A., Reinds, G. J., Kros, J., Lesschen, J. P., and Bouwman, A. F.: Comparison of land nitrogen budgets for European agriculture by various modeling approaches, Environ. Pollut., 159, 3254–3268, https://doi.org/10.1016/j.envpol.2011.03.038, 2011.
Del Grosso, S. J., Ojima, D. S., Parton, W. J., Stehfest, E., Heistemann, M., DeAngelo, B., and Rose, S.: Global scale DAYCENT model analysis of greenhouse gas emissions and mitigation strategies for cropped soils, Global Planet Change, 67, 44–50, https://doi.org/10.1016/j.gloplacha.2008.12.006, 2009.
Dono, G., Cortignani, R., Dell'Unto, D., Deligios, P., Doro, L., Lacetera, N., Mula, L., Pasqui, M., Quaresima, S., Vitali, A., and Roggero, P. P.: Winners and losers from climate change in agriculture: insights from a case study in the Mediterranean basin, Agr. Syst., 147, 65–75, https://doi.org/10.1016/j.agsy.2016.05.013, 2016.
Drouet J.-L., Capian N., Fiorelli J.-L., Blanfort V., Capitaine M., Duretz S., Gabrielle B., Martin R., Lardy R., Cellier P., and Soussana J.-F.: Sensitivity analysis for models of greenhouse gas emissions at farm level. Case study of N2O emissions simulated by the CERES-EGC model, Environ. Pollut., 159, 3156–3161, https://doi.org/10.1016/j.envpol.2011.01.019, 2011.
EC (European Commission): Communication from the commission to the European parliament, the council, the European economic and social committee and the committee of the regions Stepping up Europe's 2030 climate ambition Investing in a climate-neutral future for the benefit of our people, https://eur-lex.europa.eu/legal-content/EN/TXT/PDF/?uri=CELEX:52020DC0562&from=EN (last access: 17 June 2022), 2020.
EEA (European Environment Agency): Trends and projections in Europe 2020, Tracking progress towards Europe's climate and energy targets, https://www.eea.europa.eu//publications/trends-and-projections-in-europe-2020 (last access: 17 June 2022), 2020.
Ehrhardt, F., Soussana, J.-F., Bellocchi, G., Grace, P., McAuliffe, R., Recous, S., Sándor, R., Smith, P., Snow, de Antoni Migliorati, Basso, B., Bhatia, A., Brilli, L., Doltra, J., Dorich, C. D., Doro, L., Fitton, N., Giacomini, S. J., Grant, B., Harrison, M. T., Jones, S. K., Kirschbaum, M. U. F., Klumpp, K., Laville, P., Léonard, J., Liebig, M., Lieffering, Martin, R., Massad, R. S., Meier, E., Merbold, L., Moore, Myrgiotis, Newton, Pattey, Rolinski, S., Sharp, J., Smith, Wu, L., and Zhang, Q.: Assessing uncertainties in crop and pasture ensemble model simulations of productivity and N2O emissions, Glob. Change Biol., 24, e603-e616, https://doi.org/10.1111/gcb.13965, 2018.
Emmel, C., Winkler, A., Hörtnagl, L., Revill, A., Ammann, C., D'Odorico, P., Buchmann, N., and Eugster, W.: Integrated management of a Swiss cropland is not sufficient to preserve its soil carbon pool in the long term, Biogeosciences, 15, 5377–5393, https://doi.org/10.5194/bg-15-5377-2018, 2018.
Eurostat: Agri-environmental indicator – greenhouse gas emissions, https://ec.europa.eu/eurostat/ (last access: 7 September 2021), 2017.
Eurostat: European Statistical Office database, https://ec.europa.eu/eurostat/data/database (last access: 17 June 2022), 2019a.
Eurostat: European Statistical Office database, Share of irrigable and irrigated areas in utilised agricultural area (UAA) by NUTS 2 regions, http://appsso.eurostat.ec.europa.eu/nui/show.do?dataset=aei_ef_ir&lang=en (last access: 17 June 2022), 2019b.
Eurostat: Annual crop statistics handbook, 2020 Edn., https://ec.europa.eu/eurostat/cache/metadata/Annexes/apro_cp_esms_an1.pdf (last access: 17 June 2022), 2020.
Ewert, F., Van Ittersum, M. K., Heckelei, T., Therond, O., Bezlepkina, I., and Andersen, E.: Scale changes and model linking methods for integrated assessment of agri-environmental systems, Agr. Ecosyst. Environ., 142, 6–17, https://https://doi.org/10.1016/j.agee.2011.05.016, 2011.
Faivre, R., Leenhardt, D., Voltz, M., Benoit, M., Papy, F., Dedieu, G., and Wallach, D.: Spatialising crop models, Agronomie, 24, 205–217, https://doi.org/10.1051/agro:2004016, 2004.
FAOSTAT (Food and Agriculture Organization of the United Nations): FAOSTAT Database, Rome, Italy, https://www.fao.org/faostat/en/#home, last access: 17 June 2022.
Ferrara, R. M., Carozzi, M., Decuq, C., Loubet, B., Finco, A., Marzuoli, R., Gerosa, G., Di Tommasi, P., Magliulo, V., and Rana, G.: Ammonia, nitrous oxide, carbon dioxide, and water vapor fluxes after green manuring of faba bean under Mediterranean climate, Agr. Ecosyst. Environ., 315, 107439, https://doi.org/10.1016/j.agee.2021.107439, 2021.
Fischer, G., Shah, M., Tubiello, F. N., and von Velthuizen, H.: Socio-economic and climate change impacts on agriculture: An integrated assessment, 1990–2080, Philos. T. R. Soc. Lond. Ser. B, 360, 2067–2083, https://doi.org/10.1098/rstb.2005.1744, 2005.
Fitton, N., Alexander, P., Arnell, N., Bajzelj, B., Calvin, K., Doelman, J., Gerber, J. S., Havlik, P., Hasegawa, T., Herrero, M., Krisztin, T., van Meijl, H., Powell, T., Sands, R., Stehfest, E., West, P. C., and Smith, P.: The vulnerabilities of agricultural land and food production to future water scarcity, Glob. Environ. Change, 58, 101944, https://doi.org/10.1016/j.gloenvcha.2019.101944, 2019.
Folberth, C., Elliott, J., Müller, C., Balkovic, J., Chryssanthacopoulos, J., Izaurralde, R. C., Jones, C. D., Khabarov, N., Liu, W., Reddy, A., Schmid, E., Skalský, R., Yang, H., Arneth, A., Ciais, P., Deryng, D., Lawrence, P. J., Olin, S., Pugh, T. A. M., Ruane, A. C., and Wang, X.: Parameterization-induced uncertainties and impacts of crop management harmonization in a global gridded crop model ensemble, PLoS ONE, 14, e0221862, https://doi.org/0.1371/journal.pone.0221862, 2019.
Fuss, S., Jones, C. D., Kraxner, F., Peters, G. P., Smith, P., Tavoni, M., Van Vuuren, D. P., Canadell, J. G., Jackson, R. B., Milne, J., Moreira, J. R., Nakicenovic, N., Sharifi, A., and Yamagata, Y.: Research priorities for negative emissions, Environ. Res. Lett., 11, 115007, https://doi.org/10.1088/1748-9326/11/11/115007, 2016.
Gabrielle, B., Da-Silveira, J., Houot, S., and Michelin, J.: Field-scale modelling of carbon and nitrogen dynamics in soils amended with urban waste composts, Agr. Ecosyst. Environ., 110, 289e299, https://doi.org/10.1016/j.agee.2005.04.015, 2005.
Goglio, P., Colnenne-David, C., Laville, P., Doré, T., and Gabrielle, B.: 29 % N2O emission reduction from a modelled low-greenhouse gas cropping system during 2009–2011, Environ. Chem. Lett., 11, 143–149, https://doi.org/doi.org/10.1007/s10311-012-0389-8, 2013.
Gottschalk, P., Wattenbach, M., Neftel, A., Fuhrer, J., Jones, M., Lanigan, G., Davis, P., Campbell, C., Soussana, J.-F., and Smith, P.: The role of measurement uncertainties for the simulation of grassland net ecosystem exchange (NEE) in Europe, Agr. Ecosyst. Environ., 121, 175–185, https://doi.org/10.1016/j.agee.2006.12.026, 2007.
Haas, E., Carozzi, M., Massad, R. S, Scheer, C., and Butterbach-Bahl, K.: Testing the performance of CERES-EGC and LandscapeDNDC to simulate effects of residue management on soil N2O emissions, ResidueGas deliverable report 4.1, https://projects.au.dk/fileadmin/projects/residuegas/D_reports/ResidueGas_D4.1.pdf (last access: 17 June 2022), 2021.
Haas, E., Carozzi, M., Massad, R. S., Butterbach-Bahl, K., and Scheer, C.: Long term impact of residue management on soil organic carbon stocks and nitrous oxide emissions from European croplands, Sci. Total Environ., 154932, https://doi.org/10.1016/j.scitotenv.2022.154932, 2022.
Haas, E., Klatt, S., Fröhlich, A., Kraft, P., Werner, C., Kiese, R., Grote, R., Breuer, L., and Butterbach-Bahl, K.: LandscapeDNDC: A process model for simulation of biosphere-atmosphere-hydrosphere exchange processes at site and regional scale, Landscape Ecol., 28, 615–636, https://doi.org/10.1007/s10980-012-9772-x, 2013.
Hansen, J. W. and Jones, J. W.: Scaling-up crop models for climate variability applications, Agr. Syst., 65, 43–72, https://doi.org/10.1016/S0308-521X(00)00025-1, 2000.
Hassink, J. and Whitmore, A. P.: A Model of the Physical Protection of Organic Matter in Soils, Soil Sci. Soc. Am. J., 61, 131–139, https://doi.org/10.2136/sssaj1997.03615995006100010020x, 1997.
Hénault, C., Bizouard, F., Laville, P., Gabrielle, B., Nicoullaud, B., Germon, J. C., and Cellier, P.: Predicting in situ soil N2O emission using NOE algorithm and soil database, Glob. Change Biol., 11, 115–127, https://doi.org/10.1111/j.1365-2486.2004.00879.x, 2005.
Hiederer, R.: Mapping Soil Properties for Europe – Spatial Representation of Soil Database Attributes, Luxembourg, Publications Office of the European Union – 2013, 47 pp., EUR26082EN Scientific and Technical Research series, ISSN 1831–9424, https://doi.org/10.2788/94128, 2013.
Hoffmann, H., Zhao, G., Asseng, S., Bindi, M., Biernath, C., Constantin, J., Coucheney, E., Dechow, R., Doro, L., Eckersten, H., Gaiser, T., Grosz, B., Heinlein, F., Kassie, B., Kersebaum, K., Klein, C., Kuhnert, M., Lewan, E., Moriondo, M., Nendel, C., Priesack, E., Raynal, H., Roggero, P., Rötter, R., Siebert, S., Specka, X., Tao, F., Teixeira, E., Trombi, G., Wallach, D., Weihermüller, L., Yeluripati, J., and Ewert, F.: Impact of spatial soil and climate input data aggregation on regional yield simulations, PloS One, 11, e0151782, https://doi.org/10.1371/journal.pone.0151782, 2016.
Hörtnagl, L., Barthel, M., Buchmann, N., Eugster, W., Butterbach-Bahl, K., Díaz-Pinés, E., Zeeman, M., Klumpp, K., Kiese, R., Bahn, M., Hammerle, A., Lu, H., Ladreiter-Knauss, T., Burri, S., and Merbold, L.: Greenhouse gas fluxes over managed grasslands in Central Europe, Glob. Change Biol., 24, 1843–1872, https://doi.org/10.1111/gcb.14079, 2018.
Howden, S. M., Soussana, J.-F., Tubiello, F. N., Chhetri, N., Dunlop, M., and Meinke, H.: Adapting agriculture to climate change, P. Natl. Acad. Sci. USA, 104, 19691–19696, https://doi.org/10.1073/pnas.0701890104, 2007.
Hsu, J. S., Powell, J., and Adler, P. B.: Sensitivity of mean annual primary production to precipitation, Glob. Change Biol., 18, 2246–2255, https://doi.org/10.1111/j.1365-2486.2012.02687.x, 2012.
IPCC: Climate Change 2013: The Physical Science Basis, Contribution of Working Group I to the Fifth Assessment Report of the Intergovernmental Panel on Climate Change, edited by: Stocker, T. F., Qin, D., Plattner, G.-K., Tignor, M., Allen, S. K., Boschung, J., Nauels, A., Xia, Y., Bex, V., and Midgley, P. M., Cambridge University Press, Cambridge, United Kingdom and New York, NY, USA, 1535, https://doi.org/10.1017/CBO9781107415324, 2013.
IPCC: Global warming of 1.5 ∘C. An IPCC Special Report on the impacts of global warming of 1.5 ∘C above pre-industrial levels and related global greenhouse gas emission pathways, in the context of strengthening the global response to the threat of climate change, sustainable development, and efforts to eradicate poverty, edited by: Masson-Delmotte, V., Zhai, P., Pörtner, H. O., Roberts, D., Skea, J., Shukla, P. R., Pirani, A., Moufouma-Okia, W., Péan, C., Pidcock, R., Connors, S., Matthews, J. B. R., Chen, Y., Zhou, X., Gomis, M. I., Lonnoy, E., Maycock, T., Tignor, M., and Waterfield, T., Cambridge University Press, https://doi.org/10.1017/9781009157940, 2018.
Jones, C. A. and Kiniry, J. R.: CERES-Maize: A simulation model of maize growth and development, Texas A&M University Press, Temple, TX, USA, ISBN 08-909-62693, 1986.
Jones, C. D., Hughes, J. K., Bellouin, N., Hardiman, S. C., Jones, G. S., Knight, J., Liddicoat, S., O'Connor, F. M., Andres, R. J., Bell, C., Boo, K.-O., Bozzo, A., Butchart, N., Cadule, P., Corbin, K. D., Doutriaux-Boucher, M., Friedlingstein, P., Gornall, J., Gray, L., Halloran, P. R., Hurtt, G., Ingram, W. J., Lamarque, J.-F., Law, R. M., Meinshausen, M., Osprey, S., Palin, E. J., Parsons Chini, L., Raddatz, T., Sanderson, M. G., Sellar, A. A., Schurer, A., Valdes, P., Wood, N., Woodward, S., Yoshioka, M., and Zerroukat, M.: The HadGEM2-ES implementation of CMIP5 centennial simulations, Geosci. Model Dev., 4, 543–570, https://doi.org/10.5194/gmd-4-543-2011, 2011.
Jones, S. K., Helfter, C., Anderson, M., Coyle, M., Campbell, C., Famulari, D., Di Marco, C., van Dijk, N., Tang, Y. S., Topp, C. F. E., Kiese, R., Kindler, R., Siemens, J., Schrumpf, M., Kaiser, K., Nemitz, E., Levy, P. E., Rees, R. M., Sutton, M. A., and Skiba, U. M.: The nitrogen, carbon and greenhouse gas budget of a grazed, cut and fertilised temperate grassland, Biogeosciences, 14, 2069–2088, https://doi.org/10.5194/bg-14-2069-2017, 2016.
Kanter, D., Zhang, X., Mauzerall, D., Malyshev, S., and Shevliakova, E.: The importance of climate change and nitrogen use efficiency for future nitrous oxide emissions from agriculture, Environ. Res. Lett., 11, 094003, https://doi.org/10.1088/1748-9326/11/9/094003, 2016.
Kirschbaum, M. U. F.: The temperature dependence of soil organic matter decomposition, and the effect of global warming on soil organic C storage, Soil Biol. Biochem., 27, 753–760, https://doi.org/10.1016/0038-0717(94)00242-s, 1995.
Kutsch, W. L., Aubinet, M., Buchmann, N., Smith, P., Osborne, B., Eugster, W., Wattenbach, M., Schrumpf, M., Schulze, E. D., Tomelleri, E., Ceschia, E., Bernhofer, C., Beziat, P., Carrara, A., Di Tommasi, P., Grünwald, T., Jones, M., Magliulo, V., Marloie, O., Moureaux, C., Olioso, A., Sanz, M. J., Saunders, M., Søgaard, H., and Ziegler, W.: The net biome production of full crop rotations in Europe, Agr. Ecosyst. Environ., 139, 336–345, https://doi.org/10.1016/j.agee.2010.07.016, 2010.
Lassaletta, L., Billen, G., Grizzetti, B., Anglade J., and Garnier J.: 50 year trends in nitrogen use efficiency of world cropping systems: The relationship between yield and nitrogen input to cropland, Environ. Res. Lett., 9, 105011, https://doi.org/10.1088/1748-9326/9/10/105011, 2014.
Launay, C., Constantin, J., Chlebowski, F., Houot, S., Graux, A.I., Klumpp, K., Martin, R., Mary, B., Pellerin, S., and Therond, O. Estimating the carbon storage potential and greenhouse gas emissions of French arable cropland using high-resolution modeling, Glob. Change Biol., 27, 1645–1661, https://doi.org/10.1111/gcb.15512, 2021.
Lawton, D., Leahy, P., Kiely, G., Byrne, K., and Calanca, P.: Modeling of net ecosystem exchange and its components for a humid grassland ecosystem, J. Geophys. Res.-Biogeo., 111, G04013, https://doi.org/10.1029/2006JG000160, 2006.
Lehmann, N., Finger, R., Klein, T., Calanca, P., and Walter, A.: Adapting crop management practices to climate change: Modeling optimal solutions at the field scale, Agr. Syst., 117, 55–65, https://doi.org/10.1016/j.agsy.2012.12.011, 2013.
Lehuger, S., Gabrielle, B., Laville, P., Lamboni, M., Loubet, B., and Cellier, P.: Predicting and mitigating the net greenhouse gas emissions of crop rotations in Western Europe, Agr. Forest Meteorol., 151, 1654–1671, https://doi.org/10.1016/j.agrformet.2011.07.002, 2011.
Lehuger, S., Gabrielle, B., Oijen, M. Van, Makowski, D., Germon, J., Morvan, T., Hénault, C., Lehuger, S., Gabrielle, B., Oijen, M. Van, Makowski, D., and Germon, J.: Bayesian calibration of the nitrous oxide emission module of an agro-ecosystem model, Agr. Ecosyst. Environ., 133, 208–222, https://doi.org/10.1016/j.agee.2009.04.022, 2009.
Lehuger, S., Gabrielle, B., Cellier, P., Loubet, B., Roche, R., Béziat, P., Ceschia, E., and Wattenbach, M.: Predicting the net carbon exchanges of crop rotations in Europe with an agro-ecosystem model, Agr. Ecosyst. Environ., 139, 384–395, https://doi.org/10.1016/j.agee.2010.06.011, 2010.
Leip, A., Marchi, G., Koeble, R., Kempen, M., Britz, W., and Li, C.: Linking an economic model for European agriculture with a mechanistic model to estimate nitrogen and carbon losses from arable soils in Europe, Biogeosciences, 5, 73–94, https://doi.org/10.5194/bg-5-73-2008, 2008.
Leip, A., Britz, W., Weiss, F., and de Vries, W.: Farm, land, and soil nitrogen budgets for agriculture in Europe calculated with CAPRI, Environ. Pollut., 159, 3243–3253, https://doi.org/10.1016/j.envpol.2011.01.040, 2011.
Lesschen, J. P., van den Berg, M., Westhoek, H. J., Witzke, H. P., and Oenema, O.: Greenhouse gas emission profiles of European livestock sectors, Anim. Feed Sci. Technol., 166/167, 16–28, https://doi.org/10.1016/j.anifeedsci.2011.04.058, 2011.
Li, X., Sørensen, P., Olesen, J. E., and Petersen, S. O.: Evidence for denitrification as main source of N2O emission from residue-amended soil, Soil Biol. Biochem., 92, 153–160, https://doi.org/10.1016/j.soilbio.2015.10.008, 2016.
Lobell, D. B. and Tebaldi, C.: Getting caught with our plants down: The risks of a global crop yield slowdown from climate trends in the next two decades, Environ. Res. Lett., 9, 074003, https://doi.org/10.1088/1748-9326/9/7/074003, 2014.
Lugato, E., Zuliani, M., Alberti, G., Vedove, G. D., Gioli, B., Miglietta, F., and Peressotti, A.: Application of DNDC biogeochemistry model to estimate greenhouse gas emissions from Italian agricultural areas at high spatial resolution, Agr. Ecosyst. Environ., 139, 546–556, https://doi.org/10.1016/j.agee.2010.09.015, 2010.
Lugato, E., Bampa, F., Panagos, P., Montanarella, L., and Jones, A.: Potential carbon sequestration of European arable soils estimated by modelling a comprehensive set of management practices, Glob. Change Biol., 20, 3557–3567, https://doi.org/10.1111/gcb.12551, 2014.
Lugato, E., Paniagua, L., Jones, A., de Vries, W., and Leip, A.: Complementing the topsoil information of the Land Use/Land Cover Area Frame Survey (LUCAS) with modelled N2O emissions, PLoS ONE, 12, e0176111, https://doi.org/10.1371/journal.pone.0176111, 2017.
Lugato, E., Leip, A., and Jones, A.: Mitigation potential of soil carbon management overestimated by neglecting N2O emissions, Nat. Clim. Change, 8, 219–223, https://doi.org/10.1038/s41558-018-0087-z, 2018.
Ma, S., Lardy, R., Graux, A.-I., Ben Touhami, H., Klumpp, K., Martin, R., and Bellocchi, G.: Regional-scale analysis of carbon and water cycles on managed grassland systems, Environ. Modell. Softw., 72, 356–371, https://doi.org/10.1016/j.envsoft.2015.03.007, 2015.
Maaz, T. M., Sapkota, T. B., Eagle, A. J., Kantar, M. B., Bruulsema, T. W., and Majumdar, K.: Meta-analysis of yield and nitrous oxide outcomes for nitrogen management in agriculture, Glob. Change Biol., 27, 2343–2360, https://https://doi.org/10.1111/gcb.15588, 2021.
Martínez-López J., Bagstad K.J., Balbi S., Magrach A., Voigt B., Athanasiadis I., Pascual M., Willcock S., and Villa F.: Towards globally customizable ecosystem service models, Sci. Total Environ., 650, 2325–2336, https://doi.org/10.1016/j.scitotenv.2018.09.371, 2019.
Martre, P., Wallach, D., Asseng, S., Ewert, F., Jones, J. W., Rötter, R. P., Boote, K. J., Ruane, A. C., Thorburn, P. J., Cammarano, D., and Hatfield, J. L.: Multimodel ensembles of wheat growth: many models are better than one, Glob. Change Biol., 21, 911–925, https://doi.org/10.1111/gcb.12768, 2015.
Metzger, M. J., Bunce, R. G. H., Jongman, R. H. G., Mücher, C. A., and Watkins, J. W.: A climatic stratification of the environment of Europe, Glob. Ecol. Biogeogr., 14, 549–563, https://doi.org/10.1111/j.1466-822X.2005.00190.x, 2005.
Minasny, B., Malone, B. P., McBratney, A. B., Angers, D. A., Arrouays, D., Chambers, A., Chaplot, V., Chen, Z.-S., Cheng, K., Das, B. S., Field, D. J., Gimona, A., Hedley, C. B., Hong, S. Y., Mandal, B., Marchant, B. P., Martin, M., McConkey, B. G., Mulder, V. L., O'Rourke, S., Richer-de-Forges, A. C., Odeh, I., Padarian, J., Paustian, K., Pan, G., Poggio, L., Savin, I., Stolbovoy, V., Stockmann, U., Sulaeman, Y., Tsui, C.-C., Vågen, T.-G., van Wesemael, B., and Winowiecki, L.: Soil carbon 4 per mille, Geoderma, 292, 59–86, https://doi.org/10.1016/j.geoderma.2017.01.002, 2017.
Minoli, S., Müller, C., Elliott, J., Ruane, A.C., Jägermeyr, J., Zabel, F., Dury, M., Folberth, C., François, L., Hank, T. B., Jacquemin, I., Liu, W., Olin, S., and Pugh, T. A.: Global response patterns of major rainfed crops to adaptation by maintaining current growing periods and irrigation, Earth's Future, 7, 1464–80, https://doi.org/10.1029/2018EF001130, 2019.
Molina, J. A. E., Clapp, C. E., Shaffer, M. J., Chichester, F. W., and Larson, W. E.: NCSOIL, a model of nitrogen and carbon transformations in soil: description, calibration, and behavior, Soil Sci. Soc. Am. J., 47, 85–91, https://doi.org/10.2136/sssaj1983.03615995004700010017x, 1983.
Molina-Herrera, S., Haas, E., Klatt, S., Kraus, D., Augustin, J., Magliulo, V., Tallec, T., Ceschia, E., Ammann, C., Loubet, B., Skiba, U., Jones, S., Brümmer, C., Butterbach-Bahl, K., and Kiese, R.: A modeling study on mitigation of N2O emissions and NO3 leaching at different agricultural sites across Europe using LandscapeDNDC, Sci. Total Environ., 553, 128–140, https://doi.org/10.1016/j.scitotenv.2015.12.099, 2016.
Morais, T. G., Teixeira, R. F., and Domingos, T.: Detailed global modelling of soil organic carbon in cropland, grassland and forest soils, PLoS ONE, 14, e0222604, https://doi.org/10.1371/journal.pone.0222604, 2019.
Mueller, B., Hauser, M., Iles, C., Rimi, R. H., Zwiers, F. W., and Wan, H.: Lengthening of the growing season in wheat and maize producing regions, Weather Clim. Extrem., 9, 47–56, https://doi.org/10.1016/j.wace.2015.04.001, 2015.
Myrgiotis, V., Williams, M., Rees, R. M., and Topp, C. F. E.: Estimating the soil N2O emission intensity of croplands in northwest Europe, Biogeosciences, 16, 1641–1655, https://doi.org/10.5194/bg-16-1641-2019, 2019.
Nicolardot, B., Molina, J. A. E., and Allard, M. R.: C and N fluxes between pools of soil organic matter: model calibration with long-term incubation data, Soil Biol. Biochem., 26, 235–243, https://doi.org/10.1016/0038-0717(94)90163-5, 1994.
Niu, X., Easterling, W., Hays, C. J., Jacobs, A., and Mearns, L.: Reliability and input-data induced uncertainty of EPIC model to estimate climate change impact on sorghum yields in the U.S, Great Plains, Agr. Ecosyst. Environ., 129, 268–276, https://doi.org/10.1016/j.agee.2008.09.012, 2009.
Olesen, J. E.: Climate change impacts on society: Section 5.3, Agriculture, in: Climate change, impacts and vulnerability in Europe 2016: An indicator-based report, European Environment Agency, 1, 223–244, 2017.
Olesen, J. E. and Bindi, M.: Consequences of climate change for European agricultural productivity, land use and policy, Eur. J. Agron., 16, 239–262, https://doi.org/10.1016/S1161-0301(02)00004-7, 2002.
Olesen, J. E., Trnka, M., Kersebaum, K. C., Skjelvåg, A. O., Seguin, B., Peltonen-Sainio, P., Rossi, F., Kozyra, J., and Micale, F.: Impacts and adaptation of European crop production systems to climate change, Eur. J. Agron., 34, 96–112, https://doi.org/10.1016/j.eja.2010.11.003, 2011.
Olesen, J. E., Børgesen, C. D., Elsgaard, L., Palosuo, T., Rötter, R. P., Skjelvåg, A. O., Peltonen-Sainio, P., Börjesson, T., Trnka, M., Ewert, F., Siebert, S., Brisson, N., Eitzinger, J., van Asselt, E. D., Oberforster, M., and van der Fels-Klerx, H. J.: Changes in time of sowing, flowering and maturity of cereals in Europe under climate change, Food Addit. Conta.m Pt. A, 29, 1527–1542, https://doi.org/10.1080/19440049.2012.712060, 2012.
Parry, M., Rosenzweig, C., and Livermore, M.: Climate change, global food supply and risk of hunger, Philos. T. R. Soc. B, 360, 2125–2138, https://doi.org/10.1098/rstb.2005.1751, 2005.
Parton, W. J., Schimel, D. S., Ojima, D. S., and Cole, C. V.: A general model for soil organic matter dynamics: sensitivity to litter chemistry, texture and management, in: Quantitative modeling of soil farming processes, edited by: Bryant, R. B. and Arnold, R. W., SSSA Special Publication 39, ASA, CSSA, and SSA, Madison, Wisconsin, USA, 147–167, https://doi.org/10.2136/sssaspecpub39.c9, 1994.
Ramirez-Villegas, J., Watson, J., and Challinor, A. J.: Identifying traits for genotypic adaptation using crop models, J. Exp. Bot., 66, 3451–3462, https://doi.org/10.1093/jxb/erv014, 2015.
Reay, D. S., Davidson, E. A., Smith, K. A., Smith, P., Melillo, J. M., Dentener, F., and Crutzen, P. J.: Global agriculture and nitrous oxide emissions, Nat. Clim. Change, 2, 410–416, https://doi.org/10.1038/NCLIMATE1458, 2012.
Reinds, G. J., Heuvelink, G. B. M., Hoogland, T., Kros, J., and de Vries, W.: Estimating nitrogen fluxes at the European scale by upscaling INTEGRATOR model outputs from selected sites, Biogeosciences, 9, 4527–4536, https://doi.org/10.5194/bg-9-4527-2012, 2012.
Reuter, H. I, Rodriguez Lado, L., Hengl, T., and Montanarella, L.: Continental Scale Digital Soil Mapping using European Soil Profile Data: soil pH, in: SAGA – Seconds Out, edited by: Böhner, J., Blaschke, T., and Montanarella, L., Hamburger Beiträge zur Physischen Geographie und Landschaftsökologie, Heft 19, Universität Hamburg, Institut für Geographie, https://esdac.jrc.ec.europa.eu/public_path/shared_folder/dataset/10_soil_ph/soil_ph_in_europe_hbpl19_10.pdf (last access: 17 June 2022), 2008.
Riedo, M., Grub, A., Rosset, M., and Fuhrer, J. A.: Pasture Simulation model for dry matter production, and fluxes of carbon, nitrogen, water and energy, Ecol. Model., 105, 141–183, https://doi.org/10.1016/S0304-3800(97)00110-5, 1998.
Rolland, M.-N., Gabrielle, B., Laville, P., Serça, D., Cortinovis, J., Larmanou, E., Lehuger, S., and Cellier, P. Modeling of nitric oxide emissions from temperate agricultural soils, Nutr. Cycl. Agroecosyst., 80, 75–93, https://doi.org/10.1007/s10705-007-9122-6, 2008.
Rosenzweig C., Jones J. W., Hatfield J. L., Ruane A. C., Boote K. J., Thorburn P., Antle J. M., Nelson G. C., Porter C., Janssen S., Asseng S., Basso B., Ewert F., Wallach D., Baigorria G., and Winter J. M.: The Agricultural Model Intercomparison and Improvement Project (AgMIP): Protocols and pilot studies, Agr. Forest Meteorol., 170, 166–172, https://doi.org/10.1016/j.agrformet.2012.09.011, 2013.
Rumpel, C., Amiraslani, F., Chenu, C., Garcia Cardenas, M., Kaonga, M., Koutika, L. S., Ladha, J., Madari, B., Shirato, Y., Smith, P., Soudi, B., Soussana, J.-F., Whitehead, D., and Wollenberg, E.: The 4p1000 initiative: Opportunities, limitations and challenges for implementing soil organic carbon sequestration as a sustainable development strategy, Ambio, 1–11, https://doi.org/10.1007/s13280-019-01165-2, 2019.
Sacks, W. J., Deryng, D., Foley, J. A., and Ramankutty, N.: Crop planting dates: An analysis of global patterns, Glob. Ecol. Biogeogr., 19, 607–620, https://doi.org/10.1111/j.1466-8238.2010.00551.x, 2010.
Sándor, R., Barcza, Z., Hidy, D., Lellei-Kovács, E., Ma, S., and Bellocchi, G.: Modelling of grassland fluxes in Europe: Evaluation of two biogeochemical models, Agr. Ecosyst. Environ., 215, 1–19, https://doi.org/10.1016/j.agee.2015.09.001, 2016.
Sándor, R., Ehrhardt, F., Brilli, L., Carozzi, M., Recous, S., Smith, P., Snow, V., Soussana, J.-F., Dorich, C. D., Fuchs, K., Fitton, N., Gongadze, K., Klumpp, K., Liebig, M., Martin, R., Merbold, L., Newton, P. C. D., Rees, R. M., Rolinski, S., and Bellocchi, G.: The use of biogeochemical models to evaluate mitigation of greenhouse gas emissions from managed grasslands, Sci. Total Environ., 642, 292–306, https://doi.org/10.1016/j.scitotenv.2018.06.020, 2018.
Sansoulet, J., Pattey, E., Kröbel, R., Grant, B., Smith, W., Jégo, G., Desjardins, R. L., Tremblay, N., and Tremblay, G.: Comparing the performance of the STICS, DNDC, and DayCent models for predicting N uptake and biomass of spring wheat in Eastern Canada, Field Crops Res., 156, 135–150, https://doi.org/10.1016/j.fcr.2013.11.010, 2014.
Scarlat, N., Fahl, F., Lugato, E., Monforti, F., and Dallemand, J.: Integrated and spatially explicit assessment of sustainable crop residues potential in Europe, Biomass Bioenerg., 122, 257–269, https://doi.org/10.1016/j.biombioe.2019.01.021, 2019.
Schmid, M., Neftel, A., Riedo, M., and Fuhrer, J.: Process-based modelling of nitrous oxide emissions from different nitrogen sources in mown grassland, Nutr. Cycl. Agroecosyst., 60, 177–187, https://doi.org/10.1023/A:1012694218748, 2001.
Shcherbak, I., Millar, N., and Robertson, G.P.: Global metaanalysis of the nonlinear response of soil nitrous oxide (N2O) emissions to fertilizer nitrogen, P. Natl. Acad. Sci. USA, 111, 9199–9204, https://doi.org/10.1073/pnas.1322434111, 2014.
Smit, H. J., Metzger, M. J., and Ewert, F.: Spatial distribution of grassland productivity and land use in Europe, Agr. Syst., 98, 208–219, https://doi.org/10.1016/j.agsy.2008.07.004, 2008.
Smith, P.: Agricultural greenhouse gas mitigation potential globally, in: Europe and in the UK: what have we learnt in the last 20 years?, Glob. Change Biol., 18, 35–43, https://doi.org/10.1111/j.1365-2486.2011.02517.x, 2012.
Smith, P.: Soil carbon sequestration and biochar as negative emission technologies, Glob. Change Biol., 22, 1315–1324, https://doi.org/10.1111/gcb.13178, 2016.
Smith, P., Martino, D., Cai, Z., Gwary, D., Janzen, H. H., Kumar, P., McCarl, B., Ogle, S., O'Mara, F., Rice, C., Scholes, R. J., Sirotenko, O., Howden, M., McAllister, T., Pan, G., Romanenkov, V., Schneider, U., Towprayoon, S., Wattenbach, M., and Smith, J. U.: Greenhouse gas mitigation in agriculture, Philos. T. R. Soc. Lond. Ser. B, 27, 89–813, https://doi.org/10.1098/rstb.2007.2184, 2008.
Smith, P., Heberl, H., Popp, A., Erb, K.-H., Lauk, C., Harper, R., Tubiello, F., De Pinto, A., Jafari, M., Sohi, S., Masera, O., Bottcher, H., Berndes, G., Bustamante, M., Ahammad, H., Clark, H., Dong, H., Elsiddig, E., Mbow, C., Ravindranath, N., Rice, C., Abad, C., Romanovskaya, A., Sperling, F., Herrero, M., House, J., and Rose, S.: How much land based greenhouse gas mitigation can be achieved without compromising food security and environmental goals?, Glob. Change Biol., 19, 2285–2302, https://doi.org/10.1111/gcb.12160, 2013.
Soussana, J.-F., Tallec, T., and Blanfort, V.: Mitigating the greenhouse gas balance of ruminant production systems through carbon sequestration in grasslands, Animal, 4, 334–350, https://doi.org/10.1017/S1751731109990784, 2010.
Soussana, J. F., Allard, V., Pilegaard, K., Ambus, C., Campbell, C., Ceschia, E., Clifton-Brown, J., Czobel, S., Domingues, R., Flechard, C., Fuhrer, J., Hensen, A., Horvath, L., Jones, M., Kasper, G., Martin, C., Nagy, Z., Neftel, A., Raschi, A., Baronti, S., Rees, R.M., Skiba, U., Stefani, P., Manca, G., Sutton, M., Tuba, Z., and Valentini, R.: Full accounting of the greenhouse gas (CO2, N2O, CH4) budget of nine European grassland sites, Agr. Ecosyst. Environ., 121, 121–134, https://doi.org/10.1016/j.agee.2006.12.022, 2007.
Stagge, J. H., Kingston, D. G., Tallaksen, L. M., and Hannah, D. M.: Observed drought indices show increasing divergence across Europe. Sci. Rep., 7, 14045. https://doi.org/10.1038/s41598-017-14283-2, 2017.
Steduto, P., Hsiao, T. C., Fereres, E., and Raes, D.: Crop Yield Response to Water, Irrigation and Drainage Paper 66, United Nations FAO, Rome, ISBN 978-92-5-107274-5, 2012.
Stehfest, E. and Bouwman, L.: N2O and NO emission from agricultural fields and soils under natural vegetation: summarizing available measurement data and modeling of global annual emissions, Nutr. Cycl. Agroecosyst., 74, 207–228, https://doi.org/10.1007/s10705-006-9000-7, 2006.
Stella, T., Mouratiadou, I., Gaiser, T., Berg-Mohnicke, M., Wallor, E., Ewert, F., and Nendel, C.: Estimating the contribution of crop residues to soil organic carbon conservation, Environ. Res. Lett., 14, 094008, https://doi.org/10.1088/1748-9326/ab395c, 2019.
Sutton, M., Billen, G., Bleeker, A., Erisman, J. W., Grennfelt, P., Grinsven, H., Grizzetti, B., Howard, C., and Leip, A.: The European Nitrogen Assessment: Sources, Effects and Policy Perspectives, Cambridge University Press, https://doi.org/10.1017/CBO9780511976988, 2011.
Tao, F. and Zhang, Z.: Impacts of climate change as a function of global mean temperature: maize productivity and water use in China, Climatic Change, 105, 409–432, https://doi.org/10.1007/s10584-010-9883-9, 2011.
Therond, O., Hengsdijk, H., Casellas, E., Wallach, D., Adam, M., Belhouchette, H., Oomen, R., Russell, G., Ewert, F., Bergez, J. E., and Janssen, S.: Using a cropping system model at regional scale: Low-data approaches for crop management information and model calibration, Agr. Ecosyst. Environ., 142, 85–94, https://doi.org/10.1016/j.agee.2010.05.007, 2011.
Tian, H., Xu, R., Canadell, J. G., Thompson, R. L., Winiwarter, W., Suntharalingam, P., Davidson, E. A., Ciais, P., Jackson, R. B., Janssens-Maenhout, G., Prather, M. J., Regnier, P., Pan, N., Pan, S., Peters, G. P., Shi, H., Tubiello, F. N., Zaehle, S., Zhou, F., Arneth, A., Battaglia, G., Berthet, S., Bopp, L., Bouwman, A. F., Buitenhuis, E. T., Chang, J., Chipperfield, M. P., Dangal, S. R. S., Dlugokencky, E., Elkins, J. W., Eyre, B. D., Fu, B., Hall, B., Ito, A., Joos, F., Krummel, P. B., Landolfi, A., Laruelle, G. G., Lauerwald, R., Li, W., Lienert, S., Maavara, T., MacLeod, M., Millet, D. B., Olin, S., Patra, P. K., Prinn, R. G., Raymond, P. A., Ruiz, D. J., van der Werf, G. R., Vuichard, N., Wang, J., Weiss, R. F., Wells, K. C., Wilson, C., Yang, J., and Yao, Y.: A comprehensive quantification of global nitrous oxide sources and sinks, Nature, 586, 248–256, https://doi.org/10.1038/s41586-020-2780-0, 2020.
Tubiello, F. N., Soussana, J. F., Howden, M., and Easterling, W.: Crop and pasture responses to climate change: fundamental processes, P. Natl. Acad. Sci. USA., 104, 19686–19690, https://doi.org/10.1073/pnas.0701728104, 2007.
Tubiello, F. N. and Rosenzweig, C.: Developing climate change impact metrics for agriculture, Integrat. Assess. J., 8, 165–184, 2008.
Turral, H., Burke, J., and Faurès, J.-M.: Climate change, water and food security, FAO Water Reports, 36, FAO, Rome, ISBN 978-9-25106-7-956, 2011.
UNEP: Drawing Down N2O to Protect Climate and the Ozone Layer. A UNEP Synthesis Report, United Nations Environment Programme (UNEP), Nairobi, Kenya, ISBN 978-92-807-3358-7, 2013.
USDA: Major World Crop Areas and Climatic Profiles. World Agricultural Outlook Board, U.S. Department of Agriculture, Agricultural Handbook No. 664, https://naldc.nal.usda.gov/download/CAT88895275/PDF (last access: 17 June 2022), 1994.
van der Velde, M., Bouraoui, F., and Aloe, A.: Pan-European regional-scale modelling ofwater and N efficiencies of rapeseed cultivation for biodiesel production, Glob. Change Biol., 15, 24–37, https://doi.org/10.1111/j.1365-2486.2008.01706.x, 2009.
Van Oijen, M., Balkovi, J., Beer, C., Cameron, D.R., Ciais, P., Cramer, W., Kato, T., Kuhnert, M., Martin, R., Myneni, R., and Rammig, A.: Impact of droughts on the carbon cycle in European vegetation: a probabilistic risk analysis using six vegetation models, Biogeosciences, 11, 6357–6375, https://doi.org/10.5194/bg-11-6357-2014, 2014.
Voglmeier, K., Six, J., Jocher, M., and Ammann, C.: Grazing-related nitrous oxide emissions: From patch scale to field scale, Biogeosciences, 16, 1685–1703, https://doi.org/10.5194/bg-16-1685-2019, 2019.
Vuichard, N., Ciais, P., Viovy, N., Calanca, P., and Soussana, J.-F.: Estimating the greenhouse gas fluxes of European grasslands with a process-based model: 2. Simulations at the continental level, Global Biogeochem. Cy., 21, GB1005, https://doi.org/10.1029/2005gb002612, 2007.
Wada, Y., Wisser, D., Eisner, S., Flörke, M., Gerten, D., Haddeland, I., Hanasaki, N., Masaki, Y., Portmann, F. T., Stacke, T., Tessler, Z., and Schewe, J.: Multimodel projections and uncertainties of irrigation water demand under climate change, Geophys. Res. Lett., 40, 4626–4632, https://doi.org/10.1002/grl.50686, 2013.
Waha, K., Dietrich, J. P., Portmann, F. T., Siebert, S., Thornton, P. K., Bondeau, A., and Herrero, M.: Multiple cropping systems of the world and the potential for increasing cropping intensity, Glob. Environ. Change, 64, 102131, https://doi.org/10.1016/j.gloenvcha.2020.102131, 2020.
Warszawski, L., Frieler, K., Huber, V., Piontek, F., Serdeczny, O., and Schewe, J.: The Inter-Sectoral Impact Model Intercomparison Project (ISI-MIP): project framework, P. Natl. Acad. Sci. USA, 111, 3228–3232, https://doi.org/10.1073/pnas.1312330110, 2014.
Wattenbach, M., Sus, O., Vuichard, N., Lehuger, S., Gottschalk, P., Li, L., Leip, A., Williams, M., Tomelleri, E., Kutsch, W. L., Buchmann, N., Eugster, W., Dietiker, D., Aubinet, M., Ceschia, E., Béziat, P., Grünwald, T., Hastings, A., Osborne, B., Ciais, P., Celier, P., and Smith, P.: The carbon balance of European croplands: A cross-site comparison of simulation models, Agr. Ecosyst. Environ., 139, 419–453, https://doi.org/10.1016/j.agee.2010.08.004, 2010.
Wattenbach, M., Lüdtke, S., Redweik, R., Van Oijen, M., Balkovic, J., and Reinds, G.: A generic probability based model to derive regional patterns of crops in time and space, Geophys. Res. Abstr., EGU2015–13153, EGU General Assembly 2015, Vienna, Austria, 2015.
Weitz, A. M., Linder, E., Frolking, S., Crill, P. M., and Keller, M.: N2O emissions from humid tropical agricultural soils: Effects of soil moisture, texture and nitrogen availability, Soil Biol. Biochem., 33, 1077–1093, https://doi.org/10.1016/S0038-0717(01)00013-X, 2001.
Wells, K. C., Millet, D. B., Bousserez, N., Henze, D. K., Griffis, T. J., Chaliyakunnel, S., Dlugokencky, E. J., Saikawa, E., Xiang, G., Prinn, R. G., O'Doherty, S., Young, D., Weiss, R. F., Dutton, G. S., Elkins, J. W., Krummel, P. B., Langenfelds, R., and Steele, L. P.: Top-down constraints on global N2O emissions at optimal resolution: application of a new dimension reduction technique, Atmos. Chem. Phys., 18, 735–756, https://doi.org/10.5194/acp-18-735-2018, 2018.
Wilkinson, J. M. and Lee, M. R. F.: Use of human-edible animal feeds by ruminant livestock, Animal, 12, 1–9, https://doi.org/10.1017/S175173111700218X, 2017.
Wint, G. R. W. and Robinson, T. P.: Gridded livestock of the world 2007, Food and Agriculture Organization of the United Nations (FAO), Rome, Italy, 131 pp. ISBN 978-9-2510-579, 2007.
World Bank: World Development Indicators: Trends in greenhouse gas emissions, http://wdi.worldbank.org/table/3.9, last access: 7 September 2021.
Yang, C., Fraga, H., van Ieperen, W., Trindade, H., and Santos, J. A.: Effects of climate change and adaptation options on winter wheat yield under rainfed Mediterranean conditions in southern Portugal, Climatic Change, 154, 159–178, https://doi.org/10.1007/s10584-019-02419-4, 2019.
Yang, X., Chen, F., Lin, X., Liu, Z., Zhang, H., Zhao, J., Li, K., Ye, Q., Li, Y., Lv, S., and Yang, P.: Potential benefits of climate change for crop productivity in China, Agr. Forest Meteorol., 208, 76–84, https://doi.org/10.1016/j.agrformet.2015.04.024, 2015.
Zhang, Q., Zhang, W., Li, T., Sun, W., Yu, Y., and Wang, G.: Projective analysis of staple food crop productivity in adaptation to future climate change in China, Int. J. Biometeorol., 61, 1445–1460, https://doi.org/10.1007/s00484-017-1322-4, 2017.
Zhao, C., Liu, B., Piao, S. L., Wang, X. H., Lobell, D. B., Huang, Y., Huang, M. T., Yao, Y. T., Bassu, S., Ciais, P., Durand, J. L., Elliott, J., Ewert, F., Janssens, I. A., Li, T., Lin, E., Liu, Q., Martre, P., Muller, C., Peng, S. S., Penuelas, J., Ruane, A. C., Wallach, D., Wang, T., Wu, D. H., Liu, Z., Zhu, Y., Zhu, Z. C., and Asseng, S.: Temperature increase reduces global yields of major crops in four independent estimates, P. Natl. Acad. Sci. USA, 114, 9326–9331, https://doi.org/10.1073/pnas.1701762114, 2017.