the Creative Commons Attribution 4.0 License.
the Creative Commons Attribution 4.0 License.
 | 24 Jun 2022
High peatland methane emissions following permafrost thaw: enhanced acetoclastic methanogenesis during early successional stages
Maria A. Cavaco
Maya P. Bhatia
Cristian Estop-Aragonés
Klaus-Holger Knorr
David Olefeldt
Permafrost thaw in northern peatlands often leads to increased methane (CH4) emissions, but the underlying controls responsible for increased emissions and the duration for which they persist have yet to be fully elucidated. We assessed how shifting environmental conditions affect microbial communities and the magnitude and stable isotopic signature (δ13C) of CH4 emissions along a thermokarst bog transect in boreal western Canada. Thermokarst bogs develop following permafrost thaw when dry, elevated peat plateaus collapse and become saturated and dominated by Sphagnum mosses. We differentiated between a young and a mature thermokarst bog stage (∼ 30 and ∼ 200 years since thaw, respectively). The young bog located along the thermokarst edge was wetter, warmer, and dominated by hydrophilic vegetation compared to the mature bog. Using high-throughput 16S rRNA gene sequencing, we show that microbial communities were distinct near the surface and converged with depth, but fewer differences remained down to the lowest depth (160 cm). Microbial community analysis and δ13C data from CH4 surface emissions and dissolved gas depth profiles show that hydrogenotrophic methanogenesis was the dominant pathway at both sites. However, mean δ13C-CH4 signatures of both dissolved gas profiles and surface CH4 emissions were found to be isotopically heavier in the young bog (−63 ‰ and −65 ‰, respectively) compared to the mature bog (−69 ‰ and −75 ‰, respectively), suggesting that acetoclastic methanogenesis was relatively more enhanced throughout the young bog peat profile. Furthermore, mean young bog CH4 emissions of 82 mg CH4 m−2 d−1 were ∼ 3 times greater than the 32 mg CH4 m−2 d−1 observed in the mature bog. Our study suggests that interactions between the methanogenic community, hydrophilic vegetation, warmer temperatures, and saturated surface conditions enhance CH4 emissions in young thermokarst bogs but that these favourable conditions only persist for the initial decades after permafrost thaw.
- Article
(5919 KB) - Full-text XML
-
Supplement
(1072 KB) - BibTeX
- EndNote


Methane (CH4) emissions in northern peatlands are typically thought to be driven by environmental and ecological conditions such as temperature, water table position, and vegetation community (Bellisario et al., 1999). However, CH4 emissions are ultimately the result of microbial activity, and understanding the interactions between environmental conditions and microbial processes is key to understanding the impact of disturbances on peatland CH4 emissions. Increased disturbances such as permafrost thaw are transforming northern-latitude peatlands (Helbig et al., 2016) through the disruption of the frozen landscape and environmental conditions responsible for the regional accumulation of large peatland carbon (C) stores. Rapidly rising northern air temperatures (Mudryk et al., 2018) are predicted to lead to widespread gradual thawing of permafrost (Schaefer et al., 2011) and subsequent thermokarst development in high-C-density permafrost peatlands (Olefeldt et al., 2016). Thermokarst formation in ice-rich permafrost peatlands is characterized by ground subsidence and surface inundation (Camill, 1999). This exposes previously frozen C to anaerobic microbial decomposition and potential mineralization into greenhouse gases (Schuur et al., 2015). Redox conditions following thermokarst formation are an important control of decomposition, with 3–4 times greater C mineralization occurring as aerobic respiration compared to anaerobic respiration (Schädel et al., 2016). Increased emissions of methane (CH4) due to thermokarst formation are projected to result in a positive feedback with climate warming (Turetsky et al., 2020). However, the magnitude of peatland CH4 emissions and the metabolic pathways responsible for these emissions in response to permafrost thaw remain uncertain, as does the period for which these conditions and emissions persist.
Methanogenesis, conducted by methanogenic archaea belonging to phylum Euryarchaeota, is one of the most prominent microbial processes contributing to the anaerobic decomposition of organic matter in water-logged permafrost soils (Cai et al., 2016; Knoblauch et al., 2018). Methanogenesis occurs primarily via two pathways: acetoclastic methanogenesis and hydrogenotrophic methanogenesis (Whiticar et al., 1986; Whiticar, 1999). Acetoclastic methanogenesis involves the cleavage of acetate into CH4 and CO2 and, when considering these two species, causes less apparent fractionation than the hydrogenotrophic methanogenesis pathway. This results in acetoclastic methanogenesis yielding comparatively isotopically heavy δ13C-CH4 (δ13C = −65 ‰ to −50 ‰). The reduction of CO2 and H2 in hydrogenotrophic methanogenesis typically produces CH4 lighter in 13C (δ13C = −110 ‰ to −60 ‰) (Hornibrook et al., 1997, 2000). While the two pathways are stoichiometrically equal (Conrad, 1999; Corbett et al., 2013), the activity of acetoclastic and hydrogenotrophic methanogens is governed by different extrinsic controls (Bridgham et al., 2013).
Hydrogenotrophic methanogenesis is thought to be the main pathway of CH4 formation in northern peatlands (Hornibrook et al., 1997; Galand et al., 2005). However, the acetoclastic pathway can dominate in the upper layers of more minerotrophic, nutrient-rich peatlands (Popp et al., 1999; Chasar et al., 2000) where there are sufficient levels of acetate (Ye et al., 2012). During the initial decades following thaw, surface runoff of nutrients from surrounding intact peat plateaus (Keuper et al., 2012, 2017) and increased connectivity to regional hydrology (Connon et al., 2014) can result in more minerotrophic conditions. Such shifts in hydrology, temperature, nutrients, redox conditions, and vegetation communities following permafrost thaw have been shown to increase the prevalence of acetoclastic methanogenesis and CH4 emissions (Hodgkins et al., 2014; McCalley et al., 2014). However, this potential post-thaw enhancement of acetoclastic methanogenesis needs to be considered in the context of the existing methanogenic community that developed in the peat profile before thaw. For example, historical environmental conditions have been shown to have a legacy effect on the methanogenic community following thaw and can therefore be a key constraint on methanogenic community structure and activity post-thaw (Holm et al., 2020; Lee et al., 2012). Overall, an understanding of the methanogenic community's response following thaw to shifts in both surface conditions and exposure to previously frozen organic matter is key to estimating CH4 emissions from thermokarst peatlands.
Environmental conditions following permafrost thaw in peatlands are characterized by a drastic shift in water table position and increased wetness, increased soil temperatures, and a change in vegetation community associated with increased labile inputs (Beilman, 2001; Burd et al., 2020; Camill, 1999). These shifts may provide optimal conditions for CH4 production and emissions, particularly in the initial decades following thaw. Peatland CH4 emissions are constrained by water table position (Huang et al., 2021; Strack et al., 2004), and surface inundation leads to increased CH4 emissions (Tuittila et al., 2000). Methane production and emissions are positively influenced by soil temperatures (Hopple et al., 2020; Olefeldt et al., 2017), and peatland CH4 emissions have been shown to increase when both water table position and temperatures are high (Grant, 2015). The colonization of vegetation associated with fresh, labile inputs has also been shown to increase both the magnitude and temperature sensitivity of CH4 emissions in peatlands (Leroy et al., 2017; McNicol et al., 2019). As such, many studies have focussed on the relationship between water table position, soil temperature, and vegetation communities in determining CH4 fluxes following thaw (Johnston et al., 2014; Turetsky et al., 2007; Wickland et al., 2006). However, while these environmental conditions are key drivers of CH4 emissions, they are unable to fully account for the variability in permafrost peatland CH4 emissions (Juottonen et al., 2021; Kuhn et al., 2021). Some of this unaccounted variance may be in part explained by microbial activity, as changes in the composition and abundance of methanogenic community members can contribute significantly towards peatland CH4 emissions (Fritze et al., 2021). Relatively few studies have assessed how shifts in environmental conditions and ensuing changes in methanogenic community structure influence CH4 emissions following thaw (McCalley et al., 2014), an interaction that may be significant at both the local and circumpolar scale.
In this study, we assess the impact of permafrost thaw on peatland methanogenic community composition and CH4 emissions along a space-for-time thaw gradient that includes an intact peat plateau and an adjacent thermokarst bog with areas that have thawed ∼ 30 and ∼ 200 years ago (herein referred to as young bog and mature bog, respectively). Thermokarst formation has resulted in distinct environmental conditions at each stage along this thaw gradient. We herein define these distinct environmental conditions as water table position and surface wetness, soil temperatures, and vegetation community. Along this gradient, we assessed methanogenic community structure down to 160 cm. We hypothesize that (1) shifting environmental conditions along the permafrost thaw gradient result in a successional microbial community and a restructuring of the methanogenic community, and (2) the warmer conditions and hydrophilic vegetation community in the young bog, along with the exposure of previously frozen peat, will result in a greater relative abundance of acetoclastic methanogens throughout the depth profile and subsequently greater overall CH4 emissions. In the young bog and mature bog, we measured the concentration and δ13C signature of dissolved CH4 and CO2 down to 245 cm, as well as the rates and δ13C signature of both CH4 and CO2 land–atmosphere fluxes. The combined approach of measuring dissolved gas depth profiles and surface emissions, in tandem with assessing the structure of the methanogenic community along a depth profile, allows us to determine how changing environmental conditions following thaw impacts methanogenic pathways and community composition. Utilizing this approach, we can subsequently gain further insight into how long elevated surface CH4 emissions may persist post-thaw. Furthermore, this approach highlights that while environmental conditions are important in determining CH4 emissions, microbial community composition and changes in the methanogenic community structure are likely to significantly influence CH4 emissions following thaw.
2.1 Study site and design
The Lutose peatland study site (59.5∘ N, 117.2∘ W; Fig. 1) is located on the Interior Plains of western Canada within the zone of discontinuous permafrost (Brown et al., 1997; Heginbottom et al., 1995). The climate is continental with a monthly average summer high temperature of 16.1 ∘C (July), winter low of −22.8 ∘C (January), and annual average air temperature of −1.8 ∘C (Climate-Data.org, 2019 – data from site located ∼ 50 km south of Lutose). Annual average precipitation is 391 mm, of which three-quarters fall as rain between May and September. In the discontinuous permafrost zone of the Interior Plains in boreal western Canada, ∼ 40 % of the landscape is covered by permafrost peatlands that have between 2 and 6 m deep peat deposits (Gibson et al., 2018; Vitt et al., 2000). The peatland complexes in this area are a fine-scale mosaic of permafrost peat plateaus, as well as permafrost-free ponds, fens, and bogs (Zoltai, 1993; Bauer et al., 2003; Vitt et al., 2000; Pelletier et al., 2017), and they are similar to those found in the Hudson Bay Lowlands (Kuhry, 2008) and Alaska (Jones et al., 2017). The Lutose peatland complex is representative of the peatlands found in the discontinuous permafrost zone of the Interior Plains in western Canada (Heffernan et al., 2020). The site has 5–6 m deep peat and has transitioned through multiple developmental stages since it began accumulating organic matter ∼ 8800 years ago. It transitioned from a marsh, through a fen and a bog stage prior to permafrost aggradation ∼ 1800 years ago (Heffernan et al., 2020). Peatlands in the Interior Plains in western Canada are one of the three largest stores of organic carbon found in peatlands within the permafrost zone, the other two being the Hudson Bay Lowlands and the West Siberian Lowlands (Hugelius et al., 2020; Olefeldt et al., 2021). Within the sporadic and discontinuous permafrost zone of our study region >15 % of the total peat plateau area has thawed and formed thermokarst bogs in the last 30 years (Baltzer et al., 2014; Gibson et al., 2018). Projections for this area suggests total permafrost lost from plateaus by 2050 (Chasmer and Hopkins, 2017).
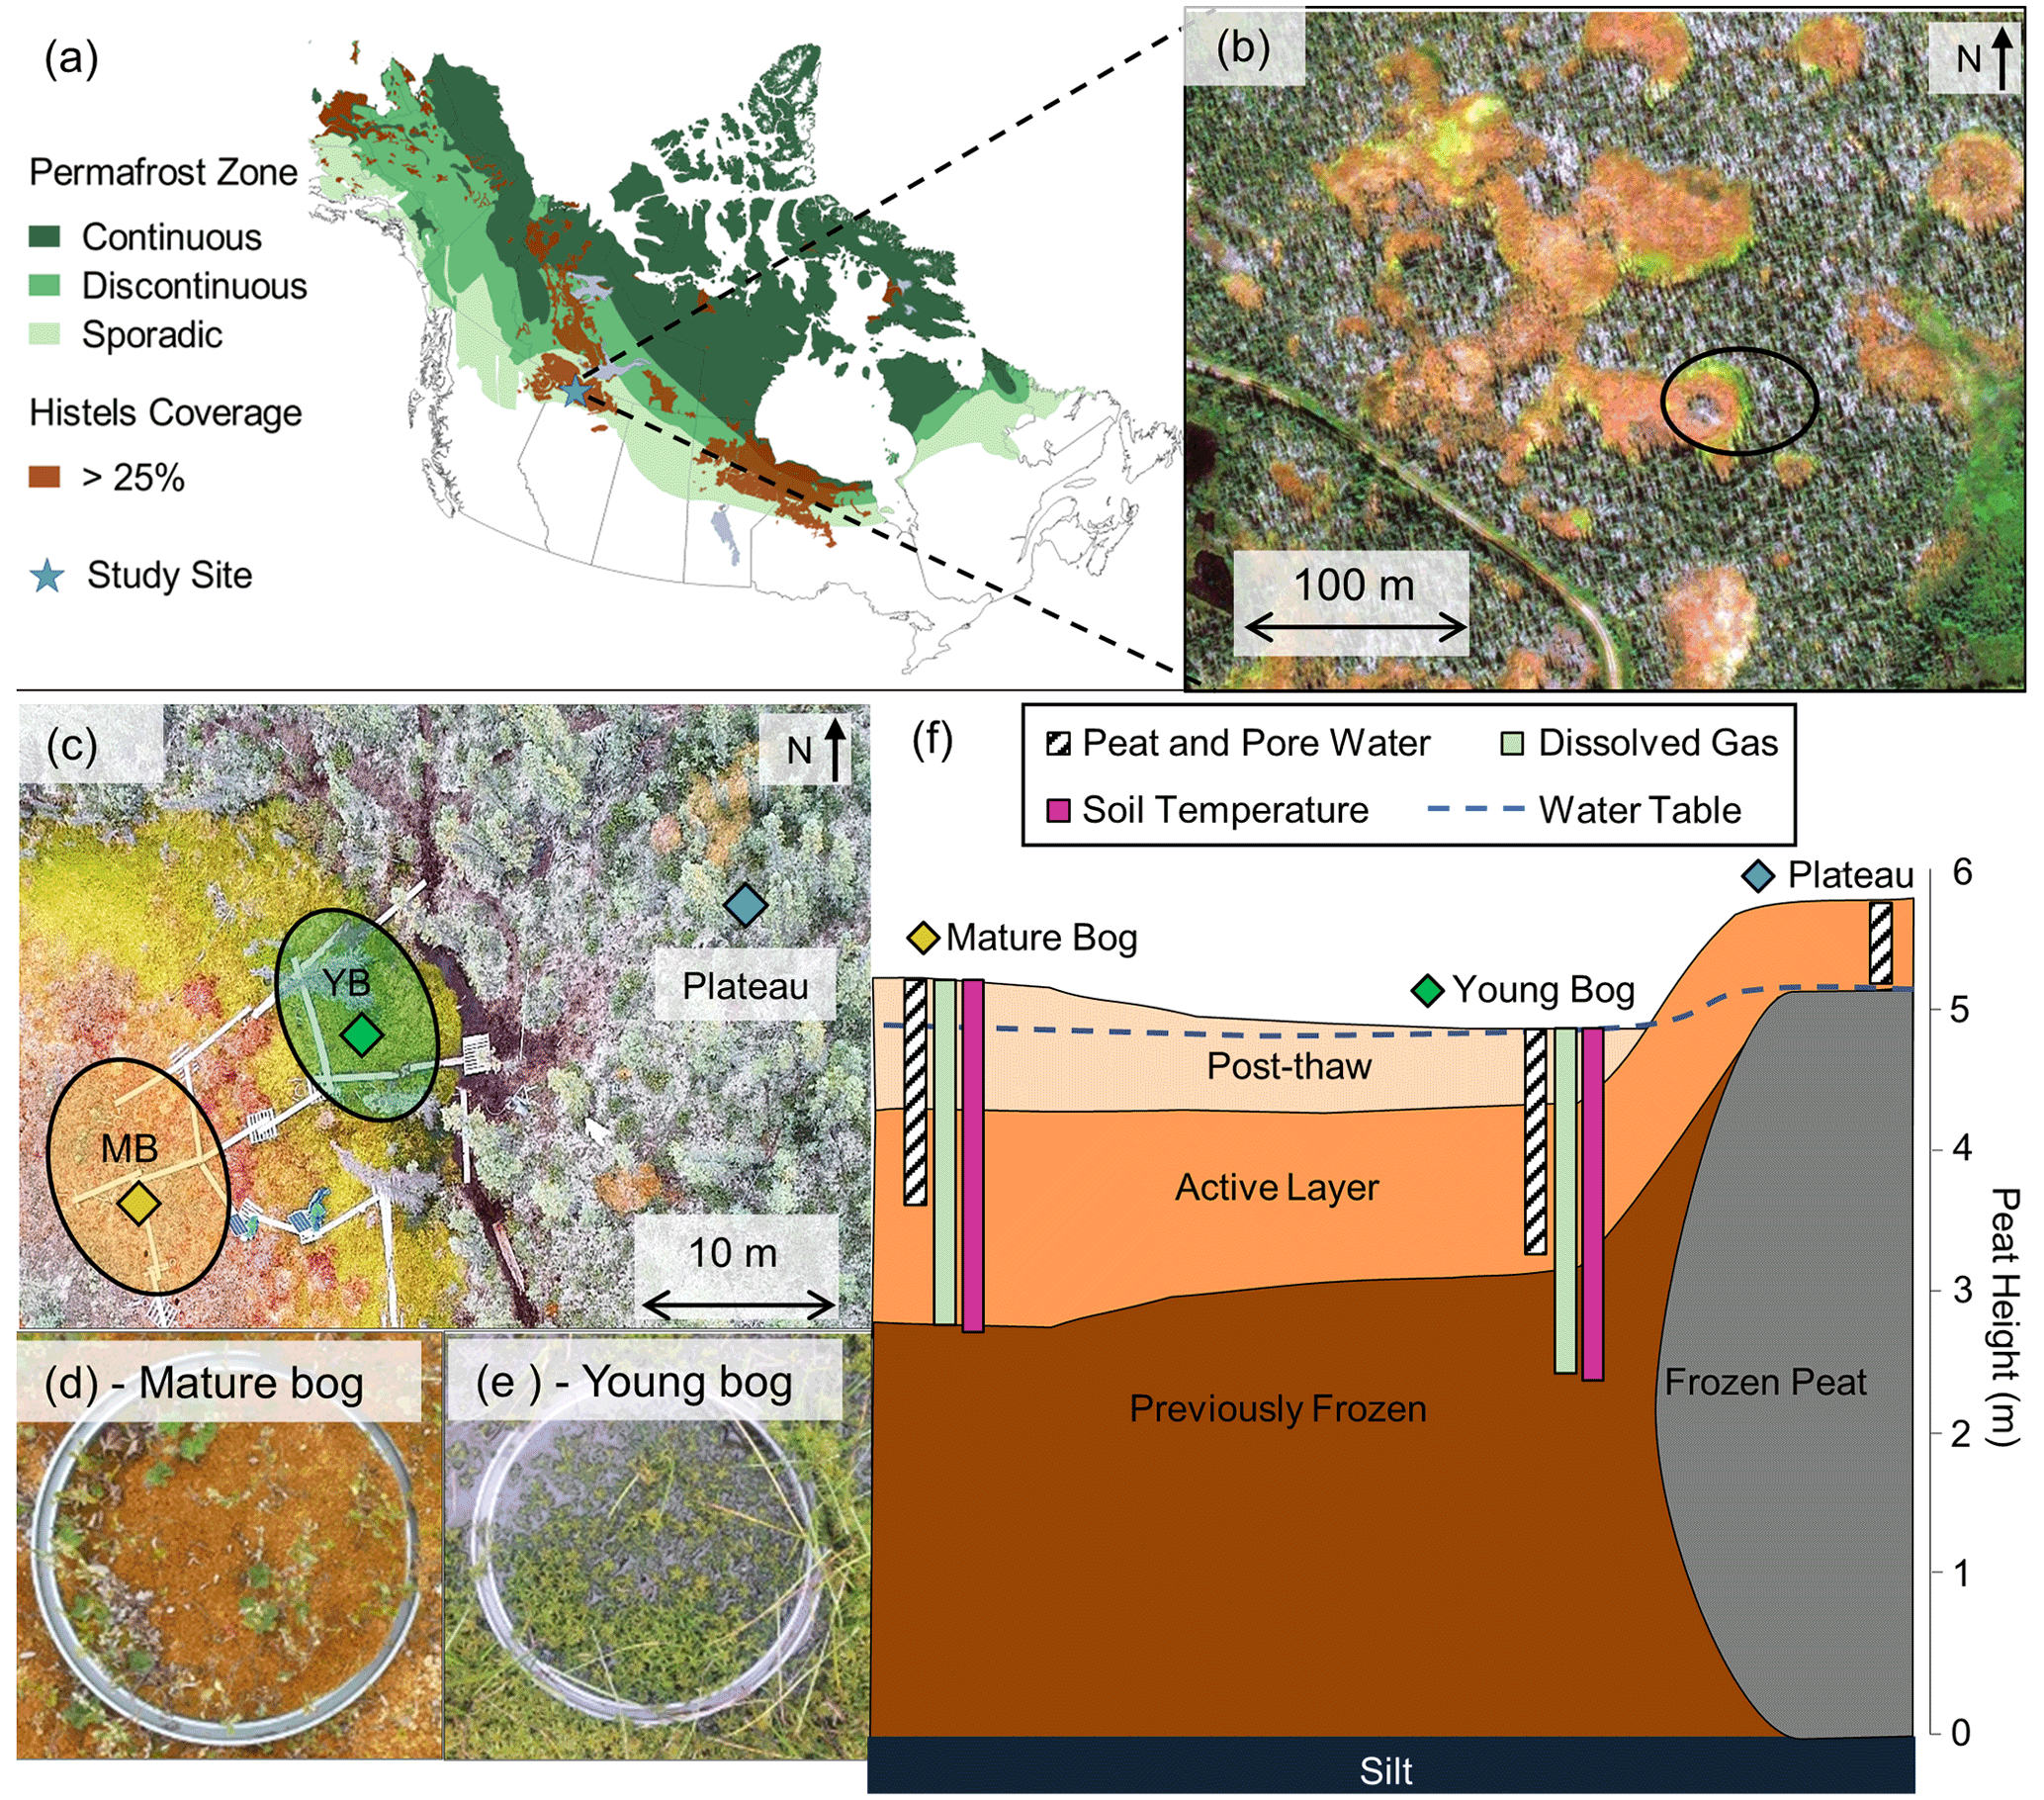
Figure 1Lutose peatland site location and study design. (a) Site location (Lutose, Alberta, Canada; 59.5∘ N, 117.2∘ W) in boreal western Canada. Green shading represents permafrost zonation (Brown et al., 1997), and brown shading represents areas with >25 % permafrost peatland (histels) extent (Hugelius et al., 2014). (b) GeoEye satellite image of study site (image from https://zoom.earth/, last access: 20 November 2018) at 0.46 m resolution. The circle represents the area where sampling took place. (c) Aerial image of study transect, locations of peat and dissolved gas sampling in the plateau (blue diamond), young bog (green diamond), and mature bog (orange diamond), and area where collars for gas flux measurements were located in the young bog (YB, green) and mature bog (MB, orange) (aerial photo credit: Olefeldt, David). (d, e) Surface vegetation in the mature bog and young bog and (f) soil profile of thaw transect based on Heffernan et al. (2020). The transition to post-thaw peat occurs at 29 and 71 cm in the young bog and mature bog, respectively. Peat (core) and pore water (pore water peepers), including microbial community, sampling depth profile for 0–160 cm shown as white column with diagonal black lines. Dissolved gas (diffusive samplers) sampling depth profile for 0–245 cm shown as light green column. Soil temperature depth profile for 0–250 cm shown as purple column. Average water table depth shown as dashed blue line.
The studied transect represents a space-for-time gradient of permafrost thaw that includes three thaw stages: a permafrost peat plateau and a young (∼ 30 years since thaw) and a mature (∼ 200 years since thaw) part of an adjacent thermokarst bog. The timing of permafrost thaw was previously determined by 14C-dating the shift in macrofossil vegetation indicative of thaw, at 29 cm in the young bog and at 71 cm in the mature bog (Fig. 1f) (Heffernan et al., 2020). The peat plateau has an active layer thickness of ∼ 70 cm, and its surface is raised 1–2 m above the adjacent thermokarst bog due to the presence of excess ground ice, resulting in relatively dry surface conditions in which the water table generally follows the deepening of the seasonally thawed peat layer (Zoltai, 1972). This thaw stage is characterized by a stunted, open black spruce (Picea mariana) canopy and ground cover of lichens (Cladonia spp.), Sphagnum fuscum hummocks, and low-lying ericaceous shrubs as is characteristic of the peat plateaus in the area (Vitt et al., 1994). The young bog stage is narrow (<5–10 m wide) and is located next to the actively thawing area of the peat plateau. The young bog has an average growing season water table position of 1.3 ± 4.9 cm below the peat surface. These inundated conditions result in the dominance of a hydrophilic vegetation community (Fig. 1e) consisting of Sphagnum riparium, bog-sedge (Carex limosa), and rannoch rush (Scheuchzeria palustris). The mature bog is ∼ 10–15 m from the young bog and is drier compared to the young bog, with an average growing season water table position of 22.9 ± 9.3 cm below the surface. The dominant vegetation reflects these drier conditions and consists of Sphagnum fuscum, Sphagnum magellanicum, leather leaf (Chamaedaphne calyculata), cloudberry (Rubus chamaemorus), Eriophorum vaginatum tussocks, and some black spruce (Picea mariana) regrowth (Fig. 1d). The mature bog is located >10–20 m from the thawing plateau edge.
2.2 Site preparation and monitoring of environmental conditions
The Lutose peatland study site was established in 2015, and a boardwalk was constructed to minimize disturbances along the peat plateau–thermokarst bog transect. Three collars for surface greenhouse gas flux (39 cm diameter) measurements were permanently installed to a depth of 20 cm in both the young and mature thermokarst bog stages. The top of each collar was aligned with the peat surface. PVC wells (2 cm diameter) were installed directly next to each collar and were used to manually monitor the water table position during each gas flux measurement. We monitored soil temperature (∘C) at 10, 30, 50, 75, 100, 150, 200, and 250 cm every 30 min from May to September 2018 using permanently installed loggers (Onset Computer Hobo 8k Pendant, Bourne, MA, USA) in both thermokarst bog stages. Temperature depth profiles were established centrally among collars in each thermokarst bog stage and in areas that had similar vegetation, water table position, and distance from the thawing edge as the collars.
Custom made plexiglass pore water suction (Heffernan et al., 2021) and diffusive equilibration gas sampling devices (Knorr et al., 2009) were installed in July 2016 in the young and mature bogs. These devices were installed in both thermokarst bog stages ∼ 1 m from the nearest flux measurement collar. Pore water suction devices were installed to a depth of 160 cm and consisted of 15 sampling depths, with each sampling depth connected to the surface via silicone tubing. This allowed for repeated non-destructive pore water sampling. Three diffusive gas sampling devices were installed in each thermokarst bog stage, where two collected dissolved soil gas samples from 5 to 95 cm deep and a third from 115 to 245 cm. Each diffusive gas sampler consisted of a PVC pipe with a 10 cm long sampling section centred at each sampling depth. Sampling sections consisted of ∼ 2 m of silicon tubing (3 mm i.d., 5 mm o.d.) wrapped around the PVC pipe and kept in place by PVC spacers at the top and bottom of each interval. Silicone tubes were sealed at one end, whereas the other end was connected to polyurethane tubing (1.8 mm i.d.) that ran back up inside the PVC tube to reach the peat surface where it was sealed with a three-way stopcock. Silicone tubing has been shown to be permeable to gases such as CO2 and CH4 within a number of hours while remaining impermeable to water, making it suitable for sampling of dissolved soil gases (Kammann et al., 2001).
2.3 Pore water chemistry and peat enzyme activity
Pore water dissolved organic matter (DOM) chemistry and peat enzyme activity presented in this study have previously been published (Heffernan et al., 2021) and are briefly described here. Pore water samples for DOM chemistry were taken monthly from May to September 2018 using the previously described pore water suction devices in the young bog and mature bog. Three 60 mL samples were taken from all 15 measurement depths by applying a vacuum at the surface and collecting water with syringes via a three-way stopcock. Each water sample was immediately filtered through 0.7 µm pore size glass fiber filters (GF/F Whatman) into two acid-washed amber glass bottles, with one sample acidified with 0.6 mL 2N HCl to prevent further microbial activity. Pore water samples were transported in a cooled container and stored at 4 ∘C prior to analysis. Pore water DOM was analyzed for pH, phosphate (PO; µg L−1), dissolved organic carbon (DOC; mg L−1), and total dissolved nitrogen (TDN; mg L−1) concentrations, phenolic contents, specific UV absorbance at 254 nm (SUVA; L mg C−1 m−1; Weishaar et al., 2003), and spectral slope between 250 and 465 nm (S250−465, nm−1; Helms et al., 2008). SUVA and S250−465 values are used to indicate aromaticity, with high SUVA indicating a high aromatic content and lower S250−465 indicating low molecular weight and decreasing aromaticity (Hansen et al., 2016).
Peat cores extracted to a depth of 160 cm were stored at 4 ∘C for less than 1 week in the laboratory before homogenization to determine potential soil enzyme activities. We performed hydrolytic enzyme assays for four enzymes – phosphatase, β-N-glucosaminidase, β-glucosidase, and β-cellobiosidase – using fluorogenic 4-methylumbelliferone labelled substrates (Dunn et al., 2014). We assayed oxidative enzyme activity by measuring laccase activity using syringaldazine (Criquet et al., 2000; Jassey et al., 2012). We summarized the activity of all enzymes using a multi-functionality index based on z scores (Allan et al., 2015; Heffernan et al., 2021).
2.4 Surface land–atmosphere gas fluxes
We measured surface land–atmosphere greenhouse gas fluxes (CH4 and carbon dioxide; CO2) monthly from May to September 2018 at the three collars in each peatland stage using the static chamber method (Carroll and Crill, 1997). The chamber used to capture land–atmosphere fluxes was a transparent cylindrical Plexiglass chamber with a basal area of 0.12 m2, height of 0.40 m, and volume of 47.8 L. The chamber was equipped with three fans (Micronel D341T012GK-2 ventilator, BEDEK GmbH, Dinkelsbühl, Germany) to mix air during measurements and a temperature sensor (Hobo RH Smart Sensor, S-THB-M002, Onset Computer, Bourne, USA) that was shaded from direct sunlight (Burger et al., 2016). An airtight seal was formed between the chamber and collar by pouring water in a ∼ 1.5 cm deep well around the upper circumference of each collar. Land–atmosphere fluxes of CO2 (ecosystem respiration) and CH4 were captured simultaneously in darkened conditions by covering the chamber with a reflective shroud. Gas concentrations were determined at a temporal resolution of 1 s using an Ultraportable Greenhouse Gas Analyzer (Los Gatos Research, CA, USA), and real-time fluxes were monitored using the VNV® Viewer (RealVNC® Limited, UK) application with an iPad mini 2 (Apple Inc.).
The rates of CH4 and CO2 land–atmosphere fluxes (Flux) were calculated using the following ideal gas law:
where slope is the linear rate of change in gas concentration (µmol mol−1 s−1) over the measurement period inside the chamber, P is an atmospheric pressure (atm) constant of 0.96 atm, V is chamber volume (L), R is the universal gas constant (L atm K−1 mol−1), T is the average temperature (K) inside the chamber during the measurement, and A is the chamber basal area (m2). Chamber closure for each flux measurement was 5 min with the first 2 min discarded to ensure fluxes (i.e., change in concentration over time) with R2>0.75. We report CO2 fluxes in grams CO2 per square meter per day (g CO2 m−2 d−1) and CH4 fluxes in milligrams CH4 per square meter per day (mg CH4 m−2 d−1), with positive values indicating fluxes to the atmosphere. To quantify the proportion of C being emitted as CH4, we standardized our CO2 and CH4 fluxes per gram C emitted. The proportion of C emitted as CH4 (CH4 : C emissions) was calculated as
2.5 δ13C signature of CH4 emissions
We assessed the δ13C-CO2 and δ13C-CH4 signatures of ecosystem respiration (CO2) and CH4 emissions. This was done similarly to regular measurements of CO2 and CH4 fluxes but using a smaller, opaque chamber of 31.1 L and discrete syringe samples for δ13C analysis in combination with the continuous monitoring of gas concentrations described above. Gas syringe samples were taken using a 20 mL syringe via a three-way stopcock placed between the sealed chamber and gas inlet port on the Ultraportable Greenhouse Gas Analyzer. Gas samples were then injected into a 37.5 mL sealed glass vial that had been flushed with nitrogen gas prior to sealing. Chamber enclosure time ranged from 30 to 50 min with four to five samples being taken during this time. Samples were taken either every 10 min or once a minimum change in CO2 (30 µmol mol−1) and CH4 (1 µmol mol−1) concentrations was observed. An atmospheric gas sample was used as a time-zero measurement when assessing the change in concentration over time. Glass vials containing samples were stored at 4 ∘C until analysis. These measurements were taken in September and October 2016 from one collar in both the young and mature bogs, with each collar measured twice.
We measured the δ13C values of gas samples from both the chamber fluxes and atmospheric background. To assess whether the gas concentration of each sample fit within the measurement range required for δ13C analysis, we measured CO2 and CH4 concentrations using 1–3 mL from each vial. Following these concentration measurements, the remaining sample (17–19 mL) was diluted with nitrogen gas to a final volume of 20 mL and injected into a small sample introduction module (SSIM; Picarro, California, USA) system to measure δ13C signatures. The δ13C-CO2 and δ13C-CH4 signature was measured in-line with a cavity ring-down spectrometer (G2201-L, Picarro, California, USA) that had been calibrated using certified standards.
We then used the time series of δ13C-CH4 and CH4 concentrations to estimate the δ13C-CH4 signature of the CH4 released to the atmosphere using Keeling plots (Keeling, 1958). Using this approach, the δ13C-CH4 signature of gas in each sample is plotted on the y axis against the inverse of CH4 gas concentrations (). The y-axis intercept of the linear regression represents the mean isotopic signature of the CH4 source (Fisher et al., 2017). While fractionation during diffusive transport may influence these estimates, it has been shown in similar systems to be of minor importance compared to other contributing processes (Preuss et al., 2013; Nielsen et al., 2019).
2.6 Dissolved gas depth profiles
Dissolved gas samples were collected using diffusive equilibration gas sampling devices. Samples were taken from the following 15 depths: every 10 cm down to 95 cm starting at 5–15 cm and then at 115, 140, 165, 195, and 245 cm. Once a month from May to September 2018 a ∼ 7 mL gas sample was drawn from each depth using a 10 mL plastic syringe. These gas samples were immediately injected into a 10 mL sealed glass vial that had been flushed with nitrogen gas prior to sealing and then were stored at 4 ∘C until analysis. A total of 214 CO2 and 211 CH4 dissolved gas concentration measurements were made by injecting 1–3 mL of gas into a gas chromatograph with an FID (flame ionization detector) and CO2 methanizer (8610C Gas Chromatograph, SRI Instruments, California, USA). We measured δ13C-CO2 and δ13C-CH4 signatures using the previously mentioned cavity ring-down spectrometer and SSIM system. As with surface chamber gas samples, dissolved gas samples were diluted with N2 to 20 mL. However, dissolved gas concentrations were considerably higher than gas concentrations found in the surface chambers, and some were well above the optimal concentration range required for accurate δ13C analysis for the SSIM system even after dilution. To fit within measurement range of the system, further dilution resulted in CO2 concentrations below detectable limits. As such, we were able to obtain 90 and 75 measurements of δ13C-CH4 in the young and mature bogs, respectively, and 93 measurements of δ13C-CO2 in both.
We used the δ13C-CO2 and δ13C-CH4 signature of each gas sample to calculate the apparent fraction factor αc, where αc= [13C-CO2+ 1000] [13C-CH4+1000]. The αc can serve as an isotopic indicator of the pathway of methanogenesis, with typical values of 1.060–1.090 observed for hydrogenotrophic methanogenesis and 1.040–1.060 for acetoclastic methanogenesis (Chanton et al., 2005).
2.7 Peat and pore water sample collection for microbial community composition analyses
Microbial community composition was characterized in both peat and peat pore water samples from depths between 0 and 160 cm in the young bog and mature bog. Focusing on peat samples, microbial community composition in the active layer of the peat plateau was assessed from depths between 0 and 30 cm. Peat cores were extracted in June and September 2018. Near-surface cores were extracted using a cutting tool down to 30 cm depth in the peat plateau and young bog and 50 cm deep in the mature bog. Surface cores were limited to 30 cm in the plateau due to the presence of ground ice during sampling in June. Surface core depths differed between the young bog and mature bog due to differences in the water table position. Deeper core sections (down to 160 cm) in the young bog and mature bog were extracted using a Russian peat corer (4.5 cm i.d., Eijkelkamp, Giesbeek, The Netherlands). Cores were extracted from two boreholes located ∼ 20 cm apart, alternating between boreholes to avoid disturbance contamination from the 10 cm corer tip during the coring process. To do so, 50 cm long core sections were taken alternatively from each borehole, with each core having a 10 cm overlap with the previous core taken from the adjacent borehole. In the field, immediately after the entire core was extracted, cores were divided into 15 subsections. The first two subsections contained peat from 0 to 5 cm and 5 to 10 cm, followed by 10 cm increments down to 120 cm, and two further subsections from 130 to 140 and 150 to 160 cm. Peat from each interval was sub-sampled using sterilized forceps, placed directly into Whirl-Pak® bags, and frozen within 3 h of sampling for transportation back to the laboratory. Once samples reached the laboratory, they were frozen at −80 ∘C until analysis.
We also sampled peat pore water at all 15 peat sampling depths in September 2018 from the pre-installed pore water suction sampling devices mentioned above. We extracted 60 mL pore water samples by applying a vacuum at the surface and collecting water with new plastic 60 mL syringes. Pore water was immediately filtered through sterile 0.2 µM pore size, polyvinylidene difluoride (PVDF) membrane Sterivex filters (MilliporeSigma). Microbial cells were retained on the filter, and remaining porewater in the Sterivex was removed via extrusion using a 60 mL sterile syringe. Sterivex filters were then immediately flash-frozen at −80 ∘C in a liquid nitrogen dry shipper to preserve microbial community members until analysis could take place.
2.8 DNA extraction
Genomic DNA was extracted from all peat and pore water samples using the DNeasy PowerSoil kit (Qiagen) and the PowerWater DNeasy kit (Qiagen), respectively, to assess the differences in microbial community structure. Extraction of DNA from both sample types was followed as described by the manufacturer (Qiagen), with two modifications: (i) for peat samples, prior to mechanical lysis using bead beating, the prepared samples were chemically lysed by incubation at 70 ∘C for 10 min in the provided lysis solution, and (ii) Sterivex (pore water) samples were incubated with rotation at 37 ∘C following addition of lysis buffer. These modifications were made to increase total DNA yield. The amount of isolated DNA from each sample was then determined using a Qubit fluorometer (model 2.0, using the 1× HS dsDNA kit), with concentrations ranging between ∼ 0.1 and 22.4 ng µL−1. This extracted DNA served as the template for polymerase chain reaction (PCR) analyses described below.
2.9 Sequencing and computational analyses
We amplified 16S rRNA genes using universal prokaryotic primers 515F (Parada et al., 2016) and 926R (Quince et al., 2011). Each primer also contained a six-base index sequence for sample multiplexing (Bartram et al., 2011). The PCR mix (25 µL total volume) contained 1 × Q5 reaction buffer, 0.5 µM forward primer, 0.5 µM reverse primer, 200 µM dNTPs, 0.500 U Q5 polymerase (New England Biolabs, Ipswich, MA, USA), and 2.5 µL of genomic template. Genomic extracts with DNA concentrations greater than 2 ng µL−1 were diluted 1:100 in nuclease-free water. The PCR was performed as follows: 95 ∘C for 3 min, 35 cycles of 95 ∘C for 30 s, 60 ∘C for 30 s, 70 ∘C for 1 min, and a final extension of 70 ∘C for 10 min. Pooled 16S rRNA gene amplicons were purified using NucleoMag beads, and a 4.5 pM library containing 50 % PhiX Control v3 (Illumina, Canada Inc., NB, Canada) was sequenced on a MiSeq instrument (Illumina Inc., CA, USA) using a 2×250 cycle MiSeq Reagent Kit v3 (Illumina Canada Inc) at the Molecular Biology Service Unit (MBSU, University of Alberta). The MiSeq reads were demultiplexed using MiSeq Reporter software version 2.5.0.5. Each read pair was assembled using the paired-end assembler for Illumina sequences (PANDAseq; Masella et al., 2012) with a quality threshold of 0.9, dictating that 90 % of overlapping reverse and forward reads must match in order to assemble reads into read pairs. Assembled reads were analyzed using the Quantitative Insights Into Microbial Ecology II pipeline (QIIME2; Boylen et al., 2020). Sequences were clustered into amplicon sequence variants (ASVs) with chimeric sequences, singletons, and low abundance ASVs removed using DADA2 (Callahan et al., 2019). All representative sequences were classified with the Greengenes reference database, using the most recent release (version 13.8; McDonald et al., 2012). Although Greengenes is not updated as frequently as the SILVA database, we chose to use it to classify our ASVs as a comparison of both databases revealed that they captured a similar number of archaea (total of 51 187 methanogenic read counts attributed to SILVA versus 51 141 methanogenic read counts attributed to Greengenes). The taxonomic resolution between both databases was also similar, identifying the same kinds of phyla, families, and genera, as well as methanogens (e.g., Methanoregula, Methanosarcinales, etc.). Given these similarities, and the fact that methanogen nomenclature has not changed significantly over time, we ultimately chose to use Greengenes because it was able to resolve more methanogenic families belonging to Methanocellales and Methanomassiliicoccaceae particularly compared to SILVA. The Greengenes database is also still commonly used to explore methanogenic archaeal communities in current literature (Vanwonterghem et al., 2016; Lin et al., 2017; Carson et al., 2019). Furthermore, since 1021 methanogenic reads were captured per sample, on average, using Greengenes and are comparable to other studies (Vishnivetskaya et al., 2018; Holm, et al., 2020), we believe that our approach is sufficient for covering methanogen diversity.
2.10 Statistical analyses
All statistical analyses were carried out in R (Version 3.4.4, R Core Team, 2015) using the nlme, vegan, factoextra, ggplot2, VariancePartition, and ggpubr packages (Pinheiro et al., 2017; Oksanen et al., 2013; Kassambara and Mundt, 2017; Wickham, 2009; Hoffman and Schadt, 2016; Kassambara, 2018). For analysis of variance (ANOVA), distribution of the data was inspected visually for normality along with the Shapiro–Wilk test. We tested homogeneity of variances using the car package and Levene's test (Fox and Weisberg, 2011). We report uncertainty as ± 1 standard deviation, except for land–atmosphere greenhouse gas fluxes which we report as ± 95 % confidence intervals. We here define the statistical significance level at 5 %.
We used ANOVAs and Bonferroni post hoc tests on linear mixed-effects models to address our second hypothesis and to evaluate significant differences and seasonal trends in greenhouse gas fluxes and dissolved gas depth profiles. We performed these tests to assess whether thaw stage (young bog or mature bog) influenced greenhouse gas fluxes and dissolved gas depth profiles. This approach was used to test for significant differences in CH4 fluxes, ratio of CH4 : C emissions, and source 13C-CH4 signature intercepts of Keeling plots between young bog and mature bog stages. In each linear mixed-effects model, sampling month and peatland stage were defined as fixed effects, whereas sampling collar was defined as a random effect. Similarly, we tested for significant differences between the young and mature bog depth profiles with respect to dissolved CH4 and CO2 concentrations, δ13C-CH4 and δ13C-CO2 values, αc values, and pore water chemistry. In these models, sampling month and peatland stage were defined as fixed effects, while sample depth was defined as a random effect.
Following microbial 16S rRNA gene sequencing, sample reads were rarefied to the lowest read count of 28 129 for all subsequent analyses. These sequences represent whole microbial community data that were used to determine whether there was evidence of changes in microbial community structure representing the successional peatland stages following permafrost thaw throughout the 160 cm depth peat profile. In addition, to address our first hypothesis, we assessed differences in community composition across both peat and pore water to determine whether seasonality impacted microbial community structure in both sample matrices. Here, Bray Curtis dissimilarity matrices for overall microbial community data were used, at 999 permutations, to identify distinct groupings assessed at the 95 % confidence interval in NMDS (non-metric multidimensional scaling) ordinations. These distinct groupings were further evaluated for significance using the non-parametric permutational analysis of variance (PERMANOVA) test.
To further test our first hypothesis, methanogens were selected at the order level from our whole community data using Greengenes-assigned taxonomy. Utilizing their assigned taxonomy, the pathways through which identified methanogens conduct methanogenesis were determined by comparing our findings with the literature (Berghuis et al., 2019; Stams et al, 2019; Kendall and Boone, 2006; Zhang et al., 2020). Focusing on the methanogenic community allowed us to specifically assess how permafrost thaw affects the microbial community responsible for CH4 production and net CH4 emissions following thaw. We utilized our methanogenic community data to construct redundancy analyses (RDAs) and relative abundance bar plots. RDAs were conducted using a Hellinger-transformed methanogenic community. Explanatory variables (i.e., dissolved concentrations of CO2, CH4, DOC, temperature, enzymatic activity estimate, thaw stage, depth, and distance to water table) were scaled about the mean. These explanatory variables had variance standardized, were checked for collinearity (parameters with variance inflation value >10 were removed), and were selected for significance using backward selection, set at 1000 permutations. The significance of the RDA model and of each axis was tested using ANOVAs, set at 999 permutations. Variance partitioning analyses were conducted to assess the contribution of significant environmental parameters (i.e., thaw stage and distance to water table) on the structuring of the Hellinger-transformed methanogenic community. Distance from water table reflects the distance (in cm) a certain sample is from the water table in different stages of thaw (young bog and mature bog). Due to the smaller size of our methanogenic community relative to the total community and the lack of some data at certain depths, we combined pore water and peat samples together for these analyses. Relative abundance, which measures how common or rare a particular microorganism is relative to the entire microbial community, of methanogenic orders related to acetoclastic or hydrogenotrophic methanogenesis processes was plotted according to depth. Significant differences in methanogenic community composition between depths were assessed using the non-parametric Kruskal–Wallis test with a Benjamini–Hochberg correction for multiple comparisons after running a Wilcox rank sum test.
3.1 Site environmental conditions
The young bog was wetter and warmer than the mature bog throughout the May–September 2018 study period. In June, following snowmelt, the water table was at its highest at 2.2 ± 0.6 cm above the surface in the young bog. The highest water table position in the mature bog was 17.5 ± 1.9 cm below the peat surface and observed in July. The water table dropped during the season and in September was 5.7 ± 2.2 and 27.3 ± 1.2 cm below the peat surface in the young bog and mature bog, respectively. In the plateau, the seasonally thawed layer gradually deepened during the growing season, with an active layer depth of 79.5 ± 13.7 cm measured in September. The water table in the peat plateau followed the deepening of the seasonally thawed layer.
Soil temperatures followed the seasonal climate but were dampened and had temporal lags in deeper peat layers (Fig. S1a). The highest young bog and mature bog soil temperatures at 10 cm depth occurred in July at 14.3 and 14.1 ∘C, respectively. At 100 cm depth the maximum temperatures occurred in August and September at 8.6 and 6.9 ∘C, respectively, for the young and mature bogs. Soil temperatures at 250 cm were still rising at the end of September, peaking at 4.1 and 3.2 ∘C in the young bog and mature bog, respectively. The young bog was consistently warmer than the mature bog throughout the study by an average of 0.9 ± 0.9, 1.8 ± 1.0, and 0.5 ± 0.4 ∘C at 10, 100, and 250 cm depths, respectively.
Across all depths and sampling occasions, average pH was higher (ANOVA: , P<0.001) in the young bog than in the mature bog at 4.1 ± 0.2 and 3.9 ± 0.2, respectively. In contrast, DOC at 69.2 ± 18.4 and 53.8 ± 5.4 mg C L−1 (ANOVA: , P<0.001) and total dissolved nitrogen at 1.5 ± 1.4 and 0.9 ± 0.1 mg L−1 (ANOVA: , P<0.01) were higher in the mature bog than in the young bog, respectively. Average SUVA values were higher (ANOVA: , P<0.001) in the young bog (3.2 ± 0.4 L mg C−1 m−1) compared to the mature bog (2.6 ± 0.4 L mg C−1 m−1), indicating DOM with a greater aromatic content in the young bog. However, average spectral slope (S250−465) values were also greater (ANOVA: , P<0.05) in the young bog (−0.016 ± 0.002 nm−1) compared to the mature bog (−0.017 ± 0.003 nm−1), indicating lower molecular weight and decreasing aromaticity. Average phenolics (0.6 ± 0.2 and 0.6 ± 0.2 mg L−1) and phosphate (PO: 9.0 ± 14.3 and 6.7 ± 3.0 µg L−1) were similar between the young bog and mature bog, respectively, across all depths and sampling occasions. Full details of DOM chemistry results can be found in Heffernan et al. (2021). Of note is the fact that the pore water chemistry was compared across all depths in this study, in contrast to Heffernan et al. (2021) in which pore water found above and below the transition indicating permafrost thaw was compared.
3.2 Concentrations and isotopic signatures of dissolved gases
Dissolved CH4 increased with depth below the water table in both the young and mature bogs (Fig. 2a). Dissolved CH4 concentrations in the young bog increased with depth, from 19 µmol L−1 at 5 cm depth to a peak of 5400 µmol L−1 at 195 cm. Dissolved CH4 concentrations in the mature bog remained low above the water table (<6 µmol L−1 below 25 cm) but then increased to 4100 ± 1700 µmol L−1 between 115 and 250 cm depth and peaked at 6800 µmol L−1. Dissolved CO2 concentrations followed a very similar pattern to CH4, increasing with depth in both the young and mature bogs (Fig. 2b). Again, the mature bog had overall higher concentrations, with mean average values ranging from 340 to 1295 µmol L−1 and peaking at 1500 µmol L−1 at 85 cm. In contrast, the young bog had average values ranging from 113 to 960 µmol L−1 and peaked at 1200 µmol L−1 at 95 cm (Fig. 2b).
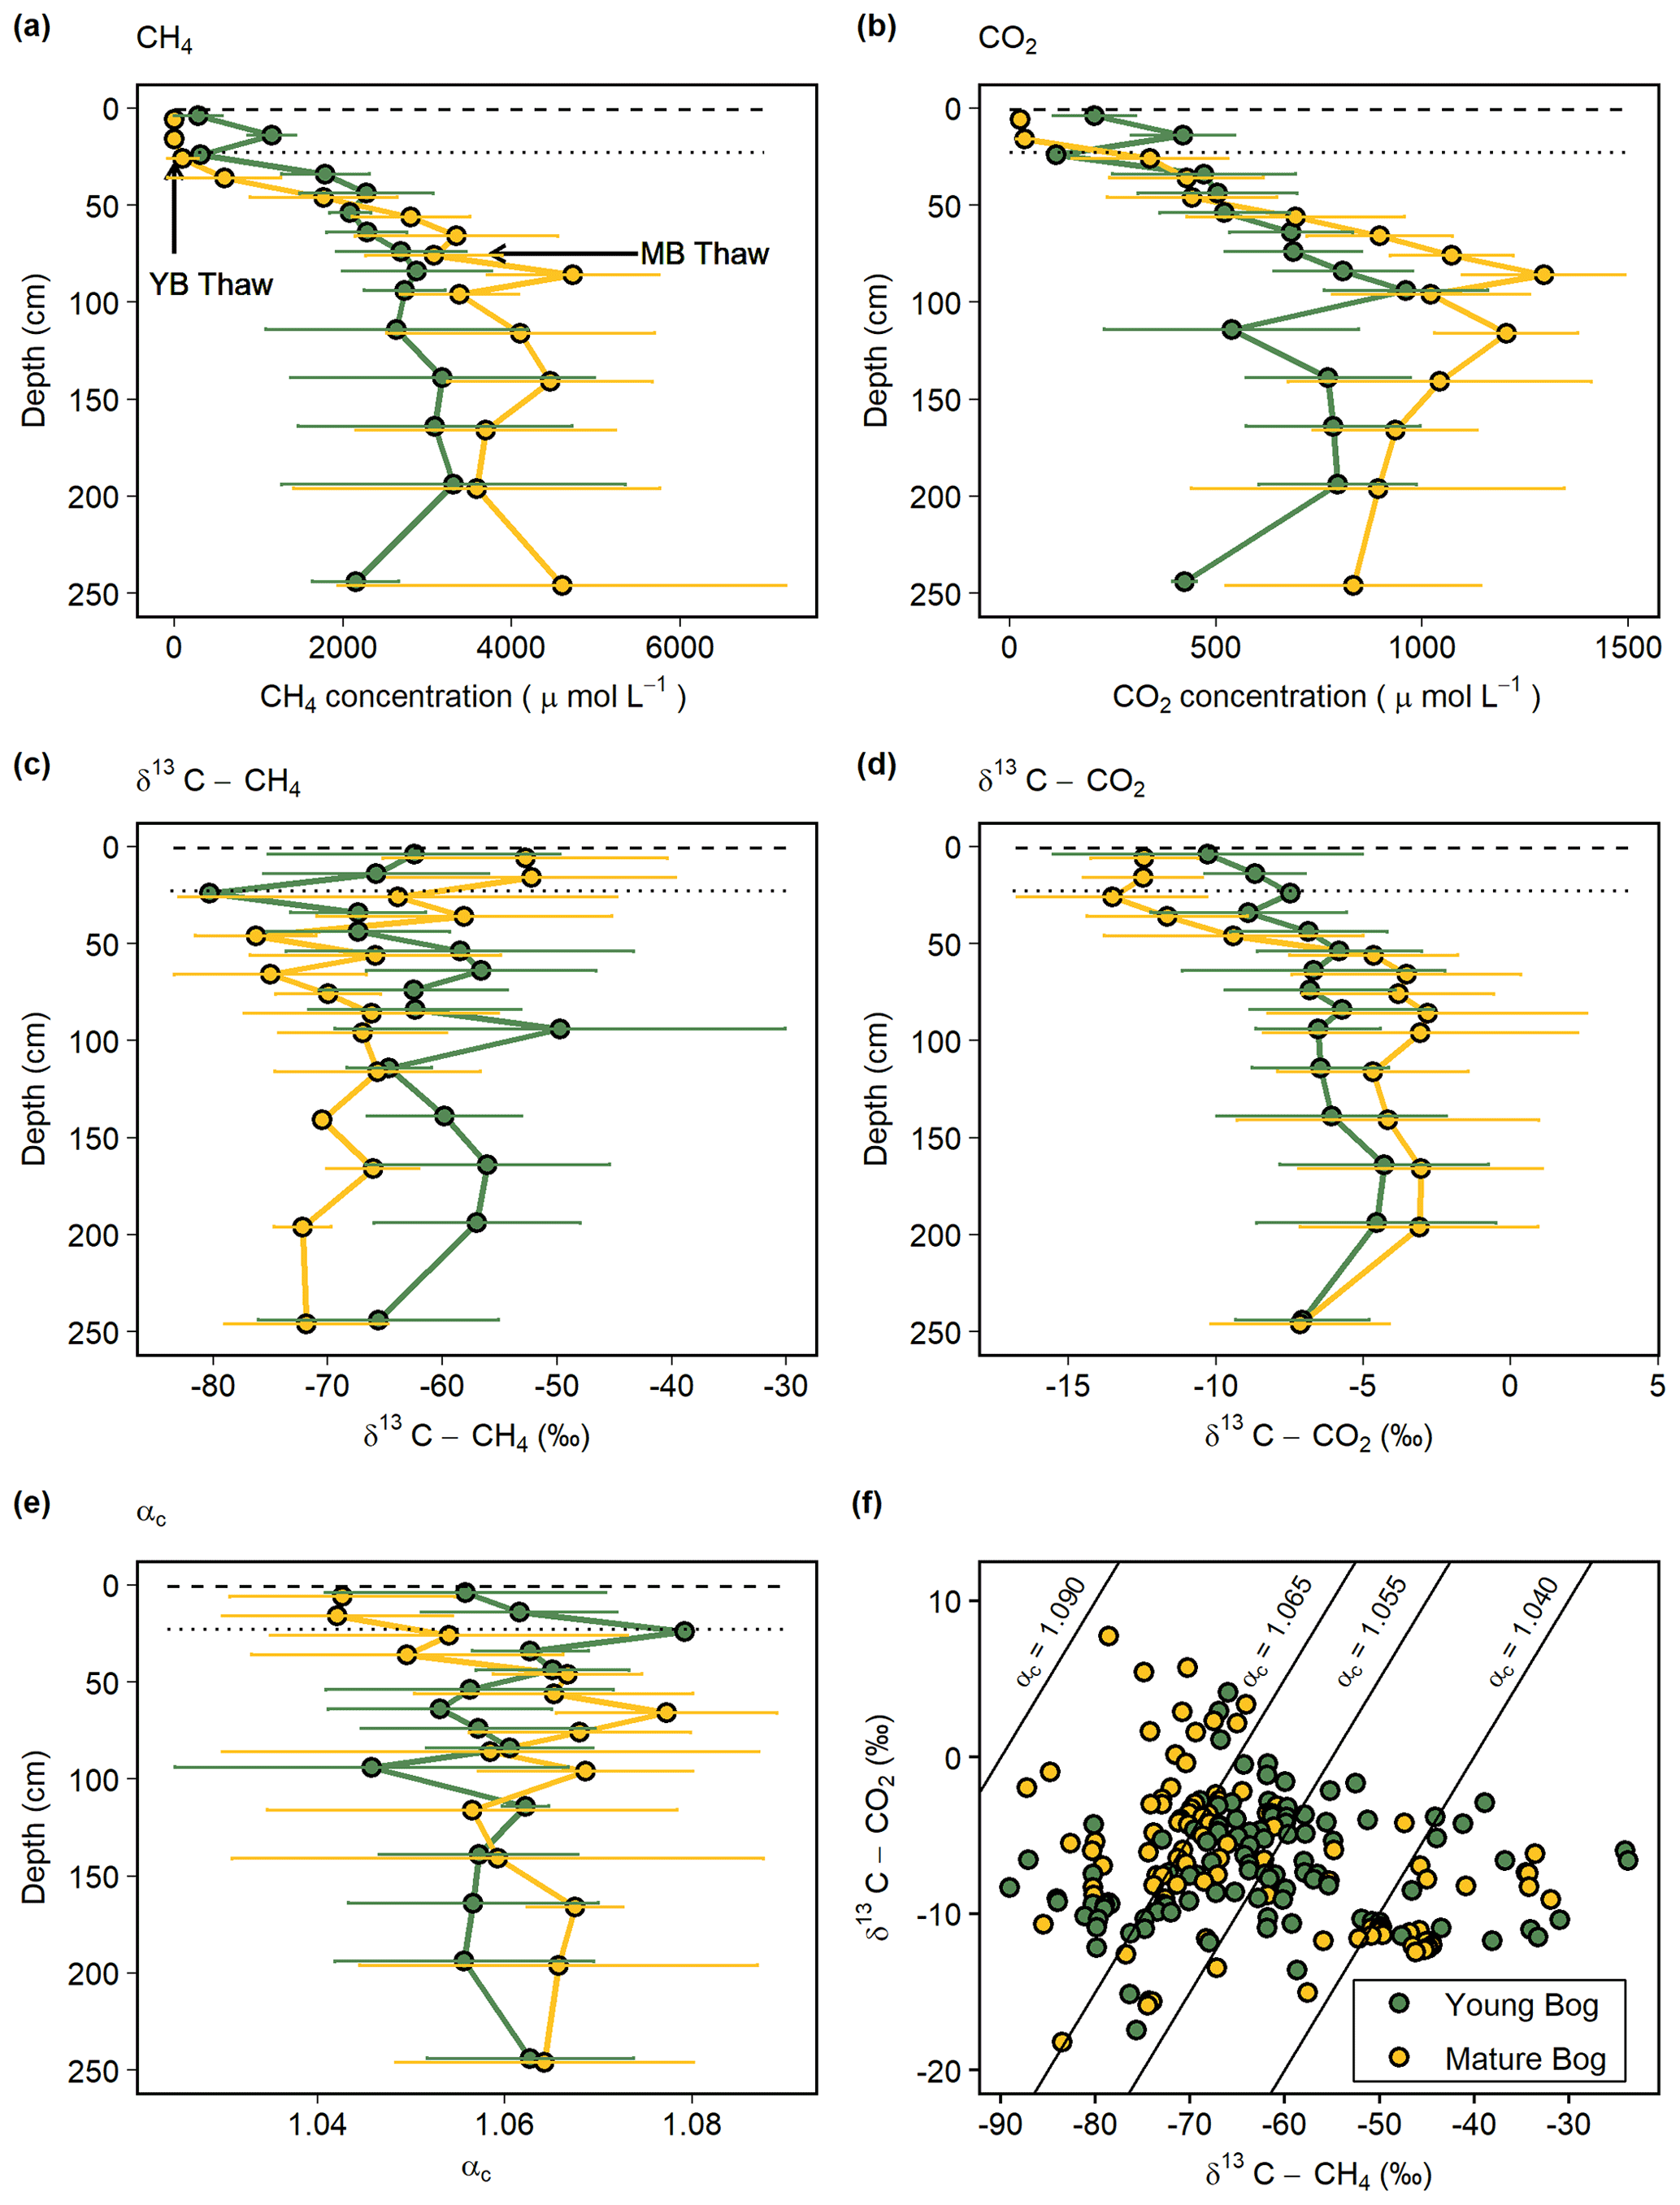
Figure 2Average seasonal (May–September) depth profiles in the young (green, black circles) and mature (yellow, black circles) bogs of (a) dissolved CH4 concentration ( µmol L−1), (b) dissolved CO2 concentration (µmol L−1), (c) δ13C-CH4 ( ‰), (d) δ13C-CO2 ( ‰), and (e) apparent fractionation factor (αc) between dissolved CH4 and CO2. (f) Cross-plot of corresponding δ13C-CH4 and δ13C-CO2 values (‰) in the young bog and mature bog from raw data used in panels (c) and (d). Diagonal lines represent different αc, where αc 1.040–1.065 represents acetoclastic methanogenesis, and αc 1.055–1.09 represents hydrogenotrophic methanogenesis (Whiticar, 1999). (a–e) Dashed and dotted horizontal lines represent water table depth in the young bog (YB) and mature bog (MB), respectively. Arrows in panel (a) represent depth of thaw transition in both the young bog (29 cm) and mature bog (71 cm), i.e., the transition from deep peat (accumulated prior to thawing) and shallow peat (accumulated post-thawing).
The young bog and mature bog had distinct profiles of δ13C values for both CH4 and CO2 (Fig. 2c, d). The young bog had no apparent trend with depth for both δ13C-CH4 (ANOVA: , P=0.08) and δ13C-CO2 (ANOVA: , P=0.07), averaging −62.4 ± 7.0 ‰ and −6.8 ± 1.6 ‰, respectively (Fig. 2c, d). In the mature bog we observed significant depth trends for both δ13C-CH4 (ANOVA: , P<0.01) and δ13C-CO2 (ANOVA: , P<0.001). These significant depth trends are due to isotopically heavy δ13C-CH4 and light δ13C-CO2 above the water table, which suggests an influence from CH4 oxidation. When comparing δ13C depth profiles between the thermokarst bogs we focused on those values taken from under the water table to avoid the effect of CH4 oxidation observed above the water table in the mature bog. Under the water table, δ13C-CH4 values in the mature bog were significantly lighter (ANOVA: , P<0.001) compared to the young bog at an average of −68.7 ± 5.0 ‰ and −62.4 ± 7.0 ‰, respectively. Conversely, the mature bog had isotopically heavier δ13C-CO2 than the young bog below the water table (ANOVA: , P<0.001).
The apparent fractionation factor (αC) is a robust parameter to characterize the relative contribution of CH4 production pathways, with values of 1.040–1.060 indicating acetoclastic methanogenesis and 1.060–1.090 indicating hydrogenotrophic methanogenesis (Chanton et al., 2005). Similar to the gas δ13C depth profiles, we found no clear trend with depth for αC values in the young bog (ANOVA: , P=0.59) with an average of 1.058 ± 0.012 and range of 1.018–1.079 (Fig. 2e). In the mature bog, we found a clear depth trend in αC values (ANOVA: , P<0.001). Similar to the δ13C depth profiles in the mature bog, this significant depth trend in αC is due to the influence of CH4 oxidation above the water table, with the lowest αC values being those from samples collected above the water table at 5, 15, and 25 cm. The average αC beneath the water table in the mature bog was 1.064 ± 0.017 and ranged from 1.015 to 1.094. When comparing αC values from beneath the water table between the young and mature bogs, we found that αC values were significantly lower in the young bog (ANOVA: , P<0.001).
In the isotopic ratio cross-plot of δ13C-CH4 and δ13C-CO2 (Fig. 2f), most of the young bog had αC values between 1.055 and 1.065 (29 in total), with a greater number of samples (21) between αC=1.040–1.055 compared to the mature bog (15). In contrast, a greater proportion of the mature bog samples had αC>1.065 (42 in the young bog and 52 in the mature bog). There was no clear depth trend in the αC values, and no samples in this study had αC>1.090. Several samples (13) from the young bog and mature bog had αC values of <1.040 likely due to CH4 oxidation (Knorr et al., 2009).
3.3 Magnitude and isotopic signature of land–atmosphere gas fluxes
The young bog had almost 3 times greater average CH4 fluxes than the mature bog during the May–September study period, at 82.3 ± 21.9 mg CH4 m−2 d−1 and 30.8 ± 10.6 mg CH4 m−2 d−1, respectively (Fig. 3a). Fluxes of CH4 in the young bog were greatest between June and August, ranging from 80.6 ± 40.3 m CH4 m−2 d−1 to 100.9 ± 63.1 mg CH4 m−2 d−1. The lowest young bog CH4 fluxes were observed in September at 55.0 ± 17.7 mg CH4 m−2 d−1 (Fig. S3a). Mature bog CH4 fluxes were greatest in September (55.8 ± 21.1 mg CH4 m−2 d−1) and lowest in May (5.6 ± 2.7 mg CH4 m−2 d−1). Ecosystem respiration (CO2 emissions measured with dark chambers) was significantly lower in the young bog than mature bog, with study period averages of 0.6 ± 0.3 and 1.9 ± 0.3 gĊO2 m−2 d−1, respectively (Fig. S3). Maximum ecosystem respiration in the young bog occurred in August (1.6 g CO2 m−2 d−1) and was much lower during the other 4 months (monthly averages of 0.2 to 0.4 g CO2 m−2 d−1). Ecosystem respiration rates in the mature bog were elevated from June to August (monthly averages between 2.1 and 2.6 g CO2 m−2 d−1) and decreased in September (0.8 g CO2 m−2 d−1). The proportion of total C emissions (sum of CH4 and CO2 emissions) released as CH4 were an order of magnitude greater in the young bog than mature bog stage, at 18 % and 2 %, respectively. This was a result of both higher CH4 emissions and lower ecosystem respiration (Fig. S3) in the young bog. The δ13C-CH4 signature of CH4 emissions (intercept values from Keeling plots) in the young bog were significantly greater than those observed in the mature bog (Fig. 3c; ANOVA: , P<0.05). The average δ13C-CH4 signature of CH4 emissions in the young bog (n=4) was −66.5 ± 1.4 ‰ (95 % confidence interval) and 78.5 ± 5.6 ‰ (95 % confidence interval; Fig. 3c) in the mature bog emissions (n=4).
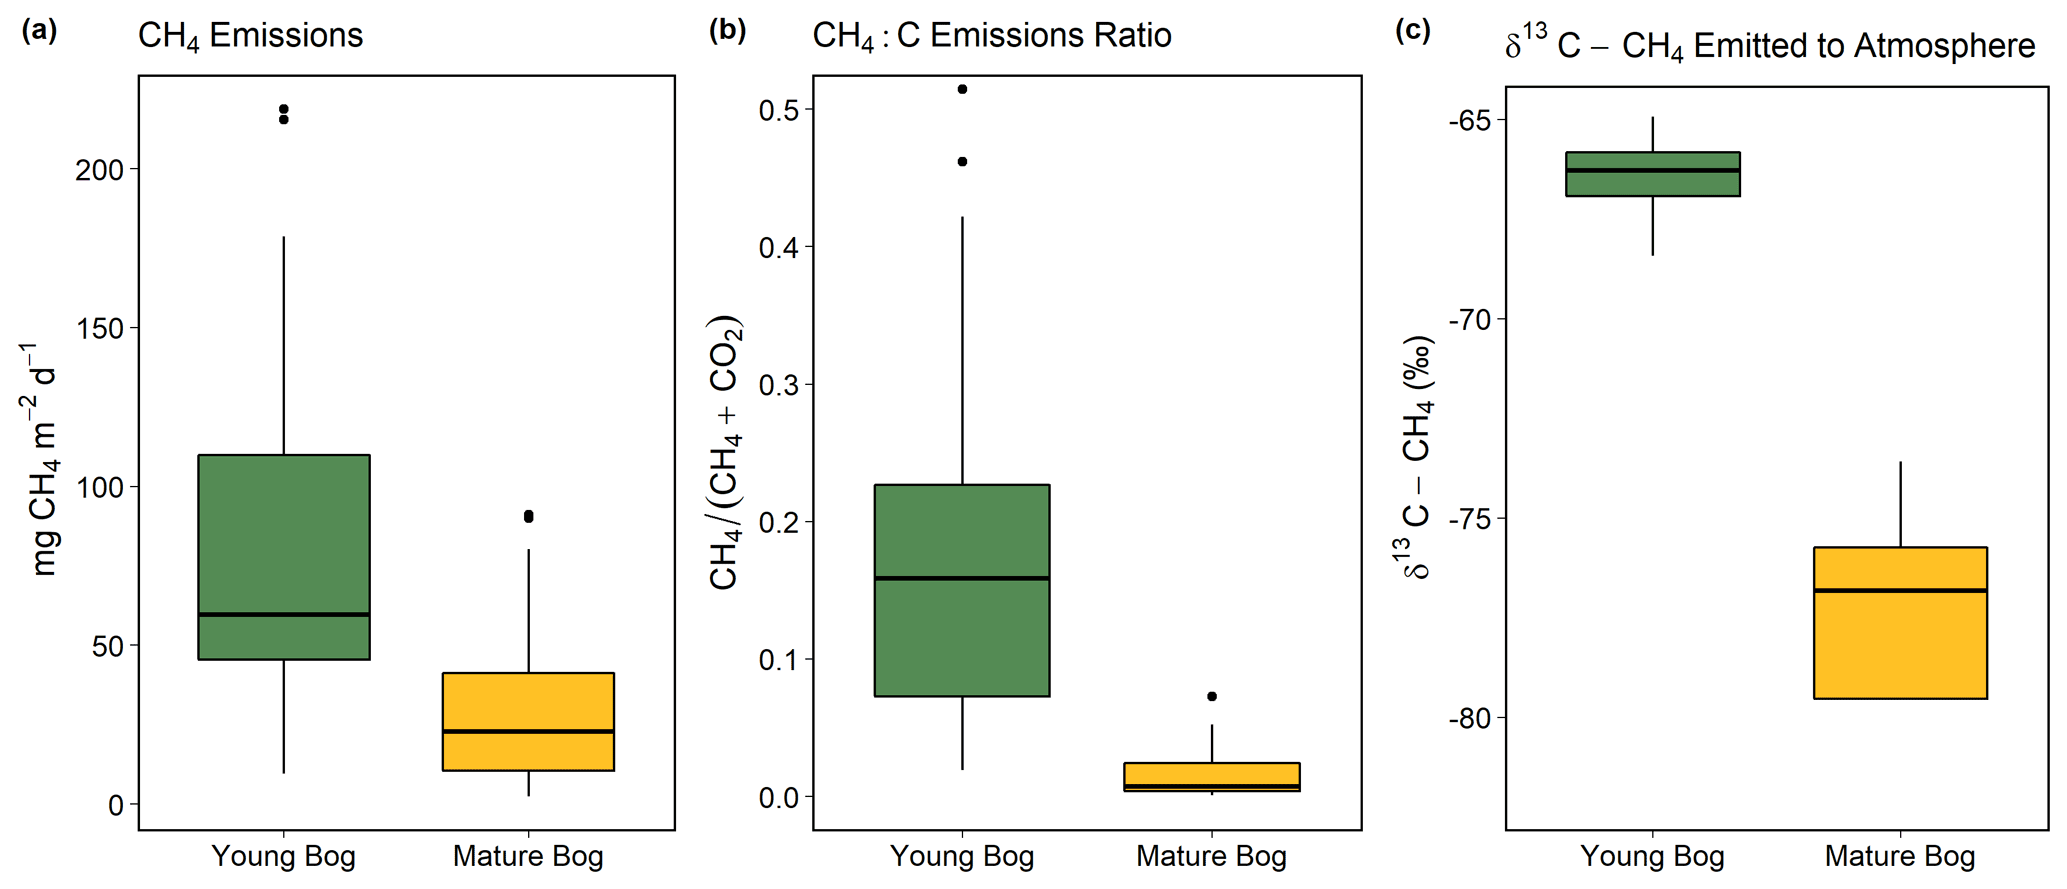
Figure 3Magnitude and isotopic signature of greenhouse gas fluxes from the young bog (green) and mature bog (yellow) shown as boxplots. Boxes represent the interquartile range (25 %–75 %), with median shown as black horizontal line. Whiskers extend to 1.5 times the interquartile range (distance between first and third quartile) in each direction, with outlier data plotted individually as black dots. (a) The magnitude of net land–atmosphere CH4 emissions as measured by soil chambers. (b) The ratio between CH4 emissions and the sum of CO2 emissions (ecosystem respiration) and CH4, both standardized to per gram C. (c) Intercept values of Keeling plots indicating the δ13C-CH4 signature of CH4 emissions. Isotopically heavier (i.e., less negative) δ13C-CH4 is produced via acetoclastic methanogenesis, whereas isotopically lighter (i.e., more negative) δ13C-CH4 is produced via hydrogenotrophic methanogenesis, The CH4 and CO2 land–atmosphere fluxes shown in (a) and (b) were measured once a month from May to September 2018. The δ13C-CH4 of CH4 emitted to the atmosphere was measured in September and October 2016 (see “Methods” for details and Fig. S4 for Keeling plots).
3.4 Microbial community structure along the permafrost peatland thaw gradient
We used NMDS ordinations to assess differences in microbial community structure between solid peat and pore water samples, between sampling depths, and between the plateau, young bog, and mature bog. The only exception was the plateau, where only peat samples were collected (i.e., no pore water samples). Microbial community structure in peat was determined to be significantly different from porewater microbial communities (PERMANOVA: R2=0.13, P<0.05, Fig. 4). The differences observed in the microbial community structure between peat and pore water samples could be a function of the different extraction methods used to extract DNA (Carrigg et al., 2007). Among the pore water samples, distinct microbial communities were found to be associated with the young bog and mature bog. Similarly, microbial community structure in peat was found to be significantly distinct between the three successional stages (plateau peat, young bog, and mature bog; Fig. 4; PERMANOVA: R2=0.18, P<0.05). There is also a common trend in vertical community structuring for all sample matrices according to depth. Changes in overall microbial community composition in both peat and pore water, across a vertical profile (to a maximum depth of 160 cm), illustrate a confluence in microbial community structure with depth in both the young and mature bogs (Fig. 4). In other words, community structure was most dissimilar at depths closer to the surface (Figs. 4, S2; PERMANOVA: R2=0.16, P<0.05). This trend was particularly evident in the porewater samples (Fig. 4). In the peat samples, though microbial communities did not fully converge, deeper young bog peat (i.e., 90–160 cm) communities did become more similar to communities found in the mature bog at intermediate depths (i.e., 30–70 cm) based on the nearness of sample points in NMDS ordinations (Fig. 4). We also observed that the mature bog near-surface peat samples were located closer to the plateau peat in NMDS ordinations (Fig. 4; PERMANOVA: R2=0.4, P=0.1). It was not possible to assess the presence of this cyclic succession (from young bog to mature bog to plateau) in the pore water samples since we did not characterize the microbial community in the plateau pore water. Finally, we also assessed the effect of seasonality on microbial community structure and found no effect with regards to sampling month (PERMANOVA: R2=0.02, P=0.090).

Figure 4Microbial community distribution according to stage of peat/pore water. NMDS ordinations of amplicon sequencing variant (ASV) data demonstrate significant community dissimilarities according to thaw stage for both pore water (shown by the triangles) and peat (shown by the circles) samples, encircled by 95 % confidence intervals. Colour gradient and lines demonstrate the shift in microbial community structure along vertical depth profiles in which lighter shades indicate samples closer to the surface.
The total archaeal community comprised 6 % of the entire microbial dataset. Methanogen-related orders comprised 54 % of this archaeal dataset and demonstrated marked differences in the relative abundance of acetoclastic-related methanogens according to thaw stage and depth in both peat and pore water samples (Figs. 5, S2). In the young and mature bog peat samples, hydrogenotrophic-related methanogens were ubiquitously present throughout both depth profiles (Fig. 5a). In comparison, acetoclastic-related methanogens exhibited a relatively restricted presence and were only present at specific depths (Fig. 5a). These communities were most abundant (>25 % of the total methanogenic community) near the surface in the young bog, just above and below the thaw transition zone (Fig. 5a). In the pore water, hydrogenotrophic methanogens were also dominant throughout depths in both stages of thaw (Fig. 5b). However, in contrast to peat samples, acetoclastic methanogens were virtually absent in the pore water, although minimally present (i.e., ≤ 10 % relative abundance) at depths between 35 and 155 cm, all found below the thaw transition zone (Fig. 5b).
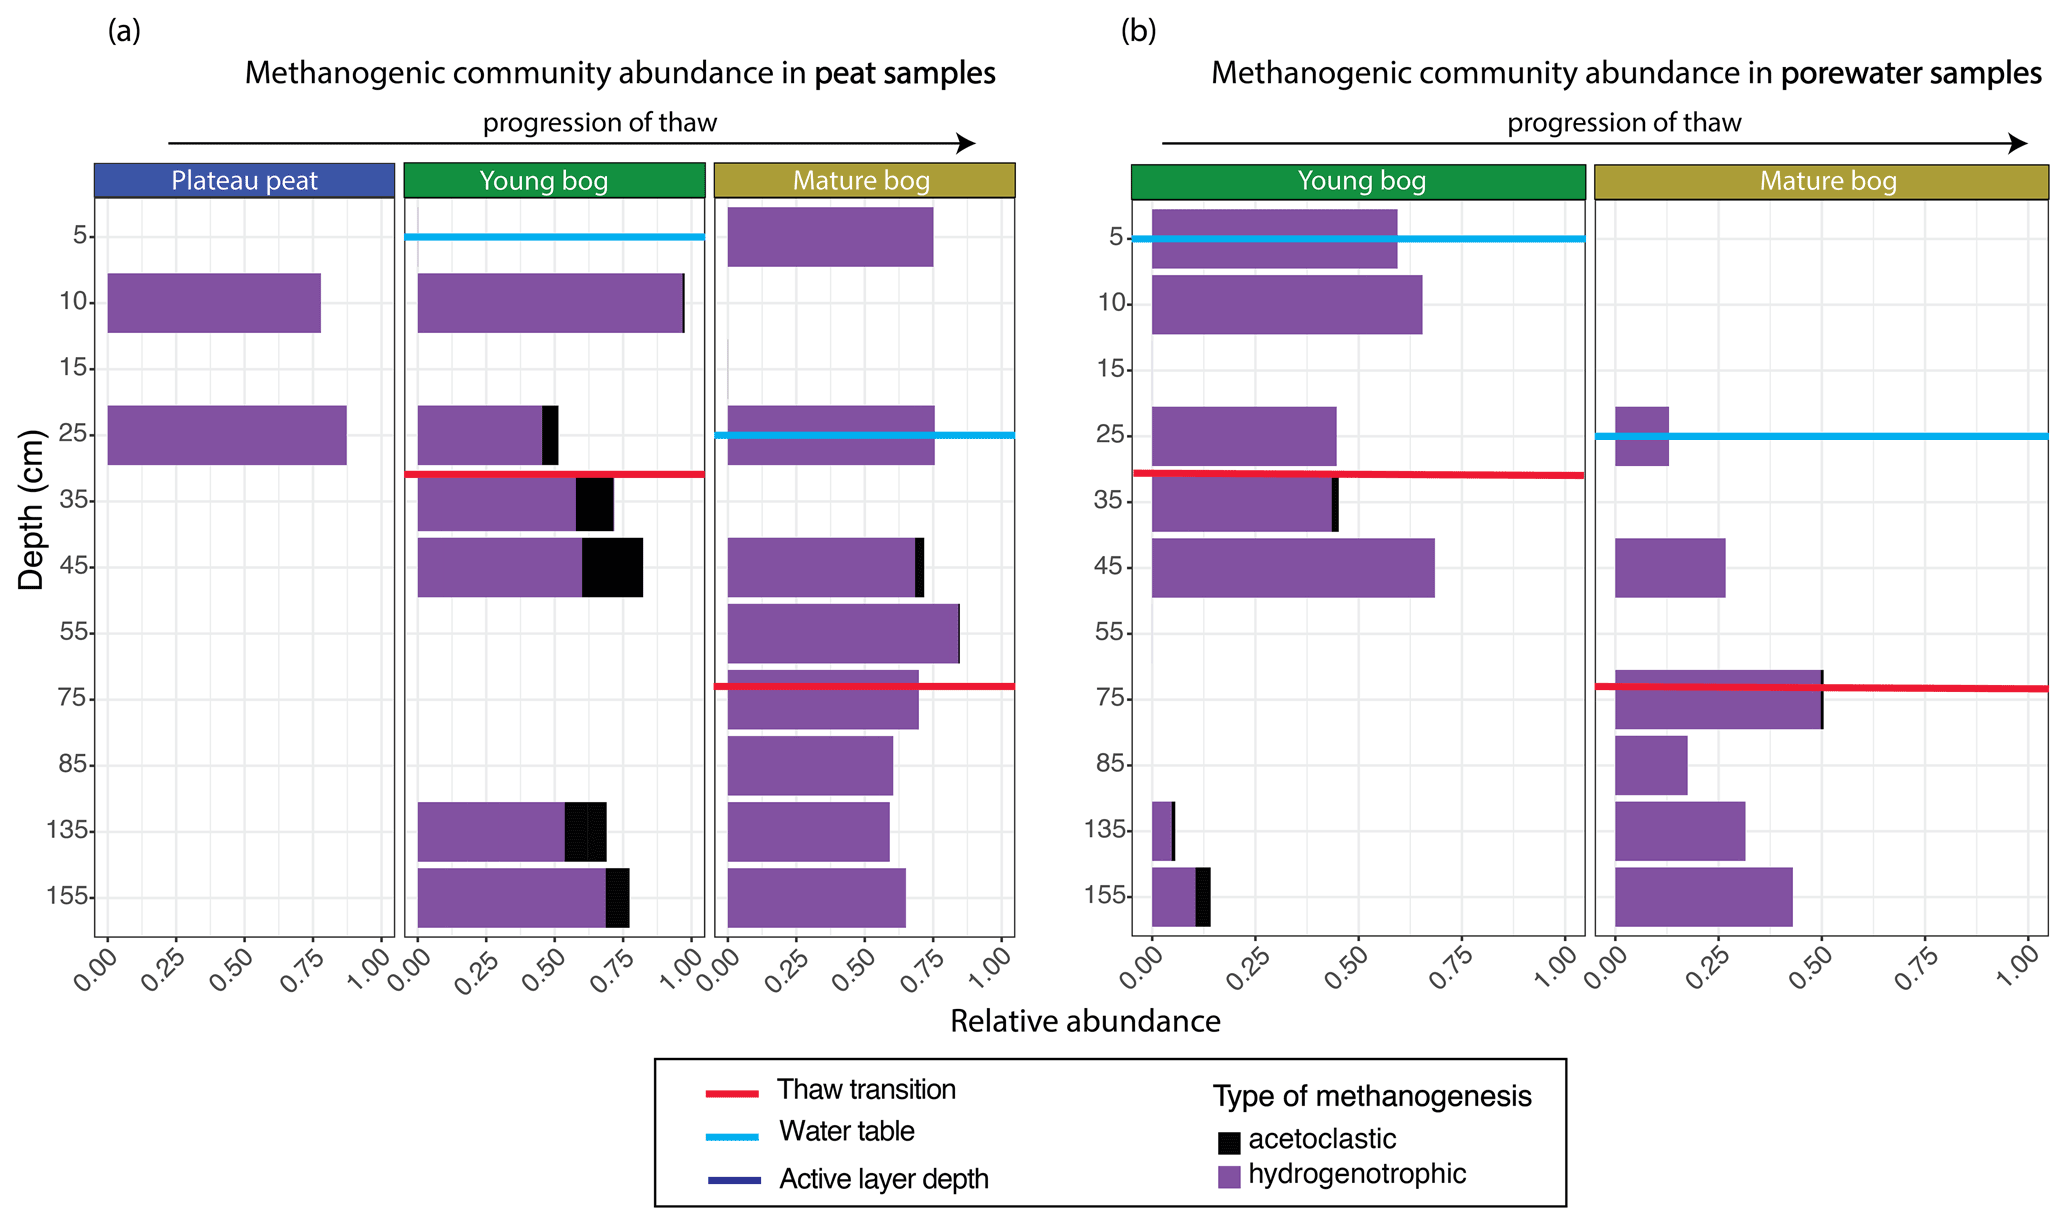
Figure 5Relative abundance of archaeal orders according to putative methanogenic capability along a depth profile for peat and pore water samples. Samples are arranged according to depth (y axis), with the relative abundance of methanogenic archaea resolved shown on the x axis. Note that the y axis does not uniformly progress in 10 cm increments. Progression of thaw is shown from plateau peat to young bog to mature bog at the top of the figures, with position of water table shown in blue for each panel. Red lines demonstrate thaw transition zone for the young bog and mature bog. (a) Stacked bar plot of methanogenic Archaea for all peat samples. Samples demonstrate significant differences in putative methanogen composition between all stages (Kruskal–Wallis test and Wilcox rank sum test, with Benjamini–Hochberg-corrected P values, P<0.05). (b) Stacked bar plot of methanogenic Archaea for all pore water samples. Samples do not demonstrate significant differences in putative methanogen composition between stages (Kruskal–Wallis test, with Benjamini–Hochberg-corrected P values, P=0.965).
Using a redundancy analysis (RDA, Fig. 6) we found that 27.6 % of variation in the methanogenic community was explained by two variables: thaw stage (ANOVA: P<0.05) and depth from the water table (ANOVA: P<0.05). Although these were the only two parameters that were identified as significant variables impacting microbial community structure when using a backward stepping model, it should be noted that there may be more variation in the community that our experimental design does not take into account as a result of unconstrained variation represented by plant–microbe and/or microbe–microbe interactions (Boon et al., 2014). Nonetheless, the 27.6 % variation explained is in accordance with other studies conducted in permafrost-impacted regions using similar methods, for which the percentage of explained variation falls between 6 % (low) to 43 % (high) (Comte et al., 2015; Hough et al., 2020). Next, we used variance partitioning to assess the extent to which thaw stage and depth from the water table (i.e., the significant environmental variables identified by the RDA) explained the variation in only the methanogenic community structure (Fig. 6). Based on this analysis, thaw stage explained 18.4 % and distance to the water table explained 4.3 % of methanogenic community variation.
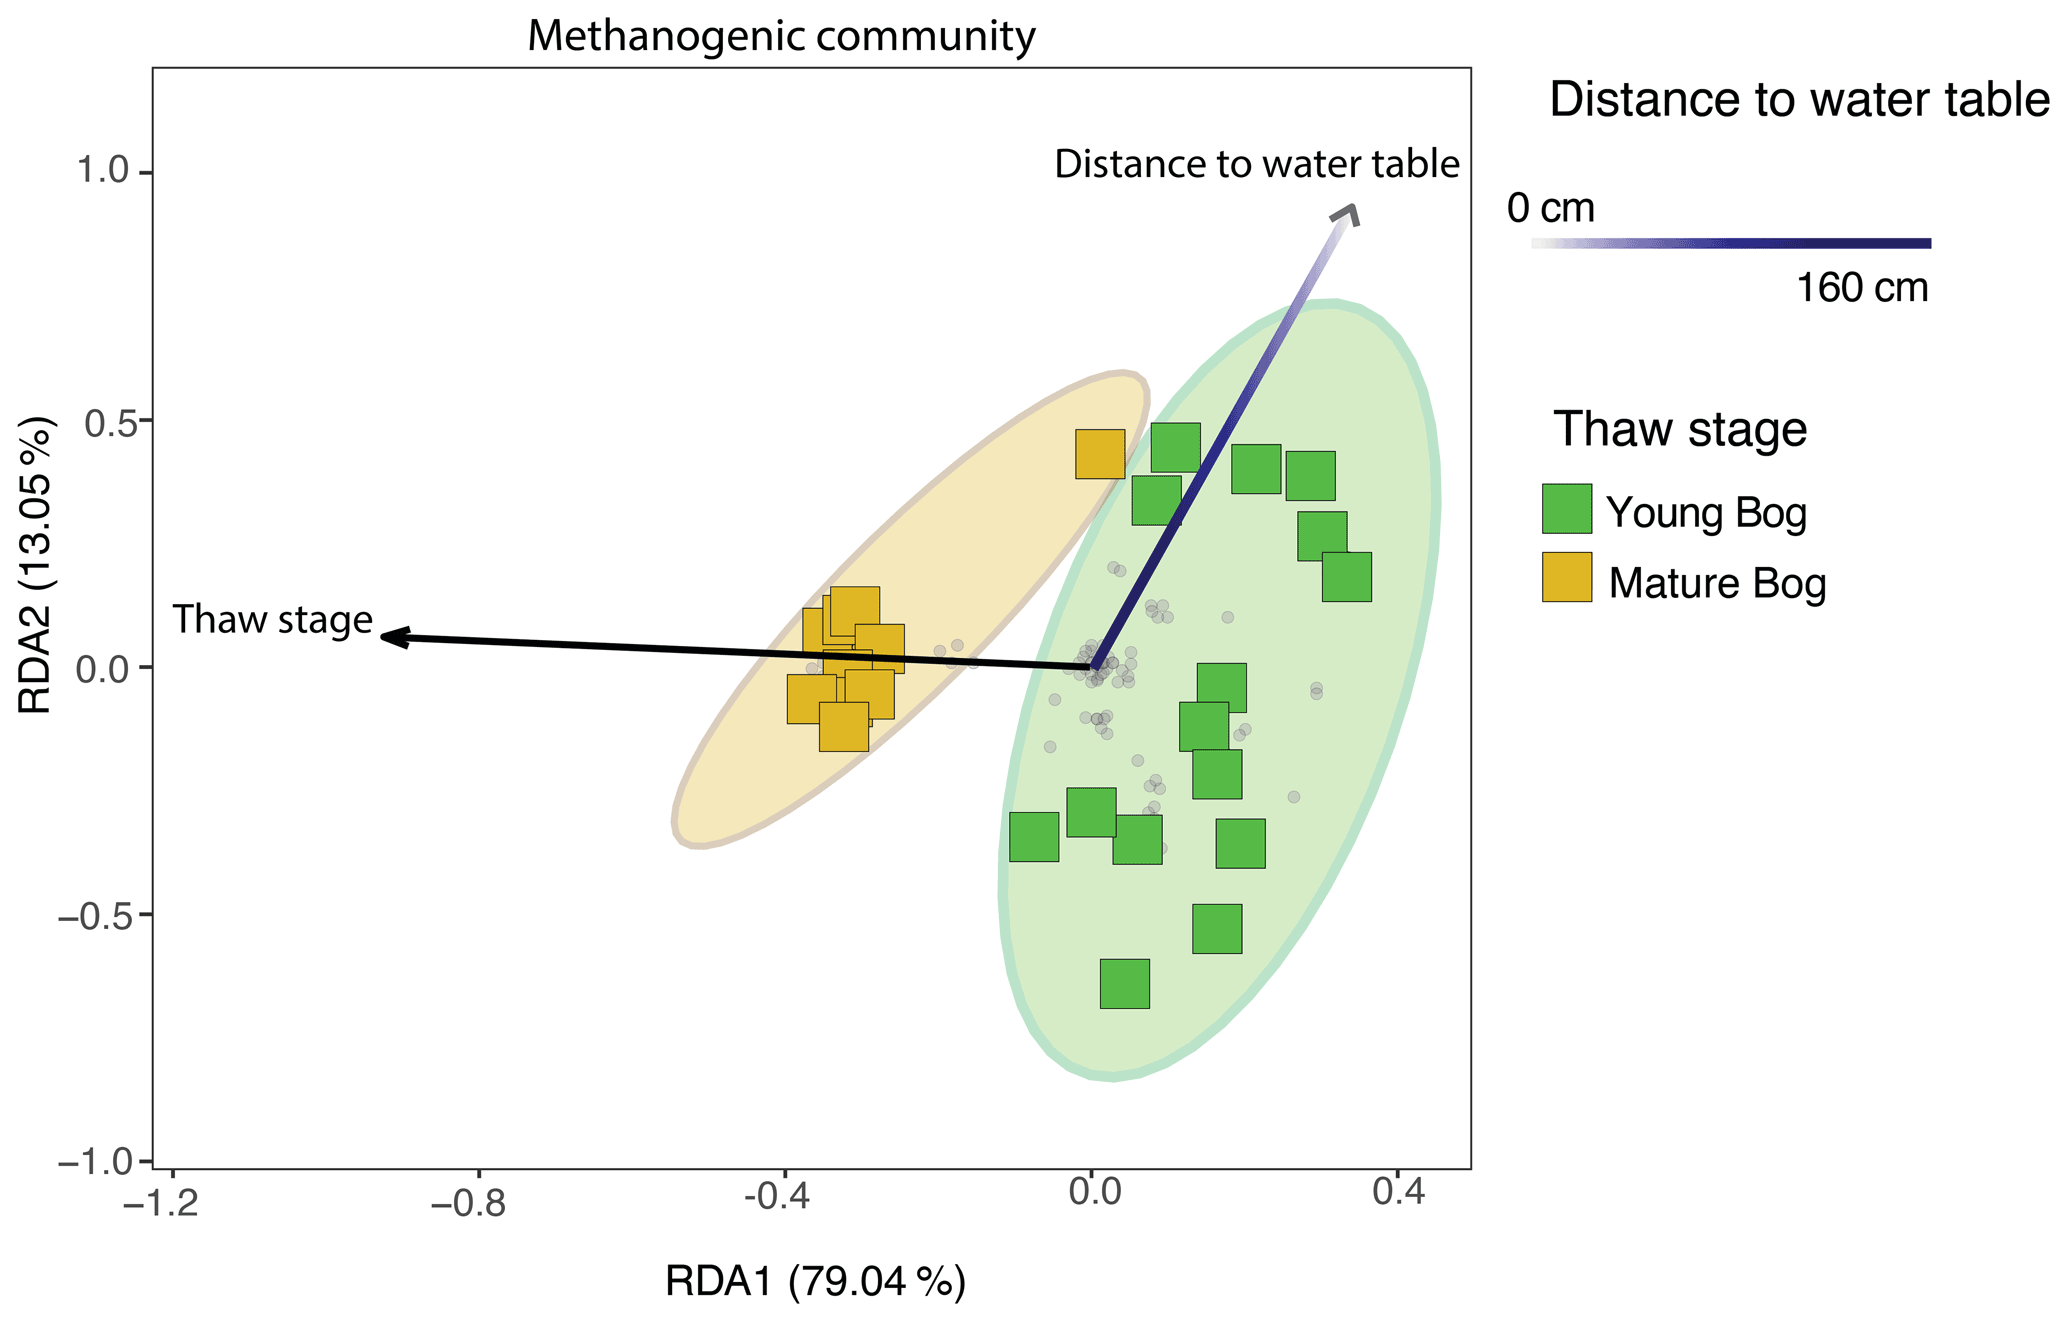
Figure 6Redundancy analysis (RDA) exploring significant biotic and abiotic variables influencing the total methanogenic community (adjusted R2=27.6 %), as determined by a backward stepping RDA model in the peat and pore water samples. All parameters that were used in the model are described in Sect. 2.1 of the “Methods”. Grey dots in the panel demonstrate the distribution of all ASVs in the methanogenic dataset. Shaded ellipses represent the 95 % confidence intervals for microbial community structure according to peatland thaw stage (young bog versus mature bog). Only significant (ANOVA: P<0.05) variables are shown. Using variation partitioning, we found that peatland thaw stage significantly explains about 18.4 % of methanogenic community variation, whereas distance to water table explained 4.3 %. Both axes are significant (ANOVA: P<0.05).
Our study shows that high CH4 emissions from thermokarst bogs in the initial decades following permafrost thaw (young bog) are not only linked to environmental conditions (wetness, soil temperature, vegetation) but are also driven by relatively increased microbial CH4 production through the energetically more favourable acetoclastic methanogenesis pathway. Evidence of putatively acetoclastic methanogens and CH4 produced via the acetoclastic metabolic pathway was found in the young bog both near the surface and at depths below the thaw transition (i.e., in peat that accumulated prior to permafrost thaw). We are unable to determine whether these greater CH4 emissions in the initial decades following thaw are due to the mineralization of labile organic matter released from previously frozen peat or are driven solely by fresh, labile DOM derived from surface vegetation leached throughout the peat profile. However, previous work in the discontinuous permafrost region in the Interior Plains of western Canada has found a limited contribution of previously frozen organic matter contributing to surface CH4 emissions in thermokarst bogs (Cooper et al., 2017). Elevated CH4 emissions then slow over the following centuries with succession into a mature thermokarst bog stage in which CH4 production is almost exclusively through the hydrogenotrophic pathway.
4.1 Shift in microbial community assemblages along a permafrost thaw gradient
Microbial communities varied along the permafrost thaw gradient: among different thaw stages (permafrost peat plateau, young bog, and mature bog), with peat depth (surface down to 160 cm), and between different sample types (solid peat and pore water). We found clear differences in microbial communities between the young bog and mature bog despite similar peat stratigraphy up to the surficial vegetation (Heffernan et al., 2020), where dominant Sphagnum species varied. The greater height of the peat surface above the water table and drier conditions in the mature bog, due to the slow accumulation of new peat over centuries, lead to a shift in vegetation composition from hydrophilic Sphagnum and graminoids towards more drought-resistant Sphagnum spp. and ericaceous shrubs. This shift in water table position and vegetation community, along with a decrease in temperatures (Fig. S1a) due to the thermal insulating properties of Sphagnum peat (Kujala et al., 2008), appears to have caused the observed differences in microbial communities between the young and mature bogs, even at depths >1 m. Microbial communities were most dissimilar between the peat plateau and young bog. This was unsurprising given the abrupt shift from the elevated, frozen, and relatively dry peat plateau forest to the young bog where the surface was saturated, was dominated by hydrophilic vegetation, and had warmer temperatures. We further noted that the microbial community of the mature bog was more similar with the peat plateau than with the young bog. Paleo-records in the region (Heffernan et al., 2020; Pelletier et al., 2017; Zoltai, 1993) show that many peatlands have undergone cyclical permafrost developments as thermal insulating properties of Sphagnum peat in mature bogs leads to the re-aggradation of permafrost peat plateaus. Our study suggests that the peat plateau microbial community is influenced by the preceding mature bog microbial community as permafrost aggrades.
The most dissimilar microbial community composition was observed between samples near the surface and those at depth (i.e., down to 160 cm), as has also been observed in other permafrost ecosystems (Frey et al., 2016; Monteux et al., 2018). Shifts in microbial community composition along the thaw gradient were most evident nearer the surface, whereas communities found at depth were similar between the young bog and mature bog (Fig. 4). At the surface, microbial community structure is influenced by the successional vegetation community (Hodgkins et al., 2014), and the role that vegetation, particularly graminoids which are found in the young bog, has on microbial community structure has been well documented in northern peatlands (Robroek et al., 2015, 2021; Bragazza et al., 2015). Moderately acidic, saturated peatlands with hydrophilic vegetation, similar to the young bog, have been shown to harbour acid-tolerant fermenting bacteria that produce substrates for methanogenesis and are trophically linked with methanogens (Wüst et al., 2009). Thus, the interaction between water table position, pH, and vegetation community influences the substrates available to the microbial community, which in turn impacts the surface community's structure (Kotiaho et al., 2013). In contrast, communities at depth are known to be influenced by peat properties, such as peat chemistry and degree of decomposition, and the paleoenvironment under which they originally colonized (Lee et al., 2012; Holm et al., 2020). In the young and mature bogs, both peat properties (humification indices including FTIR (Fourier-transform infrared spectroscopy) cm−3 and C : N ratios) and the paleoenvironment at depth are similar (Heffernan et al., 2020), which may explain the observed convergence of microbial community structure. Nonetheless, although there are some similarities at depth between both young and mature bogs, microbial communities inhabiting either are still distinct (Fig. 4). This is emphasized by the differing abundance of Archaea that participate in hydrogenotrophic or acetoclastic methanogenesis (Fig. 5) in both stages down the peat profile.
As has been shown previously in other thermokarst peatlands (McCalley et al., 2014), the young and mature bog stages were dominated by hydrogenotrophic methanogens. However, putatively acetoclastic methanogens were relatively more abundant in the young bog (Fig. 5), particularly at or below the transition in peat that accumulated prior to permafrost thaw. Thaw stage and distance from the water table were found to influence the methanogenic community composition (Fig. 6), with distance from the water table dictating where anoxic conditions persist (Blodau et al., 2004) and thus where methanogenic colonization can occur. The influence of vegetation communities associated with different thermokarst peatland stages on methanogenic community composition has previously been attributed to the role of plant-derived DOM serving as the substrate for CH4 production (Liebner et al., 2015; McCalley et al., 2014). The presence of hydrophilic vegetation, particularly graminoids, in the saturated young bog provides the precursors for fermentation, yielding acetate (Liebner et al., 2015; Ström et al., 2003, 2012, 2015) and serving as the substrate for acetoclastic CH4 production. The downward transport from the surface of plant-derived DOM in the young bog (Chanton et al., 2008) likely provides sufficient acetate for the establishment of acetoclastic methanogens at depth in this environment.
4.2 Production and emissions of CH4 along a peatland thaw gradient
Isotopic signatures (δ13C) of dissolved CO2 and CH4, αC values in porewater, and the δ13C signature of CH4 emitted to the atmosphere provided further evidence of relatively elevated acetoclastic methanogenesis in the young bog stage. The general increase in δ13C-CO2 with depth observed at both sites (Fig. 2d) indicates accumulation of isotopically heavier δ13C-CO2 which is likely explained by the preferential use of isotopically lighter δ13C-CO2 during hydrogenotrophic methanogenesis (Hornibrook et al., 2000). As a result, CH4 tends to become lighter with depth, and this was particularly apparent in the mature bog (Fig. 2c). This leads to the average αC values of 1.064 (δ13C-CH4; −68.7 ‰) in the mature bog, which were significantly higher than the 1.058 (δ13C-CH4; −62.4 ‰) observed in the young. Together, the δ13C-CH4 and δ13C-CO2 data and the resulting αC depth profiles suggest that the majority of CH4 is produced via the hydrogenotrophic methanogenic pathway, which supports the findings of the microbial community analysis (Fig. 5). Our isotope data also suggest that a greater proportion of CH4 is produced via acetoclastic methanogenesis throughout the profile in the young bog compared to the mature bog (Fig. 2c–f). This is evident from lower average αC values found in the young bog compared to the mature bog, as well as the greater number of these young bog αC values falling between 1.040 and 1.065, which represents acetoclastic methanogenesis (Whiticar, 1999). These findings again agree with the relatively greater abundance of acetoclastic methanogens observed at that site (Fig. 5).
In this study we found that average CH4 emissions in the initial decades following thaw, in the young bog stage, were 2.5–3 times greater than emissions measured in the mature bog stage which had thawed ∼ 200 years ago (Fig. 3a). Furthermore, the proportion of CH4 to overall C emissions (Fig. 3b) was considerably greater in the young bog than in the mature bog. In the mature bog the lower water table position leads to both increased CO2 emissions and decreased CH4 emissions, resulting in a reduced fraction of C emissions as CH4. Previous studies have shown similarly increased CH4 emissions in the initial decades following thaw (Johnston et al., 2014; Wickland et al., 2006). While our pore water chemistry data are inconclusive with regards to organic carbon characteristics, other work in thermokarst bogs in the Interior Plains of western Canada has shown that the organic matter derived from the young bog vegetation community is highly labile (Burd et al., 2020). Previous work at our study site has shown that the vegetation community in the young bog is associated with greater potential enzymatic degradation of organic matter (Heffernan et al., 2021). Hydrolysis of plant-derived organic matter by extracellular enzymes leads to the formation of monomers (Kotsyurbenko, 2005). These monomers can be further degraded to form acetate and other precursors for methanogenesis when present with anaerobic fermenting bacteria (Hamberger et al., 2008) and near the surface and vegetation inputs (Hädrich et al., 2012). Our study shows that these higher CH4 emissions are likely linked to increased wetness, temperatures, and a vegetation community associated with more labile organic matter which favour a greater proportion of CH4 produced via acetoclastic methanogenesis, as shown by our δ13C-CH4 values, αc depth profiles, and microbial community composition analyses.
Many factors, including environmental conditions and microbial community structure likely contribute to the differences in net CH4 emissions from the young and mature bogs (Fig. 3a). Methane oxidation has been shown to be an important regulator of post-thaw CH4 emissions (Perryman et al., 2020) and to result in isotopically heavier (i.e., less negative) δ13C-CH4 and lighter (i.e., more negative) δ13C-CO2 (Whiticar, 1999). Our data suggest the role of CH4 oxidation was different between sites. Methane oxidation was apparent in the δ13C-CH4 and δ13C-CO2 signatures above the water table in the mature bog, but no CH4 oxidation is evident in the young bog (Fig. 2c, d). The difference in gas flux δ13C signatures (Fig. 3c) also suggests a greater prevalence of CH4 oxidation in the mature bog. However, increased oxidation above the water table in the mature bog is likely not fully responsible for the observed differences in CH4 surface emissions and depth profiles between the young and mature bogs. Lower soil temperatures, a vegetation community associated with reduced substrate availability, the dominance of hydrogenotrophic methanogenesis throughout the peat profile, and a deeper water table position all contribute to the lower CH4 production and higher CH4 oxidation observed in the mature bog. Nonetheless, using this interdisciplinary approach, we are unable to determine the relative contribution of acetoclastic methanogenesis at each depth to the overall emissions at the surface.
Our results, and those of others (Euskirchen et al., 2014; Johnston et al., 2014), have shown that CH4 emissions exhibit seasonal variation (Fig. S3a, c). However, in contrast to some previous findings (Ebrahimi and Or, 2017), we did not observe a corresponding seasonal response in the microbial community composition (Fig. S2). This may be a sampling design effect since our study spanned only 2 months (June and September), compounded by the fact that we did not have replicate samples to test the robustness of this finding. However, other studies have also shown that soil microbial community growth is not impacted by seasonal variations in temperature (Simon et al., 2020) and that microbial communities require a longer timescale (years–decades–centuries) to respond to temperature following thaw (Feng et al., 2020). Our results corroborate these observations, suggesting a long-term response in the microbial community composition to the ecological shifts associated with autogenic peatland succession following permafrost thaw. Autogenic peatland succession following thaw occurs on the decade to century timescale, shifting from recently thawed to mature thermokarst bogs (Camill, 1999). Both recently thawed (young) and mature thermokarst bogs have distinct hydrological regimes, vegetation communities, and peat chemistry. Following thaw, associated changes in vegetation and litter input alter microbial community composition and activity (Adamczyk et al., 2020; Kirkwood et al., 2021). Such changes in microbial community structure thus impact CH4 emissions from thermokarst peatlands. Under predicted climatic warming scenarios differences in microbial community composition have been shown to be increasingly driven by seasonally independent variables such as substrate quality and the legacy effects of soil temperatures (Luláková et al., 2019). This study suggests that the environmental conditions required for increased methanogenic activity at depth is limited to the initial decades following thaw, after which the microbial community structure changes in response to the lowering of the water table, lower soil temperatures, and shifts in the vegetation community.
This study demonstrates that higher CH4 emissions in thermokarst bogs in the initial decades following thaw are driven by shifts in vegetation communities that produce organic matter inputs of varying lability (Burd et al., 2020) and a prevalence of anoxic conditions, which was associated with an increase in acetoclastic methanogenesis in our site. The influence of this pathway was apparent at depth throughout the peat profile. With succession following thaw towards a mature thermokarst bog, a shift in water table position and vegetation composition seems to reduce the role of the acetoclastic methanogenesis pathway. Previous work at this site (Heffernan et al., 2021) and other thermokarst peatlands in the discontinuous permafrost zone of boreal western Canada (Burd et al., 2020) have indicated that the vegetation community found in the initial decades following permafrost thaw is associated with increased potential enzymatic degradation and biodegradability of organic matter compared to that found in the mature bog. Average growing season CH4 emissions were 2.5–3 times greater in the recently thawed young bog. Overall, C emissions in the young bog contained proportionally more CH4 than those from the mature bog due to greater CH4 production and also reduced CO2 emissions. These greater CH4 emissions in the young bog are driven by a higher contribution to surface emissions from CH4 produced throughout the peat profile by acetoclastic methanogens. The response of the microbial community to permafrost thaw is tied to the shifting environmental conditions associated with peatland autogenic succession. Warmer and wetter conditions in the initial decades following thaw, in conjunction with a vegetation community associated with greater availability of labile plant leachates (Bragazza et al., 2015), provide favourable conditions for acetoclastic methanogens throughout the peat profile. Given the projected increases in thermokarst peatland formation (Olefeldt et al., 2016), our study suggests that we can expect a pulse of CH4 emissions from current regions of the discontinuous permafrost zone. This pulse will be driven, in part, by increased acetoclastic methanogenesis from labile substrates in recently thawed thermokarst peatlands. However, this rapid increase in CH4 emissions will only remain at the decadal to century scale as autogenic peatland succession results in relatively drier mature thermokarst bogs, where lower temperatures and less labile substrate availability lead to a dominance of hydrogenotrophic methanogenesis.
All biogeochemical and enzyme datasets generated and analyzed during this study are available in the UAL Dataverse repository (https://doi.org/10.5683/SP3/5TSH9V, Heffernan, 2021). Microbial sequences used in this study can be accessed from the NCBI database, using accession number PRJNA660023 (https://www.ncbi.nlm.nih.gov/bioproject/PRJNA660023, Cavaco, 2020).
The supplement related to this article is available online at: https://doi.org/10.5194/bg-19-3051-2022-supplement.
All authors contributed to the conception of the work. LH and CEA performed the field work component. LH performed the biogeochemistry measurements. MAC performed the microbial measurements. LH and MAC analyzed the data and wrote the manuscript draft. MPB contributed lab space and expertise on microbial community analyses and provided feedback on the writing and figures. KHK helped to set up the field sampling campaign and provided valuable feedback for the writing and analyses. DO supported the field campaign for these samples and provided his expertise on the writing and interpretation of figures. All authors reviewed and edited the manuscript.
The contact author has declared that neither they nor their co-authors have any competing interests.
Publisher's note: Copernicus Publications remains neutral with regard to jurisdictional claims in published maps and institutional affiliations.
The authors wish to thank McKenzie Kuhn, Maya Frederickson, Jördis Stührenberg, and Trisha Elliot for assistance with field and lab work. We also thank Sophie Dang at MBSU for providing guidance throughout 16S rRNA gene library building and for subsequently sequencing these libraries.
This research has been supported to David Olefeldt and Maya P. by the Natural Sciences and Engineering Research Council of Canada Discovery Grant (grant nos. RGPIN-2016-04688 (David Olefeldt) and RGPIN-2020-05975 (Maya P. Bhatia)).
This paper was edited by Luo Yu and reviewed by three anonymous referees.
Adamczyk, M., Perez-Mon, C., Gunz, S., and Frey, B.: Strong shifts in microbial community structure are associated with increased litter input rather than temperature in High Arctic soils, Soil Biol. Biochem., 151, 1–14, https://doi.org/10.1016/j.soilbio.2020.108054, 2020.
Allan, E., Manning, P., Alt, F., Binkenstein, J., Blaser, S., Blüthgen, N., Böhm, S., Grassein, F., Hölzel, N. Klaus, V.H., Kleinebecker, T., Morris, E.K., Oelmann, Y., Prati, D., Renner, S.C., Rillig, M.C., Schaefer, M., Schloter, M., Schmitt, B., Schöning, I., Schrumpf, M., Solly, E., Sorkau, E., Steckel, J. Steffen-Dewenter, I., Stempfhuber, B., Tschapka, M., Weiner, C.N., Weisser, W.W., Werner, M., Westphal, C., Wilcke, W., and Fischer M.: Land use intensification alters ecosystem multifunctionality via loss of biodiversity and changes to functional composition, Ecol. Lett., 18, 834–843, https://doi.org/10.1111/ele.12469, 2015.
Baltzer, J. L., Veness, T., Chasmer, L. E., Sniderhan, A. E., and Quinton, W. L.: Forests on thawing permafrost: fragmentation, edge effects, and net forest loss, Glob. Change Biol., 20, 824–834, https://doi.org/10.1111/gcb.12349, 2014.
Bartram, A. K., Lynch, M. D., Stearns, J. C., Moreno-Hegelsieb, G., and Neufeld, J. D.: Generation of multimillion-sequence 16S rRNA gene libraries from complex microbial communities by assembling paired-end illumina reads, Appl. Environ. Microbiol., 77, 3846–3852, https://doi.org/10.1128/AEM.02772-10, 2011.
Bauer, I. E., Gignac, L. D., and Vitt, D. H.: Development of a peatland complex in boreal western Canada: Lateral site expansion and local variability in vegetation succession and long-term peat accumulation, Can. J. Bot., 81, 833–847, https://doi.org/10.1139/b03-076, 2003.
Beilman, D. W.: Plant community and diversity change due to localized permafrost dynamics in bogs of western Canada, Can. J. Bot., 79, 983–993, https://doi.org/10.1139/cjb-79-8-983, 2001.
Bellisario, L. M., Bubier, J. L., Moore, T. R., and Chanton, J. P.: Controls on CH4 emissions from a northern peatland, Global Biogeochem. Cy., 13, 81–91, https://doi.org/10.1029/1998GB900021, 1999.
Berghuis, B. A., Yu, F. B., Schulz, F., Blainey, P. C., Woyke, T., and Quake, S. R.: Hydrogenotrophic methanogenesis in archaeal phylum Verstraetearchaeota reveals the shared ancestry of all methanogens, P. Natl. Acad. Sci. USA., 116, 5037–5044, https://doi.org/10.1073/pnas.1815631116, 2019.
Blodau, C., Basiliko, N., and Moore, T. R.: Carbon turnover in peatland mesocosms exposed to different water table levels, Biogeochemistry, 67, 331–351, https://doi.org/10.1023/B:BIOG.0000015788.30164.e2, 2004.
Boon, E., Meehan, C. J., Whidden, C., Wong, D. H., Langille, M. G., and Beiko, R. G.: Interactions in the microbiome: communities of organisms and communities of genes, FEMS Microbiol. Rev., 38, 90–118, https://doi.org/10.1111/1574-6976.12035, 2014.
Boylen, E., Rideout, J. R., Dillon, M. R., et al.: Reproducible, interactive, scalable and extensible microbiome data science using QIIME 2, Nat. Biotechnol., 37, 852–857, https://doi.org/10.1038/s41587-019-0209-9, 2019.
Bragazza, L., Bardgett, R. D., Mitchell, E. A. D., and Buttler, A.: Linking soil microbial communities to vascular plant abundance along a climate gradient, New Phytol., 205, 1175–1182, https://doi.org/10.1111/nph.13116, 2015.
Bridgham, S. D., Cadillo-Quiroz, H., Keller, J. K., and Zhuang, Q.: Methane emissions from wetlands: Biogeochemical, microbial, and modeling perspectives from local to global scales, Glob. Change Biol., 19, 1325–1346, https://doi.org/10.1111/gcb.12131, 2013.
Brown, J., Ferrians Jr., O. J., Heginbottom, J. A., and Melnikov, E. S.: Circum-Arctic map of permafrost and ground ice conditions, USGS Numbered Series, 1, 45, https://doi.org/10.1016/j.jallcom.2010.03.054, 1997.
Burd, K., Estop-Aragonés, C., Tank, S. E., and Olefeldt, D.: Lability of dissolved organic carbon from boreal peatlands: interactions between permafrost thaw, wildfire, and season, Can. J. Soil Sci., 13, 1–13, https://doi.org/10.1139/cjss-2019-0154, 2020.
Burger, M., Berger, S., Spangenberg, I., and Blodau, C.: Summer fluxes of methane and carbon dioxide from a pond and floating mat in a continental Canadian peatland, Biogeosciences, 13, 3777–3791, https://doi.org/10.5194/bg-13-3777-2016, 2016.
Cai, L., Alexeev, V. A., Arp, C. D., Jones, B. M., Liljedahl, A., and Gädeke, A.: Dynamical Downscaling Data for Studying Climatic Impacts on Hydrology, Permafrost, and Ecosystems in Arctic Alaska, Earth Syst. Sci. Data Discuss. [preprint], https://doi.org/10.5194/essd-2016-31, 2016.
Callahan, B. J., Wong, J., Heiner, C., Oh, S., Theriot, C. M., Gulati, A. S., McGill, S. K., and Dougherty, M. K.: High-throughput amplicon sequencing of the full-length 16S rRNA gene with single-nucleotide resolution, Nucl. Acid. Res., 47, 1–12, https://doi.org/10.1093/nar/gkz569, 2019.
Camill, P.: Peat accumulation and succession following permafrost thaw in the Boreal peatlands of Manitoba, Canada, Ecoscience, 6, 592–602, https://doi.org/10.1080/11956860.1999.11682561, 1999.
Carrigg, C., Rice, O., Kavanagh, S., Collins, G., and O'Flaherty, V.: DNA extraction method affects microbial community profiles from soils and sediment, Appl. Microbiol. Biotechnol., 77, 955–964, https://doi.org/10.1007/s00253-007-1219-y, 2007.
Carroll, P. and Crill, P.: Carbon balance of a temperate poor fen, Global Biogeochem. Cy., 11, 349–356, https://doi.org/10.1029/97GB01365, 1997.
Carson, M. A., Bräuer, S., and Basiliko, N.: Enrichment of peat yields novel methanogens: approaches for obtaining uncultured organisms in the age of rapid sequencing, FEMS Microbiol. Ecol., 95, 1–11, https://doi.org/10.1093/femsec/fiz001, 2019.
Cavaco, M.: Northern Alberta Permafrost microbial diversity along peat and porewater cores, NCBI [data set], https://www.ncbi.nlm.nih.gov/bioproject/PRJNA660023, last access: 28 August 2020.
Chanton, J., Chaser, L., Glasser, P., and Siegel, D.: Carbon and Hydrogen Isotopic Effects in Microbial, Methane from Terrestrial Environments, Stable Isotopes and Biosphere – Atmosphere Interactions, Elsevier Inc., 85–105, https://doi.org/10.1016/B978-012088447-6/50006-4, 2005.
Chanton, J. P., Glaser, P. H., Chasar, L. S. Burdige, D. J., Hines, M. E., Siegel, D. I., Tremblay, L. B., and Cooper, W. T.: Radiocarbon evidence for the importance of surface vegetation on fermentation and methanogenesis in contrasting types of boreal peatlands, Global Biogeochem. Cy., 22, 1–11, https://doi.org/10.1029/2008GB003274, 2008.
Climate-Data.org: Retrieved January 21, 2019, https://en.climate-data.org/north-america/canada/alberta/meander-river-11380/ (last access: 21 January 2019), 2019.
Chasar, L. S., Chanton, J. P., Glaser, P. H., Siegel, D. I., and Rivers, J. S.: Radiocarbon and stable carbon isotopic evidence for transport and transformation of dissolved organic carbon, dissolved inorganic carbon, and CH4 in a northern Minnesota peatland, Global Biogeochem. Cy., 14, 1095–1108, https://doi.org/10.1029/1999GB001221, 2000.
Chasmer, L. and Hopkinson, C.: Threshold loss of discontinuous permafrost and landscape evolution, Glob. Change Biol., 23, 2672–2686, https://doi.org/10.1111/gcb.13537, 2017.
Cooper, M. D. A., Estop-Aragones, C., Fisher, J. P., Thierry, A., Garnett, M. H., Charman, D. J., Murton, J. B., Phoenix, G. K., Treharne, R., Kokeli, S. V., Wolfe, S. A., Lewkowicz, A. G., WIlliams, M., and Hartley, I. P.: Limited contribution of permafrost carbon to methane release from thawing peatlands, Nat. Clim. Change, 7, 507–511, https://doi.org/10.1038/nclimate3328, 2017.
Comte, J., Monier, A., Crevecoeur, S., Lovejoy,C., and Vincent, W. F.: Microbial biogeography of permafrost thaw ponds across the changing northern landscape, Ecography, 39, 609–618, https://doi.org/10.1111/ecog.01667, 2015.
Connon, R. F., Quinton, W. L., Craig, J. R., and Hayashi, M.: Changing hydrologic connectivity due to permafrost thaw in the lower Liard River valley, NWT, Canada, Hydrol. Process., 28, 4163–4178, https://doi.org/10.1002/hyp.10206, 2014.
Conrad, R.: Contribution of hydrogen to methane production and control of hydrogen concentrations in methanogenic soils and sediments, FEMS Microbiol. Ecol., 28, 193–202, https://doi.org/10.1016/S0168-6496(98)00086-5, 1999.
Corbett, J. E., Tfaily, M. M., Burdige, D. J., Cooper, W. T., Glaser, P. H., and Chanton, J. P.: Partitioning pathways of CO2 production in peatlands with stable carbon isotopes, Biogeochemistry, 114, 327–340, https://doi.org/10.1007/s10533-012-9813-1, 2013.
Criquet, S., Farnet, A. M., Tagger, S., and Le Petit, J.: Annual variations of phenoloxidase activities in an evergreen oak litter: Influence of certain biotic and abiotic factors, Soil Biol. Biochem., 32, 1505–1513, https://doi.org/10.1016/S0038-0717(00)00027-4, 2000.
Dunn, C., Jones, T. G, Girard, A., and Freeman, C.: Methodologies for Extracellular enzyme assays from wetland soils, Wetlands, 34, 9–17, https://doi.org/10.1007/s13157-013-0475-0, 2014.
Ebrahimi, A. and Or, D.: Mechanistic modeling of microbial interactions at pore to profile scale resolve methane emission dynamics from permafrost soil, J. Geophys. Res.-Biogeo., 122, 1216–1238, https://doi.org/10.1002/2016JG003674, 2017.
Euskirchen, E. S., Edgar, C. W., Turetsky, M. R., Waldrop, M. P., and Harden, J. W.: Differential response of carbon fluxes to climate in three peatland ecosystems that vary in the presence and stability of permafrost, J. Geophys. Res.-Biogeo., 119, 1576–1595, https://doi.org/10.1002/2014JG002683, 2014.
Feng, J., Wang, C., Lei, J., Yang, Y., Yan, Q., Zhou, X., Tao, X., Ning, D., Yuan, M. M., Qin, Y., Zhou Shi, J., Guo, X., He, Z., Van Nostrand, J. D., Wu, L., Bracho-Garillo, R. G., Penton, C. R., Cole, J. R., Konstantinidis, K. T., Luo, Y., Schuur, E. A. G., Tiedje, J. M., and Zhou, J.: Warming-induced permafrost thaw exarcerbates tundra soil carbon decomposition mediated by microbial community, Microbiome, 8, 1–12, https://doi.org/10.1186/s40168-019-0778-3, 2020.
Fisher, R. E., France, J. L., Lowry, D., Lanoisellé, M., Brownlow, R., Pyle, J. A., Cain, M., Warwick, N., Skiba, U. M., Drewer, J., Dinsmore, K. J., Leeson, S. R., Bauguitte, S. J. B., Wellpott, A., O'Shea, S. J., Allen, G., Gallagher, M. W., Pitt, J., Percival, C. J., Bower, K., George, C., Hayman, G. D., Aalto, T., Lohila, A., Aurela, M., Laurila, T., Crill, P. M., McCalley, C. K., and Nisbet, E. G.: Measurement of the 13C isotopic signature of methane emissions from northern European wetlands, Global Biogeochem. Cy., 31, 605–623, https://doi.org/10.1002/2016GB005504, 2017.
Fox, J. and Weisberg, S.: An R Companion to Applied Regression, Thousand Oaks CA: Sage, Second Edition, 123–173, https://doi.org/10.1016/j.stomax.2010.07.001, 2011.
Frey, B., Rime, T., Phillips, M., Stierli, B., Hajdas, I., Widmer, F., and Hartmann, M.: Microbial diversity in European alpine permafrost and active layers, FEMS Microbiol. Ecol., 92, 1–16, https://doi.org/10.1093/femsec/fiw018, 2016.
Fritze, H., Penttilä, T., Mäkiranta, P., Laiho, R., Tuomivirta, T., Forsman, J., Kumpula, J., Juottonen, H., and Peltoniemi, K.: Exploring the mechanisms by which reindeer droppings induce fen peat methane production, Soil Biol. Biochem., 160, 1–7, https://doi.org/10.1016/j.soilbio.2021.108318, 2021.
Galand, P. E., Fritze, H., Conrad, R., and Yrjälä, K.: Pathways for methanogenesis and diversity of methanogenic archaea in three boreal peatland ecosystems, Appl. Environ. Microbiol., 71, 2195–2198, https://doi.org/10.1128/AEM.71.4.2195-2198.2005, 2005.
Gibson, C. M., Chasmer, L. E., Thompson, D. K., Quinton, W. L., Flannigan, M. D., and Olefeldt, D.: Wildfire as a major driver of recent permafrost thaw in boreal peatlands, Nat. Commun., 9, 1–9, https://doi.org/10.1038/s41467-018-05457-1, 2018.
Grant, R. F.: Ecosystem CO2 and CH4 exchange in a mixed tundra and a fen within a hydrologically diverse Arctic landscape: 2. Modeled impacts of climate change, J. Geophys. Res.-Biogeo., 120, 1388–1406, https://doi.org/10.1002/2014JG002889, 2015.
Hädrich, A., Heuer, V. B., Herrmann, M., Hinrichs, K. W., and Küsel, K.: Origin and fate of acetate in an acidic fen, FEMS Microbiol. Ecol., 81, 339–354, https://doi.org/10.1111/j.1574-6941.2012.01352.x, 2012.
Hamberger, A., Horn, M. A., Dumont, M. G., Murrell, J. C., and Drake H. L.: Anaerobic consumers of monosaccharides in a moderately acidic fen, Appl. Environ. Microbiol., 74, 3112–3120, https://doi.org/10.1128/AEM.00193-08, 2008.
Hansen, A. M., Kraus, T. E. C., Pellerin, B. A., Fleck, J. A., Downing, B. D., and Bergamaschi, B. A.: Optical properties of dissolved organic matter (DOM): Effects of biological and photolytic degradation, Limnol. Oceanogr., 61, 1015–1032, https://doi.org/10.1002/lno.10270, 2016.
Heffernan, L.: High peatland methane emissions following permafrost thaw: enhanced acetoclastic methanogenesis during early successional stages, Scholars Portal Dataverse, V1 [data set], https://doi.org/10.5683/SP3/5TSH9V, 2021.
Heffernan, L., Estop-Aragonés, C., Knorr, K.-H., Talbot, J., and Olefeldt, D.: Long-term impacts of permafrost thaw on carbon storage in peatlands: deep losses offset by surficial accumulation, J. Geophys. Res.-Biogeo., 125, e2019JG005501, https://doi.org/10.1029/2019JG005501, 2020.
Heffernan, L., Jassey, V. E. J., Frederickson, M., Mackenzie, M. D., and Olefeldt, D.: Constraints on potential enzyme activities in thermokarst bogs: Implications for the carbon balance of peatlands following thaw, Glob. Change Biol., 27, 4711–4726, https://doi.org/10.1111/gcb.15758, 2021.
Heginbottom, J. A., Dubreuil, M. H., and Harker, P. T.: Canada, Permafrost, National Atlas of Canada, 5th Edn., 1:7 500 000, Plate 2.1 (MCR 4177), https://open.canada.ca/data/en/dataset/d1e2048b-ccff-5852-aaa5-b861bd55c367 (last access: 15 November 2018), 1995.
Helbig, M., Pappas, C., and Sonnentag, O.: Permafrost thaw and wildfire: Equally important drivers of boreal tree cover changes in the Taiga Plains, Canada, Geophys. Res. Lett., 43, 1598–1606, https://doi.org/10.1002/2015GL067193, 2016.
Helms, J. R., Stubbins, A., Ritchie, J. D., Minor, E. C., Kieber, D. J., and Mopper, K.: Absorption spectral slopes and slope rations as indicators of molecular weight, source, and photobleaching of chromophoric dissolved organic matter, Limnol. Oceanogr., 53, 955–969, https://doi.org/10.4319/lo.2008.53.3.0955, 2008.
Hodgkins, S. B., Tfaily, M. M., McCalley, C. K., Logan, T. A., Crill, P. M., Saleska, S. R., Rich, V. I., and Chanton, J. P.: Changes in peat chemistry associated with permafrost thaw increase greenhouse gas production, P. Natl. Acad. Sci. USA, 111, 5819–5824, https://doi.org/10.1073/pnas.1314641111, 2014.
Hoffman, G. E. and Schadt, E. E.: variancePartition: interpreting drivers of variance in complex gene expression studies, BMC Bioinformatics, 17, 1–13, https://doi.org.10.1186/s12859-016-1323-z, 2016.
Holm, S., Walz, J., Horn, F., Yang, S., Grigoriev, M. N., Wagner, D., Knoblauch, C., and Liebner, S.: Methanogenic response to long-term permafrost thaw is determined by paleoenvironment, FEMS Microbiol. Ecol., 96, 1–13, https://doi.org/10.1093/femsec/fiaa021, 2020.
Hopple, A. M., Wilson, R. M., Kolton, M., Zalman, C. A., Chanton, J. P., Kostka, J., Hanson, P. J., Keller, J. K., and Bridgham, S. D.: Massive peatland carbon banks vulnerable to rising temperatures, Nat. Commun., 11, 1–7, https://doi.org/10.1038/s41467-020-16311-8, 2020.
Hornibrook, E. R. C., Longstaffe, F. J., and Fyfe, W. S.: Spatial distribution of microbial methane production pathways in temperate zone wetland soils: Stable carbon and hydrogen isotope evidence, Geochim. Cosmochim. Ac., 61, 745–753, https://doi.org/10.1016/S0016-7037(96)00368-7, 1997.
Hornibrook, E. R. C., Longstaffe, F. J., and Fyfe, W. S.: Evolution of stable carbon isotope compositions for methane and carbon dioxide in freshwater wetlands and other anaerobic environments, Geochim. Cosmochim. Ac., 64, 1013–1027, https://doi.org/10.1016/S0016-7037(99)00321-X, 2000.
Hough, M., McClure, A., Bolduc, B., Dorrepaal, E., Saleska, S., Klepac-Ceraj, V., and Rich, V.: Biotic and environmental drivers of plant microbiomes across a permafrost thaw gradient, Front. Microbiol., 11, 1–18, https://doi.org/10.3389/fmicb.2020.00796, 2020.
Huang, Y., Ciais, P., Luo, Y., Zhu, D., Wang, Y., Qiu, C., Goll, D. S., Guenet, B., Makowski, D., De Graaf, I., Leifeld, J., Kwon, M. J., Hu, J., and Qu, L.: Tradeoff of CO2 and CH4 emissions from global peatlands under water-table drawdown, Nat. Clim. Change, 11, 618–622, https://doi.org/10.1038/s41558-021-01059-w, 2021.
Hugelius, G., Strauss, J., Zubrzycki, S., Harden, J. W., Schuur, E. A. G., Ping, C.-L., Schirrmeister, L., Grosse, G., Michaelson, G. J., Koven, C. D., O'Donnell, J. A., Elberling, B., Mishra, U., Camill, P., Yu, Z., Palmtag, J., and Kuhry, P.: Estimated stocks of circumpolar permafrost carbon with quantified uncertainty ranges and identified data gaps, Biogeosciences, 11, 6573–6593, https://doi.org/10.5194/bg-11-6573-2014, 2014.
Hugelius, G., Loisel, J., Chadburn, S., Jackson, R. B., Jones, M., MacDonald, G., Marushchak, M., Olefeldt, D., Packalen, M., Siewert, M. B., Treat, C., Turetsky, M., Voigt, C., and Yu, Z.: Large stocks of peatland carbon and nitrogen are vulnerable to permafrost thaw, P. Natl. Acad. Sci. USA, 117, 20438–20446, https://doi.org/10.1073/pnas.19163 87117, 2020.
Jassey, V. E. J., Chiapusio, G., Gilbert, D., Toussaint, M. L., and Binet, P.: Phenoloxidase and peroxidase activities in Sphagnum-dominated peatland in a warming climate, Soil Biol. Biochem., 46, 49–52, https://doi.org/10.1016/j.soilbio.2011.11.011, 2012.
Johnston, C. E., Ewing, S. A., Harden, J. W., Varner, R. K., Wickland, K. P., Koch, J. C., Fuller, C. C., Manies, K., and Jorgenson, M. T.: Effect of permafrost thaw on CO2 and CH4 exchange in a western Alaska peatland chronosequence, Environ. Res. Lett., 9, 1–12, https://doi.org/10.1088/1748-9326/9/8/085004, 2014.
Jones, M. C., Harden, J., O'Donnell, J., Manies, K., Jorgenson, T., Treat, C., and Ewing, S.: Rapid carbon loss and slow recovery following permafrost thaw in boreal peatlands, Glob. Change Biol., 23, 1109–1127, https://doi.org/10.1111/gcb.13403, 2017.
Juottonen, H., Kieman, M., Fritze, H., Hamberg, L., Laine, A. M., Merilä, P., Peltoniemi, K., Putkinen, A., and Tuittila, E. S.: Integrating Decomposers, Methane-Cycling Microbes and Ecosystem Carbon Fluxes Along a Peatland Successional Gradient in a Land Uplift Region, Ecosystems, https://doi.org/10.1007/s10021-021-00713-w, 2021.
Kammann, C., Grünhage, L., and Jäger, H. J.: A new sampling technique to monitor concentrations of CH4, N2O and CO2 in air at well-defined depths in soils with varied water potential, Europ. J. Soil Sci., 52, 297–303, https://doi.org/10.1046/j.1365-2389.2001.00380.x, 2001.
Kassambara, A. and Mundt, F.: Package “factoextra”, R Topics Documented, https://cran.r-project.org/package=factoextra, 2017.
Kassambara, A.: ggpubr: “ggplot2” Based Publication Ready Plots. R package version 0.2, R package version 0.1.8, https://CRAN.R-project.org/package=ggpubr, 2018.
Keeling, C. D.: The concentration and isotopic abundances of atmospheric carbon dioxide in rural areas, Geochim. Cosmochim. Ac., 13, 332–334, https://doi.org/10.1016/0016-7037(58)90033-4, 1958.
Kendall, M. M. and Boone, D. R.: Cultivation of methanogens from shallow marine sediments at Hydrate Ridge, Oregon. Archaea, 2, 31–38, https://doi.org/10.1155/2006/710190, 2016.
Keuper, F., van Bodegom, P. M., Dorrepaal, E., Weedon, J. T., van Hal, J., van Logtestijn, R. S. P., and Aerts, R.: A frozen feast: thawing permafrost increases plant-available nitrogen in subarctic peatlands, Glob. Change Biol., 18, 1998–2007, https://doi.org/10.1111/j.1365-2486.2012.02663.x, 2012.
Keuper, F., Dorrepaal, E., van Bodegom, P. M., van Logtesijn, R., Venhuizen, G., van Hal, J., and Aerts, R.: Experimentally increased nutrient availability at the permafrost thaw front selectively enhances biomass production of deep-rooting subarctic peatland species, Glob. Change Biol., 23, 4257–4266, https://doi.org/10.1111/gcb.13804, 2017.
Kirkwood, J. A. H., Roy-Léveillée, P., Mykytczuk, N., Packalen, M., McLaughlin, J., Laframboise, A., and Basiliko, N.: Soil Microbial Community Response to Permafrost Degradation in Palsa Fields of the Hudson Bay Lowlands: Implications for Greenhouse Gas Production in a Warming Climate, Global Biogeochem. Cy., 35, e2021GB006954, https://doi.org/10.1029/2021GB006954, 2021.
Knoblauch, C., Beer, C., Liebner, S., Grigoriev, M. N., and Pfeiffer, E. M.: Methane production as key to the greenhouse gas budget of thawing permafrost, Nat. Clim. Change, 8, 309–312, https://doi.org/10.1038/s41558-018-0095-z, 2018.
Knorr, K. H., Lischeid, G., and Blodau, C.: Dynamics of redox processes in a minerotrophic fen exposed to a water table manipulation, Geoderma, 153, 379–392, https://doi.org/10.1016/j.geoderma.2009.08.023, 2009.
Kotiaho, M., Fritze, H., Merilä, P., Tuomivirta, T., Väliranta, M., Korhola, A., Karofeld, E., and Tuittila, E. S.: Actinobacteria community structure in the peat profile of boreal bogs follows a variation in the microtopographical gradient similar to vegetation, Plant Soil, 369, 103–114, https://doi.org/10.1007/s11104-012-1546-3, 2013.
Kotsyurbenko, O. R., Friedrich, M. W., Simankova, M. V., Nozhevnikova, A. N., Golyshin, P. N., Timmis, K. N., and Conrad, R.: Shift from acetoclastic to H2-dependent methanogenesis in a West Siberian peat bog at low pH values and isolation of an acidophilic Methanobacterium strain, Appl. Environ. Microbiol., 73, 2344–2348, https://doi.org/10.1128/AEM.02413-06, 2007.
Kotsyurbenko, O. R.: Trophic interactions in the methanogenic microbial community of low-temperature terrestrial ecosystems, FEMS Microbiol. Ecol., 53, 3–13, https://doi.org/10.1016/j.femsec.2004.12.009, 2005.
Kuhn, M. A., Varner, R. K., Bastviken, D., Crill, P., MacIntyre, S., Turetsky, M., Walter Anthony, K., McGuire, A. D., and Olefeldt, D.: BAWLD-CH4: a comprehensive dataset of methane fluxes from boreal and arctic ecosystems, Earth Syst. Sci. Data, 13, 5151–5189, https://doi.org/10.5194/essd-13-5151-2021, 2021.
Kuhry, P.: Vegetation cover and radiocarbon dates of palsa and peat plateaus in the Hudson Bay Lowlands, PANGAEA, https://doi.org/10.1594/PANGAEA.812224, Supplement to: Kuhry, P. (2008): Palsa and peat plateau development in the Hudson Bay Lowlands, Canada: timing, pathways and causes, Boreas, 37, 316–327, https://doi.org/10.1111/j.1502-3885.2007.00022.x, 2008.
Kujala, K., Seppälä, M., and Holappa, T.: Physical properties of peat and palsa formation, Cold Reg. Sci. Technol., 52, 408–414, https://doi.org/10.1016/j.coldregions.2007.08.002, 2008.
Lee, H., Schuur, E. A. G., Inglett, K. S., Lavoie, M., and Chanton, J. P.: The rate of permafrost carbon release under aerobic and anaerobic conditions and its potential effects on climate, Glob. Change Biol., 18, 515–527, https://doi.org/10.1111/j.1365-2486.2011.02519.x, 2012.
Leroy, F., Gogo, S., Guimbaud, C., Bernard-Jannin, L., Hu, Z., and Laggoun-Défarge, F.: Vegetation composition controls temperature sensitivity of CO2 and CH4 emissions and DOC concentration in peatlands, Soil Biol. Biochem., 107, 164–167, https://doi.org/10.1016/j.soilbio.2017.01.005, 2017.
Liebner, S., Ganzert, L., Kiss, A., Yang, S., Wagner, D., and Svenning, M. M.: Shifts in methanogenic community composition and methane fluxes along the degradation of discontinuous permafrost, Front. Microbiol., 6, 1–10, https://doi.org/10.3389/fmicb.2015.00356, 2015.
Lin, Y., Liu, D., Yuan, J., Ye, G., and Ding, W.: Methanogenic community was stable in two contrasting freshwater marshes exposed to elevated atmospheric CO2, Front. Microbiol., 8, 1–12, https://doi.org/10.3389/fmicb.2017.00932, 2017.
Luláková, P., Perez-Mon, C., Šantrůčková, H., Ruethi, J., and Frey, B.: High-alpine permafrost and active-layer soil microbiomes differ in their response to elevated temperatures, Front. Microbiol., 10, 1–16, https://doi.org/10.3389/fmicb.2019.00668, 2019.
Masella, A. P., Bartram, A. K., Truszkowski, J. M., Brown, D. G., and Neufeld, J. D.: PANDAseq: PAired-eND Assembler for Illumina sequences, Bioinformatics, 13, 1–7, 2012.
McCalley, C. K., Woodcroft, B. J., Hodgkins, S. B., Wehr, R. A., Kim, E. H., Mondav, R., Crill, P. M., Chanton, J. P., Rich, V. I., Tyson, G. W., and Saleska, S. R: Methane dynamics regulated by microbial community response to permafrost thaw, Nature, 514, 478–481, https://doi.org/10.1038/nature13798, 2014.
McDonald, D., Price, M. N., Goodrich, J., Nawrocki, E. P., DeSantis, T. Z., Probst, A., Andersen, G. L., Knight, R., and Hugenholtz, P.: An improved Greengenes taxonomy with exzplicit ranks for ecological and evolutionary analyses of bacteria and archaea, ISME J., 6, 610–618, https://doi.org/10.1038/ismej.2011.139, 2012.
McNicol, G., Knox, S. H., Guilderson, T. P., Baldocchi, D. D., and Silver, W. L.: Where old meets new: An ecosystem study of methanogenesis in a reflooded agricultural peatland, Glob. Change Biol., 26, 772–785, https://doi.org/10.1111/gcb.14916, 2019.
Monteux, S., Weedon, J. T., Blume-Werry, G., Gavazov, K., Jassey, V. E. J., Johansson, M., Keuper, F., Olid, C., and Dorrepaal, E.: Long-term in situ permafrost thaw effects on bacterial communities and potential aerobic respiration, ISME J., 12, 2129–2141, https://doi.org/10.1038/s41396-018-0176-z, 2018.
Mudryk, L., Brown, R., Derksen, C., Luojus, K., Decharme, B., and Helfrich, S.: Surface Air Temperature, in: Arctic Report Card 2018, retrieved at: https://www.arctic.noaa.gov/Report-Card, 2018.
Nielsen, C. S., Hasselquist, N. J., Nilsson, M. B., Öquist, M., Järveoja, J., and Peichl, M.: A Novel Approach for High-Frequency in-situ Quantification of Methane Oxidation in Peatlands, Soil Syst., 3, 1–11, https://doi.org/10.3390/soilsystems3010004, 2019.
Oksanen, J., Blanchet, F. G., Kindt, R., Oksanen, M. J., and Suggests, M.: Package “vegan”, Community Ecology Package Version, https://cran.r-project.org/package=vegan, 2013.
Olefeldt, D., Goswami, S., Grosse, G., Hayes, D., Hugelius, G., Kuhry, P., Mcguire, A. D., Romanovsky, V. E., Sannel, A. B. K., Schuur, E. A. G., and Turetsky, M. R.: Circumpolar distribution and carbon storage of thermokarst landscapes, Nat. Commun., 7, 1–11, https://doi.org/10.1038/ncomms13043, 2016.
Olefeldt, D., Euskirchen, E. S., Harden, J., Kane, E., McGuire, A. D., Waldrop, M. P., and Turetsky, M. R.: A decade of boreal rich fen greenhouse gas fluxes in response to natural and experimental water table variability, Glob. Change Biol., 23, 2428–2440, https://doi.org/10.1111/gcb.13612, 2017.
Olefeldt, D., Heffernan, L., Jones, M. C., Sannel, A. B. K., Treat, C. C., and Turetsky, M. R.: Permafrost thaw in northern peatlands: rapid changes in ecosystem and landscape functions, Ecosystem Collapse and Climate Change, Springer, Cham, Vol. 241, 27–67, 2021.
Parada, A. E., Needham, D. M., and Fuhrman, J. A.: Every base matters: assessing small subunit rRNA primers for marine microbiomes with mock communities, time series and global field samples, Environ. Microbiol., 18, 1403–1414, https://doi.org/10.1111/1462-2920.13023, 2016.
Pelletier, N., Talbot, J., Olefeldt, D., Turetsky, M., Blodau, C., Sonnentag, O., and Quinton, W. L.: Influence of Holocene permafrost aggradation and thaw on the paleoecology and carbon storage of a peatland complex in northwestern Canada, Holocene, 27, 1391–1405, https://doi.org/10.1177/0959683617693899, 2017.
Perryman, C. R., McCalley, C. K., Malhotra, A., Fahnestock, M. F., Kashi, N. N., Bryce, J. G., Giesler, R., and Varner, R. K.: Thaw Transitions and Redox Conditions Drive Methane Oxidation in a Permafrost Peatland, J. Geophys. Res.-Biogeo., 125, 1–15, https://doi.org/10.1029/2019JG005526, 2020.
Pinheiro, J., Bates, D., DebRoy, S., and Sarkar, D.: nlme: Linear and Nonlinear Mixed Effects Models, R package version 3.1-131, https://doi.org/10.1016/j.tibs.2011.05.003, 2017.
Popp, T. J., Chanton, J. P., Whiting, G. J., and Grant, N.: Methane stable isotope distribution at a Carex dominated fen in north central Alberta, Global Biogeochem. Cy., 13, 1063–1077, https://doi.org/10.1029/1999GB900060, 1999.
Preuss, I., Knoblauch, C., Gebert, J., and Pfeiffer, E. M.: Improved quantification of microbial CH4 oxidation efficiency in arctic wetland soils using carbon isotope fractionation, Biogeosciences, 10, 2539–2552, https://doi.org/10.5194/bg-10-2539-2013, 2013.
Quince, C., Lanzen, A., Davenport, R. J., and Turnbaugh, P. J.: Removing Noise From Pyrosequenced Amplicons, BMC Bioinformatics, 12, 1–18, https://doi.org/10.1186/1471-2105-12-38, 2011.
R Core Team: R: A language and environment for statistical computing, Vienna, Austria, 2014, R Foundation for Statistical Computing, https://doi.org/10.1007/978-3-540-74686-7, 2015.
Robroek, B. J. M., Jassey, V. E. J., Kox, M. A. R., Berendsen, R. L., Mills, R. T. E., Cécillon, L., Puissant, J., Meima-Franke, M., Bakker, P. A. H. M., and Bodelier, P. L. E: Peatland vascular plant functional types affect methane dynamics by altering microbial community structure, J. Ecol., 103, 925–934, https://doi.org/10.1111/1365-2745.12413, 2015.
Robroek, B. J. M., Martí, M., Svensson, B. H., Dumont, M. G., Veraart, A. J., and Jassey, V. E. J.: Rewiring of peatland plant–microbe networks outpaces species turnover, Oikos, 130, 339–353, https://doi.org/10.1111/oik.07635, 2021.
Schädel, C., Bader, M. K. F., Schuur, E. A. G., Biasi, C., Bracho, R., Capek, P., De Baets, S., Diáková, K., Ernakovich, J., Estop-Aragones, C., Graham, D. E., Hartley, I. P., Iversen, C. M., Kane, E., Knoblauch, C., Lupascu, M., Martikainen, P. J., Natali, S. M., Norby, R. J., O'Donnell, J. A., Chowdhury, T. R., Šantrucková, H., Shaver, G., Sloan, V. L., Treat, C. C., Turetsky, M. R., Waldro, M. P., and Wickland, K. P.: Potential carbon emissions dominated by carbon dioxide from thawed permafrost soils, Nat. Clim. Change, 6, 950–953, https://doi.org/10.1038/nclimate3054, 2016.
Schaefer, K., Zhang, T., Bruhwiler, L., and Barrett, A. P.: Amount and timing of permafrost carbon release in response to climate warming, Tellus B, 63, 165–180, https://doi.org/10.1111/j.1600-0889.2011.00527.x, 2011.
Schuur, E. A. G., McGuire, A. D., Schädel, C., Grosse, G., Harden, J. W., Hayes, D. J., Hugelius, G., Koven, C. D., Kuhry, P., Lawrence, D. M., Natali, S. M., Olefeldt, D., Romanovsky, V. E., Schaefer, K., Turetsky, M. R., Treat, C. C., and Vonk, J. E: Climate change and the permafrost carbon feedback, Nature, 520, 171–179, https://doi.org/10.1038/nature14338, 2015.
Simon, E., Canarini, A., Martin, V., Séneca, J., Böckle, T., Reinthaler, D., Pötsch, E. M., Piepho, H. P., Bahn, M., Wanek, W., and Richter, A.: Microbial growth and carbon use efficiency show seasonal responses in a multifactorial climate change experiment, Commun. Biol., 3, 1–10, https://doi.org/10.1038/s42003-020-01317-1, 2020.
Strack, M., Waddington, J. M., and Tuittila, E. S.: Effect of water table drawdown on northern peatland methane dynamics: Implications for climate change, Global Biogeochem. Cy., 18, 1–13, https://doi.org/10.1029/2003GB002209, 2004.
Stams, A. J. M., Teusink, B., and Sousa, D. Z.: Ecophysiology of Acetoclastic Methanogens, in: Biogenesis of Hydrocarbons, edited by: Stams, A. and Sousa, D., Handbook of Hydrocarbon and Lipid Microbiology, Springer, Cham, https://doi.org/10.1007/978-3-319-78108-2_21, 2019.
Ström, L., Ekberg, A., Mastepanov, M., and Røjle Christensen, T.: The effect of vascular plants on carbon turnover and methane emissions from a tundra wetland, Glob. Change Biol., 9, 1185–1192, https://doi.org/10.1046/j.1365-2486.2003.00655.x, 2003.
Ström, L., Ekberg, A., Mastepanov, M., and Røjle Christensen, T.: Presence of Eriophorum scheuchzeri enhances substrate availability and methane emission in an Arctic wetland, Soil Biol. Biochem., 45, 61–70, https://doi.org/10.1016/j.soilbio.2011.09.005, 2012.
Ström, L., Falk, J. M., Skov, K., Jackowizc-Korczynski, M., Mastepanov, M., Christensen, T., Lund, M., and Schmidt, N. M.: Controls of spatial and temporal variabilirt in CH4 flux in a high arctic fen over three years, Biogeochemistry, 125, 21–35, https://doi.org/10.1007/s10533-015-0109-0, 2015.
Turetsky, M. R., Wieder, R. K., Vitt, D. H., Evans, R. J., and Scott, K. D.: The disappearance of relict permafrost in boreal north America: Effects on peatland carbon storage and fluxes, Glob. Change Biol., 13, 1922–1934, https://doi.org/10.1111/j.1365-2486.2007.01381.x, 2007.
Turetsky, M. R., Abbott, B. W., Jones, M. C., Anthony, K. W., Olefeldt, D., Schuur, E. A. G., Grosse, G., Kuhry, P., Hugelius, G., Koven, C., Lawrence, D. M., Gibson, C., Sannel, A. B. K., and McGuire, A. D.: Carbon release through abrupt permafrost thaw, Nat. Geosci., 13, 138–143, https://doi.org/10.1038/s41561-019-0526-0, 2020.
Tuittila, E. S., Komulainen, V. M., Vasander, H., Nykanen, H., Martikainen, P. J., and Laine, J.: Methane dynamics of a restored cut-away peatland, Glob. Change Biol., 6, 569–581, https://doi.org/10.1046/j.1365-2486.2000.00341.x, 2000.
Vanwonterghem, I., Evans, P. N., Parks, D. H., Jensen, P. D., Woodcroft, B. J., Hugenholtz, P., and Tyson, G. W.: Methylotrophic methanogenesis discovered in the archaeal phylum Verstraetearchaeota, Nat. Microbiol., 1, 1–9, https://doi.org/10.1038/nmicrobiol.2016.170, 2016.
Vishnivetskaya, T. A., Buongiorno, J., Bird, J., Krivushin, K., Spirina, E. V., Oshurkova, V., Shcherbakova, V. A., Wilson, G., Lloyd, K. G., and Rivkina, E. M.: Methanogens in the Antarctic Dry Valley permafrost, FEMS Microbiol. Ecol., 94, 1–14, https://doi.org/10.1093/femsec/fiy109, 2018.
Vitt, D. H., Halsey, L. A., and Zoltai, S. C.: The Bog Landforms of Continental Western Canada in Relation to Climate and Permafrost Patterns, Arct. Alp. Res., 26, 1–13, https://doi.org/10.2307/1551870, 1994.
Vitt, D. H., Halsey, L. A., Bauer, I. E., and Campbell, C.: Spatial and temporal trends in carbon storage of peatlands of continental western Canada through the Holocene, Can. J. Earth Sci., 37, 683–693, https://doi.org/10.1139/e99-097, 2000.
Weishaar, J. L., Aiken, G. R., Bergamaschi, B. A., Fram, M. S., Fujii, R., and Mopper, K.: Evaluation of specific ultraviolet absorbance as an indicator of the chemical composition and reactivity of dissolved organic carbon, Environ. Sci. Technol., 37, 4702–4708, https://doi.org/10.1021/es030360x, 2003.
Whiticar, M. J., Faber, E., and Schoell, M.: Biogenic methane formation in marine and freshwater environments: CO2 reduction vs. acetate fermentation-Isotope evidence, Geochim. Cosmochim. Ac., 50, 693–709, https://doi.org/10.1016/0016-7037(86)90346-7, 1986.
Whiticar, M. J.: Carbon and hydrogen isotope systematics of bacterial formation and oxidation of methane, Chem. Geol., 161, 291–314, https://doi.org/10.1016/S0009-2541(99)00092-3, 1999.
Wickham, H.: ggplot2: Elegant Graphics for Data Analysis, J. Stat. Softw., 35, 216, https://doi.org/10.18637/jss.v035.b01, 2009.
Wickland, K. P., Striegl, R. G., Neff, J. C., and Sachs, T.: Effects of permafrost melting on CO2 and CH4 exchange of a poorly drained black spruce lowland, J. Geophys. Res.-Biogeo., 111, 1–13, https://doi.org/10.1029/2005JG000099, 2006.
Wüst, P. K., Horn, M. A,. and Drake, H. L.: Trophic links between fermenters and methanogens in a moderately acidic fen soil, Environ. Microbiol., 11, 1395–1409, https://doi.org/10.1111/j.1462-2920.2009.01867.x, 2009.
Ye, R., Jin, Q., Bohannan, B., Keller, J. K., McAllister, S. A., and Bridgham, S. D.: pH controls over anaerobic carbon mineralization, the efficiency of methane production, and methanogenic pathways in peatlands across an ombrotrophic-minerotrophic gradient, Soil Biol. Biochem., 54, 36–47, https://doi.org/10.1016/j.soilbio.2012.05.015, 2012.
Zhang, C. J., Zhang, C. J., Pan, J., Liu, Y., Duan, C. H., Duan, C. H., and Li, M.: Genomic and transcriptomic insights into methanogenesis potential of novel methanogens from mangrove sediments, Microbiome, 8, 1–12, https://doi.org/10.1186/s40168-020-00876-z, 2020.
Zoltai, S. C.: Palsas and Peat Plateaus in Central Manitoba and Saskatchewan, Can. J. Forest Res., 2, 291–302, https://doi.org/10.1139/x72-046, 1972.
Zoltai, S. C.: Cyclic Development of Permafrost in the Peatlands of Northwestern Alberta, Canada, Arct. Alp. Res., 25, 240–246, https://doi.org/10.2307/1551820, 1993.