the Creative Commons Attribution 4.0 License.
the Creative Commons Attribution 4.0 License.
 | 01 Jul 2022
Dissolved organic matter characterization in soils and streams in a small coastal low-Arctic catchment
Niek Jesse Speetjens
George Tanski
Victoria Martin
Julia Wagner
Andreas Richter
Gustaf Hugelius
Chris Boucher
Rachele Lodi
Christian Knoblauch
Boris P. Koch
Urban Wünsch
Hugues Lantuit
Jorien E. Vonk
Ongoing climate warming in the western Canadian Arctic is leading to thawing of permafrost soils and subsequent mobilization of its organic matter pool. Part of this mobilized terrestrial organic matter enters the aquatic system as dissolved organic matter (DOM) and is laterally transported from land to sea. Mobilized organic matter is an important source of nutrients for ecosystems, as it is available for microbial breakdown, and thus a source of greenhouse gases. We are beginning to understand spatial controls on the release of DOM as well as the quantities and fate of this material in large Arctic rivers. Yet, these processes remain systematically understudied in small, high-Arctic watersheds, despite the fact that these watersheds experience the strongest warming rates in comparison. Here, we sampled soil (active layer and permafrost) and water (porewater and stream water) from a small ice wedge polygon (IWP) catchment along the Yukon coast, Canada, during the summer of 2018. We assessed the organic carbon (OC) quantity (using dissolved (DOC) and particulate OC (POC) concentrations and soil OC content), quality (δ13C DOC, optical properties and source apportionment) and bioavailability (incubations; optical indices such as slope ratio, Sr; and humification index, HIX) along with stream water properties (temperature, T; pH; electrical conductivity, EC; and water isotopes). We classify and compare different landscape units and their soil horizons that differ in microtopography and hydrological connectivity, giving rise to differences in drainage capacity. Our results show that porewater DOC concentrations and yield reflect drainage patterns and waterlogged conditions in the watershed. DOC yield (in mg DOC g−1 soil OC) generally increases with depth but shows a large variability near the transition zone (around the permafrost table). Active-layer porewater DOC generally is more labile than permafrost DOC, due to various reasons (heterogeneity, presence of a paleo-active-layer and sampling strategies). Despite these differences, the very long transport times of porewater DOC indicate that substantial processing occurs in soils prior to release into streams. Within the stream, DOC strongly dominates over POC, illustrated by ratios around 50, yet storm events decrease that ratio to around 5. Source apportionment of stream DOC suggests a contribution of around 50 % from permafrost/deep-active-layer OC, which contrasts with patterns observed in large Arctic rivers (12 ± 8 %; Wild et al., 2019). Our 10 d monitoring period demonstrated temporal DOC patterns on multiple scales (i.e., diurnal patterns, storm events and longer-term trends), underlining the need for high-resolution long-term monitoring. First estimates of Black Creek annual DOC (8.2 ± 6.4 t DOC yr−1) and POC (0.21 ± 0.20 t yr−1) export allowed us to make a rough upscaling towards the entire Yukon Coastal Plain (34.51 ± 2.7 kt DOC yr−1 and 8.93 ± 8.5 kt POC yr−1). Rising Arctic temperatures, increases in runoff, soil organic matter (OM) leaching, permafrost thawing and primary production are likely to increase the net lateral OC flux. Consequently, altered lateral fluxes may have strong impacts on Arctic aquatic ecosystems and Arctic carbon cycling.
- Article
(8994 KB) - Full-text XML
-
Supplement
(2385 KB) - BibTeX
- EndNote


Global temperatures are rising, and due to Arctic amplification, surface air temperatures in high latitudes have increased by more than double compared to the global average (Meredith et al., 2019). Through numerous feedback loops, these climatological changes have significant impacts on both Arctic and global biogeochemical cycles, climate and ecosystems (AMAP, 2017). Perennially frozen ground (permafrost), underlying about 18 % of the exposed land surface area in the Northern Hemisphere (Zhang et al., 2008), is undergoing significant warming and thaw (Biskaborn et al., 2019; Olefeldt et al., 2016). This is likely to have far-reaching consequences on local Arctic ecosystems and communities (Teufel and Sushama, 2019) as well as globally through the permafrost carbon feedback on global climate (Koven et al., 2011; MacDougall et al., 2012; Schuur et al., 2015).
Permafrost soils store large amounts (1460–1600×109 t) of organic carbon (OC) (Hugelius et al., 2014), approximately twice the amount currently present in the atmosphere (Schuur et al., 2015). Release of even a small fraction of this carbon from the slow into the fast carbon cycle may have far-reaching consequences. Traditionally, research has focused on the atmospheric release (vertical flux) of permafrost carbon, thereby overlooking aquatic release pathways that are likely to contribute significantly as well (Vonk et al., 2019). Within this lateral flux component of the permafrost carbon cycle, most of the existing research has focused on the largest Arctic rivers (“Big Six”: Ob, Yenisey, Lena, Kolyma, Mackenzie and Yukon), which drain about two-thirds of the total pan-Arctic watershed area (16.8 × 10⁶ km2) (e.g., Mann et al., 2012; Holmes et al., 2012; Wild et al., 2019). While important for the Arctic lateral riverine carbon budget, only 35 % of the drainage area of the Big Six is underlain by continuous permafrost, which is where most permafrost carbon is stored. In contrast, the eight next largest (“Middle Eight”) and many smaller coastal catchments draining to the Arctic Ocean (AO) are largely underlain by continuous permafrost (Middle Eight: 60 %; remainder: 73 %) (Holmes et al., 2012).
Small coastal watersheds draining into the Arctic Ocean experience a greater warming trend due to their proximity to the coast (i.e., the Arctic amplification effect) (Parmentier et al., 2013) and are likely to see dramatic changes in terrestrial–aquatic dynamics linked to permafrost degradation (Olefeldt et al., 2016) as well as shifts in hydrological and biogeochemical processes (Vonk et al., 2015b). Small watersheds contribute significantly to the riverine discharge into the Arctic Ocean (e.g., Prowse and Flegg, 2000; Lewis and Lamoureux, 2010; Bring et al., 2016) and are key areas to study terrestrial–aquatic coupling in the northern circumpolar permafrost region, yet they remain understudied.
Ice wedge polygon (IWP) terrain is abundant in these small coastal watersheds. IWP tundra covers approximately ∼ 11 % of the entire pan-Arctic watershed and ∼ 30 % of the watershed area when excluding the Big Six, Middle Eight and Greenland (Lammers et al., 2001; Karjalainen et al., 2020). IWP tundra plays a key role in tundra hydrology and the permafrost carbon cycle (Liljedahl et al., 2016). IWPs are formed when frost-induced cracks in the ground fill with water during summer and refreeze in winter. The expanding ice pushes the surrounding soil away to form elevated rims along the lines of the IWP cracks, forming low-centered polygons (LCPs). The microtopography of LCPs promotes waterlogging and ponding in the polygon center (Fritz et al., 2016). Under historical conditions, IWP landscapes dominated by LCPs serve as a carbon sink because the waterlogged anaerobic conditions hamper carbon transport and degradation (Zimov et al., 2006; Fritz et al., 2016). Under current warming climate conditions ice wedges are more likely to melt and degrade over time. This results in polygon inversion: ice wedges melt and form troughs that function as drainage channels (Liljedahl et al., 2016). The polygon center is now elevated compared to its edges (i.e., high-centered polygon, HCP).
Lateral organic matter (OM) fluxes through and from inland waters are still poorly constrained (Drake et al., 2018), particularly the export from smaller basins draining directly into the ocean. These small basins are at the same time very relevant for OC cycling, as their soils are rich in carbon stocks, and also particularly vulnerable to current climate warming that triggers permafrost thaw leading to changes in hydrology and biogeochemistry. Due to their abundance and proximity to the Arctic Ocean, IWP tundra streams have the potential to export large quantities of terrestrial OM into coastal waters. The transitioning of these IWP landscapes from waterlogged to well drained has implications for lateral (permafrost) carbon dynamics, yet little is known about the controls on OM release and transport pathways from soils to aquatic systems (Fouché et al., 2017; Vonk et al., 2019; Beel et al., 2020; Coch et al., 2020) and the effect of thawing permafrost herein (e.g., enhancing or inhibiting). Hence it is challenging to assess landscape-scale flux variability, while this is necessary to include in future projection models.
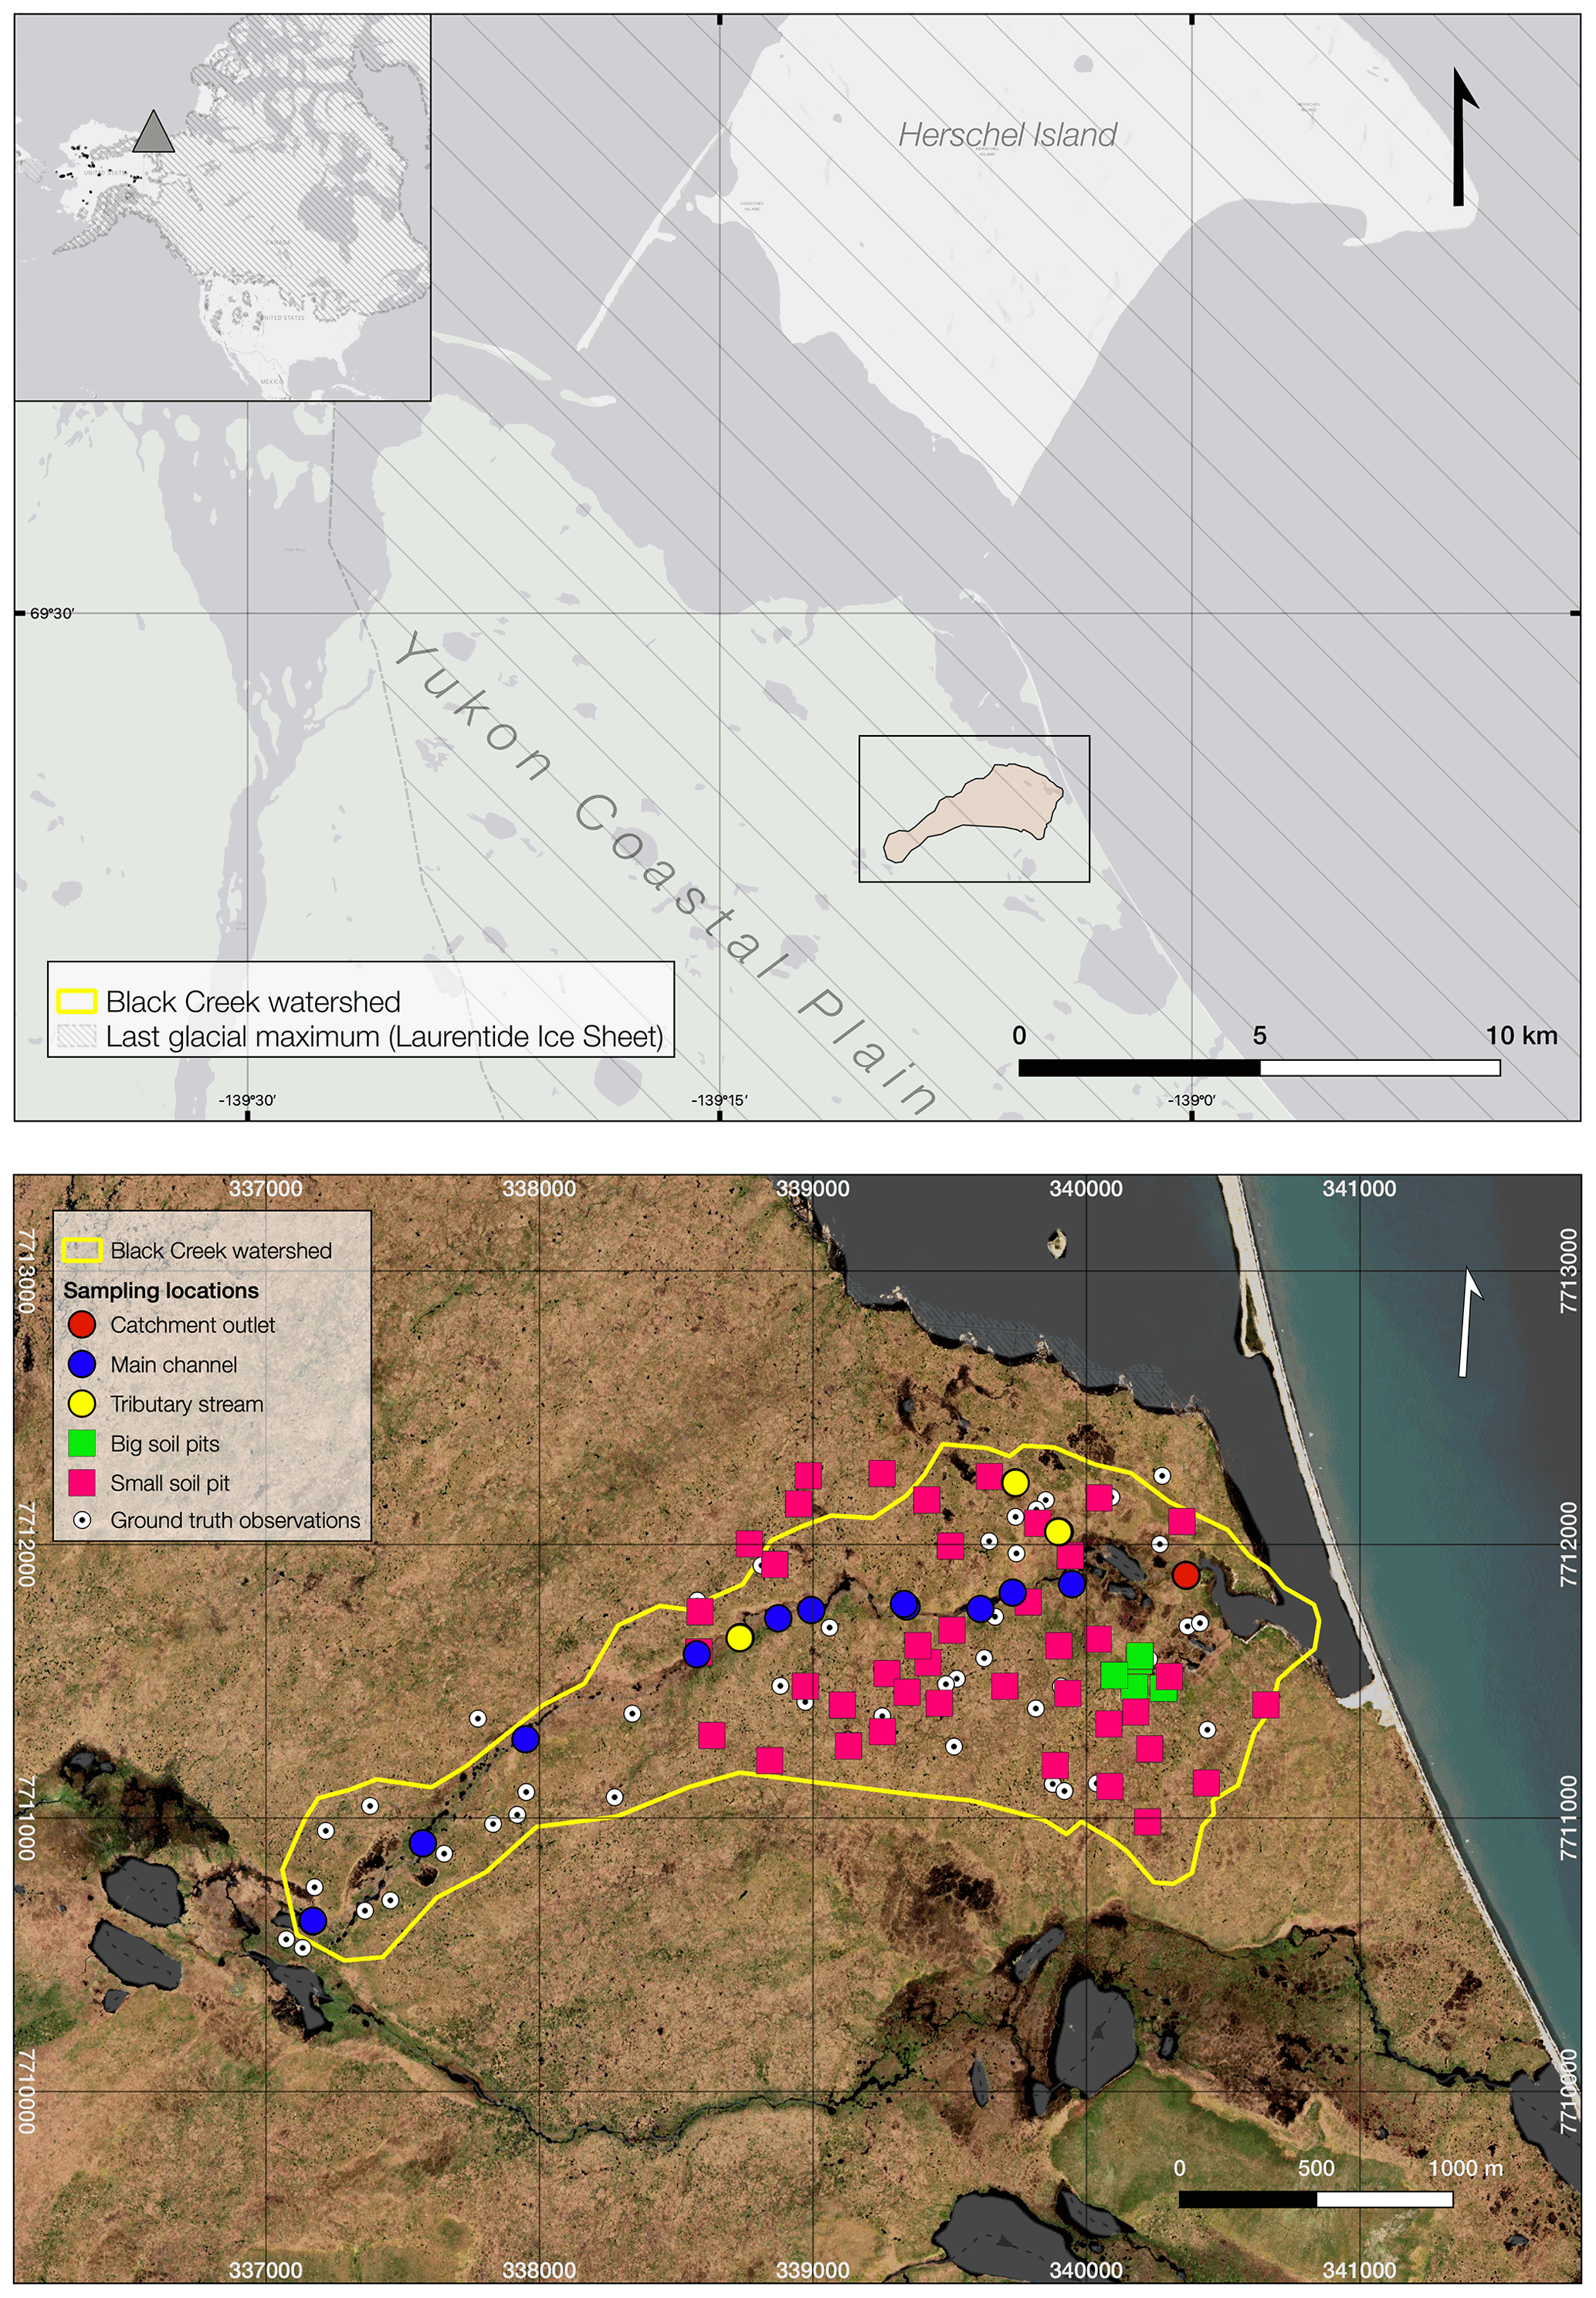
Figure 1Location of Black Creek watershed on the Yukon Coastal Plain (upper panel) and detailed catchment image showing the different sampling locations and sampling types (lower panel) (satellite imagery: WorldView-2, DigitalGlobe Inc., acquired on 18 July 2018).
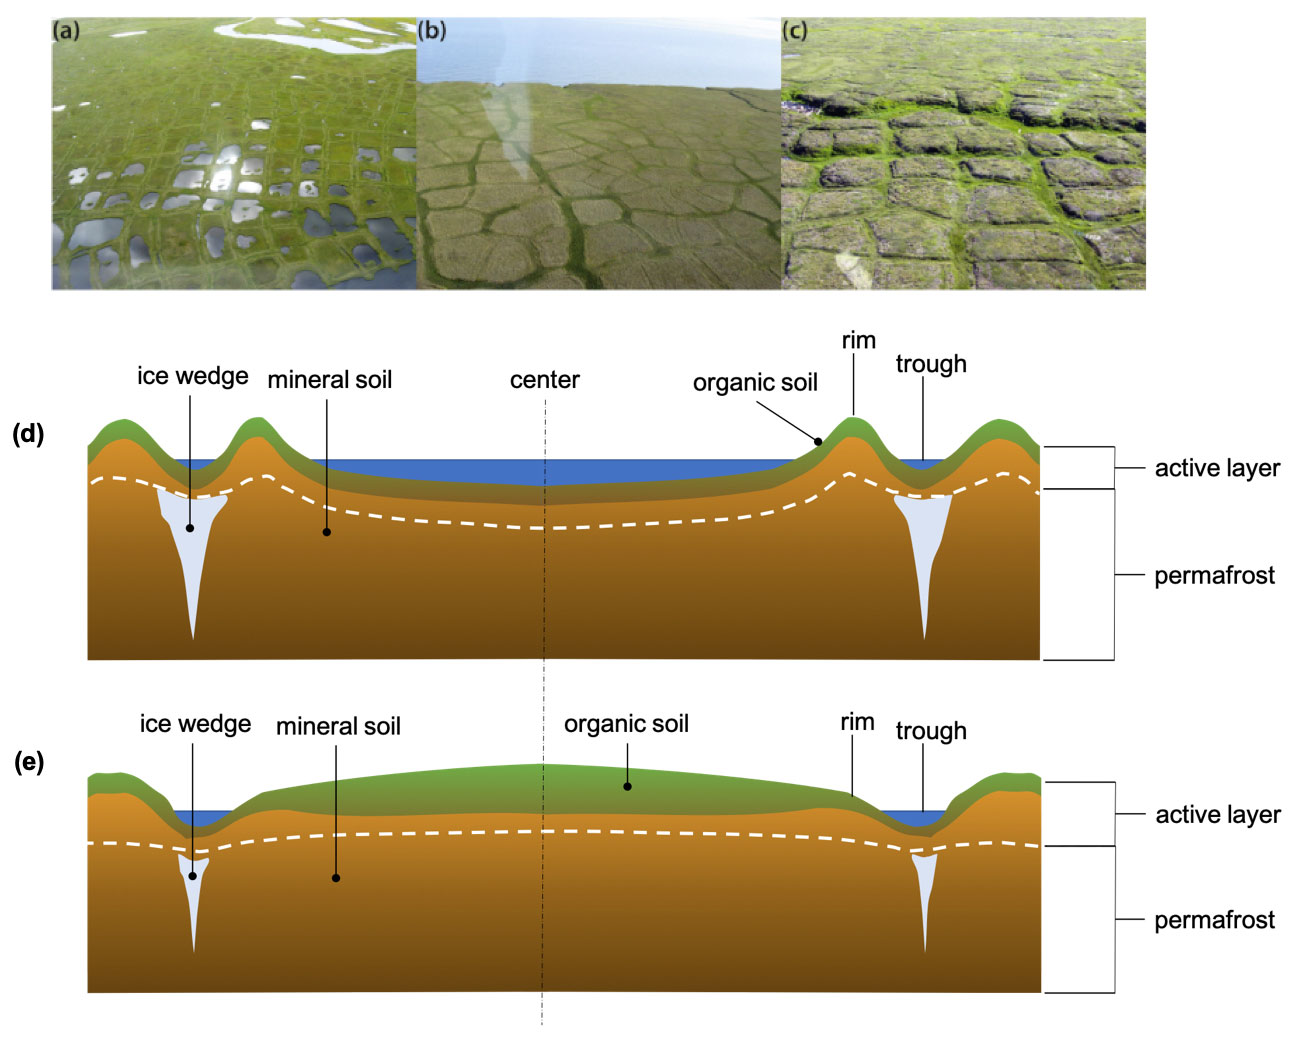
Figure 2Examples of typical low (a), flat (b) and high-centered (c) polygons as seen along the Yukon coast (adapted from Fritz et al., 2016). Schematic of a low-centered polygon (d) and high-centered polygon (e) (adapted from Fritz et al., 2016).
The aim of this study is to better quantify lateral OM fluxes in small IWP watersheds and improve our current understanding of their role in land–ocean OM budgets. We focus on the Yukon Coastal Plain in the western Canadian Arctic (Fig. 1), which is dominated by IWP tundra with three main development stages (Fig. 2): LCP (intact), HCP (degraded) and flat (intermediate) polygon types. We targeted an unnamed watershed (referred to as Black Creek watershed in this paper), a small IWP catchment (∼ 4 km2). This study contains four main sections in which we (i) characterize the OM in the most dominant IWP types (HCP, LCP and flat polygons), thermal layers (permafrost and active layer), and organic and mineral horizons using bulk isotopic and optical techniques; (ii) investigate the degradation patterns of mobilized OM during transport from soil to stream (i.e., bioavailability) using incubation experiments; (iii) determine the quantity and character and trace the origin of OM exported from the stream using isotopic and optical variables in an endmember mixing analysis (EMMA); and (iv) make first estimates of the magnitude of annual OC exports from small IWP streams on a landscape scale. With this study, we provide valuable data on so far understudied small IWP watersheds and help to build a baseline, which allows for better estimates of land–ocean OM fluxes in IWP watersheds on a pan-Arctic scale.
2.1 Study area
Black Creek watershed (BCW) is situated on the Yukon Coastal Plain in the western Canadian Arctic and drains into Ptarmigan Bay, which is a semi-open lagoon sheltered from the open Beaufort Sea (Fig. 1). Black Creek is a small coastal stream draining a polygonal tundra landscape underlain by continuous permafrost. The contributing watershed area is approximately 4 km2, estimated using ArcticDEM (digital elevation model), a publicly available 10 m resolution digital elevation model (Porter et al., 2018; accessed on 28 May 2020), from which we obtained a watershed delineation using GRASS GIS (Geographic Resources Analysis Support System graphical information system). The Yukon Coastal Plain stretches ∼ 300 km from the Mackenzie delta in the east to the Alaskan border in the west. The Quaternary surficial geology is mainly characterized by lacustrine, morainal, fluvial and colluvial deposits (Rampton, 1982). IWP tundra, moraine hills, wetlands, beaded streams and thermokarst lakes are the predominant landscape types. The land cover can be classified as low-shrub tundra, subzone E (Walker et al., 2018) with the occurrence of Betula nana, Salix polaris, mosses and lichens in HCPs, while graminoids dominate in LCP terrain. The mean summer temperature (June, July and August 1991–2020) is 7.7 ∘C (± 4.6 ∘C) based on available data for three nearby stations (Herschel Island – Qikiqtaruk, Komakuk Beach and Shingle Point). The mean annual temperatures at Shingle Point and Komakuk Beach are −9.9 and −11 ∘C, respectively, and precipitation means are 254 and 161 mm, respectively (Environment Canada, https://climate.weather.gc.ca/climate_normals, last access: 26 August 2021).
The region of interest is underlain by continuous permafrost and active-layer depths averaging around 30–40 cm in IWP terrain on nearby Herschel Island (Siewert et al., 2021). Ground ice volumetric content in the Yukon Coastal Plain averages around 46 % but reaches as high as 74 % in some areas (Couture et al., 2018; Couture and Pollard, 2017). The warm season in the western Canadian Arctic, during which the stream network is active, lasts approximately 4 months (Dunton et al., 2006). On average the sea ice break up in the southern Beaufort Sea region starts around mid-May, and freeze-up starts in early October with prolonged open-water periods around the Mackenzie delta area. Both winter and summer sea ice extent and concentration rapidly declined in recent decades (Galley et al., 2016). The lengthening of the sea-ice-free seasons leads to increased storm frequency and intensity. In combination with higher surface temperatures in the region (Screen et al., 2012), these environmental changes are expected to have a drastic impact on biogeochemical cycling and hydrological processes in the western Canadian Arctic (Parmentier et al., 2017).
2.2 Meteorological data
During the sampling period (8–19 August 2018), we collected on-site weather data at a 5 min interval. Air temperature was measured at 1.5 m above the ground (BTF11/002 TSic 506; ± 0.1 ∘C accuracy). Precipitation was measured (Young Model 52203; 0.1 mm per tip; accuracy ± 2 %) at 0.5 away from any objects causing potential wind shadow. Wind speed was measured using Thies Clima (4.3519.00.173; ± 0.5 m s−1 accuracy). Available weather data from outside the sampling period were downloaded from the Canadian government's website on the environment and natural resources (https://climate.weather.gc.ca, last access: 16 November 2021) for the three nearby stations mentioned in Sect. 2.1 (station IDs 2100636, 2100682 and 2100950, respectively).
2.3 Soil and water sampling and stream measurements
Soil and water samples were collected between 9–19 August 2018. Soil samples were taken at 46 sites within the main polygon types in the watershed (HCP, LCP and flat polygon), which were classified based on field observations. Both the active layer (AL) and upper permafrost (PF) were sampled. Active-layer samples of a known field volume were collected from the main soil horizon types (O, A, B and Bf/Cf) and classified according to Schoeneberger et al. (2012). Samples with visible gley or cryoturbation were marked additionally. Permafrost samples were collected at 10 cm intervals below the permafrost table up to a depth of 100 cm from the surface (subject to practicality) using either a steel pipe and sledgehammer, SIPRE corer, or Hilti hammer drill. All soil samples (AL and PF; n=153) were stored frozen at −18 ∘C in ziplock bags until further processing in the lab, where porewater extraction took place. Stream water samples were taken every 6 h at the catchment outlet using an ISCO 3700 automatic water sampler (Teledyne). The sampler was placed ∼ 50 m upstream (± 1 elevation meter higher than the actual outlet), where water was shooting/free flowing for a significant part of the section downstream of the sampler. This location was chosen to ensure that no interference from the neighboring lagoon would occur under normal conditions. In addition, manual samples were taken along the main channel and at three tributary streams flowing into the main stem using pre-rinsed 500 mL Nalgene bottles, which were flushed with stream water three times prior to sampling. All water samples were filtered through pre-combusted and pre-weighed glass fiber filters (GF/F, Whatman, 47 mm diameter, 0.7 µm nominal pore size). Subsamples for DOC and δ13C DOC (dissolved organic carbon) analysis were acidified to pH < 2.0 using 36 % HCl (Suprapur) and stored in a cool (4 ∘C) and dark location. Subsamples for chromophoric and fluorescent dissolved organic matter (DOM; CDOM and fDOM) were stored frozen and in a dark location at −18 ∘C. All filters with suspended material designated for total suspended solids (TSSs), POC (particulate organic carbon) and δ13C POC analysis were stored frozen and in a dark location. Basic hydrochemical readings were taken at the stream outlet with an AP-5000 multiparameter probe (Aquaread Ltd.), which was deployed at the catchment outlet from 8 until 19 August. Measurements included relative water level (h, m), water temperature (T, ∘C), acidity (pH), electrical conductivity (EC, µS m−1), turbidity [NTU] (nephelometric turbidity unit), dissolved oxygen (DO, percentage of saturation), redox potential [mV] and CDOM abundance [µg L−1]. The CDOM sensor was calibrated using a quinine sulfate equivalent solution (CDOM-CAL-600, Aquaread Ltd.), yet units are given in micrograms per liter as provided by the instrument. An empirical stage discharge equation was derived using flow measurements at different stages and fitting a quadratic function within the measured range to estimate discharge (Q, L s−1) as a function of the pressure head on the sensor (h, m) of the stream (Eq. 1).
The measurement was based on the creek's flowing cross-sectional area together with flow velocity (measured at two-thirds of the water depth and 25 cm increments using a M1 mini current meter and Z6 counting device; SEBA Hydrometrie GmbH & Co. KG) at the outflow at varying water levels.
2.4 Porewater extraction
Frozen soil samples were wet-weighed and slowly thawed at 8 ∘C. Porewater was then extracted from active-layer and permafrost samples (n=142) using Rhizon samplers (mean pore size of 0.6 µm, Rhizosphere, Wageningen, the Netherlands) under cold and dark conditions in a cooler room (4 ∘C). Subsamples for CDOM and fDOM analyses were taken from the extracted porewater and transferred into 15 mL falcon tubes and stored frozen and in a dark location until analysis. Subsamples for DOC and δ13C DOC were acidified (pH < 2) and stored cool (at 4 ∘C) and in a dark location in 40 mL pre-combusted glass vials until analysis.
2.5 DOC concentration and isotopes
All DOC samples have been filtered through glass fiber filters with 0.7 µm nominal pore size. The DOC concentration and δ13C DOC were measured with an Aurora 1030 DOC analyzer (OI Analytical, USA) connected via a Conflow V to an isotope ratio mass spectrometer (IRMS, Delta V, Thermo Scientific, Germany) at the University of Hamburg (Germany) (stream water incubation samples), the Alfred Wegener Institute Helmholtz Centre for Polar Research (Bremerhaven, Germany) (bulk porewater samples) following Hölemann et al. (2021) and at North Carolina State University (Raleigh, North Carolina, USA) (stream water bulk samples and porewater incubation samples). DOC concentrations were used to quantify the total amount of OC in a dissolved state within the watershed systems, and δ13C DOC was used to derive the origin and relative degradation state of OM. DOC concentrations from porewater were used to calculate yields in milligrams of DOC per gram of soil dry weight and milligrams of DOC per gram of soil organic carbon (SOC) using Eqs. (2) and (3).
where mw is the mass in grams of water present in the sample, measured as the difference in the bulk wet soil sample weight minus the dry weight and assuming the density of water at 4 ∘C as g L−1; ms is the soil bulk dry weight in grams; mC is the total mass of SOC in grams; and [DOC] is the DOC concentration in milligrams per liter. SOC was measured as the fraction of the dry bulk weight lost on combustion at 550 ∘C multiplied by a conservative factor of 0.45 to convert from bulk soil organic matter (SOM) to SOC, in accordance with Jensen et al. (2018).
2.6 POC concentration and isotopes
Carbonates were removed from freeze-dried filters using acid treatment. For this, filters were subsampled (16 filter punches of a 4 mm cross-section) into silver capsules, moisturized with 25 µL of distilled water, acidified with 25 µL of 1 M HCl and left for 30 min at room temperature. Then, 50 µL of HCl was added, and samples were dried in an oven for 3 h at 60 ∘C. After that, silver capsules were folded and analyzed for percentage of OC, percentage of N, and δ13C (‰ VPDB; Vienna Pee Dee Belemnite) at the Vrije Universiteit Stable Isotope Laboratory (Amsterdam, the Netherlands).
2.7 Stable water isotopes of stream and porewater samples
Deuterium and oxygen isotopes (δD and δ18O) were measured on water subsamples with a continuous-flow Delta Plus X IRMS coupled to a FlashSmart Elemental Analyzer and high-temperature conversion elemental analyzer (TC/EA) at Vrije Universiteit Amsterdam and are given as the per mil difference from Vienna Standard Mean Ocean Water (VSMOW). Deuterium excess was used to allocate the precipitation source (e.g., Fritz et al., 2016) in the same region (d excess = δD−8δ18O; Fritz et al., 2016; Dansgaard, 1964). Data were compared with water isotopic values from two local meteoric water lines (LWMLs) in Inuvik (200 km southeast) (δD = 7.3 ⋅ δ18O − 3.5) (Fritz et al., 2016) and Utqiaġvik (formerly Barrow), Alaska (600 km northwest) (δD = 7.5 ⋅ δ18O − 1.1) (Throckmorton et al., 2016).
Table 1Overview of spectral (absorbance and fluorescence) indices used for DOM qualification.

2.8 DOM optical properties
The chromophoric fraction of DOM was used to characterize DOM and identify the source. The CDOM and fDOM (fluorescent DOM fraction) were used as indicators of DOM quality such as degradation status, molecular size and DOM source (Stedmon and Nelson, 2015). We used a range of absorbance and fluorescence indices for the characterization of DOM, as summarized in Table 1. Fluorescence data were processed using the drEEM toolbox (decomposition routines for Excitation Emission Matrices; Murphy et al., 2013) in MATLAB (R2017b). CDOM and fDOM were measured on a HORIBA Aqualog fluorescence spectrophotometer at the Technical University of Denmark (DTU, Copenhagen).
2.9 DOM lability
In this study we chose four indicators to the estimate degradation state and to infer lability:
-
Slope ratio (Sr) was calculated as the ratio between the slope of the absorbance between 275–290 and 350–400 nm and the absorbance ratio (a254:a365). These have been recognized as indicators of DOM molecular weight (MW) (Helms et al., 2008). The assumption is that lower-MW organic molecules will generally be more bioavailable.
-
The specific UV absorbance at 254 nm divided by the DOC concentration has been identified as a proxy for DOM aromaticity (Weishaar et al., 2003). Fouché et al. (2020) show that high Sr (i.e., low molecular weight) and low SUVA254 (i.e., low aromaticity) together are indicative of higher lability of permafrost DOM.
-
The degradation status, which can be inferred from the humification index (HIX), was calculated as the area under the emission spectra of 435–480 nm divided by the peak area of 300–345 nm + 435–480 nm, at an excitation wavelength of 254 nm (Ohno, 2002). DOM degradation in soils is the processing of labile fresh organic products (e.g., sugars) to more chemically complex and less bioavailable forms (Balser, 2004). Hence, more degraded DOM will generally be less labile.
-
The freshness index (FRESH) is calculated from the emission intensity at 380 nm divided by the maximum emission intensity between 420 and 435 nm at an excitation wavelength of 310 nm (Parlanti et al., 2000; Wilson and Xenopoulos, 2009), and the fluorescence index (FI) is the ratio of emission intensity at a wavelength of 470 and 520 nm and an excitation wavelength of 370 nm, which indicate what proportion of DOM is likely to be fresh and microbially produced (McKnight et al., 2001; Cory et al., 2010). The assumption is that small, fresh, microbial leachates (i.e., high FI and FRESH) correlate with higher DOM lability.
Additionally, we performed incubations with stream and porewater samples to estimate the degradation potential of DOC by comparing DOC concentrations and δ13C DOC values before and after incubations.
2.9.1 Stream water incubation
From three tributary streams (A, B and C), three aliquots of 60 mL water were incubated (in the field) for 14 d at an ambient air temperature of ∼ 4 ∘C under dark and oxygenated conditions in 120 mL amber glass vials. These incubations were repeated at three different instances during the field campaign. Samples were turned once a day to prevent flocculation and mimic mixing in the stream. Aside from the baseline samples (T=0), incubations were stopped after 7 (T=7) and 14 d (T=14). Hence a total of 81 vials were analyzed. At each time step, samples were filtered using pre-combusted glass fiber filters (GF/F, nominal pore size of 0.7 µm). The filtrate was split into subsamples for DOC and δ13C DOC analysis (acidified to pH < 2.0 with 36 % HCl (Suprapur) and stored in a dark location at 4 ∘C) and subsamples for CDOM and fDOM (stored in a dark location and frozen at −18 ∘C).
2.9.2 Porewater incubation
We incubated porewater extracts from six upper-active-layer samples (Oi horizon) and nine upper-permafrost samples at Vrije Universiteit Amsterdam to check for differences in OM degradation potentials between the active layer and permafrost. Incubations were conducted under laboratory conditions following procedures adapted from Vonk et al. (2013) and Spencer et al. (2015). Rhizon-filtered samples (median pore size of 0.6 µm) were transferred to pre-combusted 40 mL amber glass vials, holding in total 30 mL of sample. An inoculum was added and prepared from a soil slurry consisting of a total of 12 g (2 g of each) of the sampled Oi horizons mixed with 240 mL of autoclaved tap water. The slurry was filtered through a glass fiber filter (Whatman, 1.2 µm nominal pore size), and 1 mL was added to each incubation sample. Samples were then placed on a shaker table for incubations at 8 ∘C under dark and oxygenated conditions. The incubations were run in triplicate and were stopped after T=2, 7, 14 and 21 d by acidification to pH < 2.0 (using 36 % HCl, Suprapur). Samples were stored cool (4 ∘C) until further analysis for DOC concentration and δ13C DOC.
2.10 Endmember mixing model
Along with isotope tracers such as δ13C DOC, Δ14C DOC, δD and δ18O (Vonk et al., 2012; Grotheer et al., 2020), absorbance and fluorescence properties have been successfully used for source apportionment approaches and to characterize DOM and trace sources (Lee et al., 2020). We used endmember mixing model analysis (EMMA) to estimate the contribution of three potential sources (permafrost, active layer and in-stream primary production) to the Black Creek stream using δ13C DOC, Sr and as tracers. These parameters are considered semi-conservative and most distinctive in separating endmembers. We used a Bayesian mass-balance source apportionment model with Metropolis–Hastings Markov chain Monte Carlo sampling following and adapting code found in the supplementary information of Bosch et al. (2015) in MATLAB R2017b. To compute source contributions, we ran the model with a time series of measured δ13C DOC, Sr and at the catchment outlet over time. Although sample size is limited due to practical limitations, we chose to use δ13C DOC of porewater instead of δ13C SOC of soils to avoid fractionation effects from soil-to-water leaching (e.g., Kaiser et al., 2001; Boström et al., 2007) impacting the source apportionment. For the active layer, we used a δ13C DOC value of −26.4 ± 1.07 ‰ based on the porewater δ13C DOC measurements in the catchment (n=3). Active-layer values for Sr and were also based on porewater samples from the catchment and were 0.71 ± 0.08 (n=45) and 4.55 ± 0.8 (n=45), respectively. For permafrost we used a δ13C DOC value of −24.15 ± 1.03 ‰ (n=6) and Sr and values of 0.85 ± 0.08 (n=44) and 5.81 ± 1.2 (n=45), respectively, based on δ13C DOC and Sr and of permafrost porewater. Finally, the primary-production source was set to −28.48 ± 1.0 ‰ (n=9) based on δ13C DOC values of the tributaries where we observed primary production (algal mats). The standard deviation of the analyzed endmember samples was 0.237 ‰. However, we acknowledge that the tributary water δ13C DOC signal probably consists of a mixture of terrestrial and primary-production source leachates. Moreover, it is likely that fractionation takes place during leaching from OM sources, including primary-production sources. Hence, we expect a pure primary-production signal would be more depleted than what is found in the tributary water DOC, and we have therefore increased the standard deviation to ± 1 ‰, similar to the other δ13C DOC sources, to account for uncertainty. Our decision-making process herein is consistent with what others have found as representable δ13C primary-production endmembers (e.g., Winterfeld et al., 2015). The Sr and of the primary-production endmember were set at 0.78 ± 0.020 (n=9) and 5.40 ± 0.23 (n=9), respectively. To estimate mixing with terrestrial DOC, we also ran the simulation with δ13C POC (32.68 ± 2.00 ‰, n=9) instead of δ13C DOC by means of sensitivity analysis. We acknowledge that using the δ13C POC to trace DOM is not incorporating potential fractionation effects through leaching and that the most realistic primary-production δ13C value probably lies between the δ13C DOC and δ13C POC values used here.
We performed a sensitivity analysis by increasing and decreasing (± 5 %) permafrost endmember tracer means and standard deviations separately and comparing the effect (percentage change) on relative contribution of each source in the mixing model. The sensitivity analysis focused on permafrost endmember values, since we are primarily interested in the relative contribution of thawing permafrost. Additionally, it is assumed that changing other endmember tracer means and standard deviations by the same order of magnitude will result in same changes in order of magnitude of relative source contribution and testing, with only permafrost being representative of all endmembers.
2.11 Statistical analyses
All statistical analyses were performed in the Python 3 programming environment (Van Rossum and Drake, 2009) using the pandas (McKinney, 2010), SciPy (Virtanen et al., 2020) and statsmodels (Seabold and Perktold, 2010) packages. Significance statistics were calculated with a two-sided T test. Linear
regression results were obtained using linear least-squares regression for two sets of measurements as described in the SciPy manual.
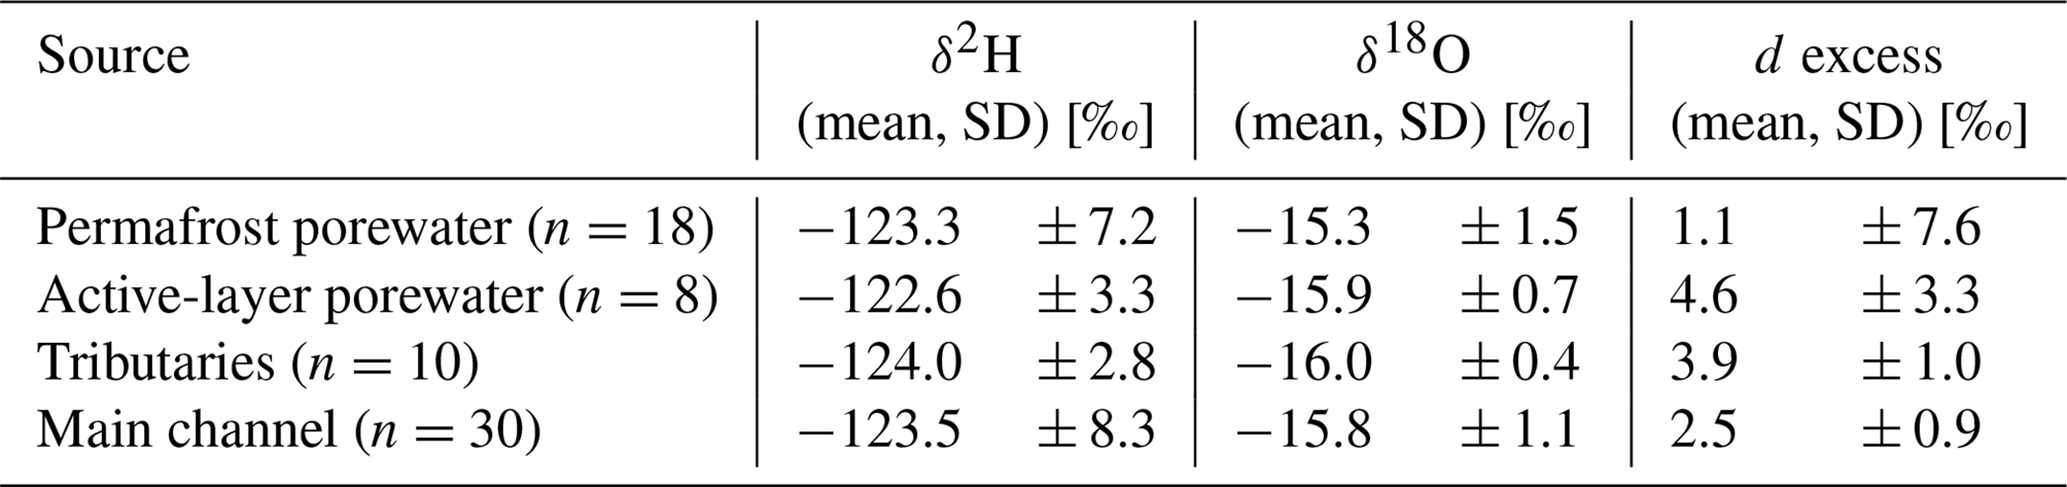
Table 2Stable water isotope values mean and standard deviation by source.
3.1 Meteorology and hydrogeochemistry
Weather conditions during the field campaign were variable with air temperatures ranging between −0.8 and 12.7 ∘C (mean = 4.2 ± 2.6 ∘C) (Fig. S1 in the Supplement). The predominant wind direction was northwest with mean wind speeds of 4.78 ± 2.92 m s−1 and gusts up to 15.1 m s−1 (7 Bft; Beaufort scale). Precipitation was generally low with notable rainfall recorded on 13 August (1.3 mm) and between 16 and 19 August (7.7 mm cumulative). Total precipitation during the monitoring period was 9.8 mm (Table S1 in the Supplement). Mean electrical conductivity (EC) at the catchment outlet was 954 µS cm−1; pH ranged between 6.5 and 7.8 (mean = 6.9 ± 0.19); and water temperature ranged between 2.9 and 12.3 ∘C (mean = 6.6 ± 1.7 ∘C). During a storm event on 16 and 17 August, water levels at the outlet monitoring station peaked together with EC (19134 µS cm−1). Apart from the elevated EC values during the storm event, the EC remained fairly constant during the monitoring period (100 ± 14.0 µS cm−1). Discharge in the creek's main channel showed a decreasing trend (min = 9, max = 140, mean = 43 ± 27 L s−1) during the measurement period. Discharge during the storm event of 16 and 17 August was disregarded due to uncertainty regarding tidal influence, which is indicated by the elevated EC values. Water isotope values within the main channel ranged between −130.3 ‰ and −127.1 ‰ (δD) and −16.35 ‰ and −16.25 ‰ (δ18O) with mean values of −128.0 ± 1.2 ‰ and 16.32 ± 0.03 ‰, respectively. In tributary streams stable water isotope values covered a wider range, between −132.4 ‰ and −94.38 ‰ (δD) and −17.11 ‰ and −11.94 ‰ (δ18O) with mean values of −122.9 ± 7.5 ‰ and 15.71 ± 0.98 ‰, respectively. Stable water isotope signals were grouped by their main source (i.e., permafrost and active-layer porewater, tributaries and the main channel) (Table 2). The correlation of δD and δ18O for the samples compared to the local meteoric water line (LMWL) in Inuvik shows that permafrost samples group in roughly three lines that are distinguished by their d excess (Fig. S2). The majority of the permafrost samples plot further from the LMWL at Inuvik than the modern samples (streams and active layer), which in turn also deviate from the Inuvik LMWL.
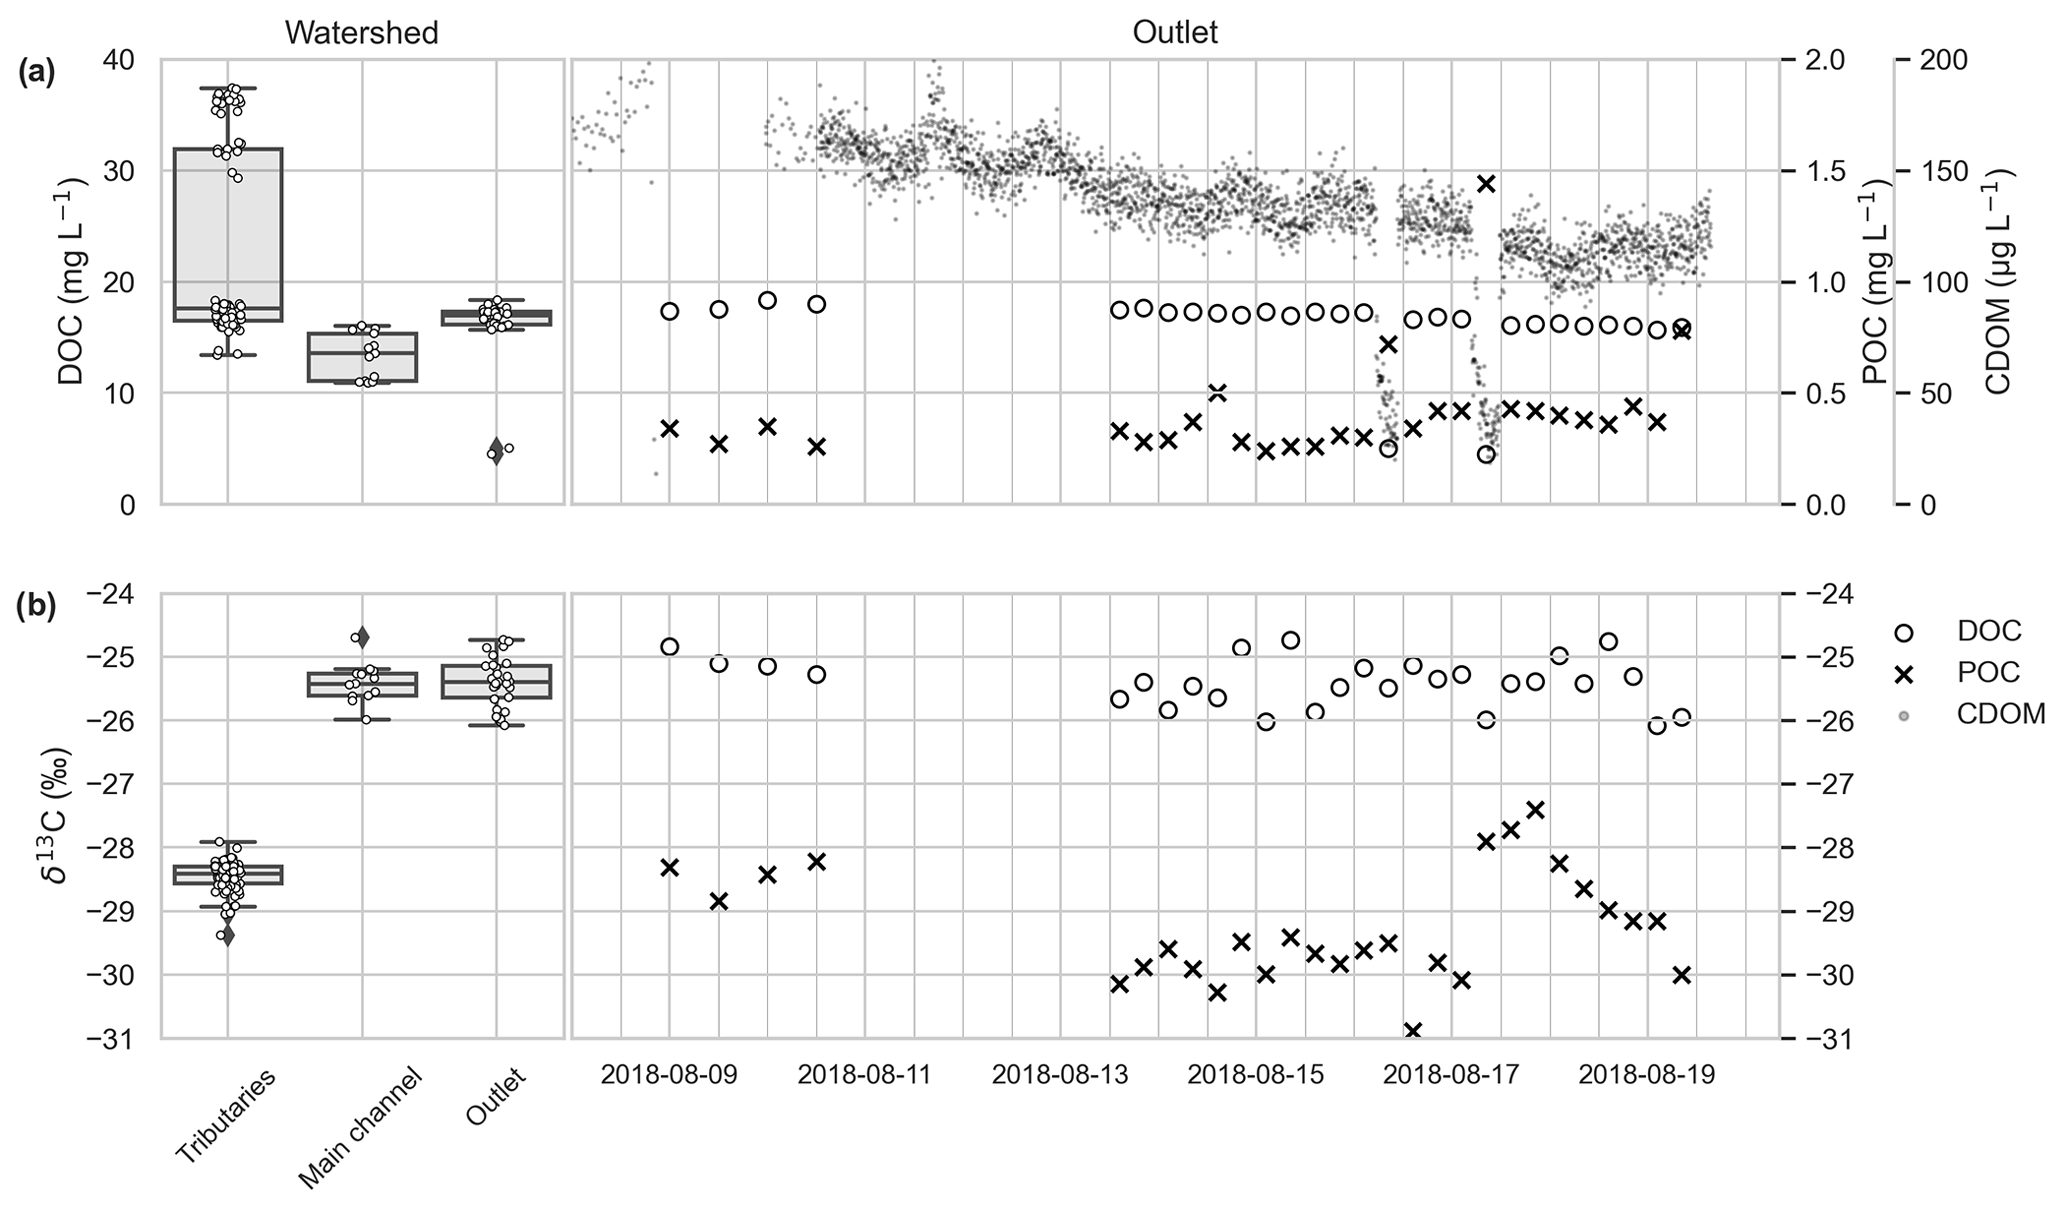
Figure 3DOC concentrations (mg L−1) measured within tributaries, the main channel and the outlet (a, left) and POC (mg L−1; cross markers), DOC (mg L−1; circles; please note that the scale on the left panel applies to the right panel as well) and CDOM (mg L−1; filled small circles) concentrations within stream water at the watershed outlet over time (a, right). δ13C DOC isotopic signal within tributaries, the main channel and the outlet (b, left) and δ13C DOC and δ13C POC over time at the catchment outlet (b, right). Note that two clear drops in the CDOM measurements on 16 and 17 August mark a storm event. This is also visible in the δ13C POC and to lesser extent δ13C DOC source shift (b, right) around these dates. Please note that the date format used in this figure is year-month-day.
Table 3δ13C values of DOC and POC/SOC for various sources in the catchment.
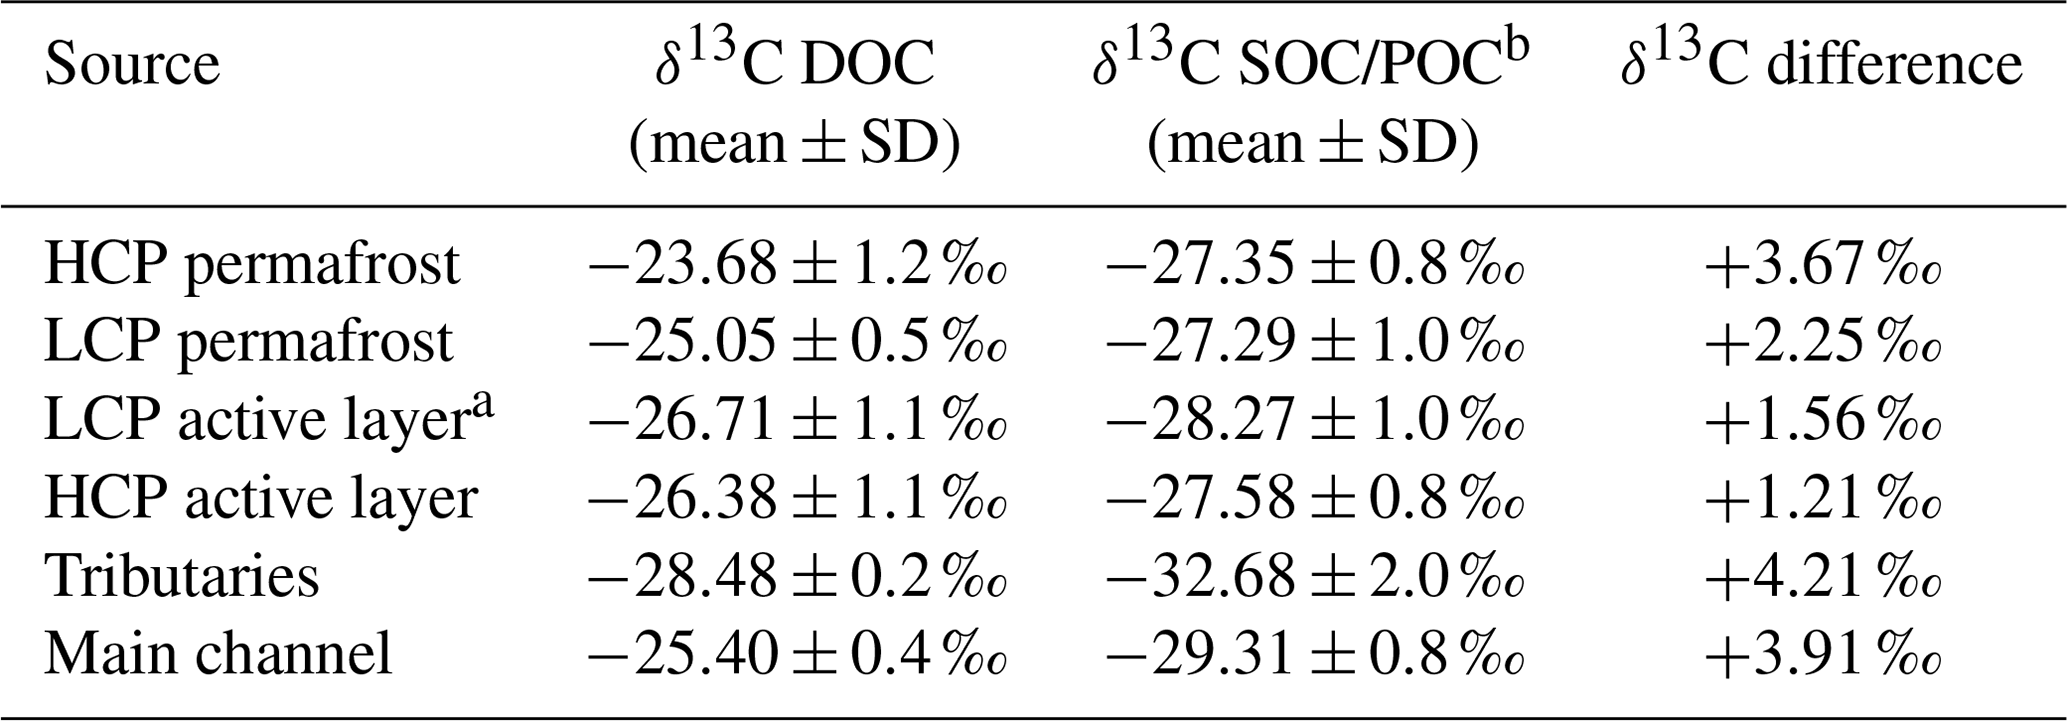
a Note that the δ13C DOC of the LCP active layer was calculated from the linear relationship between the available δ13C DOC of the HCP active layer and δ13C SOC and using the δ13C SOC of the LCP active layer. b Values listed are the SOC for the HCP/LCP active layer and permafrost and the POC for tributaries and the main channel.
3.2 OC concentrations and stable isotopes
3.2.1 Concentrations and δ13C of DOC and POC in streams
The DOC concentrations in the main channel upstream and at the outlet were on average 13.3 ± 2.04 and 16.9 ± 0.68 mg L−1, respectively (Fig. 3, Table S2). At the outlet, values as low as 4.5 mg L−1 were measured during the storm event of 16 and 17 August. DOC concentrations correlated with measured CDOM (Aquaprobe AP-5000, Aquaread Ltd.) concentrations (133.7 ± 29.02 µg L−1; Fig. 3, Table S2) and showed a gently declining trend over the monitoring period. The average DOC concentrations measured in tributaries were significantly higher (p < 0.05) (22.74 ± 8.66 mg L−1) than in the main stem. POC concentrations and δ13C POC values in the main channel (0.36 ± 0.11 mg L−1, −30.0 ± 0.93 ‰) were significantly different (p < 0.05) than the values in the tributary streams (1.2 ± 0.60 mg L−1, −32.7 ± 2.04 ‰, Table 3). The POC concentrations peaked at 1.4 mg L−1 during the storm event, which is opposite of the DOC concentrations which declined. Similarly, during this event the δ13C POC signal became less depleted (−28.0 ‰), whereas the δ13C DOC signal became slightly more depleted (−26.0 ‰). The tributaries had the most depleted δ13C DOC signal (−28.5 ± 0.24 ‰) of all samples. In one tributary we observed algal production which we consider the main source of primarily produced material in streams. The δ13C POC values of OC on the filters taken from this tributary were among the most depleted found during this study (−35.3 ± 1.00 ‰, n=3).
3.2.2 Concentrations, yields and δ13C of DOC and SOC in soils
SOC contents (percentage of dry weight) of the sampled soils were high but differed strongly (Fig. S3 and Table S3) between the LCP active layer (26 ± 13.2 %, n=16) and LCP permafrost (17 ± 10.7 %, n=21), while differences for the HCP active layer (23 ± 12.8 %, n=38) and HCP permafrost (18 ± 6.2 %, n=44) were less pronounced. Differences between permafrost and the active layer were significant between the LCP and HCP classes (p < 0.05). For the flat-terrain active layer (17 ± 13.5 %, n=12) and flat-terrain permafrost (15 ± 7.7 %, n=11) differences were not significant (p>0.05). Although the differences between the three landscape classes within each thermal layer were large, they were not significant (p>0.05).
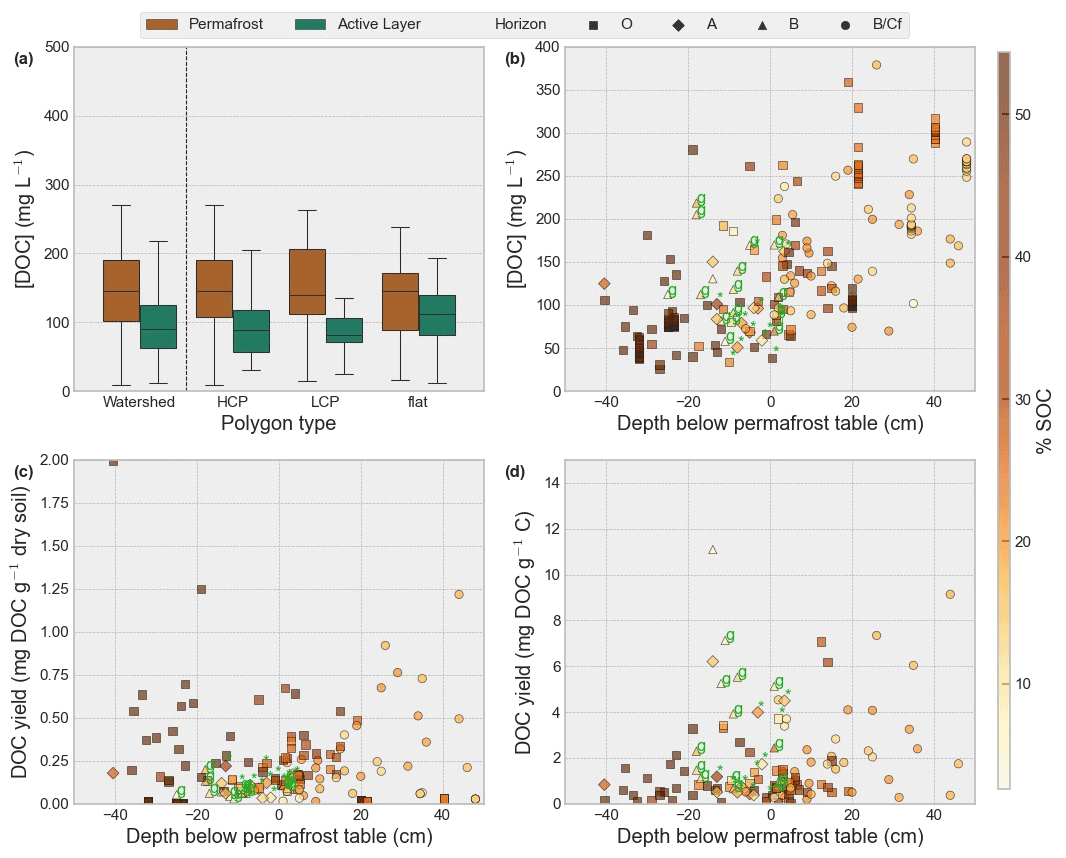
Figure 4Porewater DOC concentrations (mg L−1) across the entire watershed and identified polygon types (HCP, LCP and flat) for permafrost (dark-grey boxplots) and the active layer (light grey) (a) vs. depth (b), yield of DOC (in mg) per gram dry soil (c) and yield of DOC (in mg) per gram soil OC (d). Color indicates soil organic carbon content (%). Marker type distinguishes soil horizon. Cryoturbated soil samples are annotated with “*”, and samples of gleyed soil are annotated with “g”.
The DOC concentration in porewater extracts showed a great variability (142.3 ± 83.62 mg L−1) but were significantly (p < 0.05) higher in permafrost (181.3 ± 82.86 mg L−1) compared to the active-layer extracts (88.96 ± 47.55 mg L−1). Among permafrost samples, a significant concentration difference was found between HCPs (171.19 ± 87.8 mg L−1) and LCPs (150.61 ± 63.1 mg L−1) as well as the HCP and flat (146.26 ± 89.5 mg L−1) polygon types (p < 0.05), with HCPs having the highest concentrations (Fig. 4a). Active-layer DOC concentrations were not significantly different between polygon types.
DOC yields (Fig. 4c and d) were highly variable both in permafrost (0.27 ± 0.27 mg g−1 soil, 2.10 ± 2.65 mg g−1 C) and active-layer soils (0.22 ± 0.31 mg g−1 soil, 2.97 ± 6.69 mg g−1 C) but were not significantly different from each other. While permafrost DOC yield was higher at a lower SOC content, active-layer DOC yield was highest with higher SOC (Fig. 4c and d). Results also show that gleyed soils have slightly higher DOC yield (2.54 ± 1.82 mg g−1 C) compared to other active-layer samples (2.31 ± 1.85 mg g−1 C). DOC yields above 7.10 mg DOC g−1 C were considered outliers, since they were not within the 95th percentile range, and were therefore removed from the yield analyses. The DOC yields of permafrost samples generally increase with depth. Although DOC concentrations were significantly different (p < 0.05) between permafrost and active-layer samples as well as between HCP permafrost and LCP permafrost, DOC yields were similar among the different classes (Fig. S4). This is similar for DOC concentrations which were not significantly different (p > 0.05) between polygon types in the active layer.
The δ13C DOC values varied significantly (p < 0.05) between most sample sources. Values were highest and most variable in HCP permafrost (−23.68 ± 1.2 ‰) followed by LCP permafrost (−25.05 ± 0.5 ‰). LCP permafrost δ13C DOC was not significantly different (p = 0.0519) from the δ13C DOC signal in the main channel (−25.40 ± 0.4 ‰). In contrast to that, the δ13C DOC signature in the HCP active layer was more depleted and had a wider range (−26.38 ± 1.1 ‰). The SOC δ13C values in the catchment were generally more depleted than porewater δ13C DOC (Table 3) for permafrost and the active layer in HCP (PF: −26.91 ± 1.0624 ‰, AL: −27.41 ± 0.9 ‰), LCP (PF: −27.01 ± 1.0 ‰, AL: −28.27 ± 1.0 ‰) and flat (PF: −27.73 ± 0.9 ‰, AL: −27.93 ± 0.9 ‰) polygon types. The difference between porewater δ13C DOC and soil δ13C SOC is larger for permafrost (LCP: 2.25 ‰, HCP: 3.7 ‰) compared to the active layer (HCP: 1.21 ‰, LCP: not applicable; Tables S3 and S4).
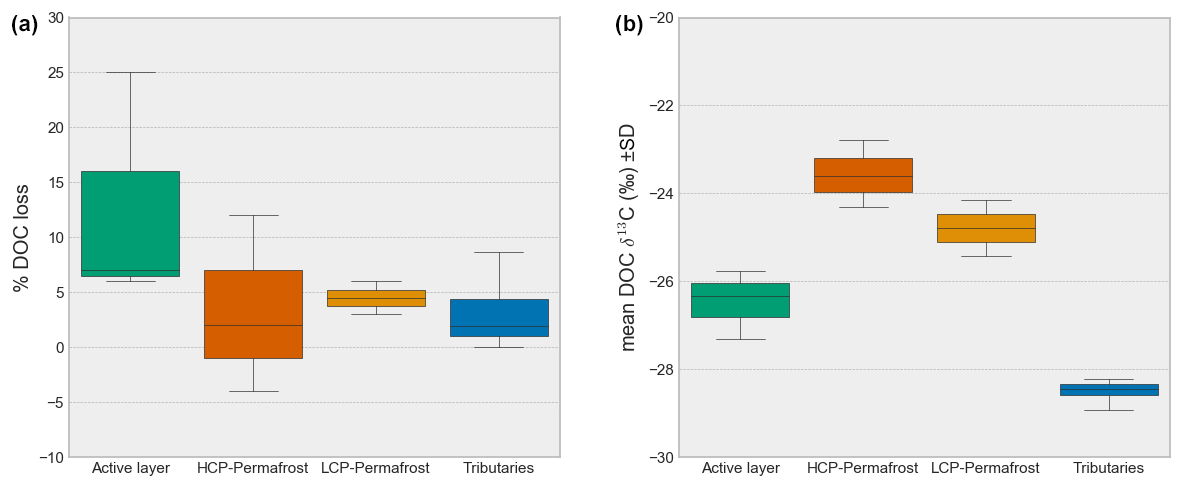
Figure 5Loss of DOC (%) after 7 d incubation (a) and initial δ13C DOC (b) for the sources active layer (porewater), HCP and LCP permafrost (porewater), and tributaries (stream water).
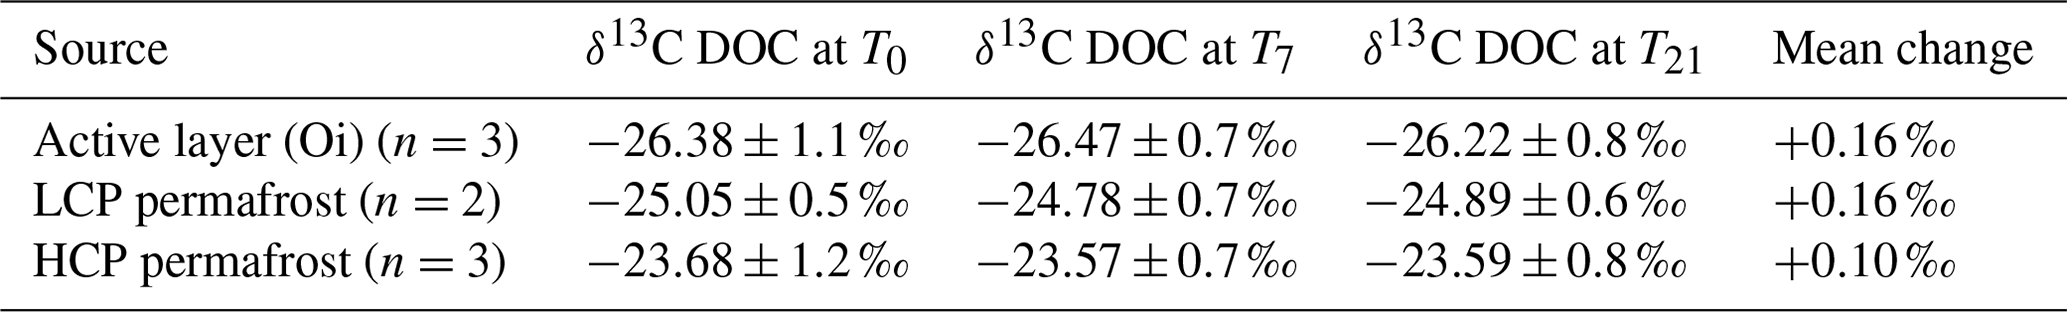
Table 4Change in mean δ13C DOC (‰ VPDB) between the active layer and permafrost for the two polygon types (LCP and HCP).
3.3 Degradability of DOC
Incubation experiments show a high variability in DOC loss as well as δ13C shifts for the active layer and permafrost (Fig. 5). The degradability of DOC strongly differed between samples. The mean loss of DOC [%] from incubations with water from the three different tributary locations (A, B and C) was 4.30 ± 5.3 % after 7 d of incubation. During this period, mean isotopic values of δ13C DOC did not change significantly (p > 0.05) (−28.48 ± 0.2 ‰ at T = 0 d and −28.52 ± 0.3 ‰ at T = 7 d). However, looking at individual samples, δ13C DOC enrichment was observed in several cases (Table S3 and Fig. S5). Locations A and B showed comparable patterns with depletion of δ13C in the first 7 d and repletion between days 7 and 14; location C showed almost a linear trend toward a less depleted δ13C DOC signal over time. The incubation of porewater showed that DOC losses are in the same range as the tributaries and that there are no significant differences between HCP permafrost (5.0 ± 6 % DOC loss, n=3, T = 7 d) and LCP permafrost (7.0 ± 1 % DOC loss, n=2, T = 7 d) (p > 0.05). In contrast to that, DOC losses in the active layer (Oi horizon) were significantly higher (s ± 16 %, n=3, T = 7 d). The δ13C DOC signals are significantly different between the active layer, LCP permafrost and HCP permafrost at the beginning of the incubation (T = 0) and, on average, become slightly more enriched over time. Yet, there is no significant change in δ13C DOC between T = 0 and T = 21 (Table 4, Fig. S6).
Table 5Summary of fluorescence and absorbance indicators of DOM quality. Significant differences and sample sizes are indicated in Table S4.
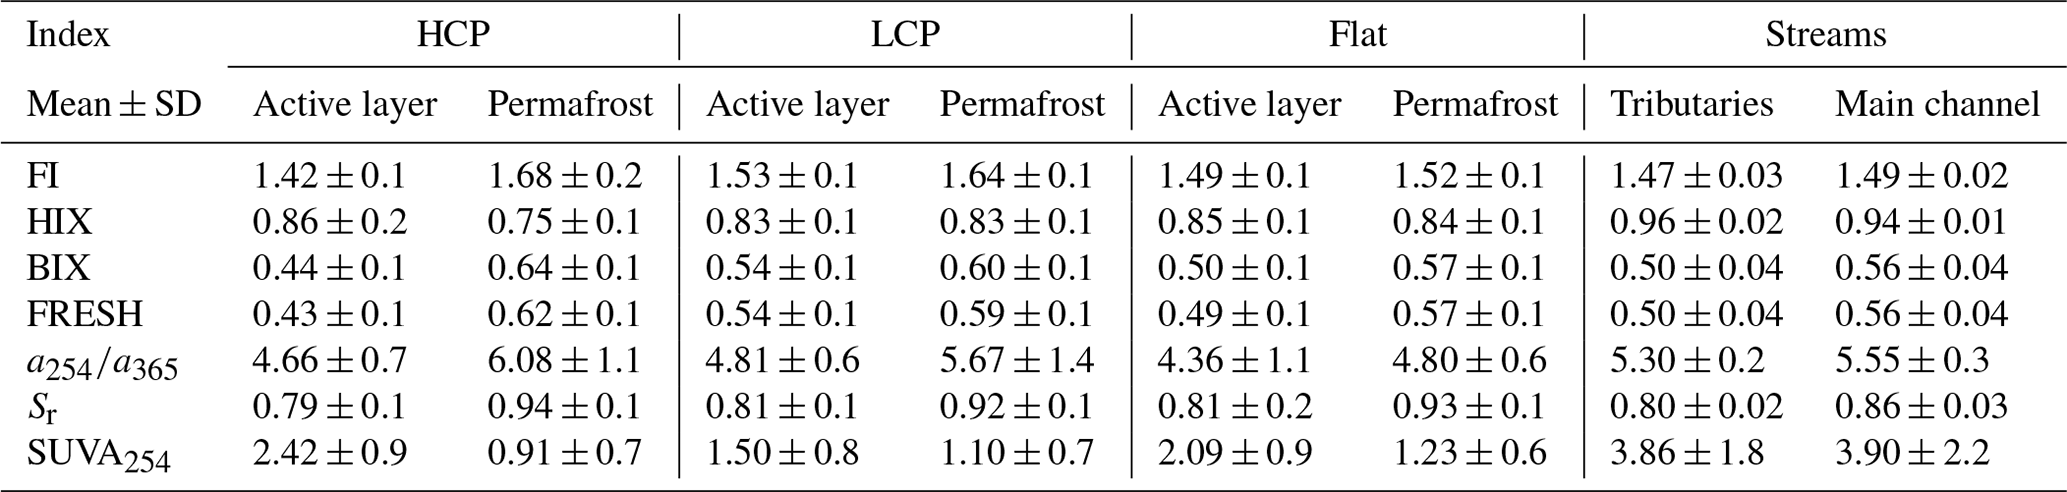
3.4 Optical properties of DOM in the catchment
Values of SUVA254 at the catchment outlet varied between ∼ 1.71 and ∼ 3.88 and averaged around ∼ 3.07 ± 0.5 (n=25). With the exclusion of two storm event extremes (SUVA254 = 11.02; 11.72 ), mean SUVA254 values were not significantly (p > 0.05) different from mean SUVA254 values in tributaries (∼ 3.86 ± 1.8 ). Permafrost porewater showed significantly lower SUVA254 (∼ 1.00 ± 0.6 ) (p < 0.05) than active-layer porewater (∼ 2.13 ± 0.9 ). The highest mean active-layer porewater SUVA254 is found in HCP polygon types (∼ 2.4 ± 0.9 ) followed by flat (∼ 2.14 ± 0.9 ) and LCP polygon types (∼ 1.55 ± 1.1 ). For permafrost the order was different, with the HCP polygon type showing the lowest values for SUVA254 (∼ 0.91 ± 0.7 ) followed by the LCP polygon type (∼ 1.06 ± 0.6 ) and the flat polygon type the showing highest SUVA254 (∼ 1.23 ± 0.6 ) in permafrost. Slope ratio (Sr), which negatively correlates with the MW of DOM, was negatively correlated with SUVA254 in our porewater samples (i.e., lower-MW molecules were less aromatic). Contrastingly Sr shows a weak positive correlation with SUVA254 (i.e., lower-MW molecules were more aromatic) in stream water samples. For the fluorescence index and biological index (FI and BIX), which are used to indicate terrestrial sources of DOM (i.e., soil organic matter and plant litter; low FI and BIX), and relatively fresh, more microbially derived DOM (i.e., leachates and products of algae and bacteria; high FI and BIX) (Fouché et al., 2017) the same holds: in porewater samples the aromaticity was highest in samples with a terrestrial and less fresh DOM signal, while in streams the aromaticity was highest in samples with a relatively fresh DOM signal.

Figure 6SUVA254, slope ratio (Sr), absorbance ratio (), fluorescence index (FI), freshness index (FRESH) and humification index (HIX) for both thermal layers in each polygon type. Differences between the two thermal layers are largest in HCPs and smallest in LCPs except for FI where the flat polygon type has the smallest difference between the active layer and permafrost, indicating a shift in biogeochemical processing of DOM as IWP degradation progresses (i.e., transition from LCPs to HCPs).
Overall, our results show a predominantly terrestrial signature in streams which is slightly but significantly (p < 0.05) higher in tributaries (FI: ∼ 1.47, BIX: ∼ 0.50, Sr: ∼ 0.80) compared to the outlet (FI: ∼ 1.49, BIX: ∼ 0.55, Sr: ∼ 0.85). This signal is comparable to that of porewater in the active layer (FI: ∼ 1.46, BIX: ∼ 0.48, Sr: ∼ 0.81). In contrast, the permafrost porewater averages around a more fresh, microbial and lower-MW signature (FI: ∼ 1.65, BIX: ∼ 0.62, Sr: ∼ 0.93). Permafrost and the active layer are significantly different with respect to their SUVA254, FI, BIX and Sr values (p < 0.05). However, when looking more closely at the distribution of their values within the soil profile, we observe linear trends with depth respective to the permafrost table rather than clustering linked explicitly to each thermal layer (Fig. S7). With respect to polygon types, results show that HCP active-layer spectral indices are significantly different (p < 0.05) from the other polygon classes except for HIX and that differences between active layer and permafrost are most pronounced in HCPs (Table S6, Fig. 6). The humification index (HIX) peaks in the HCP active layer (∼ 0.86), while the lowest HIX value was found in HCP permafrost (∼ 0.75) (Table 5). A more detailed peak in HIX around the permafrost table suggests the prevalence of more degraded SOM (Fig. S7). With a deeper permafrost sampling depth, a decreasing HIX value is observed. Although distinctly different, values of HIX are significantly different neither between the active layer and permafrost nor between landscape classes. Values of HIX were highest in streams (∼ 0.95) and the active layer (∼ 0.85).
Table 6Mean relative contribution of three identified sources (source fractions) to the integrated signal at the catchment outlet, using δ13C DOC for the primary-production endmember.
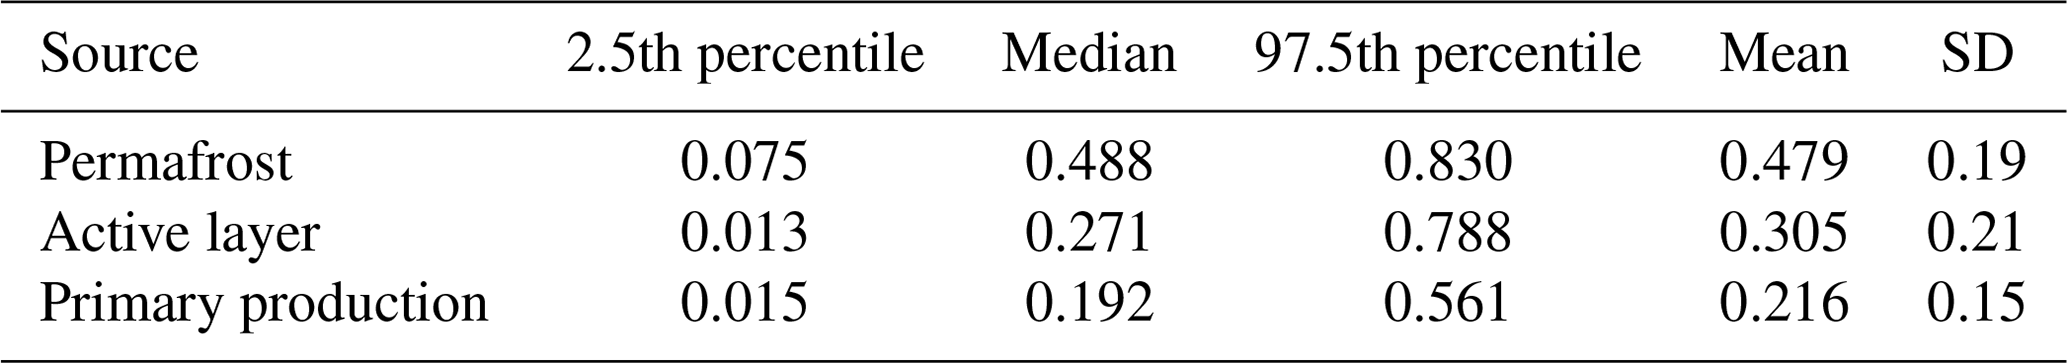
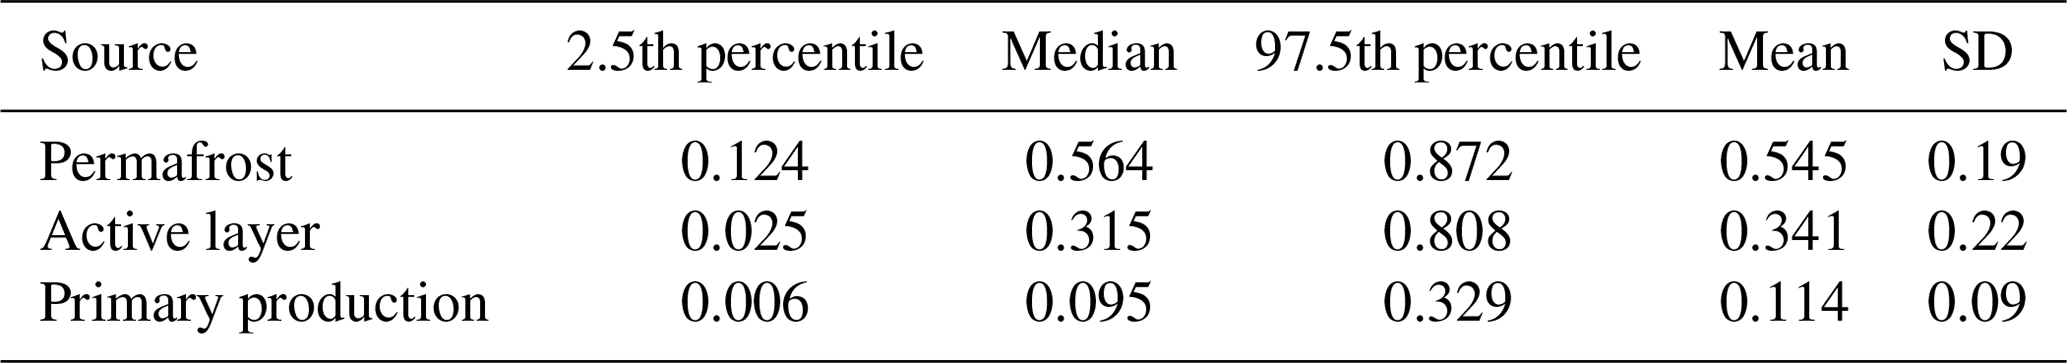
Table 7Mean relative contribution of three identified sources (source fractions) to the integrated signal at the catchment outlet, using δ13C POC for the primary-production endmember.
3.5 Endmember-based source apportionment of DOM
With our initial source apportionment setup, we modeled source contribution with mean isotopic (Fig. S8) and spectral-index values at the outlet (δ13C DOC: −25.40 ‰, Sr: 0.86, : 5.55) for three endmembers (permafrost OM, active-layer OM and primary-production OM). Model results given these inputs indicate a relative contribution of these sources of ∼ 48 ± 20 %, ∼ 30 ± 21 % and ∼ 22 ± 15 %, respectively (Table 6, Figs. S9 and S10). We used the maximum (−26.08 ‰) and minimum (−24.73 ‰) δ13C DOC values and corresponding Sr and at the outlet to assess variation in source contribution over time. Correspondingly we find that permafrost, active-layer and primary-production OM contributions vary with between 31 %–67 %, 20 %–38 % and 14 %–31 %, respectively. When calculating the source apportionment considering HCP permafrost and LCP permafrost as different DOM sources (HCP permafrost δ13C DOC: −23.68 ± 1.2 ‰, Sr: 0.94 ± 0.1, : 6.08 ± 1.1; LCP permafrost δ13C DOC: −25.05 ± 0.5 ‰, Sr: 0.92 ± 0.01, : 5.67 ± 1.4), the mean relative contribution of permafrost sources increases from 48 % to 58 % at the catchment outlet. When using δ13C POC of the primary-production sources instead of δ13C DOC, this leads to a decrease in primary-production contribution from 21 % to 11 %, mostly resulting in an increase in permafrost contribution from 48 % to 55 % and an increase in active-layer contribution from 31 % to 34 % (Tables 6 and 7). A summary of the time series and computed source contributions using δ13C DOC of primary production can be found in Table S9.
From sensitivity analysis (i.e., changing input parameters with fixed relative amounts) we observed that modeled source contributions respond strongest to shifts in δ13C DOC. When decreasing the permafrost mean δ13C DOC from −24.15 ‰ to −25.36 ‰, this resulted in a shift from 48.7 % to 51.6 % of relative contribution, while active-layer contribution changes only 0.8 % from 30.8 % to 31.6 %, and primary production decreases from 20.6 % to 16.9 %. Inversely, when using a higher permafrost mean δ13C DOC (−24.15 ‰ to −22.94 ‰), this results in a decrease in its contribution from 49 % to 40 %, while primary production increased from 21 % to 27 % (Tables S7 and S8), and the active layer increased from 31 % to 33 %. Changing standard deviations of permafrost endmember values by ± 5 % leads to changes in contribution ranging from −3 % for permafrost to + 5 % for primary production.
The aim of this study is to better assess the role of small IWP watersheds to improve land–ocean OM budgets. The specific objectives of this study are to (i) characterize the OM in the most dominant IWP types (discussed in Sect. 4.1); (ii) investigate the degradation patterns of mobilized OM during transport from soil to stream (Sect. 4.2); (iii) determine the quantity, character and origin of OM exported from the stream (EMMA) (Sect. 4.3); and ultimately (iv) estimate an annual OC export from small streams on a landscape scale (Sect. 4.4).
4.1 Differences in OM pools of HCPs and LCPs
Our data show that there are significant differences in terms of OM pools between the two thermal layers (i.e., active layer and permafrost) and between the main landscape features that define the terrain (i.e., HCP and LCP). The main differences between HCPs and LCPs are the microtopography and hydrological pathways, which may influence OC characteristics. The wetter soils in LCPs have higher thermal conductance; hence summer active-layer depths in the center of the polygon often reach deeper than in HCPs (Liljedahl et al., 2016; Walvoord and Kurylyk, 2016; Wales et al., 2020). LCPs' elevated ice wedge rims generally promote waterlogged conditions in the polygon center, while in HCPs, the degraded ice wedges form connected drainage channels result in well-drained polygon centers (Liljedahl et al., 2012).
Differences in drainage patterns are reflected in our observed DOC concentrations and yields. Mean SOC contents are higher in the active layer (LCP: 26 ± 13.2 %, HCP: 23 ± 12.8 %) compared to permafrost (LCP: 17 ± 10.7 %, HCP: 18 ± 6.2 %). This contrasts with the DOC concentrations, which are higher in permafrost (HCP: 171.20 ± 87.8 mg L−1, LCP: 150.62 ± 63.1 mg L−1) compared to active layer (HCP: 95.20 ± 53.7 mg L−1, LCP: 92.98 ± 53.2 mg L−1). The high mean DOC concentrations in permafrost porewater (162.44 ± 82.0 mg L−1) compared to those of the active layer (97.14 ± 52.54 mg L−1) indicate that the permafrost DOC pool is still freeze-locked (i.e., immobile), whereas the active layer has been flushed more regularly. Differences in DOC concentration between the active layer and permafrost were highest in the HCP and lower in the LCP polygon type category. This could indicate that in the active layer of HCPs, DOM was already subject to more degradation and flushing with runoff. This is also suggested in a simulation study by Liljedahl et al. (2012) showing that in LCP terrain 46 % of the snow water equivalent was flushed as runoff, while this was 73 % in HCP terrain.
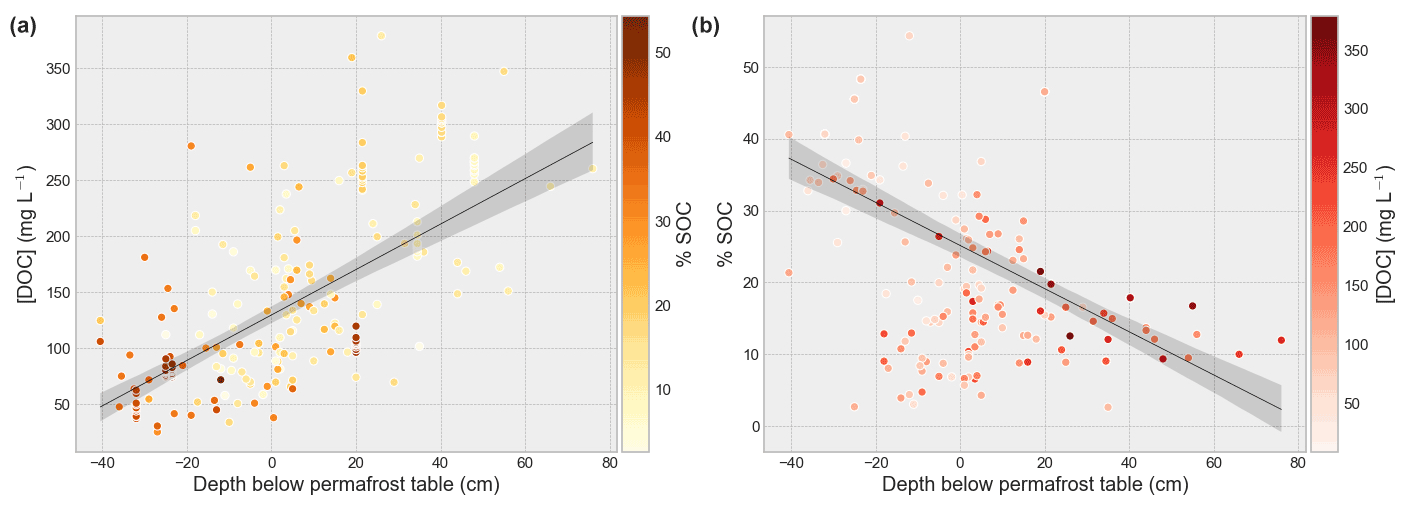
Figure 7DOC concentration (mg L−1) vs. depth to the permafrost table (cm; a) and SOC content (% of dry weight) vs. depth to the permafrost table (cm; b), where a negative value indicates samples within the active layer and a positive one indicates samples below the permafrost table. Colors of the dots show SOC percentage and DOC concentration, respectively, and show the inverse correlation between soil organic carbon content and DOC concentration over the depth of the soil profile. We observe elevated DOC concentrations corresponding with low SOC content around the permafrost table, which may be an effect of flushing in from the overlying Oi horizons and accumulation above the permafrost table. Linear regression of DOC with depth respective to permafrost table in centimeters (i.e., active-layer depth ZAL) yields , R2=0.71, and SOC % , R2=0.55, .
Overall our data show a trend of increasing DOC yield (mg DOC g−1 SOC) with increasing depth in the soil. The depth below the permafrost table proved to be a good indicator of DOC concentration as well (, R2 = 0.71, ). The SOC content showed a negative correlation with depth (Fig. 7), dipping around the permafrost table. This “dipping” effect could be ascribed to the increasing likelihood of waterlogging conditions occurring near the permafrost table of HCP soils (Harden et al., 2012). Signs of stagnant water were observed in several profiles of gleyed soil (typical brown-orange to grey-blueish color patterning caused by waterlogged anoxic conditions). We also noted that in samples of gleyed soil, comprising mostly mineral soils (B horizons), there often was a low SOC content relative to the DOC concentration (i.e., a high DOC yield; in mg DOC g−1 soil OC). This suggests that, due to their waterlogged conditions, either these soils are efficiently leached out and/or DOC is flushed in from overlying O horizons and accumulates. The δ13C signature of DOC shows a more degraded (i.e., more enriched) signal than the bulk δ13C SOC, indicating that the degraded fraction of SOM is preferably leached and/or sorption processes are affecting δ13C DOC signatures. Moreover, we find that values of permafrost δ13C DOC are more enriched than those of the active layer, indicating a more processed OM pool or a stronger DOC leaching effect on 13C in mineral permafrost horizons than organic surface horizons.
4.2 Mobilization and degradation dynamics of OM from soils
4.2.1 Explaining laboratory results
Generally, DOC in the active layer is more labile than DOC in permafrost. Our incubation experiments showed a 17 % DOC loss (7 d) in the active layer, while DOC in permafrost varied between 5 % (HCP) and 7 % (LCP). In a meta-analysis, Vonk et al. (2015a) calculated average bio-labile DOC (BDOC) content in permafrost of ∼ 16 % after 28 d of aerobic incubation (T= 15–25 ∘C, n=205) and even higher BDOC content when looking at continuous permafrost zone leachates only, based on several studies. Although our incubations were done at lower temperatures (4 ∘C), we observed that degradation rates stagnated after ∼ 14 d, hinting that most labile BDOC would have been processed by then. Selvam et al. (2017), who incubated permafrost peat, showed much lower lability (∼ 3 % after 7 d), which confirms that the bioavailability of DOM in permafrost is variable. It is worth noting that the maximum depth at which permafrost was sampled in the study by Selvam et al. (2017) was only 5 cm below the permafrost table, comparable to our study. Vonk et al. (2015a) could not include depth in their assessment of permafrost DOM lability due to limitations in the data. However, they do acknowledge the linkage between depth and DOM character and showed the highest lability in deep Yedoma layers. There may be several explanations for the relative low lability of permafrost DOC compared to the high lability in the active layer. First of all, active-layer DOM likely contains fresh OC components such as bioavailable sugars (Balser, 2004) that degrade quickly. Oi horizons in HCPs show a high SOC content yet low DOC concentrations which may support the rapid loss. Secondly, the depth of sampling within permafrost may have played a role. Due to practical constraints we were only able to extract sufficient porewater from relatively shallow depths (∼ 10 to 50 cm below the permafrost table, taken with a SIPRE corer), whereas smaller samples that were used for DOM spectral characterization reached greater depths (∼ 10 to 100 cm below the permafrost table, taken with a steel tube and sledgehammer). Due to this constraint we likely only sampled within the so-called paleo-active-layer, a remnant from the Holocene thermal maximum (∼ 10.6 ka cal BP) (Fritz et al., 2012; Fouché et al., 2020). This is also supported by degradation-state proxies such as HIX (Fouché et al., 2017) that confirm this, as this value increases with depth up to the permafrost table but then starts to decrease, suggesting an increasing presence of less degraded OM with depth in permafrost. Hence, the sampled OM has likely undergone previous degradation. Thirdly, losses of DOC may have occurred before incubation; on average there was 24 h between onset of thawing of the samples and porewater extraction (i.e., start of the incubation). In this case DOM can be considered highly labile.
4.2.2 Translation of laboratory measurements to soil DOM dynamics in the field
It is difficult to accurately assess the degradability and fate of DOM upon thaw, yet various studies have attempted to tackle the problem of quantifying carbon fluxes from degrading permafrost landscape in situ (e.g., Schuur et al., 2009; Natali et al., 2014; Plaza et al., 2019), bulk soil incubation (e.g., Dutta et al., 2006; Lee et al., 2012; Gentsch et al., 2018) and lateral-flux-specific experiments (e.g., Kalbitz et al., 2003; Kawahigashi et al., 2006; Vonk et al., 2013, 2015b). Porewater DOM incubation experiments as performed in this study are rare; however most confirm that DOM character and thus lability is highly variable on spatial scales (e.g., Shirokova et al., 2019; Fouché et al., 2020; MacDonald et al., 2021). Our results fall within the range of what is found in other studies (0 %–67 % BDOC) (Vonk et al., 2015a) but are on average rather low for permafrost compared with the active layer due to the reasons highlighted above. Nevertheless, our results show that DOM from both permafrost and the active layer will likely be degraded within the soil. Depending on location and transport times the fraction of SOM that reaches stream networks as DOM has undergone significant processing. Although small compared to the soil organic matter stock, the aquatic DOM “stock” we observe in streams is predominantly terrestrially derived and high in aromatic, degraded components.
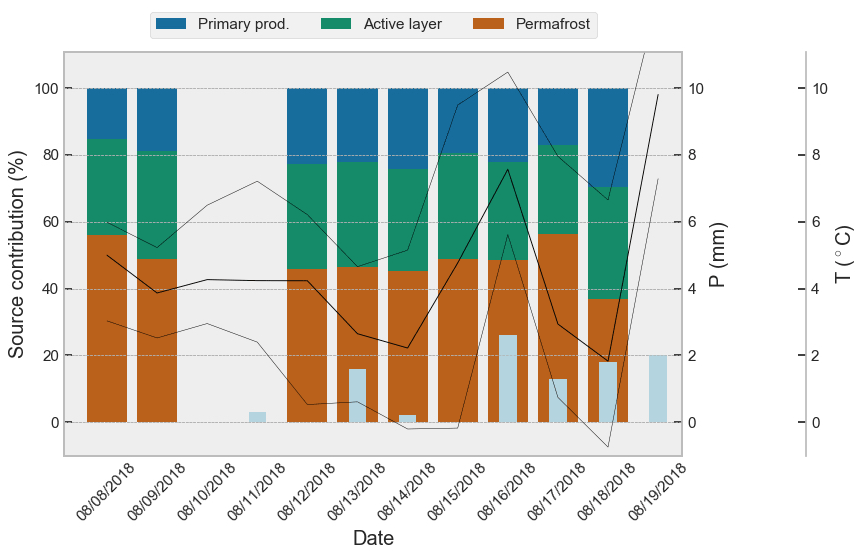
Figure 8Modeled DOM source contributions, aggregated by day, to the catchment outlet sample over time. Plotted together with recorded rainfall (precipitation, P, light-blue bars) and recorded minimum, maximum and mean air temperature (T, black lines). Please note that the date format used in this figure is month/day/year.
4.3 Stream water OM dynamics and drivers during the warm season
The OC export from our investigated watershed is dominated by DOC (meanDOC:meanPOC = ) with limited variability in concentration except from two storm events that diluted the DOC load. This may be explained by the flat topography in this area which minimizes impacts of bank erosion and thermo-erosion that enhance sediment mobilization (Costard et al., 2003), along with long residence times of groundwater within the soil facilitating DOC leaching (Connolly et al., 2018). Similar dominance of DOC has been shown elsewhere in the pan-Arctic watershed, both in large and small rivers (e.g., Holmes et al., 2012; Fabre et al., 2019; Coch et al., 2020), but this dominance may be even more pronounced for low-relief tundra plains. Based on satellite imagery (WorldView-2, DigitalGlobe Inc., acquired on 18 July 2018) an estimated ∼ 80 % to ∼ 90 % of our watershed consists of HCP terrain. The δ13C DOC and δ13C POC signatures from the stream water at the outlet compared to what was found in porewaters suggest that DOC is predominantly derived from HCP terrestrial sources (Mann et al., 2015), whereas POC likely stems from primary production of phytoplankton growth within the stream network or ice wedge troughs (Tank et al., 2011; Winterfeld et al., 2015) or fragments of sedge biomass transported into the stream (Wooller et al., 2007). According to our source apportionment ∼ 81 %–∼ 90 % is of terrestrial origin with 48 ± 19 % of the DOM/DOC stemming from permafrost. The remainder (22 ± 15 %) is most likely aquatic DOM/DOC produced by primary production (Fig. 8). The tributaries δ13C signal showing signs of primary production indicates that these small ice wedge trough streams are not necessarily important for transporting terrestrial OM. Presumably terrestrial OM is rather transported towards the main channel via supra-permafrost base flow, instead of via IWP troughs. Alternatively, terrestrial OM present in the IWP troughs may quickly be decomposed and/or incorporated into primary production. Increased hydrologic connectivity of IWP troughs as well as increased connectivity via active-layer deepening in permafrost watersheds (Lafrenière and Lamoureux, 2019; Evans et al., 2020) may lead to higher input of terrestrial OM.
At the outlet we measured the variable OC concentration and geochemical signature over time, with three observable patterns: (i) diurnal variation in CDOM abundance and optical properties; (ii) short, storm-induced peaks in POC and dips in DOC; and (iii) seasonal decline in DOM export (Fig. 3a and b, right).
- i.
We observed a diurnal pattern in CDOM concentrations (range: ∼ 20 %–25 %) at the stream outlet (Fig. 3a, right). This diurnal pattern can be explained by both temperature- and light-dependent variability in productivity as well as variations in ground ice melt contribution and evapotranspiration-induced flow effects, which are in turn temperature dependent (Spencer et al., 2008; Ruhala and Zarnetske, 2017). We observe that CDOM fluctuates synchronously with water temperature (i.e., peaks in water temperature correspond with peaks in CDOM). Similarly, peaks in Sr (∼ 0.9) and FI (∼ 1.5) correspond with lows in temperature, while for HIX this pattern is inverted (Fig. S9). This dynamic may be explained by the increasing importance of primary production with high temperatures and decreasing importance of deeper baseflow when temperature decreases (i.e., flow becomes shallower, and the signal becomes less deeply terrestrial). The highest values of HIX are found around the permafrost table (presumably where baseflow takes place) (Fig. S7), and a decrease in HIX at the outlet in sync with lowering temperatures supports the idea of freezing up from below.
- ii.
A storm event on 16 and 17 August resulted in dilution of CDOM and DOC concentrations and a sharp spike in POC load (Fig. 3a and b, right). This shifted the DOC : POC ratio from an average of 50 to 5.1. We also observed an increase in pH (from ∼ 7 to ∼ 8) and spikes in EC (up to ∼ 19 000 µS cm−1 compared to an average of ∼ 100 µS cm−1). The storm event was characterized by strong northwesterly winds which, given the shape and orientation of the lagoon, are likely to have pushed water up the stream channel. Due to its proximity to Ptarmigan Bay lagoon the autosampler and multi-parameter probe are likely to have recorded the inflow of lagoon water during a storm spring tide. Simultaneously, we observed two peaks in POC export with two different terrestrial δ13C POC signals; the first one (∼ −31 ‰ on 16 August) lasted only 6 h, and the second one (∼ −27.5 ‰ on 17 August) lingered on for ca. 18 h before going back to the background signal around −29 ‰. This is compared to the average δ13C POC signal at the outlet, which tends to be a more primarily produced signal (−29.31 ± 0.8 ‰ SD, Table 3). We attribute the drop in DOC during this event to dilution by the influx of seawater, while the increase in POC and isotopic signal shift to a more terrestrial signal (δ13C POC = −27.5 ‰) seems to result from the input of storm-induced flushing of terrestrial POC, from overland flow, wind-driven bank erosion, and/or bottom disturbance in upstream lakes and ponds.
- iii.
Our sensor and sample data show a decreasing trend in both CDOM and DOC concentration during our 10 d sampling period (Figs. 3a and b, right, and S9). A possible explanation is the gradual decline in temperature in the late summer. Temperature records from nearby Herschel Island (Fig. S1) show our 10 d monitoring period within the larger seasonal trend to be on the falling limb of the annual temperature curve. The decrease in concentrations over time can be caused by the following. (i) Lower temperatures may decrease the efficiency of OM soil leaching (Whitworth et al., 2014) over time. (ii) Additionally, we observed that some of our material installed in the soil had been frozen solid by the end of the monitoring period. This indicates that the active layer is already starting to freeze up from below, potentially leading to lower soil DOC flux. (iii) Finally, a decrease in temperatures and solar irradiation toward the end of summer could have led to lower primary production in the aquatic network, explaining some of the variation. It is most probable that all three explanations contribute to what was measured.
Several studies have looked at seasonal variability in DOC and DOM composition and concluded that antecedent winter DOC is flushed out during freshet, resulting in a DOC peak with relatively low Sr and FI and high SUVA254, indicative of DOM coming from the organic surface layer. As the summer season progresses, a steady increase in Sr and FI and decrease in SUVA254 and DOC continuing up to the very end of the season were found uniformly in rivers across the Arctic, linked to the increasing contribution of deeper soil horizons via deepening of the active layer (Neff et al., 2006; Spencer et al., 2008, 2009a; Holmes et al., 2008, 2012). In this respect our study shows similar trends in DOC, SUVA254, Sr and FI at the outlet over the course of the monitoring period.
Our source apportionment using δ13C DOC, Sr and as tracers showed that a high proportion of DOC within the stream originates from permafrost/deep-active-layer DOC contributions (∼ 48 %), outnumbering the DOC influx from the active layer (∼ 31 %) and primary production within the stream (∼ 21 %). This is in stark contrast to larger (Siberian) Arctic rivers (Wild et al., 2019), where fluvial DOM fluxes stem predominantly from recent terrestrial primary-production sources. Due to the small catchment size the contribution of permafrost OC is likely more evident in small streams, and the difference between these and larger Arctic rivers may indicate that permafrost DOC is likely degraded before it reaches larger rivers. Moreover, small streams like the one in this study drain a degrading continuous permafrost landscape exclusively, whereas large Arctic rivers drain also non-permafrost or discontinuous permafrost terrain, disproportionally contributing to the riverine OM fluxes (e.g., Frey and McClelland, 2009). The spatial and temporal extent of terrestrial permafrost inputs into stream networks may likely expand upon increasing severity of meteorological extremes. For instance, Schwab et al. (2020) found aged DOC downstream in the Mackenzie River main stem, following a warm summer and the second warmest winter on record.
This study shows that permafrost-DOM-related processes are most visible close to the terrestrial–aquatic interface, i.e., in the headwaters of Arctic rivers. With our results we also show that variability herein is highly seasonal and weather driven, as our measurements at the outlet show diurnal, storm event and seasonal-trend patterns within the duration of our relatively short (10 d) field campaign. This emphasizes the need for high-resolution long-term measurements (e.g., such as those ongoing at Cape Bounty Arctic Watershed Observatory (CBAWO); Lamoureux and Lafrenière, 2018) in order to fully understand the mechanisms at work in the (Arctic) permafrost watershed OM dynamics. Important is the notion that cascading effects and food web interactions resulting from permafrost release into Arctic headwaters may be difficult to detect but may have large impacts on sensitive Arctic ecosystems (e.g., Vonk et al., 2015a).
4.4 First estimate of fluxes from small streams
Small IWP tundra watersheds such as Black Creek, presented here, are abundant in and representative of the lowland regions of the coastal Arctic continuous permafrost zone. Due to their abundance and proximity to the Arctic Ocean, tundra streams have the potential to export large quantities of terrestrial permafrost organic matter into coastal waters. Our samples and measurements at the outlet give insight into the average discharge and OC flux of a typical tundra stream during summer. We acknowledge that uncertainty exists in these data and that extrapolation based on a single watershed will greatly increase these uncertainties. Still, we deem our study area representative of the majority of small catchments along the Canadian Yukon Coastal Plain (roughly from the Alaskan border in the west to Shingle Point in the east). As a first attempt toward upscaling from small stream data, we used mean discharge (67 ± 51.1 L s−1), mean DOC and POC concentration (16.89 ± 0.7 and 0.36 ± 0.1 mg L−1), and a catchment area of ∼ 4 km2 to make an area-based estimated baseline OC flux for the region. This yields a DOC flux of ∼ 0.03 ± 0.021 and POC flux of ∼ 0.0005 ± 0.00042 . In these flux estimates we excluded the variability caused by storm days. In contrast to DOC, POC fluxes are likely to be highly variable, since they are impacted by summer storm activity which can vary between 2 and 21 storms yr−1 in the southern Beaufort Sea region (Hudak and Young, 2002). Arctic-type storms are most prevalent in July and August and average 8 storms per season. Assuming a duration of 1–2 d per storm, this would lead to an additional export of ∼ 0.010–0.020 g POC m−2 annually. The period through which lateral transport of OM occurs is dependent on the thaw season length and the rate at which the seasonal active layer deepens. To estimate seasonal fluxes, we use an average thaw season duration of 87.7 consecutive frost-free days calculated over the period 1950–2013 from “The Climate Atlas of Canada” (version 2, 10 July 2019, https://climateatlas.ca, last access: 18 August 2021). Using this average, we calculate that Black Creek watershed (∼ 4 km2) exports an average of 8.58 ± 6.6 t DOC yr−1 (or 2.14 ± 1.6 ) and 0.24 ± 0.2 t POC yr−1 (or 0.061 ± 0.04 ). A similar study by Coch et al. (2018) showed an average 17 d flux of 82.7 ± 30.7 kg DOC km−2 and 3802.5 kg POC km−2. Making accurate extrapolations based on a few data points is debatable, yet by studying watersheds that are representative of IWP tundra we attempt to gain a first insight into the magnitude lateral OC flux components from this particular system on a larger scale. Our data compared with the nearby study site presented by Coch et al. (2018) show that OC fluxes from small streams are variable. With longer, warmer seasons and higher storm frequencies which are predicted for the Arctic (Day and Hodges, 2018), mobilization and export of POC and DOC towards the Arctic Ocean may substantially increase.
4.5 Implications and future research
This study focuses on data retrieved during the latest stage of the thawing season, when active-layer depths are at their seasonal maximum. Our results show that OC quality and quantity varies between different soil horizons and landform (i.e., polygon type). Evolution of landforms via degradation of IWPs from LCPs to HCPs is likely to result in increased drainage and drying of the landscape and increased net runoff as a consequence. Our results show that the balance between lateral and vertical flux is therefore likely to shift toward lateral flux as mobilizable OM will be flushed out of the system more effectively. The shift towards drainage and export rather than within-ecosystem processing may have strong effects on the Arctic lowland tundra biodiversity and food web interactions, since these are to a large extent based on wetland ecosystems (e.g., Vonk et al., 2015a; Liljedahl et al., 2016).
In parallel to annual active-layer depth deepening, older and potentially more labile OM pools will become available for degradation. In this study we find indications that the most labile fractions are utilized within the soil, and we expect that even in a more well-drained HCP system, residence times within the soil will be long enough to allow for the utilization of the majority of labile DOM. The results show that concentrations of DOC in permafrost are much higher than in the active layer. This together with the notion that labile DOM would be converted quickly leads to the expectation that under current climate trends, small Arctic catchments affected by permafrost degradation may export higher loads of recalcitrant DOM. This in turn could impact aquatic food webs. Due to its strong coloration permafrost and deep-active-layer-derived CDOM could significantly impact light-dependent processes in the aquatic network. Moreover, chemical composition of permafrost and deep-active-layer DOM (e.g., high values of ammonium were found) may impact aquatic biogeochemistry. More research is needed to elucidate these ecosystem interactions.
To better understand and implement lateral permafrost OM dynamics in climate models, more quantitative and qualitative data on the distribution and behavior of small, pan-Arctic permafrost catchments are needed. Moreover, there is a need for more detailed mapping of these watersheds (e.g., high-resolution watershed delineation and assessment of watershed characteristics). Both the former and latter could be achieved by more longer-term (weeks or ideally months or years) monitoring on a larger spatial scale, e.g., by installing sensors and conducting repetitive field research in designated representative areas as well as by aggregating databases with field and remote sensing data (e.g., mapping of landscape-scale changes such as IWP degradation that help predict shifts in soil–stream dynamics and remote-sensing-derived SOC stock maps which could help predict soil DOC stocks and serve as a starting point to predict headwater stream DOC on a larger scale). Such an aggregated database would be valuable input for spatial modeling of lateral carbon fluxes. We also acknowledge that our and future studies would benefit from more extensive sampling to determine unambivalent endmember tracer values, especially for primary-production sources. Hence, we encourage future research efforts aiming to perform source apportionment to extensively test and select suitable endmembers and tracer values. Lastly, by focusing on optical properties of DOM it is relatively easy and cost-effective to trace changes in watershed biogeochemistry, as optical measurement techniques are relatively uncomplicated and readily available. Usage of these techniques together with the standardization of protocols and methods are therefore recommended in order to achieve a more harmonized approach toward understanding lateral permafrost OM dynamics.
This study investigates the lateral release of organic matter in an Arctic lowland IWP tundra watershed, subject to permafrost degradation. Soil porewater DOM properties and DOC concentrations in the Black Creek catchment vary between the thermal layer (i.e., active layer and permafrost) and landform (i.e., LCP and HCP), reflecting differences in drainage patterns and waterlogged conditions. Also, within the active layer, DOM signatures vary between polygon types due to differences in drainage status (i.e., LCPs are more waterlogged, whereas HCPs are well drained). HCP active layers show a more degraded OM signature. When further Arctic warming transitions LCP landscapes into HCP-dominated settings, this may lead to an increasing flux of degraded DOM from soils to streams.
Dissolved carbon yields (mg DOC g−1 soil OC) increase with soil depth yet show a larger variability around the permafrost table. Samples of gleyed soil from mineral horizons had relatively highly dissolved yields while having low SOC contents; hence accumulation of DOM from other horizons in these gleyed horizons is likely. Porewater incubation experiments show 5 %–17 % DOC loss after 7 d, with higher losses for the active layer than permafrost. The incubated permafrost samples are mostly from within the transition layer where degradation has likely occurred in the past. Optical properties however indicate increasingly fresh and (potentially) labile OM with depth. A long transport time of porewater DOC within these low-relief catchments suggests that most permafrost DOM is processed/degraded within the soil before it reaches the stream network.
Black Creek transports much more DOC than POC, but storm events change that ratio by an order of magnitude. Our 10 d monitoring period shows diurnal, weather-driven and intermediate-term (over the course of multiple days) patterns in OC concentrations and properties. Source apportionment of stream DOC using δ13C and DOM spectral signatures show a dominance of terrestrial OC over autochthonous production and a deep-active-layer/permafrost DOC contribution around 48 %. This contrasts with larger Arctic fluvial systems that are dominated by recent terrestrial production. The first upscaling estimates of annual Black Creek fluxes give values of 2.03 ± 1.6 and 0.053 ± 0.05 . Although we deem Black Creek representative of IWP creeks along the tundra of the Yukon Coastal Plain, spatial and temporal variability yields large uncertainties. Hence in order to be able to upscale fluxes from these small Arctic watersheds, more extensive sampling is needed.
High-frequency measurements at the outlet in combination with in situ weather observations underline the highly variable nature of small Arctic watersheds and their susceptibility to changes. To get a more thorough understanding of Arctic watersheds and their responses to climate change and permafrost degradation, it is important that more spatially and temporally widespread monitoring efforts of these streams are implemented (e.g., through sensor installations and the use of cost-effective optical proxies) to monitor change. Further, combining remote sensing data with field observations and machine learning techniques poses a powerful tool for upscaling.
Code for the source apportionment was taken and adapted from Bosch et al. (2015; https://doi.org/10.1021/acs.est.5b01190) and is available on request. Other software code (statistics, plotting and data processing) is available on request.
All data relevant for this study can be found in the Supplement. Specific snapshots of the data are available on request.
The supplement related to this article is available online at: https://doi.org/10.5194/bg-19-3073-2022-supplement.
NJS is the lead author responsible for the main scientific conceptualization, field and laboratory work setup and execution, and the manuscript writing. JEV is responsible as the main supervising authority for this research project and provided main conceptual content as well as guidance and input during manuscript writing. Aside from these contributions, JEV provided main financial and managerial support. GT contributed to project conceptualization and fieldwork planning, logistics, and execution. VM, JW, AW and GH provided permafrost soil samples and soil and landscape descriptions as well as field assistance and minor manuscript writing input. CB and RL helped with sample preparation before analysis. CK, BPK and UW performed various laboratory analyses and provided DOM-related scientific expertise. HL is one of the main founders of the overarching project Nunataryuk, which provides the framework within which this research is placed. HL also arranged the necessary permits and infrastructure for the fieldwork.
At least one of the (co-)authors is a member of the editorial board of Biogeosciences. The peer-review process was guided by an independent editor, and the authors also have no other competing interests to declare.
Publishers note: Copernicus Publications remains neutral with regard to jurisdictional claims in published maps and institutional affiliations.
We thank all those who have made contributions that have led to this publication. We thank the Yukon territorial government, Yukon Parks (Herschel Island – Qikiqtaruk Territorial Park) and the Aurora Research Institute for their support during this project. We wish to express our special gratitude to Colin Stedmon for providing laboratory access, equipment and guidance and to Suzan Verdegaal-Warmerdam, Anders Dalhoff Bruhn Jensen, Claudia Burau, Justus Gimsa, Samuel Stettner, Alison Beamish, Konstantin Klein, Rob Broekman, Richard van Logtestijn, Monica Sanchez Roman, Michael Fritz and Lisa Bröder for laboratory analysis, field and laboratory assistance, and brainstorming sessions during the research project. We thank Samuel McLeod, Peter Archie and Frank Dillon for their helpful insights and support in the field.
This research has been supported by Horizon 2020 (Nunataryuk; grant agreement no. 773421).
This paper was edited by Yuan Shen and reviewed by two anonymous referees.
AMAP: Snow, Water, Ice and Permafrost in the Arctic, Arctic Monitoring and Assessment Programme (AMAP), Oslo, Norway, xiv + 269 pp., ISBN 978-82-7971-101-8, 2017.
Balser, T. C.: Humification, in: Encyclopedia of Soils in the Environment, edited by: Hillel, D., Elsevier, Oxford, 195–207, https://doi.org/10.1016/B0-12-348530-4/00453-7, 2004.
Beel, C. R., Lamoureux, S. F., Orwin, J. F., Pope, M. A., Lafrenière, M. J., and Scott, N. A.: Differential impact of thermal and physical permafrost disturbances on High Arctic dissolved and particulate fluvial fluxes, Scientific Reports, 10, 11836, https://doi.org/10.1038/s41598-020-68824-3, 2020
Biskaborn, B. K., Smith, S. L., Noetzli, J., et al.: Permafrost is warming at a global scale, Nat. Commun., 10, 264, https://doi.org/10.1038/s41467-018-08240-4, 2019.
Bosch, C., Andersson, A., Kruså, M., Bandh, C., Hovorková, I., Klánová, J., Knowles, T. D. J., Pancost, R. D., Evershed, R. P., and Gustafsson, Ö.: Source Apportionment of Polycyclic Aromatic Hydrocarbons in Central European Soils with Compound-Specific Triple Isotopes (δ13C, Δ14C, and δ2H), Environ. Sci. Technol., 49, 7657–7665, https://doi.org/10.1021/acs.est.5b01190, 2015.
Boström, B., Comstedt, D., and Ekblad, A.: Isotope fractionation and 13C enrichment in soil profiles during the decomposition of soil organic matter, Oecologia, 153, 89–98, https://doi.org/10.1007/s00442-007-0700-8, 2007.
Bring, A., Fedorova, I., Dibike, Y., Hinzman, L., Mård, J., Mernild, S. H., Prowse, T., Semenova, O., Stuefer, S. L., and Woo, M. K.: Arctic terrestrial hydrology: A synthesis of processes, regional effects, and research challenges, J. Geophys. Res.-Biogeo., 121, 621–649, https://doi.org/10.1002/2015JG003131, 2016.
Butman, D., Raymond, P. A., Butler, K., and Aiken, G.: Relationships between Δ14C and the molecular quality of dissolved organic carbon in rivers draining to the coast from the conterminous United States, Global Biogeochem. Cy., 26, GB4014, https://doi.org/10.1029/2012GB004361, 2012.
Coch, C., Lamoureux, S. F., Knoblauch, C., Eischeid, I., Fritz, M., Obu, J., and Lantuit, H.: Summer rainfall dissolved organic carbon, solute, and sediment fluxes in a small Arctic coastal catchment on Herschel Island (Yukon Territory, Canada), Arct. Sci., 4, 750–780, https://doi.org/10.1139/as-2018-0010, 2018.
Coch, C., Ramage, J. L., Lamoureux, S. F., Meyer, H., Knoblauch, C., and Lantuit, H.: Spatial Variability of Dissolved Organic Carbon, Solutes, and Suspended Sediment in Disturbed Low Arctic Coastal Watersheds, J. Geophys. Res.-Biogeo., 125, e2019JG005505, https://doi.org/10.1029/2019JG005505, 2020.
Connolly, C. T., Khosh, M. S., Burkart, G. A., Douglas, T. A., Holmes, R. M., Jacobson, A. D., Tank, S. E., and McClelland, J. W.: Watershed slope as a predictor of fluvial dissolved organic matter and nitrate concentrations across geographical space and catchment size in the Arctic, Environ. Res. Lett., 13, 104015, https://doi.org/10.1088/1748-9326/aae35d, 2018.
Cory, R. M., Miller, M. P., Mcknight, D. M., Guerard, J. J., and Miller, P. L.: Effect of instrument-specific response on the analysis of fulvic acid fluorescence spectra, Limnol. Oceanogr.-Meth., 8, 67–78, https://doi.org/10.4319/lom.2010.8.67, 2010.
Costard, F., Dupeyrat, L., Gautier, E., and Carey-Gailhardis, E.: Fluvial thermal erosion investigations along a rapidly eroding river bank: Application to the Lena River (Central Siberia), Earth Surf. Proc. Land., 28, 1349–1359, https://doi.org/10.1002/esp.592, 2003.
Couture, N. J. and Pollard, W. H.: A Model for Quantifying Ground-Ice Volume, Yukon Coast, Western Arctic Canada, Permafrost Periglac., 28, 534–542, https://doi.org/10.1002/ppp.1952, 2017.
Couture, N. J., Irrgang, A., Pollard, W., Lantuit, H., and Fritz, M. Coastal Erosion of Permafrost Soils Along the Yukon Coastal Plain and Fluxes of Organic Carbon to the Canadian Beaufort Sea, J. Geophys. Res.-Biogeo., 123, 406–422, https://doi.org/10.1002/2017JG004166, 2018.
Dansgaard, W.: Stable isotopes in precipitation, Tellus, 16, https://doi.org/10.3402/tellusa.v16i4.8993, 1964.
Day, J. J. and Hodges, K. I.: Growing Land-Sea Temperature Contrast and the Intensification of Arctic Cyclones, Geophys. Res. Lett., 45, 3673–3681, https://doi.org/10.1029/2018GL077587, 2018.
De Haan, H. and De Boer, T.: Applicability of light absorbance and fluorescence as measures of concentration and molecular size of dissolved organic carbon in humic Lake Tjeukemeer, Water Res., 21, 731–734, https://doi.org/10.1016/0043-1354(87)90086-8, 1987.
Drake, T. W., Raymond, P. A., and Spencer, R. G. M.: Terrestrial carbon inputs to inland waters: A current synthesis of estimates and uncertainty, Limnology and Oceanography Letters, 3, 132–142, https://doi.org/10.1002/lol2.10055, 2018.
Dunton, K. H., Weingartner, T., and Carmack, E. C.: The nearshore western Beaufort Sea ecosystem: Circulation and importance of terrestrial carbon in arctic coastal food webs, Prog. Oceanogr., 71, 362–378, https://doi.org/10.1016/j.pocean.2006.09.011, 2006.
Dutta, K., Schuur, E. A. G., Neff, J. C., and Zimov, S. A.: Potential carbon release from permafrost soils of Northeastern Siberia, Glob. Change Biol., 12, 2336–2351, https://doi.org/10.1111/j.1365-2486.2006.01259.x, 2006.
Evans, S. G., Yokeley, B., Stephens, C., and Brewer, B.: Potential mechanistic causes of increased baseflow across northern Eurasia catchments underlain by permafrost, Hydrol. Process., 34, 2676–2690, https://doi.org/10.1002/hyp.13759, 2020.
Fabre, C., Sauvage, S., Tananaev, N., Noël, G. E., Teisserenc, R., Probst, J. L., and Pérez, J. M. S.: Assessment of sediment and organic carbon exports into the Arctic ocean: The case of the Yenisei River basin, Water Res., 158, 118–135, https://doi.org/10.1016/j.watres.2019.04.018, 2019.
Fellman, J. B., Hood, E., and Spencer, R. G. M.: Fluorescence spectroscopy opens new windows into dissolved organic matter dynamics in freshwater ecosystems: A review, Limnol. Oceanogr., 55, 2452–2462, https://doi.org/10.4319/lo.2010.55.6.2452, 2010.
Fouché, J., Lafrenière, M. J., Rutherford, K., and Lamoureux, S.: Seasonal hydrology and permafrost disturbance impacts on dissolved organic matter composition in High Arctic headwater catchments, Arctic Science, 3, 378–405, https://doi.org/10.1139/as-2016-0031, 2017.
Fouché, J., Christiansen, C. T., Lafrenière, M. J., Grogan, P., and Lamoureux, S. F.: Canadian permafrost stores large pools of ammonium and optically distinct dissolved organic matter, Nat. Commun., 11, 4500, https://doi.org/10.1038/s41467-020-18331-w, 2020.
Frey, K. E. and McClelland, J. W.: Impacts of permafrost degradation on arctic river biogeochemistry, Hydrol. Process., 23, 169–182, https://doi.org/10.1002/hyp.7196, 2009.
Fritz, M., Wetterich, S., Schirrmeister, L., Meyer, H., Lantuit, H., Preusser, F., and Pollard, W. H.: Eastern Beringia and beyond: Late Wisconsinan and Holocene landscape dynamics along the Yukon Coastal Plain, Canada, Palaeogeogr. Palaeocl., 319–320, 28–45, https://doi.org/10.1016/j.palaeo.2011.12.015, 2012.
Fritz, M., Wolter, J., Rudaya, N., Palagushkina, O., Nazarova, L., Obu, J., Rethemeyer, J., Lantuit, H., and Wetterich, S., Holocene ice-wedge polygon development in northern Yukon permafrost peatlands (Canada), Quaternary Sci. Rev., 147, 279–297, https://doi.org/10.1016/j.quascirev.2016.02.008, 2016.
Galley, R. J., Babb, D., Ogi, M., Else, B. G. T., Geilfus, N. X., Crabeck, O., Barber, D. G., and Rysgaard, S.: Replacement of multiyear sea ice and changes in the open water season duration in the Beaufort Sea since 2004, J. Geophys. Res.-Oceans, 121, 1806–1823, https://doi.org/10.1002/2015JC011583, 2016.
Gentsch, N., Wild, B., Mikutta, R., Čapek, P., Diáková, K., Schrumpf, M., Turner, S., Minnich, C., Schaarschmidt, F., Shibistova, O., Schnecker, J., Urich, T., Gittel, A., Šantrůčková, H., Bárta, J., Lashchinskiy, N., Fuß, R., Richter, A., and Guggenberger, G.: Temperature response of permafrost soil carbon is attenuated by mineral protection, Glob. Change Biol., 24, 3401–3415, https://doi.org/10.1111/gcb.14316, 2018.
Grotheer, H., Meyer, V., Riedel, T., Pfalz, G., Mathieu, L., Hefter, J., Gentz, T., Lantuit, H., Mollenhauer, G., and Fritz, M.: Burial and Origin of Permafrost-Derived Carbon in the Nearshore Zone of the Southern Canadian Beaufort Sea, Geophys. Res. Lett., 47, e2019GL085897, https://doi.org/10.1029/2019GL085897, 2020.
Harden, J. W., Koven, C. D., Ping, C. L., Hugelius, G., David McGuire, A., Camill, P., Jorgenson, T., Kuhry, P., Michaelson, G. J., O’Donnell, J. A., Schuur, E. A. G., Tarnocai, C., Johnson, K., and Grosse, G.: Field information links permafrost carbon to physical vulnerabilities of thawing, Geophys. Res. Lett., 39, L15704, https://doi.org/10.1029/2012GL051958, 2012.
Helms, J. R., Stubbins, A., Ritchie, J. D., Minor, E. C., Kieber, D. J., and Mopper, K.: Absorption spectral slopes and slope ratios as indicators of molecular weight, source, and photobleaching of chromophoric dissolved organic matter, Limnol. Oceanogr., 53, 955–969, https://doi.org/10.4319/lo.2008.53.3.0955, 2008.
Hölemann, J. A., Juhls, B., Bauch, D., Janout, M., Koch, B. P., and Heim, B.: The impact of the freeze–melt cycle of land-fast ice on the distribution of dissolved organic matter in the Laptev and East Siberian seas (Siberian Arctic), Biogeosciences, 18, 3637–3655, https://doi.org/10.5194/bg-18-3637-2021, 2021.
Holmes, R. M., McClelland, J. W., Raymond, P. A., Frazer, B. B., Peterson, B. J., and Stieglitz, M.: Lability of DOC transported by Alaskan rivers to the Arctic Ocean, Geophys. Res. Lett., 35, L03402, https://doi.org/10.1029/2007GL032837, 2008.
Holmes, R. M., McClelland, J. W., Peterson, B. J., Tank, S. E., Bulygina, E., Eglinton, T. I., Gordeev, V. V., Gurtovaya, T. Y., Raymond, P. A., Repeta, D. J., Staples, R., Striegl, R. G., Zhulidov, A. V., and Zimov, S. A.: Seasonal and Annual Fluxes of Nutrients and Organic Matter from Large Rivers to the Arctic Ocean and Surrounding Seas, Estuaries Coasts, 35, 369–382, https://doi.org/10.1007/s12237-011-9386-6, 2012.
Hudak, D. R. and Young, J. M. C.: Storm climatology of the Southern Beaufort sea, Atmos. Ocean, 40, 145–158, https://doi.org/10.3137/ao.400205, 2002.
Hugelius, G., Strauss, J., Zubrzycki, S., Harden, J. W., Schuur, E. A. G., Ping, C.-L., Schirrmeister, L., Grosse, G., Michaelson, G. J., Koven, C. D., O'Donnell, J. A., Elberling, B., Mishra, U., Camill, P., Yu, Z., Palmtag, J., and Kuhry, P.: Estimated stocks of circumpolar permafrost carbon with quantified uncertainty ranges and identified data gaps, Biogeosciences, 11, 6573–6593, https://doi.org/10.5194/bg-11-6573-2014, 2014.
Jensen, J. L., Christensen, B. T., Schjønning, P., Watts, C. W., and Munkholm, L. J.: Converting loss-on-ignition to organic carbon content in arable topsoil: pitfalls and proposed procedure, Eur. J. Soil Sci., 69, 604–612, https://doi.org/10.1111/ejss.12558, 2018.
Kaiser, K., Guggenberger, G., and Zech, W.: Isotopic fractionation of dissolved organic carbon in shallow forest soils as affected by sorption, Eur. J. Soil Sci., 52, 585–597, https://doi.org/10.1046/j.1365-2389.2001.00407.x, 2001.
Kalbitz, K., Schmerwitz, J., Schwesig, D., and Matzner, E.: Biodegradation of soil-derived dissolved organic matter as related to its properties, Geoderma, 113, 273–291, https://doi.org/10.1016/S0016-7061(02)00365-8, 2003.
Karjalainen, O., Luoto, M., Aalto, J., Etzelmüller, B., Grosse, G., Jones, B. M., Lilleøren, K. S., and Hjort, J., High potential for loss of permafrost landforms in a changing climate, Environ. Res. Lett., 15, 104065, https://doi.org/10.1088/1748-9326/abafd5, 2020.
Kawahigashi, M., Kaiser, K., Rodionov, A., and Guggenberger, G.: Sorption of dissolved organic matter by mineral soils of the Siberian forest tundra, Glob. Change Biol., 12, 1868–1877, https://doi.org/10.1111/j.1365-2486.2006.01203.x, 2006.
Koven, C. D., Ringeval, B., Friedlingstein, P., Ciais, P., Cadule, P., Khvorostyanov, D., Krinner, G., and Tarnocai, C.: Permafrost carbon-climate feedbacks accelerate global warming, P. Natl. Acad. Sci. USA, 108, 14769–14774, https://doi.org/10.1073/pnas.1103910108, 2011.
Lafrenière, M. J. and Lamoureux, S. F.: Effects of changing permafrost conditions on hydrological processes and fluvial fluxes, Earth-Sci. Rev., 191, 212–223, 2019.
Lammers, R. B., Shiklomanov, A. I., Vörösmarty, C. J., Fekete, B. M., and Peterson, B. J., Assessment of contemporary Arctic river runoff based on observational discharge records, J. Geophys. Res.-Atmos., 106, 3321–3334, https://doi.org/10.1029/2000JD900444, 2001.
Lamoureux, S. F. and Lafrenière, M. J.: More than just snowmelt: integrated watershed science for changing climate and permafrost at the Cape Bounty Arctic Watershed Observatory, WIREs Water, 5, e1255, https://doi.org/10.1002/wat2.1255, 2018.
Lee, H., Schuur, E. A. G., Inglett, K. S., Lavoie, M., and Chanton, J. P.: The rate of permafrost carbon release under aerobic and anaerobic conditions and its potential effects on climate, Glob. Change Biol., 18, 515–527, https://doi.org/10.1111/j.1365-2486.2011.02519.x, 2012.
Lee, M. H., Lee, S. Y., Yoo, H. Y., Shin, K. H., and Hur, J.: Comparing optical versus chromatographic descriptors of dissolved organic matter (DOM) for tracking the non-point sources in rural watersheds, Ecol. Indic., 117, 106682, https://doi.org/10.1016/j.ecolind.2020.106682, 2020.
Lewis, T. and Lamoureux, S. F.: Twenty-first century discharge and sediment yield predictions in a small high Arctic watershed, Global Planet. Change, 71, 27–41, https://doi.org/10.1016/j.gloplacha.2009.12.006, 2010.
Liljedahl, A., Hinzman, L. D., and Schulla, J.: Ice-wedge polygon type controls low-gradient watershed-scale hydrology, in: Proceedings of the Tenth International Conference on Permafrost, The Northern Publisher, 1, 231–236, 2012.
Liljedahl, A. K., Boike, J., Daanen, R. P., Fedorov, A. N., Frost, G. V., Grosse, G., Hinzman, L. D., Iijma, Y., Jorgenson, J. C., Matveyeva, N., Necsoiu, M., Raynolds, M. K., Romanovsky, V. E., Schulla, J., Tape, K. D., Walker, D. A., Wilson, C. J., Yabuki, H., and Zona, D.: Pan-Arctic ice-wedge degradation in warming permafrost and its influence on tundra hydrology, Nat. Geosci., 9, 312–318, https://doi.org/10.1038/ngeo2674, 2016.
MacDonald, E. N., Tank, S. E., Kokelj, S. V., Froese, D. G., and Hutchins, R. H. S.: Permafrost-derived dissolved organic matter composition varies across permafrost end-members in the western Canadian Arctic, Environ. Res. Lett., 16, 024036, https://doi.org/10.1088/1748-9326/abd971, 2021.
MacDougall, A. H., Avis, C. A., and Weaver, A. J.: Significant contribution to climate warming from the permafrost carbon feedback, Nat. Geosci., 5, 719–721, https://doi.org/10.1038/ngeo1573, 2012.
Mann, P. J., Davydova, A., Zimov, N., Spencer, R. G. M., Davydov, S., Bulygina, E., Zimov, S., and Holmes, R. M.: Controls on the composition and lability of dissolved organic matter in Siberia's Kolyma River basin, J. Geophys. Res.-Biogeo., 117, G01028, https://doi.org/10.1029/2011JG001798, 2012.
Mann, P. J., Eglinton, T. I., McIntyre, C. P., Zimov, N., Davydova, A., Vonk, J. E., Holmes, R. M., and Spencer, R. G. M.: Utilization of ancient permafrost carbon in headwaters of Arctic fluvial networks, Nat. Commun., 6, 7856, https://doi.org/10.1038/ncomms8856, 2015.
McKinney, W.: Data Structures for Statistical Computing in Python, in: Proceedings of the 9th Python in Science Conference, Austin, Texas, 28 June–3 July 2010, 56–61, https://doi.org/10.25080/majora-92bf1922-00a, 2010.
McKnight, D. M., Boyer, E. W., Westerhoff, P. K., Doran, P. T., Kulbe, T., and Andersen, D. T.: Spectrofluorometric characterization of dissolved organic matter for indication of precursor organic material and aromaticity, Limnol. Oceanogr., 46, 38–48, https://doi.org/10.4319/lo.2001.46.1.0038, 2001.
Meredith, M., Sommerkorn, M., Cassotta, S., Derksen, C., Ekaykin, A., Hollowed, A., Kofinas, G., Mackintosh, A., Melbourne-Thomas, J., Muelbert, M. M. C., Ottersen, G., Pritchard, H., and Schuur, E. A. G.: Chapter 3: Polar Regions, in: IPCC Special Report on the Ocean and Cryosphere in a Changing Climate, edited by: Pörtner, H.-O., Roberts, D. C., Masson-Delmotte, V., Zhai, P., Tignor, M., Poloczanska, E., Mintenbeck, K., Alegría, A., Nicolai, M., Okem, A., Petzold, J., Rama, B., and Weyer, N. M., Cambridge University Press, Cambridge, UK and New York, NY, USA, 203–320, https://doi.org/10.1017/9781009157964.005, 2019.
Murphy, K. R., Stedmon, C. A., Graeber, D., and Bro, R.: Fluorescence spectroscopy and multi-way techniques. PARAFAC, Anal. Methods-UK, 5, 6557–6566, https://doi.org/10.1039/C3AY41160E, 2013.
Natali, S. M., Schuur, E. A. G., Webb, E. E., Pries, C. E. H., and Crummer, K. G.: Permafrost degradation stimulates carbon loss from experimentally warmed tundra, Ecology, 95, 602–608, https://doi.org/10.1890/13-0602.1, 2014.
Neff, J. C., Finlay, J. C., Zimov, S. A., Davydov, S. P., Carrasco, J. J., Schuur, E. A. G., and Davydova, A. I.: Seasonal changes in the age and structure of dissolved organic carbon in Siberian rivers and streams, Geophys. Res. Lett., 33, L23401, https://doi.org/10.1029/2006GL028222, 2006.
O'Donnell, J. A., Aiken, G. R., Walvoord, M. A., Raymond, P. A., Butler, K. D., Dornblaser, M. M., and Heckman, K.: Using dissolved organicmatter age and composition to detect permafrost thaw in boreal watersheds of interior Alaska, J. Geophys. Res.-Biogeo., 119, 2155–2170, https://doi.org/10.1002/2014JG002695, 2014.
Ohno, T.: Fluorescence inner-filtering correction for determining the humification index of dissolved organic matter, Environ. Sci. Technol., 36, 742–746, https://doi.org/10.1021/es0155276, 2002.
Olefeldt, D., Goswami, S., Grosse, G., Hayes, D., Hugelius, G., Kuhry, P., Mcguire, A. D., Romanovsky, V. E., Sannel, A. B. K., Schuur, E. A. G., and Turetsky, M. R.: Circumpolar distribution and carbon storage of thermokarst landscapes, Nat. Commun., 7, 13043, https://doi.org/10.1038/ncomms13043, 2016.
Parlanti, E., Wörz, K., Geoffroy, L., and Lamotte, M.: Dissolved organic matter fluorescence spectroscopy as a tool to estimate biological activity in a coastal zone submitted to anthropogenic inputs, Org. Geochem., 31, 1765–1781, https://doi.org/10.1016/S0146-6380(00)00124-8, 2000.
Parmentier, F. J. W., Christensen, T. R., Sørensen, L. L., Rysgaard, S., Mcguire, A. D., Miller, P. A., and Walker, D. A.: The impact of lower sea-ice extent on Arctic greenhouse-gas exchange, Nat. Clim. Change, 3, 195–202, https://doi.org/10.1038/nclimate1784, 2013.
Parmentier, F. J. W., Christensen, T. R., Rysgaard, S., Bendtsen, J., Glud, R. N., Else, B., van Huissteden, J., Sachs, T., Vonk, J. E., and Sejr, M. K.: A synthesis of the arctic terrestrial and marine carbon cycles under pressure from a dwindling cryosphere, Ambio, 46, 53–69, https://doi.org/10.1007/s13280-016-0872-8, 2017.
Plaza, C., Pegoraro, E., Bracho, R., Celis, G., Crummer, K. G., Hutchings, J. A., Hicks Pries, C. E., Mauritz, M., Natali, S. M., Salmon, V. G., Schädel, C., Webb, E. E., and Schuur, E. A. G.: Direct observation of permafrost degradation and rapid soil carbon loss in tundra, Nat. Geosci., 12, 627–631, https://doi.org/10.1038/s41561-019-0387-6, 2019.
Porter, C., Morin, P., Howat, I., Noh, M.-J., Bates, B., Peterman, K., Keesey, S., Schlenk, M., Gardiner, J., Tomko, K., Willis, M., Kelleher, C., Cloutier, M., Husby, E., Foga, S., Nakamura, H., Platson, M., Wethington, M., Jr., Williamson, C., Bauer, G., Enos, J., Arnold, G., Kramer, W., Becker, P., Doshi, A., D’Souza, C., Cummens, P., Laurier, F., and Bojesen, M.: ArcticDEM, Harvard Dataverse [data set], https://doi.org/10.7910/DVN/OHHUKH, 2018.
Prowse, T. D. and Flegg, P. O.: Arctic River Flow: A Review of Contributing Areas, in: The Freshwater Budget of the Arctic Ocean, Springer, Dordrecht, 269–280, https://doi.org/10.1007/978-94-011-4132-1_12, 2000.
Rampton, V. N.: Quaternary Geology of the Yukon Coastal Plain, Geol. Surv. Can. Bull., 317, 49 pp., https://doi.org/10.4095/111347, 1982.
Ruhala, S. S. and Zarnetske, J. P.: Using in-situ optical sensors to study dissolved organic carbon dynamics of streams and watersheds: A review, Sci. Total Environ., 575, 713–723, 2017.
Schoeneberger, P. J., Wysocki, D. A., Benham, E. C., and Soil Survey Staff: Field Book for Describing and Sampling Soils, Version 3.0, Natural Resources Conservation Service, National Soil Survey Center, Lincoln, NE, ISBN: 9780160915420, 2012.
Schuur, E. A. G., Vogel, J. G., Crummer, K. G., Lee, H., Sickman, J. O., and Osterkamp, T. E.: The effect of permafrost thaw on old carbon release and net carbon exchange from tundra, Nature, 459, 556–559, https://doi.org/10.1038/nature08031, 2009.
Schuur, E. A. G., McGuire, A. D., Schädel, C., Grosse, G., Harden, J. W., Hayes, D. J., Hugelius, G., Koven, C. D., Kuhry, P., Lawrence, D. M., Natali, S. M., Olefeldt, D., Romanovsky, V. E., Schaefer, K., Turetsky, M. R., Treat, C. C., and Vonk, J. E.: Climate change and the permafrost carbon feedback, Nature, 520, 171–179, https://doi.org/10.1038/nature14338, 2015.
Schwab, M. S., Hilton, R. G., Raymond, P. A., Haghipour, N., Amos, E., Tank, S. E., Holmes, R. M., Tipper, E. T., and Eglinton, T. I.: An Abrupt Aging of Dissolved Organic Carbon in Large Arctic Rivers, Geophys. Res. Lett., 47, e2020GL088823, https://doi.org/10.1029/2020GL088823, 2020.
Screen, J. A., Deser, C., and Simmonds, I.: Local and remote controls on observed Arctic warming, Geophys. Res. Lett., 39, L10709, https://doi.org/10.1029/2012GL051598, 2012.
Seabold, S. and Perktold, J.: Statsmodels: Econometric and Statistical Modeling with Python, in: Proceedings of the 9th Python in Science Conference, 92–96, https://doi.org/10.25080/majora-92bf1922-011, 2010.
Selvam, B. P., Lapierre, J. F., Guillemette, F., Voigt, C., Lamprecht, R. E., Biasi, C., Christensen, T. R., Martikainen, P. J., and Berggren, M.: Degradation potentials of dissolved organic carbon (DOC) from thawed permafrost peat, Sci. Rep.-UK, 7, 45811, https://doi.org/10.1038/srep45811, 2017.
Shirokova, L. S., Chupakov, A. V., Zabelina, S. A., Neverova, N. V., Payandi-Rolland, D., Causserand, C., Karlsson, J., and Pokrovsky, O. S.: Humic surface waters of frozen peat bogs (permafrost zone) are highly resistant to bio- and photodegradation, Biogeosciences, 16, 2511–2526, https://doi.org/10.5194/bg-16-2511-2019, 2019.
Siewert, M. B., Lantuit, H., Richter, A., and Hugelius, G.: Permafrost Causes Unique Fine-Scale Spatial Variability Across Tundra Soils, Global Biogeochem. Cy., 35, e2020GB006659, https://doi.org/10.1029/2020GB006659, 2021.
Spencer, R. G. M., Aiken, G. R., Wickland, K. P., Striegl, R. G., and Hernes, P. J.: Seasonal and spatial variability in dissolved organic matter quantity and composition from the Yukon River basin, Alaska, Global Biogeochem. Cy., 22, GB4002, https://doi.org/10.1029/2008GB003231, 2008.
Spencer, R. G. M., Aiken, G. R., Butler, K. D., Dornblaser, M. M., Striegl, R. G., and Hernes, P. J.: Utilizing chromophoric dissolved organic matter measurements to derive export and reactivity of dissolved organic carbon exported to the Arctic Ocean: A case study of the Yukon River, Alaska, Geophys. Res. Lett., 36, L06401, https://doi.org/10.1029/2008GL036831, 2009.
Spencer, R. G. M., Mann, P. J., Dittmar, T., Eglinton, T. I., McIntyre, C., Holmes, R. M., Zimov, N., and Stubbins, A.: Detecting the signature of permafrost thaw in Arctic rivers, Geophys. Res. Lett., 42, 2015GL063498, https://doi.org/10.1002/2015GL063498, 2015.
Stedmon, C. A. and Nelson, N. B.: The Optical Properties of DOM in the Ocean, in: Biogeochemistry of Marine Dissolved Organic Matter, 2nd edn., Academic Press, https://doi.org/10.1016/B978-0-12-405940-5.00010-8, 2015.
Tank, S. E., Lesack, L. F. W., Gareis, J. A. L., Osburn, C. L., and Hesslein, R. H.: Multiple tracers demonstrate distinct sources of dissolved organic matter to lakes of the Mackenzie Delta, Western Canadian Arctic, Limnol. Oceanogr., 56, 1297–1309, https://doi.org/10.4319/lo.2011.56.4.1297, 2011.
Teufel, B. and Sushama, L.: Abrupt changes across the Arctic permafrost region endanger northern development, Nat. Clim. Change, 9, 858–862, 2019.
Throckmorton, H. M., Newman, B. D., Heikoop, J. M., Perkins, G. B., Feng, X., Graham, D. E., O'Malley, D., Vesselinov, V. V., Young, J., Wullschleger, S. D., and Wilson, C. J.: Active layer hydrology in an arctic tundra ecosystem: quantifying water sources and cycling using water stable isotopes, Hydrol. Process., 30, 4972–4986, https://doi.org/10.1002/hyp.10883, 2016.
van Rossum, G. and Drake Jr, F. L.: Python 3 Reference Manual, Scotts Valley, CA, CreateSpace, ISBN: 1441412697, 2009.
Virtanen, P., Gommers, R., Oliphant, T. E., et al.: SciPy 1.0: fundamental algorithms for scientific computing in Python, Nat. Methods, 17, 261–272, https://doi.org/10.1038/s41592-019-0686-2, 2020.
Vonk, J. E., Sanchez-Garca, L., Van Dongen, B. E., Alling, V., Kosmach, D., Charkin, A., Semiletov, I. P., Dudarev, O. V., Shakhova, N., Roos, P., Eglinton, T. I., Andersson, A., and Gustafsson, A.: Activation of old carbon by erosion of coastal and subsea permafrost in Arctic Siberia, Nature, 489, 137–140, https://doi.org/10.1038/nature11392, 2012.
Vonk, J. E., Mann, P. J., Dowdy, K. L., Davydova, A., Davydov, S. P., Zimov, N., Spencer, R. G. M., Bulygina, E. B., Eglinton, T. I., and Holmes, R. M.: Dissolved organic carbon loss from Yedoma permafrost amplified by ice wedge thaw, Environ. Res. Lett., 8, 35023, https://doi.org/10.1088/1748-9326/8/3/035023, 2013.
Vonk, J. E., Tank, S. E., Mann, P. J., Spencer, R. G. M., Treat, C. C., Striegl, R. G., Abbott, B. W., and Wickland, K. P.: Biodegradability of dissolved organic carbon in permafrost soils and aquatic systems: a meta-analysis, Biogeosciences, 12, 6915–6930, https://doi.org/10.5194/bg-12-6915-2015, 2015a.
Vonk, J. E., Tank, S. E., Bowden, W. B., Laurion, I., Vincent, W. F., Alekseychik, P., Amyot, M., Billet, M. F., Canário, J., Cory, R. M., Deshpande, B. N., Helbig, M., Jammet, M., Karlsson, J., Larouche, J., MacMillan, G., Rautio, M., Walter Anthony, K. M., and Wickland, K. P.: Reviews and syntheses: Effects of permafrost thaw on Arctic aquatic ecosystems, Biogeosciences, 12, 7129–7167, https://doi.org/10.5194/bg-12-7129-2015, 2015b.
Vonk, J. E., Tank, S. E., and Walvoord, M. A.: Integrating hydrology and biogeochemistry across frozen landscapes, Nat. Commun., 10, 5377, https://doi.org/10.1038/s41467-019-13361-5, 2019.
Wales, N. A., Gomez-Velez, J. D., Newman, B. D., Wilson, C. J., Dafflon, B., Kneafsey, T. J., Soom, F., and Wullschleger, S. D.: Understanding the relative importance of vertical and horizontal flow in ice-wedge polygons, Hydrol. Earth Syst. Sci., 24, 1109–1129, https://doi.org/10.5194/hess-24-1109-2020, 2020.
Walker, D. A., Daniëls, F. J. A., Matveyeva, N. V., Šibík, J., Walker, M. D., Breen, A. L., Druckenmiller, L. A., Raynolds, M. K., Bültmann, H., Hennekens, S., Buchhorn, M., Epstein, H. E., Ermokhina, K., Fosaa, A. M., Heidmarsson, S., Heim, B., Jónsdóttir, I. S., Koroleva, N., Lévesque, E., MacKenzie, W. H., Henry, G. H. R., Nilsen, L., Peet, R., Razzhivin, V., Talbot, S. S., Telyatnikov, M., Thannheiser, D., Webber, P. J., and Wirth, L. M.: Circumpolar Arctic Vegetation Classification, Phytocoenologia, 48, 181–201 https://doi.org/10.1127/phyto/2017/0192, 2018.
Walvoord, M. A. and Kurylyk, B. L.: Hydrologic Impacts of Thawing Permafrost-A Review, Vadose Zone J., 15, 1–20, https://doi.org/10.2136/vzj2016.01.0010, 2016.
Weishaar, J. L., Aiken, G. R., Bergamaschi, B. A., Fram, M. S., Fujii, R., and Mopper, K.: Evaluation of specific ultraviolet absorbance as an indicator of the chemical composition and reactivity of dissolved organic carbon, Environ. Sci. Technol., 37, 4702–4708, https://doi.org/10.1021/es030360x, 2003.
Whitworth, K. L., Baldwin, D. S., and Kerr, J. L.: The effect of temperature on leaching and subsequent decomposition of dissolved carbon from inundated floodplain litter: Implications for the generation of hypoxic blackwater in lowland floodplain rivers, Chem. Ecol., 30, 491–500, https://doi.org/10.1080/02757540.2014.885019, 2014.
Wild, B., Andersson, A., Bröder, L., Vonk, J., Hugelius, G., McClelland, J. W., Song, W., Raymond, P. A., and Gustafsson, Ö.: Rivers across the Siberian Arctic unearth the patterns of carbon release from thawing permafrost, P. Natl. Acad. Sci. USA, 116, 10280–10285, https://doi.org/10.1073/pnas.1811797116, 2019.
Wilson, H. F. and Xenopoulos, M. A.: Effects of agricultural land use on the composition of fluvial dissolved organic matter, Nat. Geosci., 2, 37–41, https://doi.org/10.1038/ngeo391, 2009.
Winterfeld, M., Laepple, T., and Mollenhauer, G.: Characterization of particulate organic matter in the Lena River delta and adjacent nearshore zone, NE Siberia – Part I: Radiocarbon inventories, Biogeosciences, 12, 3769–3788, https://doi.org/10.5194/bg-12-3769-2015, 2015.
Wooller, M. J., Zazula, G. D., Edwards, M., Froese, D. G., Boone, R. D., Parker, C., and Bennett, B.: Stable carbon isotope compositions of Eastern Beringian grasses and sedges: Investigating their potential as paleoenvironmental indicators, Arct. Antarct. Alp. Res., 39, 318–331, https://doi.org/10.1657/1523-0430(2007)39[318:SCICOE]2.0.CO;2, 2007.
Zhang, T., Barry, R. G., Knowles, K., Heginbottom, J. A., and Brown, J.: Statistics and characteristics of permafrost and ground-ice distribution in the Northern Hemisphere, Polar Geogr., 23, 132–154, https://doi.org/10.1080/10889379909377670, 1999.
Zhang, T., Barry, R. G., Knowles, K., Heginbottom, J. A., and Brown, J.: Statistics and characteristics of permafrost and ground-ice distribution in the Northern Hemisphere, Polar Geogr., 23, 132–154, https://doi.org/10.1080/10889379909377670, 2008.
Zimov, S. A., Schuur, E. A. G., and Chapin, F. S.: Permafrost and the Global Carbon Budget, Science, 312, 1612–1613, https://doi.org/10.1126/science.1128908, 2006.