the Creative Commons Attribution 4.0 License.
the Creative Commons Attribution 4.0 License.
 | 19 Jan 2022
Net soil carbon balance in afforested peatlands and separating autotrophic and heterotrophic soil CO2 effluxes
Renée Hermans
Rebecca McKenzie
Roxane Andersen
Yit Arn Teh
Neil Cowie
Jens-Arne Subke
Peatlands are a significant global carbon (C) store, which can be compromised by drainage and afforestation. Quantifying the rate of C loss from peat soils under forestry is challenging, as soil CO2 efflux includes both CO2 produced from heterotrophic peat decomposition and CO2 produced by tree roots and associated fungal networks (autotrophic respiration). We experimentally terminated autotrophic below-ground respiration in replicated forest plots by cutting through all living tree roots (trenching) and measured soil surface CO2 flux, litter input, litter decay rate, and soil temperature and moisture over 2 years. Decomposition of cut roots was measured and CO2 fluxes were corrected for this, which resulted in a large change in the fraction heterotrophic : autotrophic flux, suggesting that even 2 years after trenching decaying root biomass makes significant contributions to the CO2 flux. Annual peat decomposition (heterotrophic CO2 flux) was 115 ± 16 g C m−2 yr−1, representing ca. 40 % of total soil respiration. Decomposition of needle litter is accelerated in the presence of an active rhizosphere, indicating a priming effect by labile C inputs from roots. This suggests that our estimates of peat mineralization in our trenched plots are conservative and underestimate overall rates of peat C loss. Considering also input of litter from trees, our results indicate that the soils in these 30-year-old drained and afforested peatlands are a net sink for C, since substantially more C enters the soil organic matter than is decomposed heterotrophically. This study does not account for fluvial C fluxes, which represent a small flux compared to the CO2 soil efflux; further, root litter and exudate deposition could be a significant C source that is only partially sampled by our approach, adding to these plantations being a potential carbon sink. However, the C balance for these soils should be taken over the lifespan of the trees, in order to determine if the soils under these drained and afforested peatlands are a sustained sink of C or become a net source over longer periods of forestry.
- Article
(3414 KB) - Full-text XML
- BibTeX
- EndNote


Large peatland areas in the boreal and temperate zone have been drained and afforested in western Europe, especially in the UK, Ireland and the Fennoscandia region, with conifers replacing native peatland vegetation (Andersen et al., 2016). In the UK alone, > 800 000 ha (approximately 20 %) was affected by this land-use change (Anderson et al., 2016). As well as causing habitat loss, drainage and afforestation of peatlands influence peatland hydrology, biogeochemistry and carbon (C) storage. In Fennoscandia, drainage to improve tree growth on naturally treed peatlands has been shown to cause significant changes in decomposition and greenhouse gas (GHG) fluxes (Ojanen et al., 2013). However, the effects of drainage and afforestation on temperate peatlands that were previously dominated by less-statured vegetation (e.g. blanket bogs, moorland, heathland) are more uncertain (Sloan et al., 2018). While changes in hydrology and soil redox potential are anticipated to accelerate soil C loss and alter the composition of GHG emissions, there are very few quantitative data on how this shift in land use changes soil C dynamics and GHG emissions in temperate peatlands (Hermans et al., 2018). Since Northern Hemisphere peatlands are estimated to store a third of global terrestrial carbon (Gorham, 2010), changes linked to drainage and afforestation of temperate peatlands could have significant impacts on regional C dynamics and GHG balances.
There is a broad consensus that peatland drainage accelerates the loss of endogenous peat C stocks, but the impacts of drainage and afforestation on total soil C stocks and soil respiration are less certain (Hargreaves et al., 2003; Mayer et al., 2020; Simola et al., 2012; Vanguelova et al., 2019; Zerva and Mencuccini, 2005). Afforestation of previously open peatlands in the British Isles (e.g. Mazzola et al., 2021) and Fennoscandia (e.g. Tolvanen et al., 2020) differs from other types of drained peatlands because this land-use change involves a wholesale shift in the functional composition of the plant community (i.e. replacement of short-statured vegetation with trees), leading to potential interactions or synergistic effects arising from changes to both soil hydrology and plant community composition.
The comparatively high rates of net primary production and larger stature of the trees on drained and afforested peatlands can represent a significant net ecosystem C sink and consequently represent a large source of detrital material to soil (Yamulki et al., 2013). Thus, it is possible that this input of C from more highly productive trees could partially or wholly offset or outstrip some of the losses of C derived from mineralization of the peat. Moreover, changes to soil organic matter (SOM) chemistry due to a shift towards inputs of more recalcitrant and nutrient-poor coniferous litter could further enhance soil C storage in afforested peatlands in the British Isles and Fennoscandia. This is because the trees planted in these regions (e.g. Sitka spruce) produce tissues that are less readily decomposed than the organic matter (OM) generated by the short-statured vegetation that they have replaced (i.e. larger proportion of woody debris generated with higher C : N ratios and greater proportion of recalcitrant compounds like lignin) (Hermans et al., 2018). This may affect soil C stocks by inhibiting or slowing overall rates of decay due to the tree litter's recalcitrance (Liski et al., 2002) but has not been studied in tree plantations on deep peat so far.
In order to close these knowledge gaps, we need to determine the C balance of drained and afforested peatland soils, tracking C inputs from tissue turnover (e.g. litterfall and rhizodeposition), and C losses from SOM decay. However, separating the direct and indirect effects of trees on peat mineralization is methodologically challenging (Subke et al., 2006). Soil CO2 efflux includes both CO2 released from peat mineralization (heterotrophic CO2 flux) and CO2 produced from root—rhizosphere (i.e. autotrophic) respiration; experimental manipulation of autotrophic C supply to the rhizosphere allows a separation of these two main component fluxes but introduces a number of potential artefacts (see Subke et al., 2006, for a methods overview including method-related assumptions and artefacts). Root trenching, where roots are severed throughout the depth of the rooting zone to create areas of forest floor with no recent C input from trees to roots or associated mycorrhizas, has been used across many forest sites and provides useful insights into relative contributions of autotrophic and heterotrophic soil CO2 efflux and the respective temporal dynamics. This disruption of root exudation and continuous root turnover could influence peat decay through processes such as microbial priming effects (Kuzyakov, 2006; Subke et al., 2006), where microbial activity (linked with an active rhizosphere) in the soil is stimulated by the addition of easily accessible C from roots (Kuzyakov, 2006). Further experiments are required to evaluate the effects of these other plant-facilitated processes on peat decay to better constrain estimates of heterotrophic activity in soil.
In this study, we experimentally determined the C budget of a drained and afforested peat soil. Carbon inputs were tracked by quantifying litterfall, while C outputs were determined using a trenching technique to partition root–rhizosphere and heterotrophic respiration. In addition, we conducted a root decomposition study in rhizosphere and living root-free (i.e. trenched) soil to constrain artefacts associated with the trenching and in order to determine if rhizosphere-linked processes (e.g. priming effects) facilitated OM decay. We hypothesized that (1) the soils under these forestry plantations are a net C source, (2) soil CO2 efflux is dominated by autotrophic respiration, and (3) interactions between C supply to the rhizosphere by trees and surface litter decomposition result in higher decomposition rates of the litter due to rhizosphere priming effects.
2.1 Study site
The research took place in RSPB's Forsinard Flows National Nature Reserve in the north of Scotland (58∘22′ N, 3∘53′ W). Four paired plots were established in the beginning of June 2014 in three separate forestry plantation blocks of identical age containing a mixture, 3 : 5 (on average), of Sitka spruce (Picea sitchensis) and lodgepole pine (Pinus contorta). The plantations were drained, around 30 years old and very dense (about 5000 trees per hectare), with no vascular plant understorey but sporadic patches of moss, predominantly feather moss, e.g. Hypnum jutlandicum, Hylocomium splendens and, in some instances, Sphagnum fallax and S. capillifolium in furrows. The average diameter at breast height (DBH) for Sitka spruce was 13.3 cm and for lodgepole pine 17.9 cm. The average canopy cover was 76.3 % (Smith and Hancock, 2016). Peat depths in these three forestry blocks varied between 30 and 260 cm, with depths at research plots between 137 and 204 cm (Smith et al., 2014). The average annual precipitation in the research area between 1981–2010 was 970.5 mm, with an average maximum air temperature of 11.4 ∘C and average minimum air temperature of 3.3 ∘C measured at the Kinbrace weather station approximately 20 km from the plots (location: 58∘13′89′′ N, 3∘55′1.2′′ W; altitude: 103 m above mean sea level; Met Office, 2018). Seasonal averaged water table relative to ground surface is −350 (±20) mm in spring (March–May), −457 (±34) mm in summer (June–August), −404 (±49) mm in autumn (September–November) and −244 (±14) mm in winter (December–February).
2.2 Experimental set-up
Candidate locations for the four paired trenched and control areas in each plot were initially identified at random and soil surface respiration measured. Based on respiration results, two closely matched plots were selected and randomly allocated a treatment (trenching or control). Paired plots were no more than 10 m apart from each other.
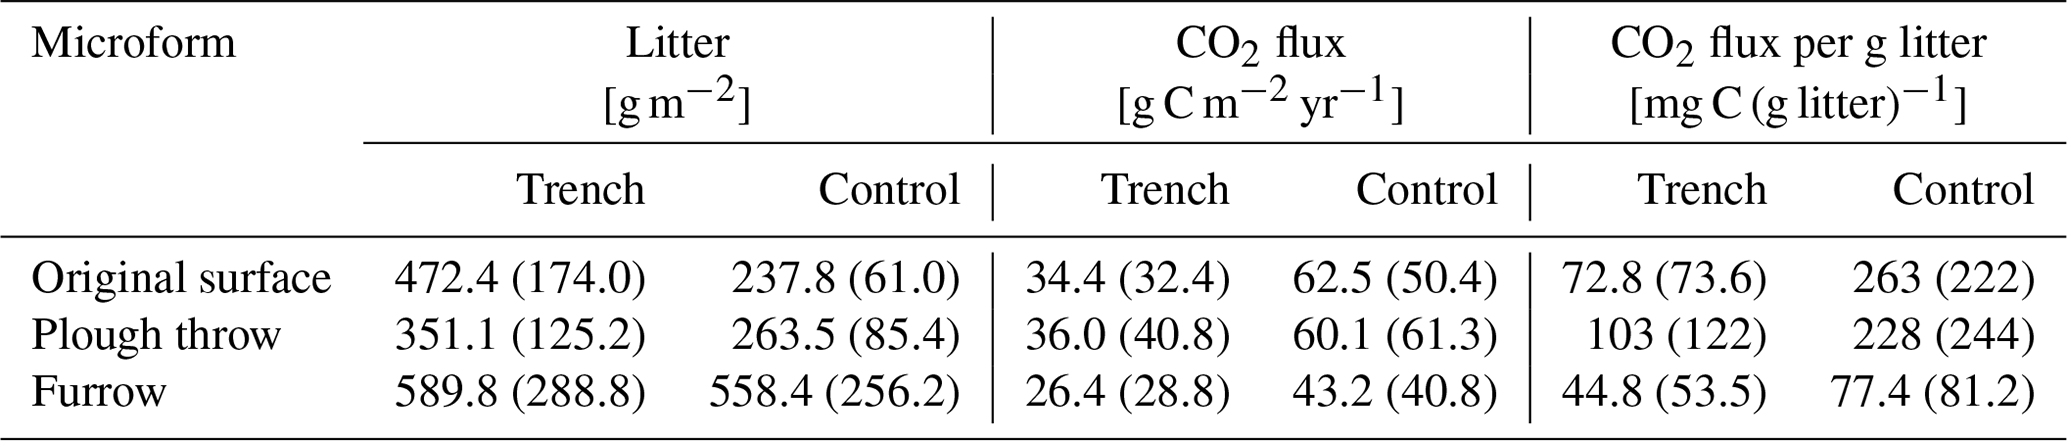
The double-mouldboard ploughing of the peat at the time of afforestation created a regular microtopography with low-lying furrows (ca. 1.5 m wide) flanked by high ridges (plough throws; ca. 0.75 m wide) on either side. In between two plough throws, there is an area of ca. 0.50 m width of the original (unploughed) surface (Fig. 1). The height from the bottom of the furrow to the top of the plough throw is on average 0.5 m, and from the original surface to the plough throw it is about 0.15–0.2 m. In general, conifer seedlings were planted on the plough throws because of the improved drainage compared to the original surface. For our study, each plot encompassed the three types of microtopography.
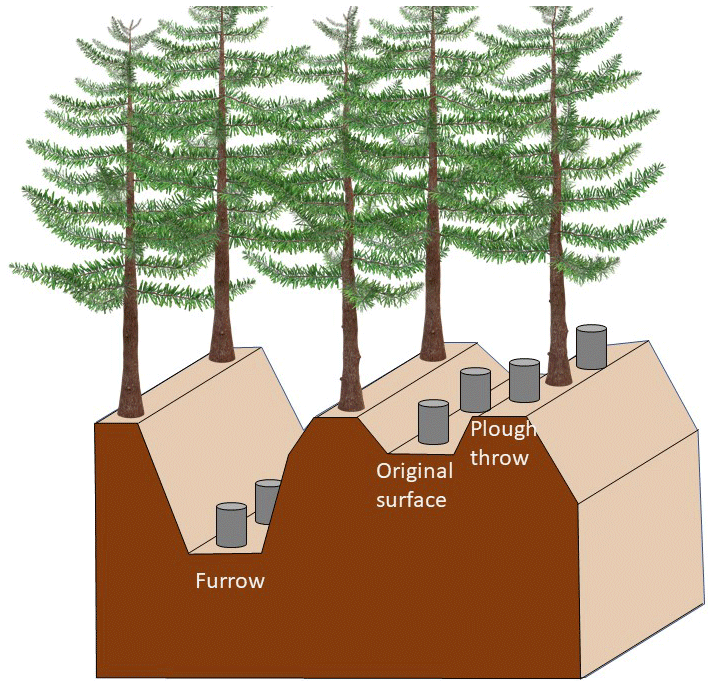
Figure 1Microtopography in forest plantations, with location of measurements for flux chambers (not to scale).
2.3 Trenching
A 40 cm deep and 30 cm wide trench was cut to just below the main rooting depth of the trees, cutting through all roots present. The trench was double lined using polypropylene gardening cloth and refilled with peat soil in between the two layers of cloth to prevent ingrowth of roots (Fig. 2). The dimensions of each trench plot were about 3.5×1.5 m and included all three microtopographic forms. These dimensions maximized the space between trees but did not represent ground within 60 cm of trees.
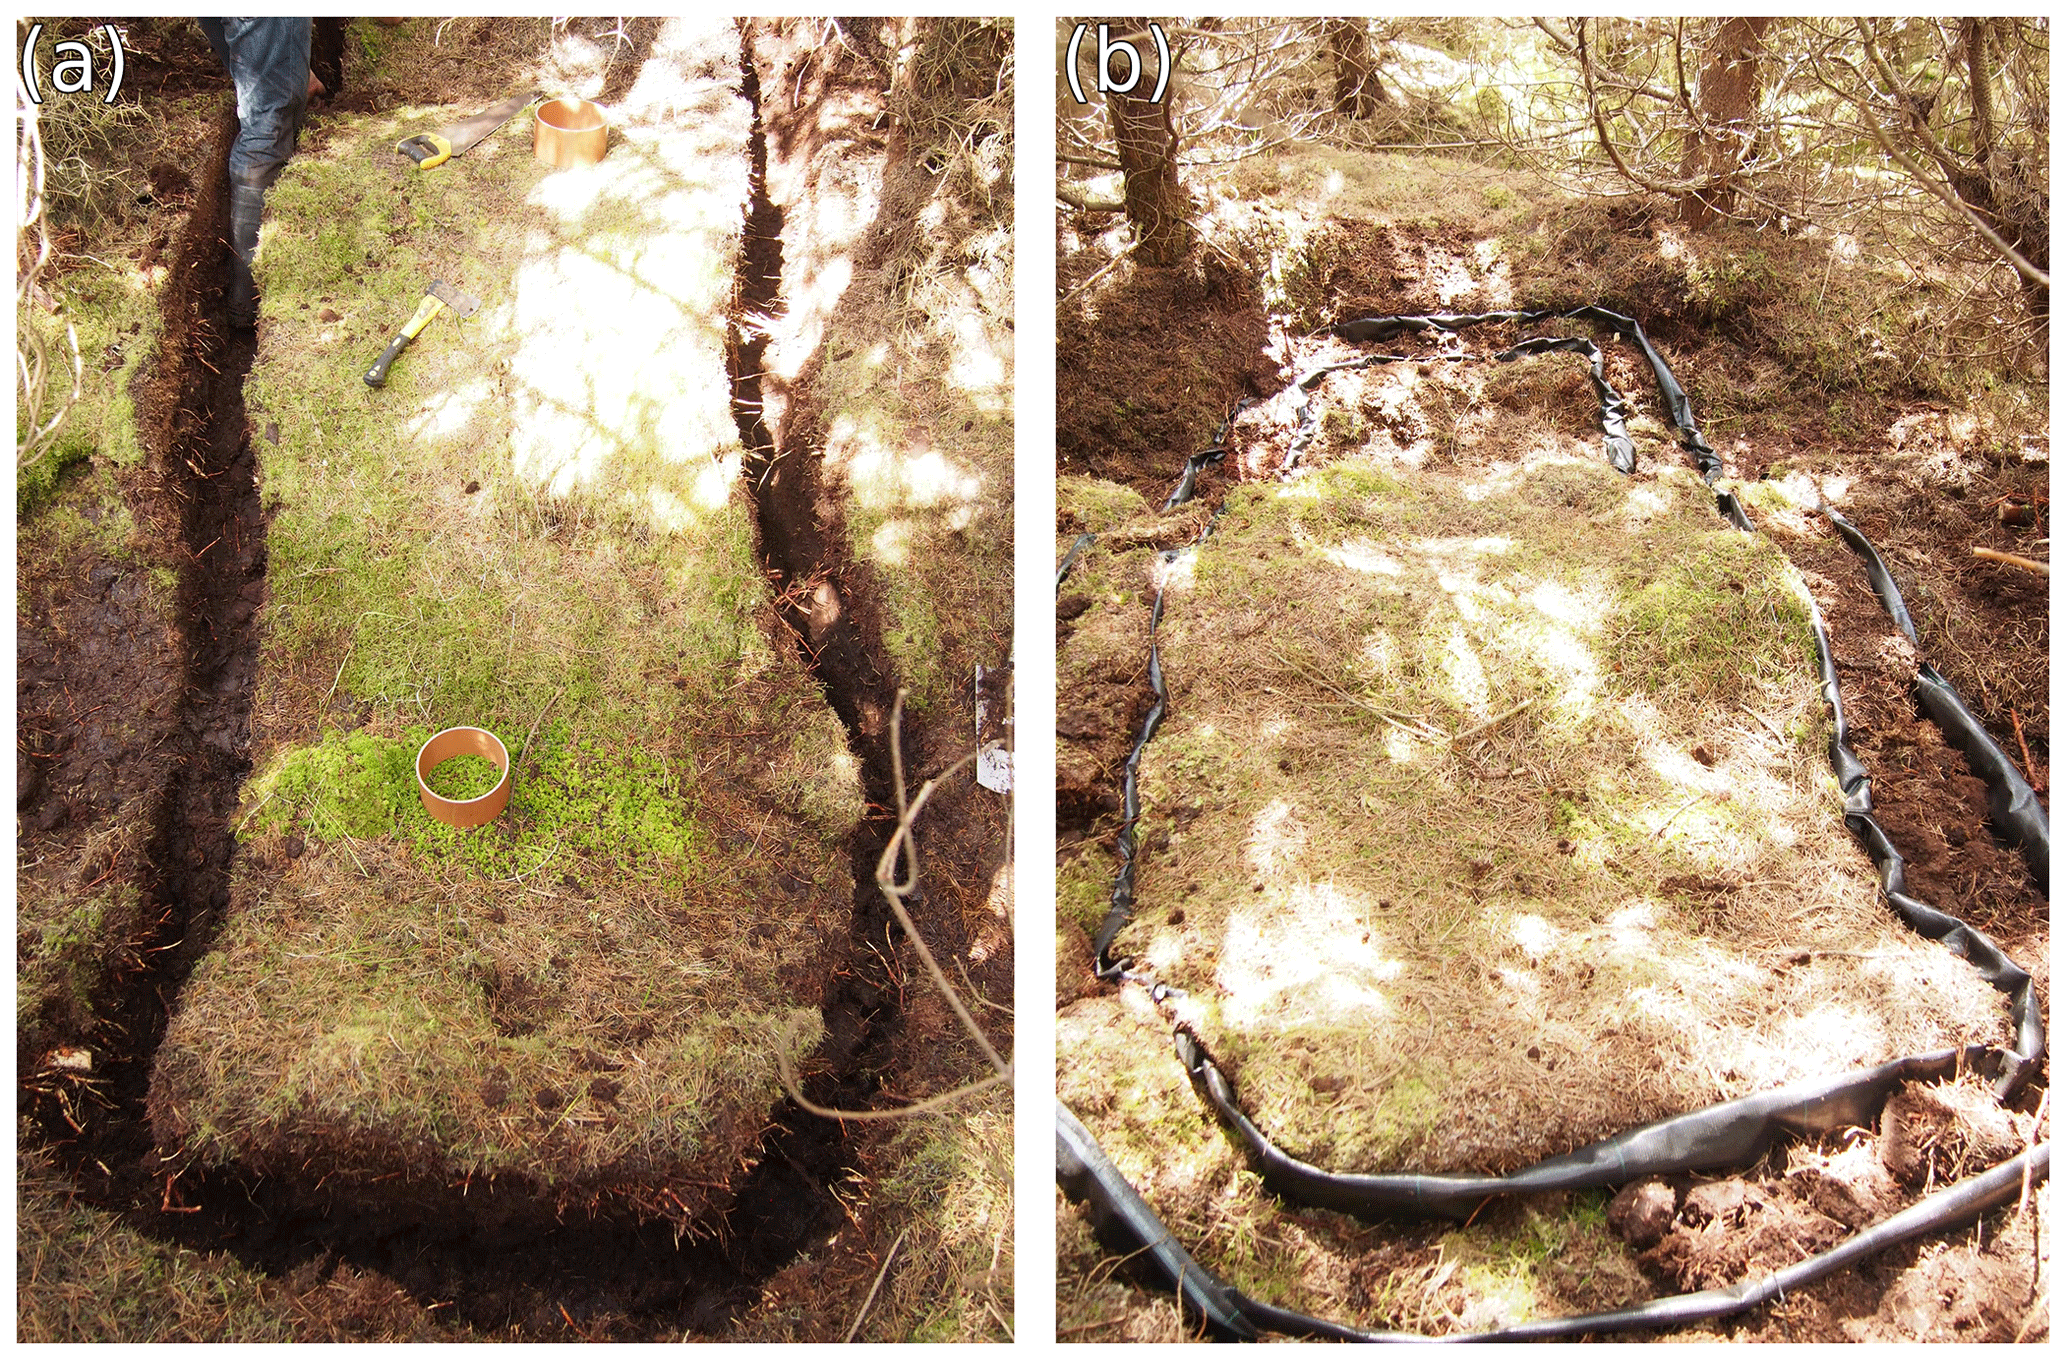
Figure 2(a) Trenching plot dug and all living tree roots are sawn trough. (b) Finished trench plot; trenches double lined with polypropylene gardening cloth and filled in with peat.
2.4 CO2 measurements
Three pairs of PVC collars of 10 cm height with a diameter of 20 cm were installed to a depth of 3 cm within the three microforms (Fig. 1) of both trenched and control plots. CO2 measurements were taken using custom-built dark dynamic closed chamber with a height of 5 cm and a diameter of 20 cm, which were placed on the permanent collars for 3 min. Elasticated rubber material placed over the joint of chambers and collars for the duration of the measurement provided an airtight seal. The chamber was connected to an EGM 4 infrared gas analyser (PP-Systems, Amesbury, MA, USA), recording CO2 concentrations every 4–5 s. Fluxes were calculated from increases in CO2 concentration within the chamber over 3 min. Measurements were carried out 10 times between August 2014 and July 2016.
2.5 Litter
Six litter traps (0.07 m2 each) were located close to each plot, and litter (falling needles and twigs) was collected at each sampling visit. The dry weight of all litter was recorded as area-based averages for each plot separately.
Litter was allowed to fall onto the soil surface within collars for the duration of the experiment. To be able to distinguish peat respiration from litter respiration, surface litter was removed manually from one (always the same) of the two paired collars in each microform before measuring respiration. The litter present in the collar with litter was weighed after a respiration measurement and then placed back in the collar. Litter adjacent to the collar was also collected and weighed in the field, then taken back to the lab, and dried and weighed again to establish the wet-to-dry-mass ratio of litter and calculate litter dry mass within each collar.
2.6 Roots
Root biomass was determined from soil cores (0–20 cm deep and 6.5 cm diameter) taken from each microform in all plots, at the start (June 2014) and end (July 2016) of the experiment. Both dead and living roots from each core were carefully separated and sorted into three root diameter classes: smaller than 2, 2 to 5 and greater than 5 mm. All roots and the root-free soil were dried at 50 ∘C for 7 d and weighed to establish percentage of roots per gram of soil. Root depth was found to be 25 cm when digging trenches, and root density for 0–20 cm was assumed to be representative for 0–25 cm.
To estimate root decomposition directly, roots were taken from soil collected in each plot, dried (50 ∘C for 7 d) and separated into the same size classes as described previously. Between 0.36 and 0.69 g of dried root material (separately for each size class) was placed in polyester mesh bags (10×10 cm; mesh size of 0.5 mm) for field incubations. Bags were soaked in water for 2 d prior to field placement to mimic field conditions. Four replicate bags of each size class were buried at 5–10 cm depth in all three microforms in all plots 4 weeks after trenching. To account for any weight loss that may have occurred prior to field incubation, five bags of each size class were taken into the field and not buried but taken back to the lab; the proportional mass loss of litter in these bags was used to correct the initial root mass of all other bags.
One bag per root class per microform was collected from all sites in November 2014, March 2015, July 2015 (except root class >5 mm, since there was not enough material for four bags) and July 2016. After retrieval, bags were dried for 7 d at 50 ∘C, and root dry mass was recorded.
Root decay was fitted to an exponential decay function:
with Mt the remaining amount of root biomass after collection from the field, M0 the initial root biomass, and t time and k the decay constant. Data fits were performed separately for root size and microform.
2.7 Soil moisture and temperature
Between June 2014 and July 2016, soil moisture and soil temperature at 5 and 20 cm soil depth were recorded at 30 min intervals in all three microforms in a nearby plot, using 12-bit smart temperature sensors, S-TMB-M002 (Onset Computer Corporation, Bourne, MA, USA), and 10HS soil moisture smart sensors, S-SMD-M005 (Decagon Devices, Inc., Pullman, WA, USA), combined with Onset's smart sensor technology, measuring m3 m−3 (volumetric water content) connected to a Hobo micro-station (Onset Computer Corporation, Bourne, MA, USA).
In addition to this, soil temperature (10 cm thermistor) and moisture (HH2 moisture meter, Delta-T Devices, Cambridge, measuring m3 m−3 (volumetric water content)) were measured at 5 cm depth next to each collar during sampling. Air temperature was also measured 1 m above the ground during sampling.
2.8 Statistical analyses and flux calculations
Data were analysed using R (R Core Team, 2016) in RStudio version 1.0.136. All CO2 data were log transformed to meet the criteria of normality, and a linear mixed-effect model (LMM) using the lme4 package in R (Bates et al., 2015) was used to predict CO2 fluxes based on environmental drivers. All numerical predictors were standardized to 1 standard deviation prior to statistical analyses to allow relative effect sizes of predictors to be compared directly (Nakagawa and Schielzeth, 2010). Model selection was done based on information theory (Burnham and Anderson, 2002). First a model of maximum complexity was built, with interactions between soil moisture, soil temperature, trench treatment, and microform plus interactions between trench treatment, microform and litter treatment, with plot as a random effect (lmer(CO2 flux ∼ (soil moisture ⋅ soil temperature ⋅ treatment ⋅ microform + treatment ⋅ microform ⋅ litter treatment) + (1|plot))). Then, all possible combinations of this model were identified using the “dredge” function in the MuMIn package (Barton, 2017). Goodness of model fit was assessed with the small-sample-size-corrected Akaike information criterion (AICc), which is calculated using the number of parameters and either the maximum likelihood estimate for the model or the residual sum of squares. “Likelihood” here is a measure of the extent to which a sample provides support for particular values of a parameter in a parametric model. AICc values of different models can be compared, and the model with the lowest AICc is selected as the best approximating model, hereafter called “top model” (Burnham and Anderson, 2002). Any of the models with a delta AICc of less than 2 are considered to be as good as the best model (Richards, 2005). The dredge function also gives a weight to the models it produces, ranging between 0 and 1, with for example a weight of 0.7 meaning that there is a 70 % chance that that model is the best approximating model of the models considered. If the weight of the best model is low, it is not possible to say that that model really is the best model, meaning other models also have to be considered. In this study, the model with the best AICc and highest weight was used. Significance (p values) for the mixed-effect model was calculated using the package lmerTest (Kuznetsova et al., 2016).
Annual fluxes were calculated using the predict function over the mixed-effect model from library lme4 in R (Bates et al., 2015), and predictions and error terms were back transformed. The predictions were made over half-hourly measurements of soil moisture and soil temperature at 5 cm soil depth in all three microforms just outside the plots.
From these predictions, partitioned fluxes were calculated from the collars without litter as
where Fa is autotrophic CO2 flux, Fcontrol is the CO2 flux from the control plots, Ftrench is the CO2 flux from trenched plots, Fdead roots is the CO2 flux coming from the dead roots in the trenched plots created by the trenching technique and ε is the associated error terms (error terms were propagated).
The annual flux from litter was calculated from the difference in modelled annual fluxes between collars with and without litter.
3.1 Temporal trends in soil CO2 fluxes
Trenching initially led to an increase in soil respiration, followed by a significant reduction in soil CO2 flux. Soil respiration fluxes from both control and trenched plots showed a clear annual cycle, with the highest fluxes in summer. After the initial perturbation, fluxes from trenched plots are significantly lower than fluxes from control plots (p<0.001), and this difference is greater in the summer (Fig. 3).
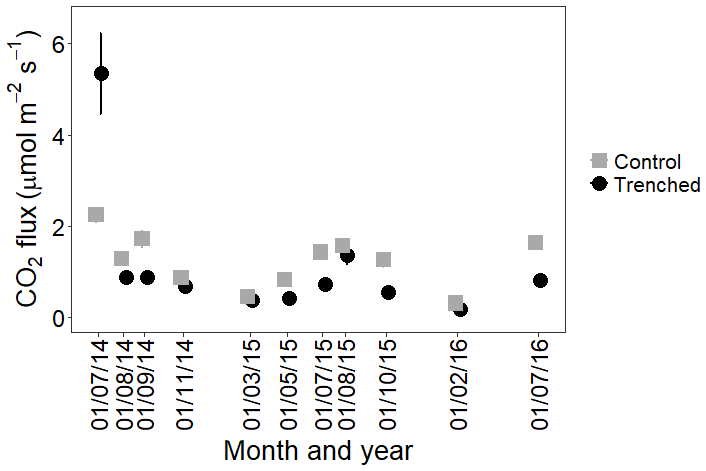
Figure 3Mean CO2 fluxes from control (grey squares) and trenched (black circles) plots over time, averaging across all microforms (n=12) and both litter treatments. Error bars are standard errors and are in most instances smaller than symbols.
Soil CO2 fluxes were best explained with a combination of soil moisture, soil temperature, trenching treatment, microform and litter treatment, with an interaction between soil moisture and soil temperature, including plot as a random effect. Table 1 shows model estimates for each variable, with their standard error and p value. The marginal R2 was 0.40 and conditional R2 was 0.41 on the log scale; since predictions are made in the original units, all uncertainties reinflate. The set of models with a ΔAICc of less than 2 is shown in Table 2. The predictors of the top model were present in over half of the models in the top model set, so this model was used.
Table 1Model estimates with standard errors and p value for the best-fit model. All numerical predictors were standardized to 1 standard deviation prior to analysis.
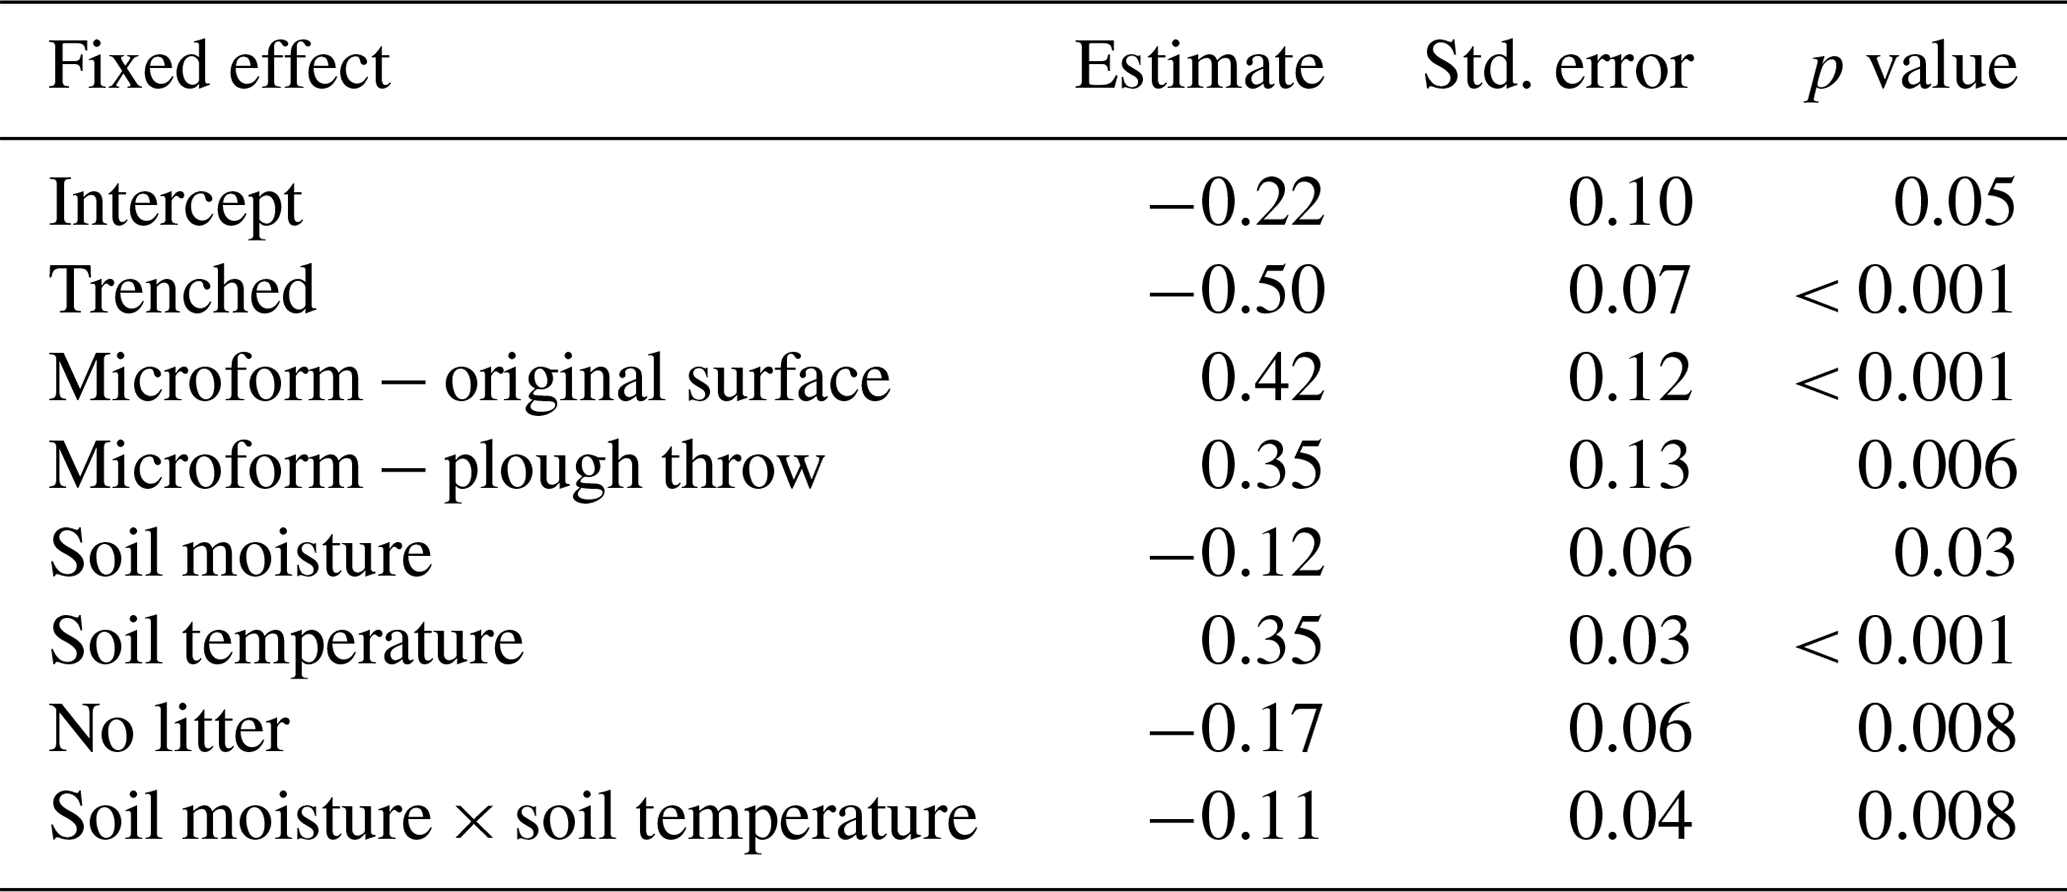
Table 2Model selection summary, showing the four best-ranked models with a delta AICc of less than 2. Models are ranked by AICc and weight, where higher weighted models have more statistical support. Df is the degrees of freedom, LogLik is the log likelihood and ΔAICc is the difference in AICc to the top model.

3.2 Spatial trends and litter contributions to soil CO2 flux
In both control and trenched plots, fluxes from plough throw (control: 1.23 ± 0.10; trenched: 0.85 ± 0.07 µmol m−2 s−1; p=0.01) and original surface (control: 1.48 ± 0.10; trenched: 0.83 ± 0.06 µmol m−2 s−1; p<0.001) were significantly higher than fluxes from furrow (control: 0.90 ± 0.06; trenched: 0.47 ± 0.04 µmol m−2 s−1). Across all microforms, fluxes from collars with litter (1.03 ± 0.05 µmol m−2 s−1) were significantly higher than fluxes from collars without litter (0.91 ± 0.05 µmol m−2 s−1, p=0.008).
3.3 Role of environmental drivers in modulating CO2 flux
Observed soil CO2 efflux values correlated positively with soil temperature, whilst soil moisture showed an inconsistent correlation with flux values; a significant (p=0.008) interaction between soil temperature and soil moisture means that at high temperatures CO2 flux decreases with increasing soil moisture, but at low temperatures flux increases when soil moisture increases, with an inflection between positive and negative moisture dependence between 6 and 7 ∘C (Fig. 4).
There was no difference in soil temperature between trenched and control plots, but soil moisture was significantly higher in trenched plots than in control plots (p<0.001). To account for the artificially elevated soil moisture in trenched plots, CO2 fluxes were corrected using the global relationship between soil moisture and CO2 flux (Fig. 4) to calculate fluxes expected to occur under moisture conditions in control plots.
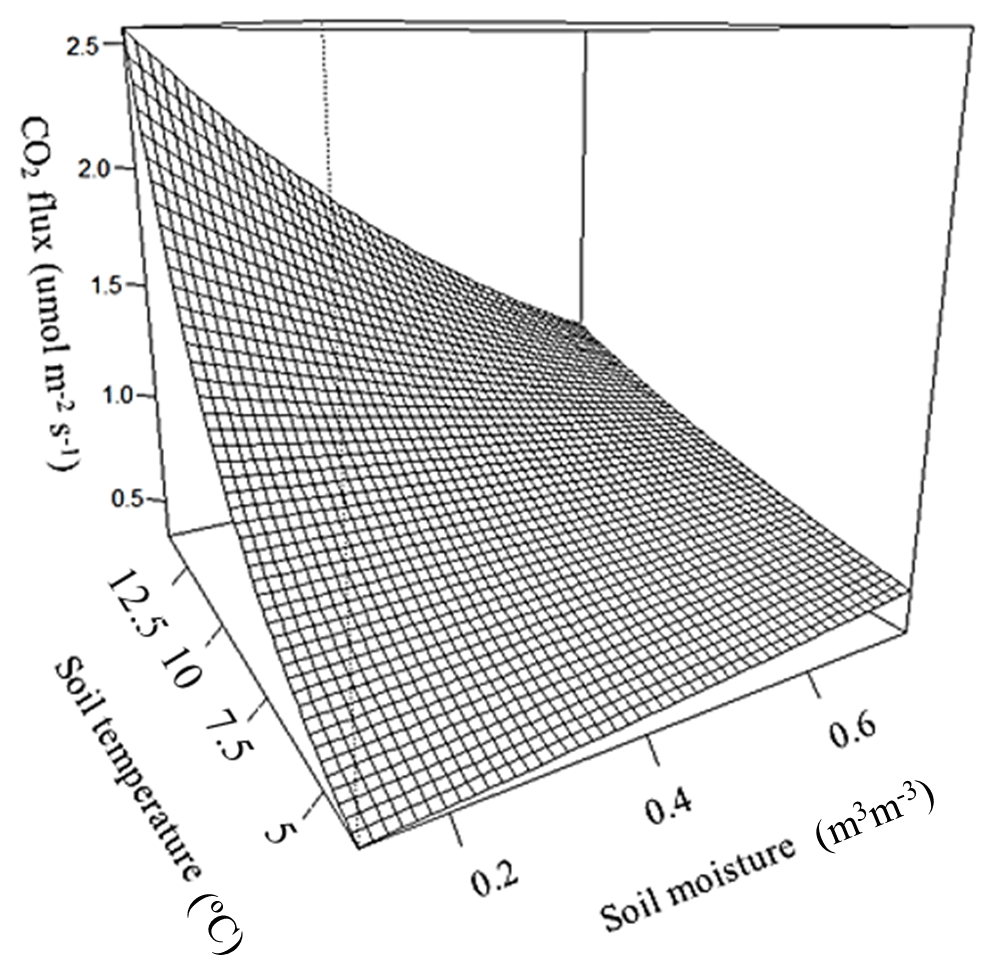
Figure 4Combined effect of soil temperature and soil moisture at 5 cm depth on soil CO2 flux from the control sites, estimated from the top model.
3.4 Partitioned fluxes
Soil CO2 efflux was partitioned into component fluxes for all measuring dates from August 2014 onwards to remove disturbance-related artefacts observed immediately after trenching. The model prediction of heterotrophic respiration is calculated by subtracting the autotrophic flux from the total soil flux and includes emissions from decomposition of cut roots. Flux simulations based on the soil model details indicate significantly lower autotrophic fluxes than heterotrophic fluxes (p=0.01, Fig. 5). Across all microforms, heterotrophic fluxes represented 61 % and autotrophic fluxes represented 39 % of the total fluxes. From these predictions, annual sums for autotrophic and heterotrophic fluxes have been calculated, giving an average peat decomposition flux of 184 ± 21 g C m−2 yr−1. Total soil respiration without needle litter is 301.3 ± 34.2 g C m−2 yr−1, with needle decomposition adding 41.2 ± 53.5 g C m−2 yr−1 to annual fluxes, giving a total soil respiration including needle litter of 343 ± 35 g C m−2 yr−1.
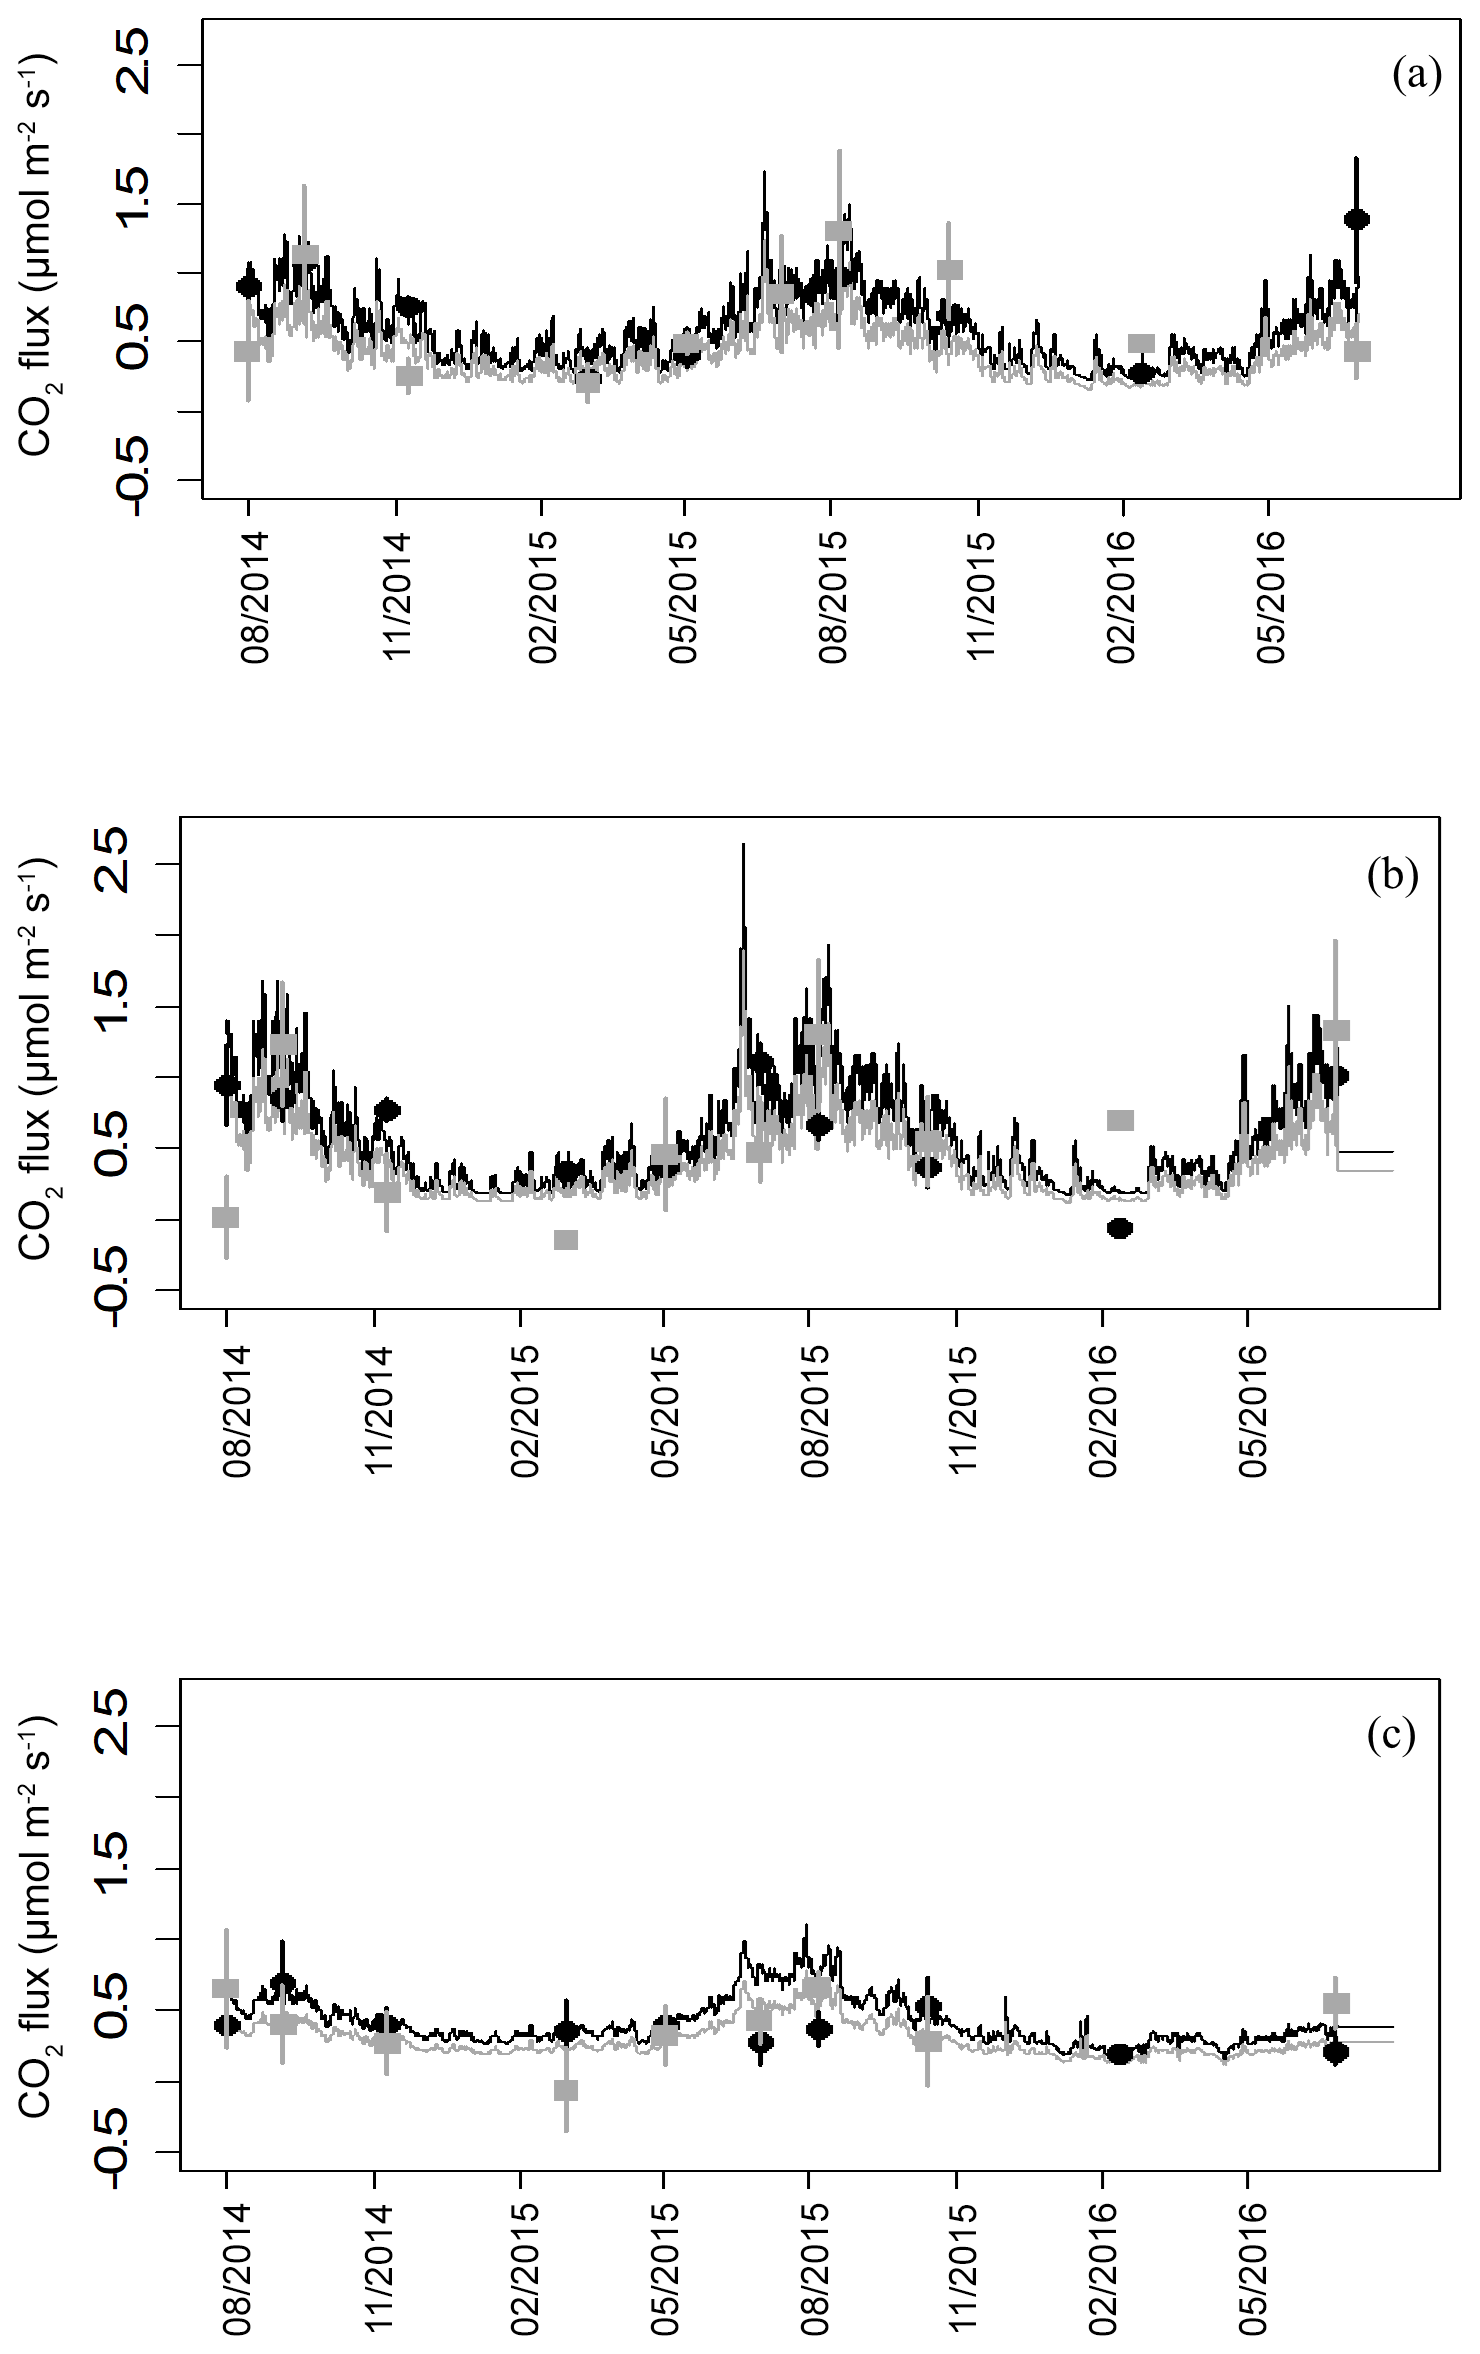
Figure 5Modelled and measured fluxes of heterotrophic (black) and autotrophic (grey) soil CO2 efflux from the three topographic microforms. Closed symbols are average fluxes with error bars (n=4 plots). Connecting lines are the predicted fluxes using soil temperature and moisture at 5 cm depth. (a) Original surface, (b) plough throw and (c) furrow.
3.5 Impact of litter and roots
Litter fall was 719 ± 71.3 g of litter per square meter per year, with no detectable difference between trenched and control plots. Assuming a C fraction of biomass of 50 % (Mathews, 1993), this represents an input to the soil of 359 g C m−2 yr−1 via litter fall.
CO2 flux from surface litter is calculated from the difference in the modelled annual fluxes between the collars with and without litter, with the fluxes from collars with litter significantly higher than the CO2 flux from the collars without litter (p=0.008, Table 1). C emitted by litter in the control plots appears to be higher than in trenched plots, and the CO2 flux per gram of litter is 1.7 to 3.6 times higher from the control plots than from the trenched plots (Table 3).
Table 3Mean amount of C emitted as CO2 by surface needle litter in litter collars, for both years (standard error in brackets).
Root biomass per square meter with an assumed rooting depth of 25 cm in August 2014 was 761 ± 324, 603 ± 110 and 715 ± 257 g for <2 mm roots, 2–5 mm roots and >5 mm roots, respectively. For both the control and the trench plots, roots smaller than 2 mm declined in total biomass from the start of the experiment to the end of the experiment, but there were no significant differences between the control and trenched plots at the start and end of the experiment. Despite an apparent trend towards higher root biomass in control plots in July 2016, these differences were not statistically significant. There were also no significant differences between the beginning and end of the experiment for root classes 2–5 and >5 mm (Fig. 6).
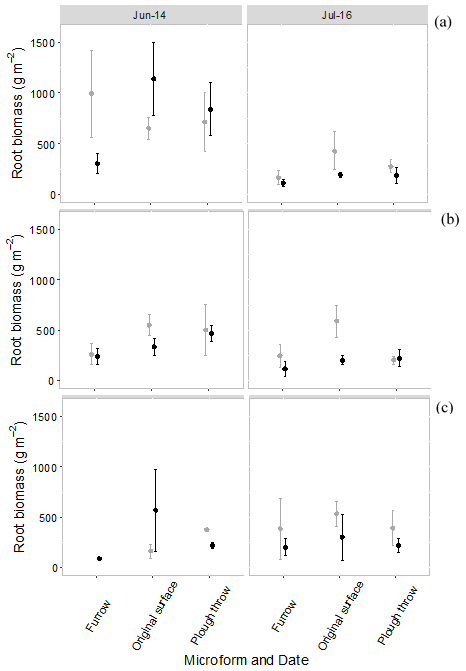
Figure 6Root biomass per square meter to 25 cm in control (grey) and trenched (black) plots at the beginning of the experiment (June 2014) and end of experiment (July 2016), split into three root size classes, per microform. (a) Root size <2 mm, (b) root size 2–5 mm and (c) root size > 5 mm. Symbols are average fluxes with error bars representing standard errors (n=4 plots).
3.6 Root decomposition
Root mass in decomposition bags showed a consistent decline over the duration of the experiment (Fig. 7). The calculated decay constant (k) showed systematic differences by microform, with the highest decay rates tending to occur for incubations at the original surface (Table 4).
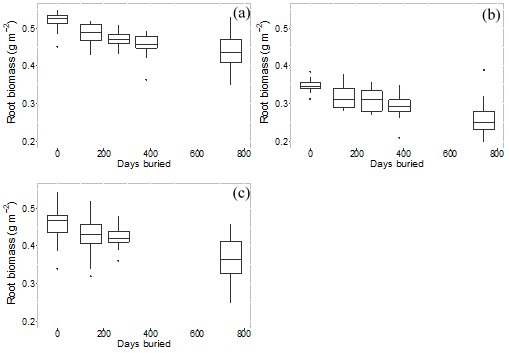
Figure 7Root mass remaining in root bags over number of days buried, for each root size class averaged across all microforms. (a) Root size < 2 mm, (b) root size 2–5 mm and (c) root size > 5 mm.
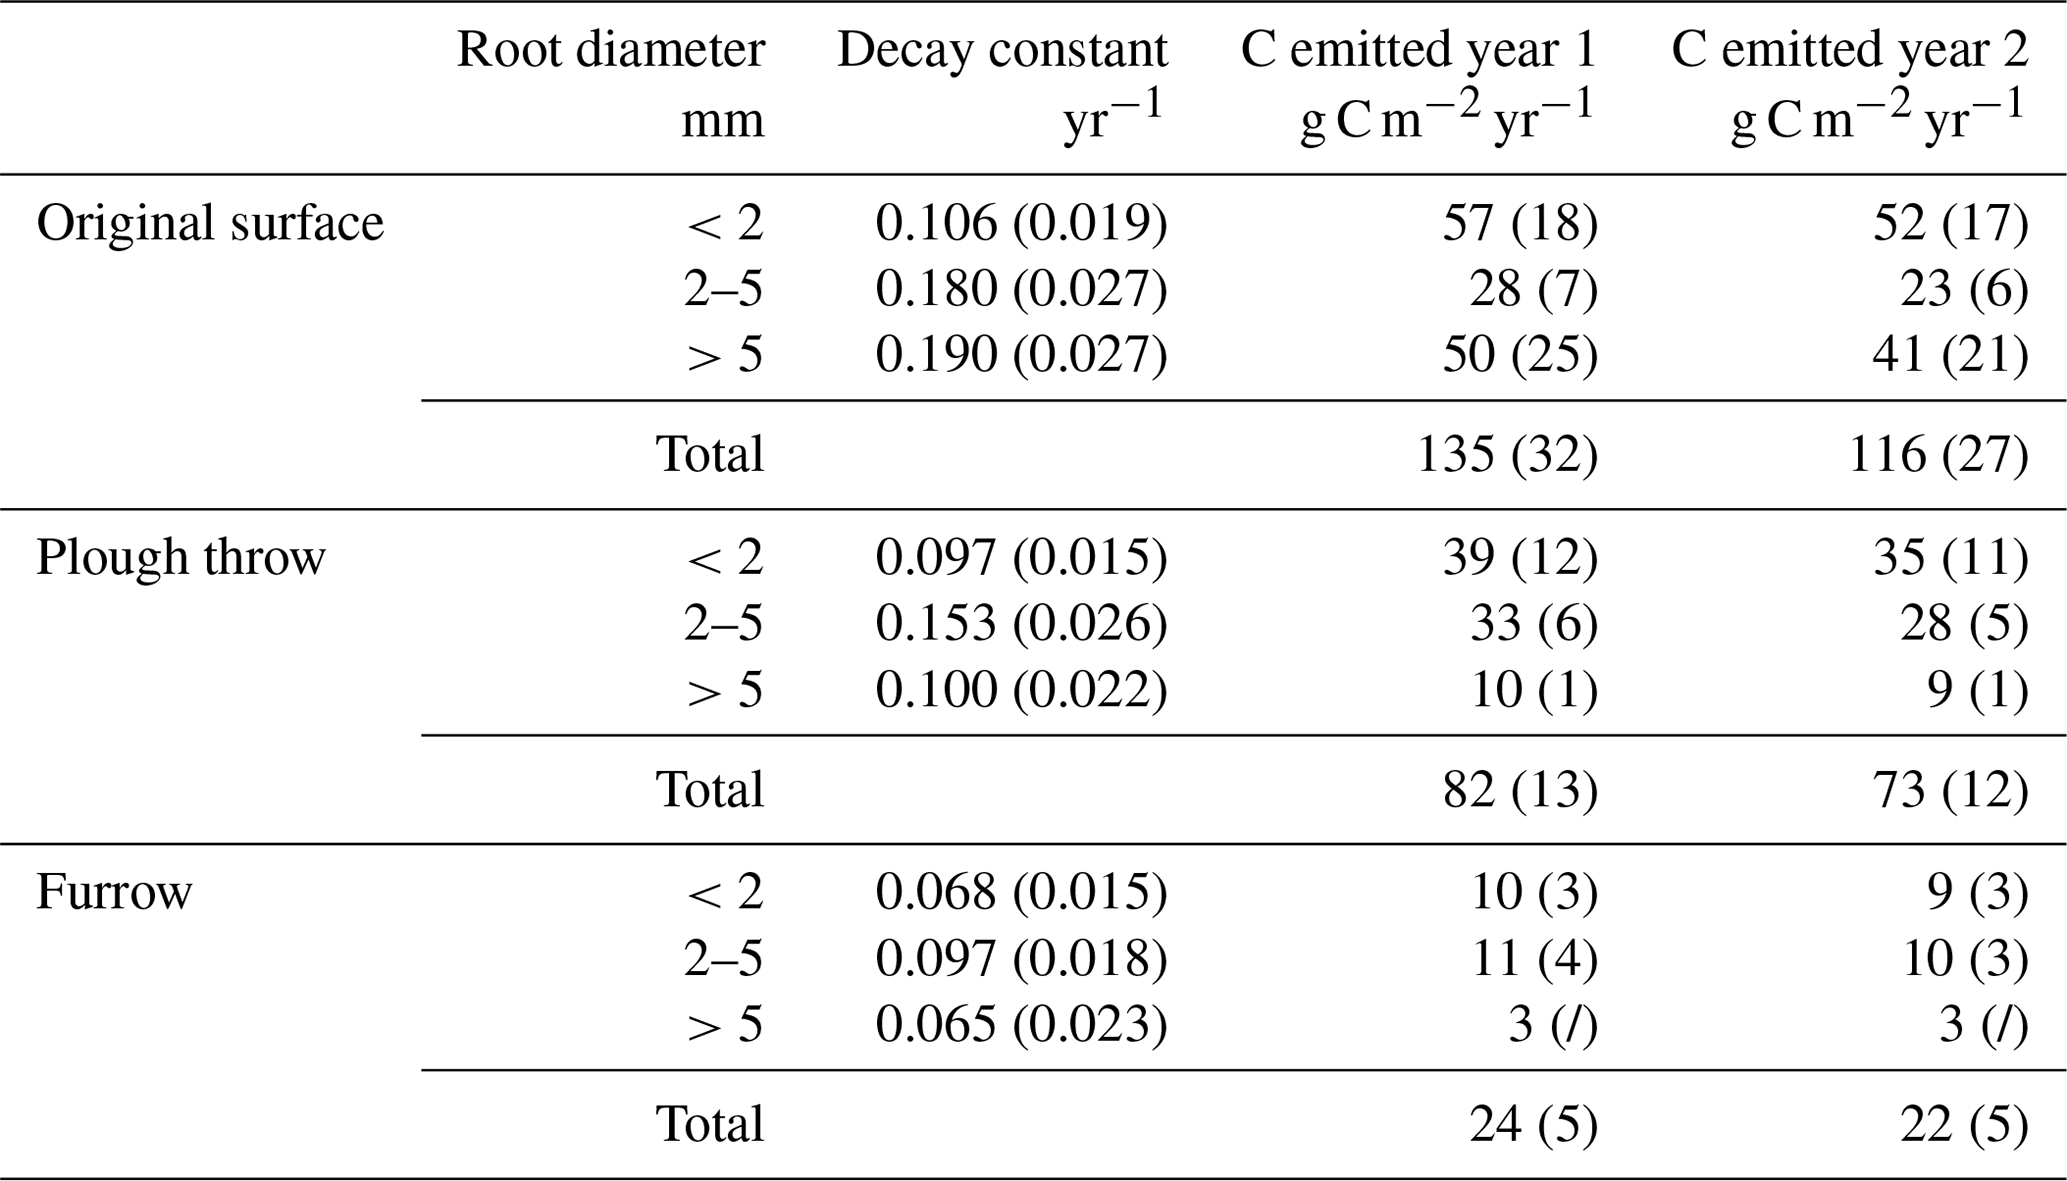
Table 4Root decay constants and associated C emissions in trenched plots by microform and root size classes (standard error in brackets).
3.7 C flux from dead roots
The amount of C emitted from the decaying roots is calculated using the exponential decay function (1), with the biomass of roots per square meter to a depth of 20 cm in the trenched plots at the beginning of the experiment as M0. It is assumed that all biomass lost is emitted as CO2 and that 50 % of roots are C (Mathews, 1993), as conservative assumptions, meaning that estimates are the maximum possible CO2 flux from decaying roots in trenched plots. To correct for soil CO2 efflux generated in trenched plots as an artefact of creating dead root biomass, annual estimated CO2 emissions were corrected by subtracting root-decay-based estimates from trenched plot CO2 emissions (Table 5).
Table 5Corrected for dead root decay in trenched plots, heterotrophic soil CO2 efflux (excluding litter) (Fh) and autotrophic (Fa) fluxes (standard error in brackets) in g C m−2 yr−1 for both the first year (August 2014–August 2015) and second year (August 2015–August 2016) of the study.
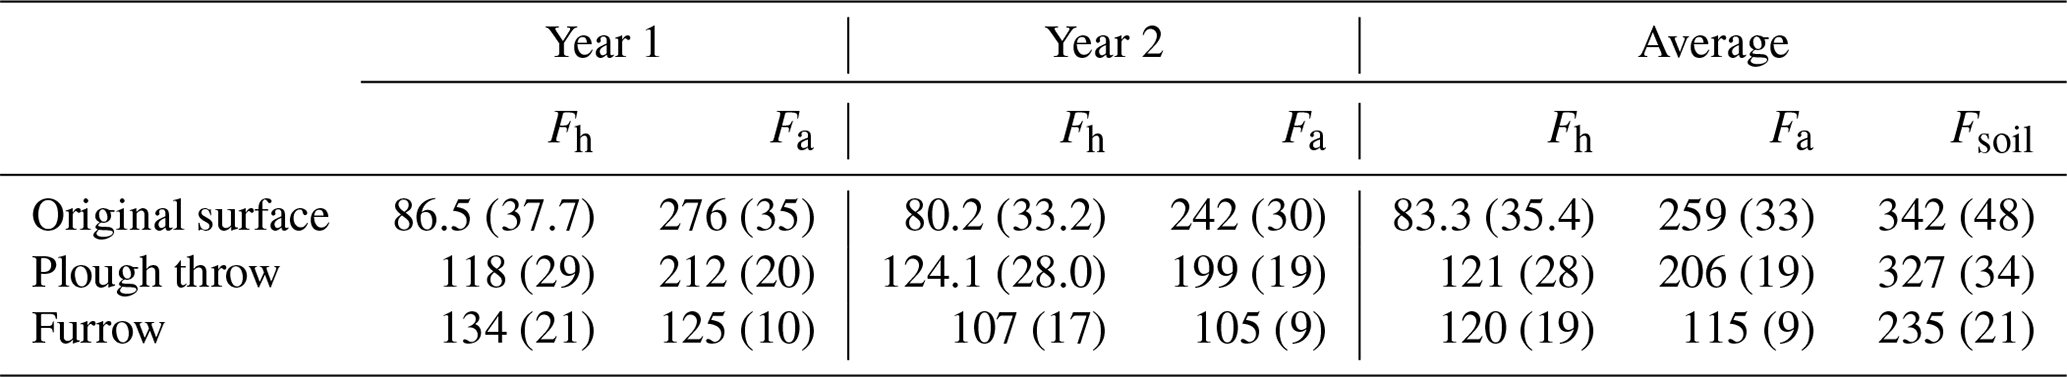
Heterotrophic fluxes represent approximately 24 % and autotrophic fluxes 76 % of the total soil fluxes in the original surface, 37 % and 63 % respectively in the plough throw, 51 % and 49 % respectively in the furrow, and 38 % and 62 % respectively averaged over all microforms.
3.8 Weighted average for soil CO2 flux in Flow Country forest plantations
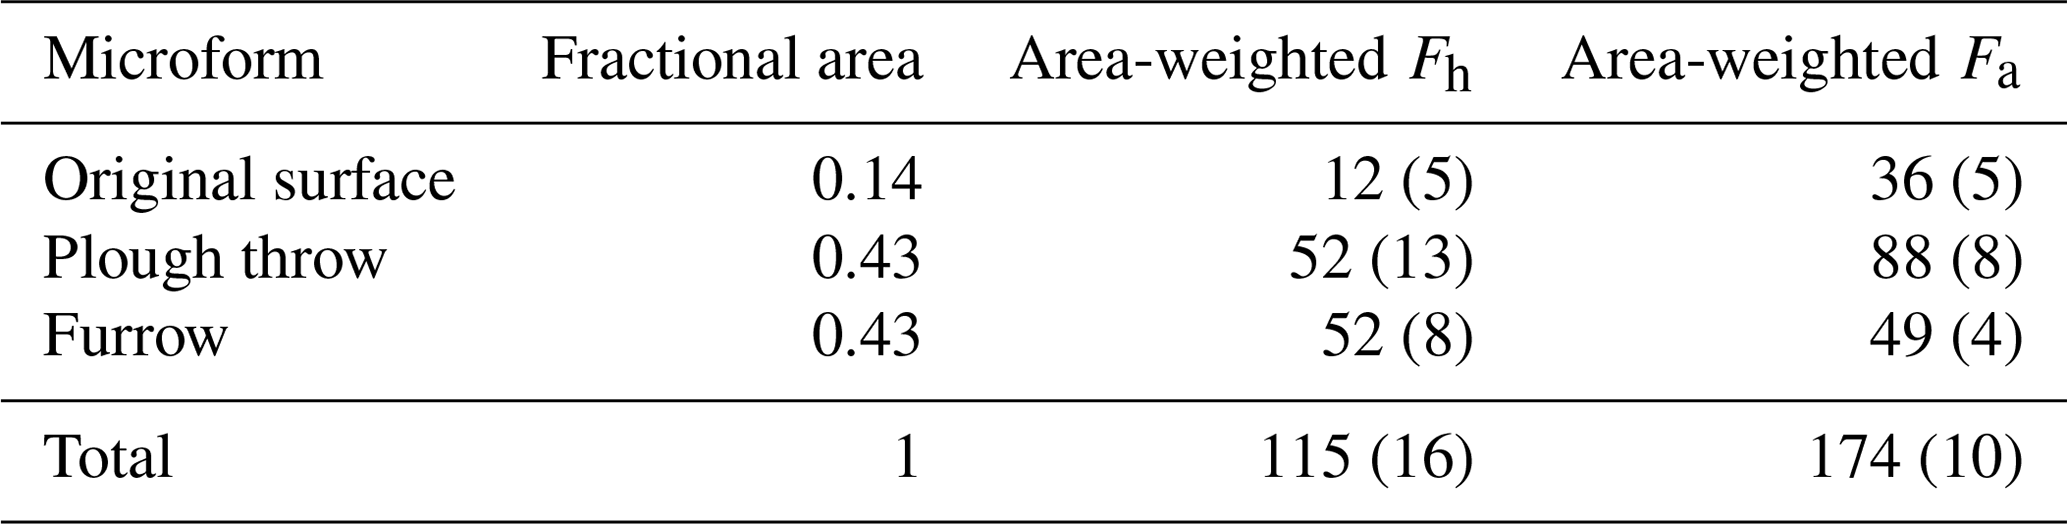
In order to scale soil CO2 fluxes (excluding litter) from different microforms to the level of an entire forest stand, fluxes from individual microforms were weighted by their fractional area (Table 6). This results in a slight shift in proportion of heterotrophic and autotrophic CO2 flux sources to 40 % and 60 % respectively and a total area-weighted soil CO2 flux of 289.4 ± 18.6 g C m−2 yr−1.
Table 6Area-weighted heterotrophic peat decomposition (Fh) and autotrophic (Fa) fluxes (standard error in brackets) in g C m−2 yr−1 averaged over both years measured.
Our results indicate that the soils in these 30-year-old drained and afforested peatlands are a net sink for C, as substantially more C enters the soil as organic matter than is decomposed heterotrophically. The soil surface C balance of the soil under these forest plantations is visualized in Fig. 8, with the annual CO2 fluxes of the forest plantation based on the area-weighted fluxes. Based on these fluxes, we tentatively estimate the soil C sink (the difference between litter C input and total heterotrophic soil CO2 efflux) to be 191±64 g C m−2 yr−1 for our site.
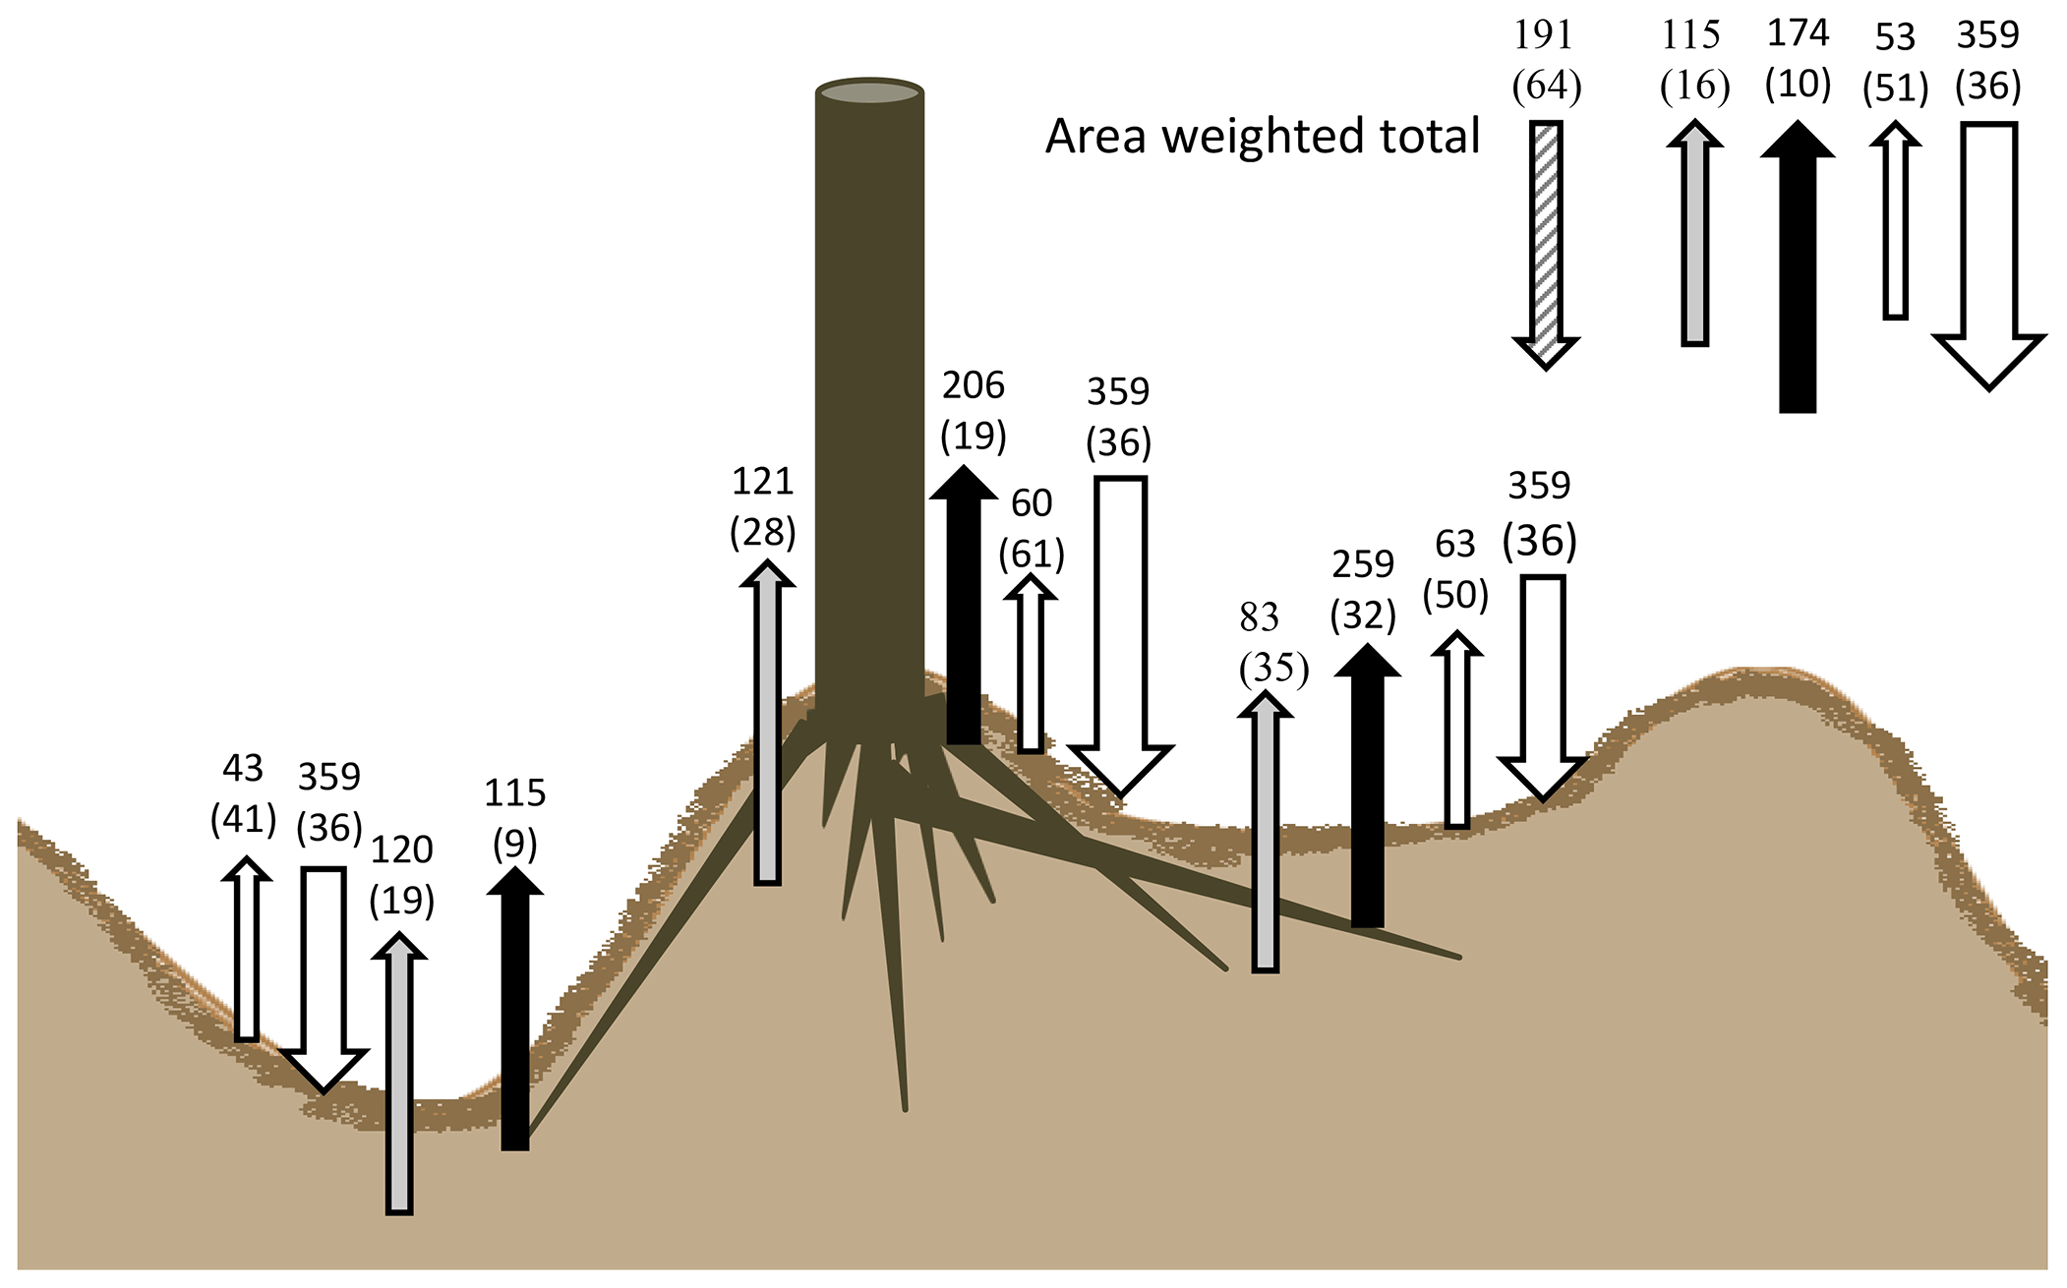
Figure 8Summary of soil C budget (in g C m−2 yr−1) under the canopy of a Sitka spruce and lodgepole pine plantation on deep peat. Downward arrows indicate litterfall, whilst upward fluxes show autotrophic (Fa) (black), peat decomposition flux (grey) and surface needle litter (white) across the three main microforms. Total forest soil fluxes with area-weighted values are visualized in the top-right corner, including the estimated soil C sink (grey and white diagonal striped).
We found a C input of 359 g C m−2 yr−1 via litter fall, similar to other Sitka spruce forests of similar age to these forest plantations in the UK, which range from 273 to 573 g C m−2 yr−1 (Morison et al., 2012). This is balanced by total soil efflux including litter-derived CO2 of 342.5 ± 34.7 g C m−2 yr−1; i.e. the amount of C entering the soil as surface litter alone falls within a similar range to C leaving as CO2. Missing in the C budget in Fig. 8 is the input of C from root exudates that remain in the soil C pool (net rhizodeposition), potential losses through aquatic C export and root turnover. Gaffney et al. (2020) have measured the aquatic C flux (DOC, DIC, POC) from similar forest plantations in the north of Scotland and have found a flux of 13.9 g C m−2 yr−1, which is a small flux compared to the CO2 soil efflux. Root : shoot allocation in forest ecosystems is usually in the order of 1 : 3 (Laiho and Laine, 1997), so it is possible that below-ground litter and exudate deposition could account for a significant C input only partially sampled by our approach (i.e. excluding large root stocks), which means that our tentative soil C sink estimate is conservative.
The rate of peat decomposition in these drained and afforested peatlands is substantial, but overall soil CO2 efflux and ratio of heterotrophic autotrophic respiration falls within boreal averages for forested ecosystems (Fig. 9; Bond-Lamberty and Thomson, 2010).

Figure 9Heterotrophic annual flux against soil respiration annual flux (g C m−2 yr−1) in boreal forests in black dots and boreal forests on peat soils in grey triangles, from the Bond-Lamberty and Thomson (2010) dynamic database downloaded on 19 April 2020. Our result of this study is added as the red square. See Table A1 in the Appendix for references to studies used to create this graph.
Results from other drained temperate peatland sites under conifer plantation vary from around 260 g C m−2 yr−1 at a 39-year-old drained Sitka spruce plantation in Ireland on naturally treeless blanket bog (Byrne and Farrell, 2005) to values of 972 g C m−2 yr−1 on average across 18- to 44-year-old Sitka spruce plantations on poorly drained Dystric Histosols in the south of Ireland (Jovani-Sancho et al., 2018), with similar annual fluxes of 453 g C m−2 yr−1 reported from under a 43-year-old lodgepole pine plantation in central Scotland (Yamulki et al., 2013). Afforested boreal peatlands also show generally higher soil CO2 flux values, ranging from 577 to 705 g C m−2 yr−1 (e.g. Mäkiranta et al., 2008; Minkkinen et al., 2018; Ojanen et al., 2010). Also taking into account possible measurement bias associated with the chemical absorption method used by Byrne and Farrell (2005), which generally underestimates fluxes compared to more reliable infrared gas analysis based methods (Janssens and Ceulemans, 1998), our results of 342.5 g C m−2 yr−1 sit at the low end of total soil respiration fluxes. These low rates are corroborated by independent chamber flux measurements across forest sites in the Flow Country (Hermans et al., unpublished data) and are likely to relate to poor site fertility and specific biochemical properties of the peat at these sites (Hermans et al., 2018).
Our peat oxidation rates of 115 ± 16 g C m−2 yr−1 are also low compared to temperate afforested peatlands, which have been reported to vary between 211 and 407 g C m−2 yr−1 for Sitka spruce sites in Ireland (Jovani-Sancho et al., 2018), whilst boreal peatlands show an even larger range of heterotrophic flux sums (145 to 670 g C m−2 yr−1; Ojanen et al., 2010). Our low estimates result in part from the root decomposition correction, which reduced heterotrophic flux estimates by around 60 g C m−2 yr−1 and is not routinely applied across other studies.
Minkkinen et al. (2018) measured carbon fluxes of a drained, naturally forested peatland (Kalevansuo peatland forest) in the south of Finland over 4 years. They found that the ecosystem was a strong sink of CO2 in all studied years, with an average net ecosystem exchange (NEE) for the 4 years of −234 g C m−2 yr−1. By subtracting the carbon sink of the tree stand from eddy-covariance-derived NEE the authors show that the soil was a carbon sink of −60 g C m−2 yr−1. However, modelling their forest soil respiration fluxes from chamber measurements, they found the peat respiration alone made up 53 % of the total forest floor respiration flux, litter 22 %, roots 16 % and autotrophic respiration of above-ground vegetation 8 %, with soils representing a weak C source. Our results show a lower percentage of peat respiration of 38 % of the total soil respiration minus the litter flux. The higher percentage found by Minkkinen et al. (2018) could possibly be explained by them not applying a dead root correction to their fluxes, which as we show could lead to a big difference in fluxes. For forestry-drained boreal peatlands, Ojanen et al. (2013) report a range of soil C balances from weak source to sinks depending on site fertility. Accounting for below-ground litter production and fine root turnover is an important source of uncertainty in soil C balance estimates (Ojanen et al., 2014), and whilst our soil C balance focuses on surface litter only, our calculations indicate a weak C sink even before below-ground litter input is considered.
Trenching is likely to underestimate heterotrophic respiration and rates of peat mineralization since this approach does not account for rhizosphere effects such as priming (Walker et al., 2016). Therefore, it is likely that the estimated rate of peat oxidation from trenching is conservative. The observed difference of 1.7 to 3.6 times higher CO2 flux per gram of litter from the control plots than from the trenched plots (Table 3) indicates that heterotrophic processes are reduced under trenching. In presence of an active rhizosphere (control plots), decomposition of needle litter and/or soil organic matter (SOM) appears to be faster than when the rhizosphere is not active (trenched plots). This priming of organic matter decomposition is likely to be the result of microbial activity in the soil stimulated by the addition of easily accessible C from roots (Kuzyakov, 2006). Friggens et al. (2020) recently demonstrated the accelerated loss of organic soil under coniferous and deciduous forest plantations on peaty podzols in Scotland, which is consistent with soil priming through the elevated input of C from trees in the rhizosphere. Several studies have shown that mycorrhizal fungi are involved in soil priming (Kuyper, 2017; Paterson et al., 2016), further underlining the interaction between plant-associated biotic activity and decomposition in underlying peat. Therefore, in the control plots a slightly larger proportion of the total CO2 flux could be heterotrophic decomposition than the fluxes from the trenched plots suggest, which means there could be an underestimation of heterotrophic flux in our results, in line with results from the literature (Subke et al., 2004, 2011).
To calculate the root biomass at the start of the experiment, one soil core per microform was taken, and since trees were standing close to each other (1.5 to 2 m apart) this was assumed to be representative for the whole microform. It was not possible to distinguish between living and dead roots in the soil cores, so our results might overestimate the living root biomass. The dead root emission correction made a big difference to the ratio of heterotrophic to autotrophic flux, going from 61 % and 39 % respectively over all microforms to 38 % and 62 % respectively (without area-weighting of fluxes), so a decrease in heterotrophic flux of 23 %. This is in line with the corrections used in other studies; a comparison of corrections used in trenching studies indicates a range from 2 % to 24 %, with an average of 12 % (Subke et al., 2006). This big difference in the fraction heterotrophic : autotrophic flux suggests that even 2 years after trenching, decaying root biomass makes significant contributions to the CO2 flux.
That soils under a 30-year-old conifer plantation on deep peat are a C sink is an interesting finding. However, in order to determine if these soils are a long-term sink or source of carbon, the balance between soil C input from roots and litter and C loss via oxidation should be quantified over the lifespan of the plantation. The average peat depth in these forest plots is 126 (±16) cm, with 0.47 kg C m−2 per centimetre depth (Cannell et al., 1993), which represents ca. 59.3 (±7.3) kg C m−2 stored in the peat under these plantations. The largest carbon losses most likely occurred in the initial planting phase of afforestation (Simola et al., 2012; Vanguelova et al., 2019; Zerva and Mencuccini, 2005), but fluxes have not been measured through this phase and cannot be quantified as new policy prevents planting on deep peat (Forestry Commission, 2016). In other parts of the world, peatland drainage is still actively happening, and studies from these sites show very high rates of peat oxidation during the first 5–10 years of conversion (e.g. Cooper et al., 2020; McCalmont et al., 2021; Minkkinen et al., 2018; Prananto et al., 2020). In the UK, forest plantations on deep peat sometimes end in clear felling of the site and restoration of the peat. The results of this study could also help inform what the CO2 fluxes will be when timber is harvested and large quantities of felling residues are left above ground as well as whole root systems below ground. However, we note that changes in water table and soil moisture conditions created by the soil rewetting associated with clear felling will have significant and separate impacts beyond the conditions of active drainage under which we took our measurements.
The main datasets used for the analysis in this paper are publicly available at http://hdl.handle.net/11667/187 (Hermans and Subke, 2021). The R code used for the analysis is not publicly available. Requests to access the code should be directed to renee.kerkvliet-hermans@iucn.org.uk.
Funding acquisition and initial conceptualization of the whole PhD project were done by JAS, RA, YAT and NC. Further in-depth conceptualization of this particular work was done by RH and JAS, with support from RA, YAT and NC. Investigation, methodology, project administration, data curation, formal analysis, software, visualization, and writing were done by RH with supervision and guidance of JAS, RA, YAT and NC. RM was the field technician on the project and supported all data collection in the field.
At least one of the (co-)authors is a member of the editorial board of Biogeosciences. The peer-review process was guided by an independent editor, and the authors also have no other competing interests to declare.
Publisher’s note: Copernicus Publications remains neutral with regard to jurisdictional claims in published maps and institutional affiliations.
We are grateful for the PhD studentship that enabled this work, jointly funded by the University of Stirling and the Royal Society for the Protection of Birds. Trenching of plots was supported by volunteers working at the RSPB Forsinard Flows reserve and the Environmental Research Institute of the University of the Highlands and Islands. We thank Paul Gaffney, Peter Gilbert and Nathalie Triches for help with field measurements. Further we gratefully acknowledge Daniela Klein, Norrie Russell, Trevor Smith (RSPB), Graeme Findlay (Forestry Commission Scotland), and Fountains Forestry and Donald MacLennan (Brook Forestry) for guidance and land access.
This research has been jointly funded by the University of Stirling and the Royal Society for the Protection of Birds.
This paper was edited by Ben Bond-Lamberty and reviewed by Russell Anderson, Peter E. Levy, and one anonymous referee.
Andersen, R., Farrell, C., Graf, M., Muller, F., Calvar, E., Frankard, P., Caporn, S., and Anderson, P.: An overview of the progress and challenges of peatland restoration in Western Europe, Restor. Ecol., 25, 271–282, https://doi.org/10.1111/rec.12415, 2016.
Anderson, R., Vasander, H., Geddes, N., Laine, A., Tolvanen, A., O'Sullivan, A., and Aapala, K.: Afforested and forestry-drained peatland restoration, in: Peatland restoration and ecosystem services – science, policy and practise, edited by: Bonn, A., Allott, T., Evans, M., Joosten, H., and Stoneman, R., 213–233, Cambridge University press, Cambridge, UK, https://doi.org/10.1017/CBO9781139177788.013, 2016.
Barton, K.: MuMIn: Multi-Model Inference, R Package version 1.40.0, available at: https://cran.r-project.org/package=MuMIn (last access: May 2020), 2017.
Bates, D., Maechler, M., Bolker, B., and Walker, S.: Fitting Linear Mixed-Effects Models Using lme4, J. Stat. Softw., 67, 1–48, https://doi.org/10.18637/jss.v067.i01, 2015.
Bond-Lamberty, B. and Thomson, A.: A global database of soil respiration data, Biogeosciences, 7, 1915–1926, https://doi.org/10.5194/bg-7-1915-2010, 2010.
Burnham, K. P. and Anderson, D. R. (Eds.): Model Selection and Multimodel Inference: A Practical Information-Theoretic Approach, 2nd Edn., Springer, New York, USA, https://doi.org/10.1007/b97636, 2002.
Byrne, K. A. and Farrell, E. P.: The effect of afforestation on soil carbon dioxide emissions in blanket peatland in Ireland, Forestry, 78, 217–227, https://doi.org/10.1093/forestry/cpi020, 2005.
Cannell, M. G. R., Dewar, R. C., and Pyatt, D. G.: Conifer plantations on drained peatlands in Britain: A net gain or loss of carbon?, Forestry, 66, 353–369, https://doi.org/10.1093/forestry/66.4.353, 1993.
Cooper, H. V., Evers, S., Aplin, P., Crout, N., Bin Dahalan, M. P., and Sjogersten, S.: Greenhouse gas emissions resulting from conversion of peat swamp forest to oil palm plantation, Nat. Commun., 11, 407, https://doi.org/10.1038/s41467-020-14298-w, 2020.
Forestry Commission: Supplementary guidance to support the FC forests and peatland habitats guideline note (2000), Scottish For. Publ., 1–5, 2016.
Friggens, N. L., Hester, A. J., Mitchell, R. J., Wookey, J. S. P. A., and Parker, T. C.: Tree planting in organic soils does not result in net carbon sequestration on decadal timescales, Glob. Change Biol., 26, 5178–5188, https://doi.org/10.1111/gcb.15229, 2020.
Gaffney, P. P. J., Hancock, M. H., Taggart, M. A., and Andersen, R.: Restoration of afforested peatland: Immediate effects on aquatic carbon loss, Sci. Total Environ., 742, 140594, https://doi.org/10.1016/j.scitotenv.2020.140594, 2020.
Gorham, E.: Northern Peatlands: Role in the Carbon Cycle and Probable Responses to Climatic Warming, Ecol. Appl., 1, 182–195, 2010.
Hargreaves, K. J., Milne, R., and Cannell, M. G. R.: Carbon balance of afforested peatland in Scotland, Forestry, 76, 299–317, 2003.
Hermans, R. and Subke, J.-A.: Dataset for Soil CO2 flux trenching study by Hermans et al., University of Stirling, Faculty of Natural Sciences [data set], http://hdl.handle.net/11667/187 (last access: 14 January 2022), 2021.
Hermans, R., Zahn, N., Andersen, R., Teh, Y. A., Cowie, N., and Subke, J. A.: An incubation study of GHG flux responses to a changing water table linked to biochemical parameters across a peatland restoration chronosequence, Mires Peat, 23, 1–18, https://doi.org/10.19189/MaP.2018.DW.354, 2018.
Janssens, I. A. and Ceulemans, R.: Spatial variability in forest soil CO2 efflux assessed with a calibrated soda lime technique, Ecol. Lett., 1, 95–98, 1998.
Jovani-Sancho, A. J., Cummins, T., and Byrne, K. A.: Soil respiration partitioning in afforested temperate peatlands, Biogeochemistry, 141, 1–21, https://doi.org/10.1007/s10533-018-0496-0, 2018.
Kuyper, T. W.: Carbon and Energy Sources of Mycorrhizal Fungi: Obligate Symbionts or Latent Saprotrophs?, in: Mycorrhizal Mediation of Soil: Fertility, Structure, and Carbon Storage, edited by: Collins Johnson, N., Gehring, and Jansa, J., 357–374, Elsevier Inc., https://doi.org/10.1016/B978-0-12-804312-7.00020-6, 2017.
Kuznetsova, A., Brockhoff, P. B., and Christensen, R. H. B.: lmerTest: Tests in Linear Mixed Effects Models, R Package version 2.0-33, available at: https://cran.r-project.org/package=lmerTest (last access: May 2020), 2016.
Kuzyakov, Y.: Sources of CO2 efflux from soil and review of partitioning methods, Soil Biol. Biochem., 38, 425–448, https://doi.org/10.1016/j.soilbio.2005.08.020, 2006.
Laiho, R. and Laine, J.: Tree stand biomass and carbon content in an age sequence of drained pine mires in southern Finland, Forest Ecol. Manage., 93, 161–169, https://doi.org/10.1016/S0378-1127(96)03916-3, 1997.
Liski, J., Perruchoud, D., and Karjalainen, T.: Increasing carbon stocks in the forest soils of western Europe, Forest Ecol. Manage., 169, 159–175, https://doi.org/10.1016/S0378-1127(02)00306-7, 2002.
Mäkiranta, P., Minkkinen, K., Hytönen, J., and Laine, J.: Factors causing temporal and spatial variation in heterotrophic and rhizospheric components of soil respiration in afforested organic soil croplands in Finland, Soil Biol. Biochem., 40, 1592–1600, https://doi.org/10.1016/j.soilbio.2008.01.009, 2008.
Mathews, G.: The carbon content of trees, Forestry Commission Technical Paper, 4, 21, ISBN 0-85538-317-8, 1993.
Mayer, M., Prescott, C. E., Abaker, W. E. A., Augusto, L., Cécillon, L., Ferreira, G. W. D., James, J., Jandl, R., Katzensteiner, K., Laclau, J. P., Laganière, J., Nouvellon, Y., Paré, D., Stanturf, J. A., Vanguelova, E. I., and Vesterdal, L.: Influence of forest management activities on soil organic carbon stocks: A knowledge synthesis, Forest Ecol. Manage., 466, 118127, https://doi.org/10.1016/j.foreco.2020.118127, 2020.
Mazzola, V., Perks, M. P., Smith, J., Yeluripati, J., and Xenakis, G.: Seasonal patterns of greenhouse gas emissions from a forest-to-bog restored site in northern Scotland: Influence of microtopography and vegetation on carbon dioxide and methane dynamics, Eur. J. Soil Sci., 72, 1332–1353, https://doi.org/10.1111/ejss.13050, 2021.
McCalmont, J., Kho, L. K., Teh, Y. A., Lewis, K., Chocholek, M., Rumpang, E., and Hill, T.: Short- and long-term carbon emissions from oil palm plantations converted from logged tropical peat swamp forest, Glob. Change Biol., 27, 2361–2376, https://doi.org/10.1111/gcb.15544, 2021.
Met Office: Kinbrace climate, available at: https://www.metoffice.gov.uk/public/weather/climate/gfm5qbgxz, last access: 20 July 2018.
Minkkinen, K., Ojanen, P., Penttilä, T., Aurela, M., Laurila, T., Tuovinen, J.-P., and Lohila, A.: Persistent carbon sink at a boreal drained bog forest, Biogeosciences, 15, 3603–3624, https://doi.org/10.5194/bg-15-3603-2018, 2018.
Morison, J., Matthews, R., Miller, G., Perks, M., Randle, T., Vanguelova, E., White, M., and Yamulki, S.: Understanding the carbon and greenhouse gas balance of forests in Britain, Res. Rep.-For. Comm. UK, ISBN 978-0-85538-855-3, 2012.
Nakagawa, S. and Schielzeth, H.: Repeatability for Gaussian and non-Gaussian data: A practical guide for biologists, Biol. Rev., 85, 935–956, https://doi.org/10.1111/j.1469-185X.2010.00141.x, 2010.
Ojanen, P., Minkkinen, K., Alm, J., and Penttilä, T.: Soil–atmosphere CO2, CH4 and N2O fluxes in boreal forestry-drained peatlands, Forest Ecol. Manage., 260, 411–421, https://doi.org/10.1016/j.foreco.2010.04.036, 2010.
Ojanen, P., Minkkinen, K., and Penttilä, T.: The current greenhouse gas impact of forestry-drained boreal peatlands, Forest Ecol. Manage., 289, 201–208, https://doi.org/10.1016/j.foreco.2012.10.008, 2013.
Ojanen, P., Lehtonen, A., Heikkinen, J., Penttilä, T., and Minkkinen, K.: Soil CO2 balance and its uncertainty in forestry-drained peatlands in Finland, Forest Ecol. Manage., 325, 60–73, https://doi.org/10.1016/j.foreco.2014.03.049, 2014.
Paterson, E., Sim, A., Davidson, J., and Daniell, T. J.: Arbuscular mycorrhizal hyphae promote priming of native soil organic matter mineralisation, Plant Soil, 408, 243–254, https://doi.org/10.1007/s11104-016-2928-8, 2016.
Prananto, J. A., Minasny, B., Comeau, L.-P., Rudiyanto, R., and Grace, P.: Drainage increases CO2 and N2O emissions from tropical peat soils, Glob. Change Biol., 26, 4583–4600, https://doi.org/10.1111/gcb.15147, 2020.
R Core Team: R: A language and environment for statistical computing. R Foundation for Statistical Computing, Vienna, Austria, available at: https://www.R-project.org/ (last access: 14 January 2022), 2016.
Richards, S. A.: Testing ecological theory using the information-theoretic approach: examples and cautionary results, Ecology, 86, 2805–2814, 2005.
Simola, H., Pitkänen, A., and Turunen, J.: Carbon loss in drained forestry peatlands in Finland, estimated by re-sampling peatlands surveyed in the 1980s, Eur. J. Soil Sci., 63, 798–807, https://doi.org/10.1111/j.1365-2389.2012.01499.x, 2012.
Sloan, T. J., Payne, R. J., Anderson, A. R., Bain, C., Chapman, S., Cowie, N., Gilbert, P., Lindsay, R., Mauquoy, D., Newton, A. J., and Andersen, R.: Peatland afforestation in the UK and consequences for carbon storage, Mires Peat, 23, 1–17, https://doi.org/10.19189/MaP.2017.OMB.315, 2018.
Smith, T. and Hancock, M.: Interim report on monitoring of forest to bog restoration, Dyke and Forsinain forests: baseline forest characteristics and vegetation, report, 2016.
Smith, T., Hancock, M., and Stagg, P.: The RSPB Forest to Bog Restoration Project Forsinard Flows Interim Report – July 2012–Sep 2013, report, 2014.
Subke, J.-A., Hahn, V., Battipaglia, G., Linder, S., Buchmann, N., and Cotrufo, M. F.: Feedback interactions between needle litter decomposition and rhizosphere activity, Oecologia, 139, 551–559, https://doi.org/10.1007/s00442-004-1540-4, 2004.
Subke, J.-A., Inglima, I., and Cotrufo, M. F.: Trends and methodological impacts in soil CO2 efflux partitioning: A metaanalytical review, Glob. Change Biol., 12, 921–943, https://doi.org/10.1111/j.1365-2486.2006.01117.x, 2006.
Subke, J.-A., Voke, N. R., Leronni, V., Garnett, M. H., and Ineson, P.: Dynamics and pathways of autotrophic and heterotrophic soil CO2 efflux revealed by forest girdling, J. Ecol., 99, 186–193, https://doi.org/10.1111/j.1365-2745.2010.01740.x, 2011.
Tolvanen, A., Tarvainen, O., and Laine, A. M.: Soil and water nutrients in stem-only and whole-tree harvest treatments in restored boreal peatlands, Restor. Ecol., 28, 1357–1364, 2020.
Vanguelova, E. I., Crow, P., Benham, S., Pitman, R., Forster, J., Eaton, E. L., and Morison, J. I. L.: Impact of Sitka spruce (Picea sitchensis (Bong.) Carr.) afforestation on the carbon stocks of peaty gley soils – A chronosequence study in the north of England, Forestry, 92, 242–252, https://doi.org/10.1093/forestry/cpz013, 2019.
Walker, T. N., Garnett, M. H., Ward, S. E., Oakley, S., Bardgett, R. D., and Ostle, N. J.: Vascular plants promote ancient peatland carbon loss with climate warming, Glob. Change Biol., 22, 1880–1889, https://doi.org/10.1111/gcb.13213, 2016.
Yamulki, S., Anderson, R., Peace, A., and Morison, J. I. L.: Soil CO2 CH4 and N2O fluxes from an afforested lowland raised peatbog in Scotland: implications for drainage and restoration, Biogeosciences, 10, 1051–1065, https://doi.org/10.5194/bg-10-1051-2013, 2013.
Zerva, A. and Mencuccini, M.: Carbon stock changes in a peaty gley soil profile after afforestation with Sitka spruce (Picea sitchensis), Ann. Forest Sci., 62, 873–880, https://doi.org/10.1051/forest:2005078, 2005.