the Creative Commons Attribution 4.0 License.
the Creative Commons Attribution 4.0 License.
 | 04 Jul 2022
The influence of mesoscale climate drivers on hypoxia in a fjord-like deep coastal inlet and its potential implications regarding climate change: examining a decade of water quality data
Johnathan Daniel Maxey
Neil David Hartstein
Aazani Mujahid
Moritz Müller
Deep coastal inlets are sites of high sedimentation and organic carbon deposition that account for 11 % of the world's organic carbon burial. Australasia's mid- to high-latitude regions have many such systems. It is important to understand the role of climate forcings in influencing hypoxia and organic matter cycling in these systems, but many such systems, especially in Australasia, remain poorly described.
We analysed a decade of in situ water quality data from Macquarie Harbour, Tasmania, a deep coastal inlet with more than 180 000 t of organic carbon loading per annum. Monthly dissolved oxygen, total Kjeldahl nitrogen, dissolved organic carbon, and dissolved inorganic nitrogen concentrations were significantly affected by rainfall patterns. Increased rainfall was correlated to higher organic carbon and nitrogen loading, lower oxygen concentrations in deep basins, and greater oxygen concentrations in surface waters. Most notably, the Southern Annular Mode (SAM) significantly influenced oxygen distribution in the system. High river flow (associated with low SAM index values) impedes deep water renewal as the primary mechanism driving basin water hypoxia. Climate forecasting predicts increased winter rainfall and decreased summer rainfall, which may further exacerbate hypoxia in this system.
Currently, Macquarie Harbour's basins experience frequent (up to 36 % of the time) and prolonged (up to 2 years) oxygen-poor conditions that may promote greenhouse gas (CH4, N2O) production altering the processing of organic matter entering the system. The increased winter rainfall predicted for the area will likely promote the increased spread and duration of hypoxia in the basins. Further understanding of these systems and how they respond to climate change will improve our estimates of future organic matter cycling (burial vs. export).
- Article
(5459 KB) - Full-text XML
- BibTeX
- EndNote


Fjords and fjord-like estuaries (also called deep coastal inlets – DCIs; Keith et al., 2020) are sites of high sedimentation and organic carbon (OC) burial. These systems account for approximately 11 % of the world's annual OC burial (Smith et al., 2015). Compared to other marine benthic environments (e.g. sediments along the continental shelf, deeper pelagic sediments, shallow-water carbonate sediments), they bury the most OC per unit area (Smith et al., 2015; Bianchi et al., 2018, 2020).
Their location within mid- to high-latitude coastal margins and disproportionate role in geochemical cycling make these systems especially vulnerable to anthropogenic pressure (Walinsky et al., 2009; Gilbert et al., 2010; Bianchi et al., 2018, 2020). Bianchi et al. (2018) have classified fjord and fjord-like DCIs as “aquatic critical zones” in need of further investigation, especially regarding how they might respond to changes in climatological drivers and anthropogenic pressure. One of the critical issues facing coastal environments is the expansion of oxygen-poor conditions due to increased anthropogenic organic matter loadings (Diaz and Rosenberg, 2008; Oschlies et al., 2018; Breitburg et al., 2018; Pitcher et al., 2021).
Combined effects of environmental drivers or forcings drive the distribution of dissolved oxygen (DO) in any given system. In fjord and fjord-like DCIs, this includes wind, tidal exchange, river flow, organic loading, deep water renewal (DWR) (Edwards and Edelsten, 1977; Gade and Edwards, 1980; Geyer and Cannon, 1982), and microbial processing in the sediments and water column (Gilibrand et al., 2006; Maxey et al., 2020). Characteristics of these systems are shallow sills at their mouth and several sills or ridges that separate the estuary into various basins (Pickard and Stanton, 1980; Stanton and Pickard, 1980; Inall and Gillibrand, 2010). These morphological features restrict mixing and promote stratification of the water column by isolating basin waters from exchange mechanisms between the coastal ocean and surrounding catchment (Inall and Gillibrand, 2010). Hypoxia (defined as DO concentrations below 2 mg L−1) has been long recognised and can be a natural feature of these systems (Rosenberg, 1977; Rabalais et al., 2010; Inall and Gillibrand, 2010; Ji et al., 2020).
The availability of DO influences the eventual fate of OC processed by microbial communities as it enters either aerobic or anaerobic metabolic pathways (see del Giorgio and Williams, 2005). In addition, the cycling of organic matter and nutrients in oxygen-poor environments often leads to the production of potent greenhouse gases such as methane (CH4) and nitrous oxide (N2O) (Codispoti et al., 2005). The fate of carbon exported to marine systems from estuaries is tied to oxygen distribution. Estuarine morphology, physical oceanography, and anthropogenic impacts (e.g. hydroelectric dams, land-use modification, sewage outfalls) drive the oxygen distribution.
Understanding how DO distribution and availability in fjord-like systems respond to climate change requires understanding how they currently respond to changes in local and mesoscale environmental drivers. These drivers include rainfall, run-off, and associated nutrient and organic matter loading. Predicted climate change impacts include changes in air pressure, wind strength, rainfall patterns, and storm intensity (Grose et al., 2010; Priestley and Catto, 2021; Goyal et al., 2021), all of which have the potential to affect DO distribution in fjord-like estuaries (Austin and Inall, 2002; Gillibrand et al., 2005, 2006; Hartstein et al., 2019).
Understanding how broader environmental drivers affect localised DO distribution requires spatially extensive long-term datasets which are not readily available in many systems. Ideally, these datasets would provide enough statistical power to tease out relationships between external drivers (e.g. rainfall volume, rainfall accumulation, OC and organic nitrogen (ON) loading, river flow and climate oscillation indices) and DO distribution through the water column. A 10-year dataset is available for a relatively remote DCI on Tasmania's west coast, enabling analyses focusing on long-term trends in water quality, freshwater and organic matter loading, and their relationships with climate drivers.
The aims of this paper are to
-
understand the effects of rainfall or freshwater inputs on organic matter (OM) loading, nutrient loading, and DO distribution in a fjord-like deep coastal inlet;
-
describe the current effects that broader climate oscillations have on DO distribution and discuss implications that future climate predictions have on possible DO dynamics in these systems (example of a restricted sill system), especially regarding physical drivers of deep water renewal;
-
discuss implications for managing these systems regarding the regulation of freshwater input, OM loading, and the potential to promote oxygen-poor conditions.
2.1 Study area
Macquarie Harbour is a fjord-like DCI located on the west coast of Tasmania. Although the glacially carved status of the harbour itself is somewhat unclear (Baker and Ahmad, 1959; Kiernan, 1990, 1991, 1995), it has the morphology and resulting oceanographic dynamics shared by many fjords and fjord-like systems, including a propensity for oxygen-poor basins (Creswell et al., 1989; Hartstein et al., 2019). Descriptions of its DO drivers (Hartstein et al., 2019; Maxey et al., 2017, 2020) suggest disparate processes affecting surface water and basin DO distribution. Namely, DO in the basin waters is resupplied by DWR. Where or when the direct effects of these processes wane, diffusive mixing and water column oxygen demand become the key drivers of oxygen availability (Inall and Gillibrand, 2010; Hartstein et al., 2019; Maxey et al., 2020).
The harbour is oriented in an NW by SE direction, is approximately 33 km long and 9 km wide, and has a surface area of 276 km2. Compared to the rest of Australia, western Tasmania receives some of the highest rainfall (more than 2500 mm yr−1) and experiences high seasonal rainfall variability (Dey et al., 2018). As a result, broad-scale climate oscillations like the Southern Annual Mode (SAM) (Meneghini et al., 2007; Hill et al., 2009) affect westerly winds that generate orographic rainfall in Macquarie Harbour's catchment. Since the 1970s, both the SAM index (positive values associated with stronger westerlies) and winter rainfall in Macquarie Harbour's catchment have increased (Taschetto and England, 2009; Marshall et al., 2018; Fogt and Marshall, 2020).
The primary source of freshwater to the harbour is the Gordon River, which is responsible for up to 82 % of the system's freshwater input (Hartstein et al., 2019). The mouth of the Gordon River is located on the harbour's SE end and drains a combined catchment (including the Franklin River) of 5682 km2 (MHDOWG, 2014). This catchment is located west of the Cradle Mountain range (Fig. 1). At the NW end of the harbour, the King River is the second largest contributor of freshwater to the system and drains a catchment area of 802 km2.
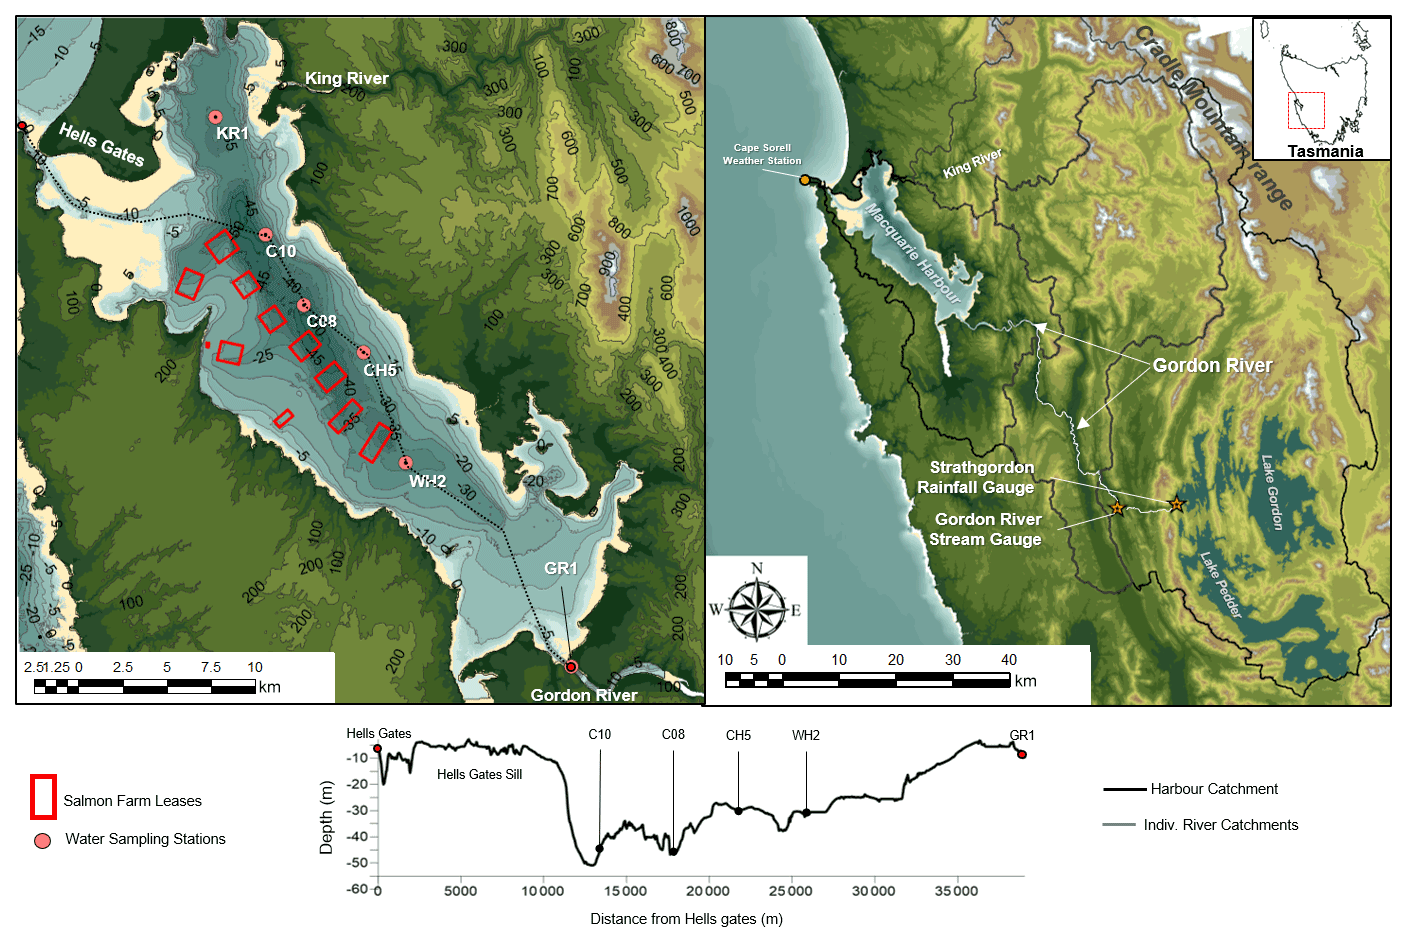
Figure 1Macquarie Harbour, Tasmania. Monthly sampling sites shown with red circles, and Gordon River Stream Gauge and Strathgordon rainfall gauge are shown as orange stars. Aquaculture lease boundaries are shown as hollow red rectangles. Lease locations are sourced from Land Information Systems Tasmania (LISTmap – https://maps.thelist.tas.gov.au/, last access: 23 June 2022). Station names reflect general harbour locations, in which KR1 indicates King River 1; C10, C08, and CH5 indicate Central Harbour 10, 08, and 5; WH2 indicates World Heritage Area 2; and GR1 indicates Gordon River station 1.
River flow in the upper catchments of the Gordon and King rivers has been regulated by hydroelectric dams since 1983 (operated by Hydro Tasmania). Gordon River mean flow has been reported to range from 190 to 265 m3 s−1 and the King River at approximately 55 m3 s−1 (Carpenter et al., 1991; Koehnken, 2006). More recent analyses indicate that mean monthly flows can vary significantly, with flows <100 m3 s−1 observed in summer and early autumn and 500 m3 s−1 in late autumn, winter, and spring (Hartstein et al., 2016; Maxey et al., 2020). Daily peak flow can reach over 1500 m3 s−1. However, before the introduction of hydroelectric dams, peak flow could have been greater (King, 1980; King and Tyler, 1981, 1982; Walker, 1985).
Both rivers supply dark, tannin-rich waters, limiting the system's photic zone to the first 2–3 m of the water column (Carpenter et al., 1991; Edgar et al., 1999). These tannin-rich waters are a product of high organic matter loading, estimated at up to 180 000 t OC per year (Hartstein et al., 2016; Maxey et al., 2020).
While the harbour's catchments are largely undeveloped native forest, anthropogenic inputs include treated copper mining discharges from the King River and several commercial salmon farms situated within the harbour's centre. Salmon farming has been present in the harbour since the 1980s. Between 2009 and 2016, it underwent significant expansion from 9000 t to 16 000 t. Since 2016 farm biomass has been set at 9500 t (Dept Natural Resources and Environment Tasmania https://salmonfarming.nre.tas.gov.au, last access: 23 June 2022) (see Fig. 1 for an overview of farming leases). It has been suggested by MHDOWG (2014) and Hartstein et al. (2016) that Gordon River dam releases may introduce highly concentrated OM pulses into the system when reservoir levels are low. Increased OM loading can impact pelagic oxygen demand in the harbour as shown by Maxey et al. (2020).
Macquarie Harbour has a strongly stratified water column set up by a long (14 km), shallow (<3 m in areas) constricted sill and oxygen-poor basins (Cresswell et al., 1989; Maxey et al., 2017). Temperature differences above and below the halocline can be 10 ∘C. However, temperatures in the bottom waters exhibit little variability (2 to 3∘C) (Hartstein et al., 2019). Basin waters are refreshed episodically by DWR, which is driven by a combination of low atmospheric pressure, low harbour water level, and sustained NW winds (Hartstein et al., 2019). However, the relative importance of freshwater supply to DWR and oxygen distribution remains unknown.
Climate change models reviewed and presented in Grose et al. (2010) and Bennett et al. (2010) indicate that the west coast of Tasmania, including the main rainwater catchments feeding Macquarie Harbour, is expected to experience increased storm intensity, wetter winters, and drier summers (up to 10 % to 18 % wetter or drier throughout the catchment). However, there has been a steady increase in spring and winter rainfall in western Tasmania (Taschetto and England, 2009) despite increasing SAM index values (Marshall et al., 2018). There is still a need to clarify the specific impacts of a changing climate on rainfall patterns. Nevertheless, to predict how future climate scenarios might affect harbour dynamics, it is vital to understand how the system currently responds to present drivers.
Much of the previous literature describing the oceanography and environmental status of Macquarie Harbour has focused on the effects of copper mine discharge (Carpenter et al., 1991; Koehnken, 2006; Featherstone and O'Grady, 1997; Stauber et al., 2000; Eriksen et al., 2001; Teasdale et al., 2003; Augustinus et al., 2010; Cracknell et al., 2019). Recently, Hartstein et al. (2019) and Maxey et al. (2020) have expanded the understanding of the physical and biological oceanography (initially described by Cresswell et al., 1989) of the harbour. They found that DWR is the major driver of bottom water oxygen distribution and that Gordon River organic loading is the primary driver of pelagic oxygen demand (POD). These previous studies demonstrate that external physical drivers (rainfall patterns, sea level, air pressure, wind direction and speed, etc.) establish horizontal and vertical salinity, density, and light and nutrient availability gradients in this system. Da Silva et al. (2021) examined the microbial communities present in Macquarie Harbour's water column. They showed distinct functional groups along the harbour's salinity and depth gradients, suggesting that physical drivers may also influence harbour microbial processes.
2.2 Data collection and analysis
Water quality data are available from a monthly water quality monitoring programme (since October 2011). The monitoring data examined here included sonde profiles and in situ water samples taken at several sites within the harbour (Fig. 1 and Table 1). These include stations at endmembers and within each of the harbour's basins. After its initial stages (2011 to 2013) the sampling programme was expanded to include additional sites and parameters (Table 1).
Water quality sonde profiles were collected every metre using a YSI 6600 V2 equipped with optical DO (accuracy from 0 to 20 mg L−1 is ± 0.1 mg L−1 or 1 % of reading, whichever is greater; precision is 0.01 mg L−1), salinity (accuracy ± 0.1 ppt – part per thousand – or 1 % of reading, whichever is greater; precision is 0.01 ppt), temperature (accuracy is ± 0.15 ∘C; precision is 0.01 ∘C), and depth sensors. Sonde calibration was checked and corrected (when needed) each sampling period. Water samples were collected at various depths (see Table 1) using a 5 L Niskin bottle sampler. Water sample parameters include total organic carbon (TOC) and dissolved organic carbon (DOC), total Kjeldahl nitrogen (TKN), soluble ammonia (NH3), nitrate (NO3), and chlorophyll a. Water collected for soluble inorganic N was filtered immediately using 0.45 µm polyethersulfone syringe filters (Whatman Puradisc), and all samples were stored in a chilled dark container until being transported to the lab for analysis.
Analytical Services Tasmania analysed all water samples. Maxey et al. (2020) outlined detailed organic carbon and chlorophyll a methodologies. Dissolved NH3, NO3, and TKN were analysed using a Lachat flow injection analyser. NH3 and NO3 analyses used methods based on APHA Standard methods (2005) 4500-NH3H (reporting limit 0.005 mg L−1) and 4500 -NO3 (reporting limit 0.002 mg L−1). TKN was determined by converting N into (NH4)2SO4 using K2SO4 digestion and reacting this digested sample with alkaline buffer, salicylate, and hypochlorite to form a coloured compound to be read on the Lachat analyser (reporting limit 0.1 mg L−1).
Table 1Monthly sampling stations showing coordinates, starting months of individual parameters, and sampling depths (in metres). MSL signifies mean sea level, and NPOC signifies non-purgeable organic carbon.
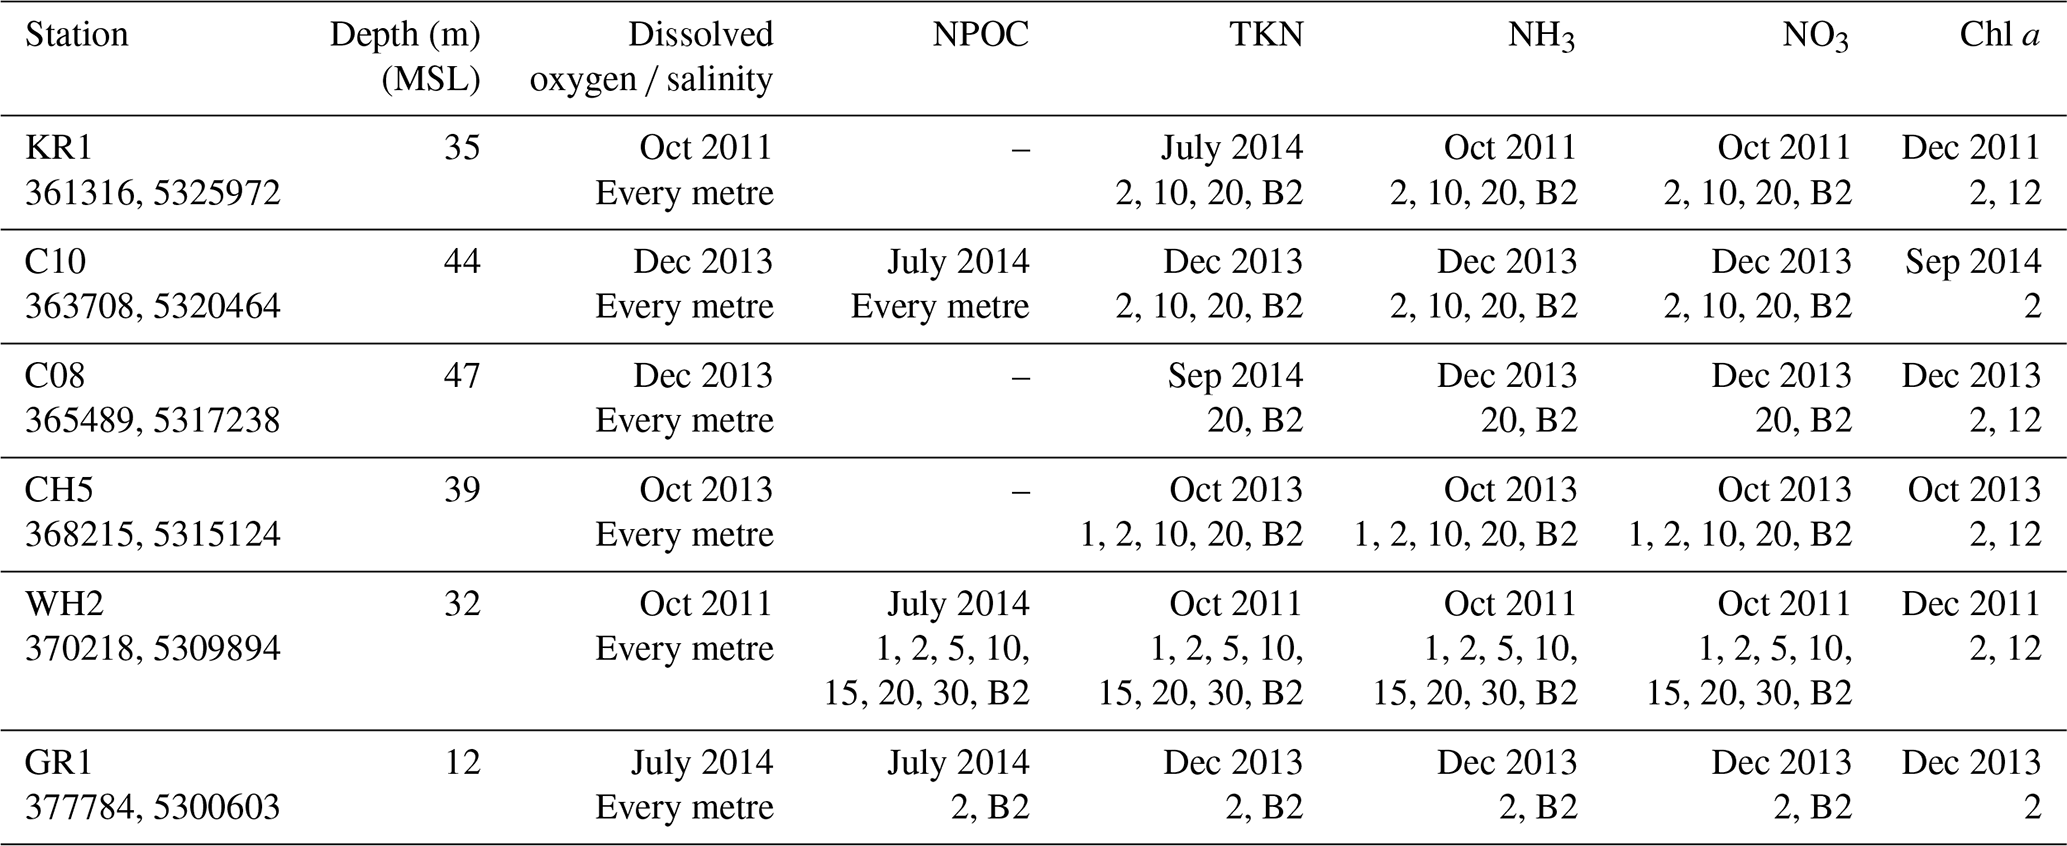
Station coordinates given in UTM (Zone 55G).
Dates indicate starting month of sampling parameter.
Sampling depths indicated under each date, with B2 = 2 m from seabed.
The Bureau of Meteorology (BOM) provided rainfall and stream gauge data from several gauging locations within the Gordon River catchment, namely Strathgordon rainfall gauge station and the Gordon above the Denison stream gauge (hereafter referred to as “Gordon River Stream Gauge”; Fig. 1). Daily rainfall and streamflow data were available for the entire span of the monthly water quality programme, and the Strathgordon rainfall dataset extends back until the 1970s. Rainfall data were organised into several metrics, including daily average monthly rainfall and total accumulated rainfall 30, 20, 10, 5, 3, 2, and 1 d before each monthly monitoring sampling period. The seasonality of rainfall was analysed using a two-way ANOVA (analysis of variance), grouping data by year and season. Post hoc analyses were performed using Tukey's HSD (honestly significant difference) test.
The flow was estimated at the mouth of the Gordon River (for loading estimations) by scaling daily rainfall to the size of the catchment and assuming a rainfall and run-off coefficient of 0.70 adopted from a neighbouring catchment with similar land cover, geology, and slope (Willis, 2008). Additional streamflow from Gordon River dam releases was estimated by subtracting scaled rainfall contributions to river flow measured at the Gordon River Stream Gauge. This flow was added to the estimated run-off entering the harbour. OC and N loading from the Gordon River was determined by multiplying the parameter concentration by the estimated flow entering the harbour.
The relationship between rainfall (of various metrics), riverine OC and N loading, and water quality (e.g. DO concentration and salinity) was analysed using Pearson correlations for each site, for each 1 m depth bin, and the entirety of the water quality dataset. In heavily stratified systems, the surface layer's depth depends upon freshwater supply, tidal forcing, and atmospheric pressure (i.e. thicker freshwater lens during flood events) (Gillibrand et al., 2005; Cage, 2006; Inall and Gillibrand, 2011). When comparing sonde profiles over multiple sampling periods, surface reference data have a shifting datum due to the varying thickness of the freshwater lens and thus introduce a source of error in the analysis. To reduce this possible source of error, we arranged the water quality data to reference height from the seabed (not depth from the surface) when comparing it to catchment rainfall and river flow.
Hypoxic volume was estimated by scaling up monthly DO concentrations using a 1 m vertical resolution box model. Oxygen concentrations within each box were represented by data from individual monitoring stations located in the boxes. A representative volume was assigned to each station's box by using the harbour hypsography in 1 m bins (bathymetry data were provided by Lucieer, 2007, and Hartstein et al., 2016). To estimate the hypoxic volume in the system, we assumed DO concentrations within the box did not vary. DO concentrations below 10 m depth were then multiplied by each bin's representative volume of water.
3.1 Rainfall patterns (2011–2021)
The average daily river flow measured from the Gordon River Stream Gauge (Denison flow) (see Fig. 1) ranged from 17 to 263 m3 s−1 (Fig. 2a). Two-way ANOVAs revealed a significant seasonal and yearly effect (with significant interaction). Minimum daily average flows ranged from 17 m3 s−1 in 2012 to 117 m3 s−1 in 2013. Hydroelectric releases, and not catchment rainfall, would predominantly determine flow at the Gordon River Stream Gauge as the upstream catchment area between the dam and the gauge is relatively small (only 49.5 km2 or about 0.8 % of the size of the ungauged catchment area feeding the Gordon River). Estimated river flow into the harbour also exhibited statistically significant (p=0.04) seasonal periods and significant (p=0.01) inter-annual variation (Fig. 2b). The average winter period daily flow was estimated to be 759 (± 67) m3 s−1. During summer, the estimated flow was approx. 502 (± 62) m3 s−1. The greatest estimated flow observed occurred in August 2018 at approx. 1630 m3 s−1.
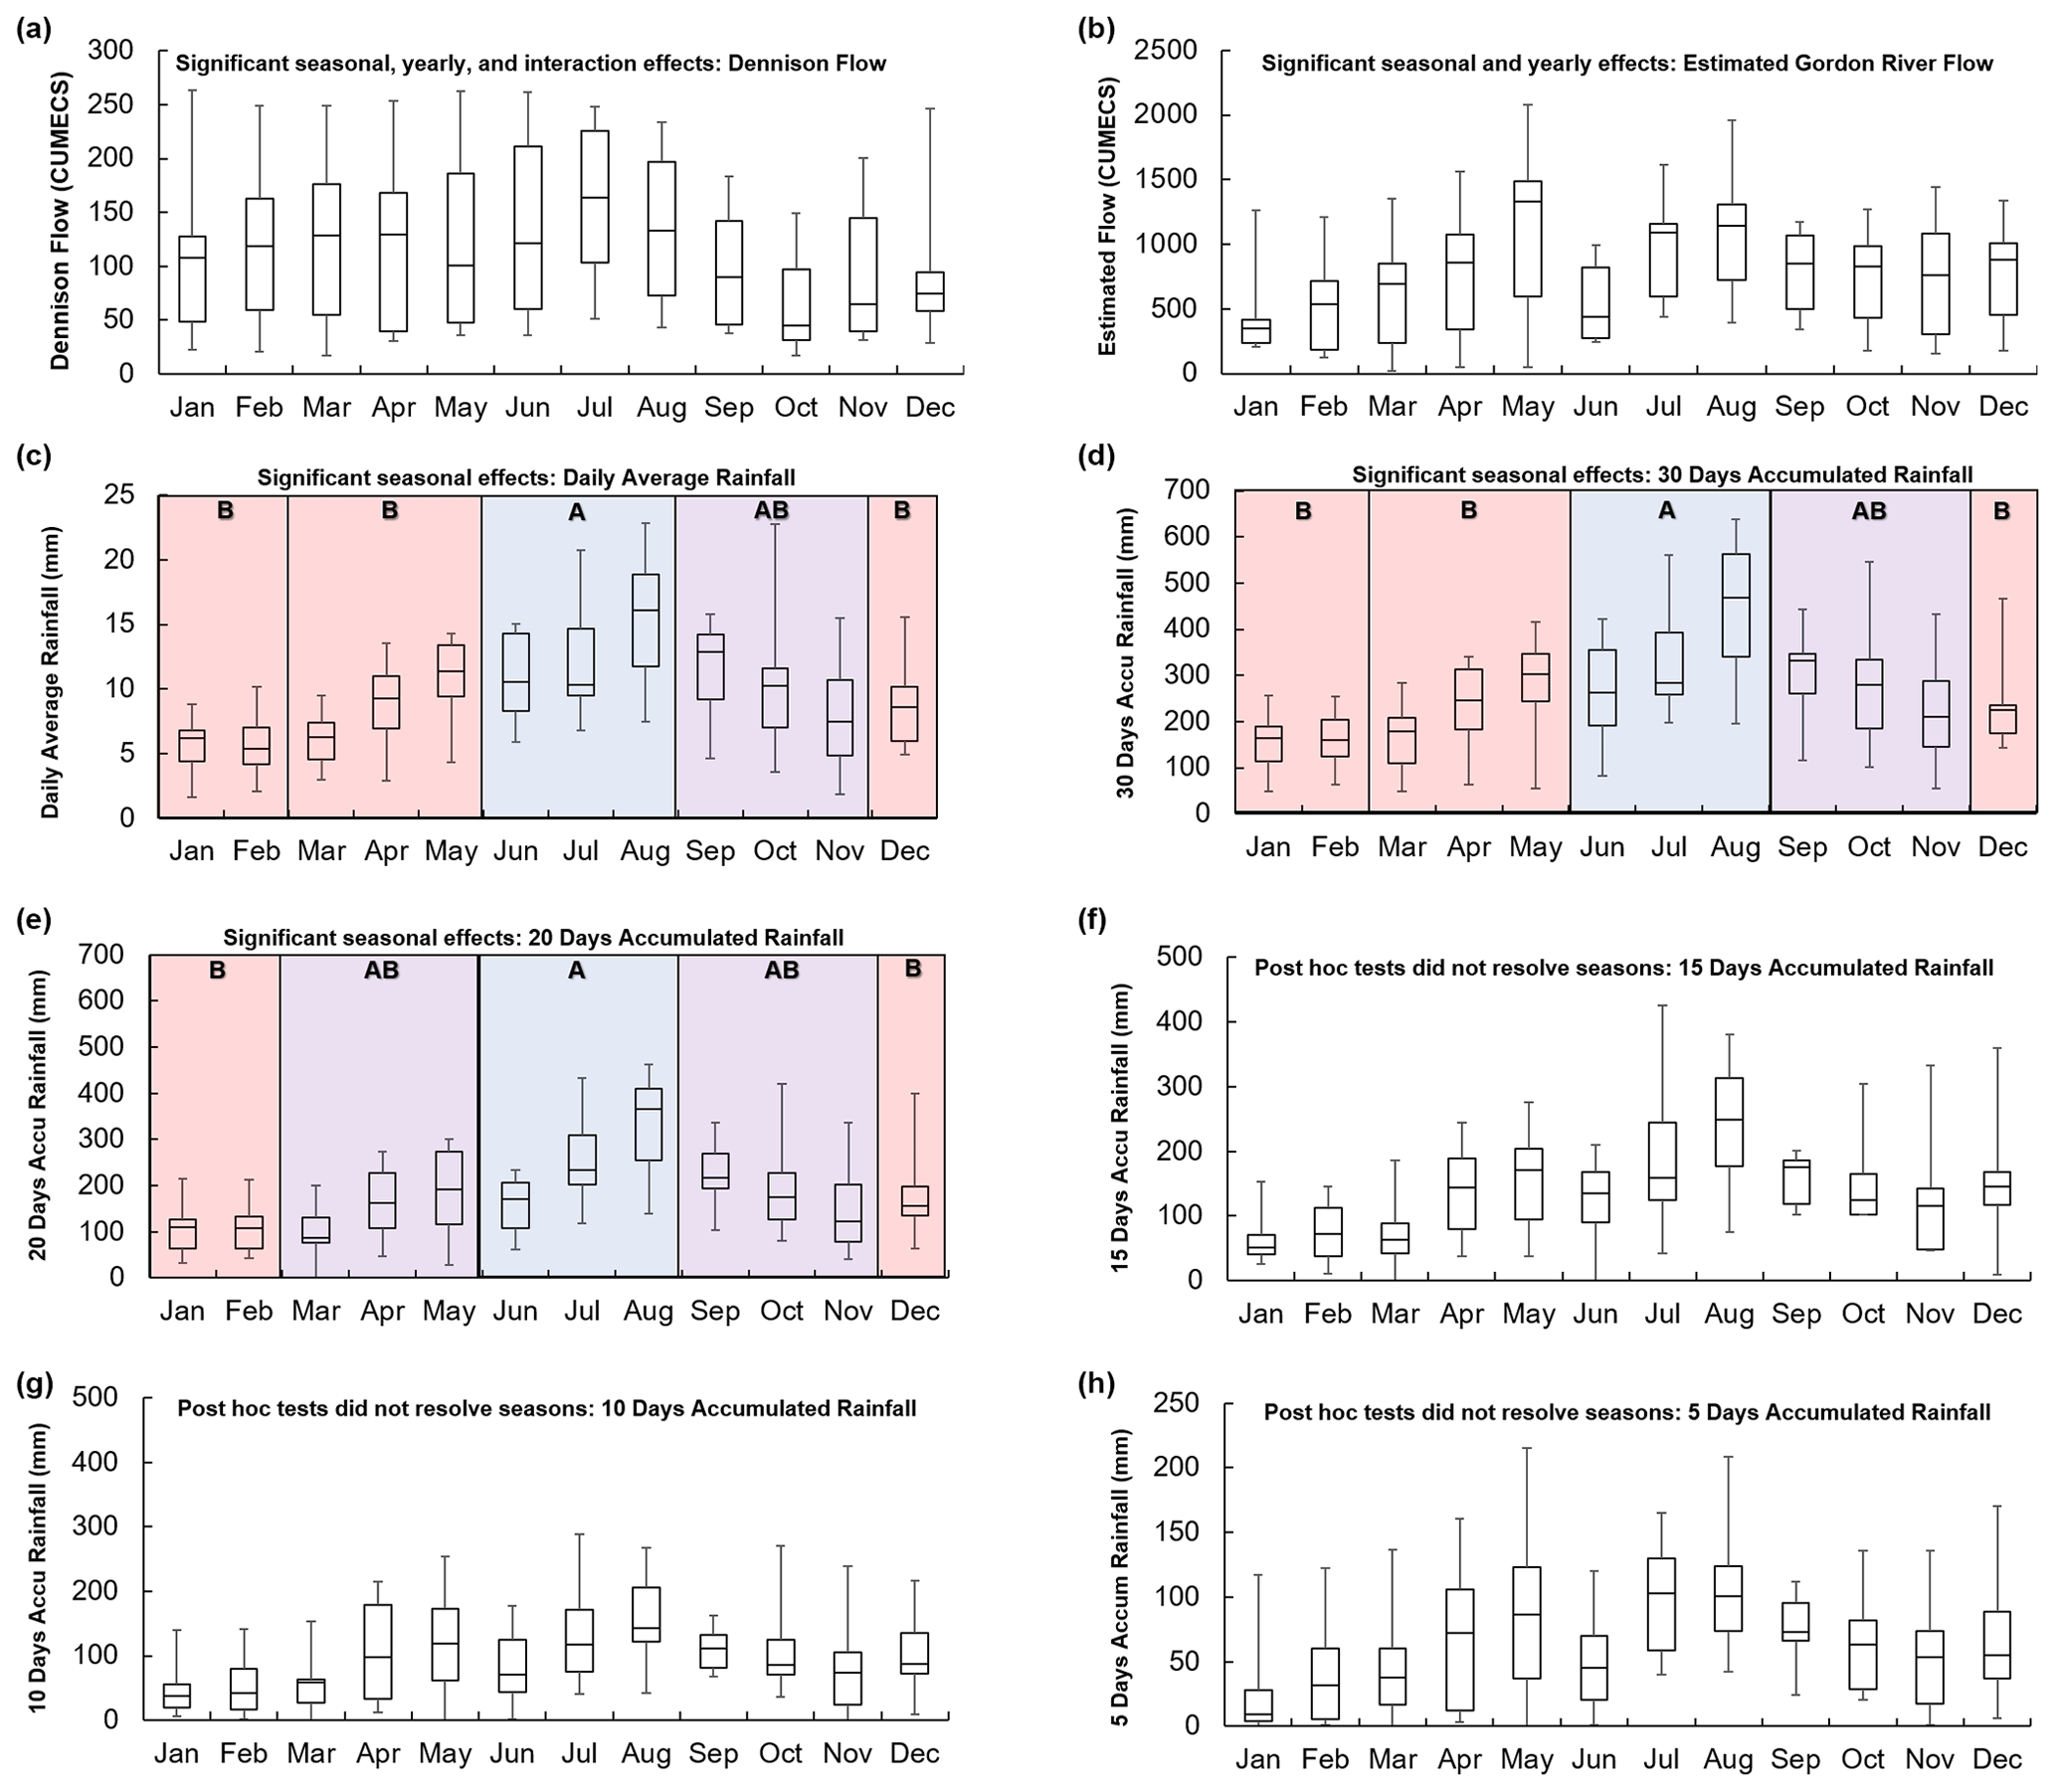
Figure 2Box plots of flow and rainfall metrics from 2011 to 2021 including (a) Gordon River Stream Gauge flow, (b) estimated daily flow into the harbour, (c) daily average rainfall at Strathgordon station, and (d) 30 d, (e) 20 d, (f) 15 d, (g) 10 d, and (h) 5 d rainfall accumulation before monthly water quality sampling. Post hoc (Tukey's HSD) groupings are depicted as colours and letters within the plot area for datasets where two-way ANOVA revealed a significant seasonal effect (for instance Group A and blue shading indicate a significantly distinct group).
Significant seasonal patterns in rainfall were observed at the Strathgordon station with greater rainfall (daily average and accumulated) in winter (June–August; blue shading and Group A) (daily average 12.9 ± 0.9 mm d−1; Fig. 2c) relative to summer (December–February; red shading and Group B) (6.6 ± 0.6 mm d−1) and autumn (March–May) (8.3 ± 0.7 mm d−1) (see Fig. 2 and Table 1). Post hoc testing could not resolve a significant difference between spring (September–November; purple shading and Group AB) (10.6 ± 0.9 mm d−1) and the other seasons (Fig. 2c). Total accumulated rainfall before sampling also showed significant seasonal patterns when considering 30 d accumulated rainfall (Fig. 2d) and 20 d accumulated rainfall (Fig. 2e), but no seasonal pattern could be resolved when considering accumulation over 15 d (Fig. 2f), 10 d (Fig. 2g), or 5 d (Fig. 2h). There were no significant inter-annual effects on rainfall at the Strathgordon station of any metric.
3.2 Rainfall patterns and water quality at the Gordon River mouth
At the mouth of the Gordon River, DOC and DON concentrations ranged from 4 to 21 mg L−1 in surface waters and 2 to 19.8 mg L−1 at 2 m from the riverbed. Correlations between daily average rainfall and OC concentrations were statistically significant, but the effect size was stronger with samples taken 2 m off the seabed (r=0.70, p=1.31 × 10⁻¹³) compared to surface water correlations (r=0.53, p=1.53 × 10⁻⁷; Fig. 3). The relationship between OC and rainfall accumulation was strongest 5 d before sampling (r=0.7 OC). It should be noted that the correlation coefficient between rainfall and bottom water OC concentration was relatively stable (and above 0.6) from 5 to 30 d of accumulation before sampling.
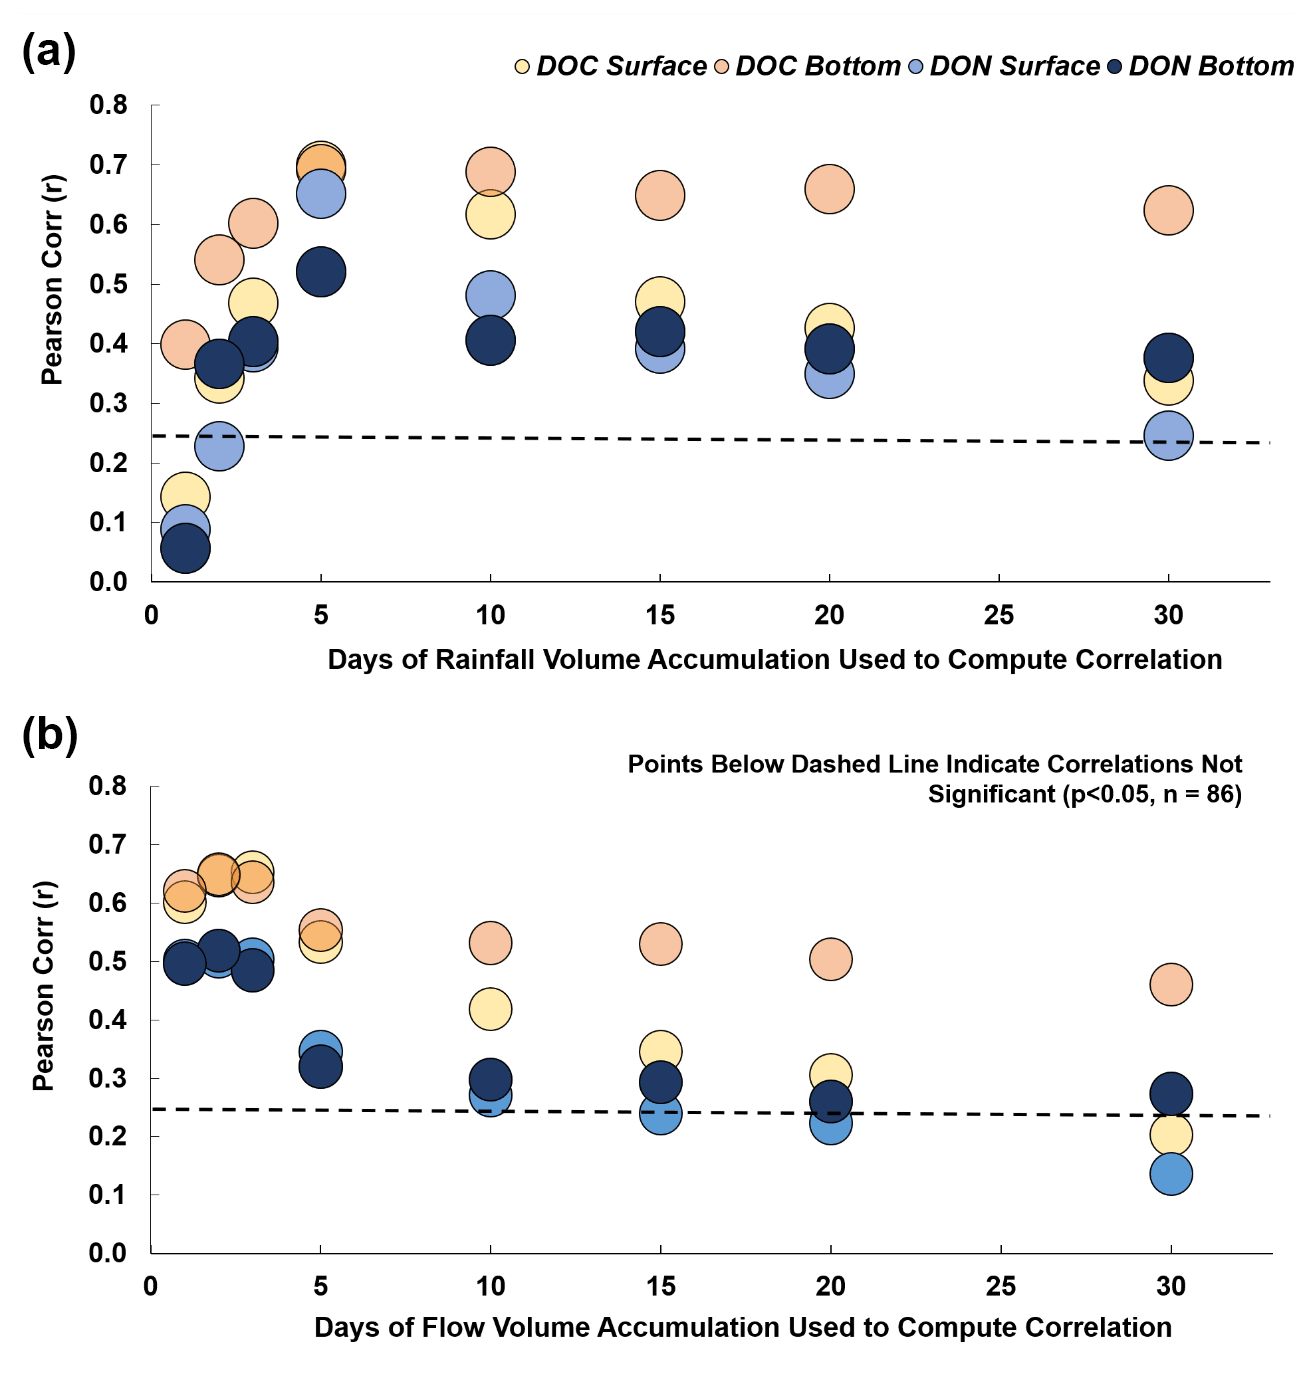
Figure 3Pearson correlation coefficients (r) (n=86) between dissolved organic C and dissolved organic N concentrations measured at the Gordon River mouth and (a) accumulated rainfall and (b) accumulated flow at the Gordon River mouth. Note that all correlations are statistically significant (p<0.05) except those circles whose centres are below the dashed line. The x axis represents the number of days over which the volume of rain or estimated flow is summed and used to compute the correlations between DOC and DON. For instance, 5 d rainfall volume is equal to the rainfall volume measured at Strathgordon gauge over the 5 d prior to water sampling at station GR1.
DON concentrations at station GR1 ranged from 0.042 to 0.43 mg L−1 in surface waters and from 0.134 to 0.46 mg L−1 at 2 m from the riverbed. As observed with the OC samples, ON concentrations were significantly correlated with rainfall, although the strength of this relationship was more modest in comparison. Daily average rainfall correlation coefficients from surface and bottom samples ranged from r=0.33 (p=0.0062) to 0.47 (p=8.0 × 10⁻⁵) respectively. The strongest correlation observed between rainfall and DON concentration was found using rainfall accumulation 5 d prior to sampling (r=0.65).
Rainfall and estimated flow were significantly correlated with TKN (greatest observation was r=0.65, 5 d accumulation) and NO concentrations (greatest was 10 d prior to sampling). The nature of the relationships between rainfall and NO concentration differed based on water sampling depth. Correlations between rainfall and NO concentrations 2 m off the riverbed were positive (strongest relationship r=0.49, 5 d accumulation before sampling), but surface water concentrations were negatively correlated (strongest relationship , 10 d accumulation before sampling). No significant relationships were observed between rainfall/estimated river flow and NH3.
Two-way ANOVA (and subsequent Tukey's HSD post hoc tests) revealed that DOC loading (calculated from samples collected at 2 m depth and 3 d flow accumulation) significantly (p=0.0478) varied with season. Winter (June to August) loadings (mean loading 642.8 ± 48.0 t d−1) were significantly greater than summer (December to February) loadings (mean loading 430.4 ± 57.8 t d−1) (Fig. 4). The maximum OC loading rate was observed in May 2016 at 1227 t OC d−1. Similar patterns and seasonal relationships were observed for ON loading.
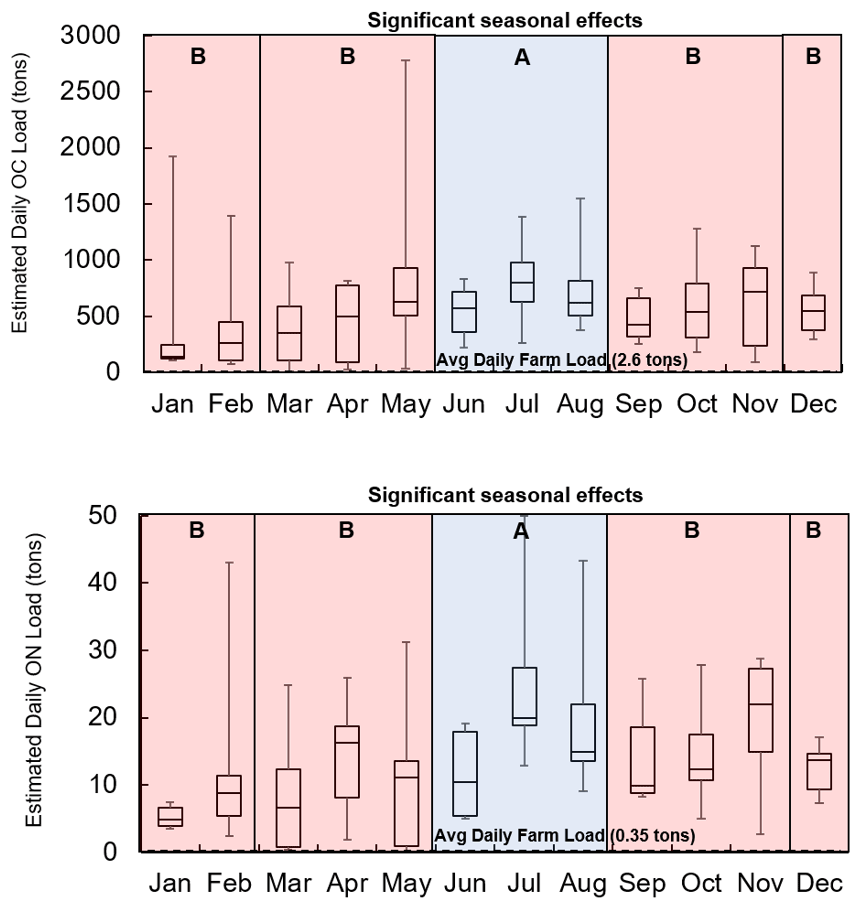
Figure 4Daily OC and ON loading (tons) for each month based on estimated daily flows and concentrations of OC and ON measured at the Gordon River mouth from 2015 to 2021. Note the large variation in the month of May is driven by large flows in years 2015 and 2016. Dashed line indicates average daily OC and ON loading from farm feed inputs based on 10 000 t annual production, feed conversion rate = 1.3, assimilation rate of 85 %, 49 % feed carbon content, and 6.7 % feed nitrogen content. Post hoc groupings show significantly higher loads in winter depicted as blue boxes (denoted Group A) relative to other seasons as red boxes (denoted Group B).
3.3 Dissolved oxygen distribution
Dissolved oxygen concentrations in Macquarie Harbour exhibited strong stratification and ranged from suboxic (<1 mg L−1) in the deep basins to over 10 mg L−1 at the surface (Fig. 5). Below the surface lens of well-oxygenated water, there was a mixing zone of approximately 10 m where DO concentrations rapidly declined, and salinity increased. Consequently, the waters below the mixing zone (referred to as basin water) were more saline and DO-poor than the surface waters.
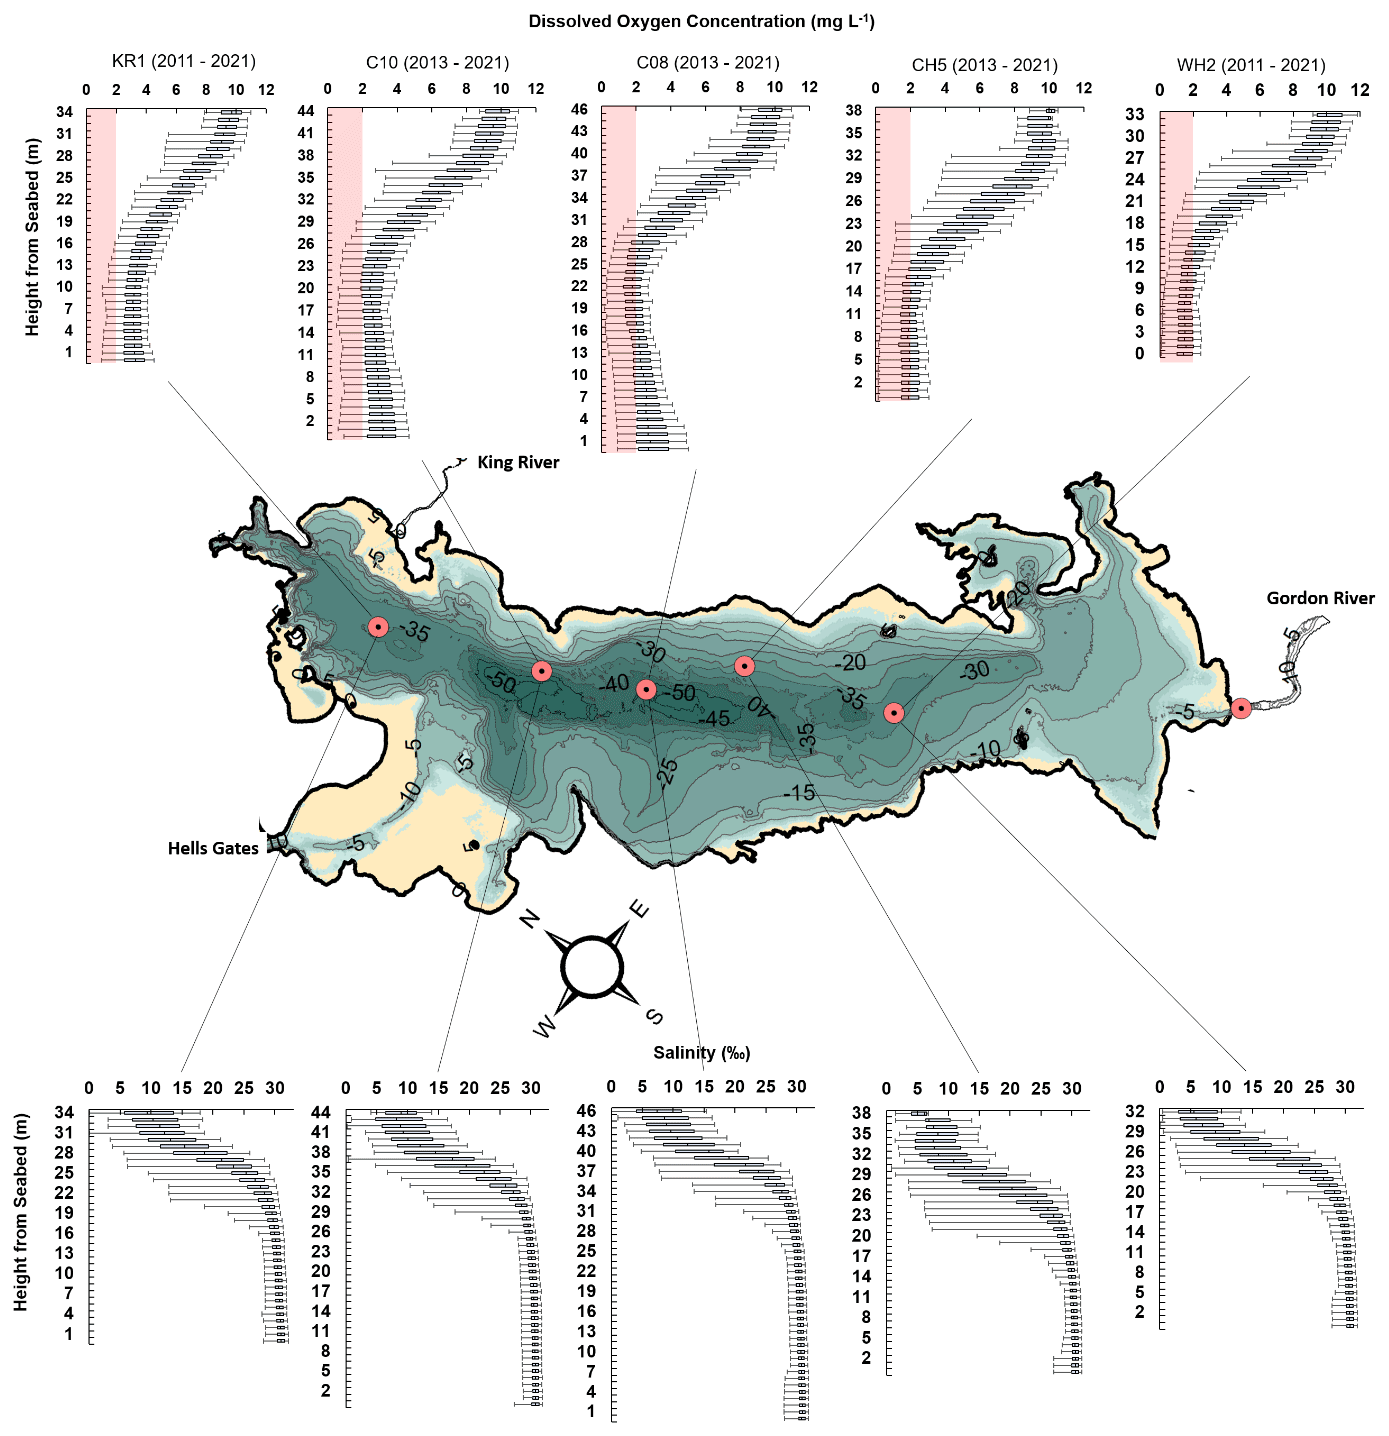
Figure 5Box plots of dissolved oxygen concentration (mg L−1) and salinity monthly profiles. Extent of dataset for each site is specified above the plots. Note vertical resolution is 1 m and references height from the seabed. Hypoxic (<2 mg L−1) conditions are highlighted in red.
Harbour basin waters closest to the ocean endmember generally had higher DO concentrations (i.e. means of approximately 4 mg L−1 observed at stations KR1 and C10; Figs. 5 and 6). Towards the Gordon River, basin water DO concentrations were lower and were more often observed to be hypoxic (<2 g L−1) or suboxic (<1 mg L−1). At stations near the ocean endmember (also the harbour's deepest basins; C10 and C08), the DO concentration and salinity were often observed to increase with depth. This water mass is the product of DWR (see Hartstein et al., 2019).
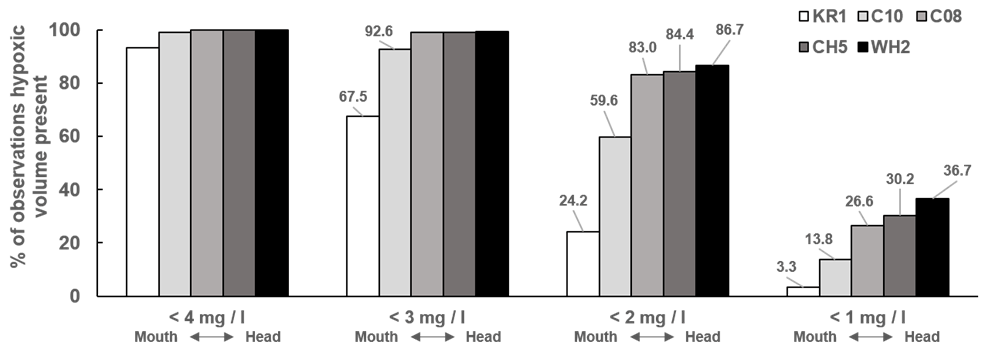
Figure 6Percentage of total observations where monthly sonde profiles contained dissolved oxygen measurements less than 4, 3 mg L−1, hypoxic water (<2 mg L−1), and suboxic (<1 mg L−1) water at any depth.
Our box model of harbour basin waters indicates there is often hypoxic (<2 mg L−1) water present in the system and prolonged periods of suboxia (<1 mg L−1) (Fig. 7). The most prolonged period of sustained suboxia occurred from June 2015 to May 2017. The largest volume of suboxic water was observed in May 2014 at over 60 × 106 m3. The frequency of hypoxic and suboxic observations at any one station increased with proximity to the Gordon River mouth. For example, while station C10 experienced suboxia 13.8 % of the time (of 96 months), station WH2 experienced suboxic conditions in nearly 37 % of observations (of 120 months; Fig. 6).

Figure 7Estimated hypoxic volume present in the harbour from 2014 to 2021 based on our 1 m resolution box model. Deep water renewal events are denoted by black arrows.
3.4 Rainfall and dissolved oxygen
There were significant correlations between rainfall and DO concentration along the entire harbour longitudinal axis (Fig. 8). However, the correlation's strength, significance, and direction varied with depth.
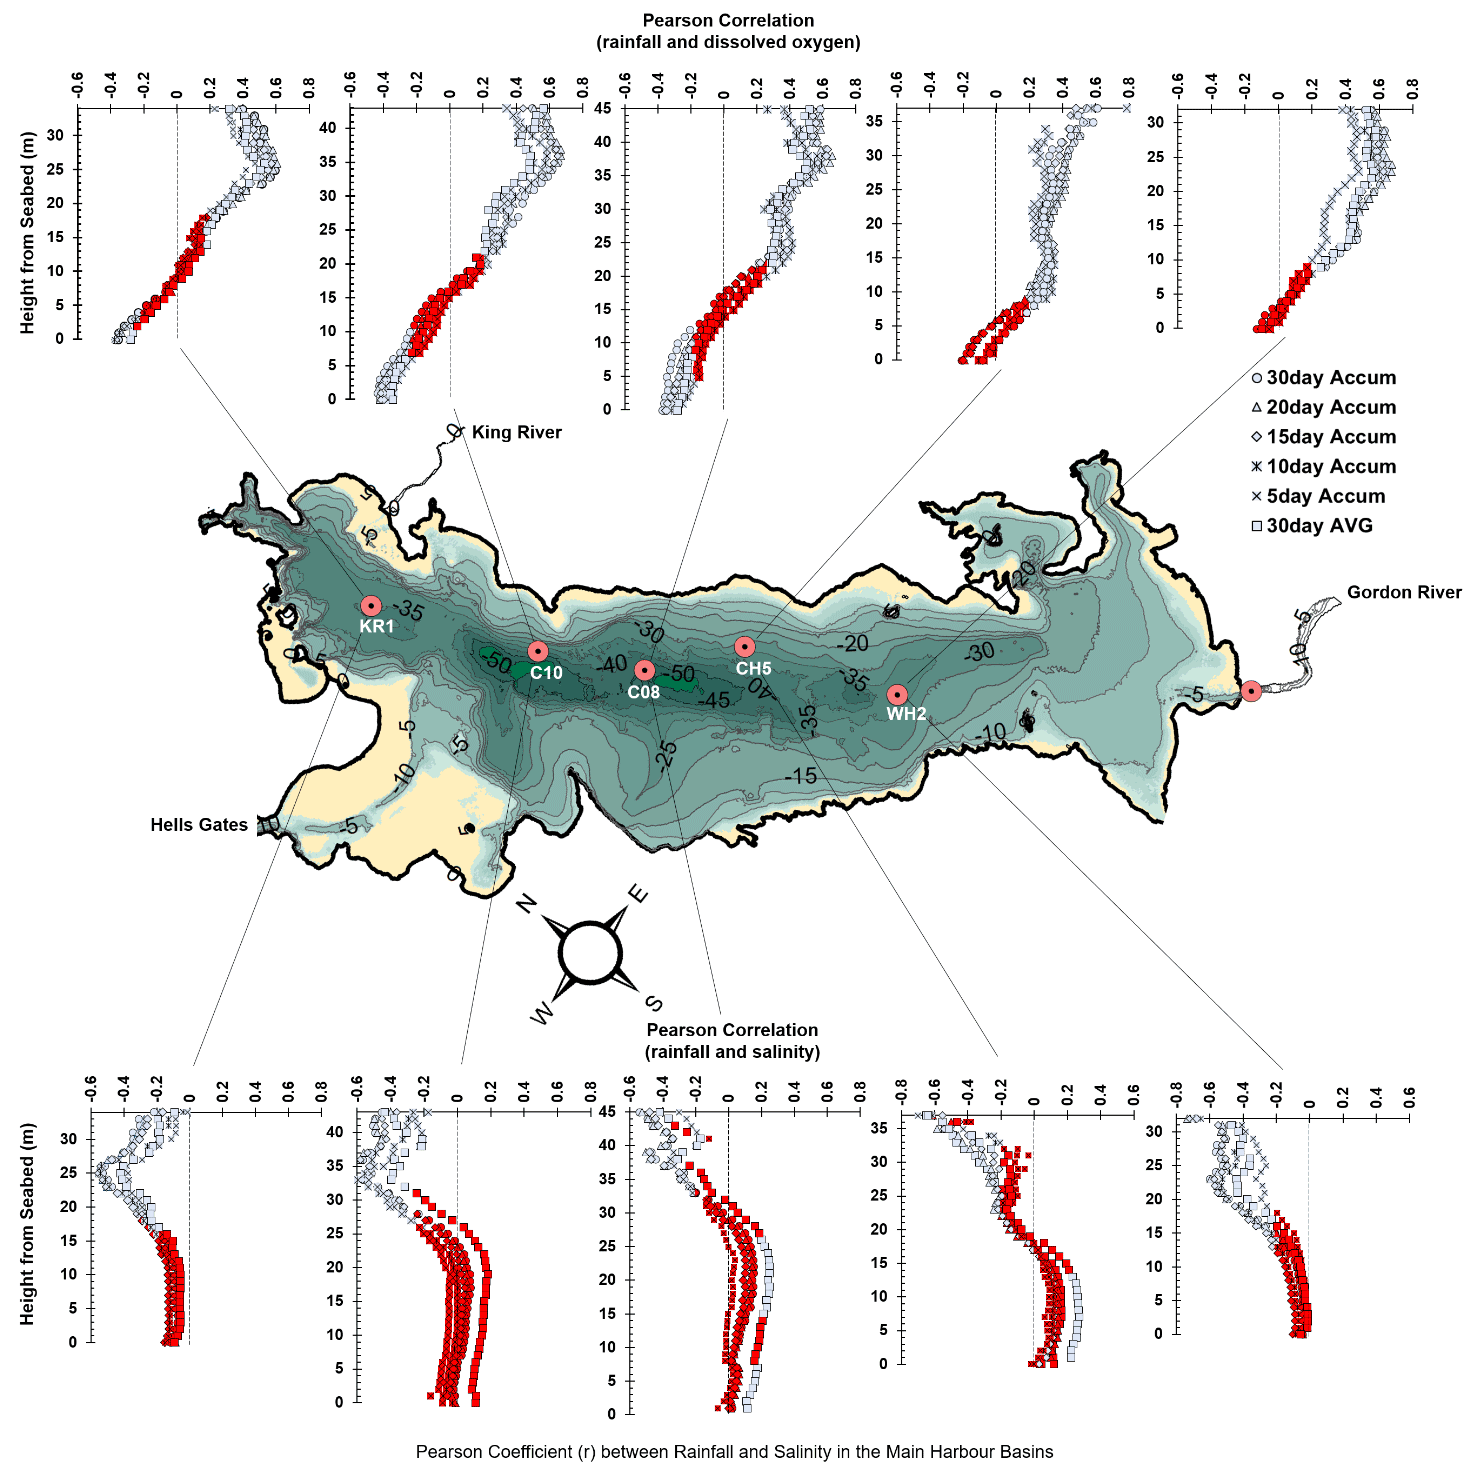
Figure 8Pearson correlation coefficients (r) between rainfall and dissolved oxygen (top) and rainfall and salinity (bottom) through the water column at 1 m vertical resolution. Selected rainfall metrics include accumulation 30 d prior to sampling (circles), 20 d (triangles), 15 d (diamonds), 10 d (asterisk), and 5 d (x) accumulation, and 30 d average daily rainfall prior to sampling (squares). Red symbols denote statistically insignificant correlations (p<0.05). Vertical dished lines represent r=0.
In the surface waters and through the mixing zone, the correlation between rainfall and DO concentration was positive (increased rainfall was observed with increased DO concentrations) and waned with depth (r=0.6 6 to 8 m below the surface at stations KR1, C10, and C08) (Fig. 8). Towards the Gordon River at station WH2, the strongest correlation (r=0.677, p=2 × 10⁻¹⁷) was observed at approximately 10 m depth with the rainfall metric “20 d rain accumulation”. At all stations, the strength of the correlation between rainfall and DO concentration decreased through the mixing zone, eventually to non-significance and no relationship. Approximately 30 m below the surface, the correlation (though not statistically significant) was observed to become inversely related to rainfall at all stations (more rainfall was observed with lower DO concentrations closer to the seabed).
At stations whose monthly profiles extend into DWR waters (i.e. KR1, C10, C08), the relationship between rainfall and DO concentration strengthened and became statistically significant, though inversely related (high rainfall observed with low DO concentrations), with depth (Fig. 8). The strongest correlation along the seabed (, p=2.3 × 10⁻⁵) was observed using 20 d rainfall accumulation at station C10 3 m from the seabed. At station C08 the strongest correlation (, p=0.00034) in the basin was observed using 30 d rainfall accumulation 1 m from the seabed.
3.5 Rainfall and salinity
As observed in rainfall–DO relationships, there were significant correlations between rainfall and salinity, whose strength, significance, and direction varied with depth. There were significant inverse relationships between rainfall and salinity (i.e. more rainfall associated with lower salinity) that reached a maximum strength () 10 m below the surface for stations near the ocean endmember. In shallow water, these relationships became stronger (r is observed to approach 0.8 at CH5) closer to the Gordon River (Fig. 8). The relationship between rainfall and salinity rapidly weakened in the mixing zone to statistical insignificance.
3.6 Southern Annular Mode and dissolved oxygen
There were depth-specific statistically significant Pearson correlations between monthly SAM index values and DO concentration at each sampling station (Fig. 9). In the surface waters the correlations were negative and became increasingly more positive with depth. The strongest relationships in the surface waters occurred at stations closest to the mouth of the harbour (except for station KR1, nearest the King River mouth). The strength of the correlations weakened with depth and eventually displayed positive r values (indicating the opposite relationship). The DO at stations nearest the sill responded most strongly to SAM index values along the seabed, with statistically significant positive correlations (high SAM index associated with higher DO concentration) observed at stations C10, C08, and KR1.
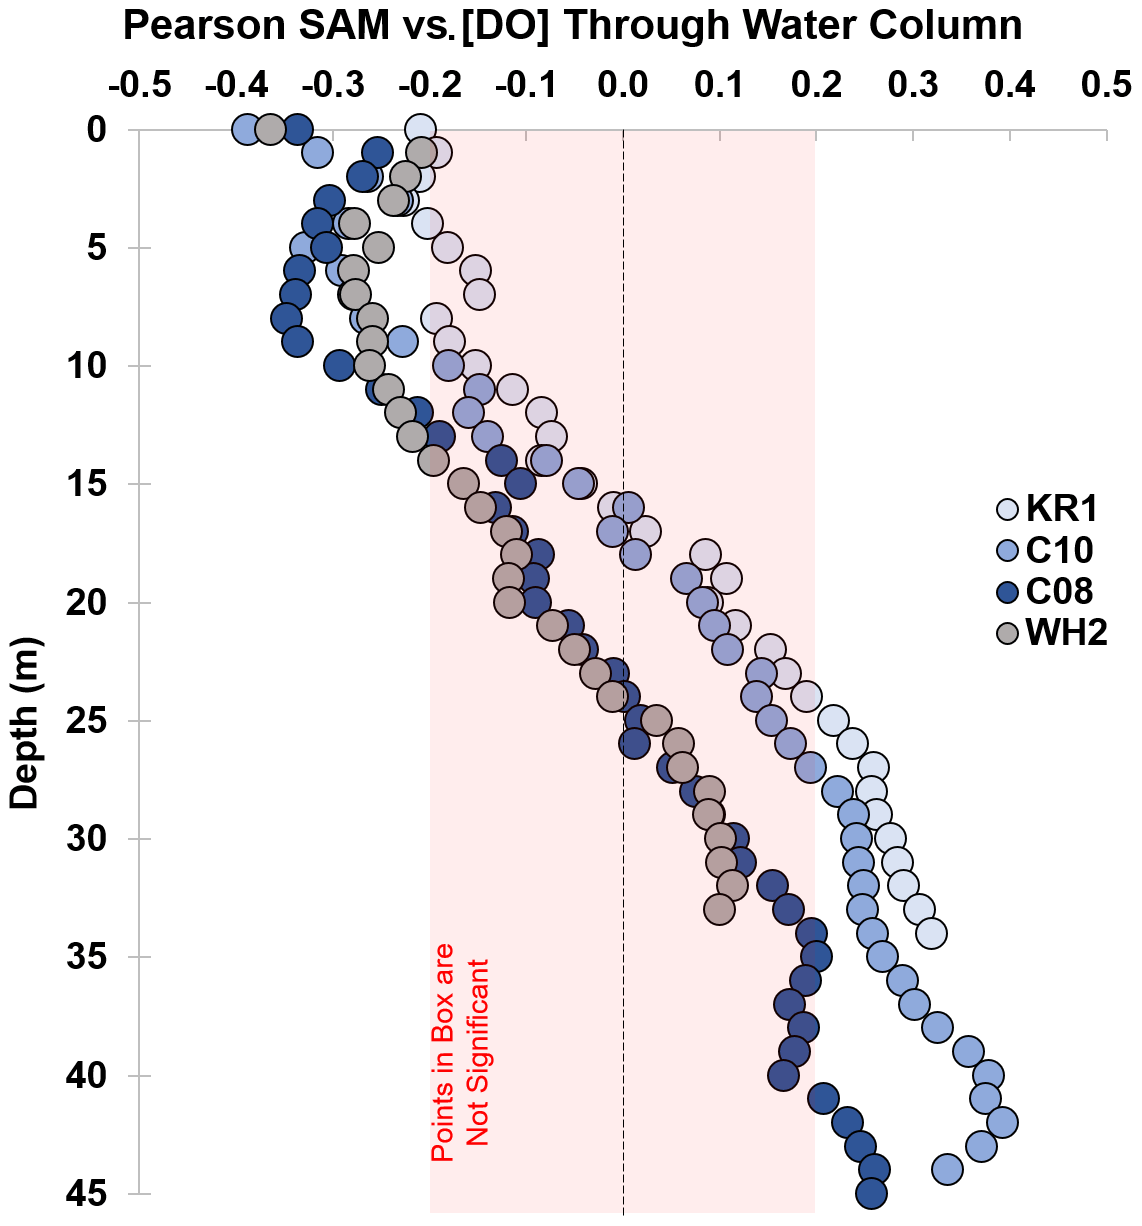
Figure 9Pearson correlation coefficients (r) between Southern Annular Mode (SAM) index and dissolved oxygen concentrations at KR1, C10, C08, and WH2 through the water column at 1 m vertical resolution. The red box denotes statistically insignificant correlations, while all points outside of the box indicate statistically significant correlations (p<0.05). Note points reference water depth and not height off seabed.
4.1 Rainfall, oxygen distribution, and implications for greenhouse gas production
The water column structure in Macquarie Harbour is similar to that of many fjord and fjord-like DCIs distributed throughout the world's mid- to high-latitude coastlines. The sill at the system's mouth sets up a strongly stratified water column isolating basin water from the surface (Inall and Gillibrand, 2011; Calvete and Sobarzo, 2011). The largest freshwater source, the Gordon River, discharges dissolved organic carbon loads (often over 500 t per day; Fig. 4; also see Appendix Fig. A1a and b for context) limiting light penetration to within the first few metres of the water column. These loads restrict photosynthesis in the system to the surface layer (demonstrated by rapidly attenuated chlorophyll a with surface concentrations of 4 to 5 µg L−1 and generally undetectable levels at 12 m; see Fig. A1c).
OC and ON loading exhibited seasonality with significantly greater loadings in winter compared to summer (Fig. 4). These loads are products of both greater flow volume and significant increases in the measured concentration of OC and ON (Fig. 3).
The lack of light penetration coupled with limited basin water exchange and large riverine OM loads makes the subsurface waters of this system, and many other similar fjord-like DCIs, naturally prone to oxygen-poor conditions (see Gonsior et al., 2008; Bianchi et al., 2020). The distribution of dissolved oxygen in Macquarie Harbour is closely tied to the physical separation of the water masses. DO is greatest in surface waters near system endmembers (Fig. 5), while hypoxia forms regularly and with varying intensity for extended periods in its basins. Below the freshwater lens, DO <4 mg L−1 occurs in >90 % of observations, and hypoxia (<2 mg L−1) was observed more than 80 % of the time (stations C08 towards WH2; Fig. 6). Suboxic (<1 mg L−1) concentrations are observed at every station but more often (up to 36 % of the time) at stations closest to the Gordon River. Suboxic conditions have persisted for up to 2 years (Fig. 7).
The primary mechanism by which basin water is re-oxygenated is the intrusion of ocean water over the sill (i.e. DWR). DWR occurs regularly (see Hartstein et al., 2019) but according to our analysis only five to seven times per decade for volumes significant enough to relieve suboxic conditions up-harbour (see Fig. 7). The drivers of DWR were examined in Hartstein et al. (2019) and included sustained N and NW winds and low (<990 hPa) atmospheric pressure. One of the DWR drivers not entirely resolved was the role of freshwater inputs into the system. Our analysis of rainfall and DO distribution suggests that during periods of high rain (i.e. winter), DO tends to be lower just above the seabed (Fig. 8). During periods of low rainfall (i.e. summer), DO above the seabed is higher. Correlations between rainfall and DO concentration were not statistically significant through a large portion of the sub-halocline but with depth became statistically significant a few metres above the seabed (see Fig. 8). This depth-dependent relationship between rainfall and DO suggests that the amount of river water entering the system is an important driver of DWR and thus the distribution of DO.
Our analysis shows that with increased rainfall, DOC and DON loading increases as a result of both increased river flow and increased concentrations of DOC and DON present in the water (Fig. 3). The majority of the additional OM entering the system is primarily dissolved and likely retained in the surface lens where DO concentrations are at their highest. It is important to note that Macquarie Harbour is a “black water system” with relatively low chlorophyll a concentrations at the surface and undetectable levels in the halocline (in this case 12 m depth). The contribution of phytoplankton production to eutrophication would be limited by poor light availability. Undoubtedly some river-derived OM will reach the dark sub-halocline layers and depending on its lability will contribute to the removal of dissolved oxygen from the water column through respiratory processes. With increased rainfall riverine OM contributions to the basins could increase (increased eutrophication), thus increasing oxygen demand and decreasing the standing oxygen concentration. However, in a previous study (Maxey et al., 2020) the effect of increased riverine OM loading on the rate of basin water column oxygen demand was not significant (although they only measured this process for 6 months), suggesting that much of the riverine OM is flushed outside of the system and/or is mostly refractory material. Rainfall in the Macquarie Harbour catchment is influenced by the oscillations of the Southern Annular Mode (SAM). Our analysis also showed that SAM index values significantly correlated with DO conditions in the surface and near-bottom layers. Positive SAM index values were associated with lower DO in the surface waters and higher oxygen concentrations in the basins nearest the sill (Fig. 9). Positive SAM index values indicate high pressure in the Southern Hemisphere mid-latitudes, leading to weaker westerly winds (Taschetto and England, 2009; Dey et al., 2018). For the west coast of Tasmania, weaker westerly winds result in less moisture captured by the mountain ranges that form the eastern edge of the harbour's catchment, and subsequently, less rainfall occurs. Less rainfall in the catchment means less river flow to the harbour, which promotes DWR and relieves deep basin hypoxia. Austin and Inall (2002) observed similar broad-scale climate oscillations (in this case, the North Atlantic Oscillation) affecting the basin water in Scottish sea lochs.
Rainfall metrics and the effect of SAM only significantly correlated with surface waters and the deeper basin waters of the harbour (Figs. 8 and 9). Without a direct supply of oxygen from either physical mixing or photosynthesis, the slow but steady uptake of DO by microbes (into heterotrophic (e.g. aerobic respiration) and autotrophic (e.g. ammonia oxidation) pathways establishes oxygen-poor conditions (Maxey et al., 2020). The low light and suboxic conditions often present in the sub-halocline up-harbour likely promote DO uptake by nitrifying microbes. Depending on the amount of available DO, the eventual end product of ammonia oxidation (first step of nitrification) may differ (Arrigo, 2005; Codispoti et al., 2005; Lam and Kuypers, 2011). At suboxic concentrations, ammonia oxidation begins to favour the production of N2O (a potent greenhouse gas – GHG) over NO (Goreau et al., 1980; Ji et al., 2018; Frey et al., 2020). Da Silva et al. (2021) observed significant differences in the microbial communities present in the harbour's basin waters, with communities comprising a more significant proportion of GHG producers than in the surface waters. Our improved understanding of the drivers and oxygen distribution in the system seems to corroborate their findings. Their observations of community composition and our DO distribution observations in the harbour suggest that the basins' communities are primed for GHG production during periods of prolonged suboxia.
The eventual fate of riverine OC and ON entering the harbour's basins will depend upon the oxygen conditions present. Suboxic DO conditions favour the production of GHGs such as CH4 and N2O, and the lack of large DWR events promotes suboxic basin water conditions. High freshwater inputs are associated with low basin water DO, and we postulate that this is due to the impediment of DWR. In Macquarie Harbour and DCIs with constricted inlets and large rivers, the physical effects of rainfall or river flow (as driven by broader climate forcings like SAM) may be tied to the eventual fate of C and N entering the system (Fig. 10).
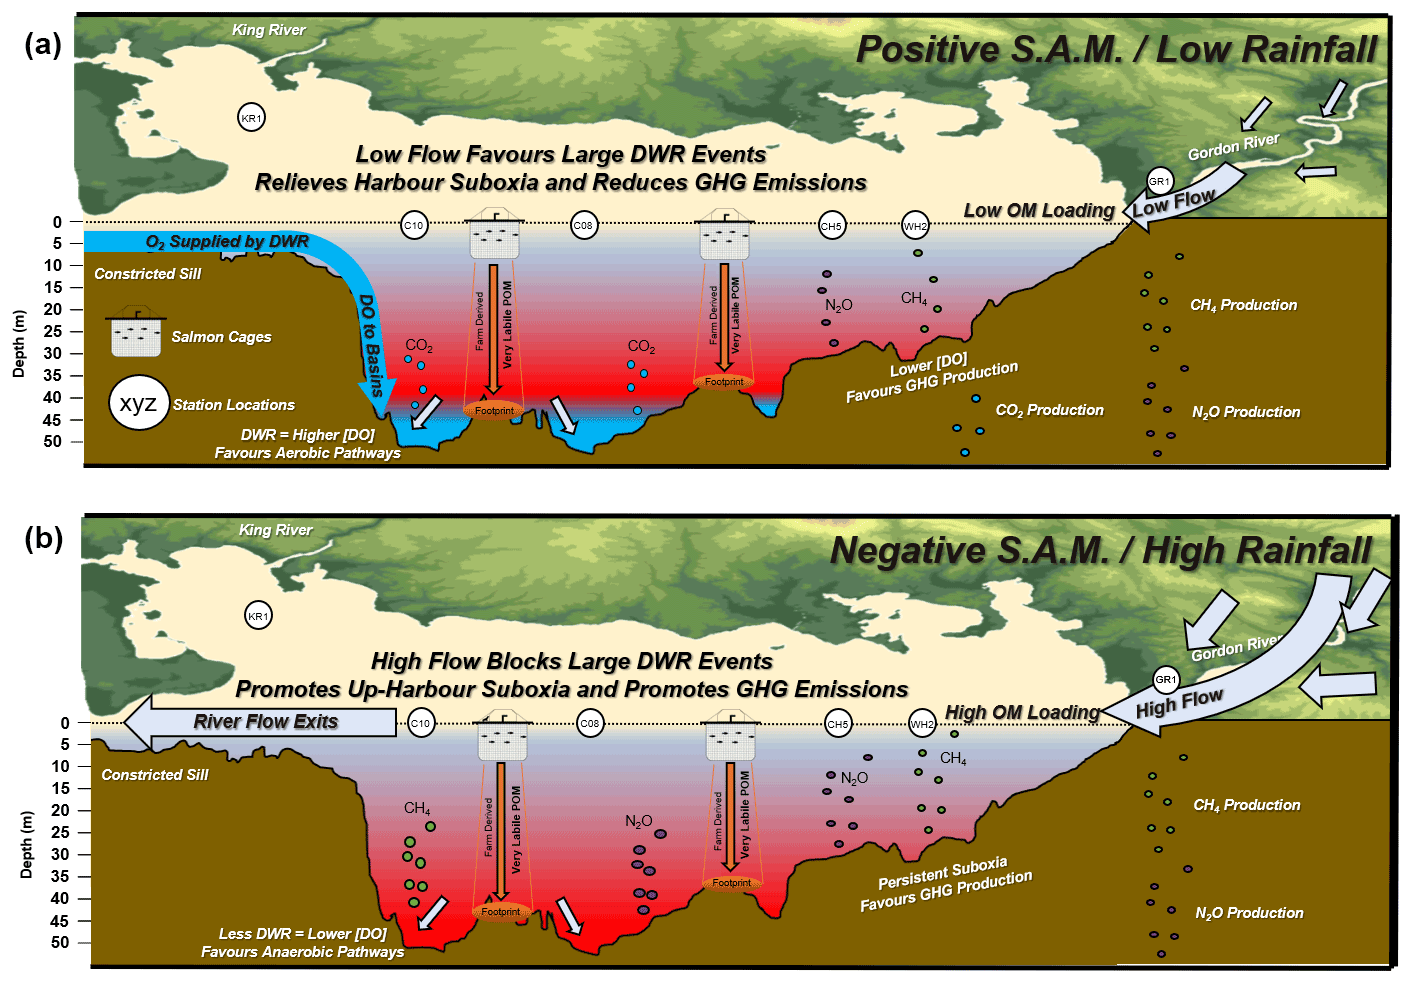
Figure 10Conceptualisation of the role of freshwater inputs on the distribution of DO and potential for GHG production in the harbour. (a) Harbour DO and GHG during periods of low rainfall (or positive SAM index) promoting DWR. (b) High rainfall (negative SAM index) blocks DWR and promotes the spread of suboxia and thus GHG production.
4.2 Climate change predictions for Tasmania's west coast and dissolved oxygen
Climate change predictions for the west coast of Tasmania suggest that there will be greater and more intense rainfall in the winter and lower rainfall in summer (Viney et al., 2009; Grose et al., 2010; Bennett et al., 2010). Increased rainfall means greater river flow and OM loading (Figs. 2 and 3) and is associated with decreased basin water DO in this system (Fig. 8). High winter river flow may reduce the chances of significant DWR events and promote prolonged basin water suboxia by stimulating pelagic oxygen demand through increased riverine OM loading (Maxey et al., 2020; Fig. 10).
While large DWR events have occurred during both summer and winter, they are infrequent (see Hartstein et al., 2019). Increased winter river flow may reduce the chance of DWR occurrence by blocking marine intrusions over the sill; this would result in more extended periods of basin water suboxia and GHG production. An analysis of the weather station wind data available from 1993 to 2014 at Cape Sorell (near Hells Gates inlet; see Fig. 1 for location) shows that wind conditions required for DWR (sustained N and NW winds; Hartstein et al., 2019) are more frequent (over 30 % of the time) in winter compared to summer (18 % of occurrences). If the climate predictions discussed in Grose et al. (2010) and Bennett et al. (2010) are realised, then this may result in a disproportionate reduction in significant DWR events for the harbour and increased GHG emissions. Likewise, if winter rainfall is reduced, DWR may become disproportionately more frequent, thus reducing potential GHG emissions.
It is the orientation of Macquarie Harbour that makes N and NW winds a significant driver of DWR. Sustained winds from this direction push water up the harbour's longitudinal axis, creating wind set-up at the head of the system and obliging marine water to cross the sill (Hartstein et al., 2019). Upon entering the main harbour body, the oxygen-rich dense marine water mass sinks into the deepest basins. If climate change affects the frequency and duration of wind occurring in N and NW directions, DWR (and GHG emissions) may be affected through an additional mechanism independent of rainfall (e.g. changes in wind direction).
There is some evidence that climate forcings (like SAM) have been significantly strengthening winds and waves along Tasmania's west coast since the 1970s (see Hemer and Griffin, 2010; Hemer et al., 2010; Kirkpatrick et al., 2017; Marshall et al., 2018; Sharples et al., 2020). If climate-driven increases in wind speed result in changes to the N and NW wind patterns, then this may have implications for DWR frequency in the harbour. Likewise, increased wind and wave forcings have been suggested as a cause for further sedimentation of the harbour mouth (Sharples et al., 2020), which would constrict the sill and impede DWR. At the moment, the confluence of large-scale climate drivers (e.g. increasing SAM; climate-driven winds and rainfall patterns) makes predicting future DWR patterns (and the resulting GHG release) in Macquarie Harbour a difficult task.
In other fjord and fjord-like DCIs, the predicted impact of climate change on rainfall varies, as does each system's sensitivity to freshwater input for DWR. In scenarios where freshwater input is the important driver of bottom-water oxygenation – for instance, lochs Etive (in Edwards and Edelsten, 1977; Austin and Inall, 2002) and Ailort (in Gillibrand et al., 1996) – increased freshwater supply may increase the extent and duration of hypoxia and thus GHG emissions. Less frequent DWR may be further exacerbated by coastal deoxygenation (see Keeling et al., 2010; Levin and Breitburg, 2015; Wang et al., 2017; Gupta et al., 2021). In such systems with coastal deoxygenation, the oxygen mass introduced to basins will be lower, further promoting hypoxia and potential GHG release.
One of the critical factors buffering GHG releases from these systems is the well-oxygenated surface water layer. Some portion of the dissolved CH4 produced in sediments and suboxic regions of the harbour might be oxidised upon reaching more normoxic regions (Reeburgh, 2007). In many systems the relatively high concentrations of CH4 produced in deeper anoxic portions of the system are observed to be reduced in surface layers (e.g. Storfjorden in Mau et al., 2013; Pearl River Estuary in Ye et al., 2019; Saguenay Fjord in Li et al., 2021). Nevertheless, the concentration of CH4 at the surface can often be observed at supersaturated concentrations which will thus still be sources of CH4 to the atmosphere. The ebullition of GHG produced in sediments can also shuttle CH4 to the surface before it is fully oxidised. This process is heavily influenced by physical factors such as sediment grain size (higher magnitudes in finer sediments) and hydrostatic pressure (Liu et al., 2016; De Mello et al., 2018). In Macquarie Harbour, and many DCIs, the areas most prone to suboxia are areas where the underlying seabed is composed of fine-grained organic-rich riverine sediment (Carpenter et al., 1991; Teasdale et al., 2003). Additionally, the water level (and thus hydrostatic head) in the harbour and many other systems varies with freshwater supply and would also contribute to the ebullition of CH4.
Whether the magnitude of climate-induced GHG emissions from DCIs is significant enough to accelerate further climate change (and thus further accelerate GHG emissions through a positive feedback loop) (Fig. 10) remains to be seen. While the oceanographic mechanisms by which fjord-like DCIs operate are similar, their unique morphologies and surrounding landscapes and hydrology must be better understood to account for their potential as sources of GHG under future climate scenarios. In order to better manage resource use affecting these systems (e.g. hydroelectric dams, salmon farms, discharge outfalls), understanding the connection between the physical processes (such as freshwater supply, weather patterns, DWR) and biogeochemical processes (pelagic oxygen demand, CH4 and N2O production, CH4 oxidation) needs to be established.
4.3 Harbour management implications
Resource use in Macquarie Harbour is similar to that of many DCIs. The relatively deep, cool, and oxygen-rich sheltered waters provide an excellent location for sea cage salmon aquaculture (Gillibrand and Turrell, 1997; Skogen et al., 2009; Inall and Gillibrand, 2010). Sea cage culture requires the fish to be immersed in their environment, and in Macquarie Harbour the areas where farms are situated span some of the area over the deepest basins (Fig. 1). Significant DWR events, like those occurring in May 2015, can cause physical disturbances to water column structure (e.g. internal waves) that significantly affect fish farms. The May 2015 event, for example, caused internal waves that transported oxygen-poor bottom water to the surface (Hartstein et al., 2019). Because rainfall affects DWR, the predicted increase in winter intensity may reduce the chances of significant DWR events and thus reduce the likelihood of adverse physical disturbances to fish farms. On the negative side, farm-derived feed and faeces waste represent a highly labile source of OM to the seabed.
Farm waste footprints may be hotspots of GHG production, but the magnitude of that production is still largely undescribed. If climate change reduces the frequency of DWR, the processing of farm-derived OM may be less efficient as less oxygen will be available to fuel aerobic respiration (Brooks et al., 2000; Hartstein, 2003; Pereira et al., 2004). This may lead to possible increased GHG production and will facilitate the spread of Beggiatoa matting (Crawford et al., 2001; Crawford, 2003). Presently, no studies describe the rate of the GHG output under salmon farms in any of these systems, leaving open a significant knowledge gap for future aquaculture and GHG research.
Rainfall is not the only driver of river flow into the harbour. The Macquarie Harbour catchment has two upstream hydroelectric dams regulating flow into the main rivers. Dam release water introduces additional particulate organic carbon and DOC load, especially during low reservoir periods (MHDOWG, 2014). These releases may impact DWR by blocking events that might otherwise have occurred. Given the infrequency of large DWR events and their important role in mitigating basin water suboxia, it seems prudent for hydroelectric management to consider the implications of ill-timed releases on harbour health and their subsequent impacts on GHG production.
In summary, rainfall significantly affects OM and nutrient concentrations entering Macquarie Harbour. Importantly, rainfall is seasonal and has a significant depth-specific impact on the distribution of dissolved oxygen in the harbour body. It appears that the impact of rainfall on basin water hypoxia is driven by physical forcings, namely the impediment of DWR.
The Southern Annular Mode (SAM) climate oscillation index also significantly correlates with DO concentrations in the surface layer and a few metres above the seabed. However, the direction of the correlation is layer-specific. The SAM index is highly variable but has been increasing in recent decades. Climate change is predicted to result in wetter winters and drier summers for the Tasmanian west coast, resulting in fewer DWR events in winter and more frequent and intense DWR events in summer.
Currently, there is no information describing the distribution of CH4 and N2O in Macquarie Harbour or how this varies with river loading. However, the DO distribution suggests that most of the production will be near the Gordon River mouth (e.g. stations CH5 and WH2). If DWR is stymied in winter by increased rainfall, the suboxic conditions promoting GHG production may become even more prolonged, especially up-harbour.
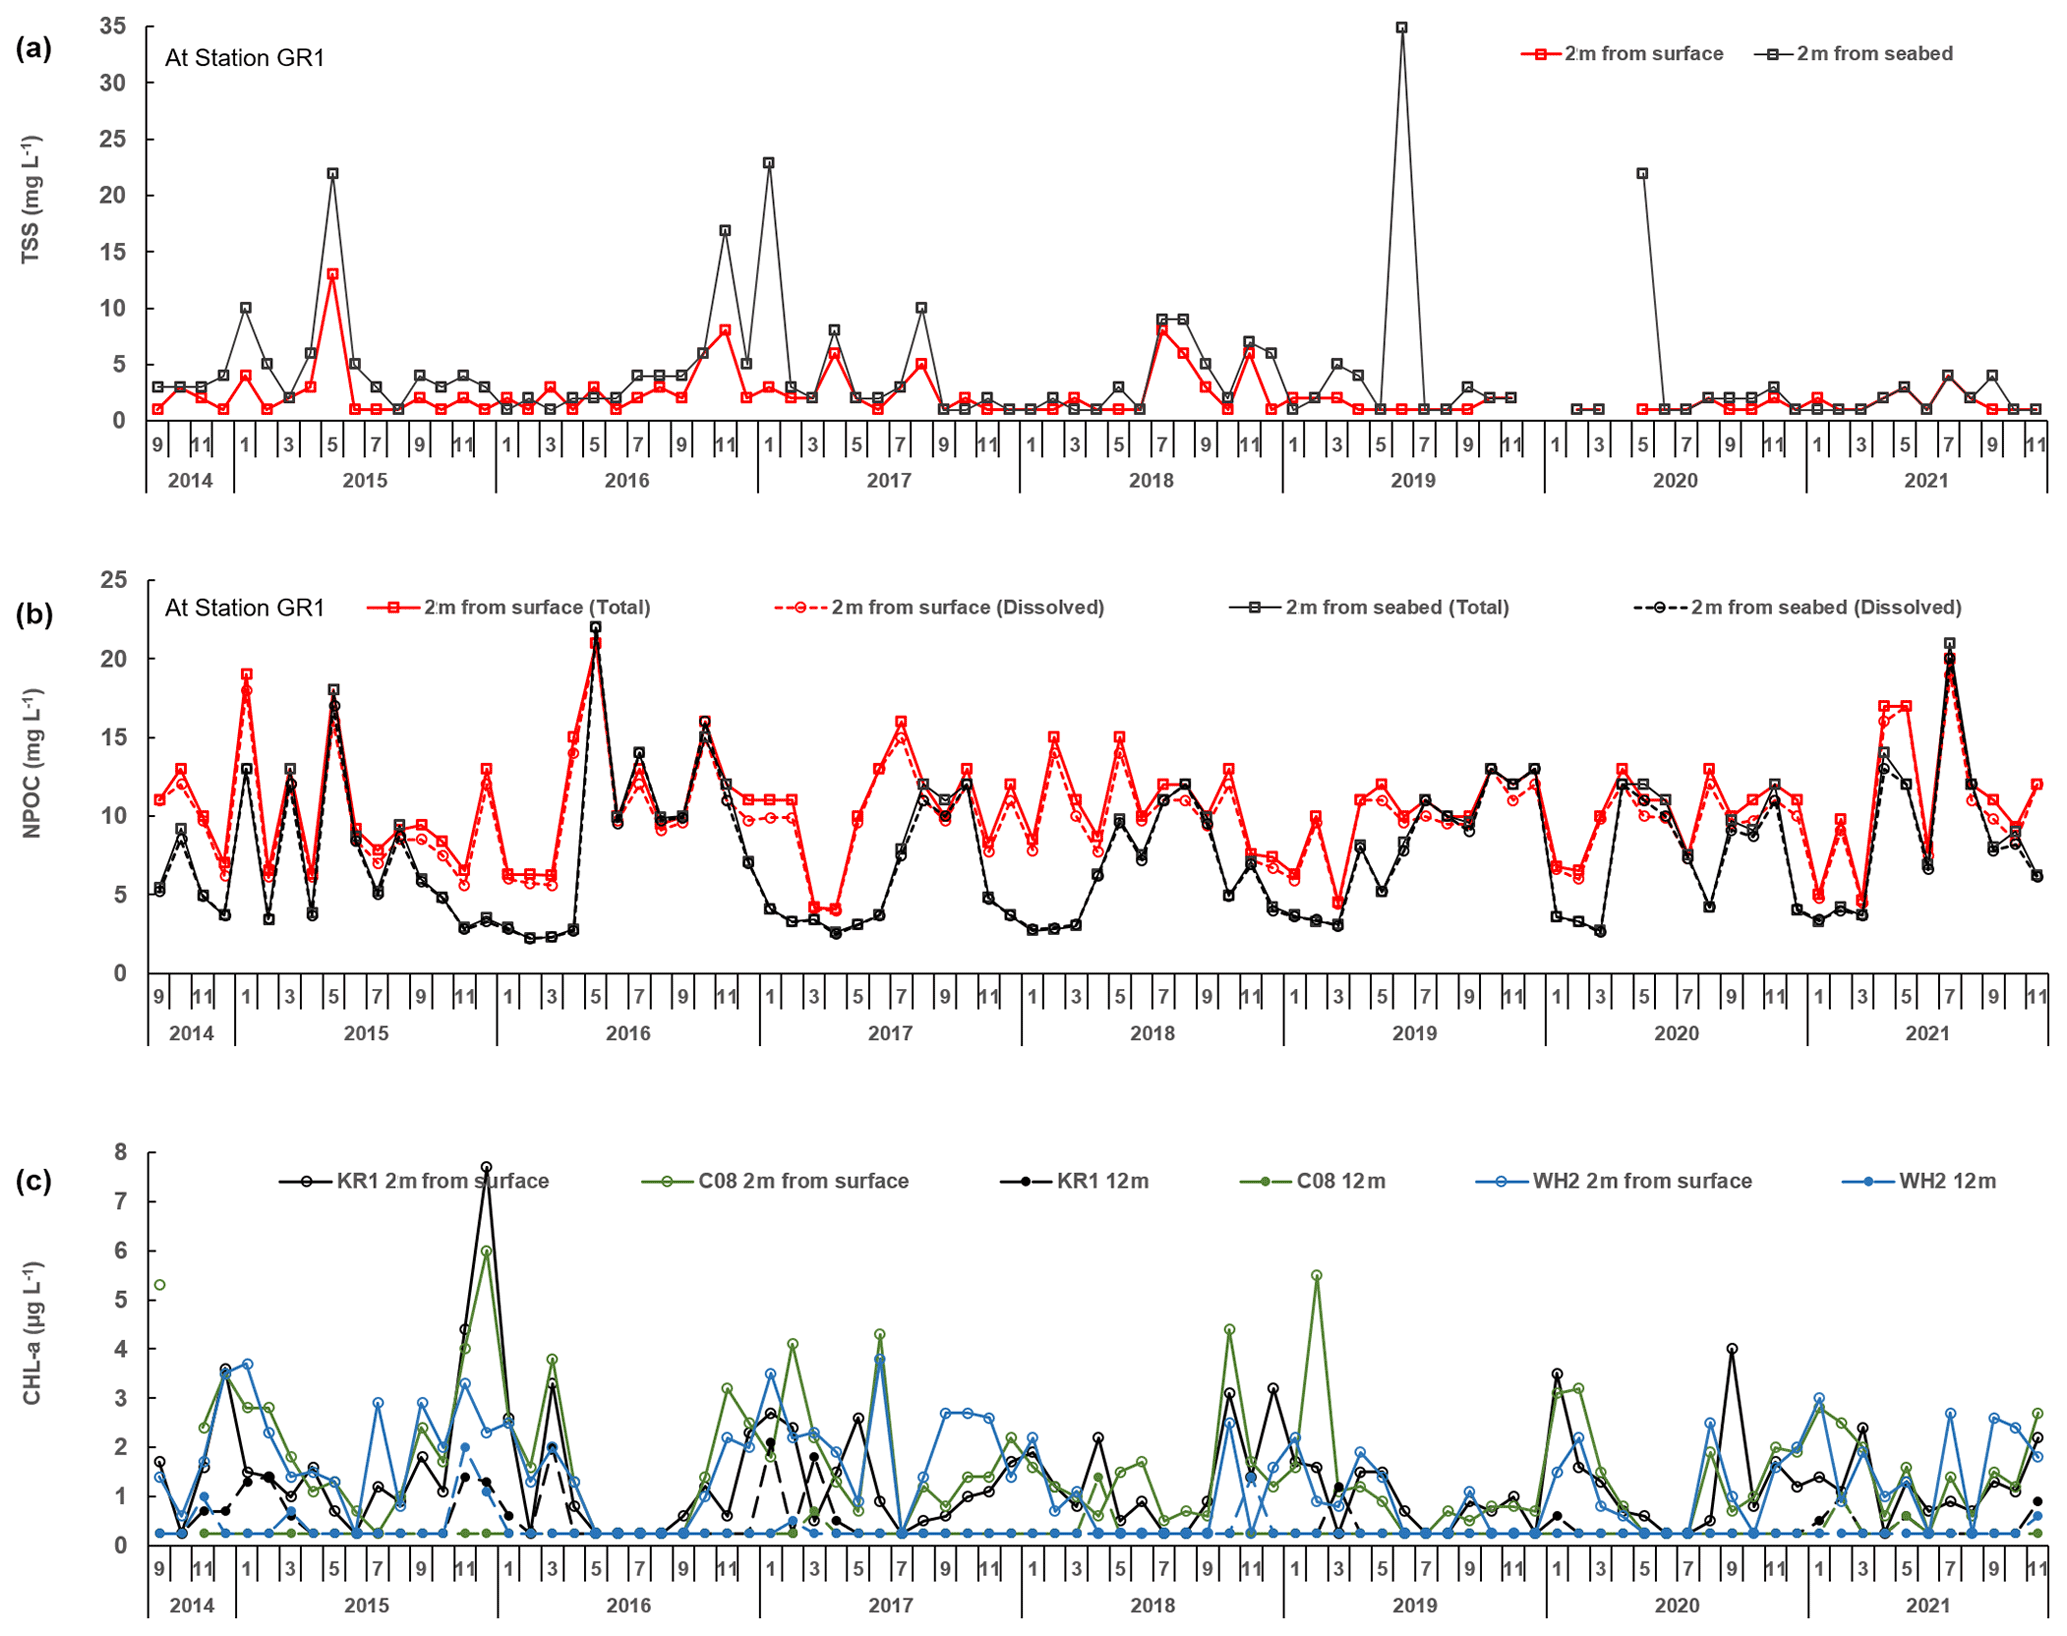
Figure A1(a) Total suspended solids concentrations observed at station GR1. Samples collected 2 m from surface (red) and 2 m from seabed (black). (b) Total organic carbon (solid lines) and dissolved organic carbon (dashed lines) concentrations observed at station GR1. Samples collected 2 m from surface (red) and 2 m from seabed (black). (c) Chlorophyll a collected from stations KR1 (black), C08 (green), and WH2 (blue). Samples collected 2 m from surface (solid lines, open symbols) and 12 m from surface (dashed lines, closed symbols). All data displayed reflect dates from September 2014 to November 2021 and are used here as an example of Macquarie Harbour water column properties.
Please contact authors regarding data availability.
JDM was responsible for conceptualisation, field collection, analytical methodology, data analysis, writing the original draft, review, and editing. NDH was responsible for conceptualisation, field collection, analytical guidance, writing, review, editing, and funding. AM was responsible for writing, review, and editing. MM was responsible for analytical guidance, writing, review, editing, and funding.
The contact author has declared that neither they nor their co-authors have any competing interests.
Publisher’s note: Copernicus Publications remains neutral with regard to jurisdictional claims in published maps and institutional affiliations.
We would like to thank Analytical Services Tasmania for their help in clarifying methods descriptions and general discussions about the implications of analytical methods. Appreciation to Hydro Tasmania and the Bureau of Meteorology for providing links to rainfall and river flow data within the Gordon River catchment. We want to thank the vessel operators for their tireless efforts during the many inclement weather days spent with us on the harbour (Sam and Sean Gerrity, the late Trevor Dennis, Torsten Schwoch, and Ryan Gunton) and the many technicians responsible for helping to collect portions of this field dataset (Justyn Chew Hui Loo, Dorathy Penjinus, Grace Wong Szu Yie, Shukry bin Bakar, Mohd Amirul Syafiq Ismail). We would also like to thank our families for supporting those long days away from home and hours spent in front of the screen to get this information and its implications published – we had to borrow the time from you, and we are grateful.
This research has been supported by the Newton-Ungku Omar Fund (grant no. NE/P020283/1) and by ADS Environmental Services internal grants.
This paper was edited by Tyler Cyronak and reviewed by two anonymous referees.
Arrigo, K. R.: Marine microorganisms and global nutrient cycles, Nature, 437, 349–355, 2005.
Augustinus, P., Barton, C. E., Zawadzki, A., and Harle, K.: Lithological and geochemical record of mining-induced changes in sediments from Macquarie Harbour, southwest Tasmania, Australia, Environ. Earth Sci., 61, 625–639, 2010.
Austin, W. E. and Inall, M. E.: Deep-water renewal in a Scottish fjord: temperature, salinity and oxygen isotopes, Polar Res., 21, 251–257, 2002.
Baker, W. E. and Ahmad, N.: Re-examination of the fjord theory of Port Davey, Tasmania, Papers and Proceedings of the Royal Society of Tasmania, 93, 113–116, 1959.
Bennett, J. C., Ling, F. L. N., Graham, B., Grose, M. R., Corney, S. P., White, C. J., Holz, G. K., Post, D. A., Gaynor, S. M., and Bindoff, N. L.: Climate Futures for Tasmania: water and catchments technical report, Antarctic Climate and Ecosystems Cooperative Research Centre, Hobart, Tasmania, Antarctic Climate and Ecosystems Cooperative Research Centre, ISBN 978-1-921197-06-8, 2010.
Bianchi, T. S., Cui, X., Blair, N. E., Burdige, D. J., Eglinton, T. I., and Galy, V.: Centers of organic carbon burial and oxidation at the land-ocean interface, Org. Geochem., 115, 138–155, 2018.
Bianchi, T. S., Arndt, S., Austin, W. E., Benn, D. I., Bertrand, S., Cui, X., Faust, J., Koziorowska-Makuch, K., Moy, C., Savage, C., Smeaton, C., Smith, R., and Syvitski, J.: Fjords as aquatic critical zones (ACZs), Earth-Sci. Rev., 203, 103145, https://doi.org/10.1016/j.earscirev.2020.103145, 2020.
Breitburg, D., Levin, L. A., Oschlies, A., Grégoire, M., Chavez, F. P., Conley, D. J., Garçon, V., Gilbert, D., Gutiérrez, D., Isensee, K., and Jacinto, G. S.: Declining oxygen in the global ocean and coastal waters, Science, 359, https://doi.org/10.1126/science.aam7240, 2018.
Brooks, K. M.: Salmon Farm Benthic and Shellfish Effects Study 1996–1997, Aquatic Environmental Sciences, 644 Old Eaglemount Road, Port Townsend, WA 98368, 117, 2000.
Cage, A. G.: The modern and late Holocene marine environments of Loch Sunart, NW Scotland, Doctoral dissertation, University of St Andrews, University of St. Andrews, http://hdl.handle.net/10023/15910 (last access: 23 June 2022), 2006.
Calvete, C. and Sobarzo, M.: Quantification of the surface brackish water layer and frontal zones in southern Chilean fjords between Boca del Guafo (43∘30′ S) and Estero Elefantes (46∘30′ S), Cont. Shelf Res., 31, 162–171, 2011.
Carpenter, P. D., Butler, E. C. V., Higgins, H. W., Mackey, D. J., and Nichols, P. D.: Chemistry of trace elements, humic substances and sedimentary organic matter in Macquarie Harbour, Tasmania, Mar. Freshwater Res., 42, 625–654, 1991.
Codispoti, L. A., Yoshinari, T., and Devol, A. H.: Suboxic respiration in the oceanic water column, in Respiration in Aquatic Ecosystems, edited by: del Giorgio, P. and Williams, P., Oxford University Press, 225–247, https://doi.org/10.1093/acprof:oso/9780198527084.001.0001, 2005.
Cracknell, M. J., Nascimento, S. C., Heng, W. X., Parbhakar-Fox, A., and Schaap, T. A.: Geophysical investigation of mine waste in the King River Delta, Macquarie Harbour, Tasmania, ASEG Extended Abstracts, 1, 1–4, 2019.
Crawford, C.: Environmental management of marine aquaculture in Tasmania, Australia, Aquaculture, 226, 129–138, 2003.
Crawford, C. M., Mitchell, I. M., and Macleod, C. K. A.: Video assessment of environmental impacts of salmon farms, ICES J. Mar. Sci., 58, 445–452, 2001.
Cresswell, G. R., Edwards, R. J., and Barker, B. A.: Macquarie Harbour, Tasmania-seasonal oceanographic surveys in 1985, Papers and Proceedings of the Royal Society of Tasmania, 123, 63–66, 1989.
Da Silva, R. R. P., White, C. A., Bowman, J. P., Raes, E., Bisset, A., Chapman, C., Bodrossy, L., and Ross, D. J.: Environmental influences shaping microbial communities in a low oxygen, highly stratified marine embayment, Aquat. Microb. Ecol., 87, 185–203, 2021.
del Giorgio, P. and Williams, P. (Eds.): Respiration in aquatic ecosystems, Oxford University Press, https://doi.org/10.1093/acprof:oso/9780198527084.001.0001, 2005.
De Mello, N. A. S. T., Brighenti, L. S., Barbosa, F. A. R., Staehr, P. A., and Bezerra Neto, J. F.: Spatial variability of methane (CH4) ebullition in a tropical hypereutrophic reservoir: silted areas as a bubble hot spot, Lake Reserv. Manage., 34, 105–114, 2018.
Dey, R., Lewis, S. C., Arblaster, J. M., and Abram, N. J.: A review of past and projected changes in Australia's rainfall, WIRES Clim. Change, 10, e577, https://doi.org/10.1002/wcc.577, 2018.
Diaz, R. J. and Rosenberg, R.: Spreading dead zones and consequences for marine ecosystems, Science, 321, 926–929, 2008.
Edgar, G. J., Barrett, N. S., and Last, P. R.: The distribution of macroinvertebrates and fishes in Tasmanian estuaries, J. Biogeogr., 26, 1169–1189, 1999.
Edwards, A. and Edelsten, D. J.: Deep water renewal of Loch Etive: a three basin Scottish fjord, Estuar. Coast. Mar. Sci., 5, 575–595, 1977.
Eriksen, R. S., Mackey, D. J., van Dam, R., and Nowak, B.: Copper speciation and toxicity in Macquarie Harbour, Tasmania: an investigation using a copper ion selective electrode, Mar. Chem., 74, 99–113, 2001.
Featherstone, A. M. and O'Grady, B. V.: Removal of dissolved copper and iron at the freshwater-saltwater interface of an acid mine stream, Mar. Pollut. Bull., 34, 332–337, https://doi.org/10.1016/S0025-326X(96)00089-6, 1997.
Fogt, R. L. and Marshall, G. J.: The Southern annular mode: Variability, trends, and climate impacts across the Southern Hemisphere, WIRES Clim. Change, 11, e652, https://doi.org/10.1002/wcc.652, 2020.
Frey, C., Bange, H. W., Achterberg, E. P., Jayakumar, A., Löscher, C. R., Arévalo-Martínez, D. L., León-Palmero, E., Sun, M., Sun, X., Xie, R. C., Oleynik, S., and Ward, B. B.: Regulation of nitrous oxide production in low-oxygen waters off the coast of Peru, Biogeosciences, 17, 2263–2287, https://doi.org/10.5194/bg-17-2263-2020, 2020.
Gade, H. G. and Edwards, A.: Deep water renewal in fjords, in: Fjord oceanography, edited by: Freeland, H. J, Farmer, D. M., and Levings, C. D., Springer, Boston, MA, 453–489, ISBN: 978-1-4613-3107-0, 1980.
Geyer, W. R. and Cannon, G. A.: Sill processes related to deep water renewal in a fjord, J. Geophys. Res.-Oceans, 87, 7985–7996, 1982.
Gilbert, D., Rabalais, N. N., Díaz, R. J., and Zhang, J.: Evidence for greater oxygen decline rates in the coastal ocean than in the open ocean, Biogeosciences, 7, 2283–2296, https://doi.org/10.5194/bg-7-2283-2010, 2010.
Gillibrand, P. A. and Turrell, W. R.: The use of simple models in the regulation of the impact of fish farms on water quality in Scottish sea lochs, Aquaculture, 159, 33–46, 1997.
Gillibrand, P. A., Cage, A. G., and Austin, W. E.: A preliminary investigation of basin water response to climate forcing in a Scottish fjord: evaluating the influence of the NAO, Cont. Shelf Res., 25, 571–587, 2005.
Gillibrand, P. A., Cromey, C. J., Black, K. D., Inall, M. E., and Gontarek, S. J.: Identifying the risk of deoxygenation in Scottish sea lochs with isolated deep water, in: Scottish Aquaculture Research Forum, SARF, 7, Scottish Association for Marine Science Dunstaffnage Marine Laboratory Oban Argyll PA37 1QA, February 2006.
Gonsior, M., Peake, B. M., Cooper, W. J., Jaffé, R., Young, H., Kahn, A. E., and Kowalczuk, P.: Spectral characterization of chromophoric dissolved organic matter (CDOM) in a fjord (Doubtful Sound, New Zealand), Aquat. Sci., 70, 397–409, 2008.
Goreau, T. J., Kaplan, W. A., Wofsy, S. C., McElroy, M. B., Valois, F. W., and Watson, S. W.: Production of NO2-and N2O by nitrifying bacteria at reduced concentrations of oxygen, Appl. Environ. Microb., 40, 526–532, 1980.
Goyal, R., England, M. H., Jucker, M., and Sen Gupta, A.: Response of Southern Hemisphere western boundary current regions to future zonally symmetric and asymmetric atmospheric changes, J. Geophys. Res.-Oceans, 126, e2021JC017858, https://doi.org/10.1029/2021JC017858, 2021.
Grose, M. R., Barnes-Keoghan, I., Corney S. P., White C. J., Holz, G. K., Bennett, J. B., Gaynor, S. M., and Bindof, N. L.: Climate Futures for Tasmania: general climate impacts technical report, Antarctic Climate and Ecosystems Cooperative Research Centre, Hobart, Tasmania, ISBN 978-1-921197-05-5, 2010.
Gupta, G. V. M., Jyothibabu, R., Ramu, C. V., Reddy, A. Y., Balachandran, K. K., Sudheesh, V., Kumar, S., Chari, N. V. H. K., Bepari, K. F., Marathe, P. H., and Reddy, B. B.: The world's largest coastal deoxygenation zone is not anthropogenically driven, Environ. Res. Lett., 16, p. 054009, https://doi.org/10.1088/1748-9326/abe9eb, 2021.
Hartstein, N. D.: Supply and dispersal of mussel farm debris and its impacts on benthic habitats in contrasting hydrodynamic regimes, PhD thesis, University of Auckland, ResearchSpace@Auckland, 2003.
Hartstein, N. D., Maxey, J. D., Loo, J. C. H., and Then, A. Y. H.: Drivers of deep water renewal in Macquarie Harbour, Tasmania, J. Marine Syst., 199, 103226, https://doi.org/10.1016/j.jmarsys.2019.103226, 2019.
Hartstein, N., Maxey, J. D., and Kerroux, A.: Potential Causes of Beggiatoa Coverage in and Around Franklin Lease and Macquarie Harbour, a Report to the Tasmanian Salmonid Growers Association from Aquadynamic Solutions, Sdn. Bhd., Kota Kinabalu, Sabah, Malaysia, Aquadynamic Solutions Sdn. Bhd., 2016.
Hemer, M. A. and Griffin, D. A.: The wave energy resource along Australia's Southern margin, J. Renew. Sustain. Ener., 2, 043108, https://doi.org/10.1063/1.3464753, 2010.
Hemer, M. A., Church, J. A., and Hunter, J. R.: Variability and trends in the directional wave climate of the Southern Hemisphere, Int. J. Climatol., 30, 475–491, 2010.
Hill, K. J., Santoso, A., and England, M. H.: Interannual Tasmanian rainfall variability associated with large-scale climate modes, J. Climate, 22, 4383–4397, 2009.
Inall, M. E. and Gillibrand, P. A.: The physics of mid-latitude fjords: a review, in: Fjord Systems and Archives, edited by: Howe, J., Austin, W., Forwick, M., and Paetzel, M., The Geological Society, 17–33, https://doi.org/10.1144/SP344.3, 2010.
Ji, Q., Frey, C., Sun, X., Jackson, M., Lee, Y.-S., Jayakumar, A., Cornwell, J. C., and Ward, B. B.: Nitrogen and oxygen availabilities control water column nitrous oxide production during seasonal anoxia in the Chesapeake Bay, Biogeosciences, 15, 6127–6138, https://doi.org/10.5194/bg-15-6127-2018, 2018.
Ji, Q., Jameson, B. D., Juniper, S. K., and Grundle, D. S.: Temporal and vertical oxygen gradients modulate nitrous oxide production in a seasonally anoxic fjord: Saanich Inlet, British Columbia, J. Geophys. Res.-Biogeo., 125, e2020JG005631, https://doi.org/10.1029/2020JG005631, 2020.
Keeling, R. F., Körtzinger, A., and Gruber, N.: Ocean deoxygenation in a warming world, Annu. Rev. Mar. Sci., 2, 199–229, 2010.
Keith, D. A., Ferrer-Paris, J. R., Nicholson, E., and Kingsford, R. T. (Eds.): The IUCN Global Ecosystem Typology 2.0: Descriptive profiles for biomes and ecosystem functional groups, Gland, Switzerland: IUCN, https://doi.org/10.2305/IUCN.CH.2020.13.en, 2020.
Kiernan, K.: The Extent of Late Cenozoic Glaciation in the Central Highlands of Tasmania, Australia, Arctic Alpine Res., 22, 341–354. https://doi.org/10.2307/1551459, 1990.
Kiernan, K.: Glacial history of the upper Derwent Valley, Tasmania, New Zeal. J. Geol. Geop., 34, 157–166, https://doi.org/10.1080/00288306.1991.9514453, 1991.
Kiernan, K.: A reconnaissance of the geomorphology and glacial history of the upper Gordon River Valley, Tasmania, Tasforests, 7, 51–76, 1995.
King, R. D.: Limnology of the Gordon River Basin, Tasmania, and its meromictic lakes, Doctoral Dissertation, University of Tasmania, 1980.
King, R. D. and Tyler, P. A.: Meromictic lakes of south-west Tasmania, Mar. Freshwater Res., 32, 741–756, 1981.
King, R. D. and Tyler, P. A.: Downstream effects of the Gordon River Power Development, south-west Tasmania, Mar. Freshwater Res., 33, 431–442, 1982.
Kirkpatrick, J. B., Nunez, M., Bridle, K. L., Parry, J., and Gibson, N.: Causes and consequences of variation in snow incidence on the high mountains of Tasmania, 1983–2013, Aust. J. Bot., 65, 214–224, https://doi.org/10.1071/BT16179, 2017.
Koehnken, L.: Water Quality in the King River and Macquarie Harbour, Tasmania: Pre-and Post-Mount Lyell Mine Closure, in: Hydrology and Water Resources Symposium 1996: Water and the Environment, Barton, ACT: Institution of Engineers, Australia, 1996, 157–162, National conference publication, Institution of Engineers, Australia, ; no. 96/05, ISBN: 0858256495, 2006.
Lam, P. and Kuypers, M. M.: Microbial nitrogen cycling processes in oxygen minimum zones, Ann. Rev. Mar. Sci., 3, 317–345, 2011.
Levin, L. A. and Breitburg, D. L.: Linking coasts and seas to address ocean deoxygenation, Nat. Clim. Change, 5, 401–403, 2015.
Li, Y., Xie, H., Scarratt, M., Damm, E., Bourgault, D., Galbraith, P. S., and Wallace, D. W.: Dissolved methane in the water column of the Saguenay Fjord, Mar. Chem., 230, 103926, https://doi.org/10.51200/bjomsa.v1i0.995, 2021.
Liu, L., Wilkinson, J., Koca, K., Buchmann, C., and Lorke, A.: The role of sediment structure in gas bubble storage and release, J. Geophys. Res.-Biogeo., 121, 1992–2005, 2016.
Lucieer, V.: SeaMap Tasmania Bathymetric Data, Institute for Marine and Antarctic Studies, University of Tasmania [data set], https://doi.org/10.1016/j.ecss.2020.107016, 2007.
Marshall, G. and National Center for Atmospheric Research Staff (Eds): The Climate Data Guide: Marshall Southern Annular Mode (SAM) Index (Station-based), https://climatedataguide.ucar.edu/climate-data/marshall-southern-annular-mode-sam-index-station-based (last access: 20 January 2022), 2018.
Mau, S., Blees, J., Helmke, E., Niemann, H., and Damm, E.: Vertical distribution of methane oxidation and methanotrophic response to elevated methane concentrations in stratified waters of the Arctic fjord Storfjorden (Svalbard, Norway), Biogeosciences, 10, 6267–6278, https://doi.org/10.5194/bg-10-6267-2013, 2013.
Maxey, J. D., Hartstein, N. D., Penjinus, D., and Kerroux, A.: Simple quality control technique to identify dissolved oxygen diffusion issues with biochemical oxygen demand bottle incubations, BJoMSA, 1, 2017.
Maxey, J. D., Hartstein, N. D., Then, A. Y. H., and Barrenger, M.: Dissolved oxygen consumption in a fjord-like estuary, Macquarie Harbour, Tasmania, Estuar. Coast. Shelf S., 246, 107016, https://doi.org/10.1016/j.ecss.2020.107016, 2020.
Meneghini, B., Simmonds, I., and Smith, I. N.: Association between Australian rainfall and the southern annular mode, Int. J. Climatol., 27, 109–121, 2007.
MHDOWG (Macquarie Harbour Dissolved Oxygen Working Group): Final Report to the Tasmanian Salmonid Growers Association, 2014.
Oschlies, A., Brandt, P., Stramma, L., and Schmidtko, S.: Drivers and mechanisms of ocean deoxygenation, Nat. Geosci., 11, 467–473, 2018.
Pereira, P. M., Black, K. D., McLusky, D. S., and Nickell, T. D.: Recovery of sediments after cessation of marine fish farm production, Aquaculture, 235, 315–330, 2004.
Pickard, G. L. and Stanton, B. R.: Pacific fjords-a review of their water characteristics, Fjord Oceanography, edited by: Freeland, H. J., Farmer, D. M., and Levings, C. D., Fjord oceanography, Plenum Press, New York, 1–51, 1980.
Pitcher, G. C., Aguirre-Velarde, A., Breitburg, D., et al.: System controls of coastal and open ocean oxygen depletion, Prog. Oceanogr., p. 102613, https://doi.org/10.1016/j.pocean.2021.102613, 2021.
Priestley, M. D. and Catto, J. L.: Future changes in the extratropical storm tracks and cyclone intensity, wind speed, and structure, Weather and Climate Dynamics Discussions, 3, 1–40, https://doi.org/10.5194/wcd-3-337-2022, 2021.
Rabalais, N. N., Díaz, R. J., Levin, L. A., Turner, R. E., Gilbert, D., and Zhang, J.: Dynamics and distribution of natural and human-caused hypoxia, Biogeosciences, 7, 585–619, https://doi.org/10.5194/bg-7-585-2010, 2010.
Reeburgh, W. S.: Oceanic methane biogeochemistry, Chem. Rev., 107, 486–513, 2007.
Rosenberg, R.: Benthic macrofaunal dynamics, production, and dispersion in an oxygen-deficient estuary of west Sweden, J. Exp. Mar. Biol. Ecol., 26, 107–133, 1977.
Sharples, C., Walford, H., Watson, C., Ellison, J. C., Hua, Q., Bowden, N., and Bowman, D.: Ocean Beach, Tasmania: A swell-dominated shoreline reaches climate-induced recessional tipping point?, Mar. Geol., 419, https://doi.org/10.1016/j.margeo.2019.106081, 2020.
Skogen, M. D., Eknes, M., Asplin, L. C., and Sandvik, A. D.: Modelling the environmental effects of fish farming in a Norwegian fjord, Aquaculture, 298, 70–75, 2009.
Smith, R. W., Bianchi, T. S., Allison, M., Savage, C., and Galy, V.: High rates of organic carbon burial in fjord sediments globally, Nat. Geosci., 8, 450–453, 2015.
Stanton, B. R. and Pickard, G. L.: Physical oceanography of the New Zealand fjords, in: Fjord oceanography, edited by: Freeland, H. J, Farmer, D. M., and Levings, C. D., Springer, Boston, MA, 453–489, 329-332, ISBN: 978-1-4613-3107-0, 1980.
Stauber, J. L., Benning, R. J., Hales, L. T., Eriksen, R., and Nowak, B.: Copper bioavailability and amelioration of toxicity in Macquarie Harbour, Tasmania, Australia, Mar. Freshwater Res., 51, 1–10, 2000.
Taschetto, A. S. and England, M. H.: An analysis of late twentieth century trends in Australian rainfall, Int. J. Climatol., 29, 791–807, 2009.
Teasdale, P. R., Apte, S. C., Ford, P. W., Batley, G. E., and Koehnken, L.: Geochemical cycling and speciation of copper in waters and sediments of Macquarie Harbour, Western Tasmania, Estuar. Coast. Shelf S., 57, 475–487, 2003.
Viney, N. R., Post, D. A., Yang, A., Willis, M., Robinson, K. A., Bennett, J. C., Ling, F. L. N., and Marvanek, S.: Rainfall-runoff modelling for Tasmania, A report to the Australian Government from the CSIRO Tasmania Sustainable Yields Project, CSIRO Water for a Healthy Country Flagship, Australia, https://doi.org/10.4225/08/585c15667ff2b, 2009.
Walinsky, S. E., Prahl, F. G., Mix, A. C., Finney, B. P., Jaeger, J. M., and Rosen, G. P.: Distribution and composition of organic matter in surface sediments of coastal Southeast Alaska, Cont. Shelf Res., 29, 1565–1579, 2009.
Walker, K. F.: A review of the ecological effects of river regulation in Australia, Perspectives in Southern Hemisphere Limnology, 28, 111–129, https://doi.org/10.1007/978-94-009-5522-6_8, 1985.
Wang, Y., Hendy, I., and Napier, T. J.: Climate and anthropogenic controls of coastal deoxygenation on interannual to centennial timescales, Geophys. Res. Lett., 44, 11–528, 2017.
Willis, M.: Tascatch Variation 2 – Surface Water Models, Department of Primary Industries and Water, Hydro Tasmania Consulting, document ID no.: WR 2008/005, https://nre.tas.gov.au/water/water-monitoring-and-assessment/hydrological-assessment/tasmanian-catchments-modelling/surface-water-models (last access: 15 April 2022), 2008.
Ye, W., Zhang, G., Zheng, W., Zhang, H., and Wu, Y.: Methane distributions and sea-to-air fluxes in the Pearl River Estuary and the northern South China sea, Deep-Sea Res. Pt., 167, 34–45, 2019.