the Creative Commons Attribution 4.0 License.
the Creative Commons Attribution 4.0 License.
 | 11 Jul 2022
Early winter barium excess in the southern Indian Ocean as an annual remineralisation proxy (GEOTRACES GIPr07 cruise)
Natasha René van Horsten
Hélène Planquette
Géraldine Sarthou
Thomas James Ryan-Keogh
Nolwenn Lemaitre
Thato Nicholas Mtshali
Alakendra Roychoudhury
Eva Bucciarelli
The Southern Ocean (SO) is of global importance to the carbon cycle, and processes such as mesopelagic remineralisation that impact the efficiency of the biological carbon pump in this region need to be better constrained. During this study early austral winter barium excess (Baxs) concentrations were measured for the first time, along 30∘ E in the southern Indian Ocean. Winter Baxs concentrations of 59 to 684 pmol L−1 were comparable to those observed throughout other seasons. The expected decline of the mesopelagic Baxs signal to background values during winter was not observed, supporting the hypothesis that this remineralisation proxy likely has a longer timescale than previously reported. A compilation of available SO mesopelagic Baxs data, including data from this study, shows an accumulation rate of ∼0.9 µmol m−2 d−1 from September to July that correlates with temporally integrated remotely sensed primary productivity (PP) throughout the SO from data spanning ∼20 years, advocating for a possible annual timescale of this proxy. The percentage of mesopelagic particulate organic carbon (POC) remineralisation as calculated from estimated POC remineralisation fluxes over integrated remotely sensed PP was ∼2-fold higher south of the polar front (19 ± 15 %, n=39) than north of the polar front (10 ± 10 %, n=29), revealing the higher surface carbon export efficiency further south. By linking integrated remotely sensed PP to mesopelagic Baxs stock, we could obtain better estimates of carbon export and remineralisation signals within the SO on annual and basin scales.
- Article
(2065 KB) - Full-text XML
-
Supplement
(341 KB) - BibTeX
- EndNote


The Southern Ocean (SO) is a carbon sink of global significance responsible for 40 %–50 % of the global oceans' carbon uptake (Friedlingstein et al., 2019; Gregor et al., 2019; Gruber et al., 2019). Oceanic carbon uptake is regulated by various processes, including the biological carbon pump (BCP). Inorganic carbon is consumed and released by photosynthetic organisms through photosynthesis and respiration (Sarmiento and Gruber, 2006), thereby regulating the earth's carbon cycle by partially sequestering photosynthetically fixed CO2 in the ocean interior (Honjo et al., 2014). In particular, the SO BCP is a crucial contributor to the earth's carbon cycle by exporting, from surface waters, ∼3 Pg C yr−1 of the ∼10 Pg C yr−1 of global export production (Schlitzer, 2002). The efficiency of the BCP is linked to the export and preservation of surface particulate matter and is directly linked to atmospheric CO2 levels on glacial–interglacial timescales (Honjo et al., 2014; Sigman et al., 2010).
Sedimentation out of the surface layer (∼100 m) is defined as surface export and out of the mesopelagic zone (∼1000 m) as deep export (Passow and Carlow, 2012). There are large gaps in our knowledge with regard to deep carbon export, internal cycling and the seasonality of these processes (Takahashi et al., 2012). The magnitude of deep carbon export is dependent on the efficiency of mesopelagic remineralisation (Jacquet et al., 2015) which can balance or even exceed particulate organic carbon (POC) surface export, especially later in the growing season, thereby limiting deep export (Buesseler and Boyd, 2009; Cardinal et al., 2005; Jacquet et al., 2011, 2015; Lemaitre et al., 2018; Planchon et al., 2013). A possible explanation for imbalances between surface export and mesopelagic processes can be the lateral advection of surface waters with lower particle export relative to the mesopelagic signal (Planchon et al., 2013). It is also possible that continued remineralisation of earlier larger export fluxes is detected in the mesopelagic signal but not in the export fluxes of in situ observations (Planchon et al., 2013). In addition to this, the efficiency of remineralisation is influenced by the size and composition of exported particles (Rosengard et al., 2015; Twining et al., 2014), as well as the pathway by which these particles are transported downwards (e.g. eddy subduction, active migration, sinking or mixing) from the surface mixed layer to the mesopelagic zone (Boyd et al., 2019; Le Moigne, 2019), creating an intricate web of processes to disentangle. Mesopelagic remineralisation has also been shown to be influenced by environmental factors, such as temperature, phytoplankton community structure and nutrient availability (Bopp et al., 2013; Buesseler and Boyd, 2009). Indeed, nutrient limitation in surface waters limits export and consequently mesopelagic remineralisation by promoting the shift to smaller phytoplankton assemblages that preferentially take up recycled nutrients in the surface mixed layer (Planchon et al., 2013). Phytoplankton community composition exerts an important control in which diatoms are more efficiently exported due to their large size and ballasting by biogenic silica compared to smaller non-diatom phytoplankton (Armstrong et al., 2009; Buesseler, 1998; Ducklow et al., 2001). Latitudinal trends in remineralisation efficiency can also be linked to temperature-dependent heterotrophs that are responsible for remineralisation (DeVries and Weber, 2017; Marsay et al., 2015). The mesopelagic layer is under-studied, especially in the high latitudes, and therefore these processes are poorly constrained despite their importance to global elemental cycles, including that of carbon (Le Moigne, 2019; Robinson et al., 2010).
Export and remineralisation tracers, such as 234Th 238U and apparent oxygen utilisation (AOU), have been used to study mesopelagic POC remineralisation fluxes (Buesseler et al., 2005; Planchon et al., 2013; Lemaitre et al., 2018). Surface export is set by the deficit of 234Th activities over 238U activities, while remineralisation processes are reflected by 234Th 238U ratios larger than 1 below the surface mixed layer integrating processes over a 2- to 3-week period (Buesseler et al., 2005; Planchon et al., 2013). AOU is the depletion of oxygen (O2) in the ocean interior relative to surface saturation due to biological respiration when surface water masses are subducted. AOU is dependent on salinity and temperature and integrates remineralisation on timescales of years to decades (Ito et al., 2004). Inaccuracies have, however, been detected with AOU as a remineralisation proxy, specifically in high-latitude areas due to O2 undersaturation as a consequence of large temperature gradients (Ito et al., 2004).
Barium excess (Baxs) is another proxy utilised to yield estimates of mesopelagic POC remineralisation fluxes. It is defined as the “biogenic” portion of particulate barium (pBa) as barite crystals, formed by the decay of bio-aggregates below the surface mixed layer (Bishop, 1988; Dehairs et al., 1980; Lam and Bishop, 2007; Legeleux and Reyss, 1996; van Beek et al., 2007). As these crystals are released, a Baxs peak is formed within the mesopelagic zone which has been found to correlate to primary production (PP), O2 consumption and POC remineralisation (Dehairs and Goeyens, 1996; Dehairs et al., 1997). Depth-integrated rates of O2 consumption between the base of the mixed layer and 1000 m were estimated using an inverse 1-D advection–diffusion–consumption model (Shopova et al., 1995) to develop transfer functions between the Baxs signal and the rate of surface POC export for subsequent mesopelagic remineralisation (Dehairs and Goeyens, 1996; Dehairs et al., 1997). Strong correlations have been obtained between the well-established export and remineralisation flux proxy 234Th and Baxs during studies conducted in the SO and the North Atlantic, confirming the validity of Baxs as a remineralisation proxy (Cardinal et al., 2005; Lemaitre et al., 2018; Planchon et al., 2013). Estimates of POC remineralisation fluxes, using the Baxs proxy, are directly influenced by the background signal of Baxs after partial dissolution and sedimentation from the previous bloom season. It can be thought of as “pre-formed” Baxs, defined as the Baresidual signal at zero O2 consumption (Jacquet et al., 2015). Because studies conducted in spring and summer suggest that the mesopelagic Baxs signal lasts between a few days to a few weeks (Dehairs et al., 1997; Cardinal et al., 2005; Jacquet et al., 2007, 2008a), it is postulated that winter measurements should give the true SO Baresidual value (Jacquet et al., 2008b, 2011). In this context, as part of a GEOTRACES process study (GIpr07) of a transect along 30∘ E in the southern Indian Ocean (58.5 to 41.0∘ S), we studied Baxs distributions during early austral winter (July 2017) to better constrain the SO Baresidual concentrations and the timescale of this proxy. To our knowledge these are the first reported wintertime values for this proxy in the SO.
2.1 Sampling and hydrography
During the GEOTRACES GIpr07 cruise, which took place in early austral winter (28 June–13 July 2017) on board the R/V SA Agulhas II, seven stations were sampled along 30∘ E, from 58.5 to 41.0∘ S (WOCE I06S, Fig. 1a). At each station between 15 and 21 samples were collected from 25 m down to 1500 m, for shallow stations, and down to 4250 m, for deep stations, to be analysed for multiple parameters.
Positions of the fronts during the cruise were determined using the July monthly mean absolute dynamic topography data from the CLS/AVISO product (Rio et al., 2011), with boundary definitions from Swart et al. (2010). From north to south the identified fronts are the subtropical front (STF), the subantarctic front (SAF), the polar front (PF), the Southern Antarctic Circumpolar Current front (SACCf) and the southern boundary (SBdy) (Fig. 1a). The marginal ice zone, identified as the position of 30 % ice cover, was positioned at 61.7∘ S, approximately 3∘ (356 km) south of the southernmost station (de Jong et al., 2018). Therefore, a potential sea ice influence on our study area can be disregarded.
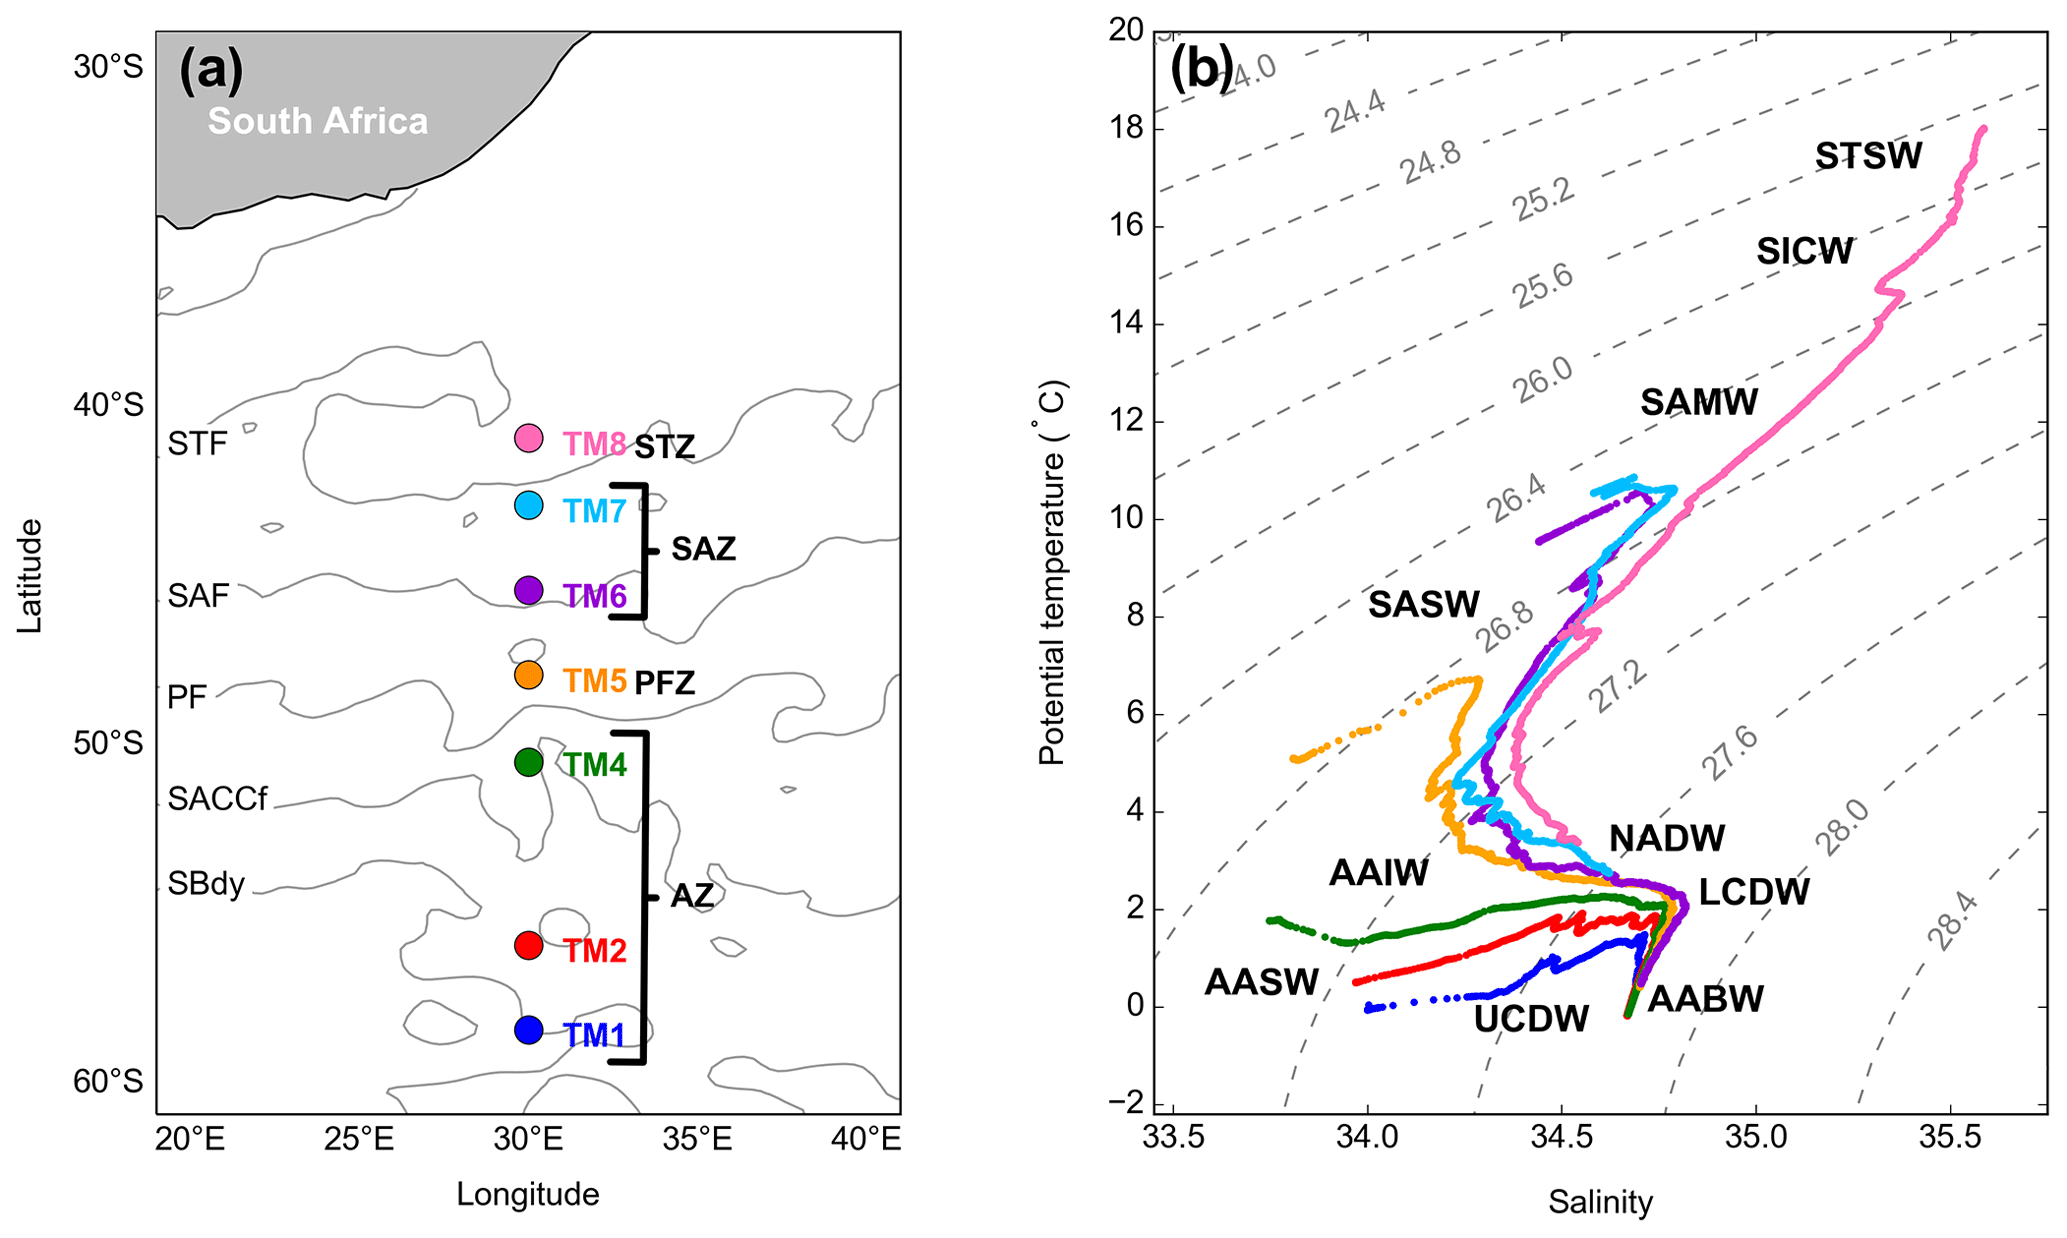
Figure 1(a) GEOTRACES GIPr07 cruise sampling stations overlaid on a map with frontal positions, namely the subtropical front (STF), the subantarctic front (SAF), the polar front (PF), the Southern Antarctic Circumpolar Current front (SACCf) and the southern boundary (SBdy), as determined by mean absolute dynamic topography (MADT) and crossing over four zones, namely the Antarctic zone (AZ), the polar frontal zone (PFZ), the subantarctic zone (SAZ) and the subtropical zone (STZ). (b) Potential temperature plotted against salinity, overlaid on isopycnals and identification of water masses sampled, namely Subtropical Surface Water (STSW), South Indian Central Water (SICW), Subantarctic Mode Water (SAMW), Subantarctic Surface Water (SASW), Antarctic Intermediate Water (AAIW), Antarctic Surface Water (AASW), North Atlantic Deep Water (NADW), Lower Circumpolar Deep Water (LCDW), Upper Circumpolar Deep Water (UCDW) and Antarctic Bottom Water (AABW).
2.2 Temperature, salinity and dissolved O2
Temperature (∘C), salinity and dissolved O2 (µmol L−1) profiles were measured by sensors (SBE 911plus) which were calibrated by the manufacturer within a year prior to the cruise. At each cast, discrete seawater samples were collected and analysed on board for in situ calibration of sensor data for salinity (8410A Portasal salinometer, R2=0.99) and dissolved O2 concentrations (Metrohm 848 Titrino plus, R2=0.83; Ehrhardt et al., 1983). Temperature and salinity measurements were used to calculate potential density (σθ; Gill, 1982) to characterise water masses sampled and to identify the mixed layer depth (MLD). The MLD is the depth at which there is a change of 0.03 kg m−3 in σθ from a near-surface value at ∼10 m (de Boyer Montégut et al., 2004). Decreases in dissolved O2 concentrations at intermediate depths, together with Baxs concentrations, were used to define the mesopelagic remineralisation layer.
2.3 pBa and particulate aluminium
Profile sampling of the water column was conducted with a GEOTRACES-compliant trace-metal-clean CTD (conductivity, temperature, depth) housed on an epoxy coated aluminium frame with titanium bolts equipped with 24 × 12 L trace-metal-clean Teflon-coated GO-FLO bottles (General Oceanics). All sampling and analyses were conducted following the GEOTRACES clean sampling and analysis protocols (Cutter et al., 2017). Volumes of 2 to 7 L seawater were filtered from the GO-FLO bottles onto acid-washed polyethersulfone filters (25 mm diameter, Supor, 0.45 µm pore size) for pBa and particulate aluminium (pAl) analyses. Filters were mounted in-line on the side spigot of each GO-FLO bottle on Swinnex filter holders. Furthermore, bottles were mixed three times before filtration, as recommended by the GEOTRACES protocols (Cutter et al., 2017), to ensure homogenous sampling. Although the large fast-sinking fraction of particles may be under-sampled by using bottles (Bishop and Edmond, 1976; Planquette and Sherrell, 2012), comparing data that were generated using the same internationally validated sampling systems and protocols (Cutter et al., 2017) as we do in this study minimises potential bias. After filtration, filters were placed in trace-metal-clean petri slides (Pall) and kept frozen at −20 ∘C until further processing on land. Sample processing was conducted under a class 100 HEPA-filtered laminar flow and extraction hood in a clean laboratory.
The pBa and pAl samples were processed and analysed 6 months after sample collection at LEMAR (France). Unused blank filters and filters containing the samples were acid reflux digested at 130 ∘C in acid-cleaned Savillex vials using a mixture of HF and HNO3 (both Ultrapur grade, Merck) solutions (Planquette and Sherrell, 2012). Archive solutions were stored in 3 mL of 0.12 M HNO3 (Ultrapur grade), of which 250 µL was diluted up to 2 mL for analysis by sector field inductively coupled plasma mass spectrometry (SF-ICP-MS; Element XR, Thermo Scientific). Samples were spiked with 1 µg L−1 indium as an internal standard to correct for instrument drift. The detection limits, defined as 3 times the standard deviation of the blanks (unused filter blanks), were 0.39 pmol L−1 and 0.03 nmol L−1 (n=5) for pBa and pAl, respectively. Mean amounts (in nmol) of a given element determined in unused filter blanks were subtracted from the amounts in the sample filter and then divided by the volume filtered. Three certified reference materials (BCR 414, MESS 4, and PACS 3) were processed and analysed with the samples to assess the accuracy of the methodology. Our values were in good agreement with the certified values of the reference materials (Table 1) (Jochum et al., 2005). Percentage error of analyses was determined by the repeat analysis of random samples during each run, and the mean percentage error of sample analysis for pBa and pAl was 9.2 ± 2.5 % and 11.1 ± 4.6 % (mean ± SD, n=6), respectively.
Table 1Certified reference material recovery data for accuracy determination of pBa and pAl analyses.
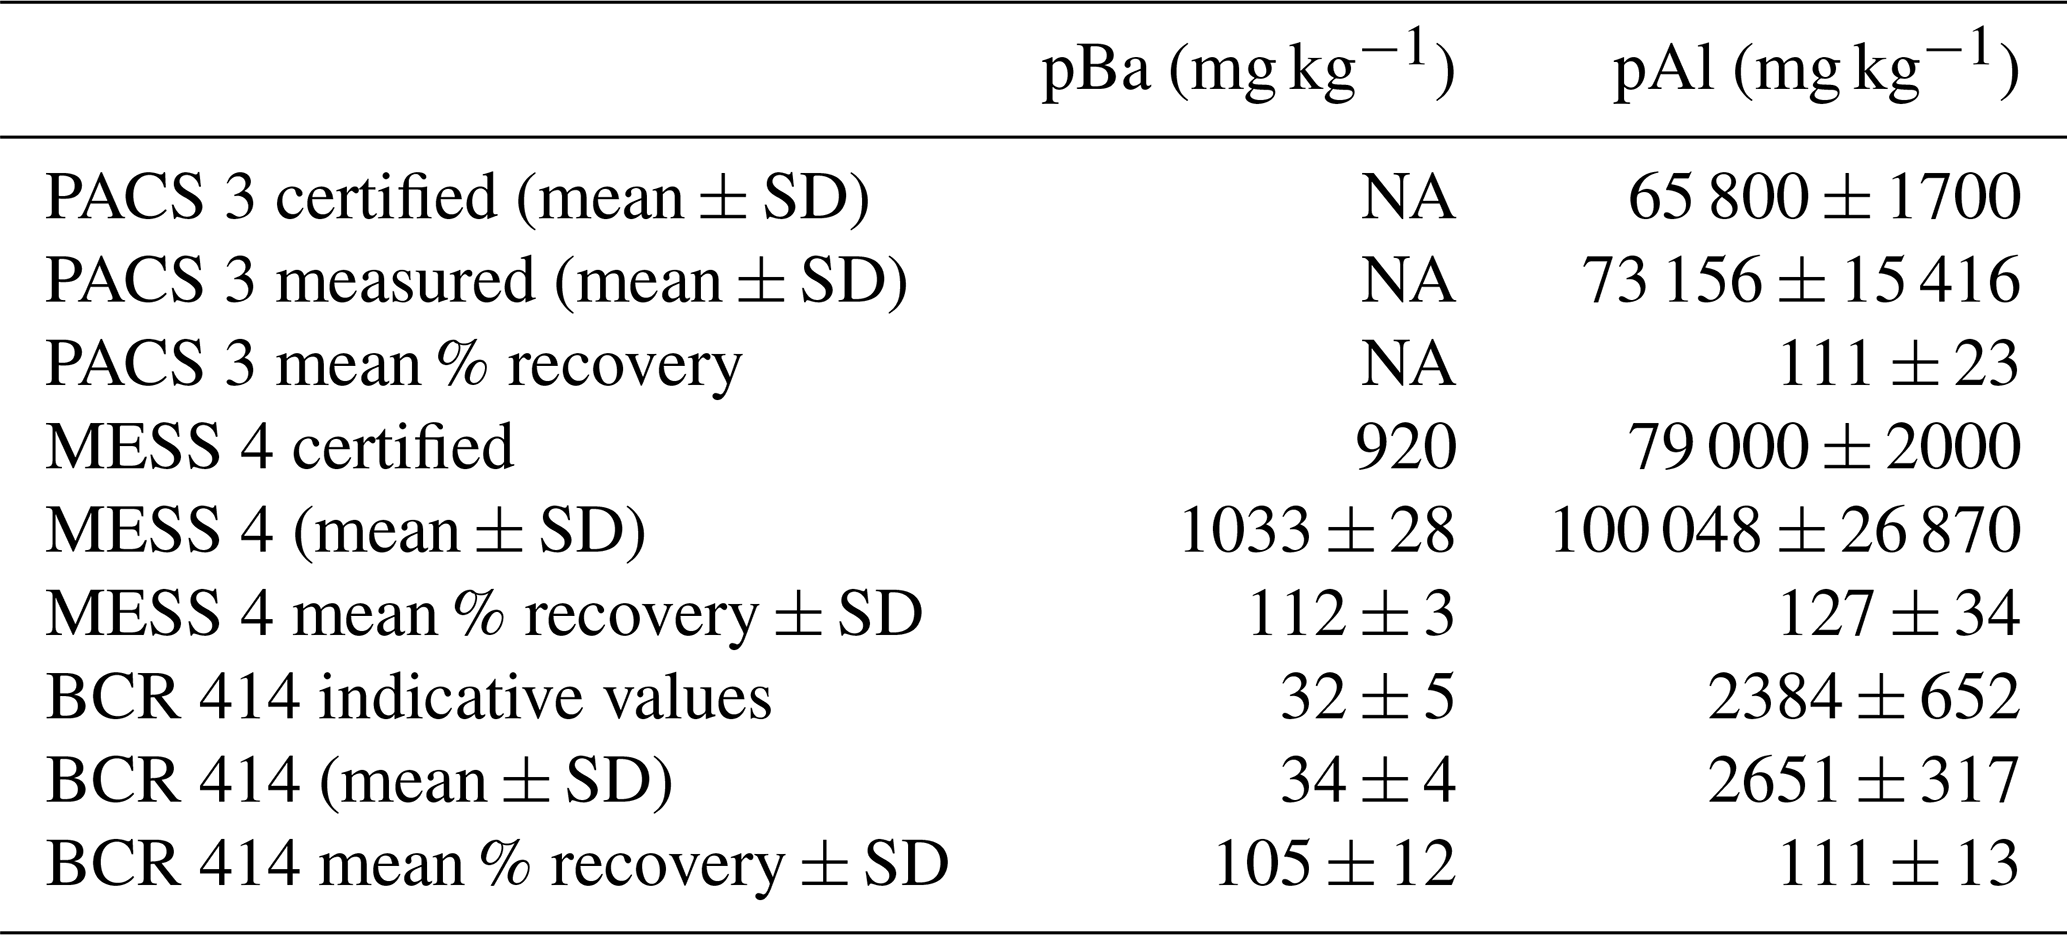
NA refers to instances when there are no certified values available to check for accuracy.
The non-lithogenic fraction of pBa, Baxs, was calculated by subtracting the lithogenic fraction of pBa from the total pBa measured using Eq. (1). The lithogenic contribution to pBa was calculated by multiplying the pAl concentration with the upper continental crust (UCC) ratio, 0.00135, as determined by Taylor and McLennan (1985).
Total pBa and Baxs profiles were nearly identical with a mean percentage Baxs to total pBa of 99 ± 1 % (mean ± SD, n=124; Table S1 in the Supplement), indicating that pBa from lithogenic sources was negligible. This ensures the accurate estimation of Baxs, which requires that less than 50 % of pBa should be associated with lithogenic inputs (Dymond et al., 1992).
The mesopelagic POC remineralisation flux was estimated using Eq. (2) (Dehairs and Goeyens, 1996; Shopova et al., 1995):
where the mesopelagic POC remineralisation flux is expressed in milligrams carbon per square metre per day (mg C m−2 d−1), Z is the depth range of the mesopelagic Baxs layer (100–1000 m), C:O2 is the stoichiometric molar ratio of carbon to O2 consumption by remineralisation as per the Redfield ratio (; Broecker et al., 1985), 12.01 is the molar mass of carbon (g mol−1), and JO2 is the rate of O2 consumption (µmol L−1 d−1) as estimated using Eq. (3).
Equation (3) (Dehairs and Goeyens, 1996; Shopova et al., 1995) is the linearisation of the exponential function by Dehairs et al. (1997). Mesopelagic Baxs is the depth-weighted average Baxs of the mesopelagic zone (pmol L−1), the constant value of 17 200 is the slope of the linear regression of depth-weighted average Baxs (pmol L−1) versus O2 consumption rate (µmol L−1 d−1), and Baresidual is the deep ocean background value of Baxs at zero oxygen consumption. The literature value of 180 pmol L−1 was used as the Baresidual value (Jacquet et al, 2008a, b; 2011, 2015; Planchon et al., 2013) in our calculations.
The integrated mesopelagic Baxs stock (µmol m−2) over the mesopelagic layer (100–1000 m) was calculated from the depth-weighted average Baxs in order to investigate the link between the accumulated mesopelagic signal and the corresponding integrated remotely sensed primary productivity (PP).
3.1 Integrated remotely sensed PP
The integrated remotely sensed PP (mg C m−2 d−1) within the surface mixed layer was calculated using the CbPM algorithm (Behrenfeld et al., 2005), which requires chlorophyll concentration (mg m−3), particulate backscatter (λ 443 nm, m−1), photosynthetically active radiation (PAR; µmol photons m−2 d−1) and the MLD (m). Ocean Colour Climate Change Initiative (OC-CCI) data (https://esa-oceancolour-cci.org/, last access: 14 August 2020), which blend existing data streams into a coherent record, meeting the quality requirements for climate assessment (Sathyendranath et al., 2019), were used for chlorophyll and particulate backscatter. PAR was taken from GlobColour (http://www.globcolour.info/, last access: 14 August 2020), and the MLD was taken from the climatology of de Boyer Montegut et al. (2004). The integrated remotely sensed PP data were regridded to 0.25∘ spatially, using bilinear interpolation using the Python programming package xESMF (Zhuang, 2018), and averaged monthly. The area-averaged PP was averaged over a rectangular sample area, starting 6∘ upstream extending up to the sampled station longitudinally, and 1∘ latitudinally centred around each sampled station (see “Discussion” for details). In order to assess the validity of the remotely sensed PP data and demonstrate no meridional bias across the SO, the percentage of valid pixels was calculated for data north (90 ± 20 %; mean ± SD, n=370) and south (82 ± 29 %; mean ± SD, n=488) of the PF, revealing no bias.
3.2 Integrated percentage of POC re-mineralised
The integrated re-mineralised POC (mg C m−2) was estimated by multiplying the POC remineralisation flux (mg C m−2 d−1), as estimated using the Baxs proxy method, by the number of days over which the corresponding remotely sensed PP (mg C m−2 d−1) was subsampled. The percentage of POC re-mineralised was then estimated as the percentage of integrated remotely sensed PP (mg C m−2) re-mineralised, assuming that the mesopelagic Baxs stock signal observed is due to the remineralisation of the integrated surface PP signal.
3.3 Statistical analysis
For statistical analysis, the least squares regression method was applied for the assessment of significant correlations (Barbur et al., 1994). Significant differences between regions and regressions were tested using Welch's t test with an alpha of 0.05 (95 % confidence level) (Kokoska and Zwillinger, 2000).
4.1 Hydrography
The potential temperature (θ) and salinity (S) along the transect ranged from −0.06 to 18.03 ∘C and from 33.77 to 35.59, respectively, where surface θ and S define four hydrographic zones: namely the Antarctic zone (AZ; θ<2.5 ∘C; S≤34) from ∼50 to 58.5∘ S, the polar frontal zone (PFZ; θ≅5 ∘C; S≅33.8) at ∼48∘ S, the subantarctic zone (SAZ; ∘C; ) between 43 and 45.5∘ S and the subtropical zone (STZ; θ≥17.9 ∘C; S≅35.6) at 41∘ S (Fig. 1a; Anilkumar and Sabu, 2017; Orsi et al., 1995; Pollard et al., 2002). The MLDs along the transect ranged between 97 and 215 m (144 ± 39 m; mean ± SD, n=7), shoaling towards the PF (Table S2).
As can be observed on the T–S plot of stations sampled (Fig. 1b), different water masses were sampled along the transect throughout the water column. South of the polar front (SPF; ⪆50∘ S; TM1, 2 and 4), from surface to depth, Antarctic Surface Water (AASW; kg m−3), Upper and Lower Circumpolar Deep Water (UCDW and LCDW; kg m−3 and kg m−3, respectively), and Antarctic Bottom Water (AABW; kg m−3) were characterised. North of the polar front (NPF) and south of the STF (<50∘ S; TM5, 6 and 7), from surface to depth, Subantarctic Surface Water (SASW; kg m−3), Antarctic Intermediate Water (AAIW; kg m−3), North Atlantic Deep Water (NADW; kg m−3) and, as far north as 45.5∘ S, AABW close to the ocean floor were identified. At the northernmost station (TM8; 41∘ S), in the STZ, the water masses sampled include Subtropical Surface Water (STSW; σθ≅25.7 kg m−3), South Indian Central Water (SICW; kg m−3), Subantarctic Mode Water (SAMW; kg m−3), AAIW and NADW.
4.2 Dissolved O2
The water column dissolved O2 concentrations ranged from 159 to 333 µmol L−1 (Fig. 2). Maximum concentrations were observed in the surface mixed layer, increasing southwards along the transect, with a mean value of 287 ± 40 µmol L−1 (mean ± SD, n=700). A decrease in concentrations below the MLD coincided with an increase in σθ. South of the PF, the decrease in dissolved O2 concentrations at the MLD was sharp and relatively shallow when compared to profiles NPF, which were more gradual, spanning a wider depth range. Within the mesopelagic zone concentrations decreased down to 204 ± 29 µmol L−1 (mean ± SD, n=6373) and then remained relatively uniform below 1000 m at 192 ± 113 µmol L−1 (mean ± SD, n=12 950).

Figure 2Baxs (black circles) with error bars, potential density (σθ; red) and dissolved O2 (blue) profiles sampled along the transect, plotted against depth, for stations TM1 to TM8 from south to north. The shaded green area is the mesopelagic zone, and the hatched area is the ocean floor.
4.3 Baxs and estimated POC remineralisation fluxes
Along the transect, Baxs concentrations ranged from 59 to 684 pmol L−1. All profiles exhibited a depletion of Baxs in the upper surface waters (59–152 pmol L−1) and then a rapid increase below the MLD (∼150 m), with concentrations ranging between 113 and 684 pmol L−1 in the mesopelagic zone (100–1000 m, Fig. 2). At the two southernmost stations (TM1 and TM2), mesopelagic Baxs peaks spanned a narrower depth range (100–600 m) than stations further north, with concentrations reaching values of ∼400 pmol L−1. Concentrations were higher in the PFZ and SAZ with a maximum of 684 pmol L−1 in the PFZ at 48∘ S (TM5). The subsurface increase in Baxs started at slightly deeper depths (150–200 m) and spanned wider depth ranges down to 1000 m at stations north of the PF. The STZ station, at 41∘ S (TM8), had the lowest concentrations, only increasing up to ∼200 pmol L−1. Double peaks were observed at all stations north of the PF, with a shallow and more substantial peak occurring in the upper mesopelagic zone and a second peak in the lower mesopelagic zone. Below the mesopelagic zone, Baxs concentrations decreased down to ∼180 pmol L−1 and remained relatively uniform.
The mean Baresidual concentration south of the PF was 183 ± 29 pmol L−1 (mean ± SD, n=7), whereas it was 142 ± 45 pmol L−1 (mean ± SD, n=8) between the PF and the STF. The two regions were not, however, significantly different to each other when conducting Welch's t test (t statistic = 2.10; p value = 0.06), and when averaging all concentrations below 2000 m along the transect, the Baresidual concentration was 161 ± 43 pmol L−1 (mean ± SD, n=15). This concentration is not statistically different from the literature value of 180 pmol L−1 (Jacquet et al, 2008a, b; 2011; 2015; Planchon et al., 2013), which is widely used for estimates of POC remineralisation fluxes. For a better comparison with these previous estimates, we used 180 pmol L−1 for the Baresidual concentration in our calculations.
The estimated POC remineralisation fluxes for the study area ranged from 6 to 96 mg C m−2 d−1 (Table S3), increasing northwards from the southernmost station up to the PFZ from 32 to 92 mg C m−2 d−1 and then decreasing down to 70 mg C m−2 d−1 at the SAF. The highest flux was estimated in the SAZ, and the lowest flux was estimated in the STZ.
5.1 Early wintertime Baxs and Baresidual concentrations
A noticeable difference between profiles sampled early in the bloom season (Dehairs et al., 1997; Jacquet et al., 2015) versus those sampled later (Cardinal et al., 2001; Planchon et al., 2013) is the contrasted Baxs concentrations in the surface mixed layer. Dehairs et al. (1997) has shown that these concentrations of Baxs can be as high as 9000 pmol L−1 in areas of high productivity during spring, which then become depleted to concentrations below the SO Baresidual value of ∼180 pmol L−1 as productivity declines and surface POC export increases (Planchon et al., 2013). These high surface concentrations are not, however, due to the same process as the one that controls the Baxs concentrations within the mesopelagic zone (Jacquet et al., 2011). Surface water concentrations are associated with Ba adsorbed onto particles, whereas the mesopelagic Baxs signal is due to barite crystals formed within decaying bio-aggregates (Cardinal et al., 2005; Lam and Bishop, 2007; Lemaitre et al., 2018; Sternberg et al., 2005). In this study, we observed surface depletion of Baxs at all stations, in line with the assumption that the bulk surface export from the preceding bloom had been achieved at the time of sampling and that the majority of the Baxs had been transferred to the mesopelagic zone.
A sharp increase in σθ observed at the MLD has previously been identified as the depth at which decaying bio-aggregates are formed (Lam and Bishop, 2007). These increases coincided with an increase in Baxs (Fig. 2), linking the subsurface Baxs signal to decaying bio-aggregates as per previous studies (Cardinal et al., 2005; Dehairs et al., 1997; Jacquet et al., 2011). Additionally, decreases observed in dissolved O2 profiles along the transect were also accompanied by coinciding increases in Baxs, in line with O2 consumption due to remineralisation within the mesopelagic zone (Fig. 2) (Cardinal et al., 2005; Jacquet et al., 2005, 2011). The observed range of mesopelagic Baxs concentrations (113–684 pmol L−1) were comparable to those previously reported in SO open waters (∼200–1000 pmol L−1; Cardinal et al., 2001, 2005; Jacquet et al., 2005, 2008a, b, 2011, 2015; Planchon et al., 2013).
Baxs profiles exhibited similar distributions to those reported throughout bloom seasons in the SO, with distinct peaks observed within the mesopelagic zone at all stations. Earlier in the bloom season, peaks mostly occur within the upper half of the mesopelagic zone (100–500 m; Cardinal et al., 2001, 2005; Jacquet et al., 2005, 2008a, 2011, 2015), but as the season progresses, they deepen down towards the bottom half of the mesopelagic zone ( m; Jacquet et al., 2008b, Planchon et al., 2013). Deepening and widening of the remineralisation depth range can be expected as the season progresses due to continued remineralisation taking place as particles sink to the bottom of the mesopelagic zone (Lemaitre et al., 2018; Planchon et al., 2013). This is also what we observed during early winter at stations NPF, with a second peak in deeper waters, as observed by Jacquet et al. (2008b) during the iron (Fe) fertilisation experiment (EIFEX). The deeper peak could also be linked to relatively larger cells that sink faster as they re-mineralise, possibly resulting in a large bloom earlier in the season.
A distinct latitudinal trend in mesopelagic depth-weighted average Baxs has generally been observed in the SO with the highest values in the PFZ, decreasing north and southwards from the PF. These latitudinal trends tend to be accompanied by a coinciding trend in in situ surface biomass measurements (Cardinal et al., 2005; Dehairs et al., 1997, Jacquet et al., 2011; Planchon et al., 2013). During our early winter study, we observed a similar latitudinal trend in mesopelagic Baxs stock (µmol m−2), with an increase from the southernmost station up to the PF, then varying around a maximum in the SAZ, down to the lowest value in the STZ, whereas temporally integrated remotely sensed PP increased progressively northwards to a maximum in the STZ (Fig. S1 in the Supplement). Time of sampling and extended blooms, which are characteristic of the SAZ (Thomalla et al., 2011), could be contributing factors to the higher values observed in PP and mesopelagic Baxs distributions at stations north of the PF (Fig. S1). Contrary to what was expected, the profiles observed during our early winter study still show a significant mesopelagic remineralisation signal well after the summer bloom termination, which occurred between April and May (Fig. 3), as defined by the point in time when community losses outweigh the growth rate (Thomalla et al., 2011).
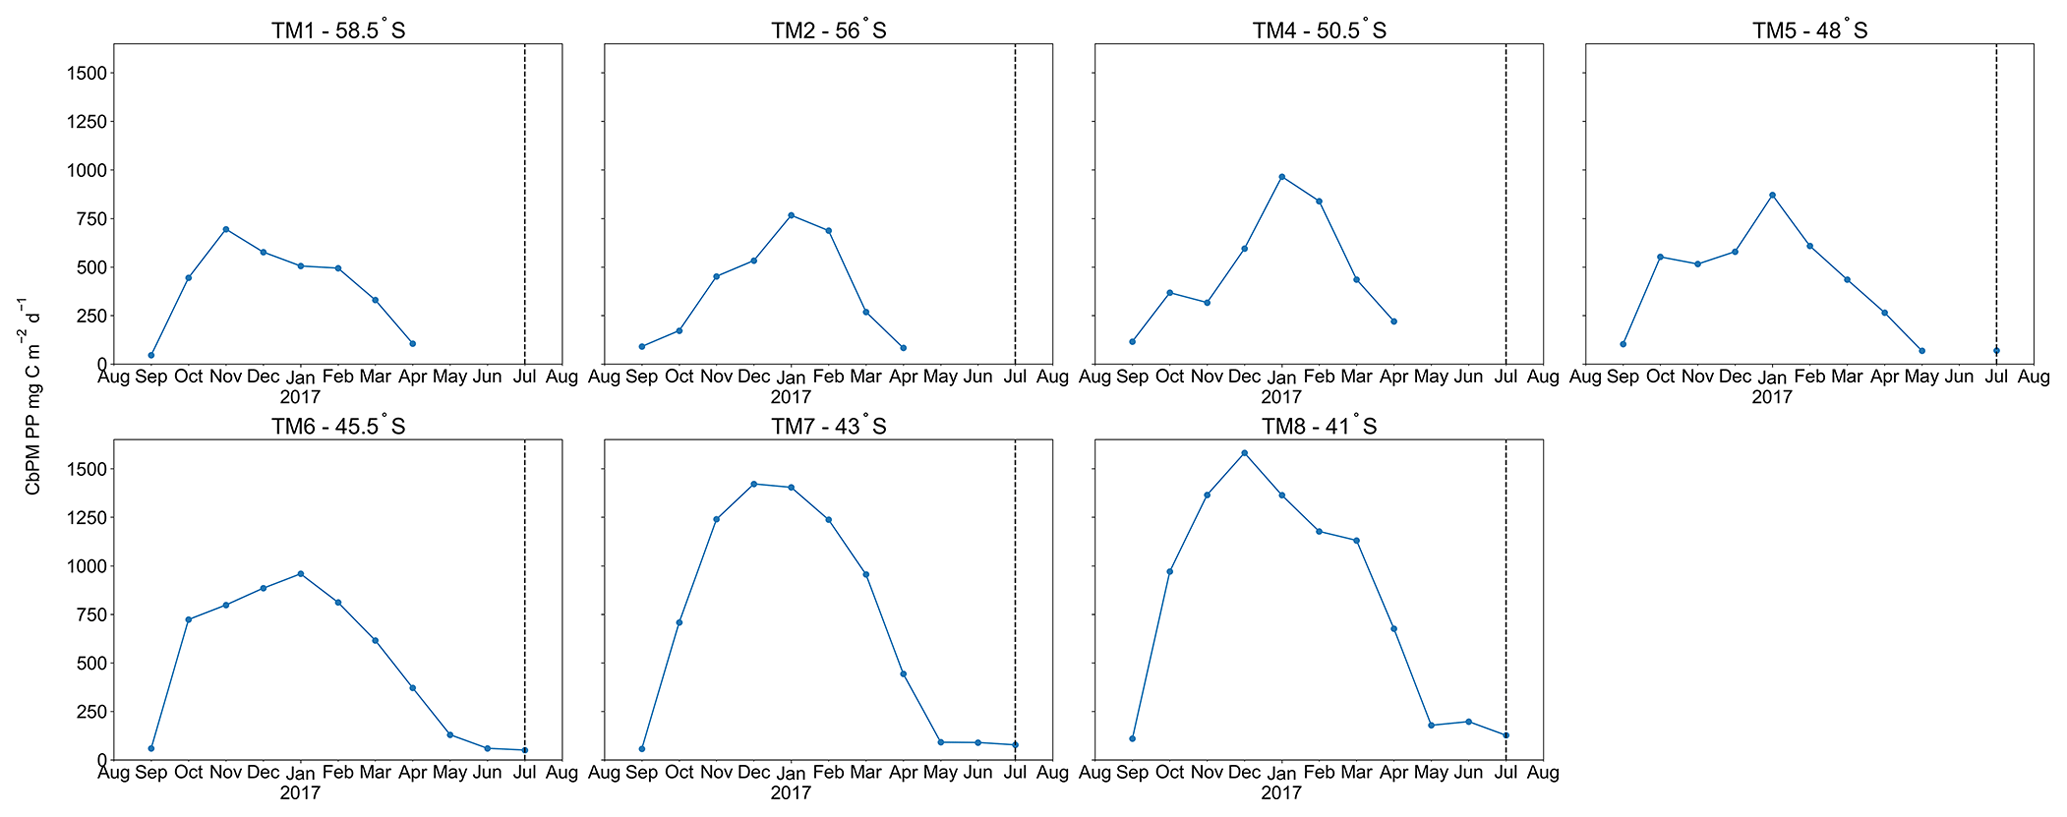
Figure 3Time series, area-averaged ( rectangular sample area, starting 6∘ upstream extending up to the sampled station longitudinally, and 1∘ latitudinally centred around each station) remotely sensed CbPM-PP (mg C m−2 d−1), averaged monthly from August 2016 to August 2017; dashed vertical lines indicate sampling date.
In deeper waters (below 2000 m) along the transect, south of the STF, where remineralisation is minimal compared to the mesopelagic zone, our Baxs concentrations of 161 ± 43 pmol L−1 (mean ± SD, n=15) are not significantly different from the widely used Baresidual concentration of 180 pmol L−1, measured during early spring to late summer (e.g. Jacquet et al., 2008a, b; 2011; 2015; Planchon et al., 2013). We thus did not observe a wintertime decline to an expected “true” SO background value, when PP and bacterial activity are suspected to be minimal (Jacquet et al., 2011). There are two possible explanations for this. Firstly, the decline to a winter background signal might never be achieved due to ongoing barite precipitation and remineralisation, as well as the release of labile Ba attached to phytoplankton as they decay, precipitating into barite crystals, which could possibly continue throughout winter (Cardinal et al., 2005). Secondly, the low sinking speed of suspended barite (∼0.3 m d−1; Sternberg et al., 2008), once produced in the mesopelagic layer, implies that it would take ∼6 years (not considering reaggregation and redissolution) to sink from 300 m (∼ peak of production) to the bottom of the mesopelagic layer (1000 m). The “true” background value may thus have to be measured at the very end of winter just before the initiation of the spring bloom. This also suggests that the Baxs signal in the mesopelagic layer may represent remineralisation activity over more than a few days to weeks, per previous reports (e.g. Dehairs et al., 1997; Jacquet et al., 2015; Planchon et al., 2013).
5.2 Timescale of the mesopelagic Baxs signal
The Baxs signal that we observed in winter is in agreement with the suggestion by Dehairs et al. (1997) that there can be significant carry-over between bloom seasons. Other studies have also pointed out that the timescale of this proxy is longer than a snapshot view (Cardinal et al., 2005) and have highlighted a seasonal increase in mesopelagic Baxs (Jacquet et al., 2011). This strongly suggests that the Baxs signal is not directly linked to synoptic measurements of PP at the time of sampling. In order to investigate this hypothesis, for the first time, we compiled a SO mesopelagic Baxs stock dataset with all available literature data including data from this study (Fig. 4a, Table S3). The mesopelagic Baxs stock was integrated over the Baxs peak depth range (as identified in each study). As can be seen on the map of the compilation dataset (Fig. 4a), these data points were collected across the three basins of the SO over ∼20 years. Despite this diversity in observations, a statistically significant accumulation of mesopelagic Baxs with time is still observed SPF (Fig. 4b) and NPF (Fig. 4c). Mesopelagic Baxs accumulates at a rate of 0.86 (±0.15) µmol m−2 d−1 SPF (R2=0.43, p value ≪0.05, n=43; Fig. 4b) and at 0.88 (±0.20) µmol m−2 d−1 NPF (R2=0.41, p value <0.05, n=31; Fig. 4c), with no statistically significant difference between the two regions (Welch's t test = 0.24; p value = 0.80).
A possible link between the integrated mesopelagic Baxs stock and the corresponding integrated remotely sensed PP was assessed for all studies conducted after September 1997, when remotely sensed PP data became available. To do so, we first estimated that sub-millimetre-sized aggregates would take ∼20 d to sink down to 1000 m (considered as the bottom of the mesopelagic zone in this study) using a sinking speed of 50 m d−1 that corresponds to an average literature value (50–100 m d−1: Riebesell et al., 1991; 50–430 m d−1 around South Georgia: Cavan et al. 2015; mean of ∼100 m d−1 in the SO as reviewed in Laurenceau-Cornec et al., 2015; Marguerite Bay: 10–150 m d−1: McDonnell and Buesseler, 2010). Assuming a maximum surface current speed of 0.2 m s−1 (Ferrari and Nikurashin, 2010), it was estimated that these aggregates would have originated 346 km west from the station that was sampled for mesopelagic Baxs ∼20 d prior. Using this distance, the dimensions of the sample area were set with the southernmost station (TM1) of this study, where degrees of longitude cover the smallest area. For the sake of consistency this sample area was applied to all sampling locations of the considered dataset. The integrated remotely sensed PP (see Sect. 2.5) was then averaged spatially, starting 6∘ upstream extending up to the sampled station longitudinally, and 1∘ latitudinally centred around each station, in order to capture the surface PP that is assumed to translate to the mesopelagic remineralisation and measured Baxs stock.
The monthly averaged remotely sensed PP, at the time of sampling, was compiled for the considered dataset, and we found that the PP over the growing season (Fig. 4d, e) reaches the highest values between January and February (day 125 to 175 of the year), thereafter steadily decreasing to minimal values in July (∼ day 310 of the year, i.e. during our study). The mesopelagic Baxs accumulation over time can not, therefore, be matched with the remotely sensed PP measured during the month of sampling. A possible relationship between mesopelagic Baxs stock and temporally integrated remotely sensed PP was further investigated by considering longer timescales. Remotely sensed PP of the preceding bloom was temporally integrated from the preceding September prior to sampling as the start of the bloom, in general agreement with previous bloom phenology studies (Thomalla et al., 2011), and up to 1 month prior to the sampling date of the study, taking into consideration time needed for export, aggregate formation and barite crystal release through remineralisation (∼1 month).
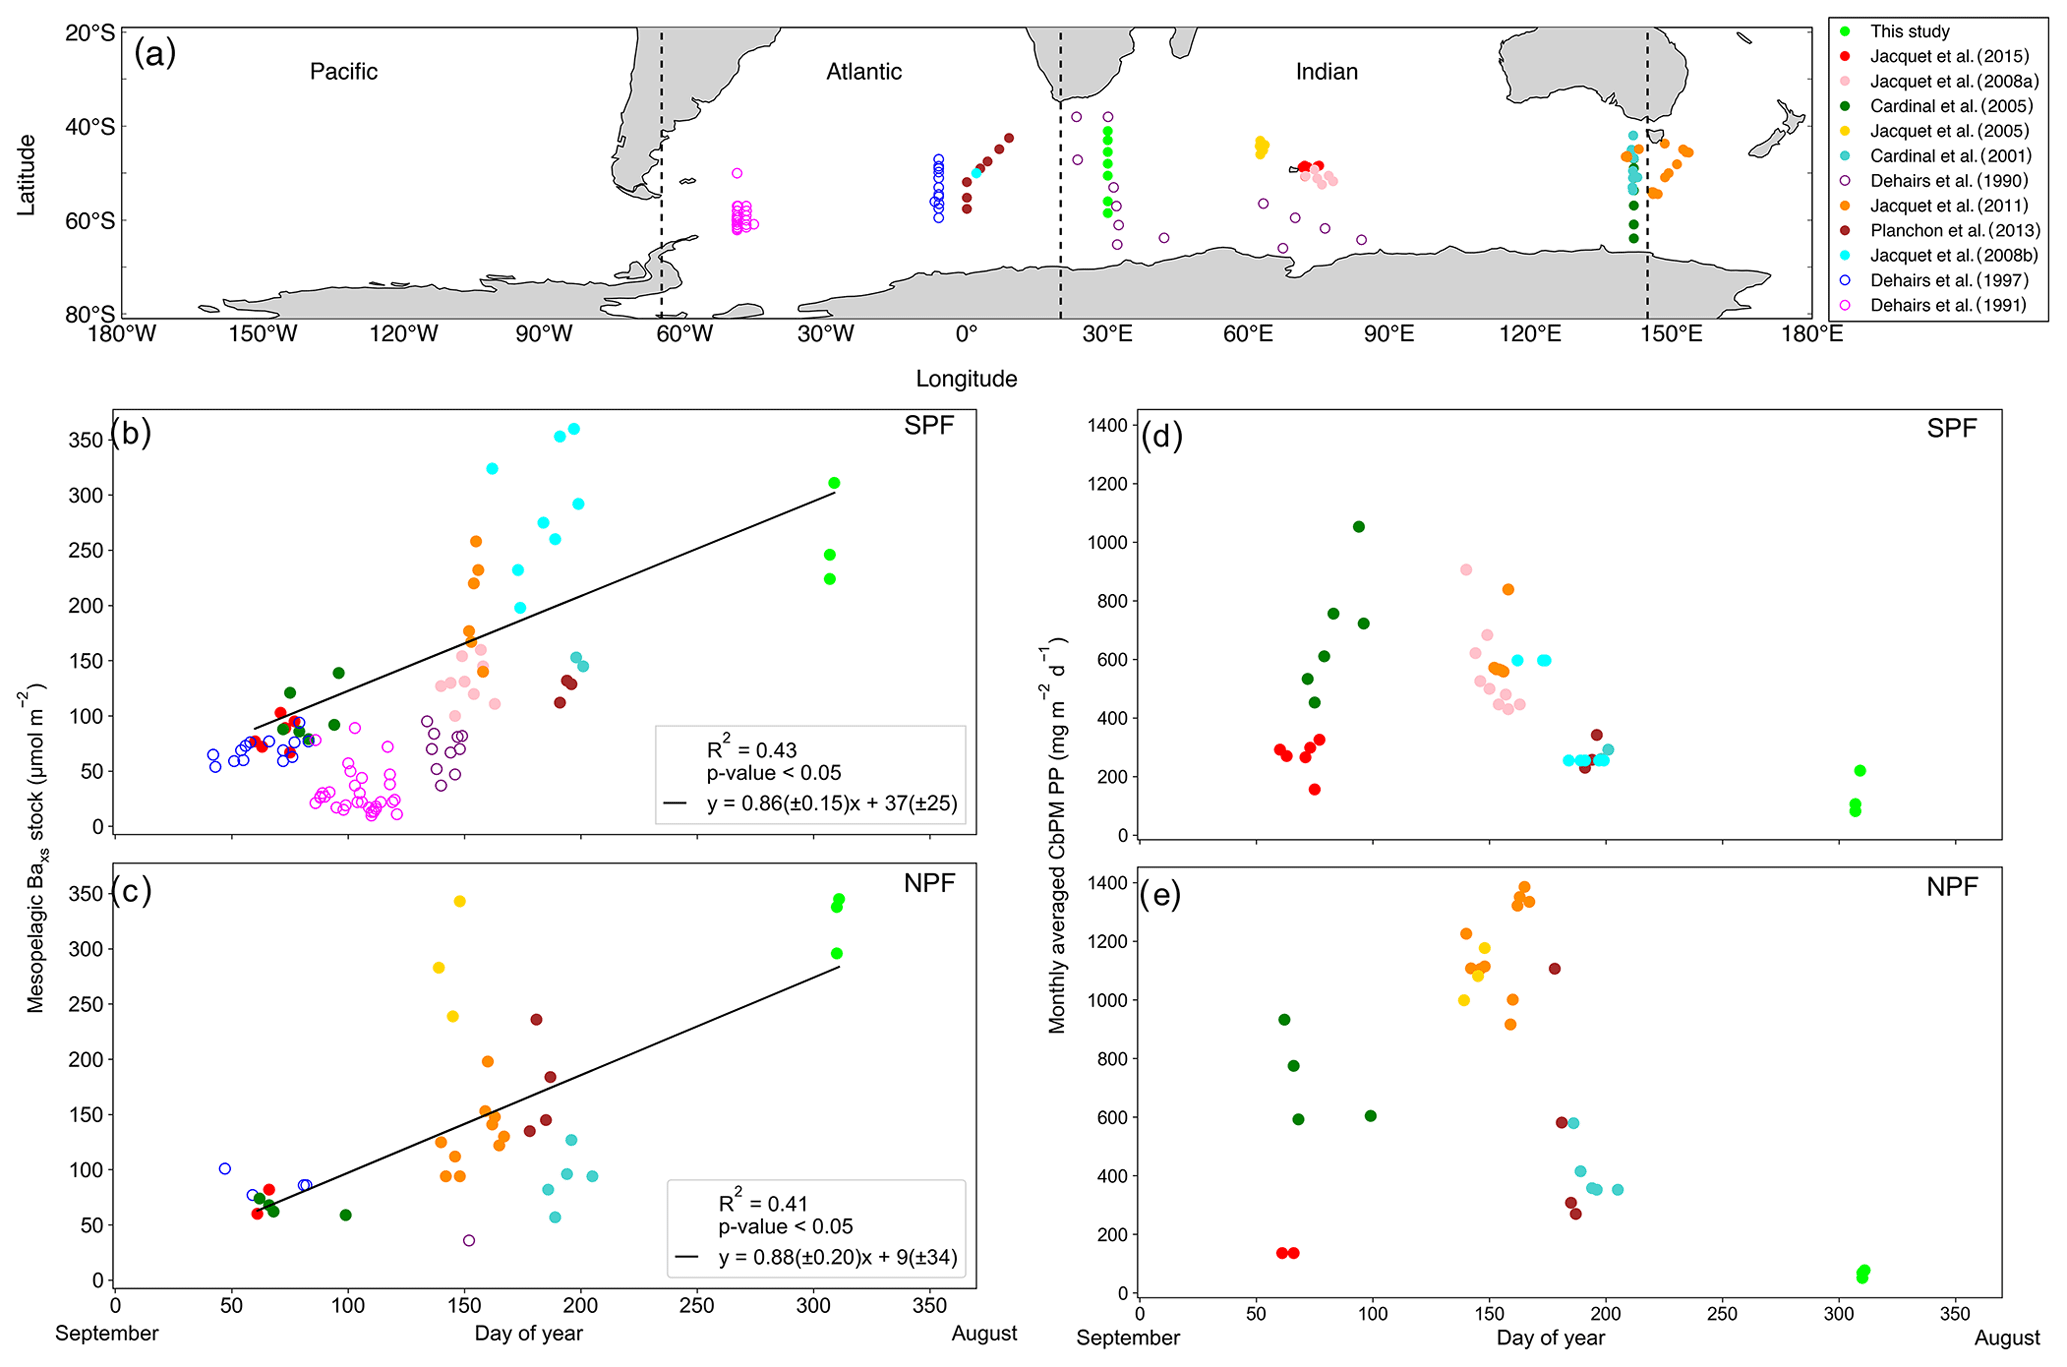
Figure 4(a) Positions of Baxs observations compiled from all known SO studies on a cylindrical equal-area projection of the SO; the three SO basin cut-offs are indicated by the dashed black lines: from left to right Pacific, Atlantic and Indian. Integrated mesopelagic Baxs stock plotted against day of year sampled, with the 1st of September set as day 1, for all available literature data and winter data from this study. Data were split into two zones using the polar front (PF) to divide the SO (b) south of the PF (SPF) and (c) north of the PF (NPF). Monthly averaged remotely sensed PP plotted against day of year for locations and dates of the SO compilation dataset and winter data from this study: (d) SPF and (e) NPF. Open circles are data points from studies which did not use HF in the particulate sample digestion procedure; regressions did not include these data. There was, however, no significant difference when including these data points (Table S3).
Varying timescales were considered between the preceding September up to 1 month prior to sampling (Sept – T1, Table S4), in monthly increments, that could influence the relationship between remotely sensed PP and the mesopelagic Baxs stock (Table S4). The strongest and most significant correlation between the mesopelagic Baxs stock and integrated remotely sensed PP, for both north and south of the PF, was obtained from the preceding September up to 1 month prior to sampling (Sept – T1, Table S4; SPF: Fig. 5a, R2=0.55, p value <0.05, n=39; NPF: Fig. 5b, R2=0.42, p value <0.05, n=31). When remote sensing data were limited due to cloud cover and low sunlight during winter months, specifically at the southernmost stations, all available data were used for the duration of the season. The correlation observed in the STZ is not significant at a 95 % confidence level (p value = 0.10); however, the limited number of data points (n=6) may preclude any significance from emerging. The significant positive correlations obtained south of the STF suggest that mesopelagic Baxs stock can be used as a remineralisation proxy on an annual timescale instead of only a few weeks. Figure 5 also reveals that for a given PP the mesopelagic Baxs stock was 2-fold higher SPF compared to NPF (Welch's t test, t statistic = 2.24; p value <0.05); this is further discussed below.

Figure 5Integrated mesopelagic Baxs stock plotted against integrated remotely sensed PP from the preceding September up to 1 month prior to sampling and all available literature data and winter data from this study (a) south of the PF (SPF, black squares) and (b) north of the PF (NPF, black circles). Red open squares are data points from our winter dataset for which there were not sufficient remote sensing PP data to integrate up to 1 month prior to sampling, and available data up to 3 months prior to sampling were plotted but not included in the statistical analysis.
5.3 Environmental factors influencing mesopelagic remineralisation and carbon export efficiency
Estimated POC remineralisation fluxes along the transect (6–96 mg C m−2 d−1) were on the upper end of the range of fluxes reported in previous studies, with the exception of the STZ station, but within the same order of magnitude for the SO as estimated from spring to autumn (0.2–118 mg C m−2 d−1; Table S3; Cardinal et al., 2005; Jacquet et al., 2011, 2015; Planchon et al., 2013). As the bloom season progresses, more efficient remineralisation rates have been reported in multiple studies (Cardinal et al., 2005; Jacquet et al., 2011; Planchon et al., 2013). However, during late summer as the bloom declines, observations indicate an inefficient BCP due to enhanced surface nutrient recycling (Dehairs et al., 1992; Jacquet et al., 2011; Planchon et al., 2013), leading to a decrease in surface POC export (Planchon et al., 2013). Seasonal variation is reported to be more pronounced northwards within the SO with the least variation observed in the southern Antarctic circumpolar current (Dehairs et al., 1997; Planchon et al., 2013).
The percentage of mesopelagic POC remineralisation as calculated from estimated POC remineralisation fluxes over integrated remotely sensed PP, for the SO compilation dataset (SPF: 19 ± 15 %, n=39; NPF: 10 ± 10 %, n=29; mean ± SD; t statistic = 2.75; p value < 0.05; Table S3), was ∼2-fold higher SPF than NPF, revealing the higher surface carbon export efficiency SPF. Our estimates of percentage of POC re-mineralised fall within the range of reported export efficiencies throughout the SO (2 %–58 %; Jacquet et al., 2011; Morris et al., 2007; Savoye et al., 2008). Our values also support the inverse relationship between export efficiency and productivity, with higher export efficiency in areas of lower production and high productivity low e-ratio (HPLE), where e-ratio refers to the ratio between export production and net primary productivity (Fan et al., 2020; Maiti et al., 2013). Estimated mesopelagic POC remineralisation has been reported to account for a significant fraction of exported carbon in the PFZ and southwards, from 31 % to 97 % from spring to summer, whereas it only accounts for ∼50 % in the SAZ and SAF during summer (Cardinal et al., 2005). A combination of variables can influence surface export efficiency and the magnitude of the subsequent mesopelagic remineralisation, even more so when considering longer timescales. These variables include physical dynamics and interlinked biogeochemical factors, i.e. bacterial activity, phytoplankton community structure, zooplankton grazing and nutrient availability (Bopp et al., 2013; Buesseler and Boyd, 2009; Cardinal et al., 2005; Jacquet et al., 2008b; Pyle et al., 2018). In previous studies, supply and loss via physical transport were deemed negligible relative to decay and loss via production due to minimal advection and diffusion gradients observed on the timescale of days to weeks. These processes were therefore assumed to have minimal impact on the mesopelagic signal (Dehairs et al., 1997; Planchon et al., 2013; Rutgers van der Loeff et al., 2011). It has, however, been observed that features such as mesoscale eddies can have an effect on Baxs distribution by influencing particle patterns on a broad spatial scale, homogenising mesopelagic remineralisation signals by causing relatively flat profiles or shallower remineralisation peaks (Buesseler et al., 2005; Jacquet et al., 2008b). The region of our winter study is known for being a mesoscale eddy hotspot due to the South-west Indian Ridge (Ansorge et al., 2015). In the STZ, extremely dynamic submesoscale activity due to the Agulhas return current may indeed have significantly influenced the mesopelagic signal and may help explain the absence of correlation with integrated surface PP. On the contrary, south of the STF, the significant correlations seem to indicate that physical transport variability is not the main process affecting the mesopelagic Baxs signal and that biogeochemical factors may be dominant.
The Fe-limited SAZ (Ryan-Keogh et al., 2018) and AZ (Viljoen et al., 2018) have generally mixed and seasonally changing assemblages of pico-, nano- and micro-phytoplankton (Eriksen et al., 2018; Gall et al., 2001). Diatoms tend to dominate in the silicate-rich waters south of the PF (Petrou et al., 2016; Rembauville et al., 2017; Wright et al., 2010), whilst seasonally silicate-limited waters north of the PF favour smaller phytoplankton groups (Freeman et al., 2018; Nissen et al., 2018; Trull et al., 2018). HPLE regimes are indeed characteristic of large areas of the SAZ mainly due to surface POC accumulation caused by non-sinking particles, tending towards less efficient export of smaller cells (Fan et al., 2020). Even when large particles are abundant in HPLE surface layers, a complex grazing community may prevent the export of large particles (Dehairs et al., 1992; Lam and Bishop, 2007). This can explain the higher surface carbon export efficiency that we estimate SPF compared to NPF. Export efficiency has also been linked to bacterial productivity with efficient surface remineralisation limiting surface POC export when most of the water column integrated bacterial productivity is restricted to the upper mixed layer (Dehairs et al., 1992; Jacquet et al., 2011), which can be the case to varying degrees throughout the SO. In the STZ phytoplankton communities are reported to be dominated by prokaryotic picoplankton including cyanobacteria and prochlorophytes (Mendes et al., 2015). These groups utilise regenerated nutrients in the surface mixed layer tending towards diminished surface export efficiency with high concentrations of non-sinking POC (Fan et al., 2020; Planchon et al. 2013). In addition to this, the potential influence of high submesoscale activity may explain the low mesopelagic Baxs measured at the STZ station of this study despite it being the station with the highest integrated PP (Fig. S1). Linking temporally integrated remotely sensed PP to mesopelagic Baxs stock, coupled with the added influence of physical dynamics affecting surface export efficiencies and along longer timescales, could give better estimates of export and remineralisation signals throughout the SO on an annual and basin scale. Our estimates of percentage re-mineralised POC over remotely sensed PP may contribute to the improved modelling of the C cycle over the SO on an annual timescale.
Our unique early winter Baxs data were similar in magnitude and exhibited the same relationship with σθ and dissolved O2 gradients as observed in summer, indicating that processes controlling this signal in summer are still driving the signal in early winter. The expected decline of the mesopelagic Baxs signal to background values during winter was not observed in this study, supporting the hypothesis that this remineralisation proxy likely has a longer timescale than previously reported. The absolute decline might be delayed due to the cumulative behaviour of mesopelagic Baxs, ongoing remineralisation and barite precipitation. The “true” SO background value may thus have to be measured at the very end of winter, prior to bloom initiation.
Significant positive correlations north and south of the PF between mesopelagic Baxs stock and remotely sensed PP integrated from September to 1 month before sampling (Sept – T1, Table S4), in combination with significant Baxs accumulation trends obtained for the SO compilation dataset, suggest an annual timescale. They may also indicate that physical processes do not dominate the mesopelagic signal on an annual scale within the SO and that biogeochemical factors are dominant. There is no significant difference in mesopelagic Baxs and POC remineralisation north and south of the PF, but the significantly higher integrated remotely sensed PP to the north when compared to the south indicates a greater export efficiency south of the PF. This is in accordance with the phenomenon of HPLE regimes which are common throughout the SO, more so north of the PF than south of the PF (Fan et al., 2020). The longer timescale of Baxs and the cumulative behaviour of this proxy in the mesopelagic zone make it possible to use Baxs on an annual scale for the estimation of POC remineralisation fluxes throughout the SO and to better understand how variable environmental factors influence these processes on a basin scale. We believe that the significance of these relationships will improve as more data become available (e.g. GEOTRACES IDP2021), which will assist in better understanding and constraining the timescale of remineralisation and carbon export efficiency throughout the SO.
Data used in this study have been published in the online open-source repository Zenodo and can be accessed at https://doi.org/10.5281/zenodo.6583338 (van Horsten et al., 2022).
The supplement related to this article is available online at: https://doi.org/10.5194/bg-19-3209-2022-supplement.
This study was conceptualised by NRvH, HP, GS and EB. Formal analysis, investigation and validation of data was carried out by NRvH, HP, GS, EB and TJRK. NRvH and TJRK contributed towards the visualisation of the data. HP, GS, TNM, AR, NL and EB contributed towards supervision and resources. Funding was acquired by NRvH, TNM, AR and EB. All authors contributed towards writing, reviewing and editing the final manuscript.
The contact author has declared that neither they nor their co-authors have any competing interests.
Publisher’s note: Copernicus Publications remains neutral with regard to jurisdictional claims in published maps and institutional affiliations.
This work was supported by the ISblue project, Interdisciplinary Graduate School for the Blue Planet (ANR-17-EURE-0015), and co-funded by a grant from the French government under the programme “Investissements d'Avenir”. International collaboration was made possible by funding received by the French–South African National Research Foundation (NRF) Collaboration (PROTEA; FSTR180418322331), NRF funding (SNA170518231343 and UID 110715) including funding from South African Department of Science and Innovation, French Ministry of National Education, Higher Education and Research, and the French Ministry of Foreign Affairs and International Development. We would like to thank the captain and crew of the R/V SA Agulhas II for their invaluable efforts, as well as all the research participants who assisted our fieldwork. Thanks to Isabelle Ansorge, Marcel du Plessis and Esther Portela for their assistance with water mass identification and Catherine Jeandel for her invaluable expert insight. Finally, we thank the three reviewers, Frank Dehairs, Stéphanie Jacquet and James K. B. Bishop, for their insightful reviews, thereby improving the quality of our manuscript. A special thank you to Frank Dehairs for sharing the Indigo 3, EPOS 2 and ANTX/6 data.
This research has been supported by the Council for Scientific and Industrial Research, South Africa (grant no. SNA170518231343).
This paper was edited by Carol Robinson and reviewed by Frank Dehairs, Stéphanie Jacquet, and J. K. B. Bishop.
Anilkumar, N. and Sabu, P.: Physical process influencing the ecosystem of the indian sector of southern ocean-An overview, Proc. Indian Natl. Sci. Acad., 83, 363–376, https://doi.org/10.16943/ptinsa/2017/48960, 2017.
Ansorge, I. J., Jackson, J. M., Reid, K., Durgadoo, J. V, Swart, S., and Eberenz, S.: Evidence of a southward eddy corridor in the South-West Indian ocean, Deep-Sea Res. Pt. II, 119, 69–76, https://doi.org/10.1016/j.dsr2.2014.05.012, 2015.
Armstrong, R. A., Peterson, M. L., Lee, C., and Wakeham, S. G.: Settling velocity spectra and the ballast ratio hypothesis, Deep-Sea Res. Pt. II, 56, 1470–1478, https://doi.org/10.1016/j.dsr2.2008.11.032, 2009.
Barbur, V. A., Montgomery, D. C., and Peck, E. A.: Introduction to Linear Regression Analysis, Stat., 43, 339, https://doi.org/10.2307/2348362, 1994.
Behrenfeld, M. J., Boss, E., Siegel, D. A., and Shea, D. M.: Carbon-based ocean productivity and phytoplankton physiology from space, Global Biogeochem. Cy., 19, 1–14, https://doi.org/10.1029/2004GB002299, 2005.
Bishop, J. K. B.: The barite-opal-organic carbon association in oceanic particulate matter, Nature, 332, 341–343, https://doi.org/10.1038/332341a0, 1988.
Bishop, J. K. B. and Edmond, J. M.: A new large volume filtration system for the sampling of oceanic particulate matter, J. Mar. Res., 34, 181–198, 1976.
Bopp, L., Resplandy, L., Orr, J. C., Doney, S. C., Dunne, J. P., Gehlen, M., Halloran, P., Heinze, C., Ilyina, T., Séférian, R., Tjiputra, J., and Vichi, M.: Multiple stressors of ocean ecosystems in the 21st century: projections with CMIP5 models, Biogeosciences, 10, 6225–6245, https://doi.org/10.5194/bg-10-6225-2013, 2013.
Boyd, P. W., Claustre, H., Levy, M., Siegel, D. A. and Weber, T.: Multi-faceted particle pumps drive carbon sequestration in the ocean, Nature, 568, 327–335, https://doi.org/10.1038/s41586-019-1098-2, 2019.
Broecker, W. S., Takahashi, T. and Takahashi, T.: Sources and flow patterns of deep-ocean waters as deduced from potential temperature, salinity, and initial phosphate concentration, J. Geophys. Res.-Oceans, 90, 6925–6939, https://doi.org/10.1029/JC090iC04p06925, 1985.
Buesseler, K. O.: The decoupling of production and particulate export in the surface ocean, Global Biogeochem. Cy., 12, 297–310, https://doi.org/10.1029/97GB03366, 1998.
Buesseler, K. O., Andrews, J. E., Pike, S. M., Charette, M. A., Goldson, L. E., Brzezinski, M. A., and Lance, V. P.: Particle export during the Southern Ocean Iron Experiment (SOFeX), Limnol. Oceanogr., 50, 311–327, https://doi.org/10.4319/lo.2005.50.1.0311, 2005.
Buesseler, K. O. and Boyd, P. W.: Shedding light on processes that control particle export and flux attenuation in the twilight zone of the open ocean, Limnol. Oceanogr., 54, 1210–1232, https://doi.org/10.4319/lo.2009.54.4.1210, 2009.
Cardinal, D., Dehairs, F., Cattaldo, T., and André, L.: Geochemistry of suspended particles in the Subantarctic and Polar Frontal zones south of Australia: Constraints on export and advection processes, J. Geophys. Res.-Ocean., 106, 31637–31656, https://doi.org/10.1029/2000JC000251, 2001.
Cardinal, D., Savoye, N., Trull, T. W., André, L., Kopczynska, E. E., and Dehairs, F.: Variations of carbon remineralisation in the Southern Ocean illustrated by the Baxs proxy, Deep-Sea Res. Pt. I, 52, 355–370, https://doi.org/10.1016/j.dsr.2004.10.002, 2005.
Cavan, E. L., Le Moigne, F. A. C., Poulton, A. J., Tarling, G. A., Ward, P., Daniels, C. J., Fragoso, G. M., and Sanders, R. J.: Attenuation of particulate organic carbon flux in the Scotia Sea, Southern Ocean, is controlled by zooplankton fecal pellets, Geophys. Res. Lett., 42, 821–830, https://doi.org/10.1002/2014GL062744, 2015.
Cutter, G., Casciotti, K., Croot, P., Geibert, W., Heimbürger, L.-E., Lohan, M., Planquette, H., and van de Flierdt, T.: Sampling and Sample-handling Protocols for GEOTRACES Cruises, Version 3, 139 pp., http://www.geotraces.org/images/stories/documents/intercalibration/Cookbook.pdf (last access: 15 February 2019), 2017.
de Boyer Montégut, C., Madec, G., Fischer, A. S., Lazar, A., and Iudicone, D.: Mixed layer depth over the global ocean: An examination of profile data and a profile-based climatology, J. Geophys. Res.-Oceans, 109, 1–20, https://doi.org/10.1029/2004JC002378, 2004.
Dehairs, F., Baeyens, W. and Goeyens, L.: Accumulation of Suspended Barite at Mesopelagic Depths and Export Production in the Southern Ocean, Science 258, 1332–1335, https://doi.org/10.1126/SCIENCE.258.5086.1332, 1992.
Dehairs, F., Chesselet, R., and Jedwab, J.: Discrete suspended particles of barite and the barium cycle in the open ocean, Earth Planet. Sc. Lett., 49, 528–550, https://doi.org/10.1016/0012-821X(80)90094-1, 1980.
Dehairs, F. and Goeyens, L.: Oxidation rate of organic carbon in the mesopelagic water column as traced by suspended barium-barite, Integr. Mar. Syst. Anal., 205–217, 1996.
Dehairs, F., Goeyens, L., Stroobants, N., Bernard, P., Goyet, C., Poisson, A. and Chesselet, R.: On suspended barite and the oxygen minimum in the Southern Ocean, Global Biogeochem. Cy., 4, 85–102, https://doi.org/10.1029/GB004I001P00085, 1990.
Dehairs, F., Shopova, D., Ober, S., Veth, C. and Goeyens, L.: Particulate barium stocks and oxygen consumption in the Southern Ocean mesopelagic water column during spring and early summer: Relationship with export production, Deep-Sea Res. Pt. II, 44, 497–516, https://doi.org/10.1016/S0967-0645(96)00072-0, 1997.
Dehairs, F., Stroobants, N., and Goeyens, L.: Suspended barite as a tracer of biological activity in the Southern Ocean, Mar. Chem., 35, 399–410, https://doi.org/10.1016/S0304-4203(09)90032-9, 1991.
de Jong, E., Vichi, M., Mehlmann, C. B., Eayrs, C., De Kock, W., Moldenhauer, M., and Audh, R. R.: Sea Ice conditions within the Antarctic Marginal Ice Zone in winter 2017, onboard the SA Agulhas II, Univ. Cape Town, PANGAEA, https://doi.org/10.1594/PANGAEA.885211, 2018.
DeVries, T. and Weber, T.: The export and fate of organic matter in the ocean: New constraints from combining satellite and oceanographic tracer observations, Global Biogeochem. Cy., 31, 535–555, https://doi.org/10.1002/2016GB005551, 2017.
Ducklow, H. W., Steinberg, D. K., and Buesseler, K. O.: Upper ocean carbon export and the biological pump, Oceanography, 14, 50–58, https://doi.org/10.5670/oceanog.2001.06, 2001.
Dymond, J., Suess, E., and Lyle, M.: Barium in Deep-Sea Sediment: A Geochemical Proxy for Paleoproductivity, Paleoceanography, 7, 163–181, https://doi.org/10.1029/92PA00181, 1992.
Ehrhardt, M., Grasshoff, K., Kremling, K., and Almgren, T. (Eds.): Methods of seawater analysis, edited by: Grasshoff, K., Ehrhardt, M., and Kremling, K.; with contributions by T. Almgren, Verlag Chemie, Weinheim, 1983.
Eriksen, R., Trull, T. W., Davies, D., Jansen, P., Davidson, A. T., Westwood, K., and Van Den Enden, R.: Seasonal succession of phytoplankton community structure from autonomous sampling at the Australian Southern Ocean Time Series (SOTS) observatory, Mar. Ecol. Prog. Ser., 589, 13–21, https://doi.org/10.3354/meps12420, 2018.
Fan, G., Han, Z., Ma, W., Chen, S., Chai, F., Mazloff, M. R., Pan, J., and Zhang, H.: Southern Ocean carbon export efficiency in relation to temperature and primary productivity, Sci. Rep., 10, 1–11, https://doi.org/10.1038/s41598-020-70417-z, 2020.
Ferrari, R. and Nikurashin, M.: Suppression of eddy diffusivity across jets in the Southern Ocean, J. Phys. Oceanogr., 40, 1501–1519, https://doi.org/10.1175/2010JPO4278.1, 2010.
Freeman, N. M., Lovenduski, N. S., Munro, D. R., Krumhardt, K. M., Lindsay, K., Long, M. C., and Maclennan, M.: The Variable and Changing Southern Ocean Silicate Front: Insights from the CESM Large Ensemble, Global Biogeochem. Cy., 32, 752–768, https://doi.org/10.1029/2017GB005816, 2018.
Friedlingstein, P., Jones, M. W., O'Sullivan, M., Andrew, R. M., Hauck, J., Peters, G. P., Peters, W., Pongratz, J., Sitch, S., Le Quéré, C., Bakker, D. C. E., Canadell, J. G., Ciais, P., Jackson, R. B., Anthoni, P., Barbero, L., Bastos, A., Bastrikov, V., Becker, M., Bopp, L., Buitenhuis, E., Chandra, N., Chevallier, F., Chini, L. P., Currie, K. I., Feely, R. A., Gehlen, M., Gilfillan, D., Gkritzalis, T., Goll, D. S., Gruber, N., Gutekunst, S., Harris, I., Haverd, V., Houghton, R. A., Hurtt, G., Ilyina, T., Jain, A. K., Joetzjer, E., Kaplan, J. O., Kato, E., Klein Goldewijk, K., Korsbakken, J. I., Landschützer, P., Lauvset, S. K., Lefèvre, N., Lenton, A., Lienert, S., Lombardozzi, D., Marland, G., McGuire, P. C., Melton, J. R., Metzl, N., Munro, D. R., Nabel, J. E. M. S., Nakaoka, S.-I., Neill, C., Omar, A. M., Ono, T., Peregon, A., Pierrot, D., Poulter, B., Rehder, G., Resplandy, L., Robertson, E., Rödenbeck, C., Séférian, R., Schwinger, J., Smith, N., Tans, P. P., Tian, H., Tilbrook, B., Tubiello, F. N., van der Werf, G. R., Wiltshire, A. J., and Zaehle, S.: Global Carbon Budget 2019, Earth Syst. Sci. Data, 11, 1783–1838, https://doi.org/10.5194/essd-11-1783-2019, 2019.
Gall, M. P., Boyd, P. W., Hall, J., Safi, K. A., and Chang, H.: Phytoplankton processes, Part 1: Community structure during the Southern Ocean Iron RElease Experiment (SOIREE), Deep-Sea Res. Pt. II, 48, 2551–2570, https://doi.org/10.1016/S0967-0645(01)00008-X, 2001.
GEOTRACES Intermediate Data Product Group: The GEOTRACES Intermediate Data Product 2021 (IDP2021), NERC EDS British Oceanographic Data Centre NOC, [data set], https://doi.org/10.5285/cf2d9ba9-d51d-3b7c-e053-8486abc0f5fd, 2021.
Gill, A. E.: Atmosphere-ocean dynamics, NEW YORK, U.S.A., ACADEMIC PRESS INC., https://doi.org/10.1016/0141-1187(83)90039-1, 1982.
Gregor, L., Lebehot, A. D., Kok, S., and Scheel Monteiro, P. M.: A comparative assessment of the uncertainties of global surface ocean CO2 estimates using a machine-learning ensemble (CSIR-ML6 version 2019a) – have we hit the wall?, Geosci. Model Dev., 12, 5113–5136, https://doi.org/10.5194/gmd-12-5113-2019, 2019.
Gruber, N., Landschützer, P., and Lovenduski, N. S.: The variable southern ocean carbon sink, Ann. Rev. Mar. Sci., 11, 159–186, https://doi.org/10.1146/annurev-marine-121916-063407, 2019.
Honjo, S., Eglinton, T. I., Taylor, C. D., Ulmer, K. M., Sievert, S. M., Bracher, A., German, C. R., Edgcomb, V., Francois, R., Deboraiglesias-Rodriguez, M., Van Mooy, B., and Repeta, D. J.: Understanding the role of the biological pump in the global carbon cycle: An imperative for ocean science, Oceanography, 27, 10–16, https://doi.org/10.5670/oceanog.2014.78, 2014.
Ito, T., Follows, M. J., and Boyle, E. A.: Is AOU a good measure of respiration in the oceans?, Geophys. Res. Lett., 31, 1–4, https://doi.org/10.1029/2004GL020900, 2004.
Jacquet, S. H. M., Dehairs, F., Cardinal, D., Navez, J., and Delille, B.: Barium distribution across the Southern Ocean frontal system in the Crozet-Kerguelen Basin, Mar. Chem., 95, 149–162, https://doi.org/10.1016/j.marchem.2004.09.002, 2005.
Jacquet, S. H. M., Dehairs, F., Elskens, M., Savoye, N., and Cardinal, D.: Barium cycling along WOCE SR3 line in the Southern Ocean, Mar. Chem., 106, 33–45, https://doi.org/10.1016/j.marchem.2006.06.007, 2007.
Jacquet, S. H. M., Dehairs, F., Savoye, N., Obernosterer, I., Christaki, U., Monnin, C., and Cardinal, D.: Mesopelagic organic carbon remineralization in the Kerguelen Plateau region tracked by biogenic particulate Ba, Deep-Sea Res. Pt. II, 55, 868–879, https://doi.org/10.1016/j.dsr2.2007.12.038, 2008a.
Jacquet, S. H. M., Savoye, N., Dehairs, F., Strass, V. H., and Cardinal, D.: Mesopelagic carbon remineralization during the European Iron Fertilization Experiment, Global Biogeochem. Cy., 22, 1–9, https://doi.org/10.1029/2006GB002902, 2008b.
Jacquet, S. H. M., Dehairs, F., Dumont, I., Becquevort, S., Cavagna, A. J., and Cardinal, D.: Twilight zone organic carbon remineralization in the Polar Front Zone and Subantarctic Zone south of Tasmania, Deep-Sea Res. Pt. II, 58, 2222–2234, https://doi.org/10.1016/j.dsr2.2011.05.029, 2011.
Jacquet, S. H. M., Dehairs, F., Lefèvre, D., Cavagna, A. J., Planchon, F., Christaki, U., Monin, L., André, L., Closset, I., and Cardinal, D.: Early spring mesopelagic carbon remineralization and transfer efficiency in the naturally iron-fertilized Kerguelen area, Biogeosciences, 12, 1713–1731, https://doi.org/10.5194/bg-12-1713-2015, 2015.
Jochum, K. P., Nohl, U., Herwig, K., Lammel, E., Stoll, B., and Hofmann, A. W.: GeoReM: A new geochemical database for reference materials and isotopic standards, Geostand. Geoanal. Res., 29, 333–338, https://doi.org/10.1111/j.1751-908x.2005.tb00904.x, 2005.
Kokoska, S. and Zwillinger, D.: CRC Standard Probability and Statistics Tables and Formulae, Student Edition, https://doi.org/10.1201/b16923, 2000.
Lam, P. J. and Bishop, J. K. B.: High biomass, low export regimes in the Southern Ocean, Deep-Sea Res. Pt. II, 54, 601–638, https://doi.org/10.1016/j.dsr2.2007.01.013, 2007.
Laurenceau-Cornec, E. C., Trull, T. W., Davies, D. M., Bray, S. G., Doran, J., Planchon, F., Carlotti, F., Jouandet, M.-P., Cavagna, A.-J., Waite, A. M., and Blain, S.: The relative importance of phytoplankton aggregates and zooplankton fecal pellets to carbon export: insights from free-drifting sediment trap deployments in naturally iron-fertilised waters near the Kerguelen Plateau, Biogeosciences, 12, 1007–1027, https://doi.org/10.5194/bg-12-1007-2015, 2015.
Le Moigne, F. A. C.: Pathways of Organic Carbon Downward Transport by the Oceanic Biological Carbon Pump, Front. Mar. Sci., 634, 6, https://doi.org/10.3389/fmars.2019.00634, 2019.
Legeleux, F. and Reyss, J. L.: 228Ra 226Ra activity ratio in oceanic settling particles: Implications regarding the use of barium as a proxy for paleoproductivity reconstruction, Deep-Sea Res. Pt. I, 43, 1857–1863, https://doi.org/10.1016/S0967-0637(96)00086-6, 1996.
Lemaitre, N., Planquette, H., Planchon, F., Sarthou, G., Jacquet, S., García-Ibáñez, M. I., Gourain, A., Cheize, M., Monin, L., André, L., Laha, P., Terryn, H., and Dehairs, F.: Particulate barium tracing of significant mesopelagic carbon remineralisation in the North Atlantic, Biogeosciences, 15, 2289–2307, https://doi.org/10.5194/bg-15-2289-2018, 2018.
Maiti, K., Charette, M. A., Buesseler, K. O., and Kahru, M.: An inverse relationship between production and export efficiency in the Southern Ocean, Geophys. Res. Lett., 40, 1557–1561, https://doi.org/10.1002/GRL.50219, 2013.
Marsay, C. M., Sanders, R. J., Henson, S. A., Pabortsava, K., Achterberg, E. P., and Lampitt, R. S.: Attenuation of sinking particulate organic carbon flux through the mesopelagic ocean, P. Natl. Acad. Sci. USA, 112, 1089–1094, https://doi.org/10.1073/pnas.1415311112, 2015.
McDonnell, A. M. P. and Buesseler, K. O.: Variability in the average sinking velocity of marine particles, Limnol. Oceanogr., 55, 2085–2096, https://doi.org/10.4319/LO.2010.55.5.2085, 2010.
Mendes, C. R. B., Kerr, R., Tavano, V. M., Cavalheiro, F. A., Garcia, C. A. E., Gauns Dessai, D. R., and Anilkumar, N.: Cross-front phytoplankton pigments and chemotaxonomic groups in the Indian sector of the Southern Ocean, Deep-Sea Res. Pt. II, 118, 221–232, https://doi.org/10.1016/j.dsr2.2015.01.003, 2015.
Morris, P. J., Sanders, R., Turnewitsch, R., and Thomalla, S.: 234Th-derived particulate organic carbon export from an island-induced phytoplankton bloom in the Southern Ocean, Deep-Sea Res. Pt. II, 54, 2208–2232, https://doi.org/10.1016/J.DSR2.2007.06.002, 2007.
Nissen, C., Vogt, M., Münnich, M., Gruber, N., and Haumann, F. A.: Factors controlling coccolithophore biogeography in the Southern Ocean, Biogeosciences, 15, 6997–7024, https://doi.org/10.5194/bg-15-6997-2018, 2018.
Orsi, A. H., Whitworth, T., and Nowlin, W. D.: On the meridional extent and fronts of the Antarctic Circumpolar Current, Deep-Sea Res. Pt. I, 42, 641–673, https://doi.org/10.1016/0967-0637(95)00021-W, 1995.
Passow, U. and Carlson, C. A.: The biological pump in a high CO2 world, Mar. Ecol. Prog. Ser., 470, 249–271, https://doi.org/10.3354/meps09985, 2012.
Petrou, K., Kranz, S. A., Trimborn, S., Hassler, C. S., Ameijeiras, S. B., Sackett, O., Ralph, P. J., and Davidson, A. T.: Southern Ocean phytoplankton physiology in a changing climate, J. Plant Physiol., 203, 135–150, https://doi.org/10.1016/j.jplph.2016.05.004, 2016.
Planchon, F., Cavagna, A.-J., Cardinal, D., André, L., and Dehairs, F.: Late summer particulate organic carbon export and twilight zone remineralisation in the Atlantic sector of the Southern Ocean, Biogeosciences, 10, 803–820, https://doi.org/10.5194/bg-10-803-2013, 2013.
Planquette, H. and Sherrell, R. M.: Sampling for particulate trace element determination using water sampling bottles: Methodology and comparison to in situ pumps, Limnol. Oceanogr.-Meth., 10, 367–388, https://doi.org/10.4319/lom.2012.10.367, 2012.
Pollard, R. T., Lucas, M. I., and Read, J. F.: Physical controls on biogeochemical zonation in the Southern Ocean, Deep-Sea Res. Pt. II, 49, 3289–3305, https://doi.org/10.1016/S0967-0645(02)00084-X, 2002.
Pyle, K. M., Hendry, K. R., Sherrell, R. M., Legge, O., Hind, A. J., Bakker, D., Venables, H., and Meredith, M. P.: Oceanic fronts control the distribution of dissolved barium in the Southern Ocean, Mar. Chem., 204, 95–106, https://doi.org/10.1016/j.marchem.2018.07.002, 2018.
Rembauville, M., Briggs, N., Ardyna, M., Uitz, J., Catala, P., Penkerc'h, C., Poteau, A., Claustre, H., and Blain, S.: Plankton Assemblage Estimated with BGC-Argo Floats in the Southern Ocean: Implications for Seasonal Successions and Particle Export, J. Geophys. Res.-Oceans, 122, 8278–8292, https://doi.org/10.1002/2017JC013067, 2017.
Riebesell, U.: Particle aggregation during a diatom bloom, II. Biological aspects, Mar. Ecol. Prog. Ser., 69, 281–291, https://doi.org/10.3354/meps069281, 1991.
Rio, M. H., Guinehut, S., and Larnicol, G.: New CNES-CLS09 global mean dynamic topography computed from the combination of GRACE data, altimetry, and in situ measurements, J. Geophys. Res.-Oceans, 116, 1–25, https://doi.org/10.1029/2010JC006505, 2011.
Robinson, C., Steinberg, D. K., Anderson, T. R., Arístegui, J., Carlson, C. A., Frost, J. R., Ghiglione, J. F., Hernández-León, S., Jackson, G. A., Koppelmann, R., Quéguiner, B., Ragueneau, O., Rassoulzadegan, F., Robison, B. H., Tamburini, C., Tanaka, T., Wishner, K. F., and Zhang, J.: Mesopelagic zone ecology and biogeochemistry – A synthesis, Deep-Sea Res. Pt. II, 57, 1504–1518, https://doi.org/10.1016/j.dsr2.2010.02.018, 2010.
Rosengard, S. Z., Lam, P. J., Balch, W. M., Auro, M. E., Pike, S., Drapeau, D., and Bowler, B.: Carbon export and transfer to depth across the Southern Ocean Great Calcite Belt, Biogeosciences, 12, 3953–3971, https://doi.org/10.5194/bg-12-3953-2015, 2015.
Rutgers van der Loeff, M. M., Cai, P. H., Stimac, I., Bracher, A., Middag, R., Klunder, M. B., and van Heuven, S. M. A. C.: 234Th in surface waters: Distribution of particle export flux across the Antarctic Circumpolar Current and in the Weddell Sea during the GEOTRACES expedition ZERO and DRAKE, Deep-Sea Res. Pt. II, 58, 2749–2766, https://doi.org/10.1016/j.dsr2.2011.02.004, 2011.
Ryan-Keogh, T. J., Thomalla, S. J., Mtshali, T. N., van Horsten, N. R., and Little, H. J.: Seasonal development of iron limitation in the sub-Antarctic zone, Biogeosciences, 15, 4647–4660, https://doi.org/10.5194/bg-15-4647-2018, 2018.
Sarmiento, J. and Gruber, N.: Ocean Biogeochemical Dynamics, Princeton University Press, Princeton, Oxford, https://doi.org/10.2307/j.ctt3fgxqx, 2006.
Sathyendranath, S., Brewin, R. J. W., Brockmann, C., Brotas, V., Calton, B., Chuprin, A., Cipollini, P., Couto, A. B., Dingle, J., Doerffer, R., Donlon, C., Dowell, M., Farman, A., Grant, M., Groom, S., Horseman, A., Jackson, T., Krasemann, H., Lavender, S., Martinez-Vicente, V., Mazeran, C., Mélin, F., Moore, T. S., Müller, D., Regner, P., Roy, S., Steele, C. J., Steinmetz, F., Swinton, J., Taberner, M., Thompson, A., Valente, A., Zühlke, M., Brando, V. E., Feng, H., Feldman, G., Franz, B. A., Frouin, R., Gould, R. W., Hooker, S. B., Kahru, M., Kratzer, S., Mitchell, B. G., Muller-Karger, F. E., Sosik, H. M., Voss, K. J., Werdell, J., and Platt, T.: An ocean-colour time series for use in climate studies: The experience of the ocean-colour climate change initiative (OC-CCI), Sensors, 19, 4285, https://doi.org/10.3390/s19194285, 2019.
Savoye, N., Trull, T. W., Jacquet, S. H. M., Navez, J., and Dehairs, F.: 234Th-based export fluxes during a natural iron fertilization experiment in the Southern Ocean (KEOPS), Deep-Sea Res. Pt. II, 55, 841–855, https://doi.org/10.1016/J.DSR2.2007.12.036, 2008.
Schlitzer, R.: Carbon export fluxes in the Southern Ocean: Results from inverse modeling and comparison with satellite-based estimates, Deep-Sea Res. Pt. II, 49, 1623–1644, https://doi.org/10.1016/S0967-0645(02)00004-8, 2002.
Shopova, D., Dehairs, F., and Baeyens, W.: A simple model of biogeochemical element distribution in the oceanic water column, J. Mar. Syst., 6, 331–344, https://doi.org/10.1016/0924-7963(94)00032-7, 1995.
Sigman, D. M., Hain, M. P., and Haug, G. H.: The polar ocean and glacial cycles in atmospheric CO2 concentration, Nature, 466, 47–55, https://doi.org/10.1038/nature09149, 2010.
Sternberg, E., Jeandel, C., Robin, E., and Souhaut, M.: Seasonal cycle of suspended barite in the mediterranean sea, Geochim. Cosmochim. Ac., 72, 4020–4034, https://doi.org/10.1016/J.GCA.2008.05.043, 2008.
Sternberg, E., Tang, D., Ho, T. Y., Jeandel, C., and Morel, F. M. M.: Barium uptake and adsorption in diatoms, Geochim. Cosmochim. Ac., 69, 2745–2752, https://doi.org/10.1016/j.gca.2004.11.026, 2005.
Swart, S., Speich, S., Ansorge, I. J., and Lutjeharms, J. R. E.: An altimetry-based gravest empirical mode south of Africa: 1. Development and validation, J. Geophys. Res.-Oceans, 115, 1–19, https://doi.org/10.1029/2009JC005299, 2010.
Takahashi, T., Sweeney, C., Hales, B., Chipman, D. W., Goddard, J. G., Newberger, T., Iannuzzi, R. A., and Sutherland, S. C.: The changing carbon cycle in the southern ocean, Oceanography, 25, 26–37, https://doi.org/10.5670/oceanog.2012.71, 2012.
Taylor, S. R. and McLennan, S. M.: The continental crust: Its composition and evolution, Blackwell Scientific Pub., Palo Alto, CA, United States, https://www.osti.gov/biblio/6582885 (last access: 6 October 2020), 1985.
Thomalla, S. J., Fauchereau, N., Swart, S., and Monteiro, P. M. S.: Regional scale characteristics of the seasonal cycle of chlorophyll in the Southern Ocean, Biogeosciences, 8, 2849–2866, https://doi.org/10.5194/bg-8-2849-2011, 2011.
Trull, T. W., Passmore, A., Davies, D. M., Smit, T., Berry, K., and Tilbrook, B.: Distribution of planktonic biogenic carbonate organisms in the Southern Ocean south of Australia: a baseline for ocean acidification impact assessment, Biogeosciences, 15, 31–49, https://doi.org/10.5194/bg-15-31-2018, 2018.
Twining, B. S., Nodder, S. D., King, A. L., Hutchins, D. A., LeCleir, G. R., DeBruyn, J. M., Maas, E. W., Vogt, S., Wilhelm, S. W., and Boyd, P. W.: Differential remineralization of major and trace elements in sinking diatoms, Limnol. Oceanogr., 59, 689–704, https://doi.org/10.4319/lo.2014.59.3.0689, 2014.
van Beek, P., François, R., Conte, M., Reyss, J. L., Souhaut, M., and Charette, M.: 228Ra 226Ra and 226Ra Ba ratios to track barite formation and transport in the water column, Geochim. Cosmochim. Ac., 71, 71–86, https://doi.org/10.1016/j.gca.2006.07.041, 2007.
van Horsten, N. R., Planquette, H., Sarthou, G., Ryan-Keogh, T. J., Lemaitre, N., Mtshali, T. N., Roychoudhury, A., and Bucciarelli, E.: Early winter barium excess in the Southern Indian Ocean as an annual remineralisation proxy (GEOTRACES GIPr07 cruise), Zenodo [data set], https://doi.org/10.5281/zenodo.6583338, 2022.
Viljoen, J. J., Philibert, R., van Horsten, N., Mtshali, T., Roychoudhury, A. N., Thomalla, S., and Fietz, S.: Phytoplankton response in growth, photophysiology and community structure to iron and light in the Polar Frontal Zone and Antarctic waters, Deep-Sea Res. Pt. I, 141, 118–129, https://doi.org/10.1016/j.dsr.2018.09.006, 2018.
Wright, S. W., van den Enden, R. L., Pearce, I., Davidson, A. T., Scott, F. J., and Westwood, K. J.: Phytoplankton community structure and stocks in the Southern Ocean (30–80∘ E) determined by CHEMTAX analysis of HPLC pigment signatures, Deep-Sea Res. Pt. II, 57, 758–778, https://doi.org/10.1016/j.dsr2.2009.06.015, 2010.
Zhuang, J.: xESMF: Universal Regridder for GeospatialData, https://github.com/JiaweiZhuang/xESMF (last access: 14 August 2020), 2018.