the Creative Commons Attribution 4.0 License.
the Creative Commons Attribution 4.0 License.
 | 15 Jul 2022
Modelling the effects of benthic fauna on carbon, nitrogen and phosphorus dynamics in the Baltic Sea
Oleg Pavlovitch Savchuk
Bo Gustav Gustafsson
Even though the effects of benthic fauna on aquatic biogeochemistry have been long recognized, few studies have addressed the combined effects of animal bioturbation and metabolism on ecosystem–level carbon and nutrient dynamics. Here we merge a model of benthic fauna (BMM) into a physical–biogeochemical ecosystem model (BALTSEM) to study the long-term and large-scale effects of benthic fauna on nutrient and carbon cycling in the Baltic Sea. We include both the direct effects of faunal growth and metabolism and the indirect effects of its bioturbating activities on biogeochemical fluxes of and transformations between organic and inorganic forms of carbon (C), nitrogen (N), phosphorus (P) and oxygen (O). Analyses of simulation results from the Baltic Proper and Gulf of Riga indicate that benthic fauna makes up a small portion of seafloor active organic stocks (on average 1 %–4 % in 2000–2020) but contributes considerably to benthic–pelagic fluxes of inorganic C (23 %–31 %), N (42 %–51 %) and P (25 %–34 %) through its metabolism. Results also suggest that the relative contribution of fauna to the mineralization of sediment organic matter increases with increasing nutrient loads. Further, through enhanced sediment oxygenation, bioturbation decreases benthic denitrification and increases P retention, the latter having far-reaching consequences throughout the ecosystem. Reduced benthic–pelagic P fluxes lead to a reduction in N fixation and primary production, lower organic matter sedimentation fluxes, and thereby generally lower benthic stocks and fluxes of C, N and P. This chain of effects through the ecosystem overrides the local effects of faunal respiration, excretion and bioturbation. Due to large uncertainties related to the parameterization of benthic processes, we consider this modelling study a first step towards disentangling the complex ecosystem-scale effects of benthic fauna on biogeochemical cycling.
- Article
(5257 KB) - Full-text XML
- BibTeX
- EndNote


Coastal ecosystems are highly productive, consist of diverse biological communities and carry out important functions including those supporting a growing world population (Costanza et al., 1997, 2014). However, they are facing multiple anthropogenic pressures such as nutrient loading and climate change (Cloern et al., 2016; Halpern et al., 2008). Elucidating the mechanisms of the coupled biogeochemical cycling of carbon (C), nitrogen (N) and phosphorous (P) in these systems is important to understand how they respond to current and future pressures but also because they contribute to the regulation of global climate and nutrient cycles by processing anthropogenic emissions from land before they reach the ocean (Ramesh et al., 2015; Regnier et al., 2013a, b; Seitzinger, 1988).
In contrast to the deep open ocean, benthic–pelagic coupling plays a large role in biogeochemical cycling in coastal and estuarine ecosystems (Soetaert and Middelburg, 2009). Coastal sediments act as hotspots for organic matter degradation and permanent removal of elements from biological cycling through burial and denitrification (Asmala et al., 2017; Regnier et al., 2013a; Seitzinger, 1988). The bioturbating activities of benthic fauna alter the physical and chemical properties of surface sediments, which in turn strongly influence organic matter degradation processes and benthic–pelagic biogeochemical fluxes (Aller, 1982; Rhoads, 1974; Stief, 2013). Here, we define bioturbation as all biological processes that affect the sediment matrix, including burrow ventilation (bio-irrigation) and reworking of particles (Kristensen et al., 2012). Additionally, benthic fauna retains carbon and nutrients in its biomass and transforms them between organic and inorganic forms through metabolic processes (Ehrnsten et al., 2020b, and references therein; Herman et al., 1999; Josefson and Rasmussen, 2000). Together, these direct and indirect effects of benthic fauna have far-reaching consequences for ecosystem functioning in the benthic and pelagic realms (Griffiths et al., 2017; Lohrer et al., 2004).
Even though the importance of benthic fauna for sediment biogeochemistry and benthic–pelagic fluxes has long been recognized (Rhoads, 1974), the combined effects of animal bioturbation and metabolism have seldom been studied together (Ehrnsten et al., 2020b; Middelburg, 2018; Snelgrove et al., 2018). A long-standing assumption in biogeochemical sediment research is that animals contribute considerably to transport of solids and solutes through bioturbation, but their consumption of organic matter is of minor importance (Middelburg, 2018). However, several studies show that this assumption does not hold in many shallow coastal systems, as recently reviewed by Middelburg (2018) and Ehrnsten et al. (2020b).
Further, empirical studies of faunal effects often focus on temporally and spatially limited parts of the system, omitting important interactions and variability occurring in natural ecosystems (Snelgrove et al., 2014). It is logistically challenging to study multiple drivers and interactions in the benthic and pelagic realms, such as the interactions between benthic and pelagic production, empirically. Mechanistic or process-based models are powerful tools to conduct such studies (Seidl, 2017). Here, we extend a physical–biogeochemical model of the Baltic Sea ecosystem (BALTSEM; Gustafsson et al., 2014; Savchuk et al., 2012) with benthic fauna components based on the Benthic Macrofauna Model (BMM; Ehrnsten et al., 2020a). We include both the direct feedbacks from animal growth and metabolism and the indirect effects of their bioturbating activities on biogeochemical cycling to evaluate their relative contributions.
We use the Baltic Sea as a model area for three reasons: (i) the shallow depth (mean depth 57 m) and enclosed geography with a long water residence time (about 33 years) contribute to strong benthic–pelagic coupling (Snoeijs-Leijonmalm et al., 2017; Stigebrandt and Gustafsson, 2003), (ii) the relatively simple, species-poor benthic communities facilitate model development, and (iii) the major features of biogeochemical cycling of C, N and P in the Baltic Sea are well known due to a wealth of oceanographic measurements and studies performed over the past century, making it an ideal system for process-based modelling (Eilola et al., 2011; Gustafsson et al., 2017; Savchuk and Wulff, 2009, 2001). However, the sediment pools and the role of sediment processes in benthic–pelagic exchange are not as well quantified as pelagic pools and fluxes. The higher uncertainty in benthic compared to pelagic processes and the traditional focus on pelagic eutrophication are probable reasons why physical–biogeochemical models of the Baltic Sea have omitted benthic fauna as state variables (e.g. Eilola et al., 2011; Lessin et al., 2018). Here, we aim to fill this knowledge gap and explore the role of benthic fauna in biogeochemical cycling of C, N and P on a long-term ecosystem-level scale.
2.1 Study system
The Baltic Sea is a semi-enclosed coastal sea in northern Europe with strong latitudinal and depth gradients in salinity, temperature and productivity shaping the distribution of species and ecosystem functioning (Bonsdorff, 2006; Elmgren, 1984; Snoeijs-Leijonmalm et al., 2017). The diversity of benthic fauna is low due to the low salinity, and large, deep-burrowing species are only found near the entrance to the Baltic Sea (Bonsdorff, 2006; Remane, 1934). Thus, the sediment layer mixed by bioturbating animals is very shallow compared to other coastal and shelf seas (Teal et al., 2008). Nonetheless, several studies have measured significant effects of benthic fauna on benthic nutrient processing in the Baltic Sea (e.g. Berezina et al., 2019; Lehtonen, 1995; Norkko et al., 2013, 2015).
Due to its large catchment area and limited water exchange with the North Sea, the Baltic Sea is heavily influenced by anthropogenic nutrient emissions (Andersen et al., 2017; Gustafsson et al., 2012). Although emissions have been significantly reduced since the peak in the 1980s, recovery from eutrophication is slow with limited reductions in nutrient pools and primary productivity seen to date (Gustafsson et al., 2012; Savchuk, 2018; Zdun et al., 2021). This is due to the long water residence time and the build-up of nutrient stores in soils and marine sediments during several decades (McCrackin et al., 2018; Savchuk, 2018, and references therein).
In this study, we focus on comparing results from the Baltic Proper and the Gulf of Riga (Fig. 1), two basins with a similar benthic community composition but differing in physical and biogeochemical properties such as depth, openness, productivity and bottom oxygen conditions. We expect these differences to be reflected in the strength of benthic–pelagic coupling processes and the role of benthic fauna therein.

Figure 1The Baltic Sea hypsography and basin divisions in the BALTSEM model. This study focusses on the Baltic Proper (basin 9) and Gulf of Riga (basin 12), outlined in blue.
The Baltic Proper is the central, deepest basin of the Baltic Sea with a maximum depth of 459 m and a mean depth of ca. 75 m. A permanent halocline at ca. 60–80 m limits the vertical mixing between the low-salinity surface waters (5–8 psu) and the deeper waters with a salinity of 9–13 (Snoeijs-Leijonmalm et al., 2017). A majority of the waters below the halocline are hypoxic or anoxic because the mineralization of organic matter sinking through the water column and in the sediments consumes oxygen faster than it is replenished by infrequent salt water intrusions and vertical turbulent mixing. The expanding hypoxia has severely reduced the area habitable by benthic fauna in the Baltic Sea (Carstensen et al., 2014a, b). In the reducing environment, P bound to iron-humic complexes is released from sediments and contributes to the dissolved inorganic P (DIP) pool in the water column. The excess DIP promotes the fixation of atmospheric N by cyanobacteria, in turn promoting primary production by other phytoplankton, which leads to increased sinking and mineralization of organic matter, in turn expanding hypoxia. This feedback loop, termed the “vicious circle” (Vahtera et al., 2007), is further strengthened by climate change as increasing water temperatures promote cyanobacterial blooms (Kahru et al., 2020; Kahru and Elmgren, 2014).
The Gulf of Riga is a semi-enclosed coastal bay with mean and maximum depths of 23 and 51 m, respectively, and a salinity of 4–7 (Snoeijs-Leijonmalm et al., 2017). In contrast to the Baltic Proper, the Gulf of Riga is relatively well mixed, and hypoxia only occurs intermittently under the summer thermocline (Kotta et al., 2008), accompanied by increased release of phosphate from the sediments (Eglite et al., 2014). When occurring more often in the most recent decade, the intensity and extent of both sporadic hypoxia and phosphate release have somewhat increased (HELCOM, 2018; Stoicescu et al., 2022). Similarly, the summer cyanobacteria blooms sporadically occurring in the Gulf of Riga before the 2010s (Kahru and Elmgren, 2014) have regularly and extensively covered the gulf since 2015 (Mati Kahru, personal communication, 2021).
2.2 Model description
The biogeochemical cycling in the BALTSEM model was extended to include benthic fauna. BALTSEM simulates physical circulation and biogeochemical transformations of C, N, P, O and Si in the Baltic Sea in response to climatic conditions and nutrient inputs from rivers, point sources and atmospheric deposition. It describes the Baltic Sea as 13 horizontally homogenous boxes with a dynamic depth resolution of generally less than 1 m in the pelagial (Fig. 1). Sediments are represented as terraces at 1 m depth intervals with an area corresponding to the hypsography of each basin. The new benthic components were constructed from the carbon-based Benthic Macrofauna Model (BMM) described in Ehrnsten et al. (2019a, b, 2020a), extended to include nitrogen (N) and phosphorus (P) components.
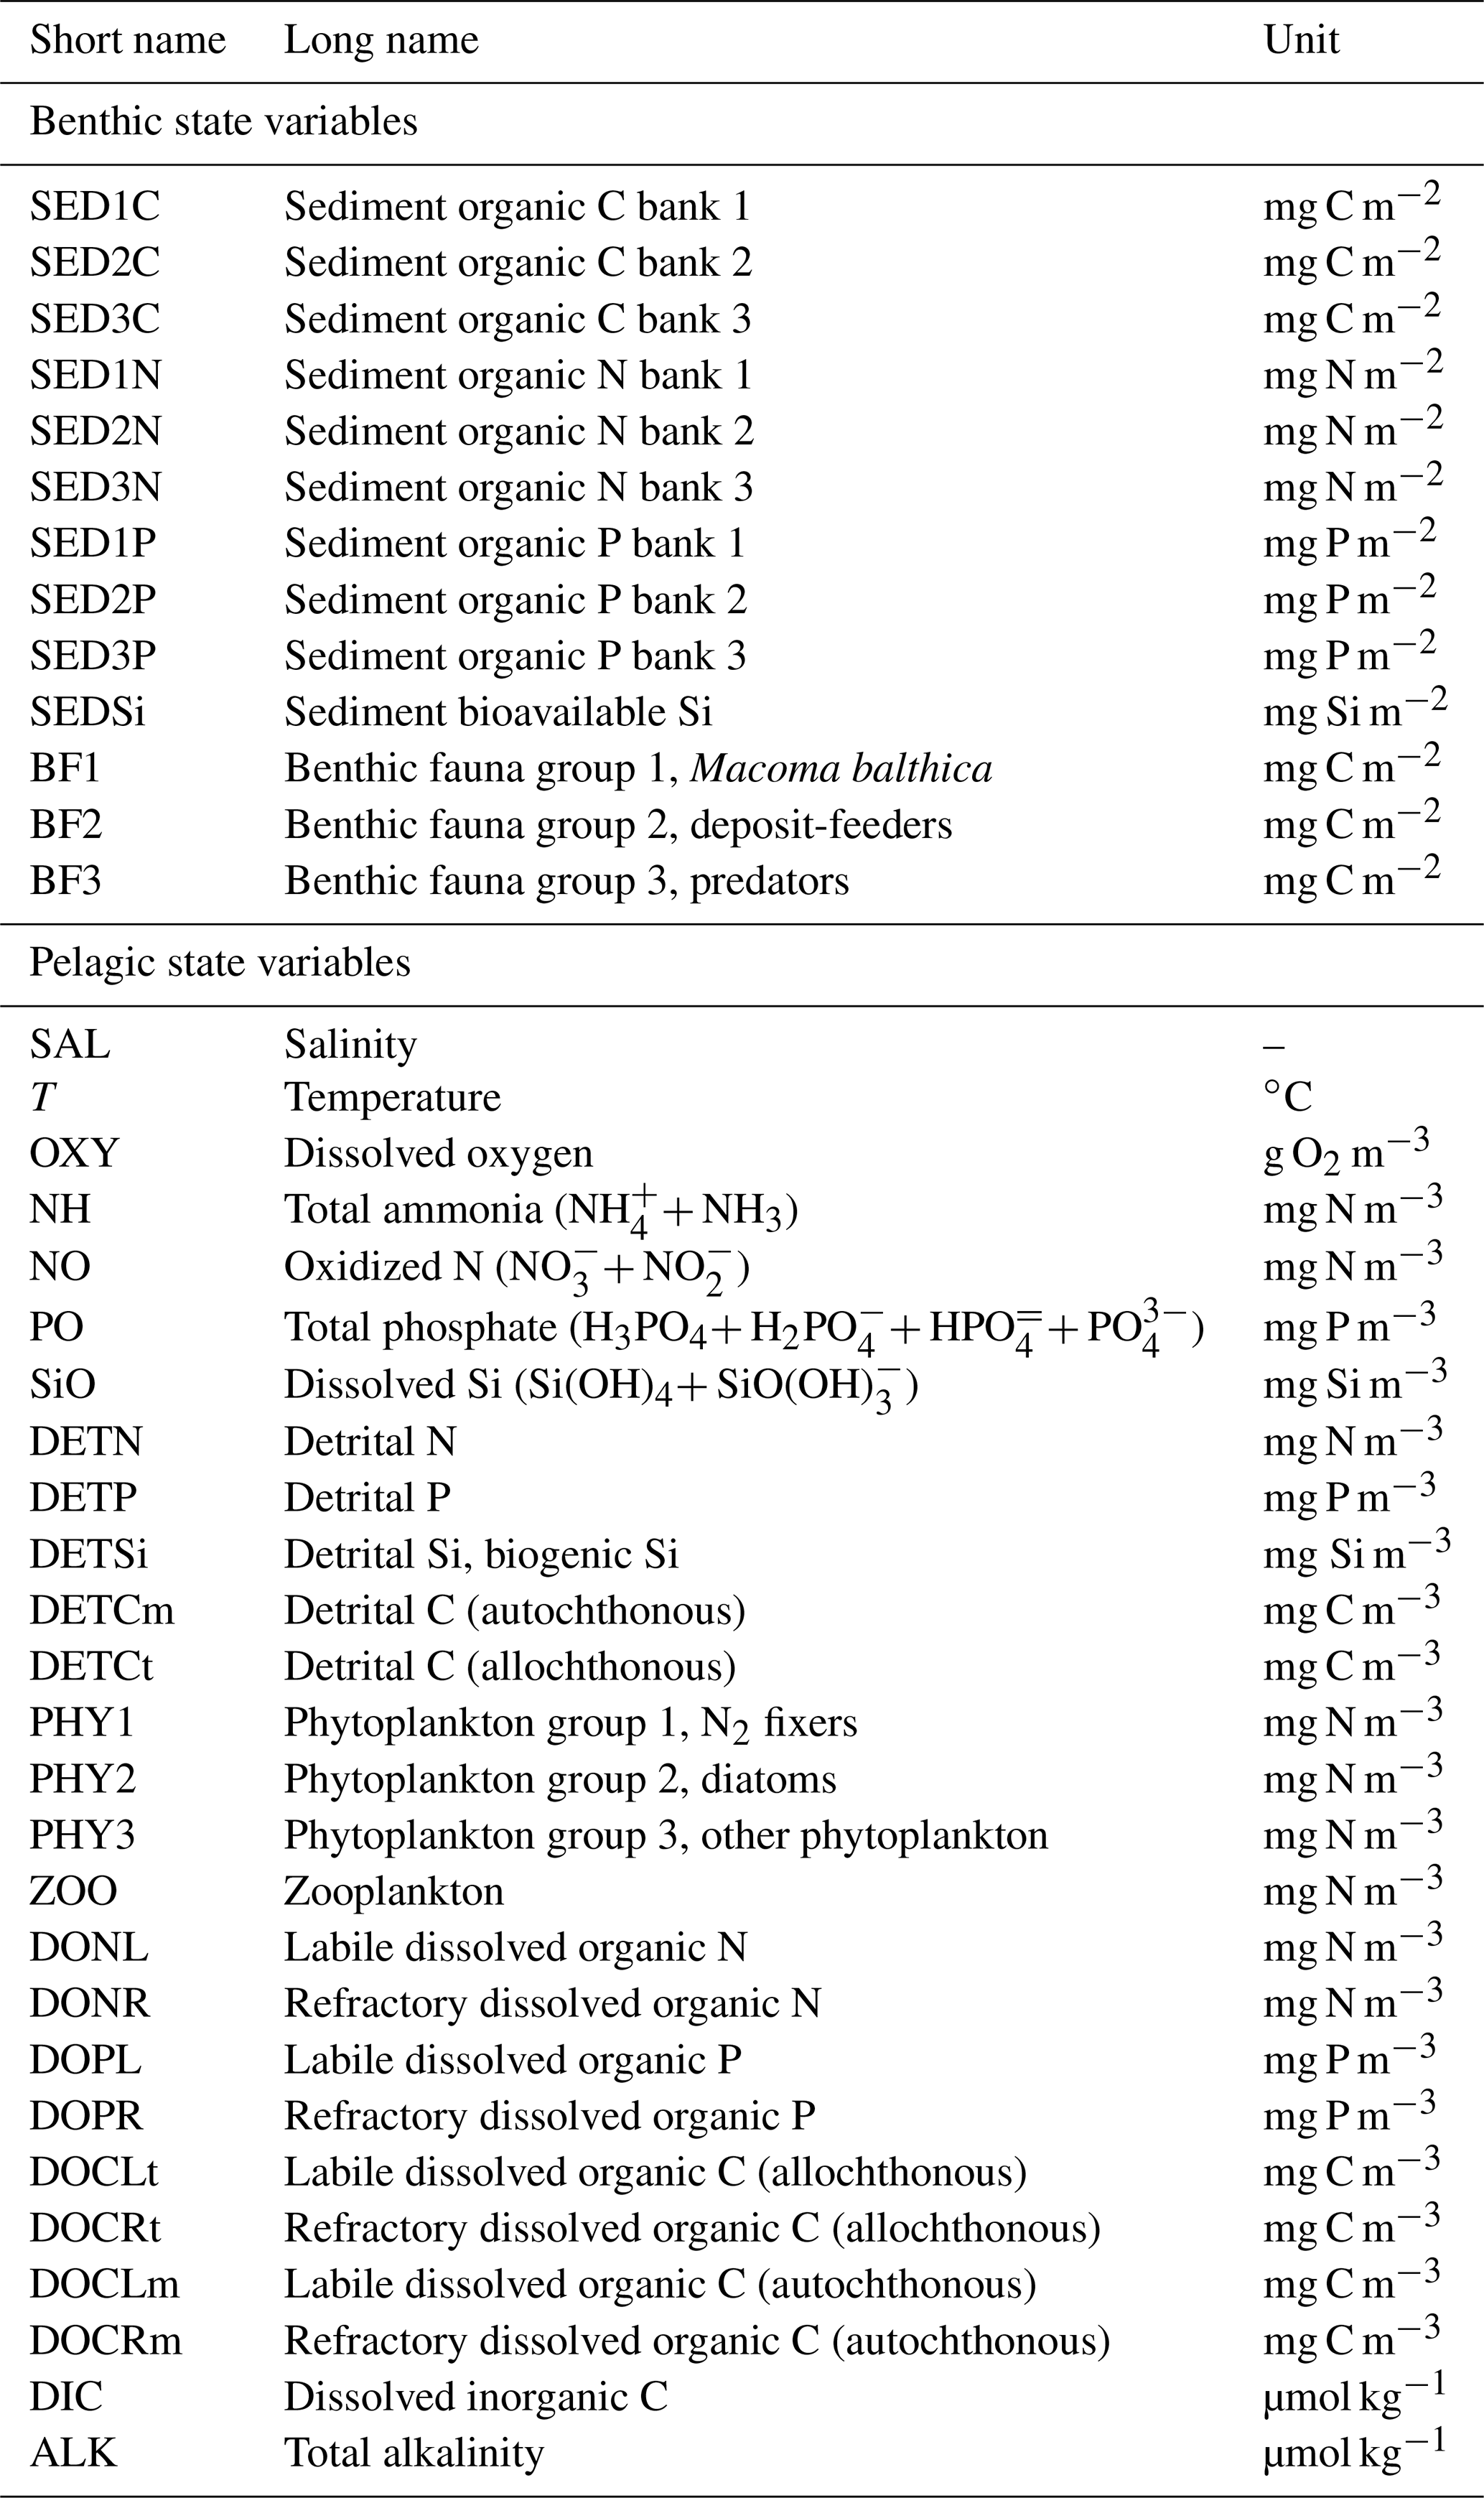
Below we give a short description of the benthic dynamics in the new model version, referred to as BALTSEM–BMM, with a focus on the effects of benthic fauna on biogeochemical processes (Fig. 2). A full mathematical description of the benthic biogeochemical processes of the model is found in Appendix A. For a description of the pelagic biogeochemistry and physics, we refer the reader to Gustafsson et al. (2012, 2014) and Savchuk et al. (2012). Additionally, all benthic and pelagic state variables are listed in Table A1.
2.2.1 Benthic fauna dynamics
BALTSEM–BMM includes C, N and P contents in biomass of three functional groups of benthic fauna. The facultative deposit- and suspension-feeding bivalve Macoma balthica is a key species dominating the biomass of benthic communities in large parts of the sea and is therefore represented by its own state variable. The group “deposit-feeders” represents the amphipods Monoporeia affinis and Pontoporeia femorata, the invasive polychaetes Marenzelleria spp., and other macrofaunal species dependent on surface sediment organic matter as their primary food source. The group “predators” represents species feeding on the two former groups, such as the isopod Saduria entomon, the polychaete Bylgides sarsi and the priapulid Halicryptus spinulosus.
The biomass of all groups of fauna are modelled as a dynamic mass balance between fluxes formed by food uptake, assimilation, respiration or excretion, and mortality. The formulations for dynamics of the functional groups and their food banks were kept as in BMM (Ehrnsten et al., 2019a, 2020a) as far as possible. The main change is the addition of N and P components to each state variable. Consumers generally regulate their inner stoichiometry within tight limits (Sterner and Elser, 2002); therefore the fauna was given a constant ratio. The ratio was approximated based on measured ratios for the dominating species in the Baltic Sea (see Appendix A).
Food uptake is modelled as a function of food availability in C units. The uptake of N and P components of a food source is thereafter calculated proportionally to the ratio of the food source. Part of the food is assimilated, with an assimilation factor depending on the food source. The assimilation factors for C components were applied to N and P as well (Table A3). The unassimilated part is released as faeces, adding organic matter to the sediment C, N and P pools (Fig. 2).
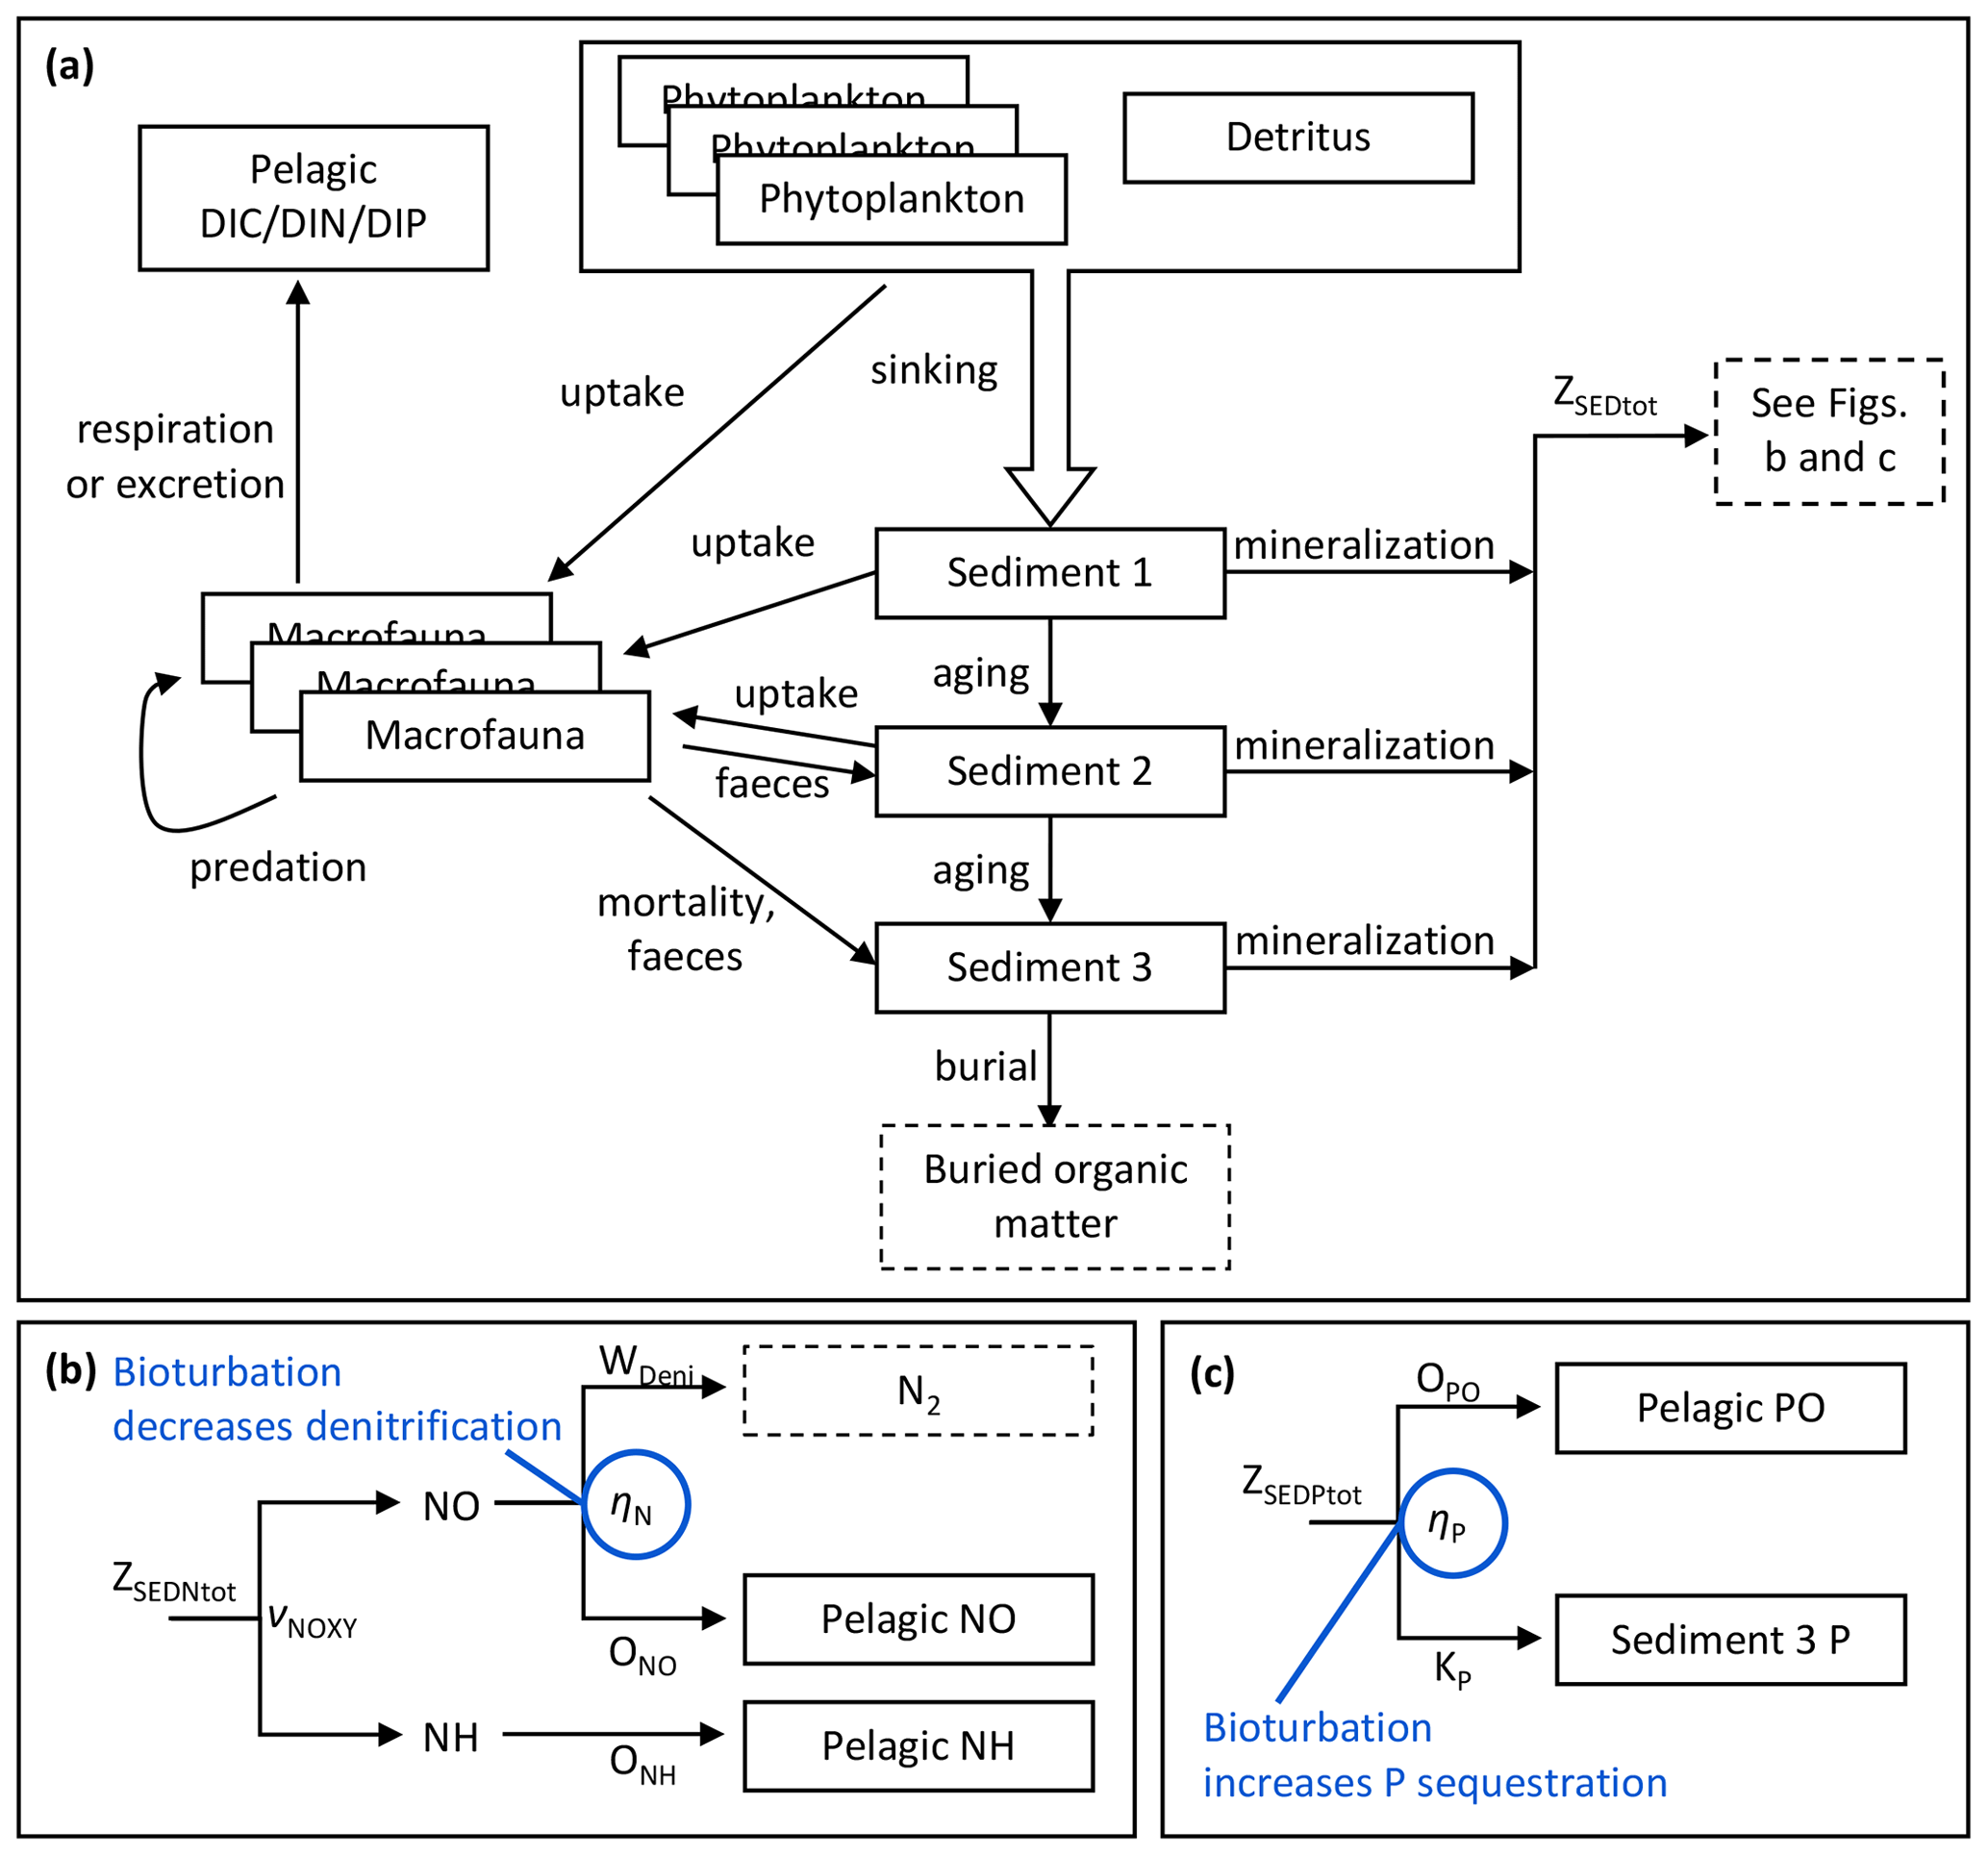
Figure 2Schematic overview of benthic model processes shared by benthic C, N and P components (a) and apportionment of mineralization fluxes of sediment N (b) and P (c) with bioturbation effects indicated in blue.
Respiration and excretion of inorganic C, N and P is divided into three parts: (1) a basal maintenance part related to biomass; (2) a growth and activity part related to food uptake as a proxy for activity; and (3) excess excretion. As the stoichiometry of assimilated food varies, excretion of excess elements is calculated dynamically to keep the fixed stoichiometry of the benthos. Formulations are similar to those used for zooplankton in BALTSEM and for benthos in other ecosystem models (Ebenhöh et al., 1995; Spillman et al., 2008). Respiration and excretion fluxes add to the bottom water pools of dissolved inorganic carbon (DIC), nitrogen (NH, representing total ammonia) and phosphorus (PO, representing total phosphate). Respiration also consumes bottom water oxygen with a respiratory quotient of 1 mol O2 : mol CO2 (Brey, 2001).
2.2.2 Sediment dynamics and bioturbation
As in the standard BALTSEM, sediment bioavailable C, N, P and Si are represented as vertically integrated concentrations in the biogeochemically active surface layer of unspecified thickness. The concentrations are modelled as a dynamic mass balance between fluxes formed by sedimentation, mineralization and burial, extended by interactions with benthic fauna. Sediment C, N and P pools are further divided into three banks of different ages to resolve the food limitation of benthic fauna (Fig. 2), while benthic Si is represented as a single pool that does not interact with the fauna. Oxygen is not a state variable in sediments, but several benthic processes interact with simulated bottom water oxygen.
Bioturbation by benthic fauna, including sediment reworking and burrow ventilation, generally increases the oxygenation of sediments (Michaud et al., 2005; Volkenborn et al., 2012), promoting the binding of phosphate to iron oxides (P sequestration) and stimulating nitrogen oxidation (Ekeroth et al., 2016; Norkko et al., 2012; Renz and Forster, 2014). Similar to Isaev et al. (2017), we use simple formulations for the effects of faunal activities on the oxygen-dependent processes of sediment nitrification and denitrification and P sequestration through a bioturbation enhancement factor Ebio. The formulation for Ebio was taken from Blackford (1997), using the feeding rate of fauna as a proxy of its bioturbation activity:
where Emax is the maximum enhancement, cfBFi is a contribution factor of functional group i, UBFiC is the carbon uptake rate of group i, and Kbio is a half saturation constant. As M. balthica is more sedentary than the other groups, a contribution factor of 0.5 was assigned to it and a factor of 1 to the two other groups (Ebenhöh et al., 1995; Gogina et al., 2017, and references therein).
Within each of the three sediment banks, C, N and P components share the same source and sink processes. Sinking organic matter is integrated into a bank of fresh organic matter available as food for deposit-feeders. This bank ages into a slightly older bank available as food for M. balthica only. The second bank ages into a third bank considered unavailable as food for benthic fauna but available for bacterial mineralization.
For each element, mineralization fluxes from the three sediment banks are combined into a total flux (ZSEDXtot, X= C, N, P). For C, the total sediment mineralization flux directly adds to the pelagic DIC pool. N and P mineralization fluxes are further divided in the same way as in the standard BALTSEM (Gustafsson et al., 2014; Savchuk, 2002) with the addition of bioturbation effects (Fig. 2b–c, Eqs. 1–9).
Depending on oxygen concentrations in the bottom water layer and bioturbation intensity, mineralized sediment N is released to the water column as ammonia (ONH, Eq. 2) or oxidized N (ONO, NO representing NO2 and NO3, Eq. 3) or denitrified to N2 (WDeni, Eq. 4).
In anoxic or nearly anoxic conditions, the majority of mineralized N is released to the water column as NH, defined by the proportion νNOXY (Eq. 5), where OXY is bottom water total oxygen concentration (that is allowed to become negative to represent hydrogen sulfide), and avNOXY is a curve parameter. Otherwise the mineralized N is oxidized (consuming bottom water oxygen; see Appendix A, Eq. A17).
Subsequently, the oxidized portion can be denitrified into N2 or released to the pelagic NO pool. Denitrification is treated as a permanent sink for N. The proportion released as NO (ηN) is positively related to oxygen according to Eq. (6), where and cN are parameters of the sigmoid function, and Ebio is the bioturbation enhancement factor.
A fraction ηP of mineralized sediment P is sequestered in the sediment (Eq. 7), while the rest is released as phosphate (OPO) to the pelagic PO pool (Eq. 8).
The fraction sequestered is positively related to oxygen and bioturbation and negatively related to salinity according to Eq. (9), where qP, aP, bP and cP are curve parameters. The fraction has an upper limit of 1 (100% of mineralized P sequestered) but can take on negative values, representing a release of previously sequestered P in severely hypoxic or anoxic conditions. The salinity dependence fSAL in the third term is used as a proxy for the higher availability of the phosphate-binding agents (e.g. iron and humic substances) in the fresher Gulf of Bothnia.
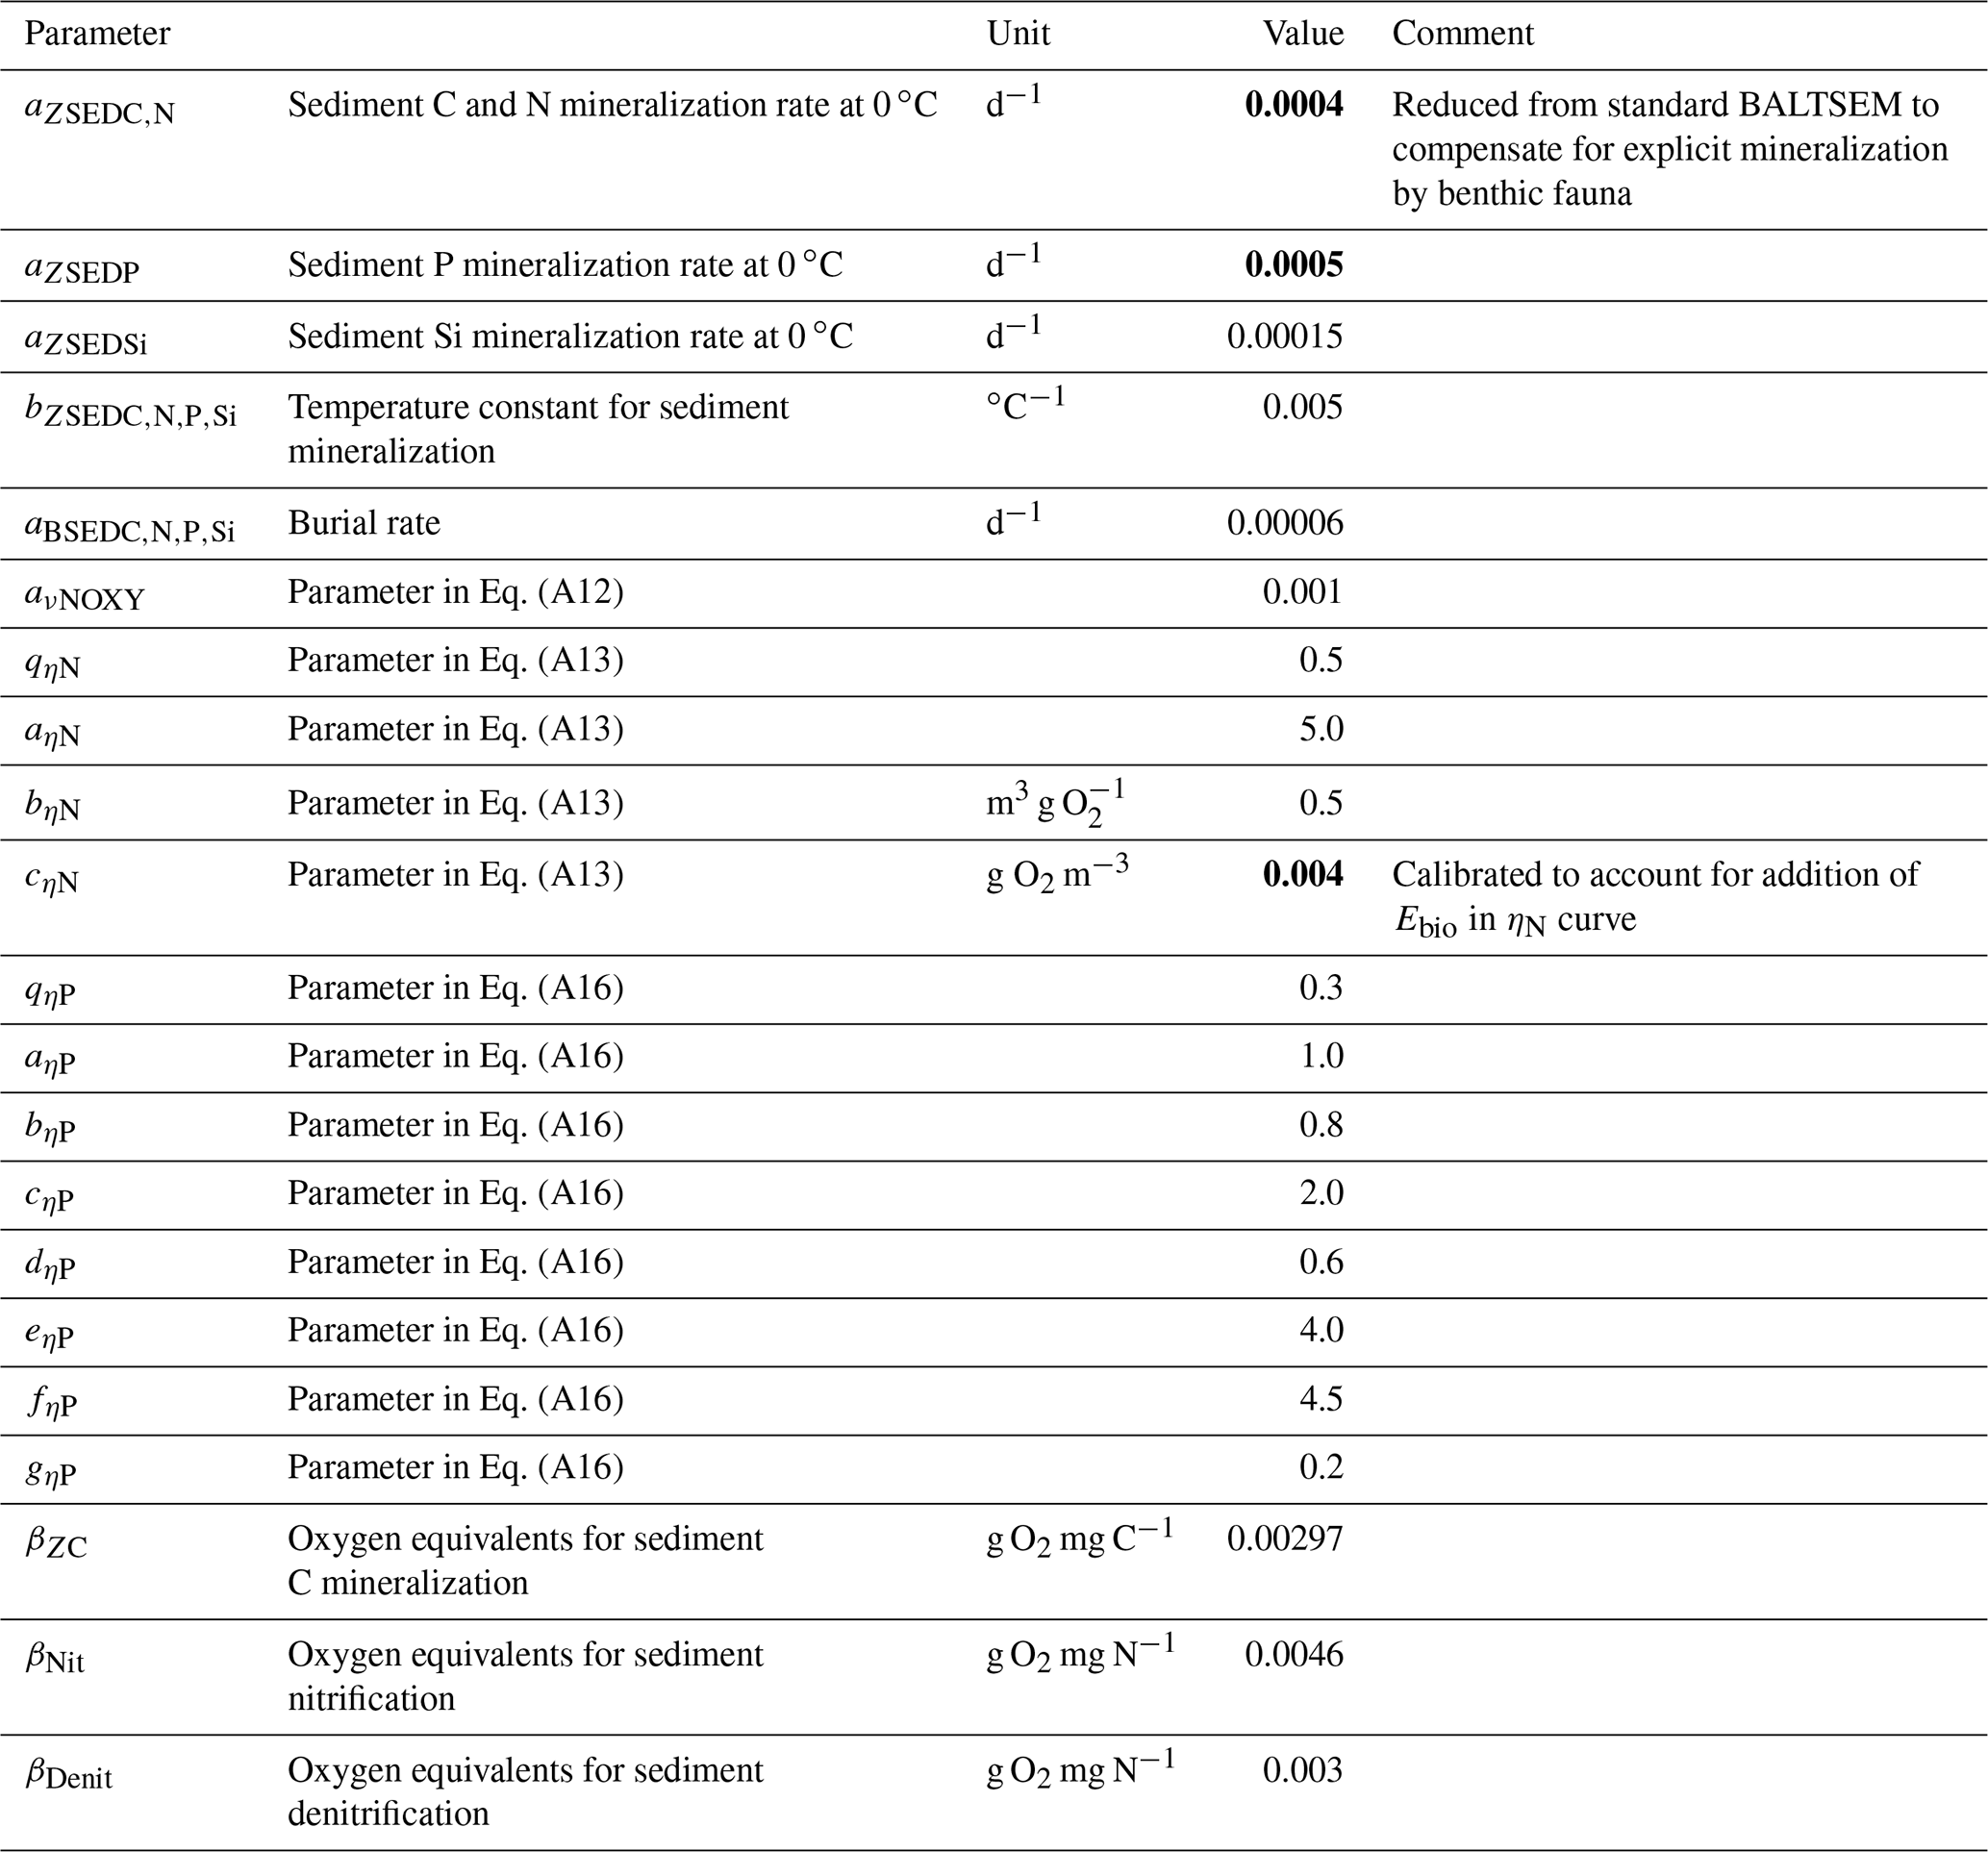
The addition of benthic fauna to BALTSEM required some recalibration of sediment processes. As the first-order rates of sediment mineralization in the standard BALTSEM represent all mineralization processes (i.e. implicitly including mineralization by benthic fauna), these rates were reduced to account for the explicit consumption and excretion by fauna. Further, the parameter cN in Eq. (6) was recalibrated to account for the addition of Ebio to ensure that the benthic release of NO is zero when oxygen concentration is zero. Several different model formulations and calibrations were tested, but in the end the simplest formulation with fewest recalibrations that produced similar results for the hindcast simulation was chosen.
2.3 Simulations
The model was run over 1970–2020 forced with observed nutrient loads and actual weather conditions as described in Gustafsson et al. (2012, 2017) with forcing time series extended to 2020. The physical circulation was forced by 3-hourly meteorological conditions and monthly time series of river run-off and state variable concentrations and sea level at the North Sea boundary. Monthly inputs of N, P, C and Si from land via rivers and from coastal point sources, as well as atmospheric deposition of N, P and C, were used as biogeochemical forcing. Initial conditions in 1970 were based on observations for pelagic variables and hindcast simulations for benthic variables as described in Gustafsson et al. (2012) and Ehrnsten et al. (2020a). Briefly, the benthic fauna and their food banks (SED1X and SED2X) were set to 1000 mg C m−2, 100 mg N m−2 or 10 mg P m−2 throughout the model domain in 1960 and given 10 years of hindcast simulation to spin up, allowing the variables to turn over several times. Initial conditions for SED3X, with a slower turnover rate, were based on a hindcast starting in 1850 to properly account for the build-up of sediment nutrient pools during past eutrophication (Gustafsson et al., 2012).
Results of this default simulation were validated against observations of salinity, temperature, oxygen, ammonium, nitrate and phosphate (Appendix B), as well as biomasses of benthic fauna (Appendix C).
It is difficult to constrain the new parameters and to validate the system-scale dynamics against observations from the field or laboratory, which are usually made on much smaller temporal and spatial scales. Instead, we made a sensitivity analysis testing the effects of changing the parameter Emax in the range 0 to 0.6, where 0 represents no bioturbation and 0.6 is the theoretical maximum value of Ebio, giving 100 % P sequestration. Emax=0.3 was used in the default model run.
Additionally, we estimated the contribution of bioturbation to benthic–pelagic nutrient fluxes by calculating the theoretical fluxes without bioturbation enhancement (i.e. with Ebio=0) for each time step while running the default model with bioturbation. In contrast to the sensitivity analysis, this analysis shows the immediate local effects of bioturbation without accounting for effects mediated through the ecosystem.
Finally, to study the relationship between nutrient loads and the role of benthic fauna in biogeochemical cycling, we ran two future scenarios for 2021–2100 with either decreasing loads of N and P according to the Baltic Sea Action Plan (BSAP scenario, total loads to the Baltic Sea of 739 kt N yr−1 and 21 kt P yr−1) or increasing loads corresponding to the highest recorded historical loads based on mean N and P loads of 1980–1990 (HIGH load scenario, 1235 kt N yr−1 and 69 kt P yr−1). For comparison, the average nutrient loads in 2000–2020 were 936 kt N yr−1 and 36 kt P yr−1. The scenarios were combined with a statistical climate forcing representing no change in climate. Details of the scenarios can be found in Ehrnsten et al. (2020).
As the purpose of this study was to evaluate large-scale dynamics, results were aggregated as means and standard deviations of the last two decades (2000–2020 or 2080–2100) to capture differences in long-term averages while accounting for inter-annual variations.
3.1 Validation
The BALTSEM–BMM behaves very similarly to the standard BALTSEM model, which has been extensively validated (Gustafsson et al., 2012, 2014; Savchuk et al., 2012) and shown to perform favourably in relation to similar Baltic Sea models (Eilola et al., 2011; Meier et al., 2018). A comparison of the main pelagic state variables (salinity, temperature and concentrations of oxygen, NH, NO and PO) to observations over time (1970–2015) and depth shows an overall relative bias of 1.40, while the relative bias of the standard BALTSEM is 1.41. The relative bias index compares model–data difference with variability in the data, giving an estimate of how well the model captures variability in nature on seasonal, annual and decadal scales (Savchuk et al., 2012). A detailed description and results of this analysis are found in Appendix B.
Ehrnsten et al. (2020) did a comprehensive validation of simulated biomasses of benthic fauna against observations over depth intervals in the largest basins of the Baltic Sea. We re-ran this analysis with the results of the coupled model and extended it to include the entire Baltic Sea. The extended analysis, based on 7774 observations, confirms previous results that the model captures the main observed patterns of biomass over latitude and depth with reasonable accuracy (Fig. 3, Appendix C), defined as cost function values <2 (Eilola et al., 2011). Simulated mean biomasses of the individual functional groups and the groups combined were mostly within 1 standard deviation of observed means from the Bornholm Basin (basin 8) in the south to Bothnian Bay (basin 11) in the north, although it should be noted that the spread of observed data is large. In the high-salinity Kattegat and Danish straits near the entrance to the Baltic Sea, the model is not applicable as the benthic biomass is dominated by groups not included in the present model, such as suspension-feeding bivalves and large echinoderms. Further details on this analysis are presented in Appendix C.

Figure 3Comparison of simulated total biomasses of benthic fauna to observations at four depth intervals in six basins from south to north. Observations are shown as both the sum of the three functional groups – M. balthica, surface deposit-feeders and predators (“Data ”) – and total observed fauna. All data are shown as means ± standard deviations of 1990–2012, except for Arkona Basin 0–30 m where observational data from 1965 to 1979 were used as no other data were available. Numbers after basin names refer to basin numbers in Fig. 1. Numbers of samples and further comparisons are presented in Appendix C.
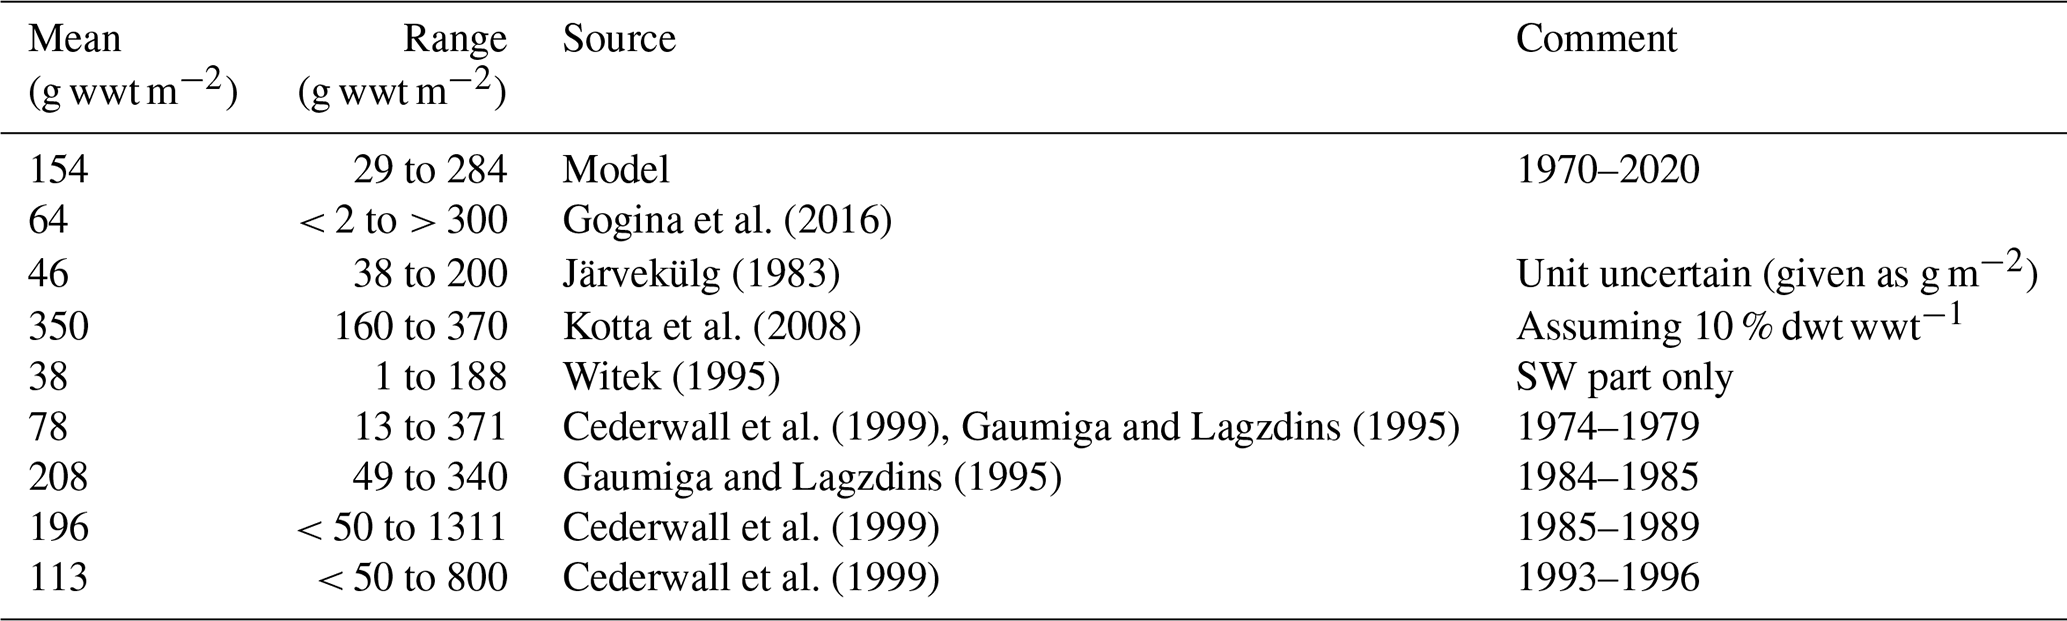
In addition, we compared the simulated biomasses of benthic fauna in the Gulf of Riga to estimates from the literature (Table 1). The simulated biomass of benthic fauna in the gulf varied substantially over depth and time (29–284 g wwt m−2; wwt signifies wet weight), which is supported by field observations. The simulated mean biomass is within the large range of estimates from the literature.
Table 1Comparison of simulated benthic fauna biomass in the Gulf of Riga and estimates based on field sampling (g wwt m−2). In the table, dwt signifies dry weight, and wwt signifies wet weight.
Carman and Cederwall (2001) have estimated the amounts of C, N and P in Baltic Sea sediments based on core samples. It is not straightforward to compare the total amounts to simulations as the thickness of the simulated sediment is not defined. However, the estimated ratios can be more readily compared. In the Baltic Proper, the molar ratio (calculated from their Table 11.4) was estimated to be in the top centimetre of sediments and in the top 5 cm, while the simulated ratio was . In the Gulf of Riga, the estimated ratio was in the top 1 cm and in the top 5 cm, while the simulated ratio was .
3.2 Budgets of benthic C, N and P
Long-term (2000–2020) average benthic budgets of C, N and P are shown in Fig. 4 for the Baltic Proper and Gulf of Riga. The results for the Baltic Proper are restricted to the depth interval 0–90 m as benthic fauna is practically absent in the oxygen-poor waters below this depth (Fig. 5a). Figure 5 also shows the long-term average depth distribution of the bioturbation factor Ebio in the two basins.
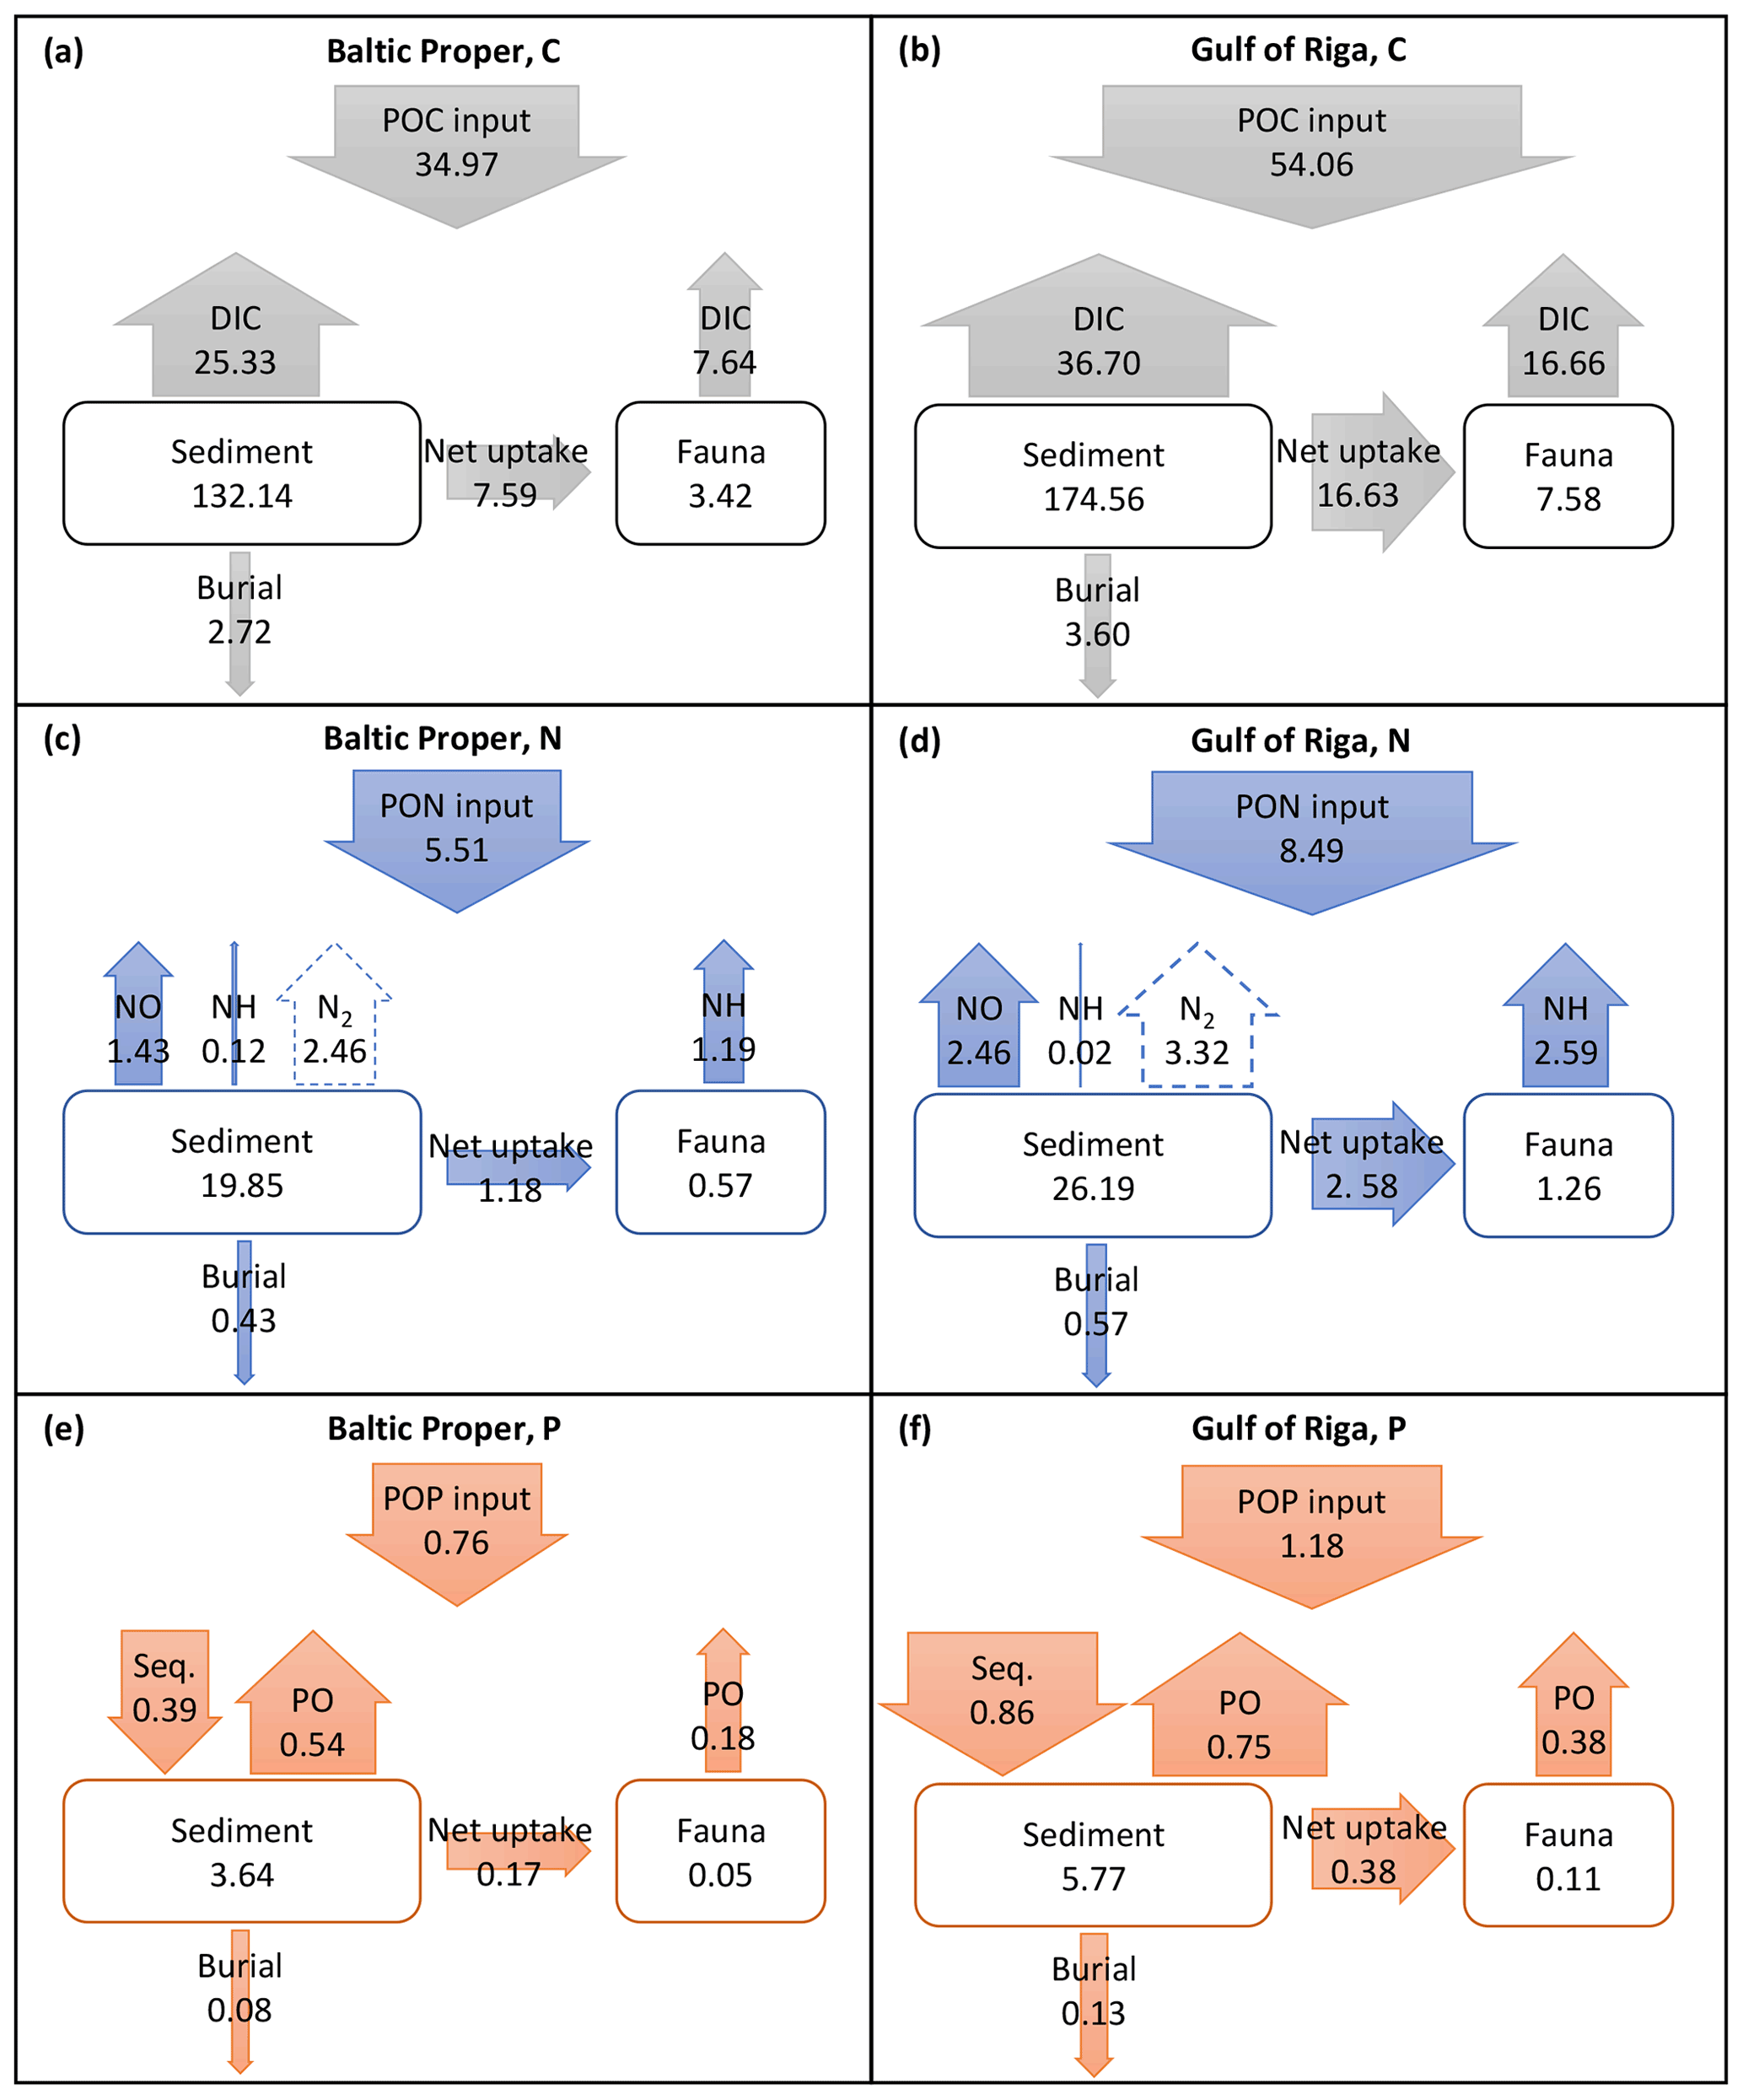
Figure 4Average (2000–2020) benthic fluxes (g m−2 yr−1) and stocks (g m−2) of C (a, b), N (c, d) and P (e, f) in the Baltic Proper (0–90 m, left column) and Gulf of Riga (right column). Arrow widths are proportional to fluxes for each element. Seq. signifies P sequestration.
According to the default simulation, the benthic fauna made up a minor part of the benthic organic C, N and P stocks (1 %–4 %) but had a proportionally larger share in benthic–pelagic fluxes of DIC (23 % and 31 % in the Baltic Proper and Gulf of Riga, respectively, Fig. 4a–b), DIN (43 % and 51 %, Fig. 4c–d) and DIP (25 % and 34 %, Fig. 4e–f). The budgets also show that input of organic matter to the sediments was higher in the Gulf of Riga compared to the Baltic Proper, resulting in overall higher benthic stocks and benthic–pelagic fluxes (Figs. 4 and 5).
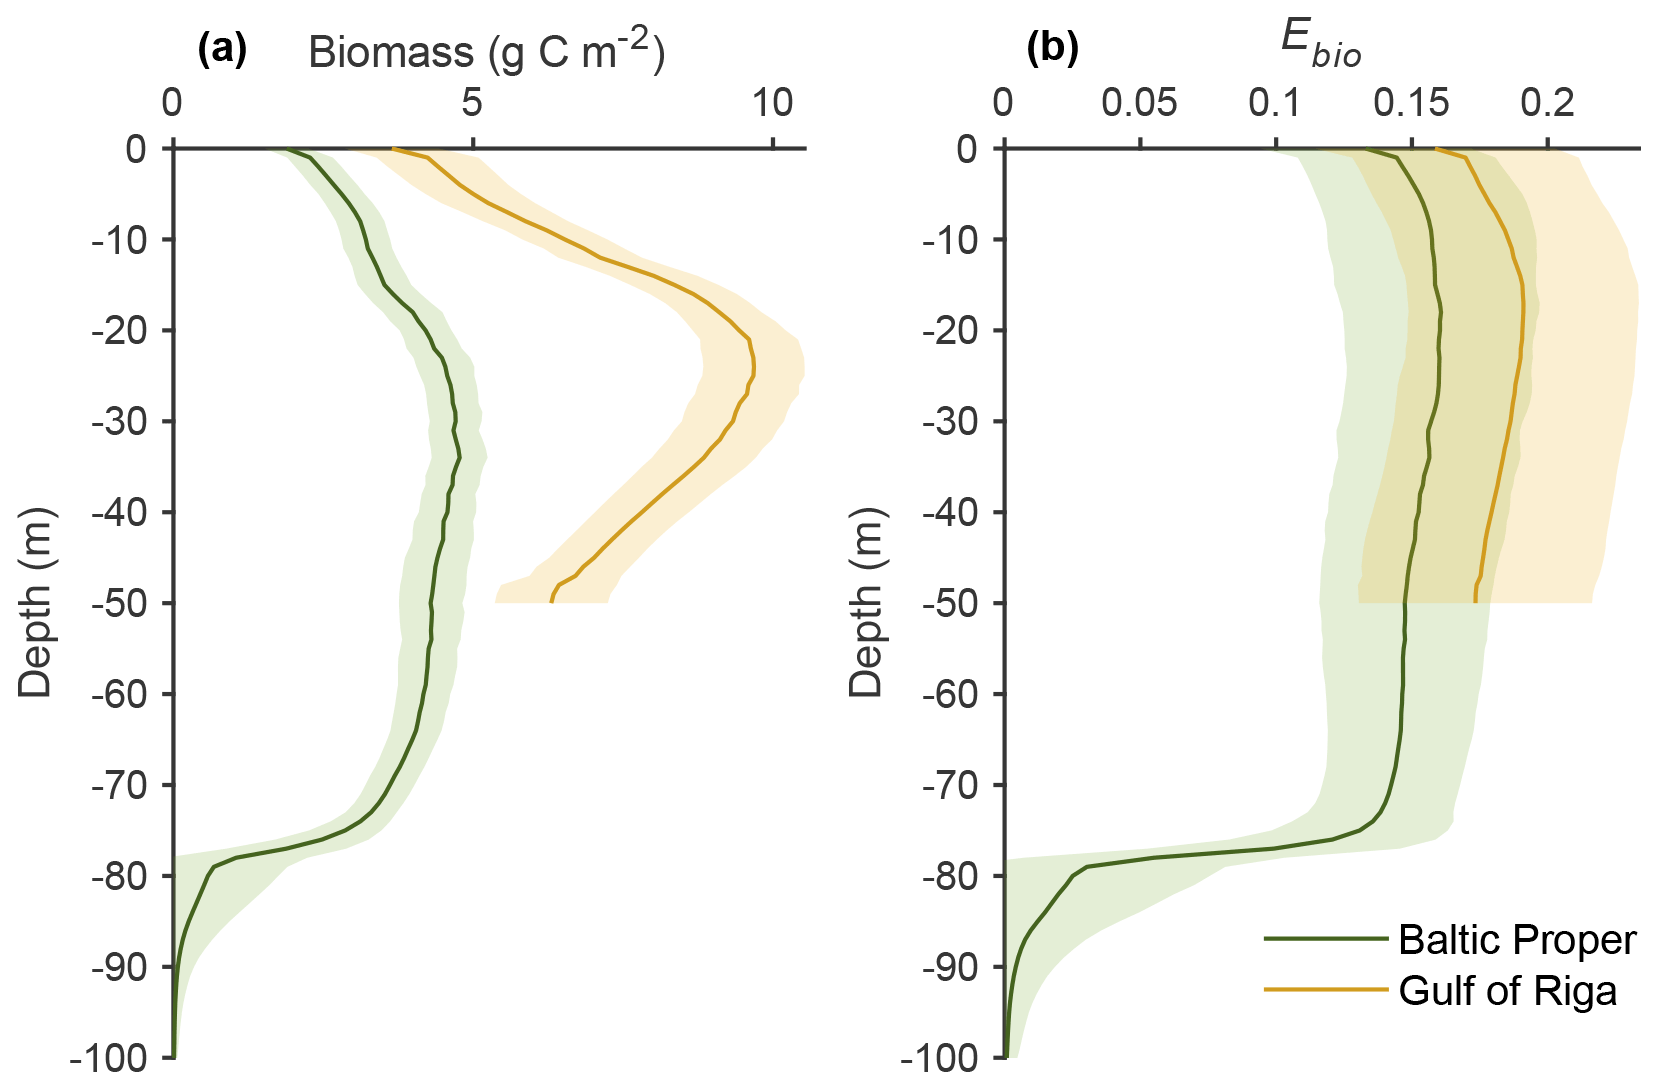
Figure 5Depth distribution of benthic fauna biomass and the bioturbation coefficient Ebio in the upper 100 m of the Baltic Proper and Gulf of Riga. Averages (lines) and standard deviations (shaded areas) of biweekly values (2000–2020) in the default model run (Emax=0.3).
3.3 Bioturbation effects on C, N and P dynamics
When accounting only for the immediate local effects of bioturbation, it increased NO outflux by 0.41 g N m−2 yr−1 (+40 %) and decreased sediment denitrification by the same amount (−14 %) in the Baltic Proper (simulated average of 2000–2020, Fig. 6a). Similarly, P sequestration was increased and PO outflux decreased by 0.09 g P m−2 yr−1 (+31 % and −15 %), respectively. In the Gulf of Riga, both the absolute flux rates and the relative effects of bioturbation on them were larger than in the Baltic Proper (Fig. 6b).
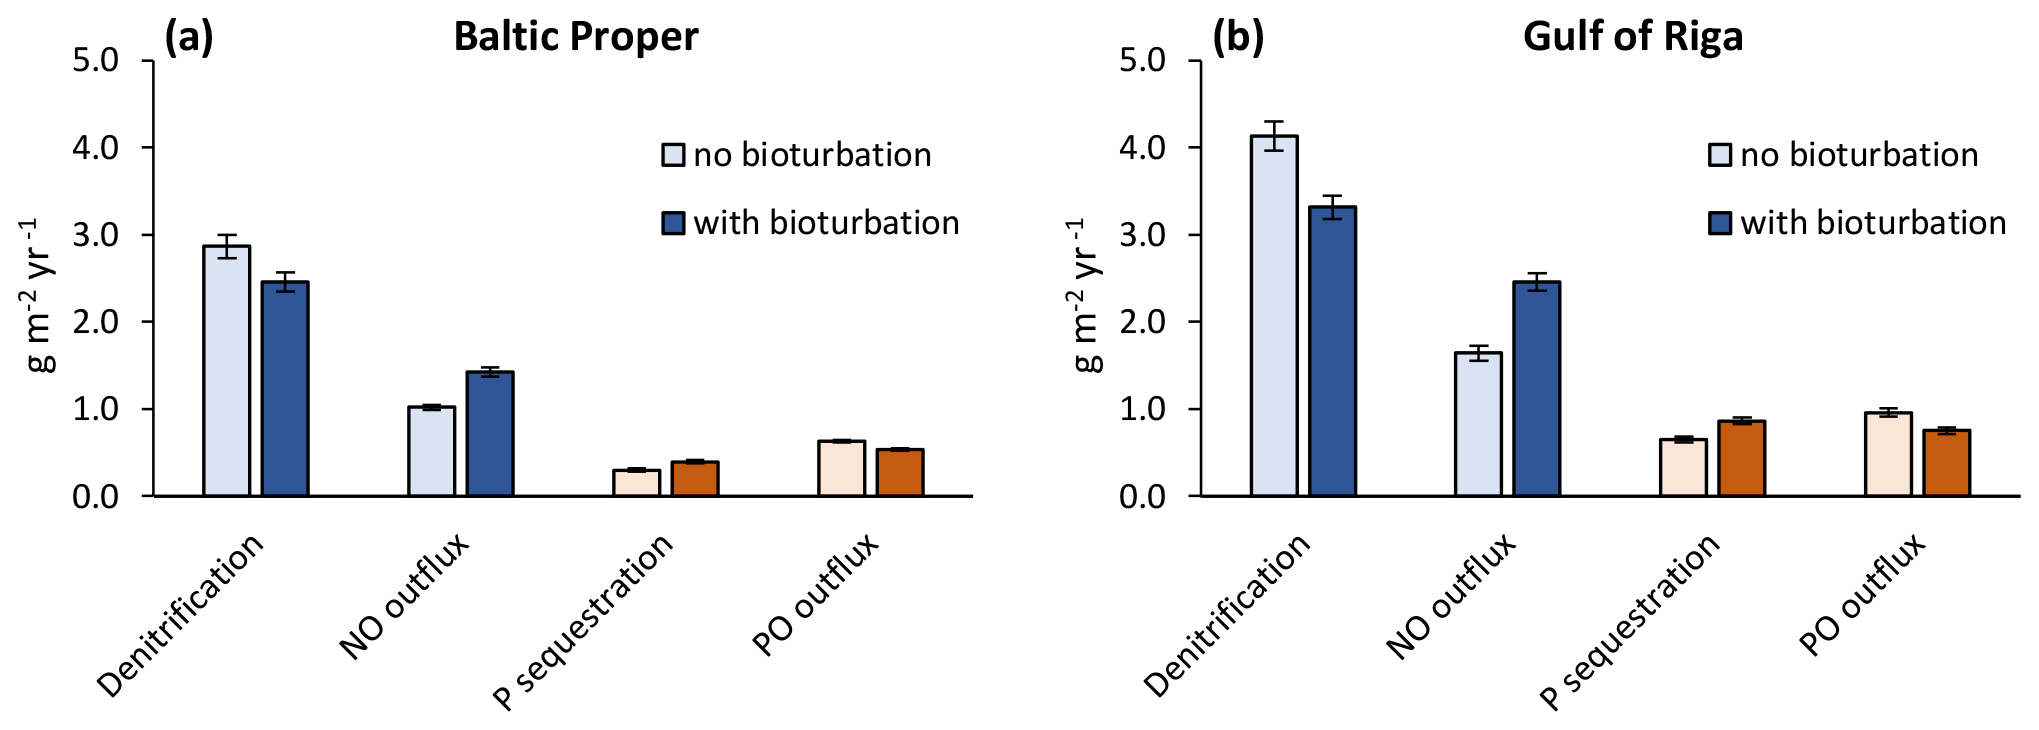
Figure 6Immediate local effects of bioturbation on benthic fluxes. Benthic fluxes directly affected by bioturbation in the default run with bioturbation and when calculated for each time step without bioturbation. Averages for 2000–2020 ± standard deviations in the Baltic Proper (0–90 m depth, a) and Gulf of Riga (b). Note that “outflux” refers to the flux from sediments to the water column without animal excretion.
When also accounting for the effects of bioturbation throughout the ecosystem in the sensitivity analysis, changes were more complex (Figs. 7–8). For example, comparing the default run (Emax=0.3) to the run with no bioturbation (Emax=0) in the Baltic Proper, denitrification was reduced by 0.44 g N m−2 yr−1 (−15 %), but NO outflux increased by only 0.38 g N m−2 yr−1 (+36 %, Fig. 7c), while P sequestration increased by 0.14 g P m−2 yr−1 (+55 %), and PO outflux decreased by 0.03 g P m−2 yr−1 (−5 %, Fig. 7e).
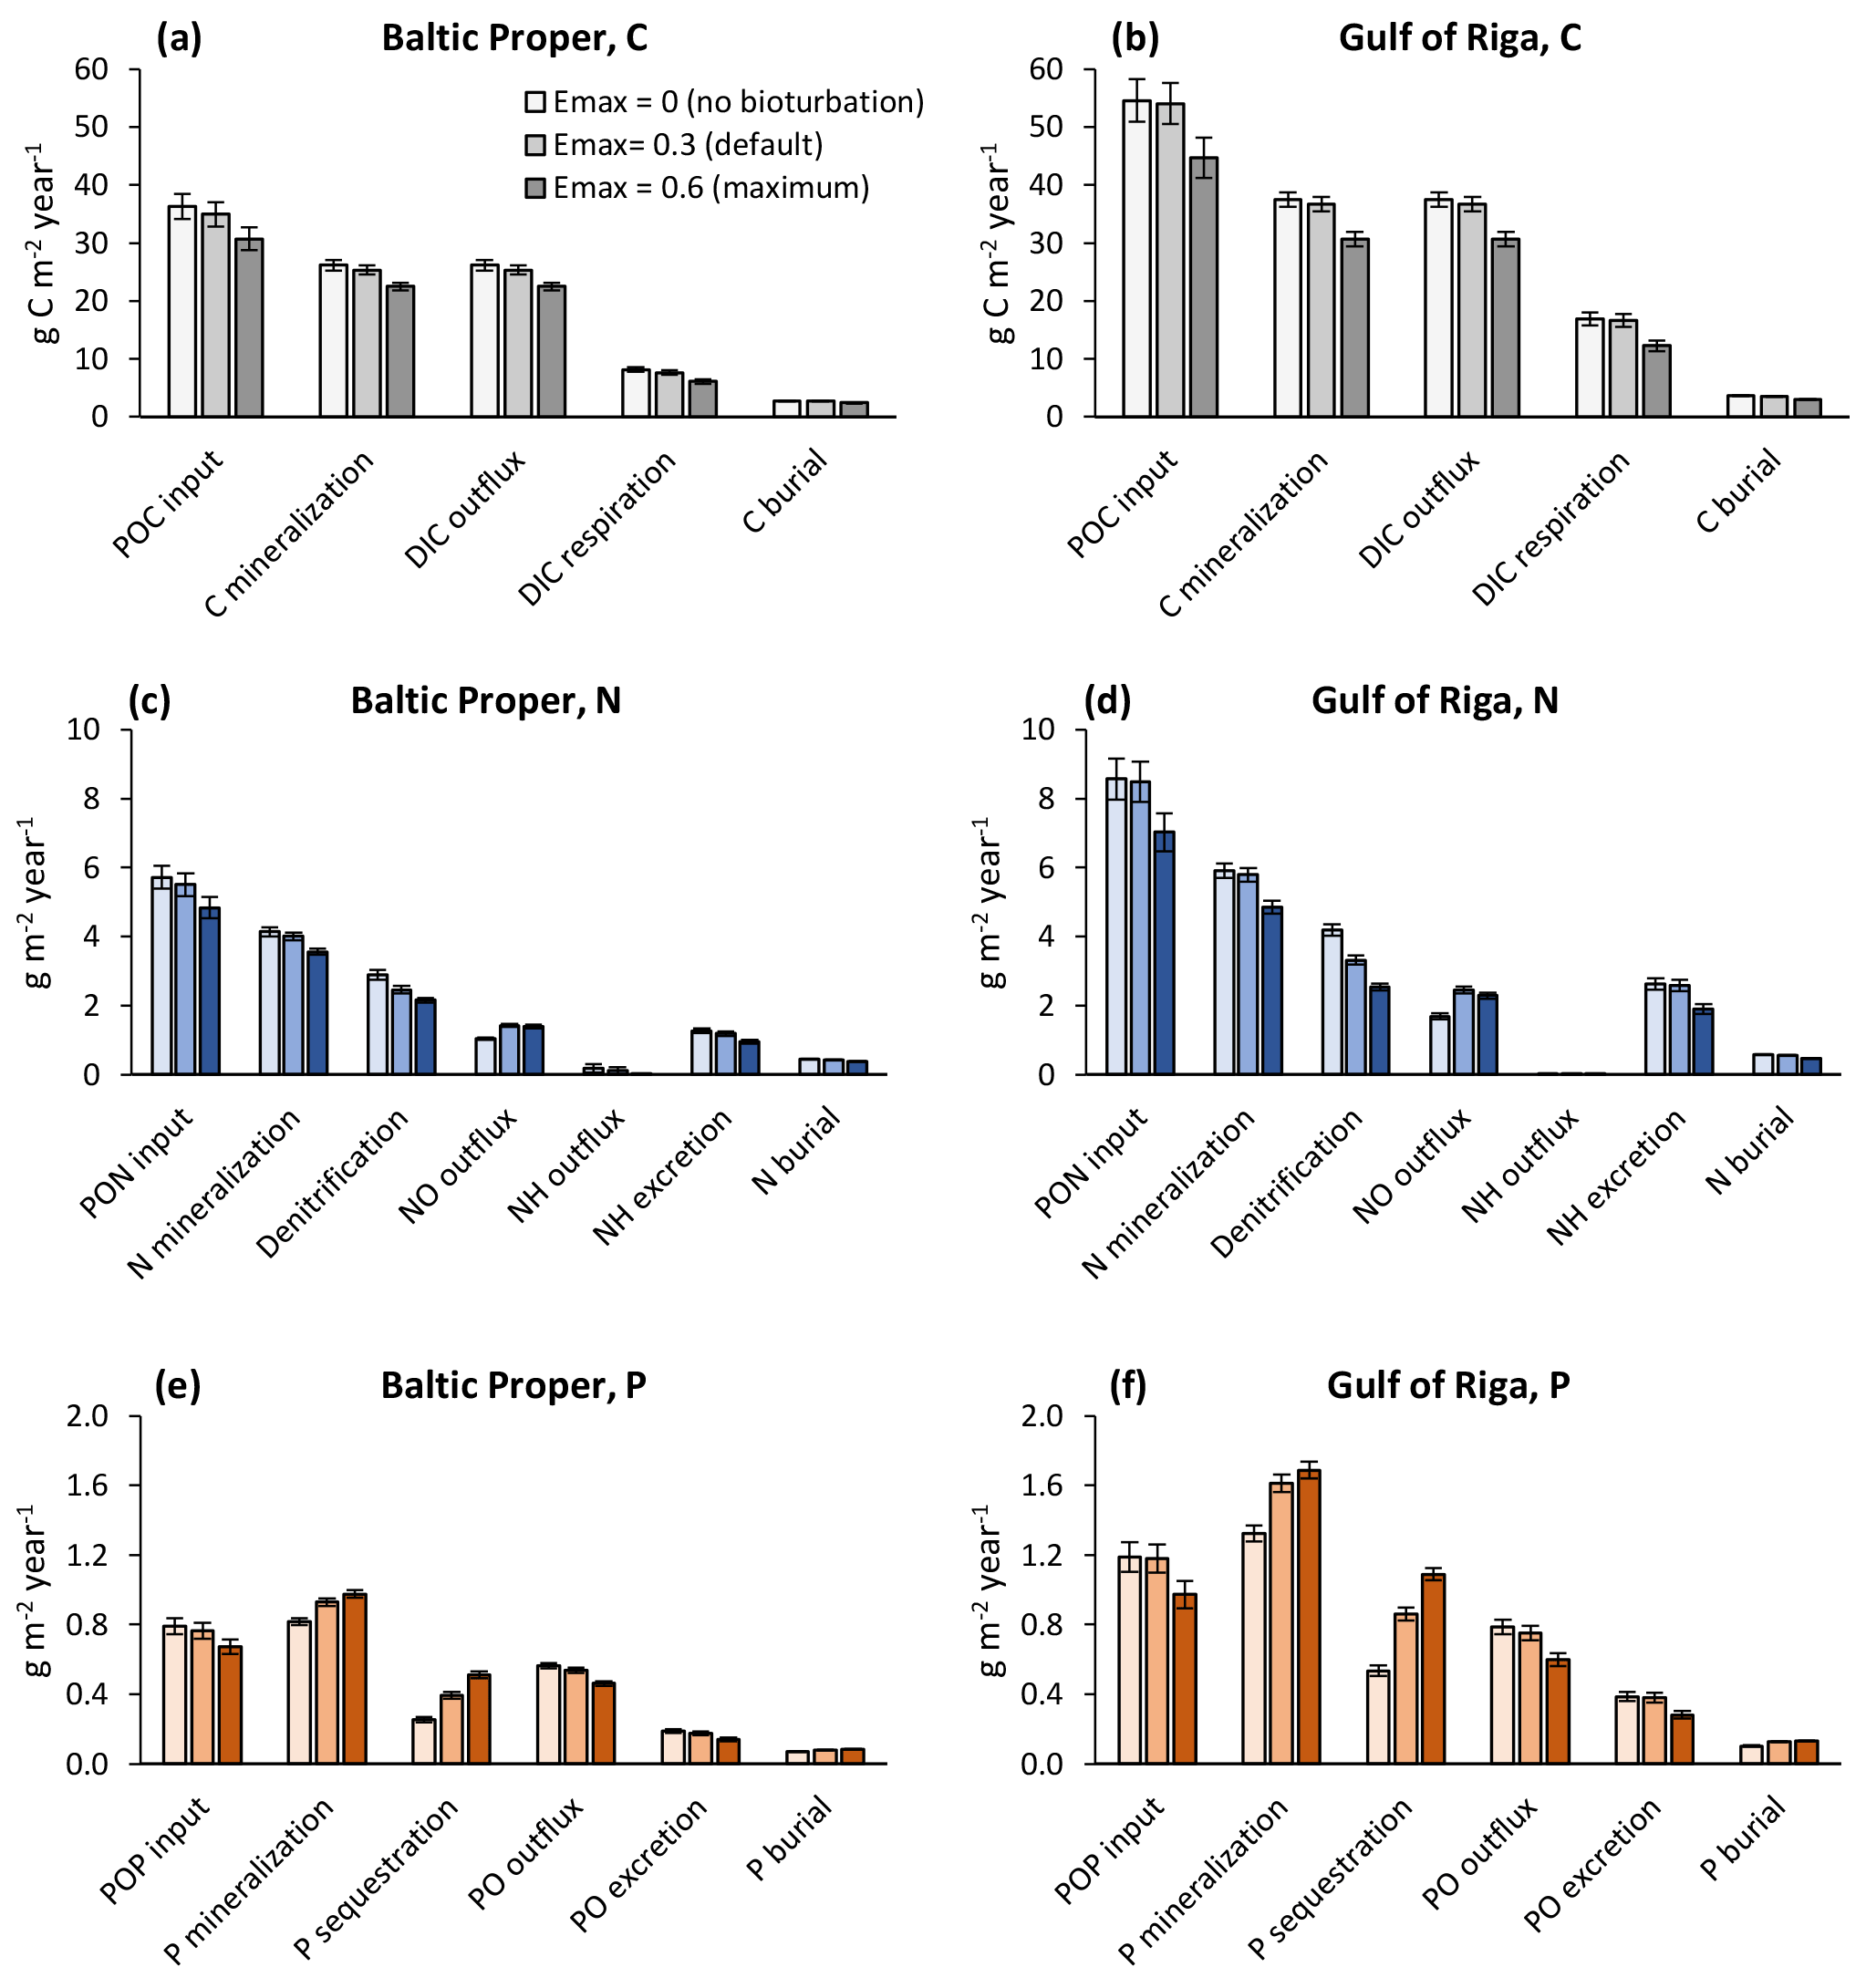
Figure 7Sensitivity analysis of effects of three levels of bioturbation on benthic fluxes of carbon (a, b), nitrogen (c, d) and phosphorus (e, f). Averages for 2000–2020 ± standard deviations in the Baltic Proper (0–90 m depth, left column) and Gulf of Riga (right column). Note that animal excretion is shown separately and not included in “mineralization” or “outflux”.

Figure 8Sensitivity analysis of effects of three levels of bioturbation on total primary production (a), N fixation by cyanobacteria (b), hypoxic area (c) and anoxic area (d). The hypoxic and anoxic areas are defined as the annual maximum extent of areas with oxygen concentration <2 and 0 mg O2 L−1, respectively. Averages for 2000–2020 ± standard deviations in the Baltic Proper and Gulf of Riga.
In general, increasing bioturbation led to a decrease in most benthic stocks (Fig. 9) and fluxes (Fig. 7). This can be explained by the following chain of effects. Increased P sequestration in the sediments (Fig. 7e–f) led to less pelagic DIP available for phytoplankton, especially cyanobacteria, growth and thereby lower N fixation and primary production (Fig. 8a–b) which in turn led to lower organic matter sedimentation rates (Fig. 7a–f), lower sediment stocks of organic matter (Fig. 9b–c), and consequently lower rates of most sediment biogeochemical transformations and fluxes (Fig. 7). Decreasing organic matter sedimentation also led to decreased biomass of benthic fauna (primarily due to a reduction in M. balthica biomass, Fig. 9a) and excretion of DIN and DIP (Fig. 7e–f). An exception is the sediment P stock (Fig. 9c), which increased with bioturbation despite decreased sedimentation of organic P (Fig. 7e–f). This was due to the increased sequestration adding to the third sediment P bank. While microbial mineralization of this bank increased as a response to increased stock size, the net effect of increased bioturbation on sediment DIP outflux was negative due to the simultaneous increase in sequestration and reduction in excretion by benthic fauna (Fig. 7e–f).
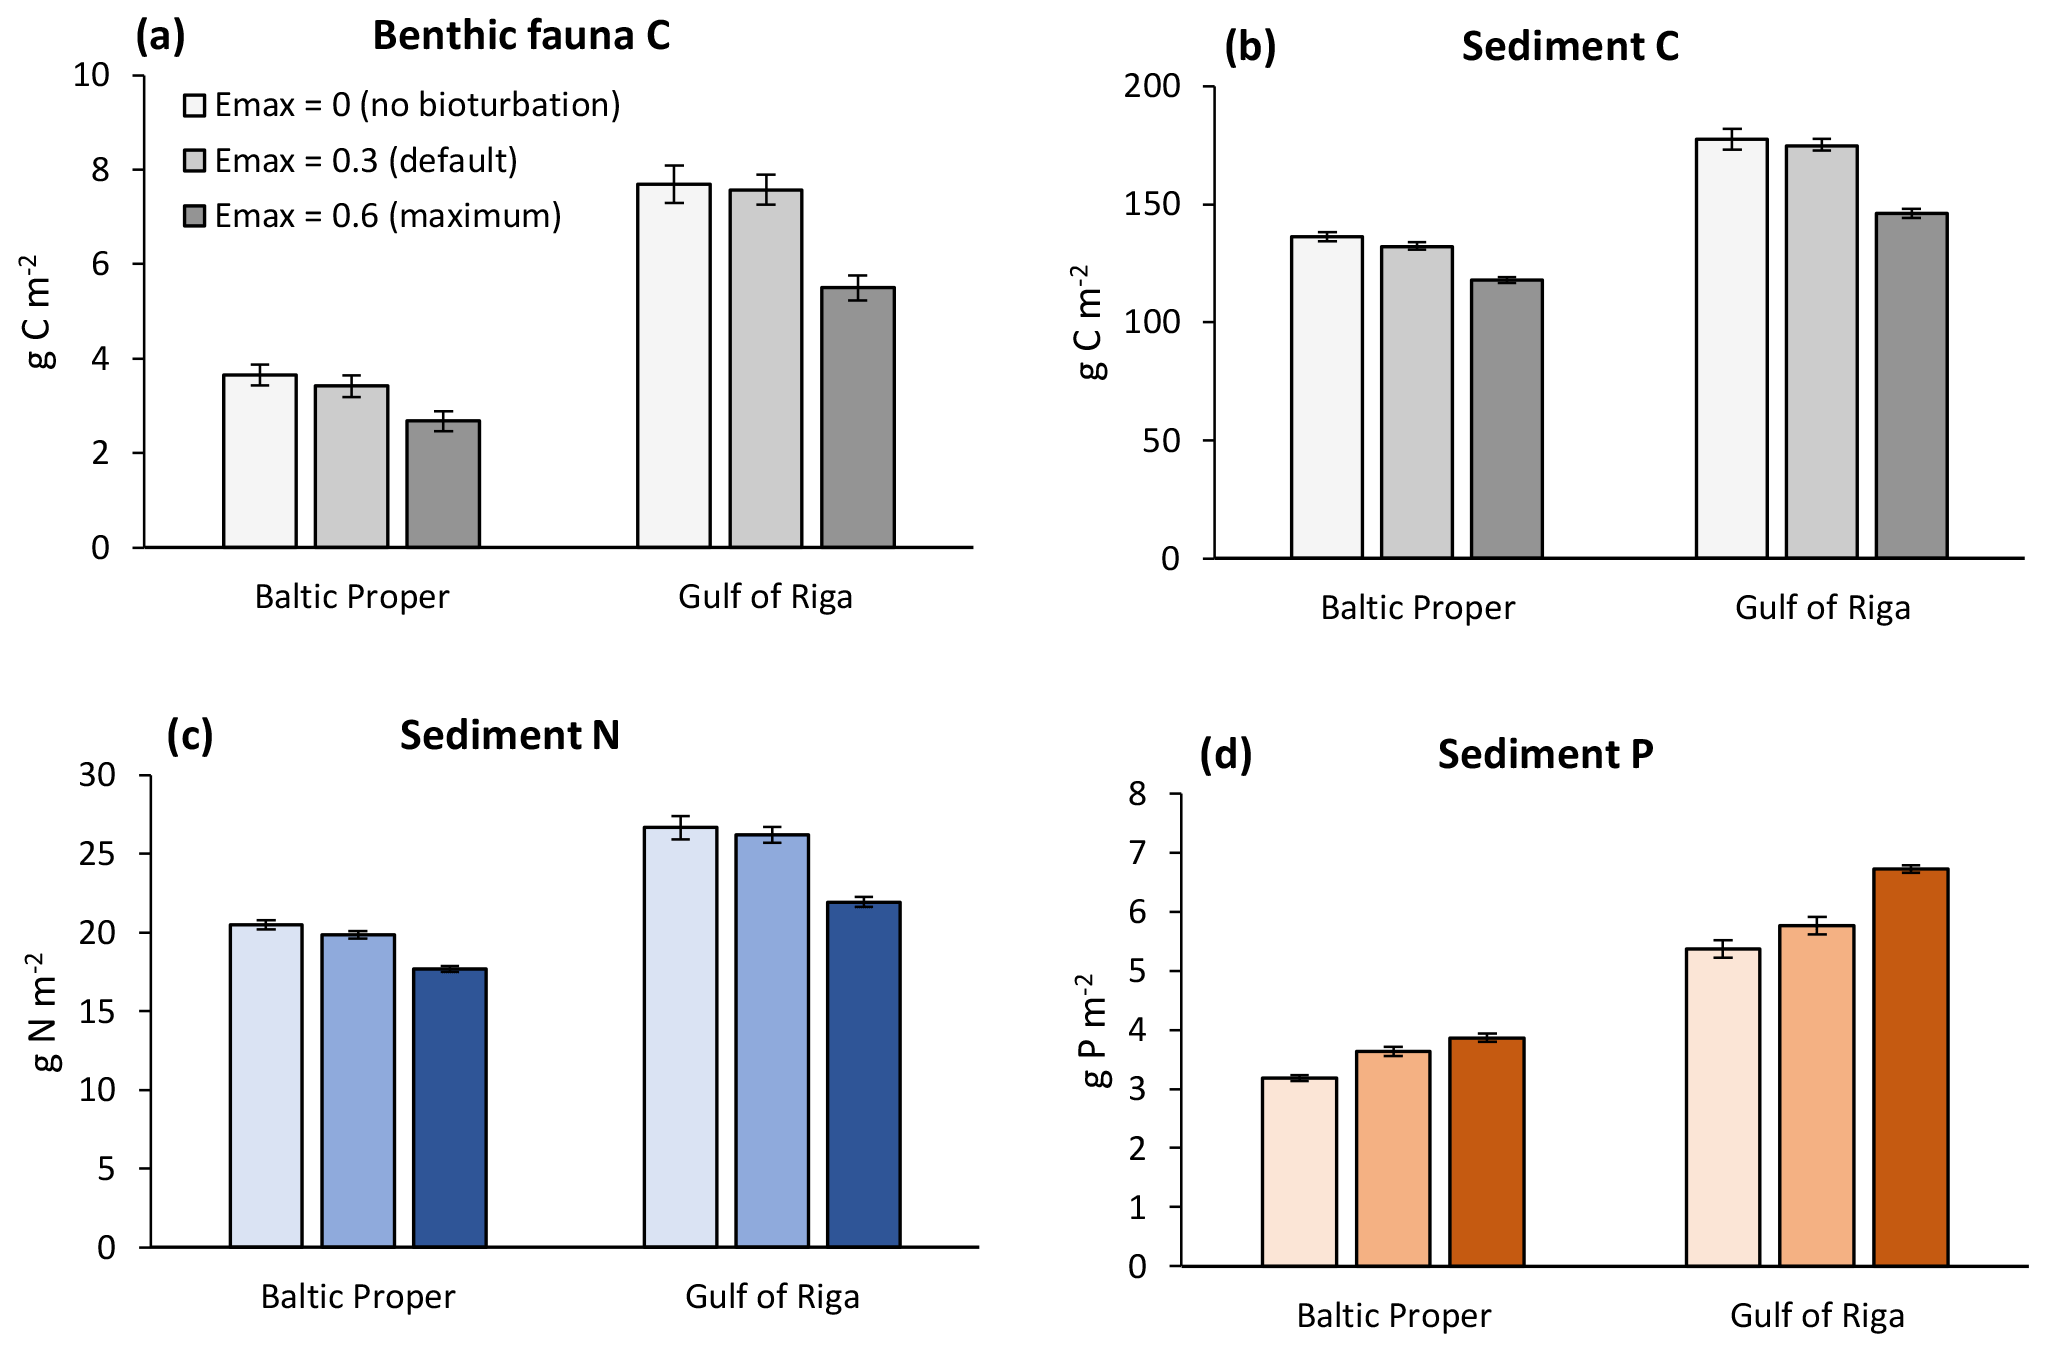
Figure 9Sensitivity analysis of effects of three levels of bioturbation on stocks of benthic fauna and sediment C, N and P. Averages for 2000–2020 ± standard deviations in the Baltic Proper (0–90 m depth) and Gulf of Riga.
Bioturbation also improved oxygen conditions (Fig. 8c–d). In the Baltic Proper the effect on hypoxic areas was marginal, but the extent of anoxic areas was reduced by ca. 8000 km2 (−16 %) in the default run and 37 000 km2 (−71 %) in the high bioturbation run compared to the no bioturbation run. In the Gulf of Riga, the intermittent hypoxic areas had a similar frequency and extent in the no bioturbation and default runs but almost disappeared in the high bioturbation run, occurring only once in the 20-year period. Nitrogen fixation also disappeared completely in the high bioturbation run in the Gulf of Riga, while it was reduced by 0.78 g N m−2 yr−1 (−81 %) in the default run compared to the no bioturbation run (Fig. 8b). In the Baltic Proper, N fixation was reduced by 0.48 g N m−2 yr−1 (−19 %) in the default and 1.22 g N m−2 yr−1 (−50 %) in the high bioturbation run.
3.4 Nutrient load scenarios
All results below are calculated from means of 2080–2100 for the BSAP and HIGH nutrient load scenarios and 2000–2020 for the default model run in the Baltic Proper (0–90 m depth) and Gulf of Riga.
With increasing nutrient loads, primary production and input of particulate organic matter (POM) to the sediments increased (Fig. 10a–e), resulting in an increase in most benthic stocks and fluxes. The biomass of benthic fauna responded more strongly to changing nutrient loads than the bioturbation enhancement coefficient linked to the feeding activities of fauna (Fig. 10f–g).
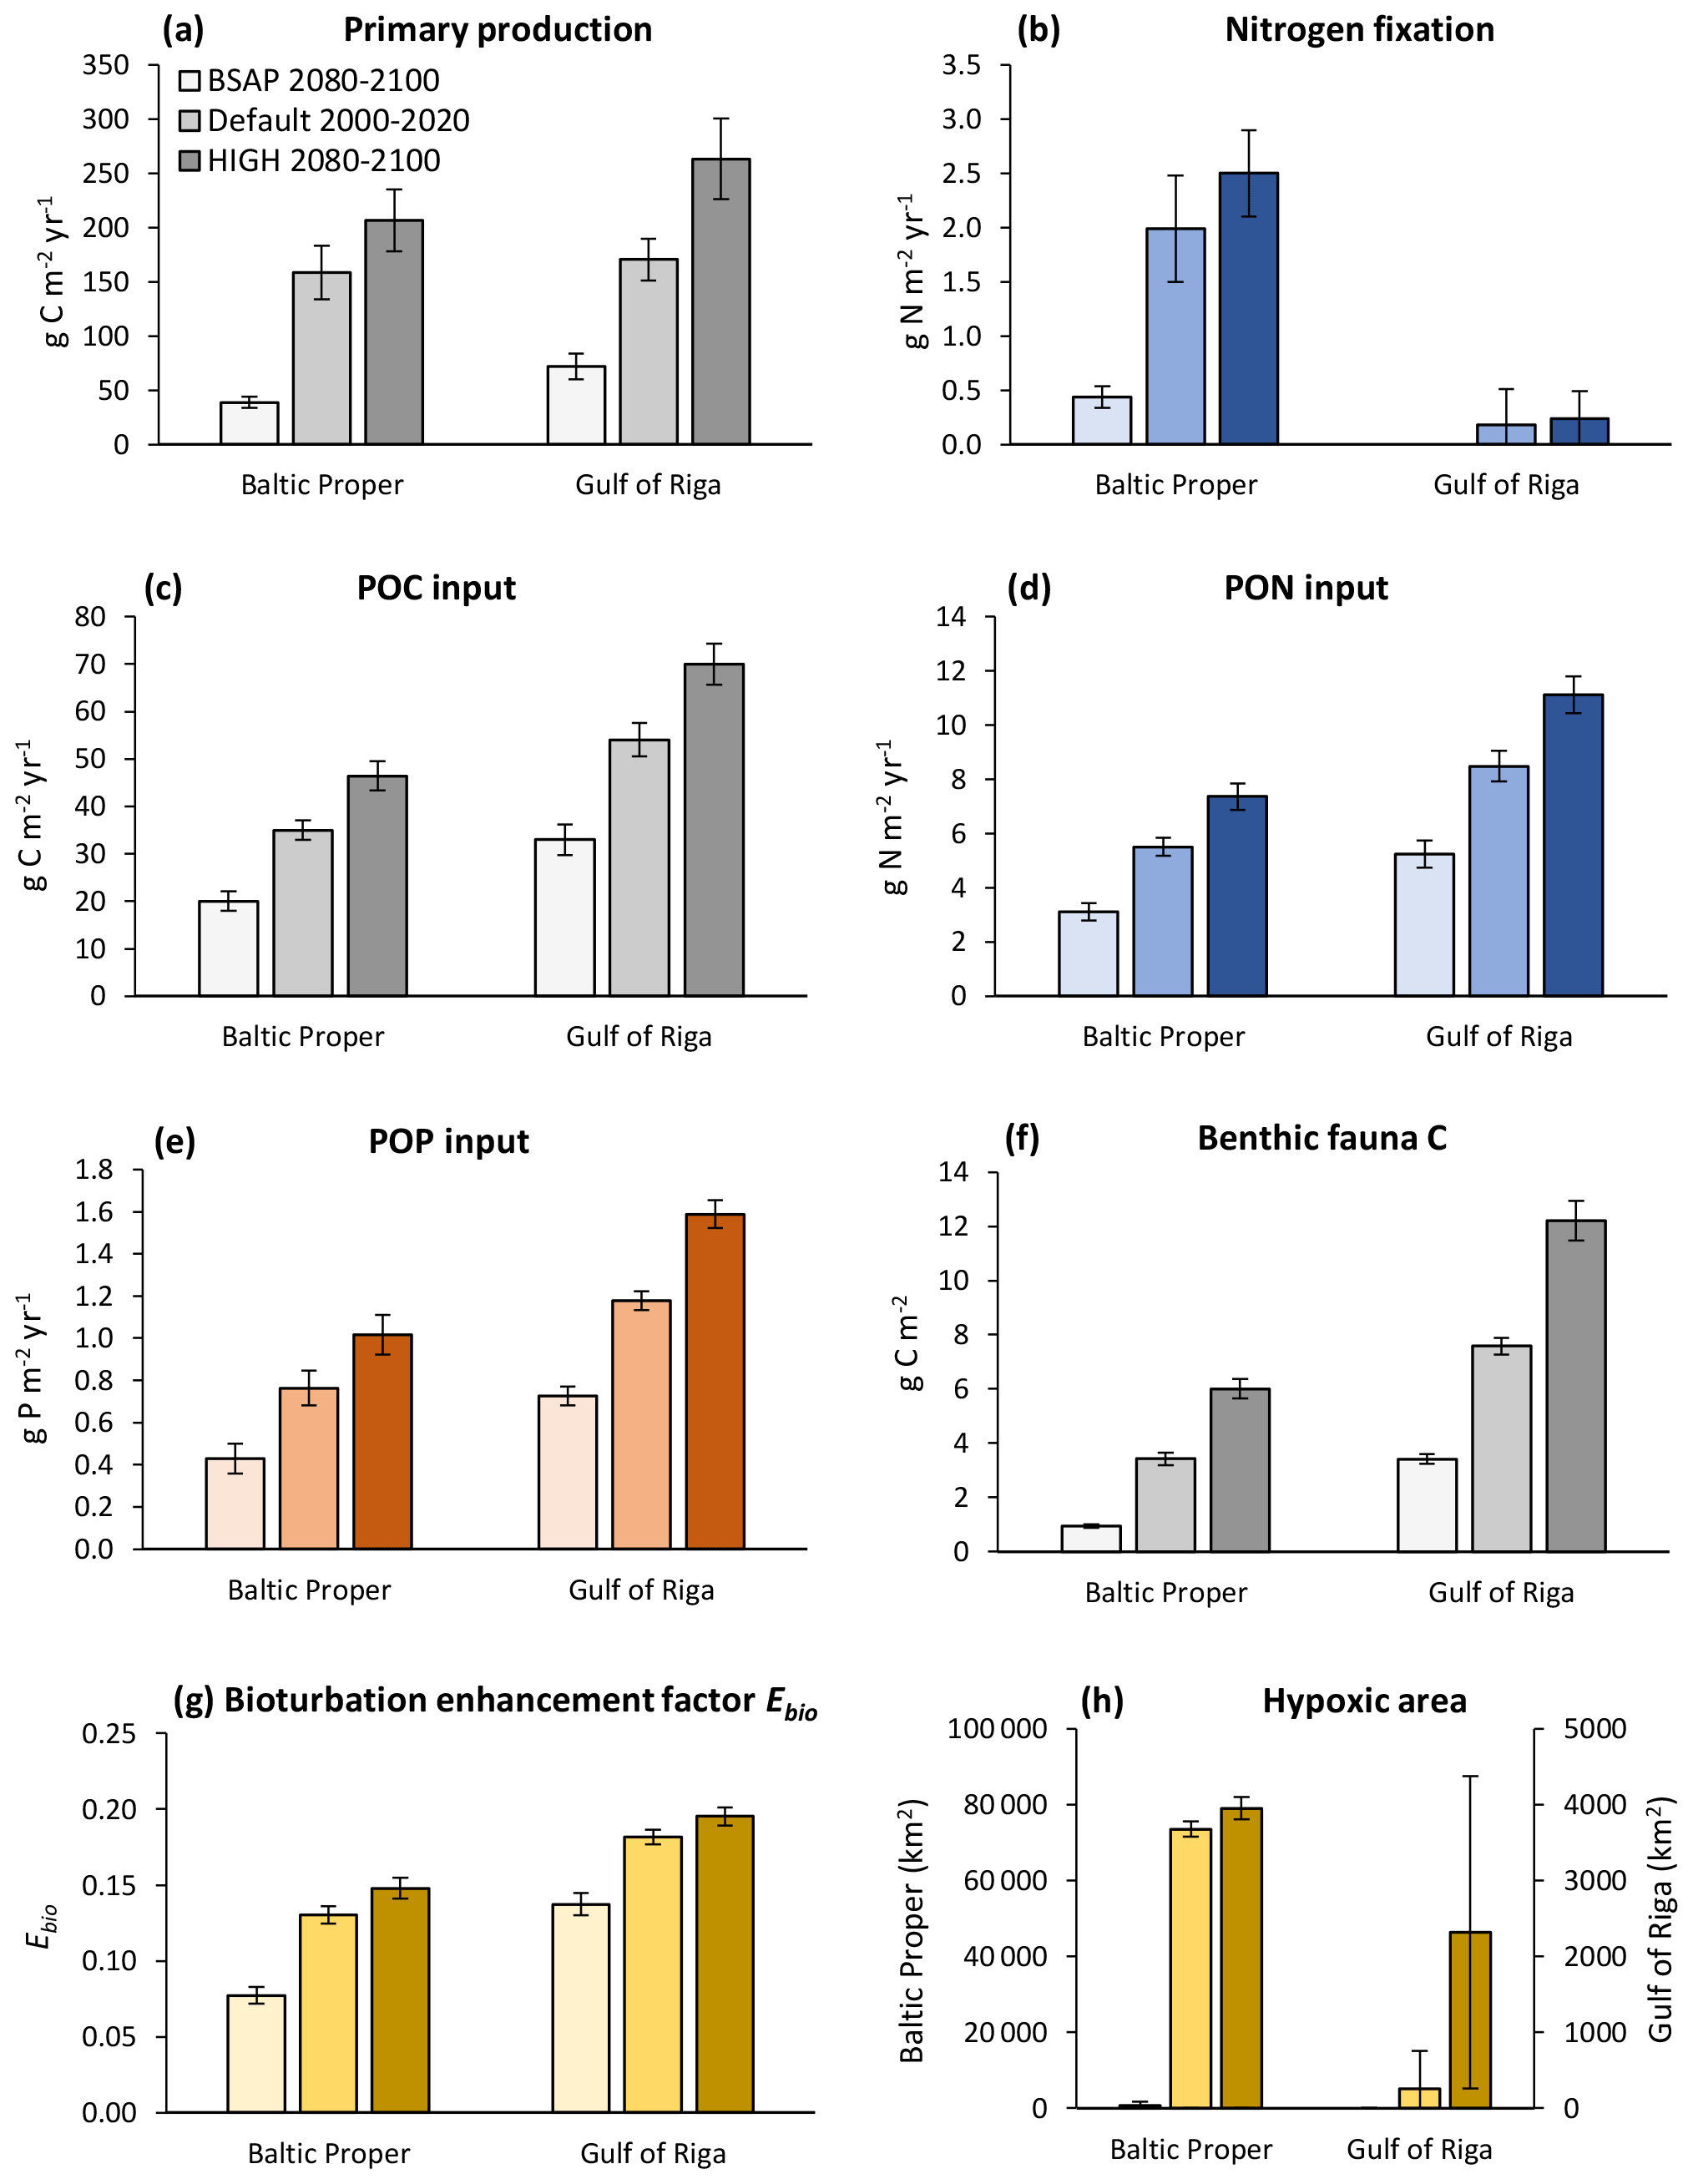
Figure 10Primary production (a), nitrogen fixation (b), input of particulate organic carbon (POC) (c), particulate organic nitrogen (PON) (d) and particulate organic phosphorus (POP) (e) to the sediment, stocks of benthic fauna (f), bioturbation enhancement coefficient (g), and hypoxic area (h) in the default model run (2000–2020) and in two nutrient load scenarios (2080–2100) in the Baltic Proper (0–90 m depth) and Gulf of Riga. The hypoxic area is defined as the annual maximum extent of areas with oxygen concentration <2 mg O2 L−1 and is given for the whole basins.
With changing loads, the relative roles of faunal and microbial processes in the sediment changed (Fig. 11). With increasing loads, an increasing proportion of benthic–pelagic fluxes of inorganic nutrients originated from faunal metabolism. Expressed as percent of POM input to the sediments, the respiration and excretion of fauna were 12 %–13 % in the BSAP scenario and 26 %–27% in the HIGH scenario in the Baltic Proper (Fig. 11a, c, e). In the Gulf of Riga, respiration and excretion were 23 %–24 % of POM input in the BSAP scenario and 35 %–37 % in the HIGH scenario (Fig. 11b, d, e). Correspondingly, the proportions of POM input released as dissolved inorganic substances resulting from microbial processes in the sediment (DIC, NO and PO outflux in Fig. 11) were higher in the BSAP than in the HIGH scenario. An exception is the NH outflux in the Baltic Proper (Fig. 11c) that increased with increasing loads due to an expansion of anoxic bottoms.
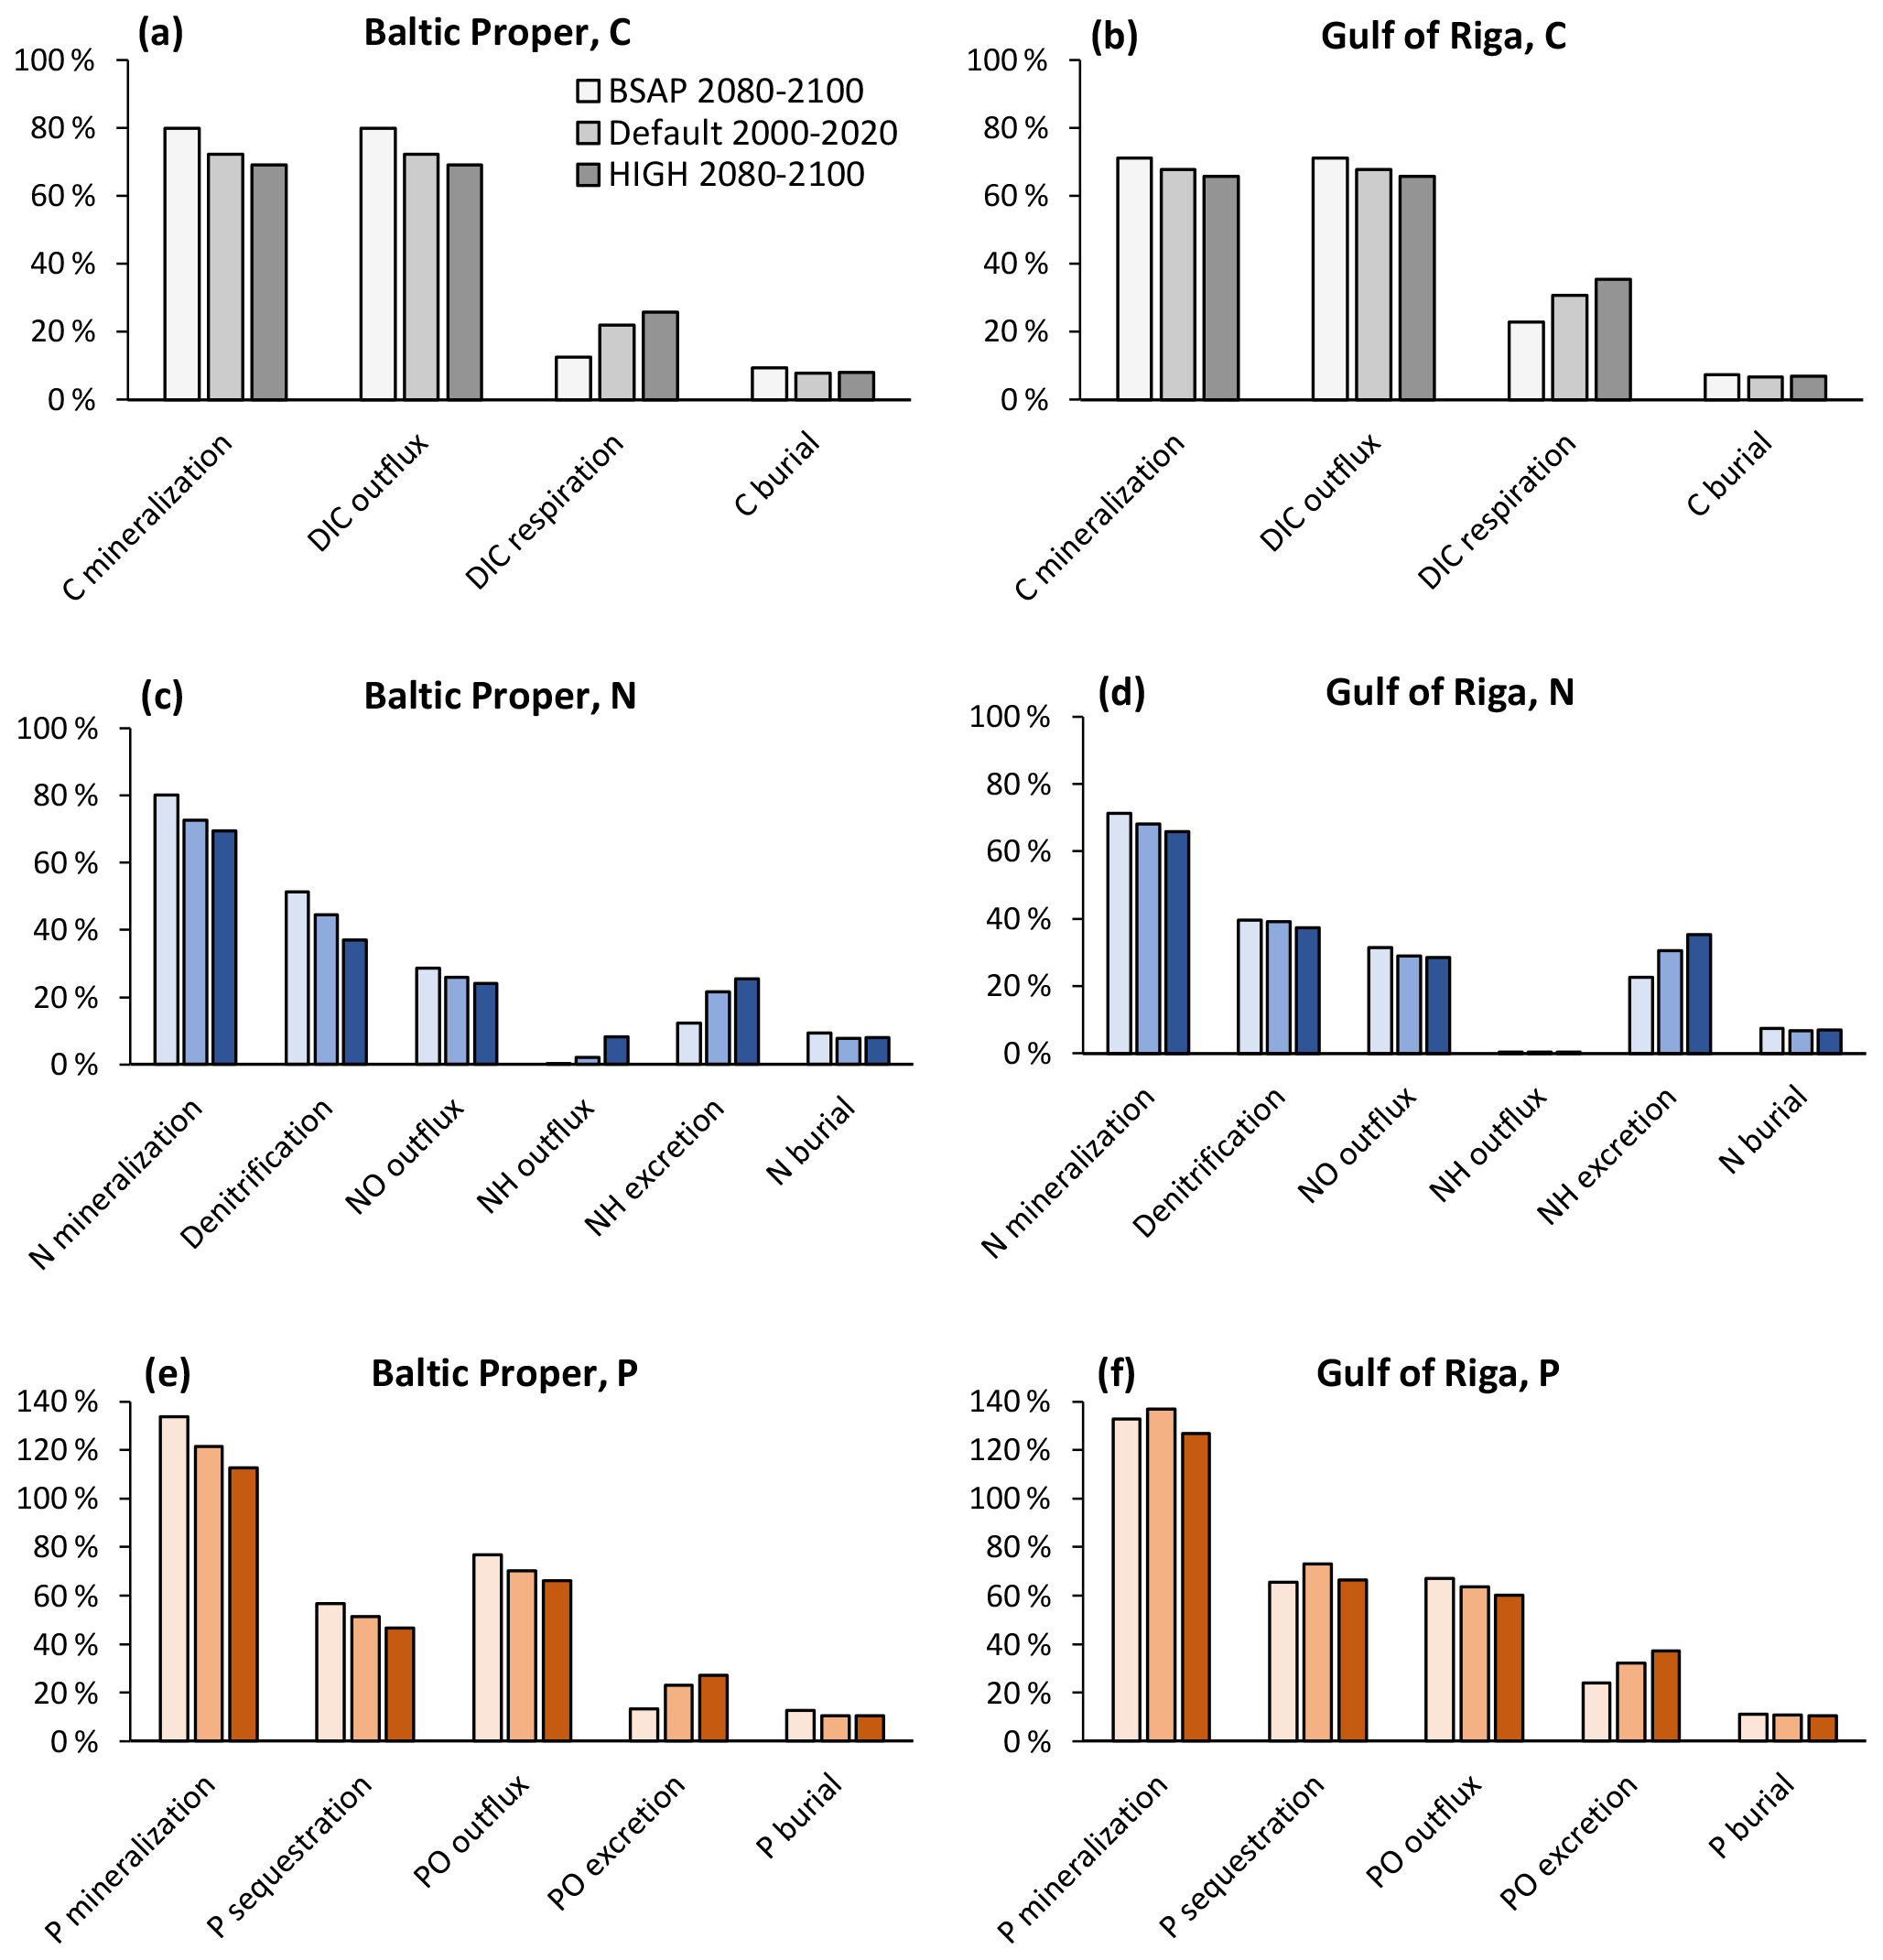
Figure 11Apportionment of benthic fluxes of carbon (a, b), nitrogen (c, d) and phosphorus (e, f) in the default model run (2000–2020) and in two nutrient load scenarios (2080–2100) in the Baltic Proper (0–90 m depth, a, c, e) and Gulf of Riga (b, d, f). Fluxes are shown as percent of POM input to the sediment. Note that animal excretion is shown separately and not included in “mineralization” or “outflux”.
The relative proportion of particulate organic phosphorus (POP) input sequestered shows a complex pattern in the Gulf of Riga (Fig. 11f): the proportion of POP input sequestered was lower in the BSAP scenario compared to the default model run due to less fauna and thereby less bioturbation. However, the proportion was also lower in the HIGH load scenario as the increased occurrence of hypoxia (Fig. 10h) counteracted the effects of increased bioturbation. In the Baltic Proper, relative P sequestration shows a decreasing pattern with increasing loads (Fig. 11e) driven by increasing occurrence of hypoxia (Fig. 10f).
Even though the total amount of POM input to the sediment increased with increasing nutrient loads, it constituted a decreasing proportion of primary production. In the BSAP scenario, almost half of the annual primary production reached the seafloor (48 % and 47 % in the Gulf of Riga and Baltic Proper, respectively) compared to 21 % and 27 % in the HIGH load scenario (Fig. 10a, c). Thus, the proportion of primary production mineralized by fauna varied only slightly with nutrient load scenario because of the opposite responses of sinking organic matter and fauna: 4.7 % (BSAP) to 4.1 % (HIGH) in the Baltic Proper and 10.7 % (BSAP) to 9.6 % (HIGH) in the Gulf of Riga.
We have created a new tool to simulate the long-term and large-scale effects of benthic fauna on biogeochemical cycling in the Baltic Sea by fully merging two existing process-based models. First simulations with the new model indicate that the benthic fauna makes up a small part of benthic organic stocks but contributes substantially to organic matter mineralization and benthic–pelagic fluxes of inorganic C, N and P through its metabolism. Further, the stimulation of P binding in sediments by bioturbation significantly reduced N fixation and primary production in the simulations, indicating that benthic fauna can alleviate the “vicious circle” of eutrophication.
4.1 Model performance
In general, the BALTSEM-BMM model reproduces the observed Baltic-Sea-scale patterns of decreasing biomass of benthic fauna with latitude and depth reasonably well, as also shown for a previous one-way coupled model version (Ehrnsten et al., 2020a). Compared to observations, the model seems to underestimate the biomass of benthic fauna in the Bothnian Sea and overestimate it in the Gulf of Finland (Figs. 3, C2). The former may be due to an underestimation of primary productivity in the Bothnian Sea by BALTSEM, while the omission of possible negative effects of low salinity on M. balthica in the Gulf of Finland may explain the latter (see Appendix C). Additionally, the model would need an addition of several groups of “megabenthos” (e.g. large echinoderms and suspension-feeding bivalves) to be applicable to the marine areas at the entrance to the Baltic Sea (Fig. C1).
The simulated mean biomass of benthic fauna in the Gulf of Riga was considerably higher than estimated by Gogina et al. (2016) (Table 1, Fig. 3). Possible reasons for overestimation may be that the model does not take into account the limitations by mobile substrates and low salinity, especially in the southern part of the basin (Carman et al., 1996; Kotta et al., 2008). In this region, a reduction in benthic biomass (e.g. of Monoporeia affinis and M. balthica) occurred in the 1990s for reasons not well understood (Kortsch et al., 2021). On the other hand, our biomass estimate is less than half of that by Kotta et al. (2008), assuming reported dry weight is 10 % of wet weight, and well within the range reported by Gaumiga and Lagzdins (1995) and Cederwall et al. (1999).
The modelled patterns in total benthic biomass are strongly driven by changes in M. balthica biomass in response to changes in food availability, leading to extinction of the group in deep waters and in the oligotrophic Bothnian Bay. These patterns are strongly supported by observations (Fig. C2).
The BALTSEM model was neither improved nor worsened by the addition of benthic fauna, according to the performance analyses comparing pelagic nutrient and oxygen concentrations to observations (Appendix B). This shows that increasing model complexity does not necessarily increase accuracy, especially when the functions and/or variables added are not well known (Ehrnsten et al., 2020b; Levins, 1966). In general, though, the previous assessments of model performance showing that the model is able to reproduce seasonal and decadal variations in biogeochemical variables and performs well in comparison to other Baltic Sea models remain valid (Eilola et al., 2011; Gustafsson et al., 2012, 2014; Meier et al., 2018; Savchuk et al., 2012).
4.2 Biogeochemical effects of benthic fauna
Similar to estimates made with previous uncoupled versions of the model (Ehrnsten et al., 2019a, 2020a), the results of this study suggest that respiration by fauna constitutes a significant part of organic matter mineralization in sediments (Fig. 4). The fauna mineralized about 8–17 g C m−2 yr−1 or 22 %–31 % of particulate organic carbon (POC) input to the sediments in 2000–2020. This agrees well with previous estimates from the Baltic Sea of 22 %–40 % (Ankar, 1977; Elmgren, 1984; Kuparinen et al., 1984). Similarly, Rodil et al. (2019) estimated that macrofauna contributed 18 %–26 % of total benthic respiration in soft and 11 %–45 % in hard bottom sites in the Gulf of Finland. Herman et al. (1999) estimated that respiration by macrofauna mineralizes 5 %–25 % of annual primary production in shallow estuaries. In these deeper coastal areas, we estimate that the fauna mineralized 3 %–9 % of annual primary production in the Baltic Proper and 8 %–15 % in the Gulf of Riga in 1970–2020, with considerable inter-annual variations.
The sensitivity analysis showed a large effect of bioturbation on primary production levels mainly due to increased P retention (Figs. 7–9). When bioturbation increased P sequestration (Fig. 7e), this led to a weakening of the “vicious circle” in the Baltic Proper where less DIP in the water column led to less N fixation and organic matter production (Fig. 8a, b), which in turn led to less organic matter input to sediments, less heterotrophic oxygen consumption, and less hypoxia and anoxia (Fig. 8c, d) and thereby further increased P sequestration in the oxygenated sediments. Also in the Gulf of Riga, where hypoxia was rare (Fig. 8c, d), the bioturbation-induced reduction in pelagic DIP had large effects on primary production and especially N fixation (Fig. 8a, b). In the two runs with bioturbation there was no or very little pelagic DIP surplus available for the N-fixing phytoplankton group in contrast to the run without bioturbation, in which N fixation added on average 0.97 g N m−2 yr−1 or ca. 17 000 t N yr−1 to the basin (Fig. 8b). It should be noted that these bioturbation effects are only valid where conditions are favourable for P binding to metal oxides, which occurs primarily in freshwater and brackish sediments with a high iron and low sulfide content (Van Helmond et al., 2020; Jordan et al., 2008).
The significant effect of bioturbation on P retention found here is in line with the results of studies on the effects of the invasive polychaete Marenzelleria spp. in the Gulf of Finland and Stockholm archipelago in the northern Baltic Proper (Isaev et al., 2017; Norkko et al., 2012). However, both of these studies focused on areas with very high abundances of Marenzelleria spp., and there are some indications that lower abundances may yield an opposite effect, i.e. increase P outflux from the sediment (Norkko et al., 2012; Nyström Sandman et al., 2018). While these studies concentrated on a single taxon in a limited area, we included a dynamic representation of the whole benthic fauna community over the whole Baltic Sea. Further, these studies only included the effects of bioturbation but excluded metabolic fluxes. Here, we estimated that even though the excretion of DIP by benthic fauna constituted a significant proportion of benthic–pelagic fluxes, about one-quarter to one-third (Fig. 4e, f), it did not reverse the effect of bioturbation on P retention. These results are supported by Berezina et al. (2019), who found a positive correlation between macrofaunal biomass and P excretion but a negative correlation between biomass and total sediment to water DIP flux in sediment cores with natural macrofauna communities in the eastern Gulf of Finland.
The effects of bioturbation on sediment N dynamics were less important for eutrophication processes than the effects on P dynamics in this study. We assumed a very simple process formulation, in which bioturbation increases oxygen penetration depth in the sediments leading to a larger proportion of organic N mineralization in oxic environments, thus promoting outflux of nitrates over benthic denitrification. In reality, denitrification is a complex process depending on, for example, the 3D structure of redoxclines in the sediment. If the biogenic structures of tube-dwelling bio-irrigators increase the area of the oxic–anoxic interface in the sediment, this can lead to the opposite effect in which a larger proportion of nitrate is denitrified at the enlarged redoxcline (Aller, 1988; Gilbert et al., 2003). However, we believe this to be a special case unlikely to dominate in the Baltic Sea. Henriksen et al. (1983) measured an increased proportion of nitrate denitrified in sediments with large burrows of animals with low irrigation activity (e.g. Arenicola marina) but a decrease in sediments with species common in the Baltic Sea (e.g. M. balthica and Mya arenaria).
To better capture alterations in redoxclines, a depth-resolved sediment model with oxygen as a state variable would be needed. We also recognize that many other possible effects of bioturbation, e.g. on burial (Josefson et al., 2002) and resuspension (Cozzoli et al., 2021), were not included. However, there is always a trade-off between model complexity and generality, with few models to date combining a depth-resolved sediment module with a full pelagic model (Ehrnsten et al., 2020b; Lessin et al., 2018). One of the main advantages of the BALTSEM model is that its simplicity and fast running time promote the development of additional features and experimentation with a large number of simulations (e.g. Gustafsson et al., 2015; Soerensen et al., 2016; Undeman et al., 2015).
Experimental studies from the Baltic Sea report a range of positive, negative or negligible effects of benthic fauna on benthic–pelagic DIN fluxes and denitrification rates, showing that these processes are highly context-dependent (Griffiths et al., 2017, and references therein). Studies with M. balthica, the dominating group in our simulations, likewise report increasing, decreasing and inverted nitrate fluxes compared to bare sediments (Stief, 2013, and references therein). On the other hand, ammonium outfluxes were consistently increased by macrofauna in 31 studies reviewed by Stief (2013), supporting our simulation results that animal metabolism plays a significant role in benthic–pelagic DIN fluxes, with ammonium excretion constituting about half of the total DIN fluxes in 2000–2020.
4.3 Benthic–pelagic coupling in a changing environment
The Gulf of Riga had higher simulated benthic stocks and fluxes than the Baltic Proper. This can partly be attributed to the slightly higher primary production (171 ± 19 vs. 159 ± 25 g C m−2 yr−1 in 2000–2020, Fig. 8a) but probably more importantly to the shallower mean depth causing a larger proportion of pelagic production to sink to the sediments before it is mineralized in the water column. In the Gulf of Riga, on average one-third (32 %) of primary production reached the bottom as POC during 2000–2020, compared to one-fifth (21 %) in the Baltic Proper.
Besides depth, the amount of organic matter export also depends on, for example, the type of plankton and temperature (Tamelander et al., 2017). Despite large inter-annual variations, there was a clear decreasing trend in the proportion of primary production exported to the seafloor of about 5 percentage points per decade in the Baltic Proper during 1970–2020 (R2=0.68, F=103, p<0.0001). This coincides with an increase in water temperature and shift in phytoplankton composition towards an increased proportion of cyanobacteria, seen both in these simulations and in reality (Belkin, 2009; Kahru and Elmgren, 2014). A less clear decreasing trend of 2 percentage points per decade was simulated in the Gulf of Riga (R2=0.29, F=20, p<0.0001).
The proportion of primary production arriving at the seafloor also varied with nutrient loads, constituting almost half of the annual primary production in the reduced-load BSAP scenario (47 %–48 %) compared to 21 %–27% in the HIGH load scenario (Fig. 10a, c). Simultaneously, the amount of benthic fauna decreased and mineralization of sediment organic matter became more dominated by microbial processes with reduced loads. Thus, we can conclude that both the absolute amount and the relative proportion of POM input mineralized by macrofauna increased with nutrient loads, but in relation to primary production the proportion mineralized by fauna was almost independent of changes in loads because of the opposite responses of sinking organic matter and fauna.
Using a newly developed modelling tool, significant effects of benthic macrofauna on C, N and P cycling were simulated in the semi-enclosed brackish-water Baltic Sea, with impacts on the ecosystem from the extent of hypoxic bottoms to the rates of pelagic nitrogen fixation and primary production. Our results suggest that in addition to bioturbation, relatively more studied in the modelling context, the metabolism of benthic fauna should be given more attention in future studies as it may play a significant role in benthic mineralization of organic C, N and P in coastal seas and estuaries.
The magnitude of effects of benthic fauna on biogeochemistry generally decreased with depth and increased with productivity, as shown by the comparison of two basins and different nutrient load scenarios. Thus, these simulations confirm the notion that benthic–pelagic coupling is strongest in shallow coastal areas (Griffiths et al., 2017; Nixon, 1981), but they also show that this relationship is modified by multiple interacting physical and biological drivers, which may change over time. For example, we found that the proportion of primary production reaching the seafloor decreased with increased nutrient loading and increased temperature as both led to an intensification of pelagic nutrient cycling. Further, simultaneous positive and negative feedback loops led to complex relationships, e.g. between productivity and P cycling (as seen in Fig. 11f). On the one hand, increased productivity can increase the amount of bioturbating fauna, stimulating P sequestration. On the other hand, increased productivity can increase benthic oxygen consumption for the mineralization of sinking organic matter, leading to deteriorating oxygen conditions and increasing P leakage from sediments. Unravelling the many interacting drivers and responses on a system scale is important to understand how coastal and global biogeochemical cycles are responding to changes in, for example, nutrient loads and climate.
Even though these large-scale simulations contain a large degree of uncertainty, they are an important complement to empirical studies, which for practical reasons can only consider temporally and spatially limited parts of the system (Boyd et al., 2018; Snelgrove et al., 2014). To improve the confidence in simulation results, we see two major ways forward. First, as all models contain different formulations, assumptions and uncertainties, implementing benthic fauna components in other physical–biogeochemical models and comparing the results would greatly increase the strength of evidence for those results where different models agree. This kind of ensemble modelling is increasingly used in climate change research and has also been applied in the context of Baltic Sea biogeochemistry (Meier et al., 2012, 2018; Murphy et al., 2004). We hope that the publication of the benthic model formulations stimulates the development of benthic fauna modules in other models of the Baltic Sea ecosystem and beyond. Even though the current model implementation is only applicable to the brackish parts of the Baltic Sea due to a lack of functional groups present in the marine parts, the inclusion of additional functional groups using the existing groups as a template would be straightforward technically. The main challenges are the parameterization of group-specific rates and managing the increased complexity.
Second, a comprehensive compilation of observational data on sediment stocks and fluxes would be needed for improved model validation. Such data are collected for monitoring and research purposes by a great number of institutions around the Baltic Sea, but a comprehensive, open-access, quality-controlled collection of these data is lacking. The Baltic Environment Database (BED) has been invaluable for both model development and validation of pelagic physics and chemistry. While these data can be used as indirect validation of benthic model processes in the strongly coupled system, we call for the development of a “Benthic BED” to facilitate future model development. A comprehensive collection of observational data would also facilitate the identification of knowledge gaps and future research priorities.
All state variables are listed in Table A1 and benthic parameters in Tables A2–A4. A graphical overview of benthic state variables and processes is provided in the main paper (Fig. 2). Bioavailable surface sediments are represented as terraces at 1 m depth intervals with an area corresponding to the hypsography of each basin. All benthic state variables are calculated in milligrams per square metre (mg m−2) for each terrace.
A1 Sediment dynamics
Sediment concentrations of elements X (X= C, N, P) are divided into three banks that share the same processes (Eqs. A1–A3). Deposition of sinking detritus (DDETX) and phytoplankton (DPHYiX, i= phytoplankton group 1, 2, 3) on the sediment is integrated into a bank of fresh organic matter, SED1X (Eq. A1). Loss terms of the bank are mineralization (ZSED1X), ageing (ASED1X) into the second food bank, SED2X, and uptake by deposit-feeders (USED1X,BF2). Sources of SED2X include ageing from bank 1 (ASED1X) and faeces from deposit-feeders (FBF2X) and predators (FBF3X) (Eq. A2). Loss terms are mineralization (ZSED2X), uptake by Macoma balthica (USED2X,BF1) and ageing (ASED2X) into the third sediment bank, SED3X, which is considered unavailable as food for the benthic fauna but available for bacterial mineralization. Mortality (MBFiX) of all benthic groups and faeces of M. balthica are added to the third bank (Eq. A3). Loss terms are mineralization (ZSED2X) and burial (BX).
Sediment silica is modelled as a single pool with sinking diatom Si (PHY2Si) as a source, as well as mineralization and burial as sinks (Eq. A4).
Mineralization (Eq. A5) and ageing (Eq. A6) of element X (X= C, N, P) in bank SEDi (i= 1, 2, 3) are formulated as first-order reactions, with the rate constants aZSEDX and kSEDi, respectively. Mineralization and ageing are temperature-dependent according to the functions QT1 (Eq. A38) and QT2 (Eq. A39), respectively.
A proportion aBSEDX of the third sediment bank is buried (Eq. A7).
Table A2Benthic parameters in the BALTSEM-BMM model taken from the standard BALTSEM (Gustafsson et al., 2014). Recalibrated parameter values are indicated in bold. Subscript indices C, N, P and Si refer to the respective elements. Where different elements share the same parameter value, the indices are listed in a row.
For each element X (X= C, N, P), the mineralization fluxes from all three sediment banks are summed into a total flux (ZSEDXtot), which is further divided in the same way as in the standard BALTSEM with the addition of bioturbation effects. For C, the total sediment mineralization flux goes to the pelagic dissolved inorganic carbon (DIC) pool (ODIC, Eq. A8).
Depending on oxygen concentrations in the bottom water layer (OXY), mineralized sediment N is released to the water column as ammonia (ONH, Eq. A9), oxidized to N (ONO, Eq. A10) or denitrified to N2 (WDeni, Eq. A11). NH represents total ammonia (NH3 and NH4) and NO the sum of nitrite (NO2) and nitrate (NO3).
In anoxic or nearly anoxic conditions, the mineralized N is released to the water column as NH, defined by the fraction vNOXY (Eq. A12); otherwise it is oxidized.
Subsequently, the oxidized fraction can be denitrified into N2 (treated as a permanent sink) or released to the pelagic NO pool. The fraction released as NO (ηN) is positively related to oxygen concentrations according to Eq. (A13), where qN, aN, bN and cN are parameters of the sigmoid curve (Savchuk, 2002), and Ebio is a bioturbation enhancement factor (see Eq. A37 below).
A fraction ηP of mineralized sediment P is sequestered (KP, Eq. A14), i.e. bound to iron oxides in the sediment, while the rest is released to the pelagic phosphate (PO) pool (OPO, Eq. A15).
Table A3Benthic parameters in the BALTSEM-BMM model taken from the carbon-based BMM (Ehrnsten et al., 2020a). Parameters are applied equally to C, N and P components.

a Deposit-feeding. b Suspension-feeding.
The fraction sequestered is positively related to oxygen concentrations (enhanced by bioturbation) and negatively related to salinity according to Eq. (A16), where qP, aP, bP, cP, dP, eP, fP and gP are curve parameters. The fraction has an upper limit of 1 (100 % of mineralized P sequestered) but can take on negative values, representing a release of previously sequestered P in severely hypoxic or anoxic conditions. The salinity (SAL) dependence in the third term is used as a proxy for the higher availability of iron in the low-saline Bothnian Bay.
Sediment C mineralization and nitrification consume oxygen, while denitrification causes reimbursement of O2. Thus, the sediment consumption of bottom water oxygen, OSEDOXY, is calculated according to Eq. (A17). The constants βZC, βNit and βDeni are oxygen equivalents for the respective processes.
Table A4New parameters in the BALTSEM-BMM model.
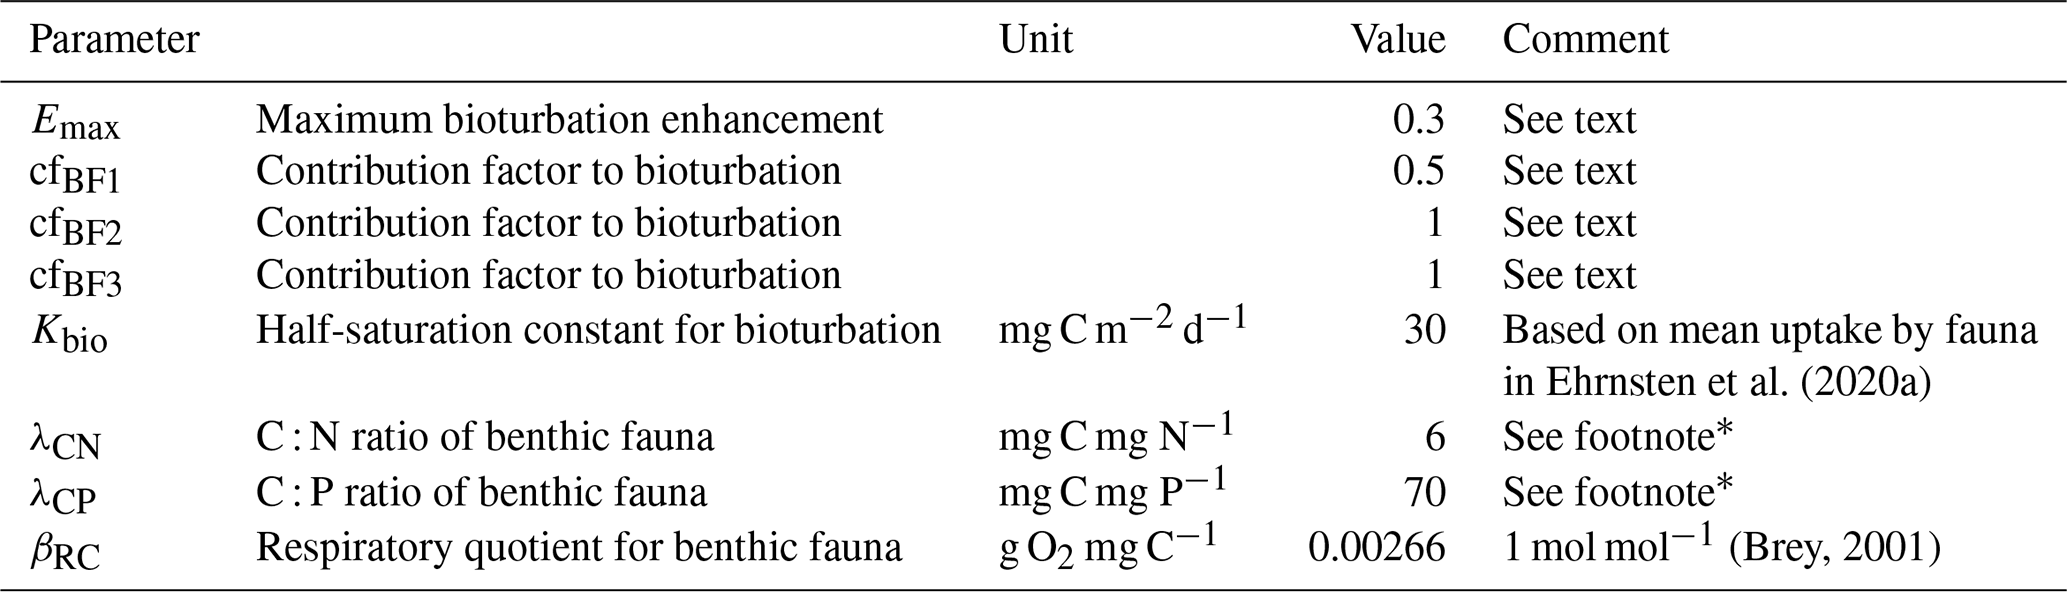
* Based on stoichiometric ratios measured from Baltic Sea benthic fauna (Carman and Cederwall, 2001; Cederwall and Jermakovs, 1999; Hedberg et al., 2020; Kahma et al., 2020; Kumblad and Bradshaw, 2008; Lehtonen, 1996; Mäkelin and Villnäs, 2022).
A2 Benthic fauna
The model includes three functional groups of benthic fauna – Macoma balthica (BF1), deposit-feeders (BF2) and predators (BF3) – that share the same processes but with group-dependent parameterizations. The change in C biomass of functional group i (i= 1, 2, 3) is the difference between food uptake, faeces production, respiration, mortality and predation (Eq. A18), where UBFiC,BF3 denotes predation on group i (i= 1, 2) by benthic predators.
Since the model does not include recruitment or migration, biomass change is set to 0 when biomass falls below 0.01 mg C m−2 to avoid permanent extinction of any group.
The change in N and P components of a group BFiX (i= 1, 2, 3; X= N, P) share the same processes as above, except that respiratory release of C is replaced by excretion of N or P (Eq. A19). As the fauna has fixed stoichiometry, the dynamics can also be expressed by the change in C biomass and a conversion factor λCX.
Food uptake of element X (X= C, N, P) by group i is the sum of ingestion of food sources j, where IjX,BFi is the ingestion rate of food source j by group i (Eq. A20).
Predators feed on deposit-feeders and M. balthica, with a strong preference for the former. The ingestion rate of multiple food sources is formulated according to Eq. (A21), where IjC,BF3 is the ingestion rate of food source j by predators, Imax,BF3 is the maximum specific ingestion rate of predators, prj and prk are preference factors for food sources j and k, Flimj and Flimk are lower feeding limits on j and k, and Km,BF3 is a half-saturation constant for predator ingestion rate.
Deposit-feeders are restricted to feeding on freshly deposited organic matter in SED1X, while M. balthica can eat slightly older organic matter in SED2X. M. balthica switches to suspension-feeding when phytoplankton concentrations are high (>2 mg Chl a m−3). Ingestion rate of a single food source j by group i can be simplified to Eq. (A22).
Additionally, feeding stops at anoxia for all groups.
The ingestion rate of food source component X (X= N, P) is proportional to the C:X ratio of the food source j (Eq. A23).
Ingested food is divided into assimilated uptake (AUBFiX, Eq. A24) and faeces (FBFiX, Eq. A25) by an assimilation factor AFj, which depends on the assumed nutritional quality of the food source j.
Respiratory release of DIC (RBFiC) is divided into three terms: basal respiration related to biomass and temperature, growth and activity respiration related to food uptake, and possible excess respiration to keep stoichiometry (RexBFiC) according to Eq. (A26), where rb,BFi and rg,BFi are the basal and growth respiration constants of group i, respectively.
Excretion of N and P (EXi) is formulated in the same way as respiration, and adds NH or PO to bottom water, respectively (Eq. A27).
To calculate excess respiration or excretion, first the limiting element for growth (limi) is calculated by comparing the stoichiometry of assimilated food uptake to the stoichiometry of the fauna group i (Eq. A28), where minloc refers to the location of the minimum term within the brackets.
For the limiting element, excess respiration or excretion is 0. The other two elements are then released to restore the stoichiometry of the fauna. Thus, total respiration and excretion of group i are given by the matrix in Eqs. (A29–A31).
Respiration consumes bottom water oxygen according to Eq. (A32).
Mortality is divided into hypoxia-induced mortality and other mortality. Other mortality rate mother,i is linear for M. balthica (Eq. A33) and quadratic for the other two groups (Eq. A34).
The hypoxia-induced mortality rate mox,BFi is dependent on bottom water oxygen concentration, temperature and the functional group's sensitivity to hypoxia according to Eq. (A35), where m0,BFi is the mortality rate at anoxia and 10 ∘C, and Kox,BFi is a hypoxic sensitivity constant (Timmermann et al., 2012).
A3 Bioturbation
Similar to Isaev et al. (2017), we use simple formulations for the effects of bioturbation on sediment denitrification (Eq. A13) and P sequestration (Eq. A16) through a bioturbation enhancement factor Ebio which mimics increased oxygen penetration into the sediment. Ebio uses the feeding rate of fauna as a proxy of their bioturbation activity (Blackford, 1997) according to Eq. (A36), where Emax is the maximum enhancement, cfBFi is a contribution factor of functional group i (i= 1, 2, 3), UBFiC is the carbon uptake rate of group i, and Kbio is a half saturation constant. As M. balthica is more sedentary than the other groups, a contribution factor of 0.5 was assigned to it and a factor of 1 to the two other groups (Ebenhöh et al., 1995; Gogina et al., 2017, and references therein).
A4 Temperature dependencies
Temperature (T) dependencies in the equations above are formulated according to Eqs. (A37–A39).
As a measure of model performance, we calculate the relative bias of simulated and observed long-term monthly means for some of the main pelagic state variables as described in Savchuk et al. (2012) but with data extended to 2015. The index compares model–data difference with variability in the data, giving an estimate of how well the model captures variability in nature on seasonal, annual and decadal scales.
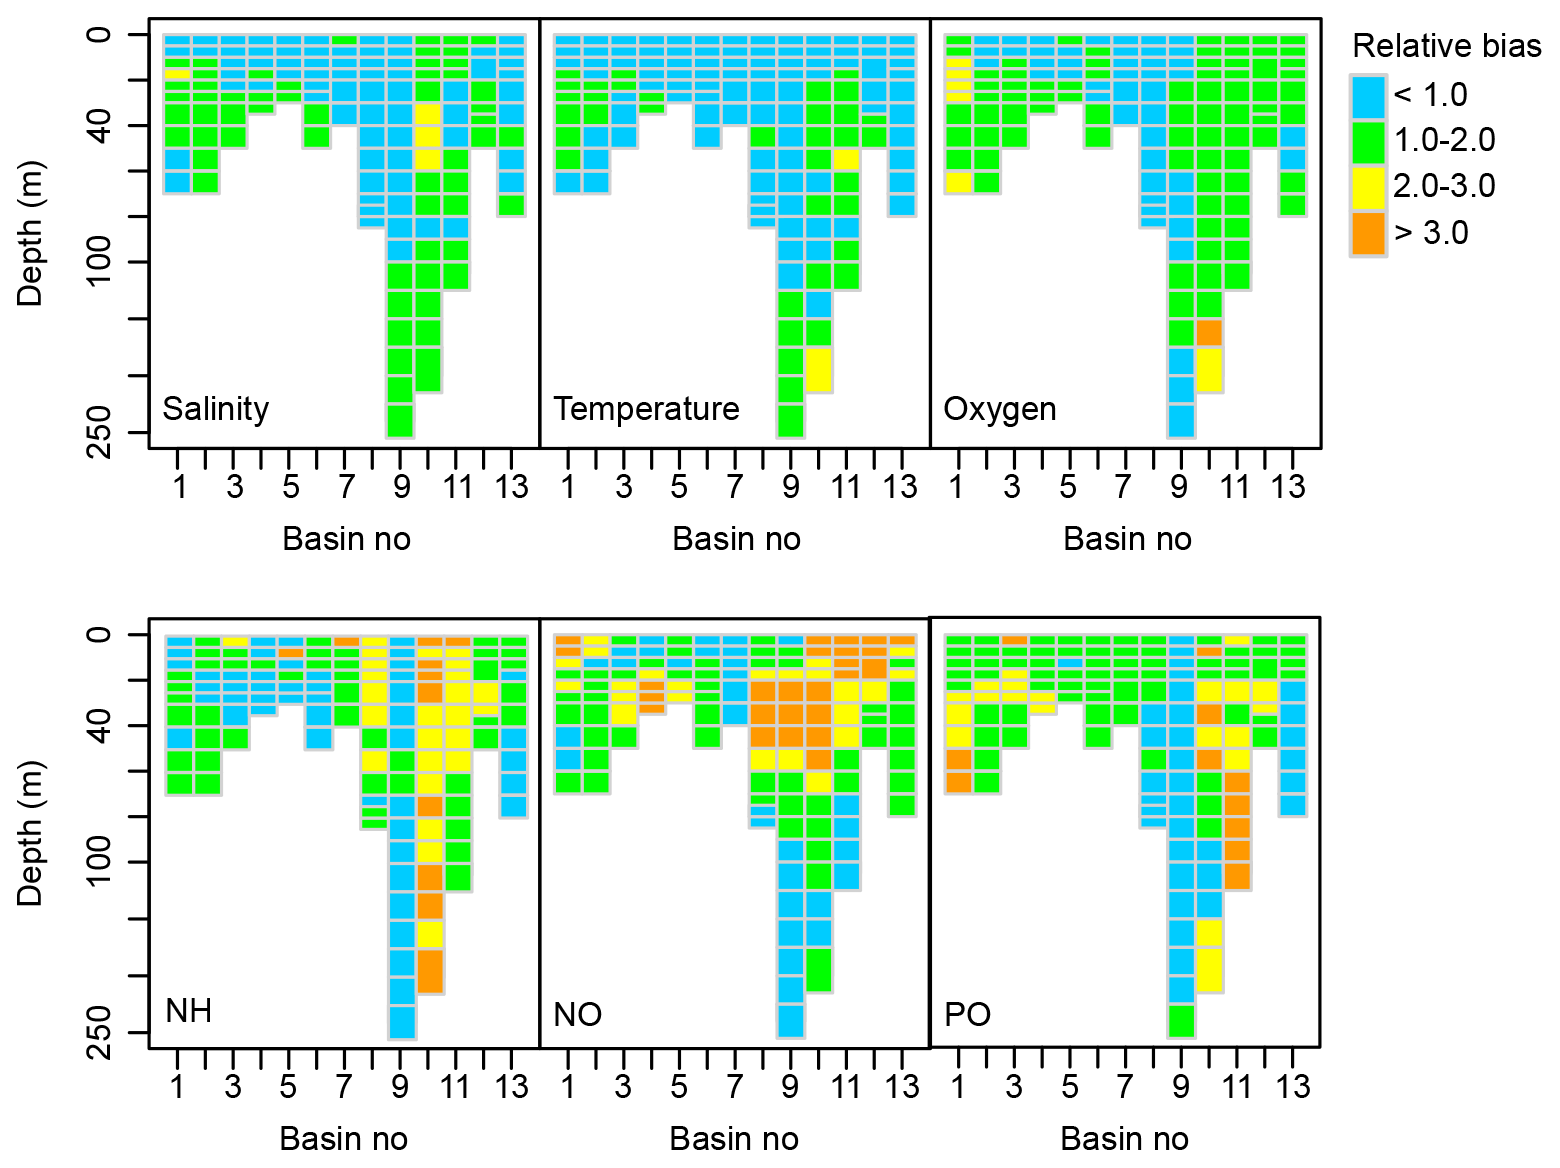
Figure B1Spatial distribution of the relative bias between simulated and observed dynamics of salinity, temperature and concentrations of oxygen, total ammonia (NH), nitrate + nitrite (NO) and total phosphate (PO) (1970–2015). See Fig. 1 for a map of basins.
B1 Methods
Observations of salinity, temperature and concentrations of oxygen, ammonium, nitrate and phosphate were collected from the Baltic Sea Environment Database (BED) and other major data sources around the Baltic Sea such as the IOW (Germany), NERI (Denmark), SYKE-FMI (Finland) and SHARK (SMHI, Sweden) databases. The full list of the data contributors can be found at http://nest.su.se/bed/ACKNOWLE.shtml, last access: 10 December 2021.
Basin-wide monthly time series were prepared from available long-term observations in the following way. All the measurements found in monthly intervals over 1970–2015 for all frequently sampled water layers within every BALTSEM basin, i.e. usually at 5 m intervals for the top 20 m of the water column and 10–25 m intervals for the deeper parts of basins, were pooled together and averaged. Coastal measurements, defined as being sampled within 12 nmi from the shore, were excluded for all basins except the three Danish straits basins, where the 12 nmi coastal strip covers almost the entire basins. Measurements from several deep and isolated trenches in the northern Baltic Proper were excluded as they often display their own dynamics, asynchronous to that in the domain of the larger basin.
To emphasize both long-term changes and seasonality of variables, time series of a model–data difference of pairwise monthly means were used. Because the seasonal cycle is also reflected in monthly standard deviations, especially in the upper part of the water column these differences were scaled with month-specific standard deviation SDm. SDm was calculated as the standard deviation of data collected in month m during the period 1970–2015 for each available sampling depth. To remove any remaining outliers, the estimated monthly standard deviations were replaced by a spline smooth-fitted by a GAM model. To avoid shifts due to some seasons being over-represented in the field data, in every basin the relative bias RBi at each sampling depth was calculated as an average of the 12 months in the annual cycle:
where m=1…12 denotes the month in the seasonal cycle, nim is the number of monthly data averages Dimj available at depth i in month m of year j, and Mimj is the model averages computed at sampling depth i in month m of the same year j. Thus, being based on monthly values computed from available data over the entire simulated time interval, the relative bias simultaneously characterizes several timescales: seasonal, inter-annual and decadal.
B2 Results and discussion
The BALTSEM-BMM performs very similarly to the standard BALTSEM. The average relative bias of the analysed variables over all basins is 1.40, which can be compared to a relative bias of 1.41 for the standard BALTSEM model.
The model captures variations in physical parameters (salinity and temperature) and oxygen concentrations with a relative bias of mostly less than 2 (Fig. B1). Simulated ammonium (NH) concentrations are lower than measured in the well-oxygenated Bothnian Sea (basin 10) and upper parts of Bothnian Bay (basin 11) as all ammonium is oxidized to nitrate (NO) in the model under these conditions. Together with an underestimation of NO utilization in intermediate depth layers by phytoplankton, this results in an overestimation of NO concentration in the upper part of several basins, including the Gulf of Riga (basin 12). Variations in PO concentrations are well captured in the Baltic Proper (basin 9) but overestimated in the Bothnian Sea (basin 10) and Bothnian Bay (basin 11). A detailed discussion of performance and sources of errors can be found in Savchuk et al. (2012) and a comparison of BALTSEM to other similar models in Eilola et al. (2011).
The simulated biomasses of benthic fauna were validated against observations using the method of Ehrnsten et al. (2020a) but with data extended to include the southern and southwestern parts of the Baltic Sea (basins 1–8 in Fig. 1), as well as the Gulf of Riga (basin 12). The comparison includes a visual comparison of biomasses over depth intervals in the different basins, as well as a cost function assessment (cf. Eilola et al., 2011).
Table C1Number of observations of benthic fauna wet weight used for model validation per basin and depth interval. Total N=7774. Note that replicate samples are counted as individual observations.
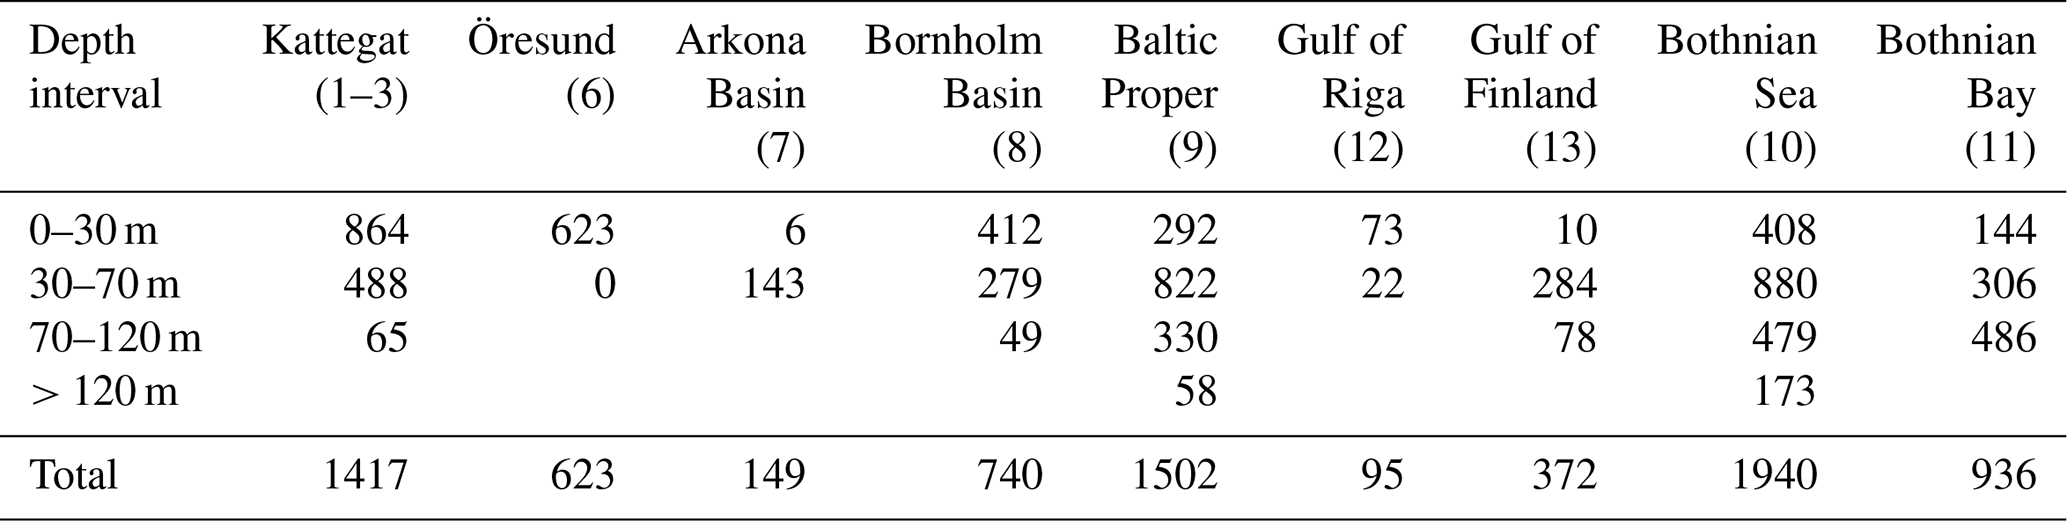

Figure C1Cost functions comparing simulated and observed biomasses of benthic fauna. ND: no data. NA: not applicable. In the deeper sections of Kattegat, observed biomasses of M. balthica are 0; i.e. CF cannot be computed.
C1 Methods
As described in detail in Ehrnsten et al. (2020a), data from samples of benthic macrofauna biomass taken between 1990 and 2012 from the national databases of Sweden (https://sharkweb.smhi.se, last access: 10 December 2021) and Finland (https://www.syke.fi/avointieto, last access: 10 December 2018), as well as unpublished data gathered by the research vessel Aranda, were used for validation. Only quantitative samples taken with a Van Veen or Smith McIntyre grab with an area of at least 0.1 m2, sieved on a 1 mm mesh and weighed wet according to national standards were used. Additionally, samples containing hard substrates, missing biomass or depth data, or flagged as suspicious in the database were removed from the dataset. As there were no data available for the Arkona Basin above 30 m in the time interval 1990–2012 or later, data collected by Aranda in 1965–1979 were used instead. For the Gulf of Riga, no data were available in open databases. Instead, data from Gogina et al. (2016) were used. These data were collected up to 2013 using different sampler (0.021–0.1 m2) and mesh sizes (0.25–1 mm) and reported as mean wet weight of all available observations within 5 km2 squares. Samples from areas defined as archipelago, embayment or river-dominated according to the EU Water Framework Directive were excluded from all datasets as the BALTSEM model does not represent these complex areas. The data were aggregated by basin and depth interval: 0–30, 30–70, 70–120 and >120 m. The final validation dataset consisted of 7774 observations (Table C1).
The results of the default simulation were compared to observations using a cost function (CF), , where M is model mean, D is mean of observations, and SD is the standard deviation of observations (Eilola et al., 2011). According to Eilola et al. (2011), model results can be interpreted as good if the model mean is within 1 standard deviation of the observed mean (0 ≤ CF < 1), reasonable if 1 ≤ CF < 2 and poor if CF ≥ 2. Modelled carbon biomasses were converted to wet weight using the factors derived by Timmerman et al. (2012) which are presented in Table A3.
C2 Results and discussion
The model is not applicable to the high-salinity areas at the entrance to the Baltic Sea (Kattegat, Öresund and Arkona Basin) as it does not include the high diversity of functional groups present in these areas (Figs. C1–C2). In the Baltic Sea sensu stricto (basins 7–13), the CF values are mostly good to reasonable (Fig. C1), but a visual comparison shows that the standard deviations of observations are very large in most cases, allowing for large deviations between modelled and observed means (Fig. C2). However, the visual comparison also shows that the main observed trends in decreasing total biomass with increasing latitude and depth are reasonably captured by the model, as well as the order of magnitude of the individual functional groups.
The closest match between simulated and observed means is seen in the Baltic Proper, which is the largest basin and which contains the major part of benthic fauna stocks in the Baltic Sea. In the deepest segment of the Bornholm Basin (70–100 m), observations are predominantly from hypoxic areas with biomasses of M. balthica close to 0, while simulations include some oxic areas giving an average biomass of 0.6 g wwt m−2, explaining the high CF values. In the Gulf of Finland, simulated biomasses of M. balthica are considerably higher than observations. This might be due to the omission of possible negative effects of low salinity on growth and/or reproduction, as discussed in Ehrnsten et al. (2020a). In the Bothnian Sea, conversely, observed biomasses are higher than simulated ones for all groups, hinting at an underestimation of primary production and/or sedimentation rates in this basin. In the oligotrophic Bothnian Bay, M. balthica is virtually extinct, and total fauna biomasses are an order of magnitude lower than in the other basins both in observations and in simulations.
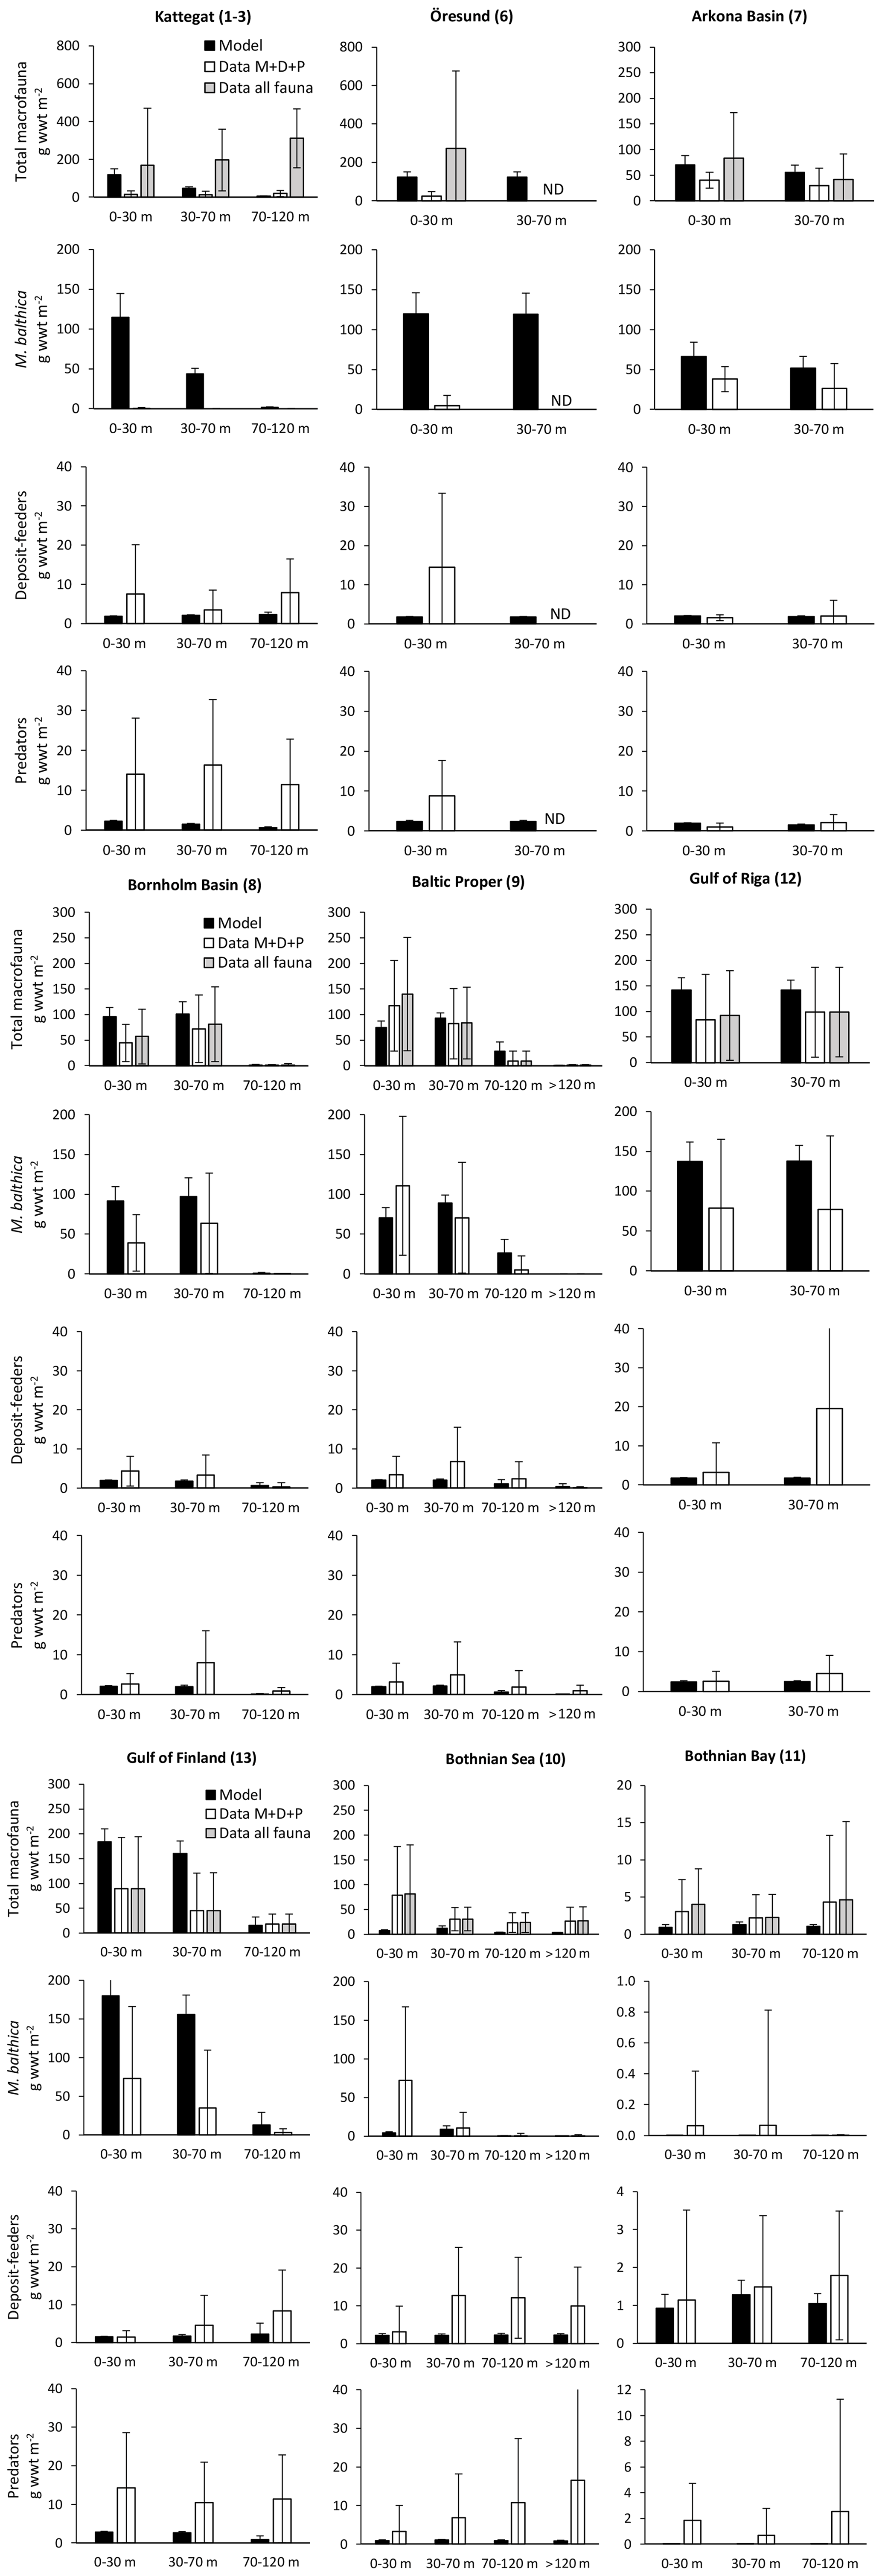
Figure C2Comparison of simulated biomasses of benthic fauna to observations at four depth intervals in BALTSEM basins from south to north. Observations are shown as both the sum of the three functional groups – M. balthica, surface deposit-feeders and predators (“Data ”) – and total observed fauna (“Data all fauna”), including other groups such as suspension-feeders, freshwater herbivores and large echinoderms. All data are given as means ± standard deviations for 1990–2012, except for Arkona Basin (0–30 m), for which data from 1965 to 1979 were used as no other data were available. Numbers after basin names refer to basin numbers in Fig. 1. ND: no data. Note different scales on y axes for Bothnian Bay.
The model code is available upon request from the corresponding author.
No original datasets were produced in this study. Observational data for validation of benthic and pelagic state variables were extracted from open-access databases as detailed in Sects. B1 and C1. Unpublished data on benthic biomass collected by Aranda were acquired from the Finnish Environment Institute and are available from the corresponding author upon reasonable request.
All authors contributed to the experimental design and interpretation of results. EE and BGG developed the model code. EE performed the experiments, analysed results and wrote the manuscript with significant contributions from BGG and OPS.
The contact author has declared that none of the authors has any competing interests.
Publisher’s note: Copernicus Publications remains neutral with regard to jurisdictional claims in published maps and institutional affiliations.
We thank Bärbel Müller-Karulis for the development of and help with the implementation of a script for relative bias calculations and Alexander Sokolov for access to environmental validation data through the BED database. Erik Smedberg is acknowledged for contributions to artwork (Fig. 1).
This research has been supported by the Swedish Agency for Marine and Water Management (grant no. 1:11 – Measures for marine and water environment).
The article processing charges for this open-access publication were covered by Stockholm University.
This paper was edited by Jack Middelburg and reviewed by Hans Cederwall and two anonymous referees.
Aller, R. C.: Carbonate dissolution in nearshore terrigenous muds: The role of physical and biological reworking, J. Geol., 90, 79–95, https://doi.org/10.1086/628652, 1982.
Aller, R. C.: Benthic fauna and biogeochemical processes in marine sediments: the role of burrow structures, in: Nitrogen Cycling in Coastal Marine Environments, edited by: Blackburn, T. H. and Sorensen, J., John Wiley & Sons., 301–338, ISBN 978-0471914044, 1988.
Andersen, J. H., Carstensen, J., Conley, D. J., Dromph, K., Fleming-Lehtinen, V., Gustafsson, B. G., Josefson, A. B., Norkko, A., Villnäs, A., and Murray, C.: Long-term temporal and spatial trends in eutrophication status of the Baltic Sea, Biol. Rev., 92, 135–149, https://doi.org/10.1111/brv.12221, 2017.
Ankar, S.: The soft bottom ecosystems of the northern Baltic Proper with special reference to the macrofauna, Contrib. from Askö Lab., 19, 1–62, 1977.
Asmala, E., Carstensen, J., Conley, D. J., Slomp, C. P., Stadmark, J., and Voss, M.: Efficiency of the coastal filter: Nitrogen and phosphorus removal in the Baltic Sea, Limnol. Oceanogr., 62, S222–S238, https://doi.org/10.1002/lno.10644, 2017.
Belkin, I. M.: Rapid warming of Large Marine Ecosystems, Prog. Oceanogr., 81, 207–213, https://doi.org/10.1016/j.pocean.2009.04.011, 2009.
Berezina, N. A., Maximov, A. A., and Vladimirova, O. M.: Influence of benthic invertebrates on phosphorus flux at the sediment-water interface in the easternmost Baltic Sea, Mar. Ecol. Prog. Ser., 608, 33–43, https://doi.org/10.3354/meps12824, 2019.
Blackford, J. C.: An analysis of benthic biological dynamics in a North Sea ecosystem model, J. Sea Res., 38, 213–230, https://doi.org/10.1016/S1385-1101(97)00044-0, 1997.
Bonsdorff, E.: Zoobenthic diversity-gradients in the Baltic Sea: Continuous post-glacial succession in a stressed ecosystem, J. Exp. Mar. Bio. Ecol., 330, 383–391, https://doi.org/10.1016/j.jembe.2005.12.041, 2006.
Boyd, P. W., Collins, S., Dupont, S., Fabricius, K., Gattuso, J. P., Havenhand, J., Hutchins, D. A., Riebesell, U., Rintoul, M. S., Vichi, M., Biswas, H., Ciotti, A., Gao, K., Gehlen, M., Hurd, C. L., Kurihara, H., McGraw, C. M., Navarro, J. M., Nilsson, G. E., Passow, U., and Pörtner, H. O.: Experimental strategies to assess the biological ramifications of multiple drivers of global ocean change – A review, Glob. Change Biol., 24, 2239–2261, https://doi.org/10.1111/gcb.14102, 2018.
Brey, T.: Population dynamics in benthic invertebrates, A virtual handbook, Version 01.2., http://www.thomas-brey.de/science/virtualhandbook (last access: 5 October 2021), 2001.
Carman, R. and Cederwall, H.: Sediments and Macrofauna in the Baltic Sea – Characteristics, Nutrient Contents and Distribution, in: A Systems Analysis of the Baltic Sea, Vol. 148, edited by: Wulff, F. V., Rahm, L., and Larsson, P., Springer-Verlag, Berlin Heidelberg, 289–327, https://doi.org/10.1007/978-3-662-04453-7_11, 2001.
Carman, R., Aigars, J., and Larsen, B.: Carbon and nutrient geochemistry of the surface sediments of the Gulf of Riga, Baltic Sea, Mar. Geol., 134, 57–76, https://doi.org/10.1016/0025-3227(96)00033-3, 1996.
Carstensen, J., Andersen, J. H., Gustafsson, B. G., and Conley, D. J.: Deoxygenation of the Baltic Sea during the last century, P. Natl. Acad. Sci. USA, 111, 5628–5633, https://doi.org/10.1073/pnas.1323156111, 2014a.
Carstensen, J., Conley, D. J., Bonsdorff, E., Gustafsson, B. G., Hietanen, S., Janas, U., Jilbert, T., Maximov, A., Norkko, A., Norkko, J., Reed, D. C., Slomp, C. P., Timmermann, K., and Voss, M.: Hypoxia in the Baltic Sea: Biogeochemical cycles, benthic fauna, and management, Ambio, 43, 26–36, https://doi.org/10.1007/s13280-013-0474-7, 2014b.
Cederwall, H. and Jermakovs, V.: Growth and production of three macrozoobenthic species in the Gulf of Riga, including comparisons with other areas, Hydrobiologia, 393, 201–210, https://doi.org/10.1023/A:1003548622112, 1999.
Cederwall, H., Jermakovs, V., and Lagzdins, G.: Long-term changes in the soft-bottom macrofauna of the Gulf of Riga, ICES J. Mar. Sci., 56, 41–48, 1999.
Cloern, J. E., Abreu, P. C., Carstensen, J., Chauvaud, L., Elmgren, R., Grall, J., Greening, H., Johansson, J. O. R., Kahru, M., Sherwood, E. T., Xu, J., and Yin, K.: Human activities and climate variability drive fast-paced change across the world's estuarine–coastal ecosystems, Glob. Change Biol., 22, 513–529, https://doi.org/10.1111/gcb.13059, 2016.
Costanza, R., D'Arge, R., de Groot, R., Farber, S., Grasso, M., Hannon, B., Limburg, K., Naeem, S., O'Neill, R. V, Paruelo, J., Raskin, R. G., Sutton, P., and van den Belt, M.: The value of the world's ecosystem services and natural capital, Nature, 387, 253–260, https://doi.org/10.1038/387253a0, 1997.
Costanza, R., de Groot, R., Sutton, P., van der Ploeg, S., Anderson, S. J., Kubiszewski, I., Farber, S., and Turner, R. K.: Changes in the global value of ecosystem services, Glob. Environ. Change, 26, 152–158, https://doi.org/10.1016/j.gloenvcha.2014.04.002, 2014.
Cozzoli, F., Shokri, M., da Conceição, T. G., Herman, P. M. J., Hu, Z., Soissons, L. M., Van Dalen, J., Ysebaert, T., and Bouma, T. J.: Modelling spatial and temporal patterns in bioturbator effects on sediment resuspension: A biophysical metabolic approach, Sci. Total Environ., 792, 148215, https://doi.org/10.1016/j.scitotenv.2021.148215, 2021.
Ebenhöh, W., Kohlmeier, C., and Radford, P. J.: The benthic biological submodel in the European Regional Seas Ecosystem Model, Neth. J. Sea Res., 33, 423–452, https://doi.org/10.1016/0077-7579(95)90056-X, 1995.
Eglite, E., Lavrinoviès, A., Müller-Karulis, B., Aigars, J., and Poikane, R.: Nutrient turnover at the hypoxic boundary: Flux measurements and model representation for the bottom water environment of the Gulf of Riga, Baltic Sea, Oceanologia, 56, 711–735, https://doi.org/10.5697/oc.56-4.711, 2014.
Ehrnsten, E., Norkko, A., Timmermann, K., and Gustafsson, B. G.: Benthic-pelagic coupling in coastal seas – Modelling macrofaunal biomass and carbon processing in response to organic matter supply, J. Mar. Syst., 196, 36–47, https://doi.org/10.1016/j.jmarsys.2019.04.003, 2019a.
Ehrnsten, E., Bauer, B., and Gustafsson, B. G.: Combined effects of environmental drivers on marine trophic groups – A systematic model comparison, Front. Mar. Sci., 6, 492, https://doi.org/10.3389/fmars.2019.00492, 2019b.
Ehrnsten, E., Norkko, A., Müller-Karulis, B., Gustafsson, E., and Gustafsson, B. G.: The meagre future of benthic fauna in a coastal sea – benthic responses to recovery from eutrophication in a changing climate, Glob. Change Biol., 26, 2235–2250, https://doi.org/10.1111/gcb.15014, 2020a.
Ehrnsten, E., Sun, X., Humborg, C., Norkko, A., Savchuk, O. P., Slomp, C. P., Timmermann, K., and Gustafsson, B. G.: Understanding Environmental Changes in Temperate Coastal Seas: Linking Models of Benthic Fauna to Carbon and Nutrient Fluxes, Front. Mar. Sci., 7, 450, https://doi.org/10.3389/fmars.2020.00450, 2020b.
Eilola, K., Gustafsson, B. G., Kuznetsov, I., Meier, H. E. M., Neumann, T., and Savchuk, O. P.: Evaluation of biogeochemical cycles in an ensemble of three state-of-the-art numerical models of the Baltic Sea, J. Mar. Syst., 88, 267–284, https://doi.org/10.1016/j.jmarsys.2011.05.004, 2011.
Ekeroth, N., Blomqvist, S., and Hall, P. O. J.: Nutrient fluxes from reduced Baltic Sea sediment: Effects of oxygenation and macrobenthos, Mar. Ecol. Prog. Ser., 544, 77–92, https://doi.org/10.3354/meps11592, 2016.
Elmgren, R.: Trophic dynamics in the enclosed, brackish Baltic Sea, Rapp. Proces-verbaux des Réunions. Cons. Int. pour l'Éxploration la Mer., 183, 152–169, 1984.
Gaumiga, R. and Lagzdins, G.: Macrozoobenthos, in: Ecosystem of the Gulf of Riga between 1920 and 1990, edited by: H. Ojaveer, Estonian Academy Publishers, 196–211, ISBN 10 9985500652, ISBN 13 978-9985500651, 1995.
Gilbert, F., Aller, R. C., and Hulth, S.: The influence of macrofaunal burrow spacing and diffusive scaling on sedimentary nitrification and denitrification: An experimental simulation and model approach, J. Mar. Res., 61, 101–125, https://doi.org/10.1357/002224003321586426, 2003.
Gogina, M., Nygård, H., Blomqvist, M., Daunys, D., Josefson, A. B., Kotta, J., Maximov, A., Warzocha, J., Yermakov, V., Gräwe, U., and Zettler, M. L.: The Baltic Sea scale inventory of benthic faunal communities, ICES J. Mar. Sci., 73, 1196–1213, https://doi.org/10.1093/icesjms/fsv265, 2016.
Gogina, M., Morys, C., Forster, S., Gräwe, U., Friedland, R., and Zettler, M. L.: Towards benthic ecosystem functioning maps: Quantifying bioturbation potential in the German part of the Baltic Sea, Ecol. Indic., 73, 574–588, https://doi.org/10.1016/j.ecolind.2016.10.025, 2017.
Griffiths, J. R., Kadin, M., Nascimento, F. J. A., Tamelander, T., Törnroos, A., Bonaglia, S., Bonsdorff, E., Brüchert, V., Gårdmark, A., Järnström, M., Kotta, J., Lindegren, M., Nordström, M. C., Norkko, A., Olsson, J., Weigel, B., Žydelis, R., Blenckner, T., Niiranen, S., and Winder, M.: The importance of benthic-pelagic coupling for marine ecosystem functioning in a changing world, Glob. Change Biol., 23, 2179–2196, https://doi.org/10.1111/gcb.13642, 2017.
Gustafsson, B. G., Schenk, F., Blenckner, T., Eilola, K., Meier, H. E. M., Müller-Karulis, B., Neumann, T., Ruoho-Airola, T., Savchuk, O. P., and Zorita, E.: Reconstructing the development of Baltic Sea eutrophication 1850–2006, Ambio, 41, 534–548, https://doi.org/10.1007/s13280-012-0318-x, 2012.
Gustafsson, E., Deutsch, B., Gustafsson, B. G., Humborg, C., and Mörth, C. M.: Carbon cycling in the Baltic Sea – The fate of allochthonous organic carbon and its impact on air-sea CO2 exchange, J. Mar. Syst., 129, 289–302, https://doi.org/10.1016/j.jmarsys.2013.07.005, 2014.
Gustafsson, E., Mörth, C. M., Humborg, C., and Gustafsson, B. G.: Modelling the 13C and 12C isotopes of inorganic and organic carbon in the Baltic Sea, J. Mar. Syst., 148, 122–130, https://doi.org/10.1016/j.jmarsys.2015.02.008, 2015.
Gustafsson, E., Savchuk, O. P., Gustafsson, B. G., and Müller-Karulis, B.: Key processes in the coupled carbon, nitrogen, and phosphorus cycling of the Baltic Sea, Biogeochemistry, 134, 301–317, https://doi.org/10.1007/s10533-017-0361-6, 2017.
Halpern, B. S., Walbridge, S., Selkoe, K. A., Kappel, C. V, Micheli, F., D'Agrosa, C., Bruno, J. F., Casey, K. S., Ebert, C., Fox, H. E., Fujita, R., Heinemann, D., Lenihan, H. S., Madin, E. M. P., Perry, M. T., Selig, E. R., Spalding, M., Steneck, R., and Watson, R.: A global map of human impact on marine ecosystems, Science, 319, 948–952, https://doi.org/10.1126/science.1149345, 2008.
Hedberg, P., Albert, S., Nascimento, F. J. A., and Winder, M.: Effects of changing phytoplankton species composition on carbon and nitrogen uptake in benthic invertebrates, Limnol. Oceanogr., 66, 469–480, https://doi.org/10.1002/lno.11617, 2020.
HELCOM: HELCOM thematic assessment of eutrophication 2011–2016, Baltic Sea Environment Proceedings No. 156, 83 pp., 2018.
Henriksen, K., Ramussen, M. B., and Jensen, A.: Effect of bioturbation on microbial nitrogen transformations in the sediment and fluxes of ammonium and nitrate to the overlaying water, Ecol. Bull., 35, 193–205, 1983.
Herman, P. M. J., Middelburg, J. J., van de Koppel, J., and Heip, C. H. R.: Ecology of Estuarine Macrobenthos, in: Advances in Ecological Research, Vol. 29, edited by: Nedwell, D. B. and Raffaelli, D. G., 195–240, Academic Press, https://doi.org/10.1016/S0065-2504(08)60194-4, 1999.
Isaev, A. V., Eremina, T. R., Ryabchenko, V. A., and Savchuk, O. P.: Model estimates of the impact of bioirrigation activity of Marenzelleria spp. on the Gulf of Finland ecosystem in a changing climate, J. Mar. Syst., 171, 81–88, https://doi.org/10.1016/j.jmarsys.2016.08.005, 2017.
Järvekülg, A. A.: Zoobenthos, in: The Baltica Project. The Problems of Research and Mathematical Modelling of the Baltic Sea Ecosystem, Issue 1: The Ecosystem and its Components, edited by: Davidan, I. N., Savchuk, O. P., and Sustavov, Y. V., Hydrometeoizdat, Leningrad, 184–191, 1983 (in Russian).
Jordan, T. E., Cornwell, J. C., Boynton, W. R., and Anderson, J. T.: Changes in phosphorus biogeochemistry along an estuarine salinity gradient: The iron conveyer belt, Limnol. Oceanogr., 53, 172–184, https://doi.org/10.4319/lo.2008.53.1.0172, 2008.
Josefson, A. B. and Rasmussen, B.: Nutrient retention by benthic macrofaunal biomass of Danish estuaries: importance of nutrient load and residence time, Estuar. Coast. Shelf Sci., 50, 205–216, https://doi.org/10.1006/ecss.1999.0562, 2000.
Josefson, A. B., Forbes, T. L., and Rosenberg, R.: Fate of phytodetritus in marine sediments: functional importance of macrofaunal community, Mar. Ecol. Prog. Ser., 230, 71–85, 2002.
Kahma, T. I., Karlson, A. M. L., Sun, X., Mörth, C. M., Humborg, C., Norkko, A., and Rodil, I. F.: Macroalgae fuels coastal soft-sediment macrofauna: A triple-isotope approach across spatial scales, Mar. Environ. Res., 162, 105163, https://doi.org/10.1016/j.marenvres.2020.105163, 2020.
Kahru, M. and Elmgren, R.: Multidecadal time series of satellite-detected accumulations of cyanobacteria in the Baltic Sea, Biogeosciences, 11, 3619–3633, https://doi.org/10.5194/bg-11-3619-2014, 2014.
Kahru, M., Elmgren, R., Kaiser, J., Wasmund, N., and Savchuk, O.: Cyanobacterial blooms in the Baltic Sea: Correlations with environmental factors, Harmful Algae, 92, 101739, https://doi.org/10.1016/j.hal.2019.101739, 2020.
Kortsch, S., Frelat, R., Pecuchet, L., Olivier, P., Putnis, I., Bonsdorff, E., Ojaveer, H., Jurgensone, I., Strâíe, S., Rubene, G., Krûze, Ç., and Nordström, M. C.: Disentangling temporal food web dynamics facilitates understanding of ecosystem functioning, J. Anim. Ecol., 90, 1205–1216, https://doi.org/10.1111/1365-2656.13447, 2021.
Kotta, J., Lauringson, V., Martin, G., Simm, M., Kotta, I., Herkül, K., and Ojaveer, H.: Gulf of Riga and Pärnu Bay, in: Ecology of Baltic Coastal Waters, edited by:Schiewer, U., Springer Berlin Heidelberg, Berlin, Heidelberg, 217–243, ISBN 978-3-540-73524-3, 2008.
Kristensen, E., Penha-Lopes, G., Delefosse, M., Valdemarsen, T., Quintana, C. O., and Banta, G. T.: What is bioturbation? The need for a precise definition for fauna in aquatic sciences, Mar. Ecol. Prog. Ser., 446, 285–302, https://doi.org/10.3354/meps09506, 2012.
Kumblad, L. and Bradshaw, C.: Element composition of biota, water and sediment in the Forsmark area, Baltic Sea, SKB Technical report TR-08-09, available at: https://skb.se/upload/publications/pdf/TR-08-09.pdf (last access: 16 November 2017), 2008.
Kuparinen, J., Leppänen, J.-M., Sarvala, J., Sundberg, A., and Virtanen, A.: Production and utilization of organic matter outside Tvärminne, southwest coast of Finland, Rapp. Proces-verbaux des Réunions. Cons. Int. pour l'Éxploration la Mer., 183, 180–192, 1984.
Lehtonen, K. K.: Geographical variability in the bioenergetic characteristics of Monoporeia/Pontoporeia spp. populations from the northern Baltic Sea, and their potential contribution to benthic nitrogen mineralization, Mar. Biol., 123, 555–564, https://doi.org/10.1007/BF00349234, 1995.
Lehtonen, K. K.: Ecophysiology of the benthic amphipod Monoporeia affinis in an open-sea area of the northern Baltic Sea: Seasonal variations in body composition, with bioenergetic considerations, Mar. Ecol. Prog. Ser., 143, 87–98, https://doi.org/10.3354/meps143087, 1996.
Lessin, G., Artioli, Y., Almroth-Rosell, E., Blackford, J. C., Dale, A. W., Glud, R. N., Middelburg, J. J., Pastres, R., Queirós, A. M., Rabouille, C., Regnier, P., Soetaert, K., Solidoro, C., Stephens, N., and Yakushev, E.: Modelling marine sediment biogeochemistry: Current knowledge gaps, challenges, and some methodological advice for advancement, Front. Mar. Sci., 5, 1–8, https://doi.org/10.3389/fmars.2018.00019, 2018.
Levins, R.: The strategy of model building in population biology, Am. Sci., 54, 421–431, 1966.
Lohrer, A. M., Thrush, S. F., and Gibbs, M. M.: Bioturbators enhance ecosystem function through complex biogeochemical interactions, Nature, 431, 1092–1095, https://doi.org/10.1038/nature03042, 2004.
Mäkelin, S. and Villnäs, A.: Food sources drive temporal variation in elemental stoichiometry of benthic consumers, Limnol. Oceanogr., 67, 784–799, https://doi.org/10.1002/lno.12034, 2022.
McCrackin, M. L., Muller-Karulis, B., Gustafsson, B. G., Howarth, R. W., Humborg, C., Svanbäck, A., and Swaney, D. P.: A Century of Legacy Phosphorus Dynamics in a Large Drainage Basin, Global Biogeochem. Cy., 32, 1107–1122, https://doi.org/10.1029/2018GB005914, 2018.
Meier, H. E. M., Müller-Karulis, B., Andersson, H. C., Dieterich, C., Eilola, K., Gustafsson, B. G., Höglund, A., Hordoir, R., Kuznetsov, I., Neumann, T., Ranjbar, Z., Savchuk, O. P., and Schimanke, S.: Impact of climate change on ecological quality indicators and biogeochemical fluxes in the Baltic Sea: A multi-model ensemble study, Ambio, 41, 558–573, https://doi.org/10.1007/s13280-012-0320-3, 2012.
Meier, H. E. M., Edman, M. K., Eilola, K. J., Placke, M., Neumann, T., Andersson, H. C., Brunnabend, S.-E., Dieterich, C., Frauen, C., Friedland, R., Gröger, M., Gustafsson, B. G., Gustafsson, E., Isaev, A., Kniebusch, M., Kuznetsov, I., Müller-Karulis, B., Omstedt, A., Ryabchenko, V., Saraiva, S., and Savchuk, O. P.: Assessment of Eutrophication Abatement Scenarios for the Baltic Sea by Multi-Model Ensemble Simulations, Front. Mar. Sci., 5, 440, https://doi.org/10.3389/fmars.2018.00440, 2018.
Michaud, E., Desrosiers, G., Mermillod-Blondin, F., Sundby, B., and Stora, G.: The functional group approach to bioturbation: The effects of biodiffusers and gallery-diffusers of the Macoma balthica community on sediment oxygen uptake, J. Exp. Mar. Bio. Ecol., 326, 77–88, https://doi.org/10.1016/j.jembe.2005.05.016, 2005.
Middelburg, J. J.: Reviews and syntheses: to the bottom of carbon processing at the seafloor, Biogeosciences, 15, 413–427, https://doi.org/10.5194/bg-15-413-2018, 2018.
Murphy, J. M., Sexton, D. M. H., Barnett, D. N., Jones, G. S., Webb, M. J., Collins, M., and Stainforth, D. A.: Quantification of modelling uncertainties in a large ensemble of climate change simulations, Nature, 430, 768–772, https://doi.org/10.1038/nature02771, 2004.
Nixon, S. W.: Remineralization and Nutrient Cycling in Coastal Marine Ecosystems, in: Estuaries and Nutrients, edited by: Neilson, B. J. and Cronin, L. E., Humana Press, Totowa, NJ, 111–138, ISBN 978-1-4612-5826-1, 1981.
Norkko, A., Villnäs, A., Norkko, J., Valanko, S., and Pilditch, C.: Size matters: implications of the loss of large individuals for ecosystem function, Sci. Rep., 3, 2646, https://doi.org/10.1038/srep02646, 2013.
Norkko, J., Reed, D. C., Timmermann, K., Norkko, A., Gustafsson, B. G., Bonsdorff, E., Slomp, C. P., Carstensen, J., and Conley, D. J.: A welcome can of worms? Hypoxia mitigation by an invasive species, Glob. Change Biol., 18, 422–434, https://doi.org/10.1111/j.1365-2486.2011.02513.x, 2012.
Norkko, J., Gammal, J., Hewitt, J. E., Josefson, A. B., Carstensen, J., and Norkko, A.: Seafloor Ecosystem Function Relationships: In Situ Patterns of Change Across Gradients of Increasing Hypoxic Stress, Ecosystems, 18, 1424–1439, https://doi.org/10.1007/s10021-015-9909-2, 2015.
Nyström Sandman, A., Näslund, J., Gren, I.-M., and Norling, K.: Effects of an invasive polychaete on benthic phosphorus cycling at sea basin scale: An ecosystem disservice, Ambio, 47, 884–892, https://doi.org/10.1007/s13280-018-1050-y, 2018.
Ramesh, R., Chen, Z., Cummins, V., Day, J., D'Elia, C., Dennison, B., Forbes, D. L., Glaeser, B., Glaser, M., Glavovic, B., Kremer, H., Lange, M., Larsen, J. N., Le Tissier, M., Newton, A., Pelling, M., Purvaja, R., and Wolanski, E.: Land-ocean interactions in the coastal zone: Past, present and future, Anthropocene, 12, 85–98, https://doi.org/10.1016/j.ancene.2016.01.005, 2015.
Regnier, P., Friedlingstein, P., Ciais, P., Mackenzie, F. T., Gruber, N., Janssens, I. A., Laruelle, G. G., Lauerwald, R., Luyssaert, S., Andersson, A. J., Arndt, S., Arnosti, C., Borges, A. V, Dale, A. W., Gallego-Sala, A., Goddéris, Y., Goossens, N., Hartmann, J., Heinze, C., Ilyina, T., Joos, F., LaRowe, D. E., Leifeld, J., Meysman, F. J. R., Munhoven, G., Raymond, P. A., Spahni, R., Suntharalingam, P., and Thullner, M.: Anthropogenic perturbation of the carbon fluxes from land to ocean, Nat. Geosci., 6, 597–607, https://doi.org/10.1038/ngeo1830, 2013a.
Regnier, P., Arndt, S., Goossens, N., Volta, C., Laruelle, G. G., Lauerwald, R., and Hartmann, J.: Modelling estuarine biogeochemical dynamics: From the local to the global scale, Aquat. Geochem., 19, 591–626, https://doi.org/10.1007/s10498-013-9218-3, 2013b.
Remane, A.: Die Brackwasserfauna, Verh. Dtsch. Zool. Ges., 36, 34–74, 1934.
Renz, J. R. and Forster, S.: Effects of bioirrigation by the three sibling species of Marenzelleria spp. on solute fluxes and porewater nutrient profiles, Mar. Ecol. Prog. Ser., 505, 145–159, https://doi.org/10.3354/meps10756, 2014.
Rhoads, D. C.: Organism-sediment relations on the muddy sea floor, Oceanogr. Mar. Biol. An Annu. Rev., 12, 263–300, 1974.
Rodil, I. F., Attard, K. M., Norkko, J., Glud, R. N., and Norkko, A.: Estimating respiration rates and secondary production of macrobenthic communities across coastal habitats with contrasting structural biodiversity, Ecosystems, 23, 630–647, https://doi.org/10.1007/s10021-019-00427-0, 2019.
Savchuk, O. and Wulff, F.: A Model of the Biogeochemical Cycles of Nitrogen and Phosphorus in the Baltic, in: A Systems Analysis of the Baltic Sea, Ecological Studies, vol 148, edited by: Wulff, F. W., Rahm, L. A., and Larsson, P., 373–415, Springer Berlin Heidelberg, https://doi.org/10.1007/978-3-662-04453-7_14, 2001.
Savchuk, O. P.: Nutrient biogeochemical cycles in the Gulf of Riga: scaling up field studies with a mathematical model, J. Mar. Syst., 32, 253–280, https://doi.org/10.1016/S0924-7963(02)00039-8, 2002.
Savchuk, O. P.: Large-scale nutrient dynamics in the Baltic Sea, 1970–2016, Front. Mar. Sci., 5, 95, https://doi.org/10.3389/fmars.2018.00095, 2018.
Savchuk, O. P. and Wulff, F.: Long-term modeling of large-scale nutrient cycles in the entire Baltic Sea, Hydrobiologia, 629, 209–224, https://doi.org/10.1007/s10750-009-9775-z, 2009.
Savchuk, O. P., Gustafsson, B. G., and Müller-Karulis, B.: BALTSEM – a marine model for desicion support within the Baltic Sea Region, BNI Technical report No. 7, Baltic Nest Institute (BNI), ISBN 978-91-86655-06-8, 2012.
Seidl, R.: To model or not to model, that is no longer the question for ecologists, Ecosystems, 20, 222–228, https://doi.org/10.1007/s10021-016-0068-x, 2017.
Seitzinger, S. P.: Denitrification in freshwater and coastal marine ecosystems: Ecological and geochemical significance, Limnol. Oceanogr., 33, 702–724, https://doi.org/10.4319/lo.1988.33.4part2.0702, 1988.
Snelgrove, P. V. R., Thrush, S. F., Wall, D. H., and Norkko, A.: Real world biodiversity-ecosystem functioning: A seafloor perspective, Trends Ecol. Evol., 29, 398–405, https://doi.org/10.1016/j.tree.2014.05.002, 2014.
Snelgrove, P. V. R., Soetaert, K., Solan, M., Thrush, S., Wei, C.-L., Danovaro, R., Fulweiler, R. W., Kitazato, H., Ingole, B., Norkko, A., Parkes, R. J., and Volkenborn, N.: Global carbon cycling on a heterogeneous seafloor, Trends Ecol. Evol., 33, 96–105, https://doi.org/10.1016/j.tree.2017.11.004, 2018.
Snoeijs-Leijonmalm, P., Schubert, H., and Radziejewska, T. (Eds.): Biological Oceanography of the Baltic Sea, Springer Netherlands, Dordrecht, https://doi.org/10.1007/978-94-007-0668-2_4, 2017.
Soerensen, A. L., Schartup, A. T., Gustafsson, E., Gustafsson, B. G., Undeman, E., and Björn, E.: Eutrophication Increases Phytoplankton Methylmercury Concentrations in a Coastal Sea – A Baltic Sea Case Study, Environ. Sci. Technol., 50, 11787–11796, https://doi.org/10.1021/acs.est.6b02717, 2016.
Soetaert, K. and Middelburg, J. J.: Modeling eutrophication and oligotrophication of shallow-water marine systems: The importance of sediments under stratified and well-mixed conditions, Hydrobiologia, 629, 239–254, https://doi.org/10.1007/s10750-009-9777-x, 2009.
Spillman, C. M., Hamilton, D. P., Hipsey, M. R., and Imberger, J.: A spatially resolved model of seasonal variations in phytoplankton and clam (Tapes philippinarum) biomass in Barbamarco Lagoon, Italy, Estuar. Coast. Shelf Sci., 79, 187–203, https://doi.org/10.1016/j.ecss.2008.03.020, 2008.
Sterner, R. W. and Elser, J. J.: Ecological Stoichiometry, Princeton University Press, ISBN 978-0691074917, 2002.
Stief, P.: Stimulation of microbial nitrogen cycling in aquatic ecosystems by benthic macrofauna: Mechanisms and environmental implications, Biogeosciences, 10, 7829–7846, https://doi.org/10.5194/bg-10-7829-2013, 2013.
Stigebrandt, A. and Gustafsson, B. G.: Response of the Baltic Sea to climate change – Theory and observations, J. Sea Res., 49, 243–256, https://doi.org/10.1016/S1385-1101(03)00021-2, 2003.
Stoicescu, S.-T., Laanemets, J., Liblik, T., Skudra, M., Samlas, O., Lips, I., and Lips, U.: Causes of the extensive hypoxia in the Gulf of Riga in 2018, Biogeosciences, 19, 2903–2920, https://doi.org/10.5194/bg-19-2903-2022, 2022.
Tamelander, T., Spilling, K., and Winder, M.: Organic matter export to the seafloor in the Baltic Sea: Drivers of change and future projections, Ambio, 46, 842–851, https://doi.org/10.1007/s13280-017-0930-x, 2017.
Teal, L. R., Bulling, M. T., Parker, E. R., and Solan, M.: Global patterns of bioturbation intensity and mixed depth of marine soft sediments, Aquat. Biol., 2, 207–218, https://doi.org/10.3354/ab00052, 2008.
Timmermann, K., Norkko, J., Janas, U., Norkko, A., Gustafsson, B. G., and Bonsdorff, E.: Modelling macrofaunal biomass in relation to hypoxia and nutrient loading, J. Mar. Syst., 105–108, 60–69, https://doi.org/10.1016/j.jmarsys.2012.06.001, 2012.
Undeman, E., Gustafsson, B. G., Humborg, C., and McLachlan, M. S.: Application of a novel modeling tool with multistressor functionality to support management of organic contaminants in the Baltic Sea, Ambio, 44, 498–506, https://doi.org/10.1007/s13280-015-0668-2, 2015.
Vahtera, E., Conley, D. J., Gustafsson, B. G., Kuosa, H., Pitkänen, H., Savchuk, O. P., Tamminen, T., Viitasalo, M., Voss, M., Wasmund, N., and Wulff, F.: Internal ecosystem feedbacks enhance nitrogen-fixing cyanobacteria blooms and complicate management in the Baltic Sea, Ambio, 36, 186–194, https://doi.org/10.1579/0044-7447(2007)36[186:IEFENC]2.0.CO;2, 2007.
Van Helmond, N. A. G. M., Robertson, E. K., Conley, D. J., Hermans, M., Humborg, C., Joëlle Kubeneck, L., Lenstra, W. K., and Slomp, C. P.: Removal of phosphorus and nitrogen in sediments of the eutrophic Stockholm archipelago, Baltic Sea, Biogeosciences, 17, 2745–2766, https://doi.org/10.5194/bg-17-2745-2020, 2020.
Volkenborn, N., Meile, C., Polerecky, L., Pilditch, C. A., Norkko, A., Norkko, J., Hewitt, J. E., Thrush, S. F., Wethey, D. S., and Woodin, S. A.: Intermittent bioirrigation and oxygen dynamics in permeable sediments: An experimental and modeling study of three tellinid bivalves, J. Mar. Res., 70, 794–823, https://doi.org/10.1357/002224012806770955, 2012.
Witek, S.: Biological Production and its Utilisation within a Marine Ecosystem in the Western Gdansk Basin, Sea Fisheries Institute, Gdynia, Poland, 1995 (in Polish).
Zdun, A., Stoñ-Egiert, J., Ficek, D., and Ostrowska, M.: Seasonal and Spatial Changes of Primary Production in the Baltic Sea (Europe) Based on in situ Measurements in the Period of 1993–2018, Front. Mar. Sci., 7, 604532, https://doi.org/10.3389/fmars.2020.604532, 2021.
- Abstract
- Introduction
- Materials and methods
- Results
- Discussion
- Conclusions and outlook
- Appendix A: Mathematical description of benthic model dynamics in BALTSEM-BMM
- Appendix B: Validation of pelagic variables
- Appendix C: Validation of benthic fauna biomasses
- Code availability
- Data availability
- Author contributions
- Competing interests
- Disclaimer
- Acknowledgements
- Financial support
- Review statement
- References