the Creative Commons Attribution 4.0 License.
the Creative Commons Attribution 4.0 License.
 | 20 Jul 2022
Exploring the role of bedrock representation on plant transpiration response during dry periods at four forested sites in Europe
César Dionisio Jiménez-Rodríguez
Mauro Sulis
Stanislaus Schymanski
Forest transpiration is controlled by the atmospheric water demand, potentially constrained by soil moisture availability, and regulated by plant physiological properties. During summer periods, soil moisture availability at sites with thin soils can be limited, forcing the plants to access moisture stored in the weathered bedrock. Land surface models (LSMs) have considerably evolved in the description of the physical processes related to vegetation water use, but the effects of bedrock position and water uptake from fractured bedrock have not received much attention. In this study, the Community Land Model version 5.0 (CLM 5) is implemented at four forested sites with relatively shallow bedrock and located across an environmental gradient in Europe. Three different bedrock configurations (i.e., default, deeper, and fractured) are applied to evaluate if the omission of water uptake from weathered bedrock could explain some model deficiencies with respect to the simulation of seasonal transpiration patterns. Sap flow measurements are used to benchmark the response of these three bedrock configurations. It was found that the simulated transpiration response of the default model configuration is strongly limited by soil moisture availability at sites with extended dry seasons. Under these climate conditions, the implementation of an alternative (i.e., deeper and fractured) bedrock configuration resulted in a better agreement between modeled and measured transpiration. At the site with a continental climate, the default model configuration accurately reproduced the magnitude and temporal patterns of the measured transpiration. The implementation of the alternative bedrock configurations at this site provided more realistic water potentials in plant tissues but negatively affected the modeled transpiration during the summer period. Finally, all three bedrock configurations did not show differences in terms of water potentials, fluxes, and performances on the more northern and colder site exhibiting a transition between oceanic and continental climate. Model performances at this site are low, with a clear overestimation of transpiration compared to sap flow data. The results of this study call for increased efforts into better representing lithological controls on plant water uptake in LSMs.
- Article
(9164 KB) - Full-text XML
- BibTeX
- EndNote


Bedrock structure and composition influence the ecosystem productivity (Hahm et al., 2014; Jiang et al., 2020) through its effect on plant nutrient and water uptake (Ding et al., 2021). Physical and chemical weathering processes allow the formation of cracks in the bedrock (Pope, 2015), increasing the presence of water reservoirs that are commonly neglected in ecological analyses at sites characterized by thin soils and seasonal droughts (Sternberg et al., 1996). These reservoirs are highly dynamic, storing water from winter precipitation (Vrettas and Fung, 2017) and sometimes holding even more moisture than the overlying soil (Jones and Graham, 1993; Rempe and Dietrich, 2018). The thickness of the weathered bedrock varies according to rock type and climatic conditions; some European sites with gneiss, granite, and flysch rock types have mean thicknesses of 7.0, 4.6, and 3.4 m, respectively (S̆amonil et al., 2020). Plants growing in seasonally dry environments rely on deep water reservoirs often available within the weathered bedrock (Barbeta et al., 2015; Ding et al., 2021; Sternberg et al., 1996). As an example, vegetation growing in karst systems is able to access water stored in the fractured bedrock thanks to the presence of sediments and organic matter within the cracks of the first 2 m of soil that increase the water-holding capacity of the karst formation (Phillips et al., 2019; Querejeta et al., 2007; Swaffer et al., 2014). This suggests that rock moisture is likely an important water reservoir supporting dry-season water use at sites with shallow soils. Therefore, inclusion of this additional water reservoir in models may be important for correctly simulating vegetation water use, especially under climate change, where seasonal changes in intensity and frequency of precipitation and drought (Hosseinzadehtalaei et al., 2020; Grillakis, 2019) are expected to result in extended drought severity and duration. However, due to the limited field data, detailed knowledge about the structure of weathered bedrock and its effect on the overlying vegetation remains poorly understood.
Plant transpiration is driven by atmospheric water demand and controlled by stomata, where water diffuses away from leaves along the same pathway as CO2 enters the leaves before it is fixed through the photosynthesis. Water transpired by leaves needs to be replenished by root water uptake and suction-driven transport from roots to leaves. The plant hydraulic system enabling this transport is vulnerable to embolism under strong suction (e.g., low soil water potential); therefore, plants reduce stomatal conductance and transpiration under such conditions (Kirkham, 2014; Sperry et al., 1998, 2002). Trees developed a number of strategies that enhance and guarantee the access to different water sources depending on the environmental conditions. Their root system can extend horizontally over large areas (e.g, Abies sp., Metrosideros sp.) or vertically into the ground (e.g, Quercus sp., Pinus sp.), reaching depths of more than 20 m (Pallardy, 2008). During prolonged dry periods, some tree species use these extended root systems to access deep groundwater reservoirs (Barbeta et al., 2015; Zhang et al., 2018), redistribute water in superficial soil layers through hydraulic lift (Alagele et al., 2021; Bayala and Prieto, 2020), and/or source water from the weathered and fractured bedrock (Ding et al., 2021; Querejeta et al., 2007; Sternberg et al., 1996; Swaffer et al., 2014). This latter water pool (i.e., moisture extracted by roots from the weathered bedrock) is poorly quantified at the global scale and especially for forested ecosystems that are widespread on hillslopes with thin soils (Jiang et al., 2020; Schwinning, 2010).
Land surface models (LSMs) have evolved considerably over the last decades and have been established as useful tools to understand ecosystem responses to water stress conditions and heat waves (Fisher and Koven, 2020). However, these developments have increased the number of parameters exerting control over multiple fluxes, highlighting the need of providing a better way to constrain LSMs simulations (Mu et al., 2021). These constraints are of high importance because they allow assessing the effect of the parameter selection on the model sensitivity and uncertainty (Lawrence et al., 2020). The representation of subsurface processes plays a critical role in the chemical, thermal, and hydrological fluxes simulated by LSMs (Choi et al., 2013; Davison et al., 2015). This representation, which varies quite strongly between LSMs, has been advanced over the recent years (e.g., Felfelani et al., 2021), requiring additional constraints to accurately estimate water and energy fluxes. For instance, the Joint UK Land Environment Simulator (JULES) LSM has a 10 m soil column with 28 soil layers (with 14 layers distributed over the first 3 m of soil). This soil column can be shallower depending on the site conditions, where the bedrock is considered only for temperature exchange and not for groundwater storage (Chadburn et al., 2015). NOAH LSM includes an unconfined aquifer beneath a soil column of 2 m depth, allowing the soil column to drain freely (Niu et al., 2011). The Organising Carbon and Hydrology In Dynamic Ecosystems (ORCHIDEE) LSM has a total soil depth of 2 m, allowing multiple soil layer discretizations (Campoy et al., 2013), with the bedrock defining a discontinuity in the soil zone processes (Sun et al., 2021). Finally, the Community Land Model version 5.0 (CLM 5) implements a spatially distributed soil thickness (Swenson and Lawrence, 2015) within a range of 0.4 to 8.5 m depth, derived from a spatially explicit soil thickness data product (Pelletier et al., 2016). Water stored in the unsaturated zone is under negative pressure and considered as the only source of plant water by the model. Depending on the soil water balance, a saturated zone builds up on top of the bedrock, but this is a temporal water storage from where any water excess moves out as drainage. Overall, LSMs are based on the common assumption that soil water is the main water source for the vegetation, and the deep drainage is used only for river and/or wetland flow routing and hence neglected as a potential source of water. This conceptualization results in a critically low storage capacity for plant available water at sites characterized by thin soil and prolonged dry periods. Furthermore, due to the lack of detailed field observations for accurately determining the depth to bedrock (DTB), this parameterization leads to a large uncertainty in applying LSMs at such sites (Shangguan et al., 2017).
Recent field evidence documents vegetation dependency on rock moisture during dry periods or extended droughts (Carrière et al., 2020; Klos et al., 2018; Hahm et al., 2020; Jiang et al., 2020; Nardini et al., 2021; Qi et al., 2018; Rempe and Dietrich, 2018) and the dependence of maximum rooting depths on the in situ hydrological regulation (Fan et al., 2017). However, consideration of rock moisture in current models is scarce, and the few examples are linked to model rock weathering processes (Cipolla et al., 2021), leaving aside its role for root water uptake and plant transpiration (Fan et al., 2019). From a pragmatic modeling perspective, the inclusion of this additional source of water could be achieved either by implementing a bottomless soil column allowing the exponential root profile to access deep soil water (de Rosnay and Polcher, 1998) or deepening the DTB and/or altering the soil composition for the bedrock layers. This latter approach emphasizes the key role played by soil texture and rock fragments in regulating the response of root growth (Hu et al., 2021; Li et al., 2019) and plant hydraulics to soil drying (Cai et al., 2021; Carminati and Javaux, 2020) as well as the effect of uncertainty in determining the DTB (Brunke et al., 2016). Recent studies stressed the importance of the accumulated sediments in weathered bedrock fractures that enhances the water-holding capacity beneath the soil (Jiang et al., 2020). These sediments allow the woody ecosystems to use additional moisture across different rock types (McCormick et al., 2021). The widespread use of rock moisture by vegetation is supported by the vast number of studies carried out during the last two decades stressing the importance of adding the weathered bedrock as an additional water reservoir that serves as a buffer water supply during dry conditions (Aranda et al., 2007; Baldocchi et al., 2010; David et al., 2013; Forner et al., 2018; Gil-Pelegrín et al., 2017; Hubbert et al., 2001; Penuelas and Filella, 2003; Nadezhdina et al., 2008; Zapater et al., 2012). This reservoir could be critical for properly representing transpiration fluxes during dry periods (e.g., summer, drought, heat waves) of vegetation growing in water-limited environments. Consequently, it is necessary to provide a preliminary evaluation of the impact that additional water storage may have on the simulated transpiration fluxes.
The objective of this work is to evaluate the impact of different bedrock conceptualizations on the simulation of plant transpiration response using CLM 5. The underlying hypothesis of the work is that the omission of plant available water stored in the weathered bedrock could explain some of the model deficiencies in reproducing seasonal transpiration patterns. It is expected that during summer, the vegetation has a fully developed canopy exhibiting a peak in leaf area index, extracting soil water at maximum rate and relying on deeper soil water pools during extended dry periods. To test this hypothesis, CLM 5 is implemented at four forested sites located across an environmental gradient in Europe using three different bedrock configurations: (i) the model default, (ii) a deeper location of the impermeable layer, and (iii) a weathered bedrock overlying the impermeable bedrock. The simulated plant transpiration of the three model configurations is compared to the upscaled transpiration signal measured by sap flow sensors at the selected study sites. Finally, the plant physiological implications of using different bedrock configurations are assessed by examining the plant vulnerability curves of the xylem and leaf segments of the simulated plants.
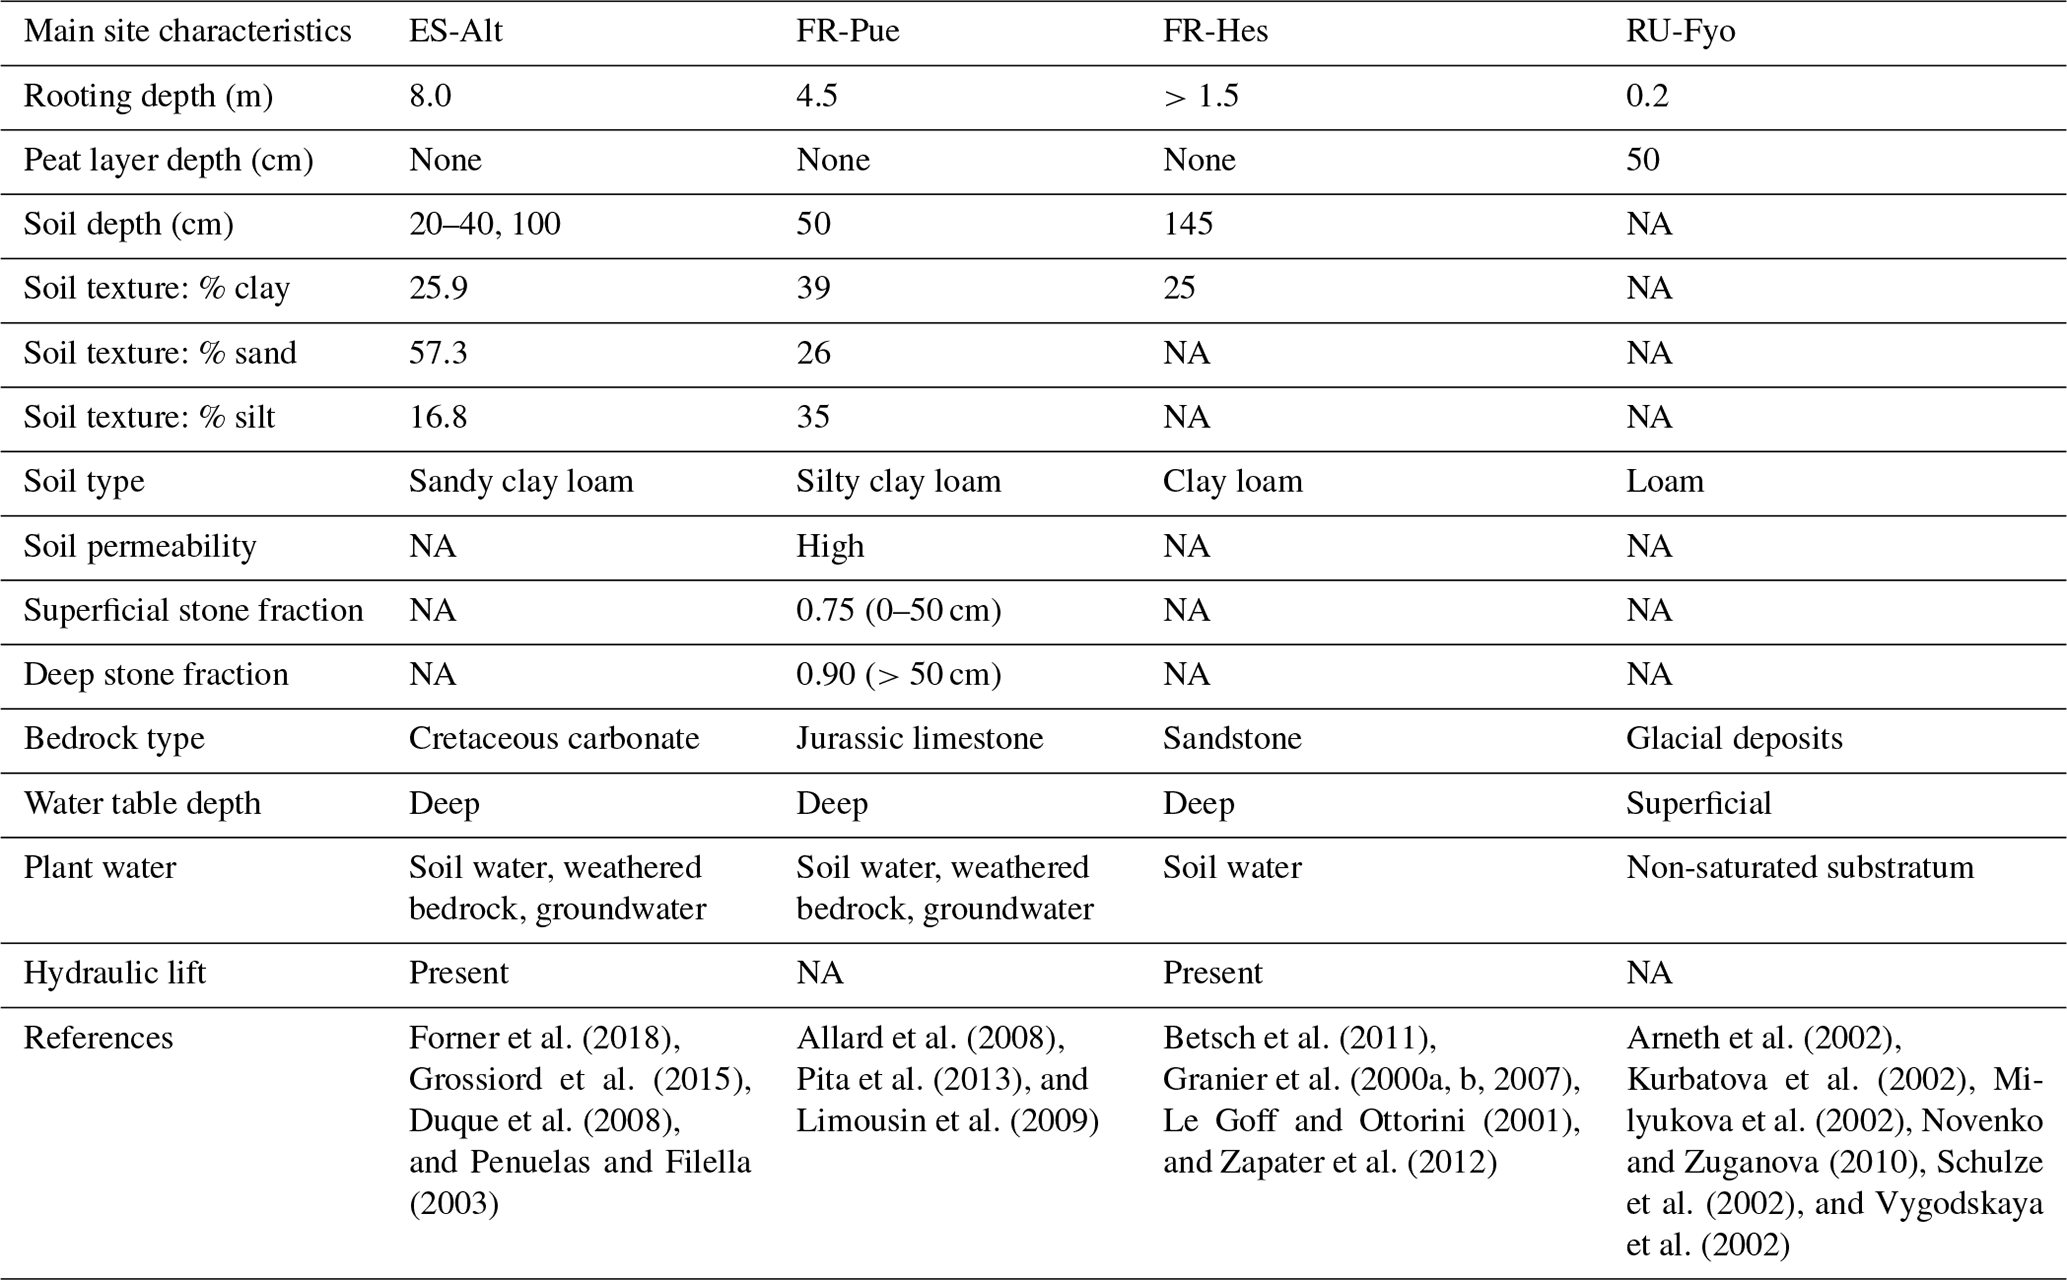
Figure 1a illustrates the spatial distribution of DTB across a domain covering a large part of the European continent: 43 % of the area with DTB between 0 and 2 m, 40 % between 2 and 40 m, and 17 % with depths larger than 40 m (Pelletier et al., 2016). This geological pattern is overlaid by three main climatic zones according to the Köppen–Geiger climate classification: (i) warm temperate climate with dry summers (Cs) surrounding the Mediterranean Sea, (ii) warm temperate fully humid climate (Cf) located in the central part of Europe, and (iii) a snow fully humid climate (Df) covering eastern Europe and the Scandinavian Peninsula (Beck et al., 2018). The four study sites were selected from the SAPFLUXNET data set (Poyatos et al., 2021) in order to sample the dominant geological and climate settings of the European continent (Table 1). These sites have DTB no larger than 1.5 m covering the shallow soils in mountain ranges (ES-Alt), foothills (FR-Pue, FR-Hes), and lowlands (RU-Fyo). All the sites lack detailed information concerning the physical properties of the weathered bedrock, such as hydraulic conductivity, water-holding capacity, or percentage of fractures. The sites are distributed across an environmental gradient (of mean annual precipitation 400–900 mm yr−1 and air temperature 4.7–13.8 ∘C) where the FR-Pue and ES-Alt sites exemplify the Cs climate class of the Mediterranean Basin, FR-Hes the Cf class of central Europe, and RU-Fyo the Df class of eastern Europe.
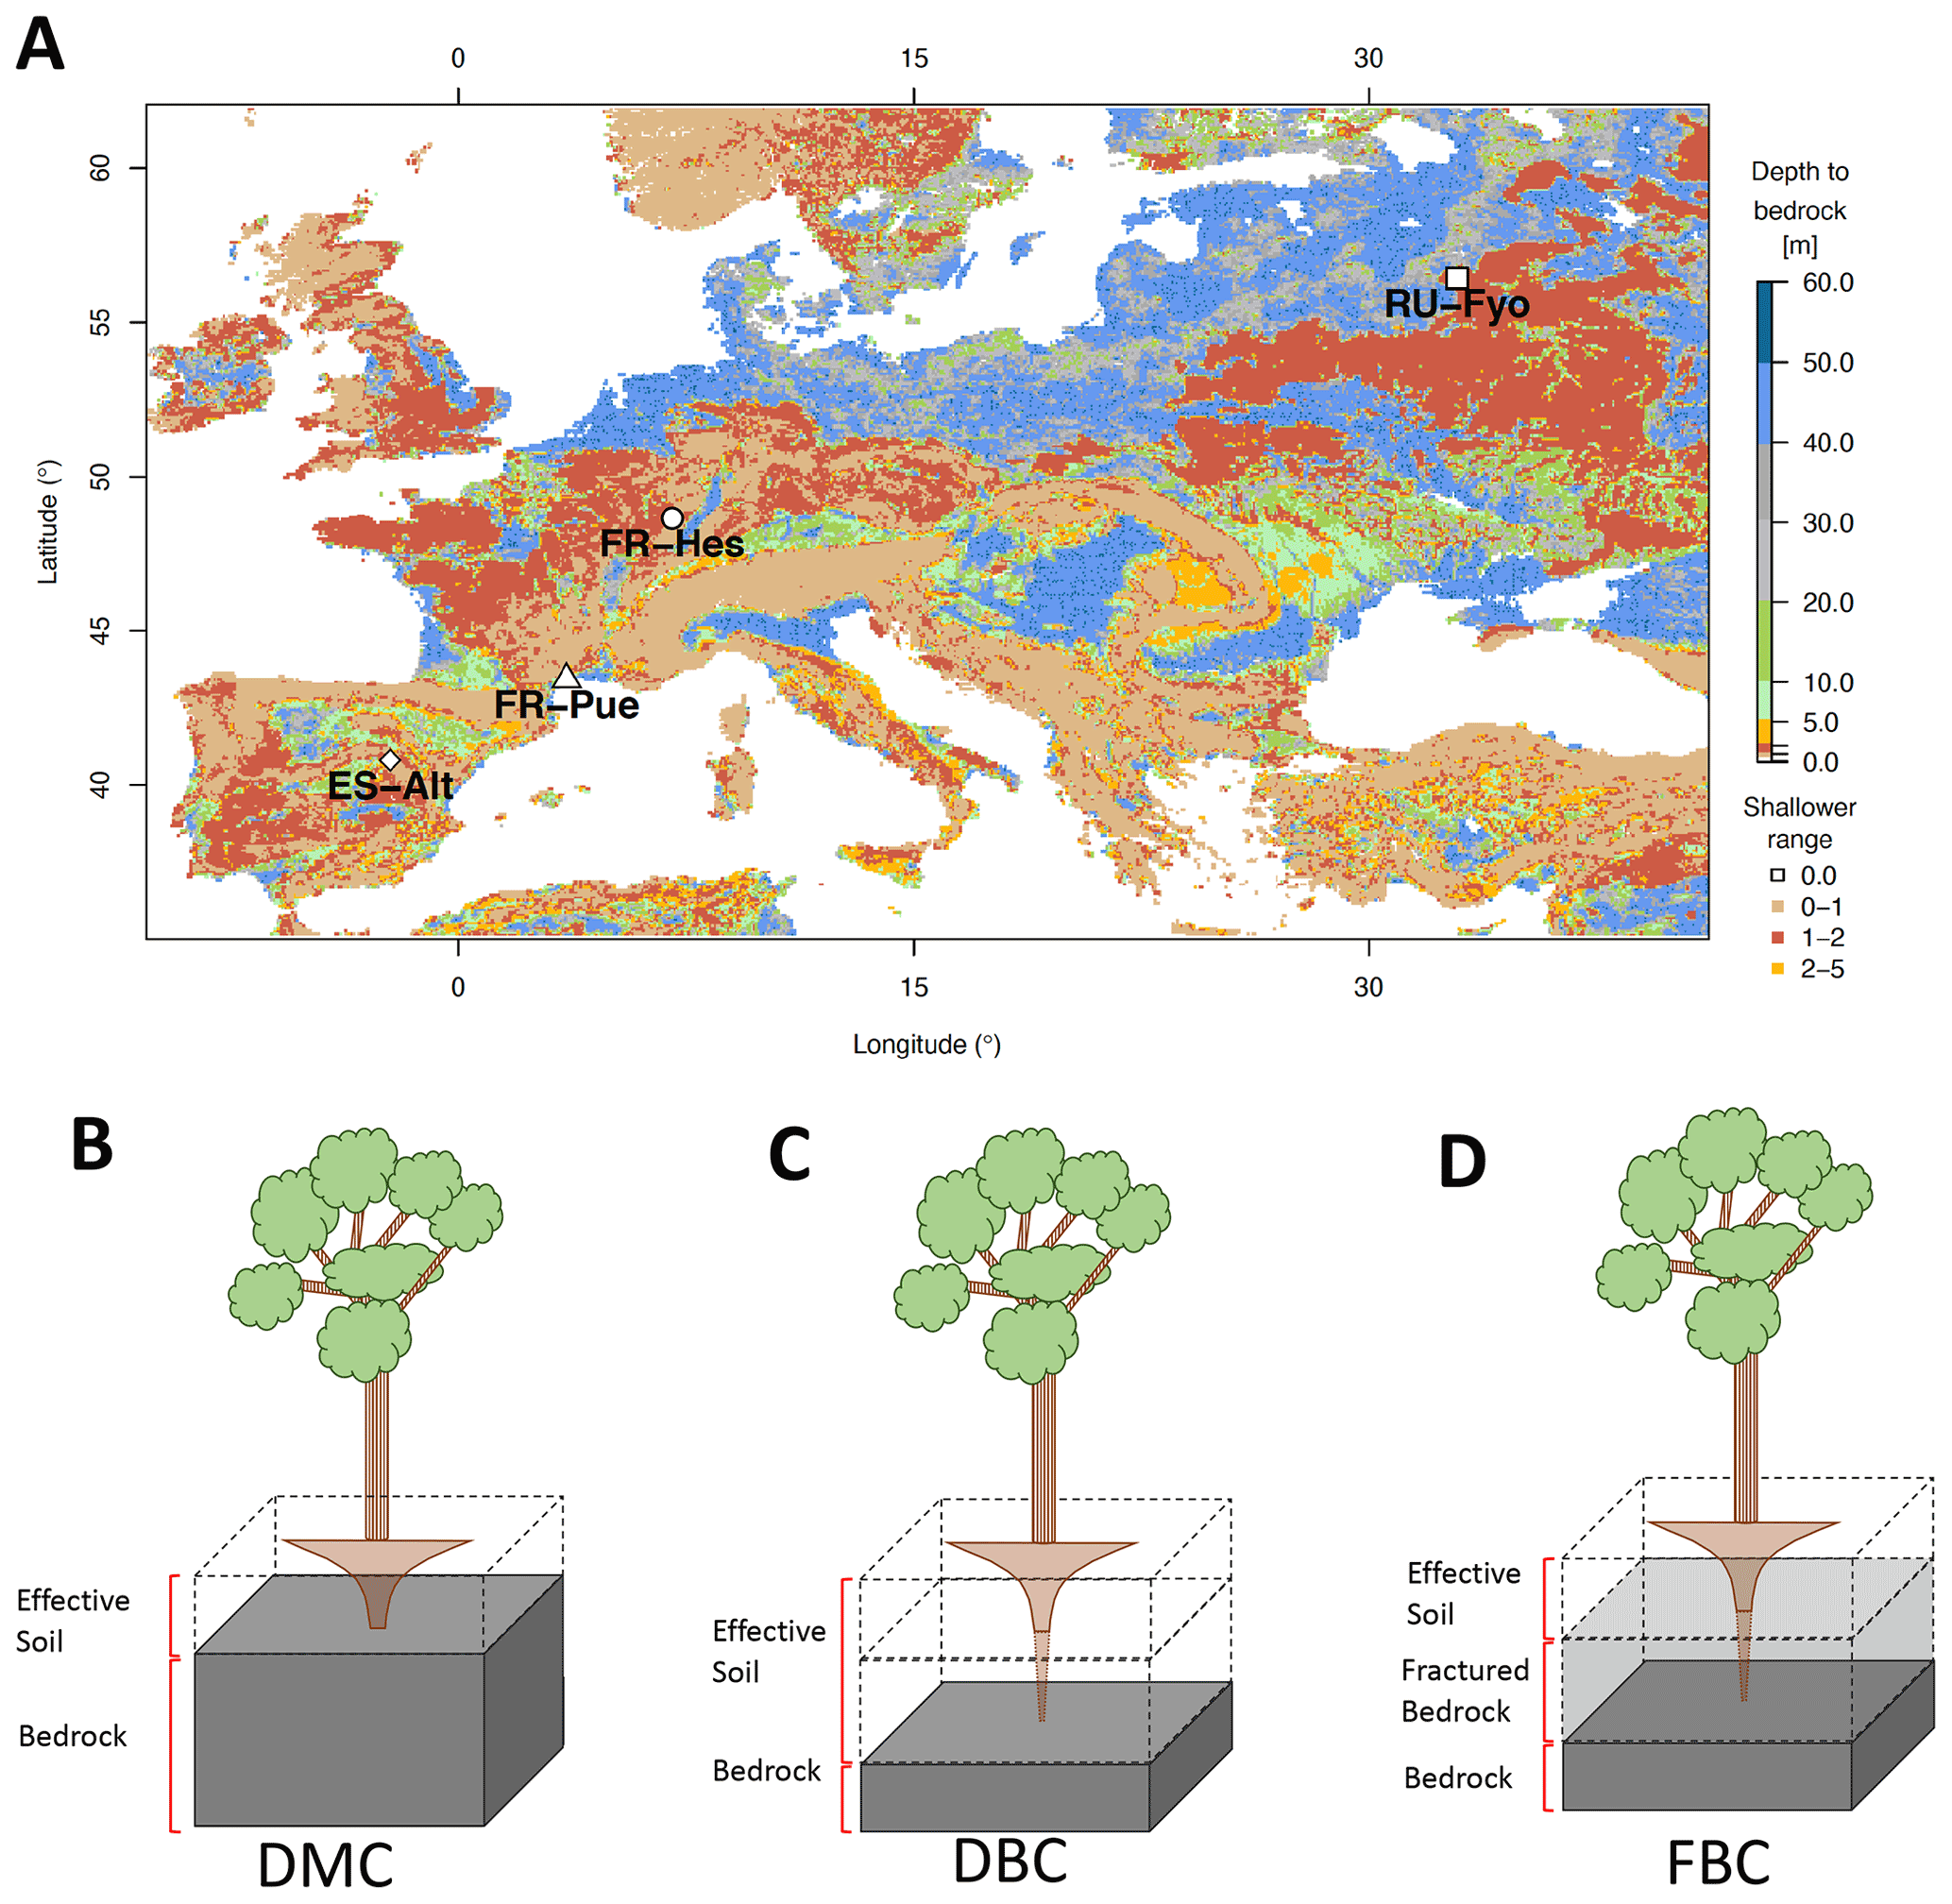
Figure 1Geographical location of the experimental sites and spatial distribution of the depth to bedrock across Europe (a) based on Pelletier et al. (2016). The graphics below the map are the schematic of the three model configurations used in this work: default model configuration, DMC (b); deeper bedrock configuration, DBC (c); and fractured bedrock configuration, FBC (d). The block with dashed lines represents the soil profile, the solid gray block represents the impermeable bedrock layer as it is assumed by CLM 5, and the translucid gray block represents the mimicked fractured bedrock layer.
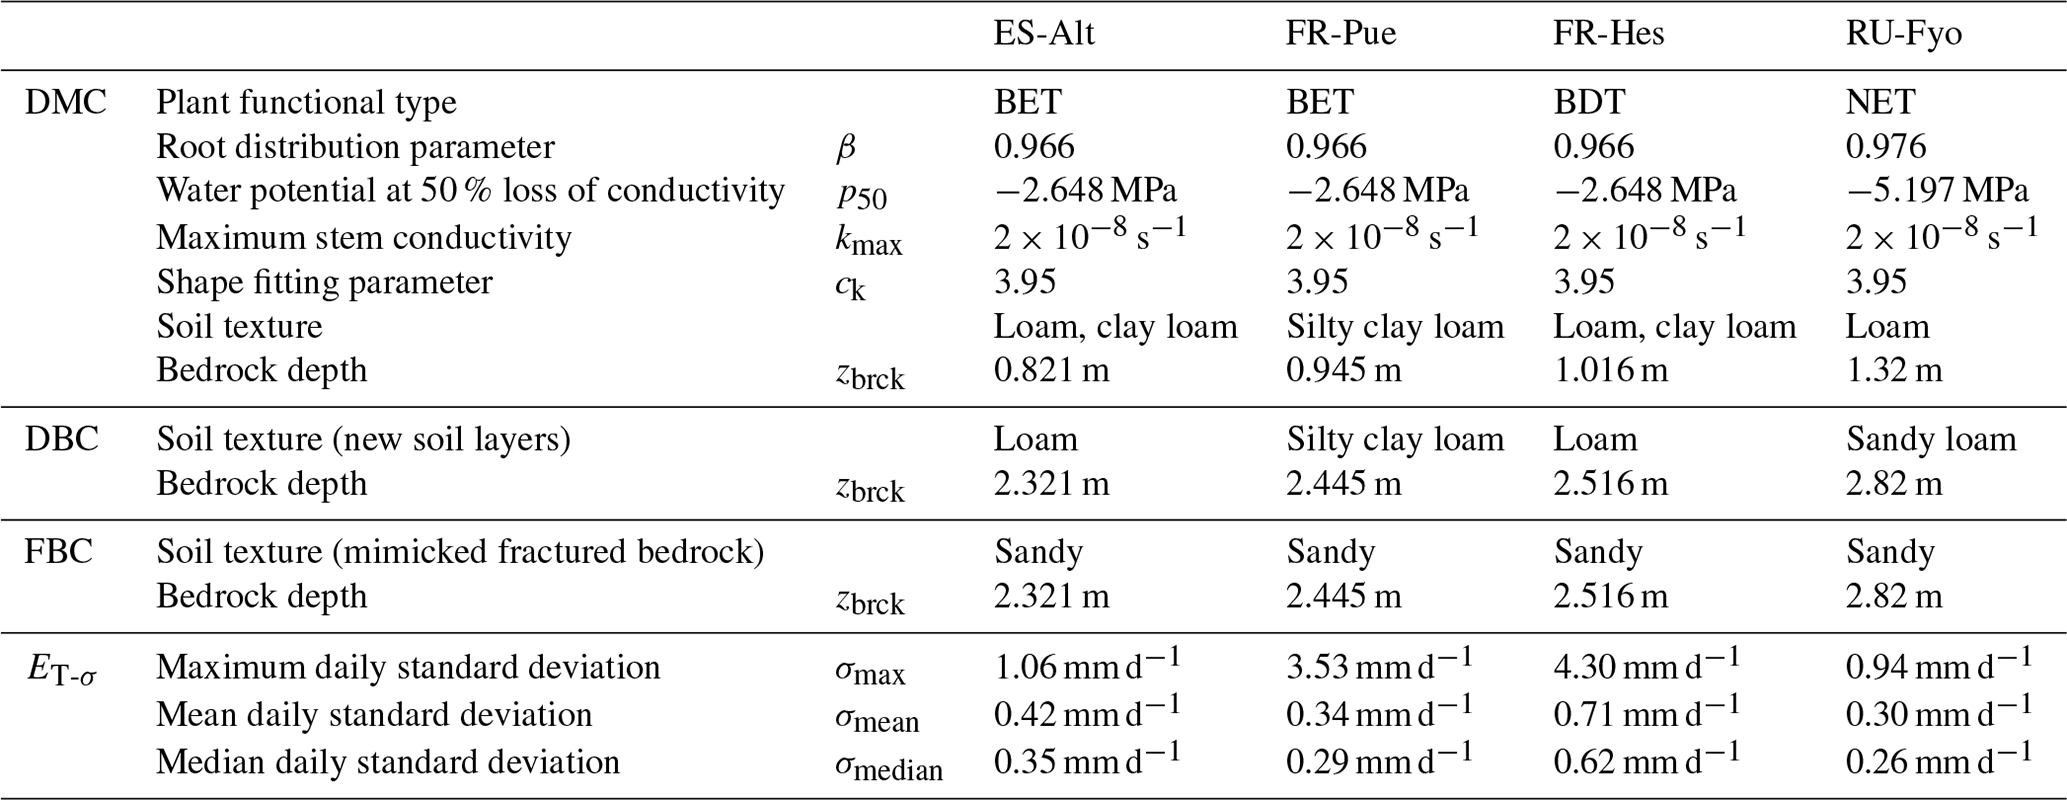
Table 1Model parameters used by the three model configurations at the four experimental sites, including the standard deviation variability of daily transpiration estimates (ET-σ) computed for each site.
2.1 Spain, Alto Tajo (ES-Alt)
This research site is located in the Alto Tajo Natural Park (40.8044∘ N–2.2328∘ W). The main soil types are classified as Calcaric Cambisols, Mollic Leptosols, and Rendzic Leptosols (Zapico et al., 2017). These soils are formed from Cretaceous carbonate rocks settled on top of sandy sediments (Carcavilla et al., 2008), with a poor soil development (Granda et al., 2012), and a thickness ranging from 25 cm up to 1.0 m depth (Martín-Moreno et al., 2014). The soils are formed from Cretaceous carbonate rocks settled on top of sandy sediments (Carcavilla et al., 2008), showing a poor development (Granda et al., 2012) with maximum soil thickness varying between 25 cm at the top of the slopes and more than 1.0 m at the bottom (Martín-Moreno et al., 2014). The climate is classified as continental Mediterranean, with a summer precipitation characterized by high-intensity rainstorms (Martín-Moreno et al., 2014) and snow fall during winter (Acuña Míguez et al., 2020). The site registered a mean annual temperature and precipitation of 11.7 ∘C and 567 mm yr−1, respectively (Poyatos et al., 2016). The vegetation is characterized by four types of forest communities dominated by Juniperus thurifera L., Pinus nigra J.F. Arnold ssp. salzmannii (Dunal) Franco, Quercus faginea Lam., and Quercus ilex ssp. ballota (Desf) Samp. (Forner et al., 2014). Quercus ilex trees at this site have the capacity to allocate structural and fine roots down to 8.0 m depth (Penuelas and Filella, 2003). The plant functional type (PFT) for this site is broadleaf evergreen tree (BET).
2.2 France, Puéchabon (FR-Pue)
The Puéchabon research site (43.4417∘ N–3.5944∘ E) is characterized by soil limitations linked to the hard Jurassic limestone formation beneath it (Cabon et al., 2018). The soil does not have a clear differentiation of horizons (Shahin et al., 2013), with a silty clay loam soil texture (Reichstein et al., 2002). The superficial soil layers have a high soil permeability thanks to the elevated stone fraction of 0.75. On the other hand, soil layers beneath 50 cm have a larger clay content (>30 %) and a stone fraction of more than 0.9 (Limousin et al., 2009; Pita et al., 2013). This location has a Mediterranean climate with a mean annual precipitation of 1023.0 mm yr−1 and a mean annual temperature of 13.8 ∘C (Poyatos et al., 2021). The forest canopy is dominated by Quercus ilex, while the understory is sparse and dominated by shrubs such as Buxus sempervirens L., Phillyrea latifolia L., Pistacia terebinthus L., and Juniperus oxycedrus L. (Allard et al., 2008). This forest stand allocates most of the fine root biomass in the top 50 cm of the soil profile with a small fraction of roots reaching depths down to 4.5 m (Allard et al., 2008). Similarly to ES-Alt, the PFT is classified as BET, due to the dominance of Quercus ilex.
2.3 France, Hesse (FR-Hes)
The Hesse experimental site (48.6742∘ N–7.0647∘ E) is located on top of a sandstone formation, with a gentle southern slope (Le Goff and Ottorini, 2001) and a soil classified as Luvisol/Stagnic Luvisol with a maximum soil depth of 145 cm depth (Granier et al., 2007). It is a clear transition between the eluviated horizon and the horizon with high clay accumulation at 50 cm depth (Zapater et al., 2012), leading to a low clay content in the upper soil layers (Granier et al., 2000b). It has a semi-continental climate with a mean annual temperature of 10.0 ∘C and a mean annual precipitation of 1003 mm yr−1 (Poyatos et al., 2021). The vegetation is dominated by Fagus sylvatica L. with 90 % of the trees, with the remaining 10 % represented by Carpinus betulus L., Betula pendula Roth, Quercus petraea (Matt.) Liebl., Larix decidua Mill., Prunus avium L., and Fraxinus excelsior L. (Granier et al., 2000a). Understory vegetation is sparse as a consequence of a closed canopy, and the mineral soil is covered by a mull-type humus (Epron et al., 2004; Le Goff and Ottorini, 2001). Fagus sylvatica trees allocate most of the fine roots in the upper 40 cm of soil with some fine roots reaching depths down to 1.5 m (Betsch et al., 2011; Granier et al., 2000a, b; Zapater et al., 2012). The dominant PFT is classified as broadleaf deciduous tree (BDT).
2.4 Russia, Fyodorovskoye (RU-Fyo)
The Fyodorovskoye experimental site (56.4615∘ N–32.9221∘ E) is located in the Central Forest Nature Reserve in the Tver region, Russia. The soils are classified as Eutric Podzoluvisol and Gleyic Podzoluvisol and characterized by their poor drainage, poor soil aeration, and bog growth on the surface (Vygodskaya et al., 2002). The site lithology describes a previous vast periglacial lake at 8 m depth, above which the peatland started forming (Novenko and Zuganova, 2010) and is still present. The peat layer at this site has an average depth of 50 cm (Arneth et al., 2002), and the glacial deposits result in a loamy texture of the soil beneath it (Novenko and Zuganova, 2010; Schulze et al., 2002). The water table at this site is shallow, forcing the trees to allocate most of the fine roots in the top 20 cm of the soil (Milyukova et al., 2002). The climate is a transition between European oceanic to continental climate being classified as moderately continental (Schulze et al., 2002) with a mean annual precipitation of 719.7 mm yr−1 and a mean annual temperature of 4.7 ∘C (Poyatos et al., 2021). The forest stand is dominated by the tree species Picea abies (L.) Karst (Norway spruce), Betula pubescens L. (Birch), and some Pinus sylvestris L. (Scots pine) (Kurbatova et al., 2013; van der Laan et al., 2014). The dominance of coniferous trees at this site determines the needleleaf evergreen tree (NET) PFT classification.
3.1 Model implementation
CLM 5 (Lawrence et al., 2019) was implemented at each experimental site using point-scale setups. Hourly atmospheric forcings (precipitation, wind speed, air temperature, relative humidity, atmospheric pressure, and incoming shortwave radiation) were retrieved from the SAPFLUXNET data set. Incoming longwave radiation was determined based on air temperature and actual air vapor pressure according to An et al. (2017), while missing variables (i.e, atmospheric pressure) and missing data were filled using the COSMO-REA6 reanalysis product (Bollmeyer et al., 2015). The plant functional types (PFTs) broadleaf evergreen tree (BET), broadleaf deciduous tree (BDT), and needleleaf evergreen tree (NET) describe the vegetation cover of the different experimental sites. CLM 5 implements a default parameterization based on previous published data for the root distribution (Jackson et al., 1996) and plant hydraulics (Kattge et al., 2011; Kennedy et al., 2019), as well as the other plant physiological properties (e.g., aerodynamic and photosynthesis) according to the PFT classification (Lawrence et al., 2019) of each experimental site. Site-specific monthly leaf area index (LAI) values were computed based on the 1 km Global Land Surface Satellite (GLASS) product provided every 8 d (Liang et al., 2013, 2014). In order to account for inter-annual variability in the plant phenological development, yearly model runs were performed where the LAI information was updated at the start of each run. Default soil texture profiles (Bonan et al., 2002) and default depth to bedrock (Pelletier et al., 2016) were used at each site; see Table 1 for summary information. Although this data set does not reflect the exact site conditions, the depth to bedrock is closer to measurements reported in previous studies at the experimental sites. The simulations were carried out over different time periods (i.e, 2012–2014 at ES-Alt, 2001–2011 at FR-Pue, 2001–2005 at FR-Hes, and 2001–2003 at RU-Fyo) covering some of most extreme drought events in Europe (e.g., 2003 and 2006). Finally, soil moisture and soil temperature were initialized by performing multi-year spin-up runs, with CLM 5 repeatedly reinitialized until dynamic equilibrium condition was reached.
3.2 Bedrock configurations
In CLM 5 the plant access to soil water is controlled by the PFT-specific root distribution parameter (β) based on the formulation proposed by Jackson et al. (1996). This parameterization results in an exponentially decreasing root profile with soil depth, which is truncated by the position of the bedrock. The water acquisition by the plants is constrained by the effective soil depth as set by the DTB static parameter, which implies that all soil layers beneath DTB are impermeable and without water-holding capacity; see schematic of Fig. 1b for a graphical illustration of the intersection between root distribution and DTB as conceptualized in CLM 5.
The first configuration (default model configuration: DMC) uses the default soil texture and DTB parameters for each location, and it is used as a baseline for comparison with the other configurations. The second configuration (deeper bedrock configuration: DBC) shifts the bedrock depth of all sites down by 1.5 m, while keeping the same default soil texture classification. This depth was defined as a fixed parameter across all sites because the thickness and degree of bedrock weathering are difficult to characterize over broad scales (Holbrook et al., 2014), where the interaction between climate, vegetation, and rock type determines the extent and properties of the weathered bedrock (Pawlik et al., 2016). The third configuration (fractured bedrock configuration: FBC) uses the extended DTB of the second configuration but parameterizes the soil texture of the layers lying in between the original and the new DTB as 90 % sand and 10 % clay (Table 1). This approach aims to mimic the hydrological behavior of a fractured bedrock based on two main assumptions: a fractured bedrock should have a high water conductivity and low water-holding capacity. As the sandy soil texture classification can be described by any soil with a combination of more than 85 % of sand and less than 10 % of clay, we decided to choose the combination of soil fractions that provides a sandy soil texture with a maximum water-holding capacity for this textural class. The high sand percentage will mimic the fast water movement through the primary and secondary porosity of the fractured bedrock. At the same time, the low clay content allows having a low water-holding capacity for plant water uptake compared with the above soil layers.
3.3 Data analysis
3.3.1 Reference evaporation and observed transpiration
To assess the effect of water stress on transpiration rates, the unstressed reference crop evaporation (Eo) was calculated following Allen et al. (1998) using Eq. (1). This equation assumes a reference crop of 0.12 m height characterized by a surface resistance of 70 s m−1 and an albedo of 0.23. This equation requires wind speed (u) in meters per second (m s−1), net radiation (Rn) and ground heat flux (G) both in megajoules per square meter per day (MJ m−2d−1), air temperature (T) in degrees Celsius (∘C), and the actual and saturated vapor pressures (ea and es, respectively) in kilopascal (kPa). G was extracted from the modeled results of the DMC for each site. The slope of the saturation vapor pressure curve at air temperature (Δ, kPa ∘C−1) was computed using Eq. (2). The psychrometric constant (γ) was estimated with Eq. (3), where λ is the latent heat of vaporization (2.45 MJ kg−1), cp is the specific heat at constant pressure (1.013 × 10⁻³ MJ kg−1 ∘C−1), p is the atmospheric pressure (kPa), and ϵ is the molecular weight ratio of water vapor and dry air (0.622).
Hourly and sub-hourly sap flux of individual trees (Qtree) in cubic centimeters per hour (cm3 h−1) was retrieved from the SAPFLUXNET data set (Poyatos et al., 2021) for each experimental site and aggregated to daily fluxes in cubic meters per day (m3 d−1). Daily transpiration fluxes were upscaled to stand transpiration (ET) in millimeters per day (mm d−1) using Eq. (4) and following the recommendations by Nelson et al. (2020). This equation requires the transpiration flux (Qtree) in cubic meters per day per tree (m3 d−1 per tree), the tree basal area (Υtree) in square meters per tree (m2 per tree), the stand basal area (Υstand) in square meters per square meter (m2 m−2), and the number of measured trees (n). All information required in Eq. (4) was extracted from the SAPFLUXNET data set for each site.
At each site the daily standard deviation of transpiration rates (ET-σ) provides an indication of the different response of individual trees (including different species) to the environmental drivers. Table 1 shows the maximum (σmax), median (σmedian), and mean (σmean) values of ET-σ for the selected time periods. FR-Hes is the site where the sampled trees have the largest variability in the transpiration response (σmean: 0.71 mm d−1; σmedian: 0.62 mm d−1), while the other three sites show similar median and mean values close to ∼ 0.3 mm d−1. FR-Pue and FR-Hes display σmax values (3.53 and 4.3 mm d−1, respectively) that are 3-fold larger than those in ES-Alt and RU-Fyo (σmax: ∼ 1.0 mm d−1). These large σmax values suggest the strong intra-specific variability of transpiration response to the meteorological conditions for forest stands dominated by a single tree species. Sites such as ES-Alt and RU-Fyo characterized by mixed forest stands experience a more homogeneous transpiration response among the sampled trees.
3.3.2 Index of agreement
The daily stand transpiration (ET) in millimeters per day (mm d−1) was compared to the simulated transpiration of the three model configurations (see Sect. 3.2). The relative comparison of the three bedrock representations was carried out by applying a symmetric index of agreement (Γ) proposed by Duveiller et al. (2016). The index is calculated using Eq. (5) and is based on the product between the Pearson correlation coefficient (r) and an α coefficient, which scales r as a measure of agreement. When r is negative, α becomes zero under the consideration that a negative correlation does not show agreement when comparing against a benchmark. Consequently, r is a measure of the linear agreement/dependence reflecting how well the measured and simulated transpiration time series agree in terms of their temporal deviations with respect to their mean responses, and the term α represents any bias (additive/multiplicative) between the two data sets and ranges between 1 (no bias, perfect agreement) and 0 (full bias, no agreement).
3.3.3 Plant vulnerability curve
The physiological implication of the plant response based on the three bedrock configurations is analyzed using the vulnerability curve of the plant hydraulic system as implemented in CLM 5 (Kennedy et al., 2019). Equation (6) expresses the plant segment hydraulic conductivity (k, s−1) as a function of tissue water potential (ψ, MPa) and contains three parameters: the water potential at 50 % loss of conductivity () in megapascal (MPa), the maximum xylem conductivity (kmax) of the plant segment in per second (s−1), and the non-dimensional sigmoidal shape-fitting parameter of the curve (ck). These parameters are defined at the PFT-level and reported in Table 1 for the different selected sites.
The loss of hydraulic conductivity in a plant segment (ΞPLC) due to low tissue water potential can also be expressed as the percent of conductivity (Ξ) (Eq. 7), with 0 % for complete loss of conductance, 50 % representing the conductance at , and 100 % representing no loss.
4.1 Reference evaporation and transpiration fluxes
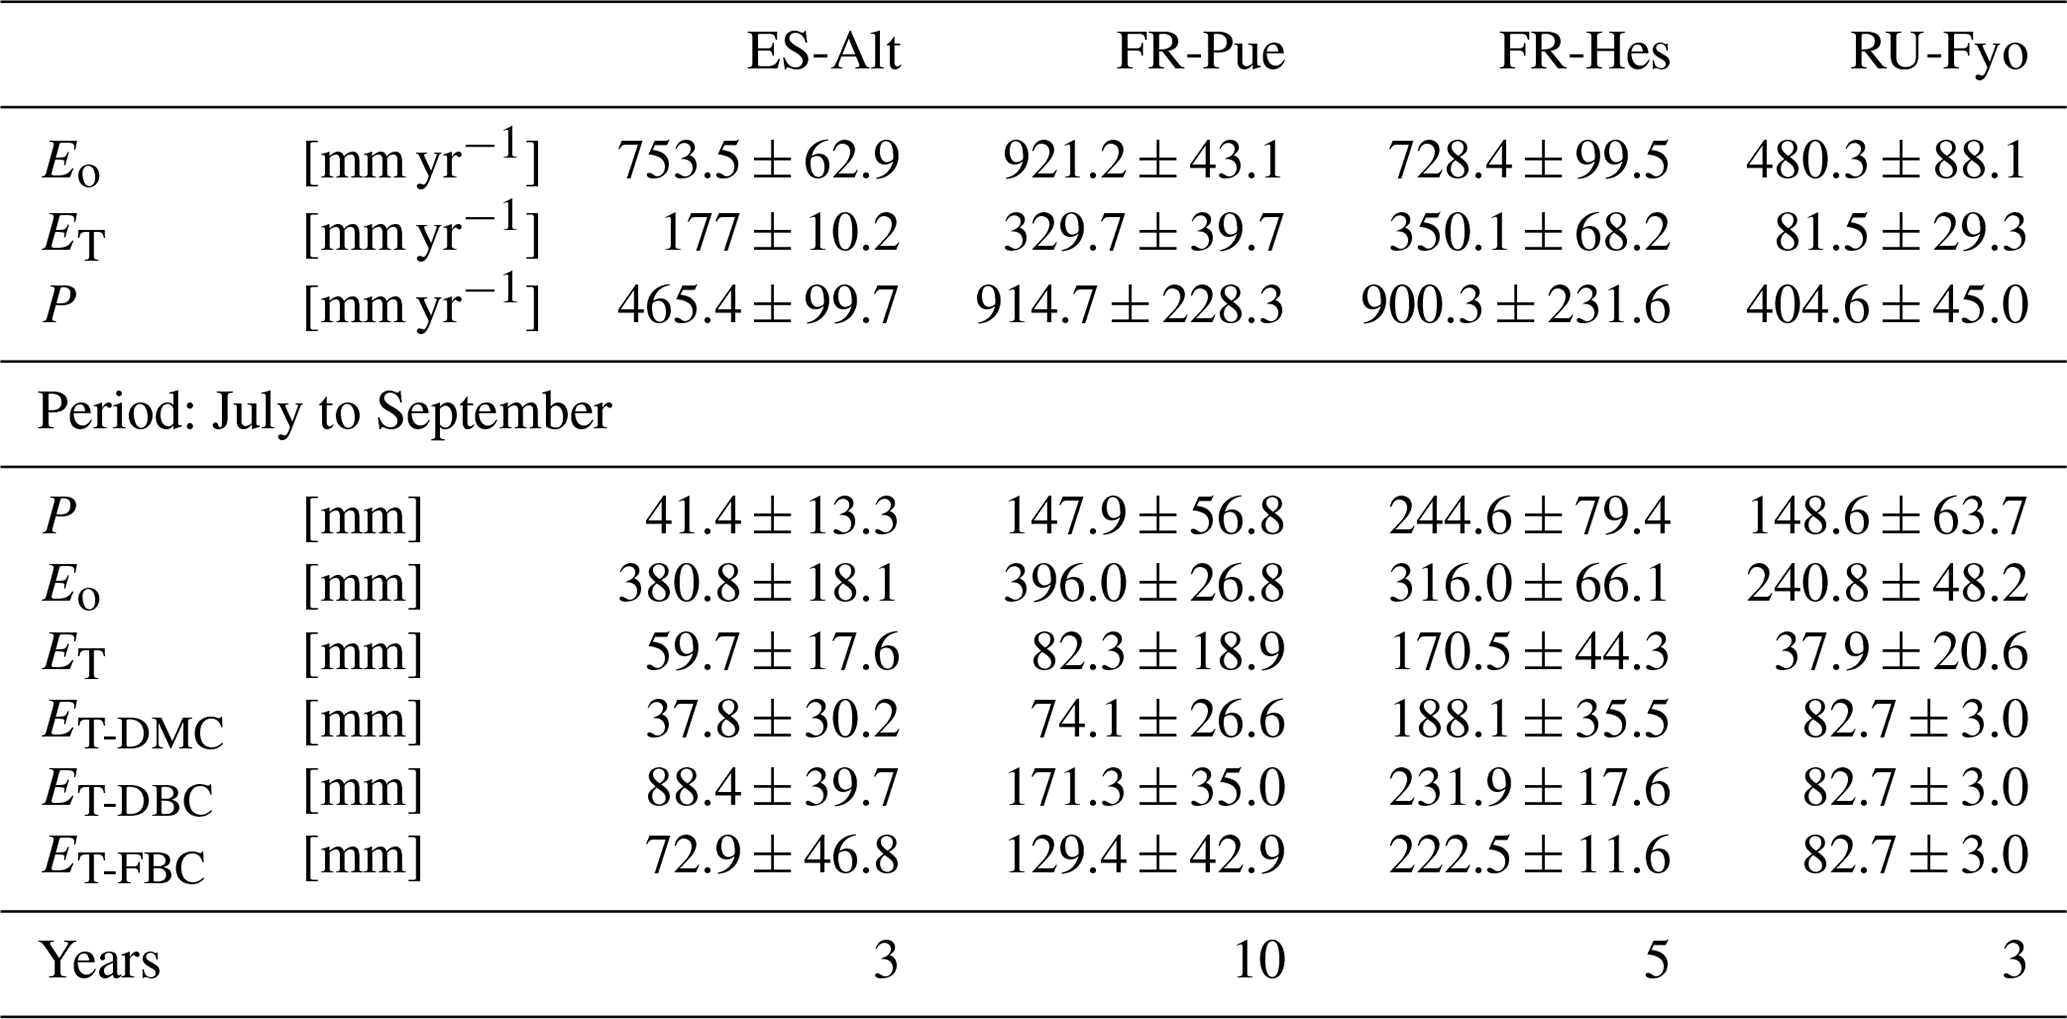
The reference evaporation (Eo) approximates the canopy water demand under optimal soil water supply, and its mean annual value can be compared to mean annual precipitation (P) to quantify the climatic water stress at a given site. For the selected study sites (Table 2), FR-Pue has the largest annual Eo (921 mm yr−1) and the largest annual P (915 mm yr−1), while RU-Fyo has both the smallest annual Eo (480.3 mm yr−1) and P (405 mm yr−1). ES-Alt and FR-Hes have similar values of annual Eo (753.5 and 728.4 mm yr−1, respectively) but very different mean annual P (465 and 900 mm yr−1, respectively), indicating that in ES-Alt the ecosystem is on average water stressed while in FR-Hes is not. At FR-Pue and ES-Alt, the months with the highest Eo are those with the lowest P, implying that at these sites the ecosystems are potentially subject to a strong seasonal climatic drought. On the contrary, FR-Hes and RU-Fyo do not experience pronounced dry periods (Fig. 2). Note that annual Eo is not balanced by the annual contribution of P at almost all sites, with the exception of FR-Hes where P exceeds Eo. This water deficit may lead important restrictions in soil moisture during dry periods at sites such as FR-Pue and ES-Alt.
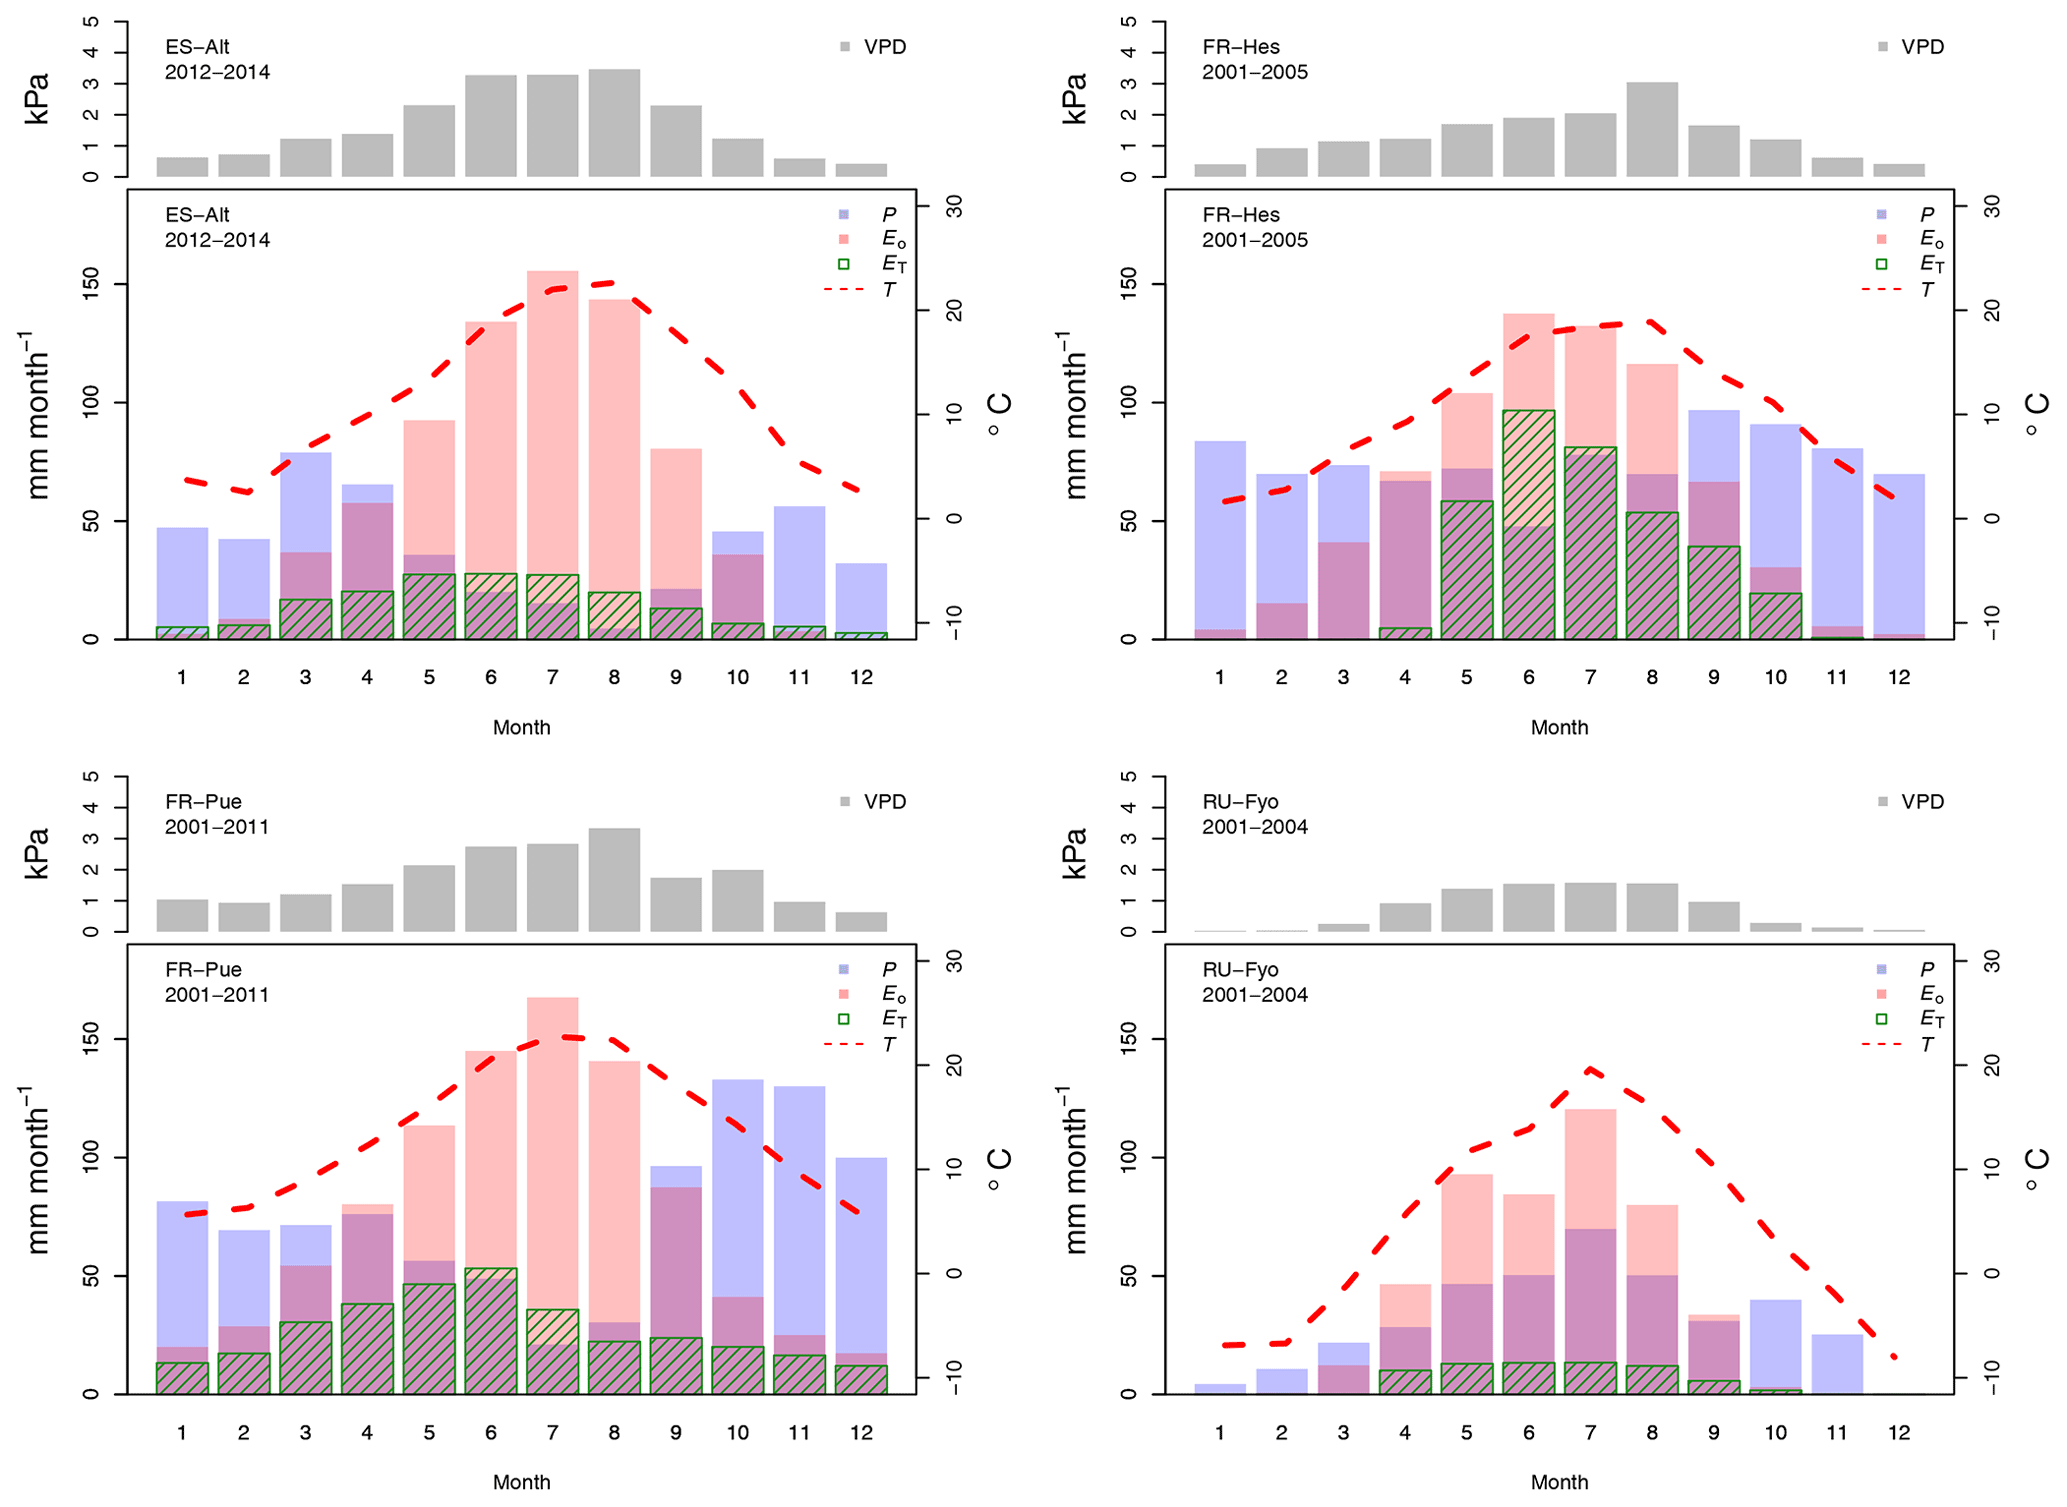
Figure 2Temporal variation of the maximum vapor pressure deficit (VPD), total precipitation (P), total potential evaporation (Eo), total transpiration (ET), and mean air temperature (T) for the selected experimental sites across Europe. The monthly values are based on the different sampling periods for each site.
Table 2Mean annual estimates of potential evaporation (Eo), stand transpiration (ET), and precipitation (P) per study site. Mean accumulated values of the modeled transpiration for the period under analysis (July to September) for the three bedrock configurations (DMC, DBC, and FBC).
The sites of ES-Alt, FR-Hes, and FR-Pue show a similar monthly trend for the maximum vapor pressure deficit (Fig. 2). ES-Alt experiences an extended drier period (3 months), while RU-Fyo is the only site where the maximum vapor pressure deficit never surpasses 3 kPa. Relationships between ET and Eo (Fig. 2) illustrate the difference between atmospheric water demand and plant transpiration across the selected sites, where the upscaled ET represents the integrated effect of environmental constraints (i.e, soil moisture availability and atmospheric demand) on the ecosystem response. RU-Fyo and ES-Alt are the sites with the smallest annual transpiration rates of 81.5 and 177 mm yr−1, respectively (Table 2). The large atmospheric water demand in ES-Alt is not satisfied by the available soil moisture, which defines a soil-water-limited transpiration process. FR-Pue and FR-Hes have a similar annual ET with values ranging between 329.7 and 350.1 mm yr−1, respectively (Table 2).
Daily transpiration rates show differences in terms of timing and magnitude among sites (Fig. 3). FR-Hes has the highest ET with a peak value of 4.5 mm d−1 at the beginning of summer followed by FR-Pue with 2.0 mm d−1 at the beginning of June. ET in FR-Hes shows a quick increment from 0 mm d−1 at the beginning of April to more than 2 mm d−1 1 month later. This increment is directly linked to the leaf flushing period of the dominant tree species (F. sylvatica). ET declines consistently throughout the summer at all sites, with a striking decline in FR-Pue where the average daily transpiration changes from 1.77 to 0.72 mm d−1 between June and July. This abrupt pattern shows how the transpiration process is constrained by low soil moisture and large atmospheric water demand. Overall, the temporal analysis of Eo and ET suggests a pairwise clustering of FR-Hes and RU-Fyo as sites with a more homogeneous temporal distribution of P that controls the atmospheric humidity (Granier et al., 2008). In a similar way, ES-Alt and FR-Pue can be clustered together as soil-water-limited sites (Grossiord et al., 2015, 2018) where the large atmospheric moisture deficit is not satisfied by the soil water supply. Altogether, ET is smaller than Eo in ES-Alt, FR-Pue, and RU-Fyo, with a sudden decline of ET at FR-Pue and ES-Alt in the middle of the year. FR-Hes transpires almost at Eo in spring and summer. Finally, RU-Fyo transpiration rates are less than 50 % of Eo throughout the season, despite sufficient rainfall to satisfy annual evaporative demand.
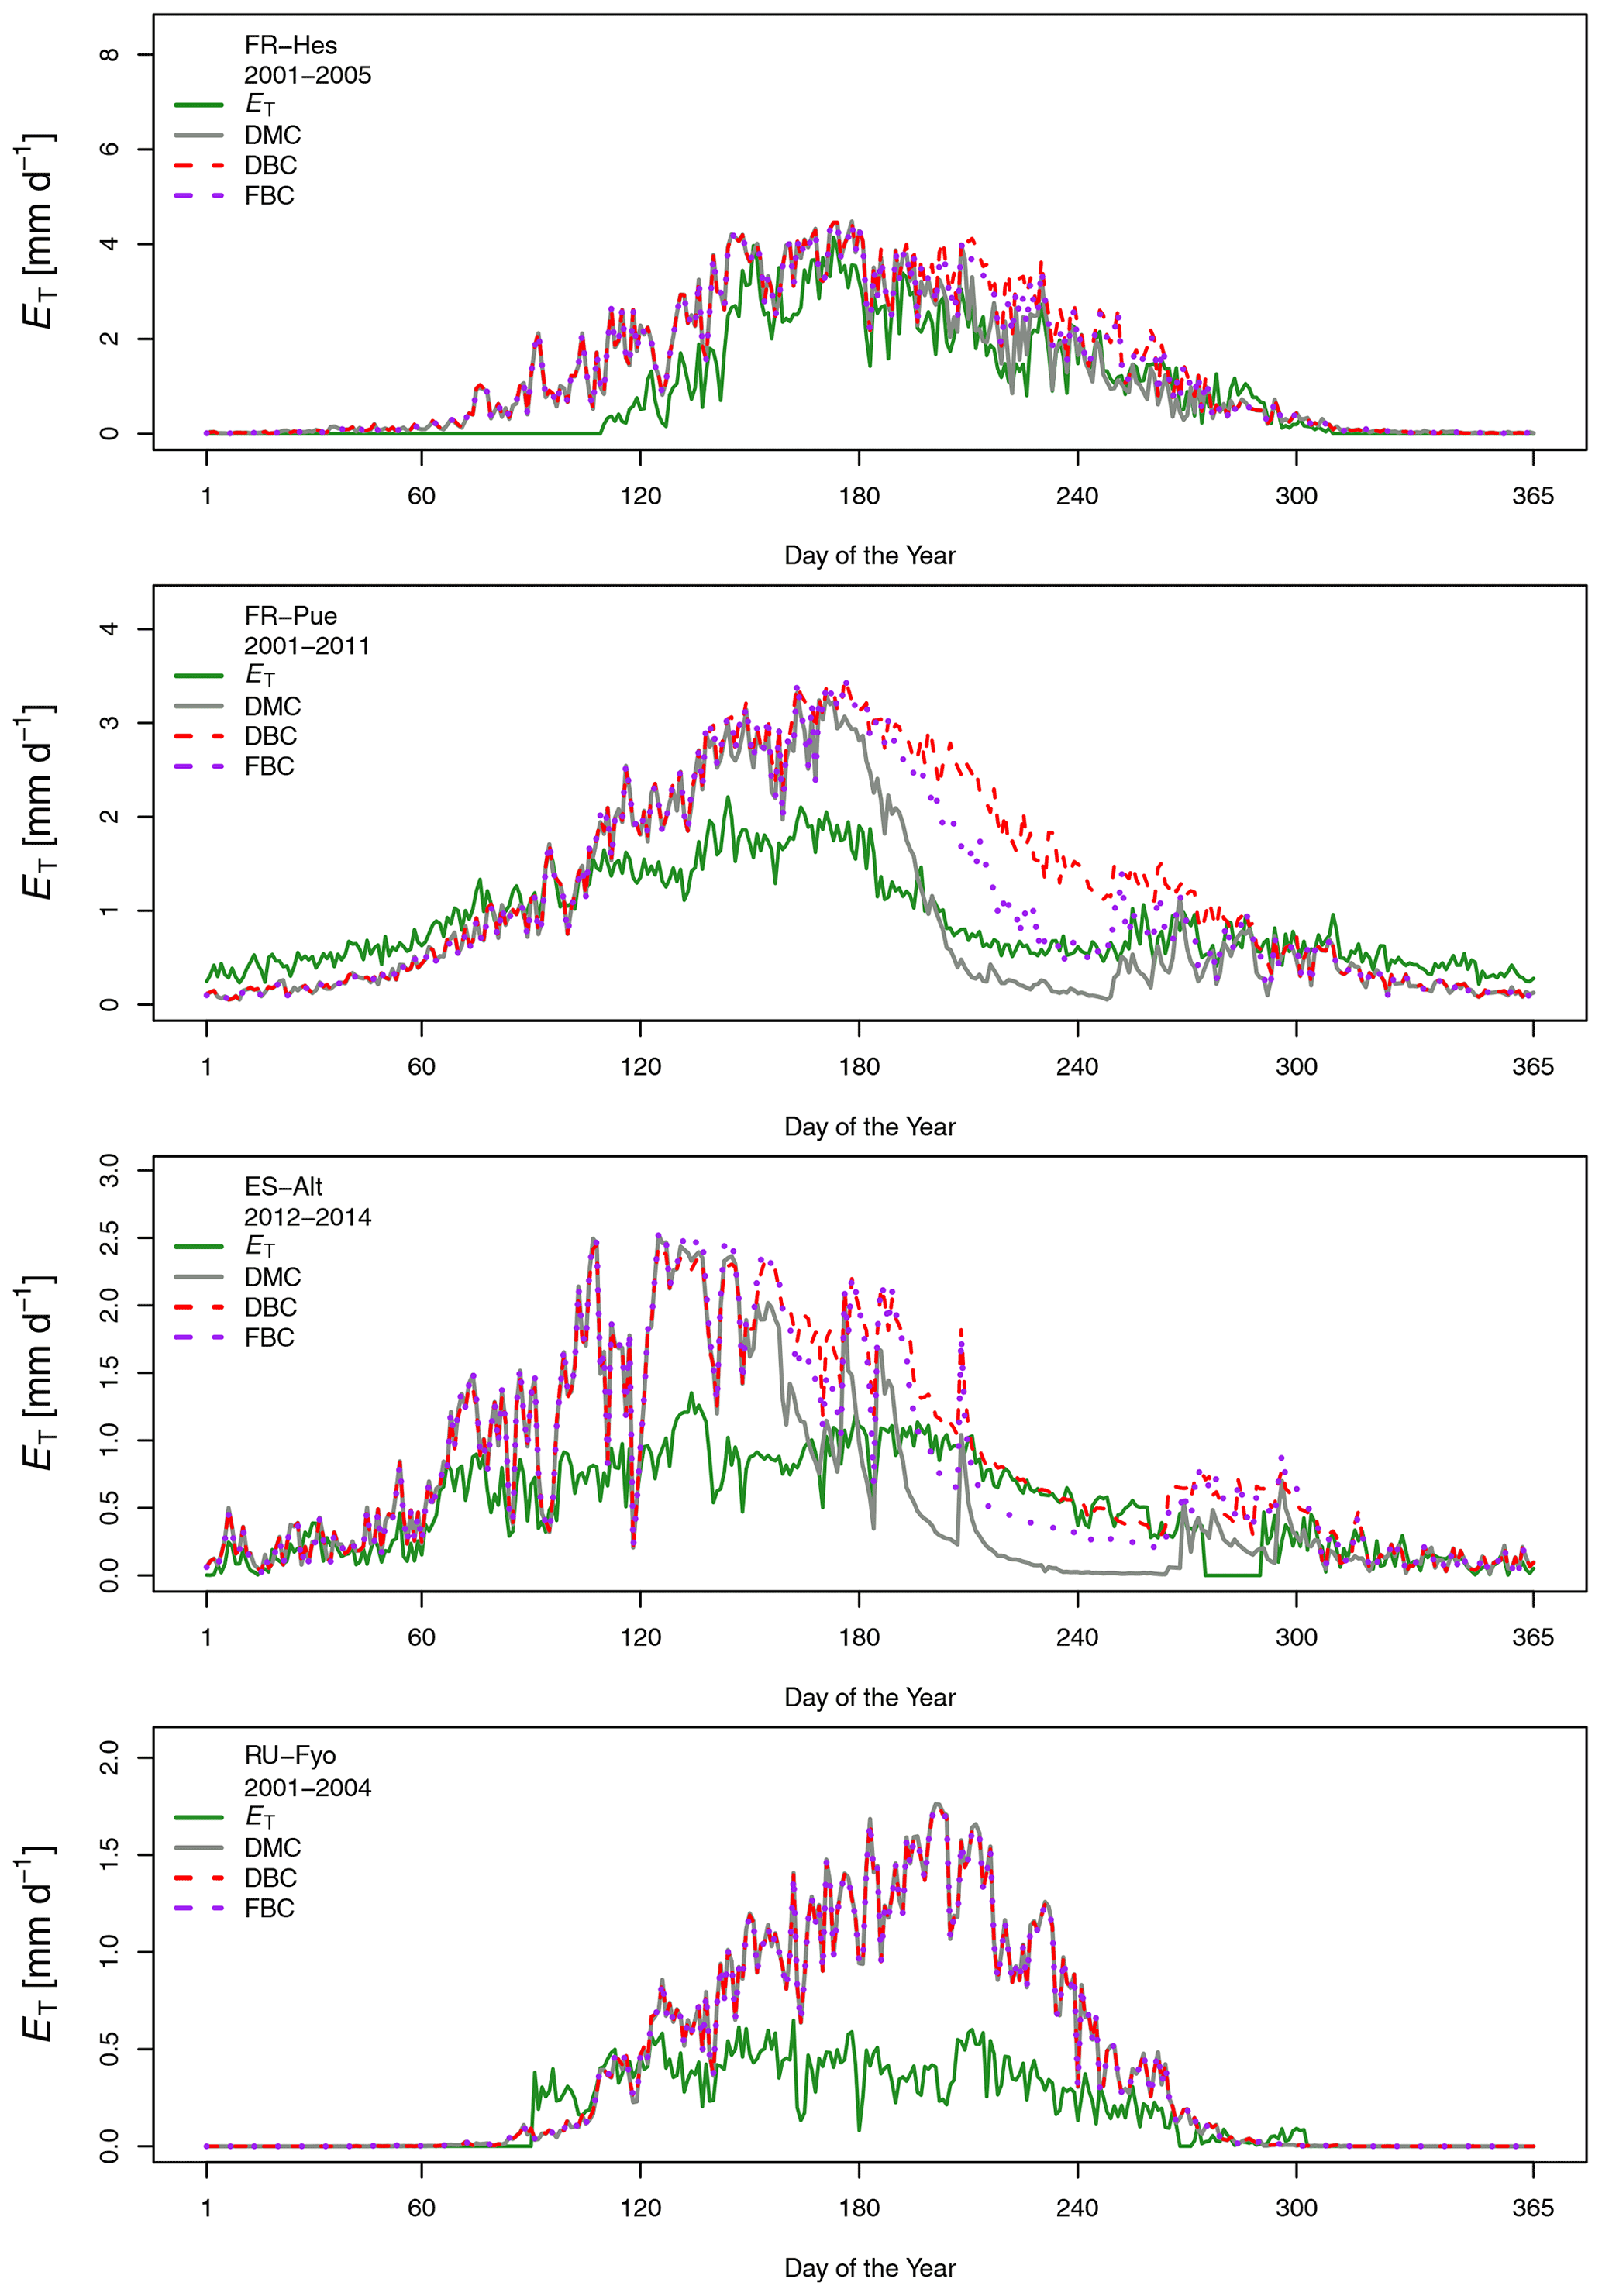
Figure 3Median of the measured and modeled daily transpiration rates for the different model configurations at each experimental site.
4.2 Modeling effects of bedrock configuration
Figure 3 shows the multi-annual variability of the measured and simulated daily transpiration fluxes at the selected sites. The visual inspection of these plots illustrates the different capability of CLM 5 to capture the intra- and inter-site variability of the measured transpiration fluxes. In the ES-Alt and FR-Pue site, the DMC largely overestimates ET during spring and underestimates ET in summer; at both sites the model simulates a sharp decline in ET at the beginning of summer. The introduction of a deeper (i.e, DBC) and fractured (i.e., FBC) bedrock configuration alleviates the summer underestimation without eliminating the large overestimation during spring. In FR-Hes, the DMC configuration accurately reproduces the magnitude and intra-seasonal variability of the measured transpiration fluxes, with a slight overestimation of ET during early spring and summer. The modified bedrock configurations DBC and FBC slightly increase the summer overestimation of ET with respect to the default configuration. All three model configurations (i.e., DMC, DBC, and FBC) systematically overestimate ET in RU-Fyo, with no differences among model configurations.
The soil parameterization used in DMC and DBC agrees with the published data for FR-Hes, FR-Pue, and RU-Fyo (Fig. A2). These configurations are located within the boundaries of the soil texture classification of each site. In this regard, the soil water storage capacity and the infiltration and percolation rates are expected to be representative of the expected site conditions. In ES-Alt, the clay content used in the model is similar with the site conditions, providing similar water-holding capacity. However, the sand content used in the DMC and DBC model configurations reflects a lower hydraulic conductivity than the one expected for this site.
A quantitative estimation of the performances of the three model configurations is obtained using the index of agreement described in Sect. 3.3.2. Figure 4 shows the monthly variability of the Pearson correlation coefficient (r), Γ index, and α coefficient for the three model configurations at the four experimental sites. In ES-Alt, the DMC configuration reproduces the measured transpiration with an r coefficient systematically larger than 0.6, and it peaks around 0.8 for the period between November and May (Table A2). This temporal agreement is, however, concurrent with a large bias, α coefficient ranging between 0.24 and 0.94, which determines Γ values being not larger that 0.57. The performance of the DMC configuration drastically deteriorates during summer and fall (max Γ equals to 0.29), where negatively or poorly correlated time series in June, September, and October determine zero or close to zero values of Γ. Note that during the dry season decent correlation values (i.e, August) are greatly outweighed by the bias between measured and simulated transpiration values (Fig. 4).

Figure 4Multi-annual monthly variation of the Pearson correlation coefficient (r) and the index of agreement (Γ) for the default model configuration (DMC), deeper bedrock configuration (DBC), and fractured bedrock configuration (FBC). See Table A2 for the detailed list of r, α, and Γ values.
The performance of the DMC configuration shows less temporal variability at the FR-Pue study site. With the exception of a few months (e.g., December), the correlation (r) and the α index vary between 0.41 and 0.79 and between 0.45 and 0.96, respectively, with the resulting Γ values between 0.25 and 0.69 (Table A2). Although not as strongly as at ES-Alt, the overall performance of the DMC configuration tends to decrease during the dry period (June–September) also at FR-Pue. The performance of the DMC is striking at FR-Hes during the May–October period (Fig. 4), with r coefficient values larger than 0.65, α values larger than 0.85, and resulting Γ index between 0.58 and 0.86. On the other hand, the DMC performance at FR-Hes is negatively affected by the strong seasonal pattern of vegetation phenology, as the leaf shedding period (November), leafless period (December to March), and leaf flushing period (April) have the lowest Γ values (0.62, 0.0, and 0.23, respectively). This discrepancy is likely caused by the leaf area index (LAI) used in the model, with values between 0.9 and 1.5 m2 m−2 during the leafless period. This results in simulated transpiration when trees on site do not have leaves at all. RU-Fyo is the only experimental site where the capability of the DMC configuration in reproducing the transpiration response is systematically low throughout the year. At this site, the satisfactory performances in terms of temporal correlation (i.e., r) in April (0.71) and June (0.65) are accompanied by a high bias, which reduces the Γ values (i.e., 0.47 and 0.27, respectively). Overall, the DMC configuration shows systematic model deficiency in reproducing the dry-season (i.e., June–September) transpiration response at Mediterranean sites with relatively high atmospheric water demand and shallow (below 1 m) bedrock depth (i.e., ES-Alt and FR-Pue).
Figure 4 shows the impact of adopting different bedrock configurations on the performance skills of the model across the four experimental sites. The visual inspection of the plot reveals that neither of the DBC and FBC configurations alters the model performance during November–May at any of the selected sites. Interestingly, neither the temporal agreement nor the bias is modified by the extended and altered bedrock during this period. At the RU-Fyo site, these two alternative bedrock configurations do not affect the model estimates at all. On the other hand, the two proposed configurations (i.e., DBC and FBC) have a clear impact on the simulated transpiration at ES-Alt and FR-Pue between June and September (Fig. 4). At ES-Alt, both configurations improve the r coefficient and the Γ index, improving the model's capability to realistically simulate transpiration fluxes. Such improvement is most evident in the late summer (i.e., August and September) and to a lesser extent in October (Fig. 3). In particular, the DBC configuration shows slightly larger Γ values in September and October, while FBC improves the modeled transpiration response in July and August (Table A2). The direction of changes introduced by DBC and FBC configurations is less distinct in the FR-Pue site. Here, extending the bedrock depth (i.e., FBC configuration) deteriorates the model performance, while prescribing a different water-holding capacity in the permeable bedrock (i.e., DBC) improves the model response just in August, September, and October. In particular, the improvements obtained using the DBC configuration are mostly explained by better temporal correlation values and marginal changes in model bias. Finally, both modified bedrock configurations at the FR-Hes site decrease the overall fit of the simulated transpiration response. This is particularly clear in August where DBC and FBC configurations drastically decrease the temporal agreement and overestimate the daily cumulative values compared to the estimates of the default (i.e., DMC) model configuration and the measured transpiration values (Fig. 3).
4.3 Plant response to water stress
Figure 5 illustrates the percent of hydraulic conductance (Ξ) as a function of plant tissue water potential and the distribution of simulated Ξ values during the dry period of the year (i.e., June–October). The shape of the plant vulnerability curves from where Fig. 5 is based on is highly dependent on (see Eq. 6), and the distribution of values indicates the level of water stress at which plants are operating (see Figs. A1 to A6 in Appendix A). For instance, under well-watered conditions the plant is unstressed and the experienced water potential is close to 0, allowing the corresponding plant organ (i.e., xylem and sunlit leaves) to move water at their maximum capacity. As soil water uptake becomes limiting, plant water potential decreases, followed by the xylem (or leaf) conductance, and the vegetation starts experiencing water stress conditions.

Figure 5Hydraulic stress experienced by the modeled vegetation per experimental site based on the vulnerability curves of each plant organ (see Figs. A1 to A6) between June and October. Each violin plot describes the distribution of the hydraulic stress experienced by stem xylem (X) and sunny leaves xylem (L) expressed as percentage of conductivity (Ξ). Each violin plot is a visual representation of the probability density of the data, with the width and length representing the frequency and data distribution, respectively. The horizontal line corresponds to the median value, and the thicker vertical line represents the range between the first and third quartiles of the data.
The most extreme plant water stress conditions are simulated at ES-Alt, where the model simulates a reduction in the median conductivities to 20 % (xylem) and 10 % (leaves) in August and even below 10 % in September. Extreme plant stress conditions are also simulated by the DMC configuration at FR-Pue experimental sites. At this location, the xylem conductivities are above 80 % of their maximum value for more than half of the simulated time in July, whereas their median value drastically decreases below 30 % in August. The range of water potentials is even more severe at the leaf level, which simulates a drop in the median conductivity from 45 % to 10 % between July and August. The system smoothly recovers in September with medians of 55 % and 30 % of the maximum conductivity for xylem and leaf, respectively. At the FR-Hes site, the DMC configuration results in little to moderate water stress conditions (the majority of simulated data are well above ; see Fig. 5), with some outliers due to isolated episodes of extreme heat (e.g., August 2003) and/or dry soil moisture conditions (e.g., July 2003). Finally, the analysis of the Ξ at RU-Fyo suggests well-watered soil conditions throughout the year, with xylem and leaf conductivity larger than 95 % of their maximum values.
The effect of deeper or fractured bedrock configurations on simulated plant water status emerges most clearly wherever the default configuration results in severe water stress, i.e., mainly at the Mediterranean sites, ES-Alt and FR-Pue (Fig. 5). At ES-Alt, the DBC shifts the median xylem conductivity to 60 %–80 % of their maximum, compared to 10 %–20 % in the default configuration in August–September. The effect of the FBC configuration is similar but less pronounced at this site. At FR-Pue, the DBC configuration leads to a very strong reduction of water stress compared to the default configuration, with increases of relative xylem conductivity from 15 %–50 % to 90 %–100 % in August and even higher in the other months. The shift is even more clear when inspecting the loss of conductivity simulated at the leaf level. In this case, there is also a drastic change in the inter-quartile range, especially in July and September, suggesting a reduction of the inter-annual variability of vegetation response during the dry season. Yet, the implementation of the FBC at FR-Pue alleviates the harsh conditions simulated by DMC, but the leaves are still affected by a severe plant water status conditions. On the other hand, at FR-Hes and RU-Fyo, where DMC results in little loss of conductance, both the DBC and FBC model do not have any clear effects on the simulated plant water status, except for August and September at FR-Hes, where the rare excursions of relative hydraulic conductivity below the 80 % mark are removed.
Plants rely on structural (e.g., rooting depth, leaf thickness) and functional (e.g., stomatal regulation, plant storage capacitance, hydraulic redistribution) strategies to tolerate extended dry periods (Aroca, 2012; Gupta et al., 2020). These strategies depend on the upper (i.e., climate) and lower (i.e., soil and geological) boundary conditions (Fan et al., 2017). If geological conditions allow for the formation of deep soils (e.g., Amazon basin, Loess Plateau), the roots access deep groundwater, which is very important for surviving extended dry periods (Chitra-Tarak et al., 2021; Tao et al., 2021). On the other hand, when soils are shallow and less developed, the trees must thrive by accessing additional water pockets in the weathered bedrock. The heterogeneous nature of weathered bedrock depends on the interaction between climate, vegetation, and rock type (Pawlik et al., 2016). These interactions allow the increment of the water-holding capacity of weathered bedrock by increasing the porosity and mineral surface area (Navarre-Sitchler et al., 2015). This water-holding capacity is considered negligible (Novák and Surda, 2010), but the vertical extent of this layer makes the water reservoir large enough to support deep rooting vegetation during dry spells (Graham et al., 2010; Jones and Graham, 1993). As an example, Mediterranean trees are able to uptake water from the deep vadose zone (Carrière et al., 2020), sustaining transpiration during the dry season without being affected by embolism (David et al., 2007, 2013; Prieto and Ryel, 2013). Given the strong effect of transpiration on the land surface energy partitioning (Duveiller et al., 2018; Forzieri et al., 2020), it is important that LSMs correctly represent plant water uptake processes and their link to the magnitude and timing of transpiration. The advanced plant hydraulics representation of CLM 5 simulates the water uptake and transport across the whole plant system (e.g., roots, stems, and leaves). This allows us to evaluate the influence of bedrock configuration on the bulk transpiration flux as well as to differentiate its impact on the susceptibility to hydraulic failure of the different plant segments.
5.1 Bedrock effects on modeled transpiration
The rooting profile implemented in CLM 5 follows an exponential distribution, resulting in non-zero root abundance throughout all the way down to the bedrock. The PFTs BDT and BET allocate 95 % of the roots within the first 0.7 m of soil. Those sites with an impermeable bedrock layer very close to the surface effectively cut off the root distribution at that position, without increasing root abundance in the layers above. This limits drastically the access to water resources, forcing the model to use only the water available in the superficial soil layers, affecting transpiration rates and plant hydraulic response under dry conditions. As a result, the DMC configuration restricts the water acquisition of these PFTs at seasonally dry sites, such as ES-Alt and FR-Pue, by removing almost 10 % of the roots that can provide more than 50 % of transpiration water during summer conditions in dry environments with deeper soils (Carrière et al., 2020; Klos et al., 2018; Hahm et al., 2020; Jiang et al., 2020; Nardini et al., 2021; Qi et al., 2018; Rempe and Dietrich, 2018). Oak tree species are known to access deep water storage because of their extensive rooting depths (Gil-Pelegrín et al., 2017). The Quercus ilex trees growing at ES-Alt and FR-Pue have shown this feature (Baldocchi et al., 2010; Forner et al., 2018), allowing the trees to transpire during the dry season despite the low soil water potentials. The transpiration signal retrieved from sap flow sensors shows how plants are able to access deep water sources during dry periods when compared to ET as simulated by the DMC configuration. The steep temporal decline of modeled ET in ES-Alt and FR-Pue during summer contrasts significantly with the measured values at both sites (Fig. 3). These differences depict the dry-out process of the superficial soil layers carried out by the vegetation due to the lack of access to deep water sources by the modeled vegetation and the absence of P to replenish the transpired soil water. Fagus sylvatica trees strongly rely on shallow soil water because of their superficial root system (Lüttschwager and Jochheim, 2020), a condition documented at FR-Hes by Granier et al. (2000a) and Zapater et al. (2012). Meanwhile, during drought periods, this tree species uses the water stored in the trunk and roots as a reservoir to maintain transpiration until the next rainfall event (Betsch et al., 2011). However, the limited access of vegetation to deep water sources due to the shallow DTB is counterbalanced by the temporal distribution of P that replenishes the transpired superficial soil water avoiding plant water stress conditions at this site.
The DTB parameterization used in CLM 5 simulations corresponds to a sharp transition between soil and consolidated bedrock, assuming the latter as a hydrologically inactive layer (Lawrence et al., 2019) that limits the plant water supply at sites with thin soils and pronounced dry seasons. This assumption neglects the fact that weathered bedrock contains cracks formed by physical and chemical weathering processes (Pawlik et al., 2016; Phillips et al., 2019; Pope, 2015), allowing for accumulation of sediments and increasing its capacity to store water. McCormick et al. (2021) underlined the importance of water stored in the weathered bedrock to fulfill the vegetation physiological needs during the growing season. Similarly, Pelletier et al. (2016) stressed the beneficial effect of adding this intermediate layer in LSMs as a reservoir for plants during dry periods. The high heterogeneity of the underlying subsurface characteristics is critical for quantifying the water budget at the local scale (Blyth et al., 2021), and it determines the large uncertainty on the estimation of the weathered bedrock depth. In our study, moving the DTB 1.5 m below the initial value allowed the vegetation to access a larger soil water storage. This configuration doubled the summer transpiration flux of the vegetation at ES-Alt and FR-Pue Mediterranean sites and increased by almost 25 % in FR-Hes with respect to the DMC configuration (Table 2).
The large spatial heterogeneity of bedrock saturated conductivity (Welch and Allen, 2014) and the fact that this property depends on the parental material (Huggett, 2007; Summerfield, 1991) increase the difficulty of incorporating this additional bedrock layer in LSMs. As an attempt to reduce this complexity, the FBC configuration proposed in our study modifies the additional water storage added in DBC by changing its soil texture. The clay fraction of DBC is larger than 10 %, a condition that enhances the soil water storage with respect to FBC, which has a larger saturated conductivity than DBC. The assumption of representing a fractured bedrock as a sandy soil is supported by the similarities in saturated hydraulic conductivity (Ks) that both substrata have. Sandy soils have a Ks of 10−4 m s−1 (Miyazaki, 1996; Pachepsky and Park, 2015), values that are within the range reported for weathered granite rocks that oscillates between 10−2 and 10−5 m s−1 (Rouxel et al., 2010; Katsura et al., 2009). The FBC reduces the summer transpiration with respect to DBC in ES-Alt, FR-Pue, and FR-Hes by 18 %, 24 %, and 4 %, respectively (Table 2). This reduction of ET is the consequence of reducing the soil water storage by changing the clay content of the fractured bedrock layer in FBC (Fig. 1). As an example, when switching from DBC to FBC configuration, the clay content in ES-Alt and FR-Pue is changed respectively from 20 % and 40 % to a fixed value of 10 %. It is important to underline that the inclusion of DBC and FBC leads to no differences in the model transpiration response during winter and spring periods but allows us to increase the summer ET in ES-Alt, FR-Pue, and FR-Hes with respect to DMC.
5.2 Bedrock and hydraulic plant recovery
The implementation of plant hydraulics in terrestrial modeling allows us to link the plant transpiration to soil water availability and vapor pressure deficit (Bonan et al., 2014; Liu et al., 2020). The photosynthesis drives the plant water needs and forces the plant hydraulic system to extract soil water at a maximum rate when soil water resources are unlimited. CLM 5 uses Eq. (6) to represent the plant water supply of different plant organs as a function of gradients in water potentials. In this formulation, modulates the plant water uptake according to the atmospheric water deficit, plant organ conductivity, and soil matric potential (Lawrence et al., 2019). The segmented application of Eq. (6) per soil layer to simulate the root water uptake allows the modeled vegetation to switch the water uptake from dry to wet soil layers (Kennedy et al., 2019). This plant hydraulic formulation provides also the opportunity to diagnose the hydraulic function of the different plant organs (i.e., roots, stems, and leaves) and their susceptibility to hydraulic failure (McCulloh et al., 2019; Meinzer et al., 2009) as part of the model response to environmental stresses.
The three model configurations (i.e., DMC, DBC, and FBC) have a tendency to overestimate ET during spring in ES-Alt, FR-Pue, and FR-Hes (Fig. 3). This tendency reflects the model transpiration response under unlimited soil water conditions and increasing VPD (Figs. 2 and A1). Under such conditions the plant hydraulic system extracts soil water to satisfy the atmospheric water demand, with the positive feedback of P replenishing the transpired soil water. However, at sites with a superficial DTB and extended periods with a lack of P, this mechanism leads to a complete dry-out of the soil profile. The extreme soil water depletion pushes the plant matric potentials well below the values prescribed for each PFT, generating physiological conditions at which plants hardly survive. As an example, the matric potentials simulated for stems and leaves at FR-Pue and ES-Alt are beyond the safety margins reported for broadleaf tree species (−0.9 and −0.8 MPa for root to stem and stem to leaf, respectively) (Johnson et al., 2012). The inclusion of a deeper and fractured bedrock (i.e., DBC and FBC) alleviates this issue, allowing the model to reproduce more realistic plant water potentials and transpiration rates during dry periods at FR-Pue and ES-Alt. The alternative bedrock configurations reduce also the susceptibility to hydraulic failure according to the experienced matric potentials by stems and leaves (Fig. 5). However, the extreme water stress in summer time in the DMC configuration could have resulted from an overestimation of water use during the early season, leading to depleted water reservoirs in summer. Although the DBC and FBC configurations improved the simulated transpiration and water stress experienced by the stem and leaves during summer by increasing the soil water availability, neither of the configurations reduced the transpiration in spring. This could suggest that the reason for the underestimated summer transpiration might not be an underestimated water storage capacity but some other model deficiency that is responsible for both overestimated transpiration in spring and subsequently underestimated transpiration in summer.
The current plant hydraulic formulation of CLM 5 assumes a full recovery of the plant also when its organs experience water potentials below ; FR-Pue and ES-Alt sites are clear examples of the implications of this assumption, with Ξ continuously ranging between 10 % and 100 % at the stem and leaf level in summer (Figs. A3 and A4). Full recovery after partial failure of the hydraulic system may be possible when plants are adapted to such conditions (Sperry and Love, 2015) despite the fact that after long dry periods the root-to-soil interface becomes a constraint to plant water uptake (Zarebanadkouki et al., 2016) before the soil gets moist again. Some plant species may have strategies to repair embolism damage in their tissues shifting the hydraulic efficiency–safety trade-off (Johnson et al., 2012; Klein et al., 2018), but it can not be considered as a norm across all vegetation types. In addition, plants depending on rock moisture can develop special water access strategies such as dynamic root systems or mycorrhizae growing along the rock cracks and accessing water stored in or dripping from the bedrock (Schwinning, 2020). Experimental evidence documented in several studies (Johnson et al., 2018; Klein et al., 2018; Ocheltree et al., 2020; Rehschuh et al., 2020) indicates that plants tissues are affected when their water potentials go below . As a result, the conducting tissues of most of the plant species are not able to recover the pre-drought hydraulic conductivity or experience embolism. This is an important omission in the current plant hydraulic system of CLM 5 that requires further model developments, including for instance plant mortality and a hydraulic conductivity recovery following a different vulnerability path.
The uncertainty in the parameterization of in the plant hydraulic system of CLM 5 can lead to large and systematic errors in the transpiration fluxes. In the RU-Fyo site, the three model configurations overestimate the measured ET with the same order of magnitude (Table 2) and the same temporal pattern (Fig. 3). This is due to the default value of −5.2 MPa (Table 1) assigned to the NET PFT, which differs from the reported values of the tree species monitored at RU-Fyo (i.e., Betula sp., P. abies, and P. sylvestris) which have mean values of −3.7 ± 0.3, −1.5 ± 0.6, and −3.1 ± 0.5 MPa (Choat et al., 2012). Larger values of allow the modeled vegetation to extract more soil moisture to fulfill the atmospheric water demand, increasing considerably the simulated ET with respect to the measured one. Finally, the growth of a bog as the main ground cover beneath the canopy in RU-Fyo is an indication of the poor drainage of the site (Vygodskaya et al., 2002). Since it is a poorly drained peatland site, it may be that root water uptake is hampered by water logging and anoxia in the root zone for extended periods of time, consequently reducing tree transpiration (Angstmann et al., 2013).
5.3 Breaking the bedrock to release the roots
The occurrence and severity of extreme weather conditions like droughts and heat waves (He et al., 2020) highlight the importance of representing the vegetation's mechanisms to avoid or cope with the adverse effects of this new reality. The inclusion of rock moisture stored in the weathered bedrock may become important for correctly simulating plant transpiration during dry periods (Rempe and Dietrich, 2018). The challenge to quantify this rock moisture is linked with the large uncertainty in determining the physical characteristics of this weathered bedrock (Pelletier et al., 2016) and the lack of spatially distributed field information related to the water storage properties of the weathered bedrock. Previous studies have highlighted the importance of groundwater and lateral flow for an improved simulation of transpiration fluxes in LSMs (Maxwell and Condon, 2016; Zeng et al., 2018). In contrast, other studies highlighted the importance of an extended rooting system with the same aim (Fan et al., 2017; Ichii et al., 2009). However, the focus of LSMs on soil water neglects the interaction between these essential components and the weathered bedrock. In this work, we show that allowing the root system to access water stored in the weathered bedrock improves the transpiration and plant water stress estimates during dry periods. The modeling community should address these two issues in a unified approach, eventually improving the water supply at sites with shallow soils and dry conditions. This unified approach, where we allow breaking the bedrock and releasing the root profile, will create a new water reservoir that will refine the vulnerability assessment of forest ecosystems growing in regions with a tendency to experience drier conditions.
Experimental studies have demonstrated that bedrock–vegetation interactions involve a significant and vital water resource for plants during the dry season, which is largely omitted in hydrological and land surface models. This study tested the impact of this omission in a state-of-the art LSM, CLM 5, by comparing the simulated transpiration response of three different bedrock configurations (i.e., default, deeper, and fractured bedrock). The two additional configurations mimic the effect of a deeper impermeable layer as well as the impact of an overlying weathered material on the impermeable bedrock. This overlying weathered bedrock is parameterized assigning a low clay content to account for its water-holding capacity while the larger sand content enables quick drainage of water percolating from the soil. The three model configurations were tested at four forested sites included in the SAPFLUXNET measurement network and characterized by a shallow bedrock and contrasting atmospheric water demand.
The results of this study suggest that the presence of a shallow bedrock defined as a hydrological inactive layer (i.e., default model configuration) leads to strongly reduced water availability to plants during prolonged dry seasons and unrealistic water stress in root, xylem, and leaf tissues. The results show also the positive impact, especially at Mediterranean climate sites, of increasing the depth to bedrock and adjusting the clay content to mimic a weathered bedrock; the simulated transpiration significantly increases attaining a better match with the measured seasonal transpiration patterns. Moreover, these two additional configurations (i.e., deeper and fractured bedrock) reduce the water stress experienced by the modeled xylem and leaf plant segments, keeping the percentage loss of tissue conductivity above 50 %, which is more in line with the range of water potentials at which plants operate. The model default configuration at sites with climates without prolonged dry periods has an optimal performance because the soil water sources are not fully depleted by the ecosystem needs. Moreover, sites with colder temperatures and more humid conditions are not affected by the implemented model configurations. Overall, the proposed weathered bedrock formulation allows the modeled vegetation to make full use of the root profile, reducing the negative effect of the large soil control on transpiration when superficial soil layers have been dried out.
This work is a first attempt to understand how the bedrock parameterization of CLM 5 impacts the transpiration and provides some important insights on the sensitivity of the newly developed plant hydraulics system. This scientific issue has been explored by accounting for the uncertainty in the definition of the depth to the bedrock and by altering the texture composition of the soil overlying the impermeable depth. As a first-order estimation, this approach provided an assessment on the impact of the additional soil water volume and water-holding capacity on the simulated plant conditions. However, as also advocated in previous studies, novel and more advanced parameterizations should also include the physical characterization (e.g., bulk hydraulic conductivity, tortuosity, porosity) of weathered bedrock to represent water movement and storage in a fractured porous media. This will allow for an improved representation of water and nutrient uptake from the soil and weathered bedrock column. Therefore, future studies should focus on identifying the most suitable weathered bedrock representation to be integrated into LSMs as well as to develop novel measurement techniques and strategies for model parameterizations such as rock moisture and water-holding capacity at the large scale.
Table A1Summary of the main sub-surface characteristics of each experimental site.
NA – not available.
Table A2Monthly summary of the Pearson correlation coefficient (r), alpha coefficient (α), and symmetry index (Γ) for the three model configurations and four experimental sites.
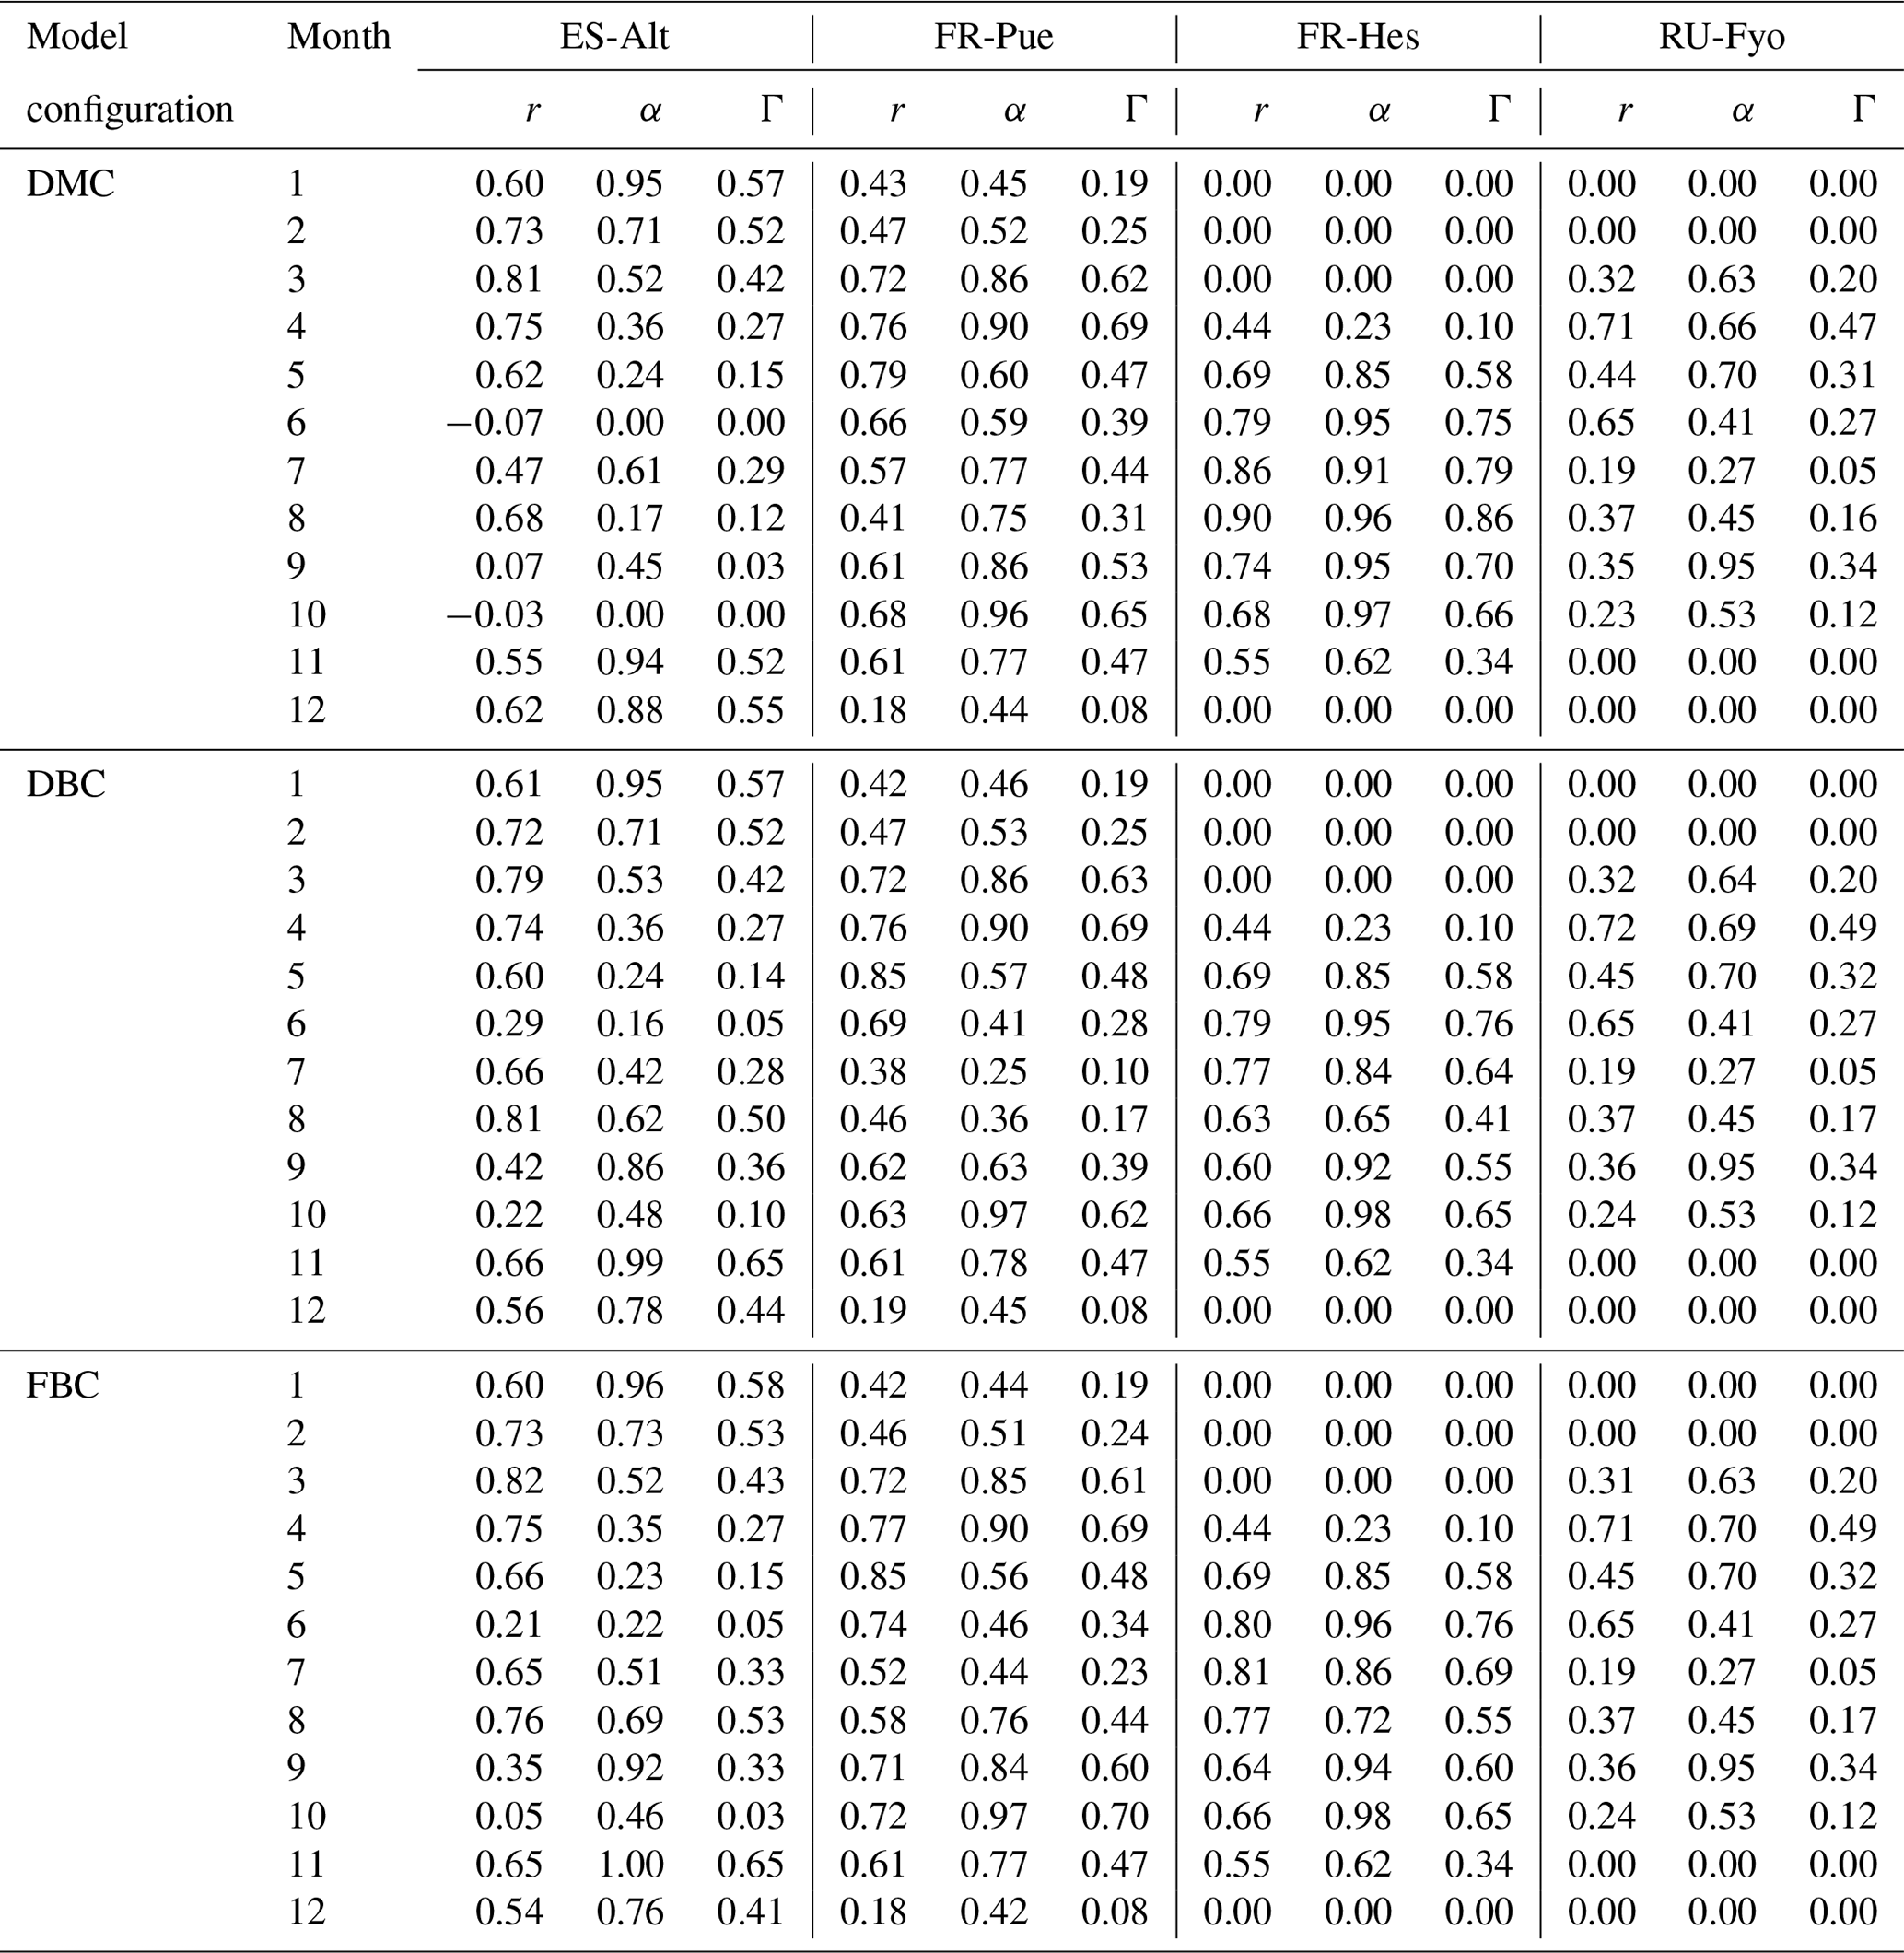
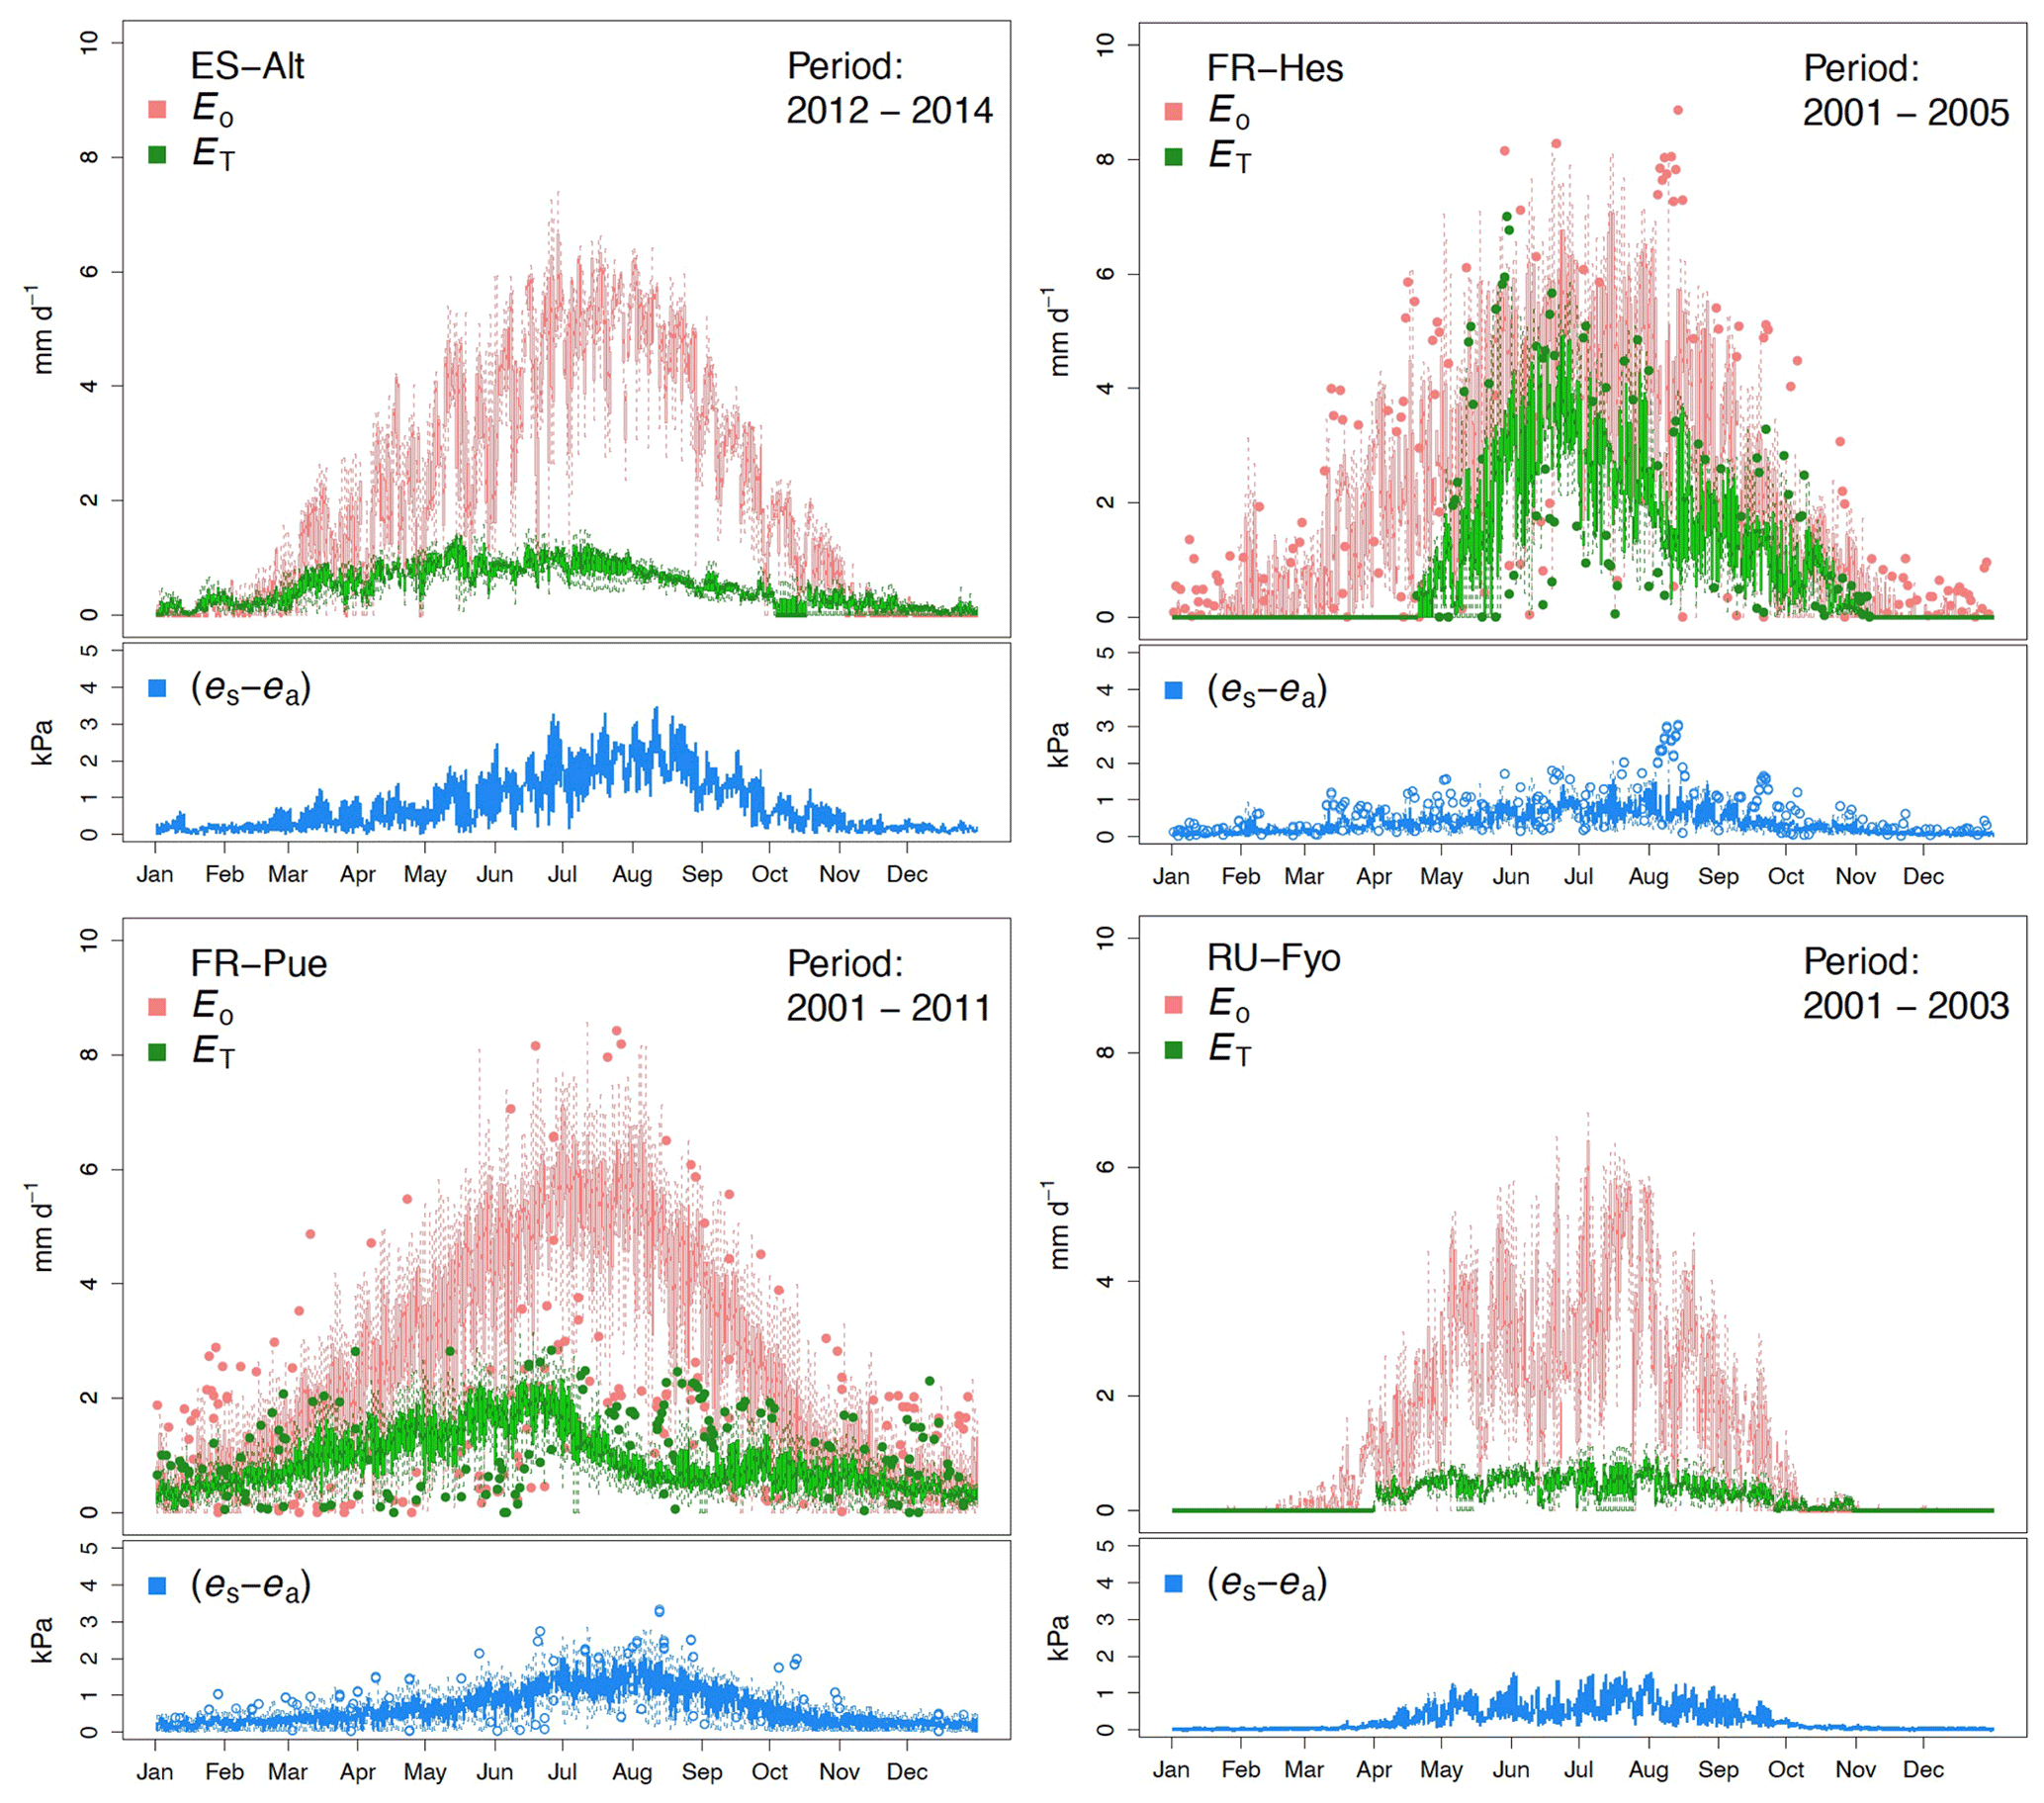
Figure A1Multi-annual daily boxplots for potential evaporation (Eo), stand transpiration (ET), and vapor pressure deficit (Λ) of the selected experimental sites across Europe. The boxplot represents the data contained between the first and third quartiles, the central line is the median, the whiskers represent a predefined distance from the median (1.5× inter-quartile range), and the dots are the outliers.
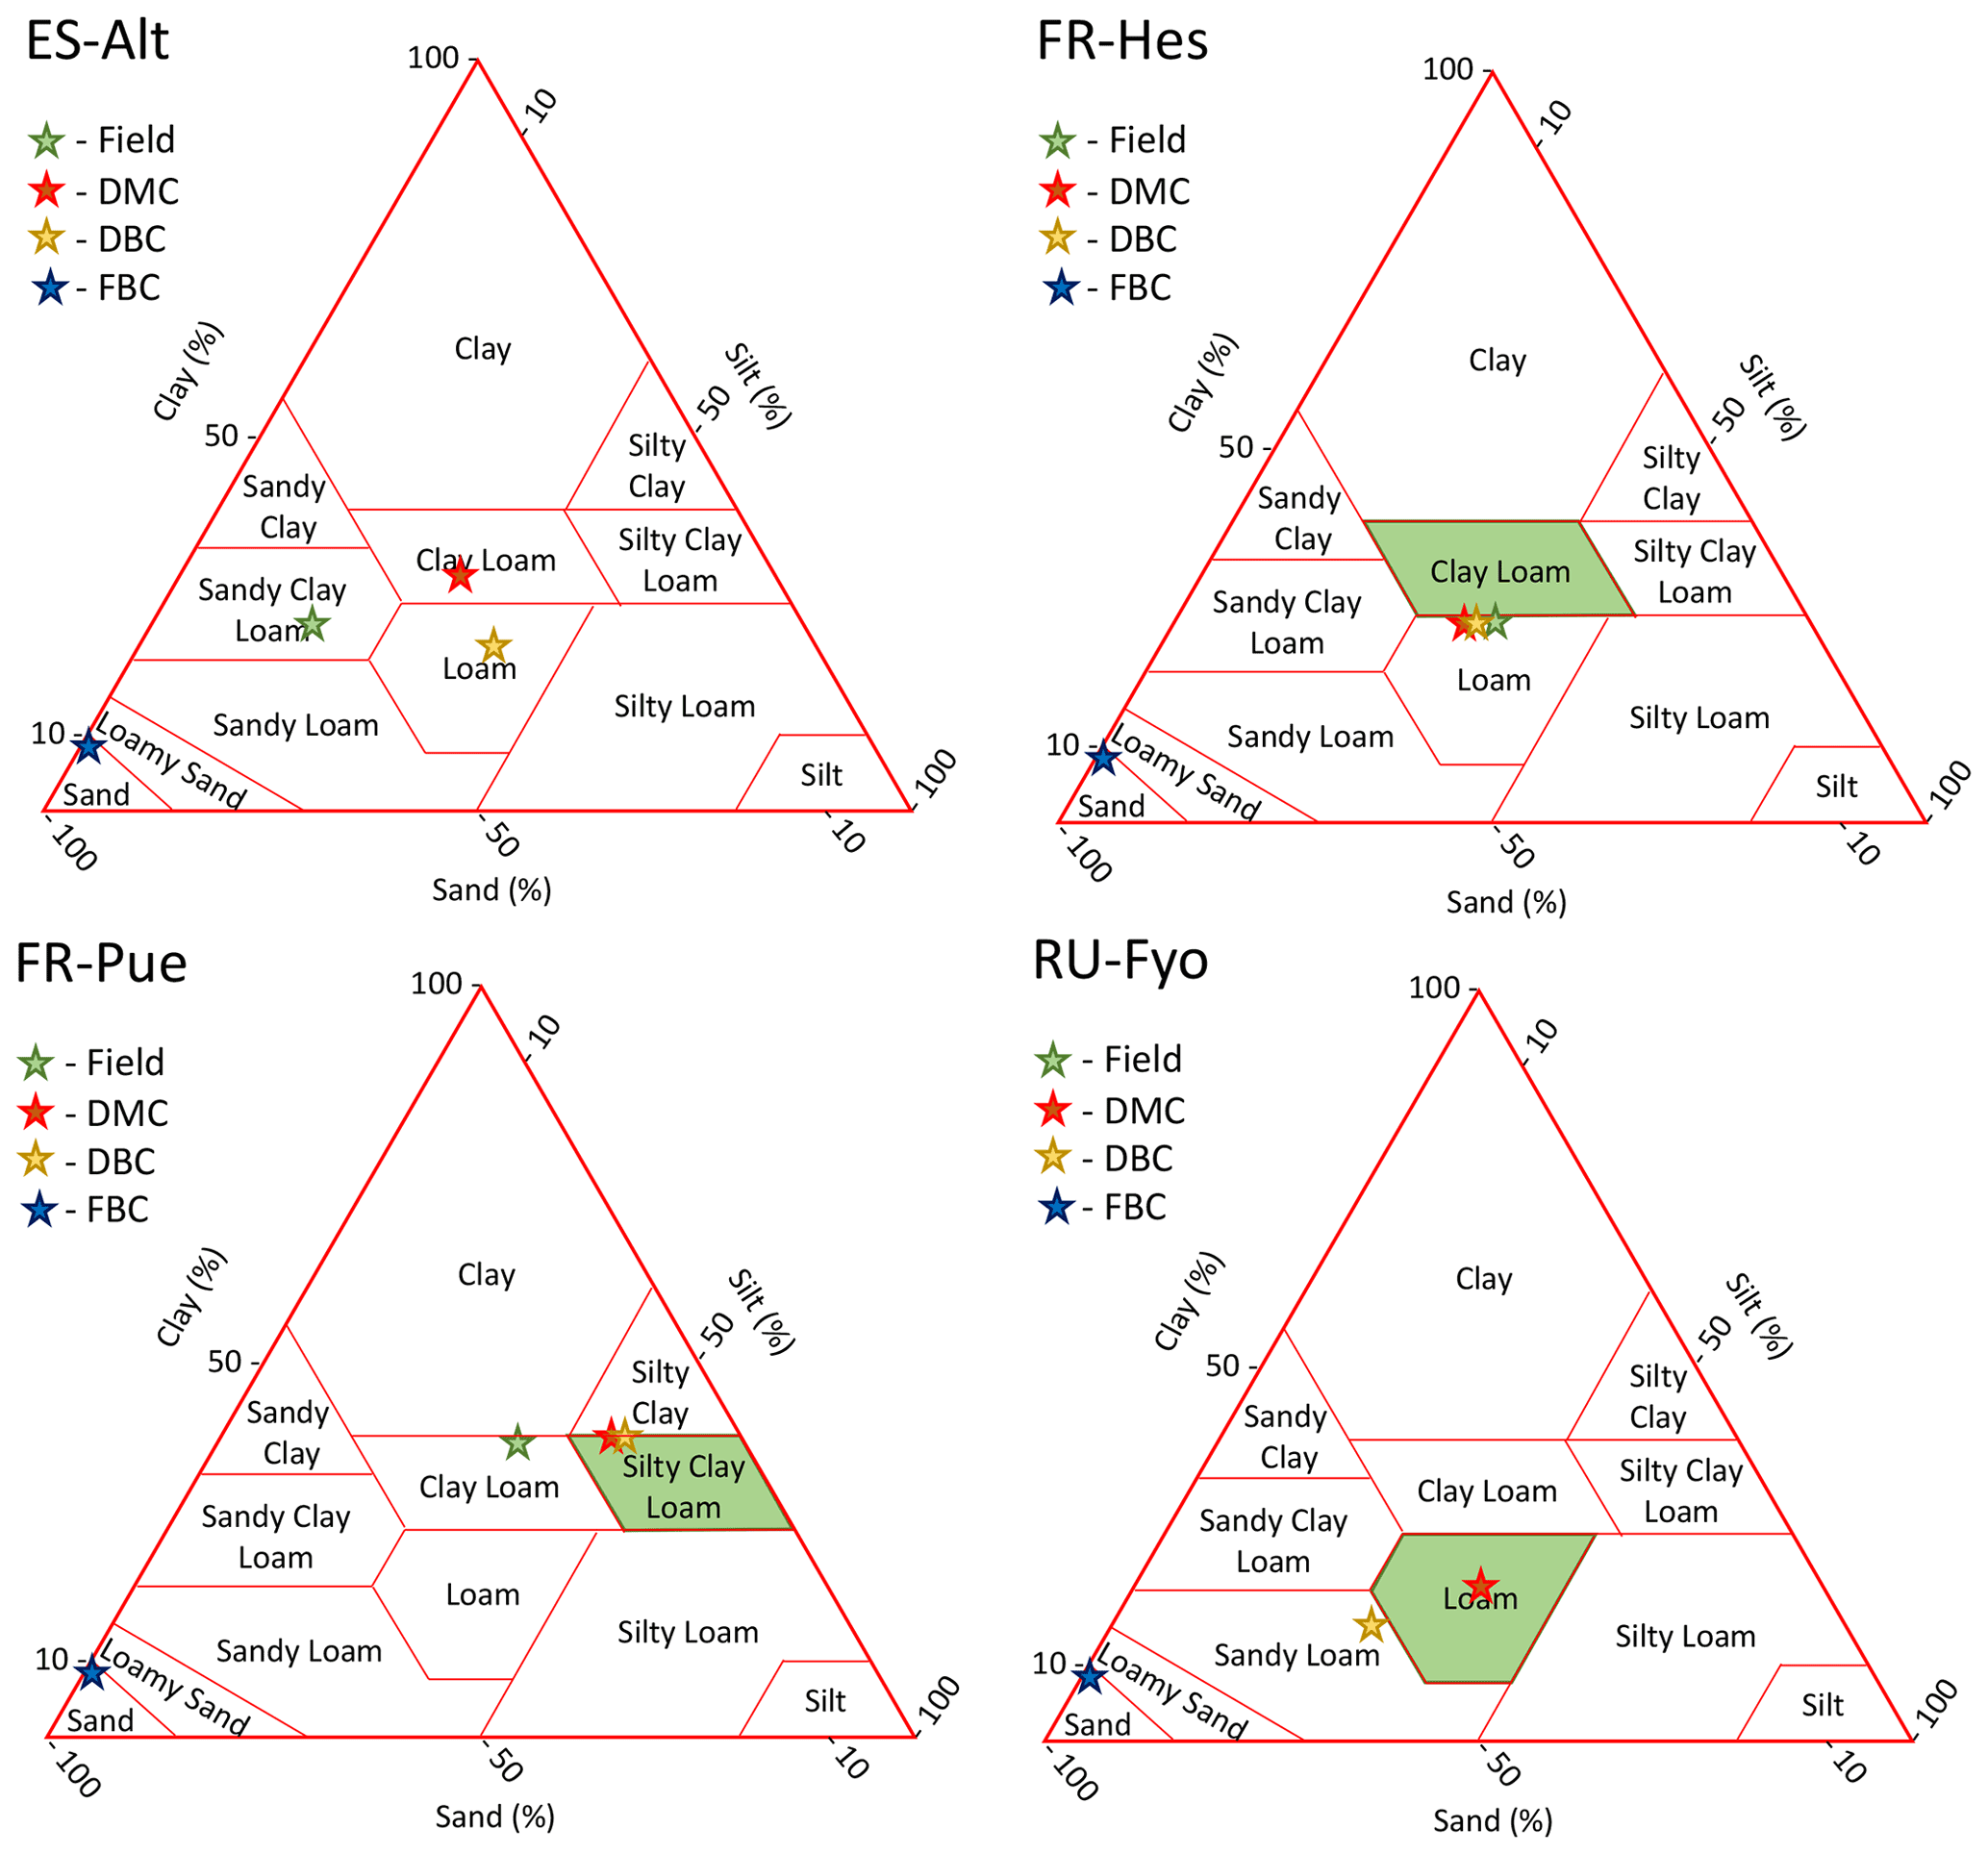
Figure A2Soil texture classification of each experimental site and model configuration. The green star and polygons highlight the experimental site classification according to the literature (the classification may differ between authors). Red, yellow, and blue stars represent the substrata classification according to the default, deeper bedrock, and fracture bedrock configurations, respectively.
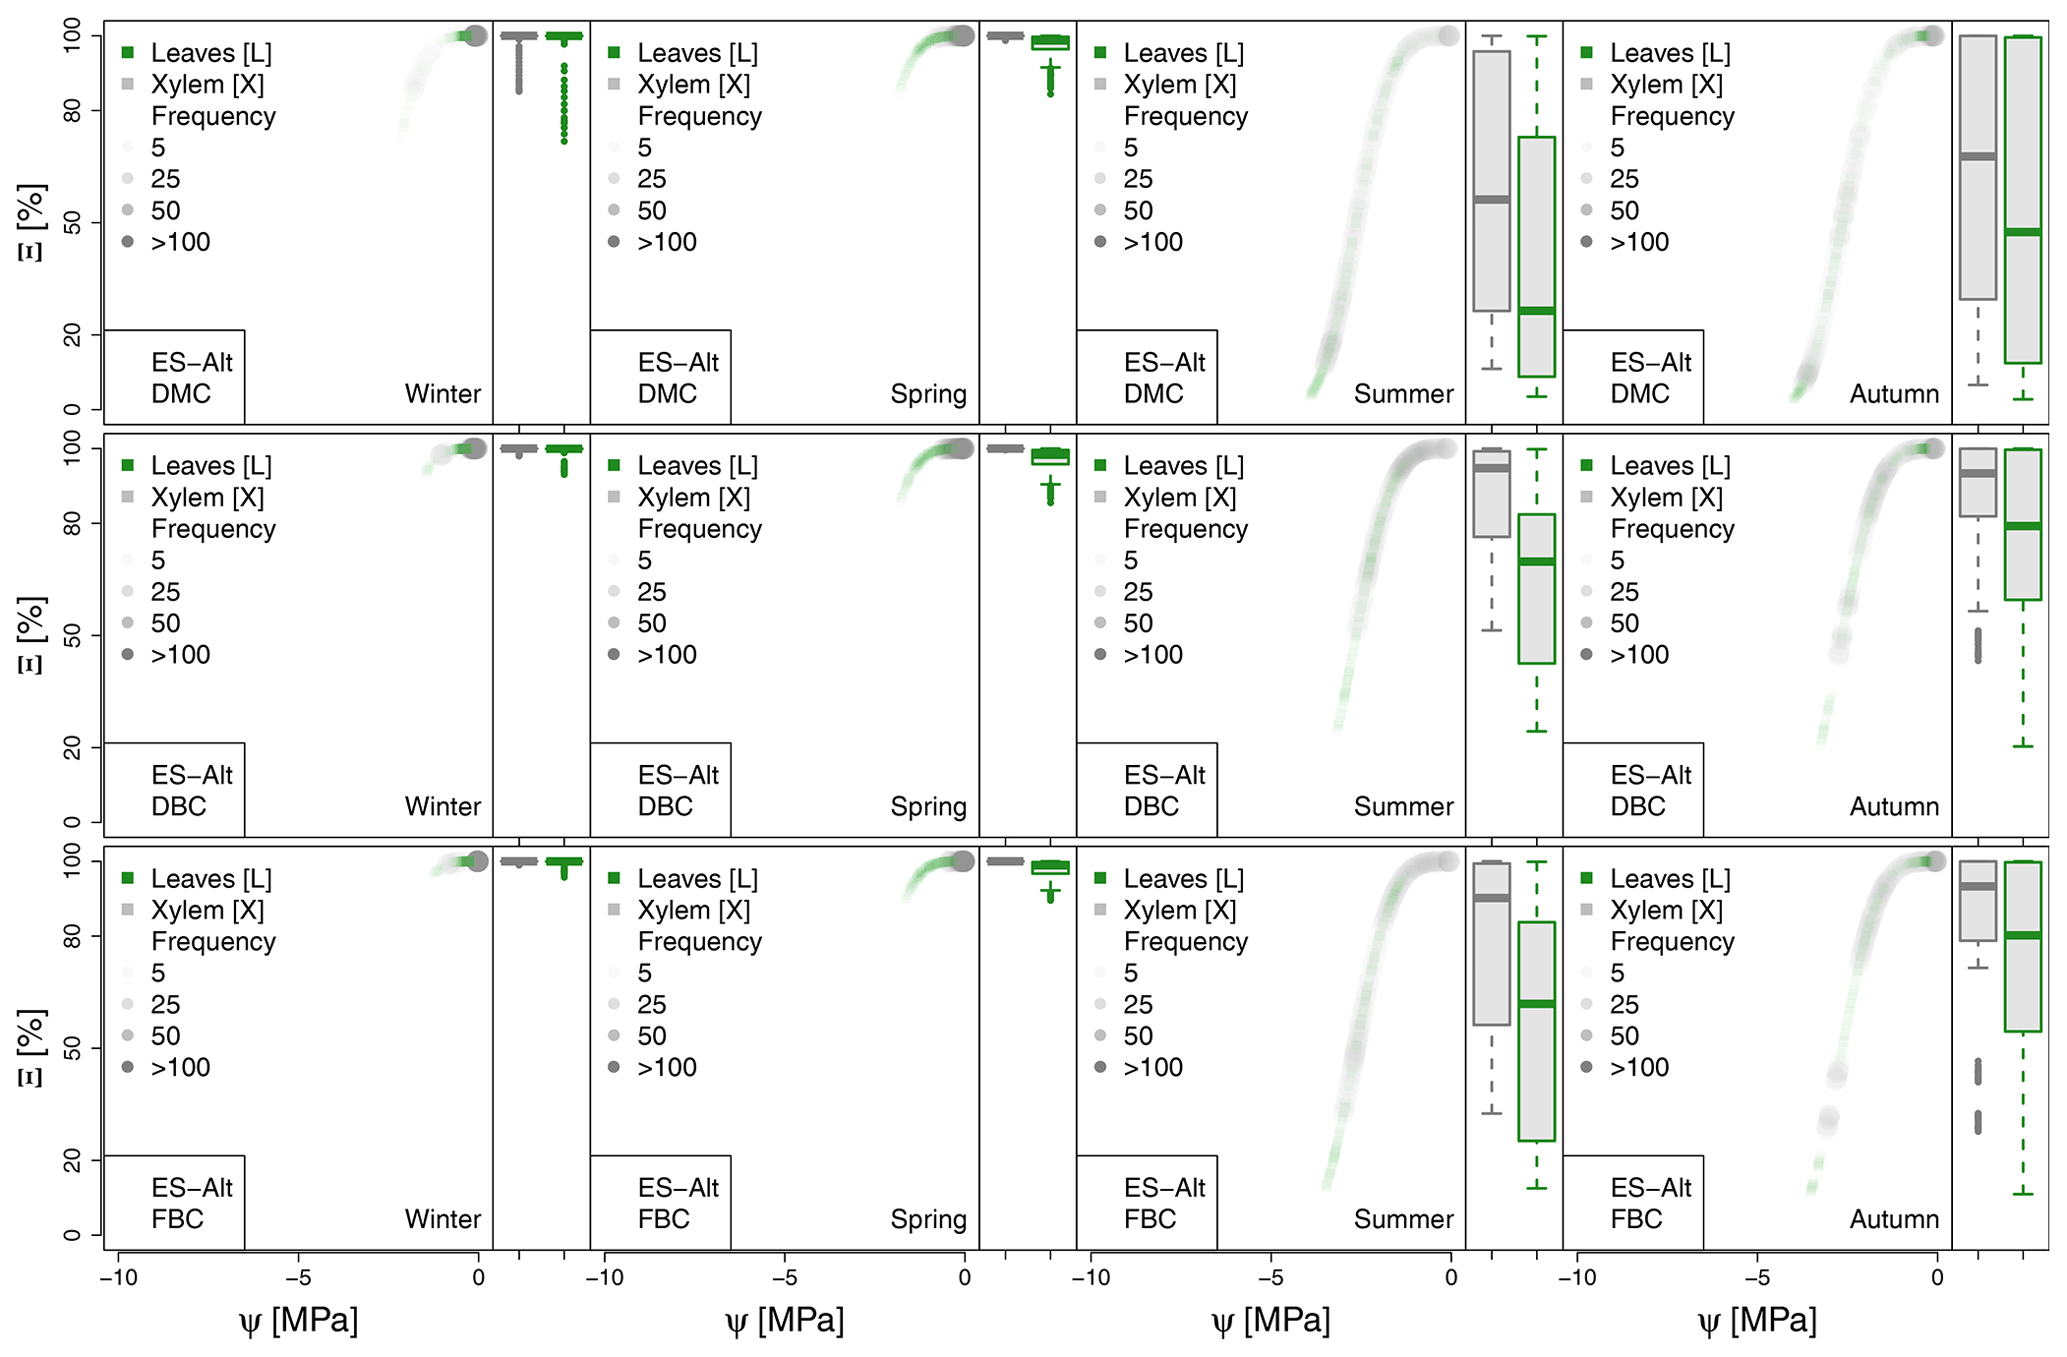
Figure A3Seasonal variation of the plant vulnerability curves describing the hydraulic stress as percentage of conductivity (Ξ) experienced by the modeled vegetation in the ES-Alt experimental site. Each plot describes the hydraulic stress experienced by stem xylem (X) and sunny leaves xylem (L).
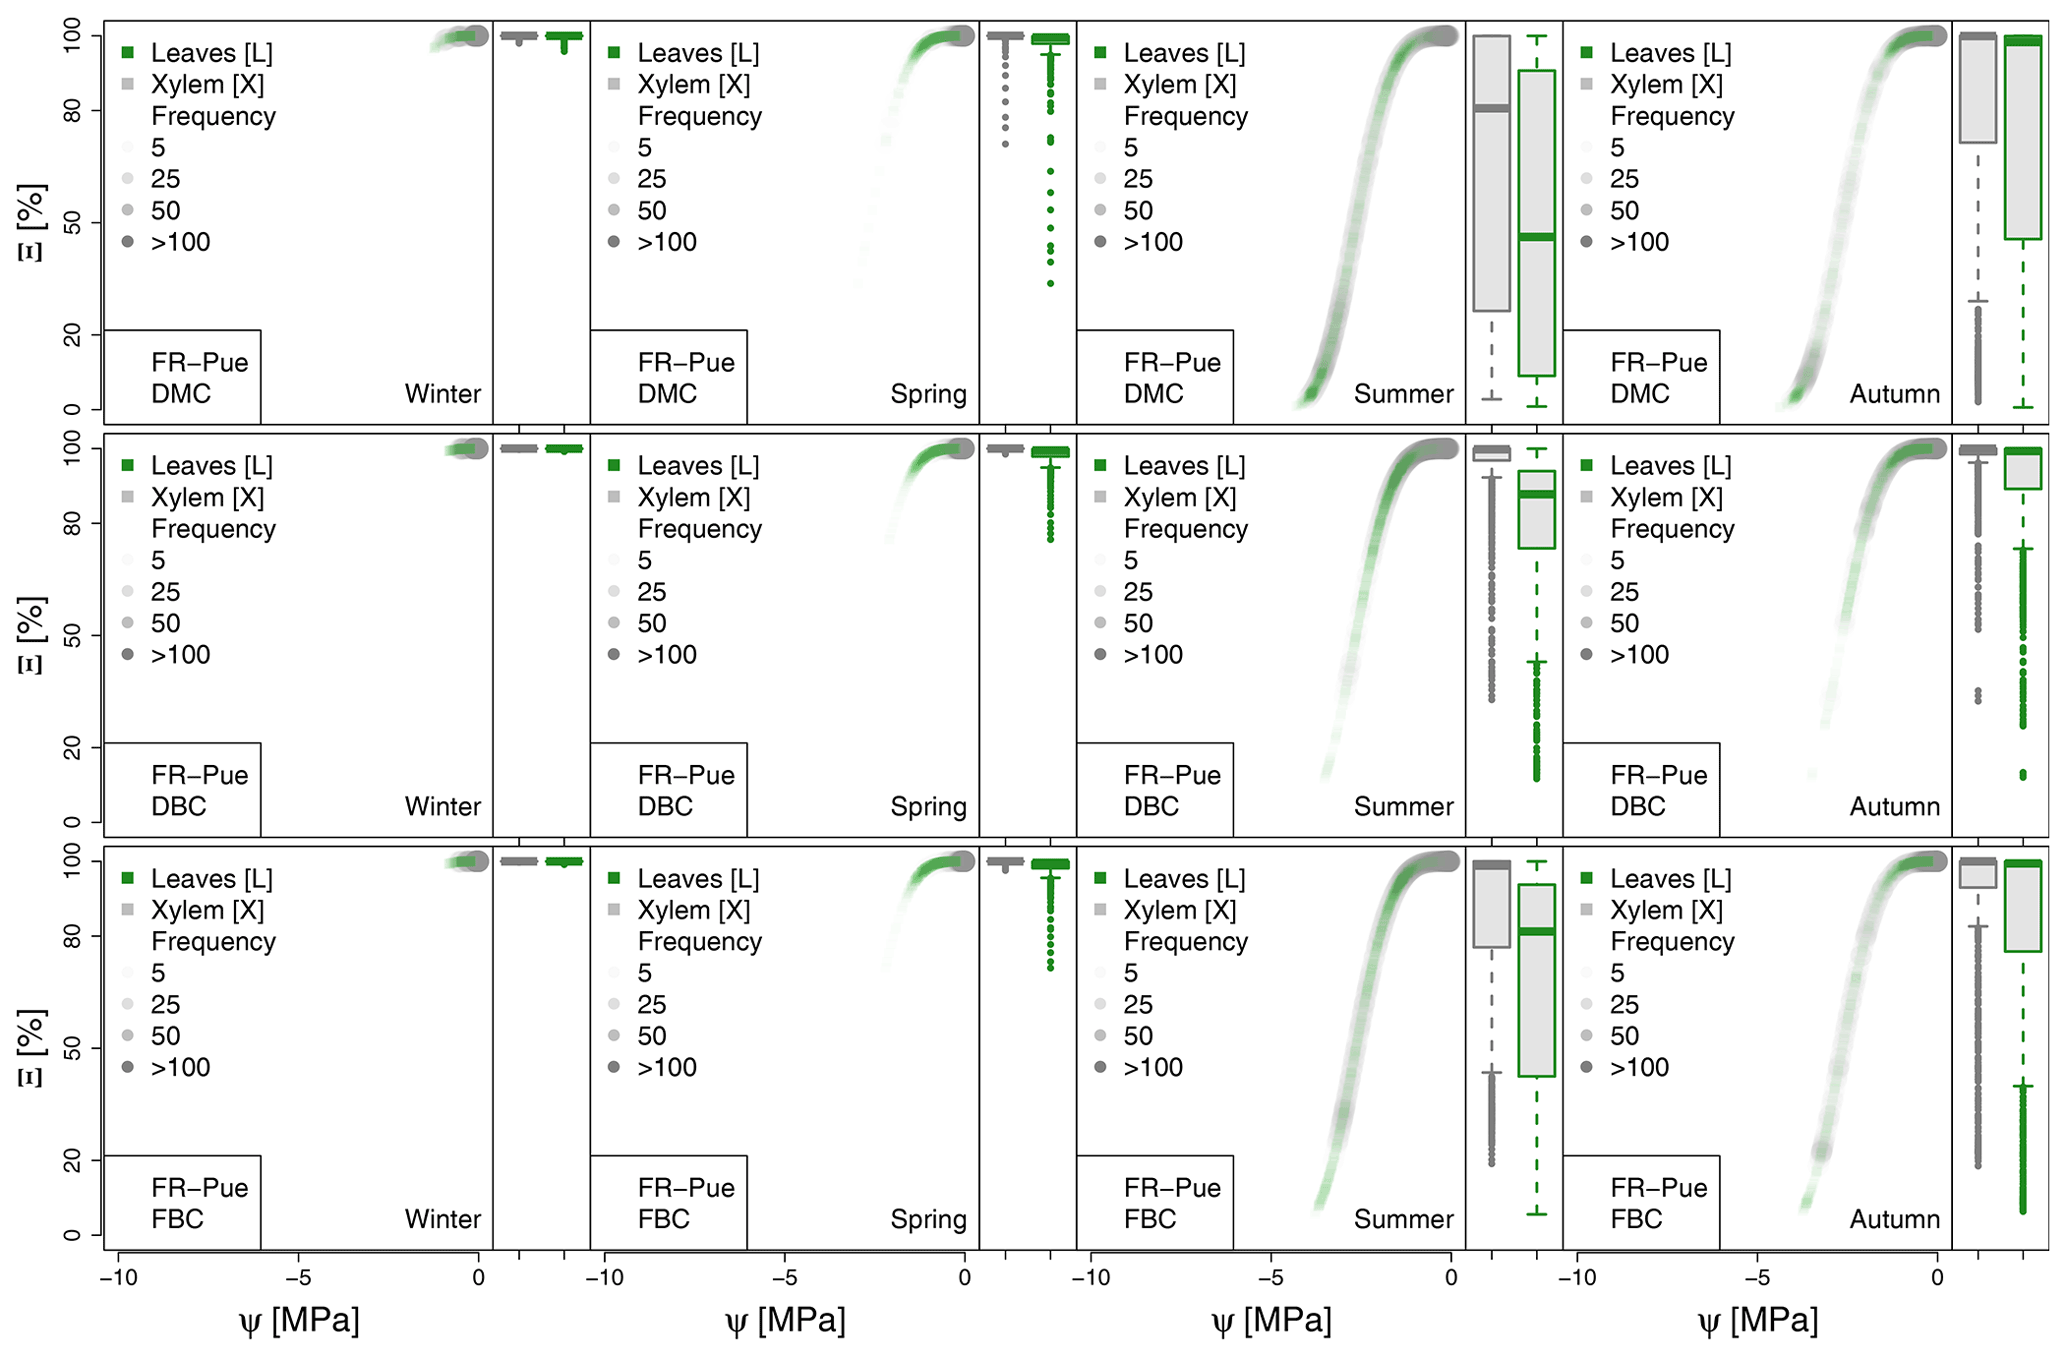
Figure A4Seasonal variation of the plant vulnerability curves describing the hydraulic stress as percentage of conductivity (Ξ) experienced by the modeled vegetation in the FR-Pue experimental site. Each plot describes the hydraulic stress experienced by stem xylem (X) and sunny leaves xylem (L).
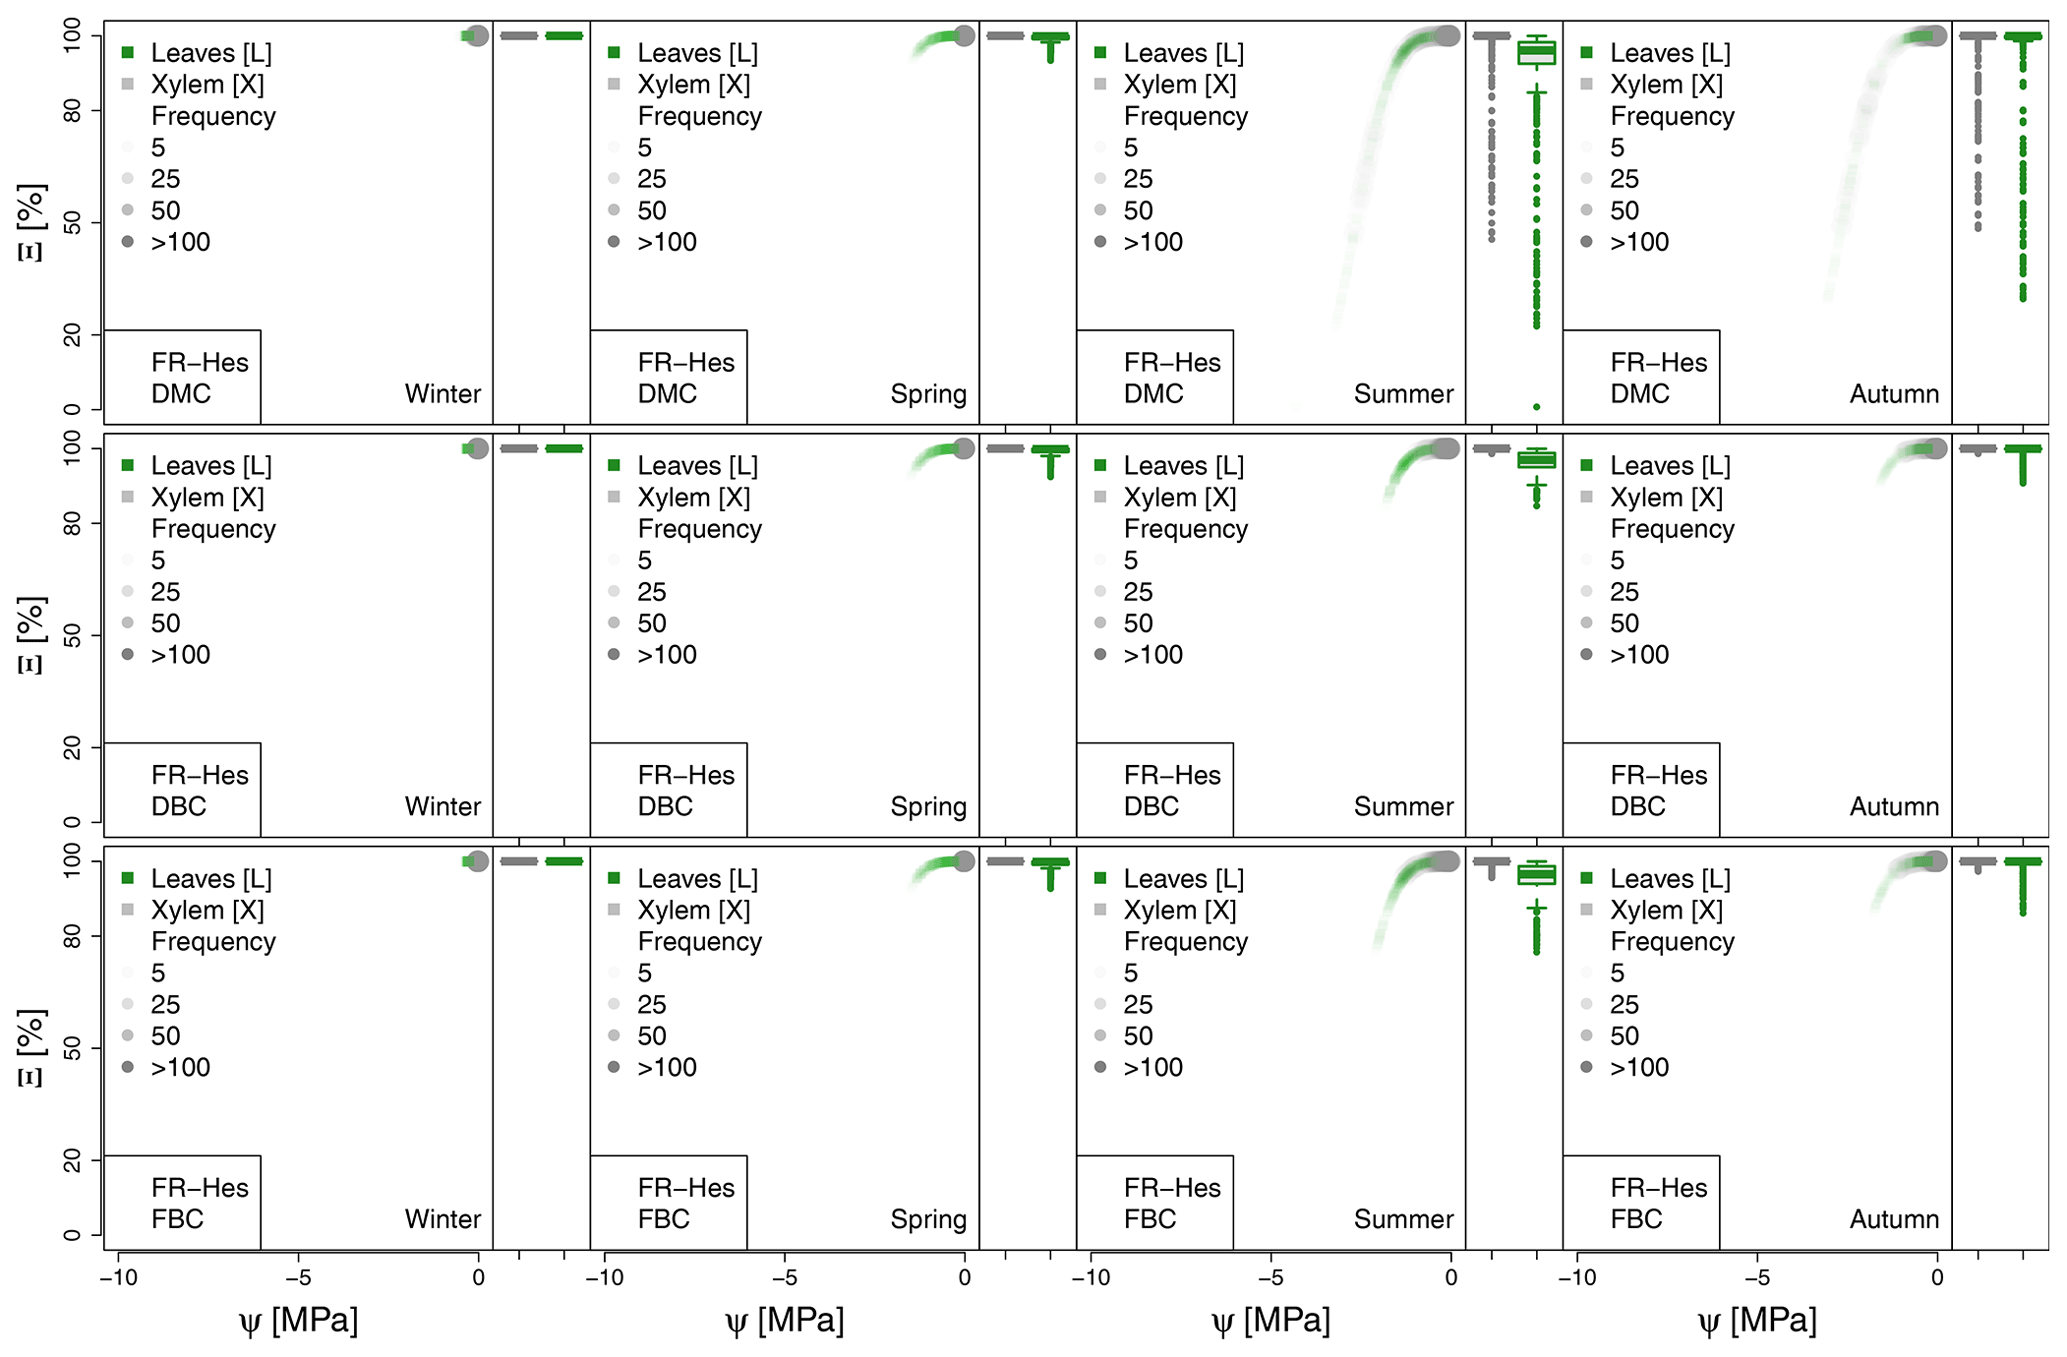
Figure A5Seasonal variation of the plant vulnerability curves describing the hydraulic stress as percentage of conductivity (Ξ) experienced by the modeled vegetation in the FR-Hes experimental site. Each plot describes the hydraulic stress experienced by stem xylem (X) and sunny leaves xylem (L).
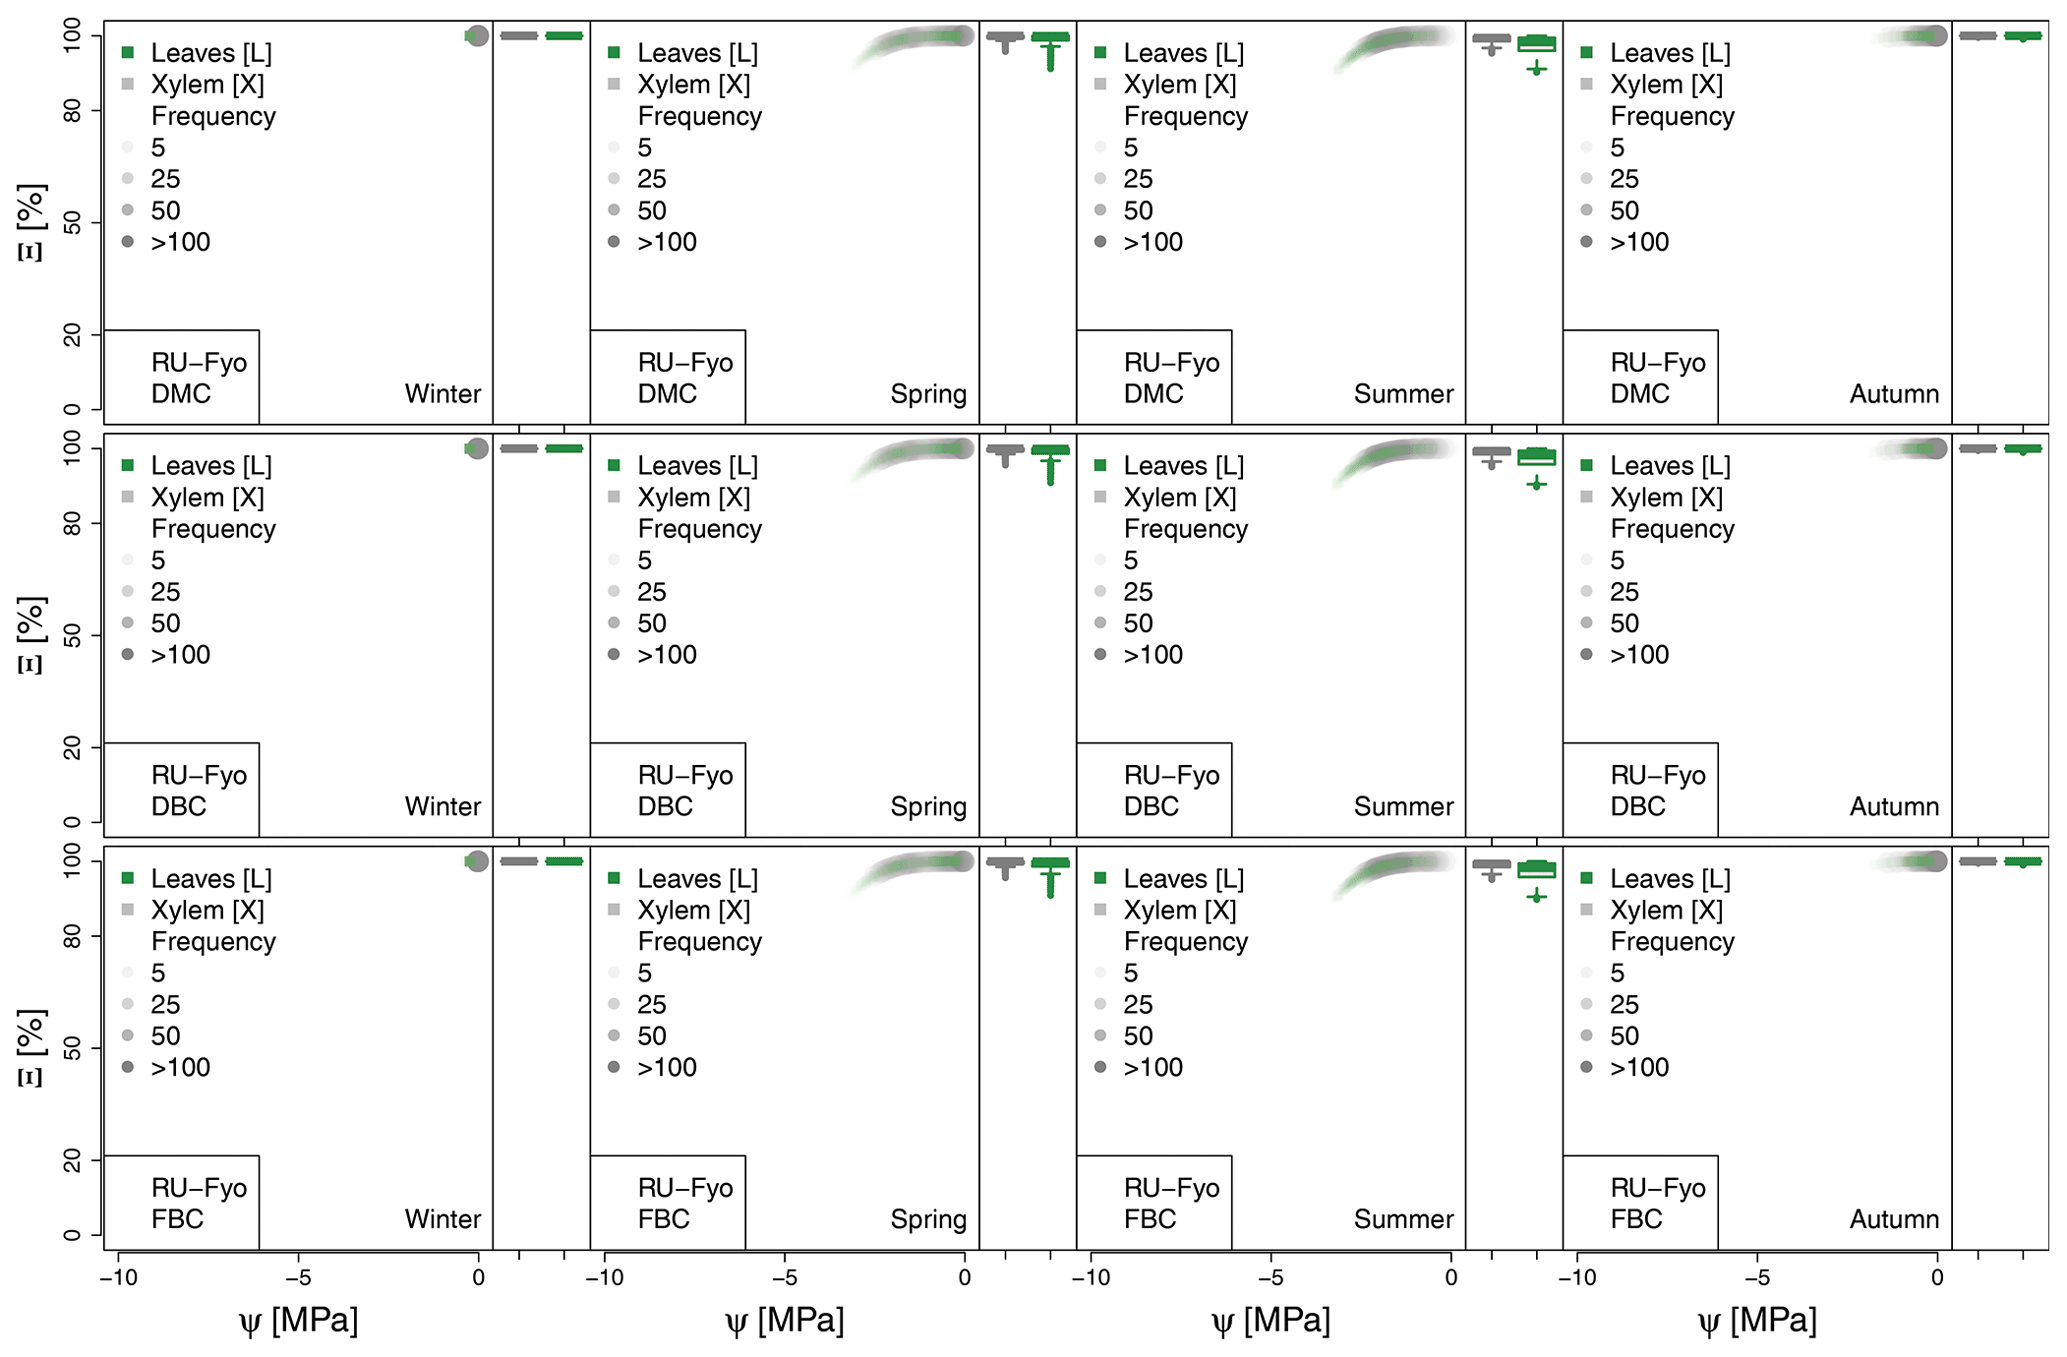
Figure A6Seasonal variation of the plant vulnerability curves describing the hydraulic stress as percentage of conductivity (Ξ) experienced by the modeled vegetation in the RU-Fyo experimental site. Each plot describes the hydraulic stress experienced by stem xylem (X) and sunny leaves xylem (L).
The R scripts used for pre-processing, post processing, and plotting the information are available from the ZENODO repository at the following link: https://doi.org/10.5281/zenodo.6778516 (Jiménez-Rodríguez, 2021).
Sap flow data are available from the ZENODO repository at the following link: https://doi.org/10.5281/zenodo.3971689 (Poyatos et al., 2020). COSMO-REA 6 data can be downloaded from the opendata FTP server at DWD at the following link: https://opendata.dwd.de/climate_environment/REA/COSMO_REA6/ (HErZ and DWD, 2020).
CDJR and MS designed the numerical experiments. CDJR carried out the numerical simulations and led the analysis with input from MS and SS. CDJR wrote the manuscript with significant contributions from MS and SS.
The contact author has declared that none of the authors has any competing interests.
Publisher’s note: Copernicus Publications remains neutral with regard to jurisdictional claims in published maps and institutional affiliations.
We thank Rosie Fisher, Steven Jansen, and Daniel Kennedy for their valuable advice.
This work is supported by the Luxembourg National Research Fund (FNR) CORE program (grant no. C19/SR/13652816/CAPACITY).
This paper was edited by Eyal Rotenberg and reviewed by two anonymous referees.
Acuña Míguez, B., Valladares, F., and Martín-Forés, I.: Both Mature Patches and Expanding Areas of Juniperus thurifera Forests Are Vulnerable to Climate Change But for Different Reasons, Forests, 11, 960, https://doi.org/10.3390/f11090960, 2020. a
Alagele, S. M., Jose, S., Anderson, S. H., and Udawatta, R. P.: Hydraulic lift: processes, methods, and practical implications for society, Agroforest. Syst., 95, 641–657, https://doi.org/10.1007/s10457-021-00614-w, 2021. a
Allard, V., Ourcival, J. M., Rambal, S., Joffre, R., and Rocheteau, A.: Seasonal and annual variation of carbon exchange in an evergreen Mediterranean forest in southern France, Glob. Change Biol., 14, 714–725, https://doi.org/10.1111/j.1365-2486.2008.01539.x, 2008. a, b, c
Allen, R. G., Pereira, L. S., Raes, D., and Smith, M.: Crop evapotranspiration-Guidelines for computing crop water requirements-FAO Irrigation and drainage paper 56, Fao, Rome, 300, 1998. a
An, N., Hemmati, S., and Cui, Y.-J.: Assessment of the methods for determining net radiation at different time-scales of meteorological variables, Journal of Rock Mechanics and Geotechnical Engineering, 9, 239–246, https://doi.org/10.1016/j.jrmge.2016.10.004, 2017. a
Angstmann, J. L., Ewers, B. E., Barber, J., and Kwon, H.: Testing transpiration controls by quantifying spatial variability along a boreal black spruce forest drainage gradient, Ecohydrology, 6, 783–793, https://doi.org/10.1002/eco.1300, 2013. a
Aranda, I., Pardos, M., Puértolas, J., Jiménez, M. D., and Pardos, J. A.: Water-use efficiency in cork oak (Quercus suber) is modified by the interaction of water and light availabilities, Tree Physiol., 27, 671–677, https://doi.org/10.1093/treephys/27.5.671, 2007. a
Arneth, A., Kurbatova, J., Kolle, O., Shibistova, O. B., Lloyd, J., Vygodskaya, N. N., and Schulze, E.-D.: Comparative ecosystem-atmosphere exchange of energy and mass in a European Russian and a central Siberian bog II. Interseasonal and interannual variability of CO2 fluxes, Tellus B, 54, 514, https://doi.org/10.3402/tellusb.v54i5.16684, 2002. a, b
Aroca, R.: Plant responses to drought stress, edited by: Aroca, R., Springer-Verlag, Berlin, https://doi.org/10.1007/978-3-642-32653-0, 2012. a
Baldocchi, D. D., Ma, S., Rambal, S., Misson, L., Ourcival, J.-M., Limousin, J.-M., Pereira, J., and Papale, D.: On the differential advantages of evergreenness and deciduousness in mediterranean oak woodlands: a flux perspective, Ecol. Appl., 20, 1583–1597, https://doi.org/10.1890/08-2047.1, 2010. a, b
Barbeta, A., Mejía-Chang, M., Ogaya, R., Voltas, J., Dawson, T. E., and Peñuelas, J.: The combined effects of a long-term experimental drought and an extreme drought on the use of plant-water sources in a Mediterranean forest, Glob. Change Biol., 21, 1213–1225, https://doi.org/10.1111/gcb.12785, 2015. a, b
Bayala, J. and Prieto, I.: Water acquisition, sharing and redistribution by roots: applications to agroforestry systems, Plant Soil, 453, 17–28, https://doi.org/10.1007/s11104-019-04173-z, 2020. a
Beck, H. E., Zimmermann, N. E., McVicar, T. R., Vergopolan, N., Berg, A., and Wood, E. F.: Present and future Köppen-Geiger climate classification maps at 1-km resolution, Sci. Data, 5, 1–12, https://doi.org/10.1038/sdata.2018.214, 2018. a
Betsch, P., Bonal, D., Bréda, N., Montpied, P., Peiffer, M., Tuzet, A., and Granier, A.: Drought effects on water relations in beech: the contribution of exchangeable water reservoirs, Agr. Forest Meteorol., 151, 531–543, https://doi.org/10.1016/j.agrformet.2010.12.008, 2011. a, b, c
Blyth, E. M., Arora, V. K., Clark, D. B., Dadson, S. J., De Kauwe, M. G., Lawrence, D. M., Melton, J. R., Pongratz, J., Turton, R. H., Yoshimura, K., and Yuan, H.: Advances in land surface modelling, Current Climate Change Reports, 7, 45–71, https://doi.org/10.1007/s40641-021-00171-5, 2021. a
Bollmeyer, C., Keller, J. D., Ohlwein, C., Wahl, S., Crewell, S., Friederichs, P., Hense, A., Keune, J., Kneifel, S., Pscheidt, I., Redl, S., and Steinke, S.: Towards a high-resolution regional reanalysis for the European CORDEX domain, Q. J. Roy. Meteor. Soc., 141, 1–15, https://doi.org/10.1002/qj.2486, 2015. a
Bonan, G. B., Levis, S., Kergoat, L., and Oleson, K. W.: Landscapes as patches of plant functional types: An integrating concept for climate and ecosystem models, Global Biogeochem. Cy., 16, 5-1–5-23, https://doi.org/10.1029/2000GB001360, 2002. a
Bonan, G. B., Williams, M., Fisher, R. A., and Oleson, K. W.: Modeling stomatal conductance in the earth system: linking leaf water-use efficiency and water transport along the soil–plant–atmosphere continuum, Geosci. Model Dev., 7, 2193–2222, https://doi.org/10.5194/gmd-7-2193-2014, 2014. a
Brunke, M. A., Broxton, P., Pelletier, J., Gochis, D., Hazenberg, P., Lawrence, D. M., Leung, L. R., Niu, G.-Y., Troch, P. A., and Zeng, X.: Implementing and evaluating variable soil thickness in the Community Land Model, version 4.5 (CLM4. 5), J. Climate, 29, 3441–3461, https://doi.org/10.1175/JCLI-D-15-0307.1, 2016. a
Cabon, A., Mouillot, F., Lempereur, M., Ourcival, J.-M., Simioni, G., and Limousin, J.-M.: Thinning increases tree growth by delaying drought-induced growth cessation in a Mediterranean evergreen oak coppice, Forest Ecol. Manage., 409, 333–342, https://doi.org/10.1016/j.foreco.2017.11.030, 2018. a
Cai, G., Carminati, A., Abdalla, M., and Ahmed, M. A.: Soil textures rather than root hairs dominate water uptake and soil-plant hydraulics under drought, Plant Physiol., 187, 858–872, https://doi.org/10.1093/plphys/kiab271, 2021. a
Campoy, A., Ducharne, A., Cheruy, F., Hourdin, F., Polcher, J., and Dupont, J. C.: Response of land surface fluxes and precipitation to different soil bottom hydrological conditions in a general circulation model, J. Geophys. Res.-Atmos., 118, 10725–10739, https://doi.org/10.1002/jgrd.50627, 2013. a
Carcavilla, L., Ruiz, R., and Rodríguez, E.: Guía Geológica del Parque Natural del Alto Tajo, Instituto Geológico y Minero de España, Organismo Autónomo Parques Nacionales, 1st Edn., Madrid, 267 pp., 2008. a, b
Carminati, A. and Javaux, M.: Soil Rather Than Xylem Vulnerability Controls Stomatal Response to Drought, Trends Plant Sci., 25, 868–880, https://doi.org/10.1016/j.tplants.2020.04.003, 2020. a
Carrière, S. D., Martin-StPaul, N. K., Cakpo, C. B., Patris, N., Gillon, M., Chalikakis, K., Doussan, C., Olioso, A., Babic, M., Jouineau, A., Simioni, G., and Davi, H.: The role of deep vadose zone water in tree transpiration during drought periods in karst settings – Insights from isotopic tracing and leaf water potential, Sci. Total Environ., 699, 134332, https://doi.org/10.1016/j.scitotenv.2019.134332, 2020. a, b, c
Chadburn, S. E., Burke, E. J., Essery, R. L. H., Boike, J., Langer, M., Heikenfeld, M., Cox, P. M., and Friedlingstein, P.: Impact of model developments on present and future simulations of permafrost in a global land-surface model, The Cryosphere, 9, 1505–1521, https://doi.org/10.5194/tc-9-1505-2015, 2015. a
Chitra-Tarak, R., Xu, C., Aguilar, S., Anderson-Teixeira, K. J., Chambers, J., Detto, M., Faybishenko, B., Fisher, R. A., Knox, R. G., Koven, C. D., Kueppers, L. M., Kunert, N., Kupers, S. J., McDowell, N. G., Newman, B. D., Paton, S. R., Pérez, R., Ruiz, L., Sack, L., Warren, J. M., Wolfe, B. T., Wright, C., Wright, S. J., Zailaa, J., and McMahon, S. M.: Hydraulically-vulnerable trees survive on deep-water access during droughts in a tropical forest, New Phytol., 231, 1798–1813, https://doi.org/10.1111/nph.17464, 2021. a
Choat, B., Jansen, S., Brodribb, T., Cochard, H., Delzon, S., Bhaskar, R., Bucci, S., Feild, T., Gleason, S., Hacke, U., Jacobsen, A., Lens, F., Maherali, H., Martinez-Vilalta, J., Mayr, S., Mencuccini, M., Mitchell, P., Nardini, A., Pittermann, J., Pratt, R., Sperry, J., Westoby, M., Wright, I., and Zanne, A.: Global convergence in the vulnerability of forests to drought, 491, 752–755, https://doi.org/10.1038/nature11688, 2012. a
Choi, H. I., Liang, X.-Z., and Kumar, P.: A Conjunctive Surface–Subsurface Flow Representation for Mesoscale Land Surface Models, J. Hydrometeorol., 14, 1421–1442, https://doi.org/10.1175/JHM-D-12-0168.1, 2013. a
Cipolla, G., Calabrese, S., Noto, L. V., and Porporato, A.: The role of hydrology on enhanced weathering for carbon sequestration I. Modeling rock-dissolution reactions coupled to plant, soil moisture, and carbon dynamics, Adv. Water Resour., 154, 103934, https://doi.org/10.1016/j.advwatres.2021.103934, 2021. a
David, T. S., Henriques, M. O., Kurz-Besson, C., Nunes, J., Valente, F., Vaz, M., Pereira, J. S., Siegwolf, R., Chaves, M. M., Gazarini, L. C., and David, J. S.: Water-use strategies in two co-occurring Mediterranean evergreen oaks: surviving the summer drought, Tree Physiol., 27, 793–803, https://doi.org/10.1093/treephys/27.6.793, 2007. a
David, T. S., Pinto, C. A., Nadezhdina, N., Kurz-Besson, C., Henriques, M. O., Quilhó, T., Cermak, J., Chaves, M. M., Pereira, J. S., and David, J. S.: Root functioning, tree water use and hydraulic redistribution in Quercus suber trees: A modeling approach based on root sap flow, Forest Ecol. Manag., 307, 136–146, https://doi.org/10.1016/j.foreco.2013.07.012, 2013. a, b
Davison, J. H., Hwang, H.-T., Sudicky, E. A., and Lin, J. C.: Coupled atmospheric, land surface, and subsurface modeling: Exploring water and energy feedbacks in three-dimensions, Adv. Water Resour., 86, 73–85, https://doi.org/10.1016/j.advwatres.2015.09.002, 2015. a
de Rosnay, P. and Polcher, J.: Modelling root water uptake in a complex land surface scheme coupled to a GCM, Hydrol. Earth Syst. Sci., 2, 239–255, https://doi.org/10.5194/hess-2-239-1998, 1998. a
Ding, Y., Nie, Y., Chen, H., Wang, K., and Querejeta, J. I.: Water uptake depth is coordinated with leaf water potential, water-use efficiency and drought vulnerability in karst vegetation, New Phytol., 229, 1339–1353, https://doi.org/10.1111/nph.16971, 2021. a, b, c
Duque, J. M., Nicolau, J., Moreno, C. M., Sánchez, L., de la Cova, R. R. L., Sanz, M., and Lucía, A.: Geomorfología y gestión del Parque Natural del Alto Tajo (1). Condicionantes y criterios geomorfológicos para la restauración de minas de caolín, in: Trabajos de geomorfología en España, 2006–2008. Actas de la X Reunión Nacional de Geomorfología. Cádiz, Spain, 14–19 September 2008, 459–462, 2008. a
Duveiller, G., Fasbender, D., and Meroni, M.: Revisiting the concept of a symmetric index of agreement for continuous datasets, Sci. Rep.-UK, 6, 19401, https://doi.org/10.1038/srep19401, 2016. a
Duveiller, G., Hooker, J., and Cescatti, A.: The mark of vegetation change on Earth’s surface energy balance, Nat. Commun., 9, 1–12, https://doi.org/10.1038/s41467-017-02810-8, 2018. a
Epron, D., Ngao, J., and Granier, A.: Interannual variation of soil respiration in a beech forest ecosystem over a six-year study, Ann. For. Sci., 61, 499–505, https://doi.org/10.1051/forest:2004044, 2004. a
Fan, Y., Miguez-Macho, G., Jobbágy, E. G., Jackson, R. B., and Otero-Casal, C.: Hydrologic regulation of plant rooting depth, P. Natl. Acad. Sci. USA, 114, 10572–10577, https://doi.org/10.1073/pnas.1712381114, 2017. a, b, c
Fan, Y., Clark, M., Lawrence, D. M., Swenson, S., Band, L. E., Brantley, S. L., Brooks, P. D., Dietrich, W. E., Flores, A., Grant, G., Kirchner, J. W., Mackay, D. S., McDonnell, J. J., Milly, P. C. D., Sullivan, P. L., Tague, C., Ajami, H., Chaney, N., Hartmann, A., Hazenberg, P., McNamara, J., Pelletier, J., Perket, J., Rouholahnejad-Freund, E., Wagener, T., Zeng, X., Beighley, E., Buzan, J., Huang, M., Livneh, B., Mohanty, B. P., Nijssen, B., Safeeq, M., Shen, C., van Verseveld, W., Volk, J., and Yamazaki, D.: Hillslope Hydrology in Global Change Research and Earth System Modeling, Water Resour. Res., 55, 1737–1772, https://doi.org/10.1029/2018WR023903, 2019. a
Felfelani, F., Lawrence, D. M., and Pokhrel, Y.: Representing Intercell Lateral Groundwater Flow and Aquifer Pumping in the Community Land Model, Water Resour. Res., 57, e2020WR027531, https://doi.org/10.1029/2020WR027531, 2021. a
Fisher, R. A. and Koven, C. D.: Perspectives on the Future of Land Surface Models and the Challenges of Representing Complex Terrestrial Systems, J. Adv. Model. Earth Sy., 12, e2018MS001453, https://doi.org/10.1029/2018MS001453, 2020. a
Forner, A., Aranda, I., Granier, A., and Valladares, F.: Differential impact of the most extreme drought event over the last half century on growth and sap flow in two coexisting Mediterranean trees, Plant Ecol., 215, 703–709, https://doi.org/10.1007/s11258-014-0351-x, 2014. a
Forner, A., Valladares, F., and Aranda, I.: Mediterranean trees coping with severe drought: Avoidance might not be safe, Environ. Exp. Bot., 155, 529–540, https://doi.org/10.1016/j.envexpbot.2018.08.006, 2018. a, b, c
Forzieri, G., Miralles, D. G., Ciais, P., Alkama, R., Ryu, Y., Duveiller, G., Zhang, K., Robertson, E., Kautz, M., Martens, B., Jiang, C., Arneth, A., Georgievski, G., Li, W., Ceccherini, G., Anthoni, P., Lawrence, P., Wiltshire, A., Pongratz, J., Piao, S., Sitch, S., Goll, D. S., Arora, V. K., Lienert, S., Lombardozzi, D., Kato, E., Nabel, J. E. M. S., Tian, H., Friedlingstein, P., and Cescatti, A.: Increased control of vegetation on global terrestrial energy fluxes, Nat. Clim. Change, 10, 356–362, https://doi.org/10.1038/s41558-020-0717-0, 2020. a
Gil-Pelegrín, E., Peguero-Pina, J. J., and Sancho-Knapik, D. (Eds.): Oaks physiological ecology. Exploring the functional diversity of genus Quercus L., Springer, https://doi.org/10.1007/978-3-319-69099-5, 2017. a, b
Graham, R. C., Rossi, A. M., and Hubbert, K. R.: Rock to regolith conversion: Producing hospitable substrates for terrestrial ecosystems, GSA today, 20, 4–9, https://doi.org/10.1130/GSAT57A.1, 2010. a
Granda, E., Escudero, A., de la Cruz, M., and Valladares, F.: Juvenile–adult tree associations in a continental Mediterranean ecosystem: no evidence for sustained and general facilitation at increased aridity, J. Veg. Sci., 23, 164–175, https://doi.org/10.1111/j.1654-1103.2011.01343.x, 2012. a, b
Granier, A., Biron, P., and Lemoine, D.: Water balance, transpiration and canopy conductance in two beech stands, Agr. Forest Meteorol., 100, 291–308, https://doi.org/10.1016/S0168-1923(99)00151-3, 2000a. a, b, c, d
Granier, A., Ceschia, E., Damesin, C., Dufrêne, E., Epron, D., Gross, P., Lebaube, S., Le Dantec, V., Le Goff, N., Lemoine, D., Lucot, E., Ottorini, J. M., Pontailler, J. Y., and Saugier, B.: The carbon balance of a young Beech forest, Funct. Ecol., 14, 312–325, https://doi.org/10.1046/j.1365-2435.2000.00434.x, 2000b. a, b, c
Granier, A., Reichstein, M., Bréda, N., Janssens, I., Falge, E., Ciais, P., Grünwald, T., Aubinet, M., Berbigier, P., Bernhofer, C., Buchmann, N., Facini, O., Grassi, G., Heinesch, B., Ilvesniemi, H., Keronen, P., Knohl, A., Köstner, B., Lagergren, F., Lindroth, A., Longdoz, B., Loustau, D., Mateus, J., Montagnani, L., Nys, C., Moors, E., Papale, D., Peiffer, M., Pilegaard, K., Pita, G., Pumpanen, J., Rambal, S., Rebmann, C., Rodrigues, A., Seufert, G., Tenhunen, J., Vesala, T., and Wang, Q.: Evidence for soil water control on carbon and water dynamics in European forests during the extremely dry year: 2003, Agr. Forest Meteorol., 143, 123–145, https://doi.org/10.1016/j.agrformet.2006.12.004, 2007. a, b
Granier, A., Bréda, N., Longdoz, B., Gross, P., and Ngao, J.: Ten years of fluxes and stand growth in a young beech forest at Hesse, North-eastern France, Ann. For. Sci., 65, 704, https://doi.org/10.1051/forest:2008052, 2008. a
Grillakis, M. G.: Increase in severe and extreme soil moisture droughts for Europe under climate change, Sci. Total Environ., 660, 1245–1255, https://doi.org/10.1016/j.scitotenv.2019.01.001, 2019. a
Grossiord, C., Forner, A., Gessler, A., Granier, A., Pollastrini, M., Valladares, F., and Bonal, D.: Influence of species interactions on transpiration of Mediterranean tree species during a summer drought, Eur. J. For. Res., 134, 365–376, https://doi.org/10.1007/s10342-014-0857-8, 2015. a, b
Grossiord, C., Sevanto, S., Limousin, J.-M., Meir, P., Mencuccini, M., Pangle, R. E., Pockman, W. T., Salmon, Y., Zweifel, R., and McDowell, N. G.: Manipulative experiments demonstrate how long-term soil moisture changes alter controls of plant water use, Environ. Exp. Bot., 152, 19–27, https://doi.org/10.1016/j.envexpbot.2017.12.010, 2018. a
Gupta, A., Rico-Medina, A., and Caño-Delgado, A. I.: The physiology of plant responses to drought, Science, 368, 266–269, https://doi.org/10.1126/science.aaz7614, 2020. a
Hahm, W. J., Riebe, C. S., Lukens, C. E., and Araki, S.: Bedrock composition regulates mountain ecosystems and landscape evolution, P. Natl. Acad. Sci. USA, 111, 3338–3343, https://doi.org/10.1073/pnas.1315667111, 2014. a
Hahm, W. J., Rempe, D. M., Dralle, D. N., Dawson, T. E., and Dietrich, W. E.: Oak Transpiration Drawn From the Weathered Bedrock Vadose Zone in the Summer Dry Season, Water Resour. Res., 56, e2020WR027419, https://doi.org/10.1029/2020WR027419, 2020. a, b
He, X., Pan, M., Wei, Z., Wood, E. F., and Sheffield, J.: A global drought and flood catalogue from 1950 to 2016, B. Am. Meteorol. Soc., 101, E508–E535, https://doi.org/10.1175/BAMS-D-18-0269.1, 2020. a
HErZ and DWD: HErZ – Hans-Ertel Centre for Weather Research (University of Bonn, Germany) and DWD – Deutscher Wetterdienst: COSMO-REA6, http://reanalysis.meteo.uni-bonn.de/?COSMO-REA6 and https://opendata.dwd.de/climate_environment/REA/COSMO_REA6/ (last access: 1 October 2021), 2020. a
Holbrook, W. S., Riebe, C. S., Elwaseif, M., Hayes, J. L., Basler-Reeder, K., Harry, D. L., Malazian, A., Dosseto, A., Hartsough, P. C., and Hopmans, J. W.: Geophysical constraints on deep weathering and water storage potential in the Southern Sierra Critical Zone Observatory, Earth Surf. Proc. Land., 39, 366–380, https://doi.org/10.1002/esp.3502, 2014. a
Hosseinzadehtalaei, P., Tabari, H., and Willems, P.: Climate change impact on short-duration extreme precipitation and intensity–duration–frequency curves over Europe, J. Hydrol., 590, 125249, https://doi.org/10.1016/j.jhydrol.2020.125249, 2020. a
Hu, H., Li, F. L., McCormack, M. L., Huang, L., and Bao, W. K.: Functionally divergent growth, biomass allocation and root distribution of two xerophytic species in response to varying soil rock fragment content, Plant Soil, 463, 265–277, https://doi.org/10.1007/s11104-021-04906-z, 2021. a
Hubbert, K., Beyers, J., and Graham, R.: Roles of weathered bedrock and soil in seasonal water relations of Pinus jeffreyi and Arctostaphylos patula, Can. J. Forest Res., 31, 1947–1957, https://doi.org/10.1139/x01-136, 2001. a
Huggett, R.: Fundamentals of geomorphology, Routledge Fundamentals of Physical Geography, 2nd Edn., https://doi.org/10.4324/9780203947111, 2007. a
Ichii, K., Wang, W., Hashimoto, H., Yang, F., Votava, P., Michaelis, A. R., and Nemani, R. R.: Refinement of rooting depths using satellite-based evapotranspiration seasonality for ecosystem modeling in California, Agr. Forest Meteorol., 149, 1907–1918, https://doi.org/10.1016/j.agrformet.2009.06.019, 2009. a
Jackson, R. B., Canadell, J., Ehleringer, J. R., Mooney, H. A., Sala, O. E., and Schulze, E. D.: A global analysis of root distributions for terrestrial biomes, Oecologia, 108, 389–411, https://doi.org/10.1007/BF00333714, 1996. a, b
Jiang, Z., Liu, H., Wang, H., Peng, J., Meersmans, J., Green, S. M., Quine, T. A., Wu, X., and Song, Z.: Bedrock geochemistry influences vegetation growth by regulating the regolith water holding capacity, Nat. Commun., 11, 2392, https://doi.org/10.1038/s41467-020-16156-1, 2020. a, b, c, d, e
Jiménez-Rodríguez, C. D.: Scripts for data analysis of transpiration rates obtained from point scale simulations with CLM 5.0, Zenodo [code], https://doi.org/10.5281/zenodo.6778516, 2021. a
Johnson, D. M., McCulloh, K. A., Woodruff, D. R., and Meinzer, F. C.: Hydraulic safety margins and embolism reversal in stems and leaves: why are conifers and angiosperms so different?, Plant Sci., 195, 48–53, https://doi.org/10.1016/j.plantsci.2012.06.010, 2012. a, b
Johnson, K. M., Jordan, G. J., and Brodribb, T. J.: Wheat leaves embolized by water stress do not recover function upon rewatering, Plant Cell Environ., 41, 2704–2714, https://doi.org/10.1111/pce.13397, 2018. a
Jones, D. and Graham, R.: Water-holding characteristics of weathered granitic rock in chaparral and forest ecosystems, Soil Sci. Soc. Am. J., 57, 256–261, https://doi.org/10.2136/sssaj1993.03615995005700010044x, 1993. a, b
Katsura, S., Kosugi, K., Mizutani, T., and Mizuyama, T.: Hydraulic Properties of Variously Weathered Granitic Bedrock in Headwater CatchmentsAll rights reserved. No part of this periodical may be reproduced or transmitted in any form or by any means, electronic or mechanical, including photocopying, recording, or any information storage and retrieval system, without permission in writing from the publisher, Vadose Zone J., 8, 557–573, https://doi.org/10.2136/vzj2008.0142, 2009. a
Kattge, J., Diaz, S., Lavorel, S., et al.: TRY – a global database of plant traits, Glob. Change Biol., 17, 2905–2935, https://doi.org/10.1111/j.1365-2486.2011.02451.x, 2011. a
Kennedy, D., Swenson, S., Oleson, K. W., Lawrence, D. M., Fisher, R., Lola da Costa, A. C., and Gentine, P.: Implementing Plant Hydraulics in the Community Land Model, Version 5, J. Adv. Model. Earth Sy., 11, 485–513, https://doi.org/10.1029/2018MS001500, 2019. a, b, c
Kirkham, M.: Chapter 20 – The Ascent of Water in Plants, in: Principles of Soil and Plant Water Relations, 2nd Edn., edited by: Kirkham, M., 347–374, Academic Press, Boston, https://doi.org/10.1016/B978-0-12-420022-7.00020-3, 2014. a
Klein, T., Zeppel, M. J., Anderegg, W. R., Bloemen, J., De Kauwe, M. G., Hudson, P., Ruehr, N. K., Powell, T. L., von Arx, G., and Nardini, A.: Xylem embolism refilling and resilience against drought-induced mortality in woody plants: processes and trade-offs, Ecol. Res., 33, 839–855, https://doi.org/10.1007/s11284-018-1588-y, 2018. a, b
Klos, P. Z., Goulden, M. L., Riebe, C. S., Tague, C. L., O'Geen, A. T., Flinchum, B. A., Safeeq, M., Conklin, M. H., Hart, S. C., Berhe, A. A., Hartsough, P. C., Holbrook, W. S., and Bales, R. C.: Subsurface plant-accessible water in mountain ecosystems with a Mediterranean climate, WIREs Water, 5, e1277, https://doi.org/10.1002/wat2.1277, 2018. a, b
Kurbatova, J., Arneth, A., Vygodskaya, N. N., Kolle, O., Varlargin, A. V., Milyukova, I. M., Tchebakova, N. M., and Schulze, E.-D.: Comparative ecosystem-atmosphere exchange of energy and mass in a European Russian and a central Siberian bog I. Interseasonal and interannual variability of energy and latent heat fluxes during the snowfree period, Tellus B, 54, 497, https://doi.org/10.3402/tellusb.v54i5.16683, 2002. a
Kurbatova, J., Tatarinov, F., Molchanov, A., Varlagin, A., Avilov, V., Kozlov, D., Ivanov, D., and Valentini, R.: Partitioning of ecosystem respiration in a paludified shallow-peat spruce forest in the southern taiga of European Russia, Environ. Res. Lett., 8, 045028, https://doi.org/10.1088/1748-9326/8/4/045028, 2013. a
Lawrence, D. M., Fisher, R. A., Koven, C. D., Oleson, K. W., Swenson, S. C., Bonan, G., Collier, N., Ghimire, B., van Kampenhout, L., Kennedy, D., Kluzek, E., Lawrence, P. J., Li, F., Li, H., Lombardozzi, D., Riley, W. J., Sacks, W. J., Shi, M., Vertenstein, M., Wieder, W. R., Xu, C., Ali, A. A., Badger, A. M., Bisht, G., van den Broeke, M., Brunke, M. A., Burns, S. P., Buzan, J., Clark, M., Craig, A., Dahlin, K., Drewniak, B., Fisher, J. B., Flanner, M., Fox, A. M., Gentine, P., Hoffman, F., Keppel-Aleks, G., Knox, R., Kumar, S., Lenaerts, J., Leung, L. R., Lipscomb, W. H., Lu, Y., Pandey, A., Pelletier, J. D., Perket, J., Randerson, J. T., Ricciuto, D. M., Sanderson, B. M., Slater, A., Subin, Z. M., Tang, J., Thomas, R. Q., Val Martin, M., and Zeng, X.: The Community Land Model Version 5: Description of New Features, Benchmarking, and Impact of Forcing Uncertainty, J. Adv. Model. Earth Sy., 11, 4245–4287, https://doi.org/10.1029/2018MS001583, 2019. a, b, c, d
Lawrence, D. M., Dagon, K., Kennedy, D., Fisher, R., Sanderson, B. M., Oleson, K. W., Hoffman, F. M., Collier, N., Lombardozzi, D. L., Wieder, W. R., Koven, C., and Swenson, S. C.: The Community Land Model (CLM5) Parameter Perturbation Ensemble Project: Towards Comprehensive Understanding of Parametric Uncertainty on the Global Terrestrial Carbon Cycle, in: AGU Fall Meeting Abstracts, Vol. 2020, B019-0011, American Geophysical Union, https://ui.adsabs.harvard.edu/abs/2020AGUFMB019.0011L (last access: 14 July 2022) 2020. a
Le Goff, N. and Ottorini, J.-M.: Root biomass and biomass increment in a beech (Fagus sylvatica L.) stand in North-East France, Ann. For. Sci., 58, 1–13, https://doi.org/10.1051/forest:2001104, 2001. a, b, c
Li, H., Si, B., Wu, P., and McDonnell, J. J.: Water mining from the deep critical zone by apple trees growing on loess, Hydrol. Process., 33, 320–327, https://doi.org/10.1002/hyp.13346, 2019. a
Liang, S., Zhao, X., Liu, S., Yuan, W., Cheng, X., Xiao, Z., Zhang, X., Liu, Q., Cheng, J., Tang, H., Qu, Y., Bo, Y., Qu, Y., Ren, H., Yu, K., and Townshend, J.: A long-term Global LAnd Surface Satellite (GLASS) data-set for environmental studies, Int. J. Digit. Earth, 6, 5–33, https://doi.org/10.1080/17538947.2013.805262, 2013. a
Liang, S., Zhang, X., Xiao, Z., Cheng, J., Liu, Q., and Zhao, X.: Leaf Area Index, 3–31, Springer International Publishing, Cham, https://doi.org/10.1007/978-3-319-02588-9_2, 2014. a
Limousin, J., Rambal, S., Ourcival, J., Rocheteau, A., Joffre, R., and Rodriguez-Cortina, R.: Long-term transpiration change with rainfall decline in a Mediterranean Quercus ilex forest, Glob. Change Biol., 15, 2163–2175, https://doi.org/10.1111/j.1365-2486.2009.01852.x, 2009. a, b
Liu, Y., Kumar, M., Katul, G. G., Feng, X., and Konings, A. G.: Plant hydraulics accentuates the effect of atmospheric moisture stress on transpiration, Nat. Clim. Change, 10, 691–695, https://doi.org/10.1038/s41558-020-0781-5, 2020. a
Lüttschwager, D. and Jochheim, H.: Drought primarily reduces canopy transpiration of exposed beech trees and decreases the share of water uptake from deeper soil layers, Forests, 11, 537, https://doi.org/10.3390/f11050537, 2020. a
Martín-Moreno, C., Fidalgo Hijano, C., Martín Duque, J., González Martín, J., Zapico Alonso, I., and Laronne, J.: The Ribagorda sand gully (east-central Spain): Sediment yield and human-induced origin, Geomorphology, 224, 122–138, https://doi.org/10.1016/j.geomorph.2014.07.013, 2014. a, b, c
Maxwell, R. M. and Condon, L. E.: Connections between groundwater flow and transpiration partitioning, Science, 353, 377–380, https://doi.org/10.1126/science.aaf7891, 2016. a
McCormick, E. L., Dralle, D. N., Hahm, W. J., Tune, A. K., Schmidt, L. M., Chadwick, K. D., and Rempe, D. M.: Widespread woody plant use of water stored in bedrock, Nature, 597, 225–229, https://doi.org/10.1038/s41586-021-03761-3, 2021. a, b
McCulloh, K. A., Domec, J.-C., Johnson, D. M., Smith, D. D., and Meinzer, F. C.: A dynamic yet vulnerable pipeline: Integration and coordination of hydraulic traits across whole plants, Plant Cell Environ., 42, 2789–2807, https://doi.org/10.1111/pce.13607, 2019. a
Meinzer, F. C., Johnson, D. M., Lachenbruch, B., McCulloh, K. A., and Woodruff, D. R.: Xylem hydraulic safety margins in woody plants: coordination of stomatal control of xylem tension with hydraulic capacitance, Funct. Ecol., 23, 922–930, https://doi.org/10.1111/j.1365-2435.2009.01577.x, 2009. a
Milyukova, I. M., Kolle, O., Varlagin, A. V., Vygodskaya, N. N., Schulze, E.-D., and Lloyd, J.: Carbon balance of a southern taiga spruce stand in European Russia, Tellus B, 54, 429–442, https://doi.org/10.3402/tellusb.v54i5.16679, 2002. a, b
Miyazaki, T.: Bulk density dependence of air entry suctions and saturated hydraulic conductivities of soils, Soil Sci., 161, 484–490, 1996. a
Mu, M., De Kauwe, M. G., Ukkola, A. M., Pitman, A. J., Gimeno, T. E., Medlyn, B. E., Or, D., Yang, J., and Ellsworth, D. S.: Evaluating a land surface model at a water-limited site: implications for land surface contributions to droughts and heatwaves, Hydrol. Earth Syst. Sci., 25, 447–471, https://doi.org/10.5194/hess-25-447-2021, 2021. a
Nadezhdina, N., Ferreira, M. I., Silva, R., and Pacheco, C. A.: Seasonal variation of water uptake of a Quercus suber tree in Central Portugal, Plant Soil, 305, 105–119, https://doi.org/10.1007/s11104-007-9398-y, 2008. a
Nardini, A., Petruzzellis, F., Marusig, D., Tomasella, M., Natale, S., Altobelli, A., Calligaris, C., Floriddia, G., Cucchi, F., Forte, E., and Zini, L.: Water “on the rocks”: a summer drink for thirsty trees?, New Phytol., 229, 199–212, https://doi.org/10.1111/nph.16859, 2021. a, b
Navarre-Sitchler, A., Brantley, S. L., and Rother, G.: How porosity increases during incipient weathering of crystalline silicate rocks, Rev. Mineral. Geochem., 80, 331–354, https://doi.org/10.2138/rmg.2015.80.10, 2015. a
Nelson, J. A., Pérez-Priego, O., Zhou, S., Poyatos, R., Zhang, Y., Blanken, P. D., Gimeno, T. E., Wohlfahrt, G., Desai, A. R., Gioli, B., Limousin, J.-M., Bonal, D., Paul-Limoges, E., Scott, R. L., Varlagin, A., Fuchs, K., Montagnani, L., Wolf, S., Delpierre, N., Berveiller, D., Gharun, M., Belelli Marchesini, L., Gianelle, D., Šigut, L., Mammarella, I., Siebicke, L., Andrew Black, T., Knohl, A., Hörtnagl, L., Magliulo, V., Besnard, S., Weber, U., Carvalhais, N., Migliavacca, M., Reichstein, M., and Jung, M.: Ecosystem transpiration and evaporation: Insights from three water flux partitioning methods across FLUXNET sites, Glob. Change Biol., 26, 6916–6930, https://doi.org/10.1111/gcb.15314, 2020. a
Niu, G.-Y., Yang, Z.-L., Mitchell, K. E., Chen, F., Ek, M. B., Barlage, M., Kumar, A., Manning, K., Niyogi, D., Rosero, E., Tewari, M., and Xia, Y.: The community Noah land surface model with multiparameterization options (Noah-MP): 1. Model description and evaluation with local-scale measurements, J. Geophys. Res.-Atmos., 116, D12109, https://doi.org/10.1029/2010JD015139, 2011. a
Novák, V. and Surda, P.: The water retention of a granite rock fragments in High Tatras stony soils, J. Hydrol. Hydromech., 58, 181–187, https://doi.org/10.2478/v10098-010-0017-x, 2010. a
Novenko, E. and Zuganova, I.: Landscape Dynamics in the Eemian Interglacial and Early Weichselian Glacial Epoch on the South Valdai Hills (Russia), Open Geography Journal, 3, 44–54, https://doi.org/10.2174/1874923201003010044, 2010. a, b, c
Ocheltree, T., Gleason, S., Cao, K.-F., and Jiang, G.-F.: Loss and recovery of leaf hydraulic conductance: Root pressure, embolism, and extra-xylary resistance, Journal of Plant Hydraulics, 7, e-001, https://doi.org/10.20870/jph.2020.e-001, 2020. a
Pachepsky, Y. and Park, Y.: Saturated Hydraulic Conductivity of US Soils Grouped According to Textural Class and Bulk Density, Soil Sci. Soc. Am. J., 79, 1094–1100, https://doi.org/10.2136/sssaj2015.02.0067, 2015. a
Pallardy, S. G.: CHAPTER 11 – Absorption of Water and Ascent of Sap, in: Physiology of Woody Plants, 3rd Edn., edited by: Pallardy, S. G., 287–323, Academic Press, San Diego, https://doi.org/10.1016/B978-012088765-1.50012-9, 2008. a
Pawlik, Ł., Phillips, J. D., and S̆amonil, P.: Roots, rock, and regolith: Biomechanical and biochemical weathering by trees and its impact on hillslopes – A critical literature review, Earth-Sci. Rev., 159, 142–159, https://doi.org/10.1016/j.earscirev.2016.06.002, 2016. a, b, c
Pelletier, J. D., Broxton, P. D., Hazenberg, P., Zeng, X., Troch, P. A., Niu, G.-Y., Williams, Z., Brunke, M. A., and Gochis, D.: A gridded global data set of soil, intact regolith, and sedimentary deposit thicknesses for regional and global land surface modeling, J. Adv. Model. Earth Sy., 8, 41–65, https://doi.org/10.1002/2015MS000526, 2016. a, b, c, d, e, f
Penuelas, J. and Filella, I.: Deuterium labelling of roots provides evidence of deep water access and hydraulic lift by Pinus nigra in a Mediterranean forest of NE Spain, Environ. Exp. Bot., 49, 201–208, https://doi.org/10.1016/S0098-8472(02)00070-9, 2003. a, b, c
Phillips, J. D., Pawlik, Ł., and S̆amonil, P.: Weathering fronts, Earth-Sci. Rev., 198, 102925, https://doi.org/10.1016/j.earscirev.2019.102925, 2019. a, b
Pita, G., Gielen, B., Zona, D., Rodrigues, A., Rambal, S., Janssens, I. A., and Ceulemans, R.: Carbon and water vapor fluxes over four forests in two contrasting climatic zones, Agr. Forest Meteorol., 180, 211–224, https://doi.org/10.1016/j.agrformet.2013.06.003, 2013. a, b
Pope, G. A.: Chapter 4 – Regolith and Weathering (Rock Decay) in the Critical Zone, Vol. 19 of Developments in Earth Surface Processes, edited by: Giardino, J. R. and Houser, C., 113–145, Elsevier, https://doi.org/10.1016/B978-0-444-63369-9.00004-5, 2015. a, b
Poyatos, R., Granda, V., Molowny-Horas, R., Mencuccini, M., Steppe, K., and Martínez-Vilalta, J.: SAPFLUXNET: towards a global database of sap flow measurements, Tree Physiol., 36, 1449–1455, https://doi.org/10.1093/treephys/tpw110, 2016. a
Poyatos, R., Granda, V., Flo, V., Molowny-Horas, R., Steppe, K., Mencuccini, M., and Martínez-Vilalta, J.: SAPFLUXNET: A global database of sap flow measurements, Zenodo [data set], https://doi.org/10.5281/zenodo.3971689, 2020. a
Poyatos, R., Granda, V., Flo, V., Adams, M. A., Adorján, B., Aguadé, D., Aidar, M. P. M., Allen, S., Alvarado-Barrientos, M. S., Anderson-Teixeira, K. J., Aparecido, L. M., Arain, M. A., Aranda, I., Asbjornsen, H., Baxter, R., Beamesderfer, E., Berry, Z. C., Berveiller, D., Blakely, B., Boggs, J., Bohrer, G., Bolstad, P. V., Bonal, D., Bracho, R., Brito, P., Brodeur, J., Casanoves, F., Chave, J., Chen, H., Cisneros, C., Clark, K., Cremonese, E., Dang, H., David, J. S., David, T. S., Delpierre, N., Desai, A. R., Do, F. C., Dohnal, M., Domec, J.-C., Dzikiti, S., Edgar, C., Eichstaedt, R., El-Madany, T. S., Elbers, J., Eller, C. B., Euskirchen, E. S., Ewers, B., Fonti, P., Forner, A., Forrester, D. I., Freitas, H. C., Galvagno, M., Garcia-Tejera, O., Ghimire, C. P., Gimeno, T. E., Grace, J., Granier, A., Griebel, A., Guangyu, Y., Gush, M. B., Hanson, P. J., Hasselquist, N. J., Heinrich, I., Hernandez-Santana, V., Herrmann, V., Hölttä, T., Holwerda, F., Irvine, J., Isarangkool Na Ayutthaya, S., Jarvis, P. G., Jochheim, H., Joly, C. A., Kaplick, J., Kim, H. S., Klemedtsson, L., Kropp, H., Lagergren, F., Lane, P., Lang, P., Lapenas, A., Lechuga, V., Lee, M., Leuschner, C., Limousin, J.-M., Linares, J. C., Linderson, M.-L., Lindroth, A., Llorens, P., López-Bernal, Á., Loranty, M. M., Lüttschwager, D., Macinnis-Ng, C., Maréchaux, I., Martin, T. A., Matheny, A., McDowell, N., McMahon, S., Meir, P., Mészáros, I., Migliavacca, M., Mitchell, P., Mölder, M., Montagnani, L., Moore, G. W., Nakada, R., Niu, F., Nolan, R. H., Norby, R., Novick, K., Oberhuber, W., Obojes, N., Oishi, A. C., Oliveira, R. S., Oren, R., Ourcival, J.-M., Paljakka, T., Perez-Priego, O., Peri, P. L., Peters, R. L., Pfautsch, S., Pockman, W. T., Preisler, Y., Rascher, K., Robinson, G., Rocha, H., Rocheteau, A., Röll, A., Rosado, B. H. P., Rowland, L., Rubtsov, A. V., Sabaté, S., Salmon, Y., Salomón, R. L., Sánchez-Costa, E., Schäfer, K. V. R., Schuldt, B., Shashkin, A., Stahl, C., Stojanović, M., Suárez, J. C., Sun, G., Szatniewska, J., Tatarinov, F., Tesař, M., Thomas, F. M., Tor-ngern, P., Urban, J., Valladares, F., van der Tol, C., van Meerveld, I., Varlagin, A., Voigt, H., Warren, J., Werner, C., Werner, W., Wieser, G., Wingate, L., Wullschleger, S., Yi, K., Zweifel, R., Steppe, K., Mencuccini, M., and Martínez-Vilalta, J.: Global transpiration data from sap flow measurements: the SAPFLUXNET database, Earth Syst. Sci. Data, 13, 2607–2649, https://doi.org/10.5194/essd-13-2607-2021, 2021. a, b, c, d, e
Prieto, I. and Ryel, R. J.: Internal hydraulic redistribution prevents the loss of root conductivity during drought, Tree Physiol., 34, 39–48, https://doi.org/10.1093/treephys/tpt115, 2013. a
Qi, J., Markewitz, D., and Radcliffe, D.: Modelling the effect of changing precipitation inputs on deep soil water utilization, Hydrol. Process., 32, 672–686, https://doi.org/10.1002/hyp.11452, 2018. a, b
Querejeta, J. I., Estrada-Medina, H., Allen, M. F., and Jiménez-Osornio, J. J.: Water source partitioning among trees growing on shallow karst soils in a seasonally dry tropical climate, Oecologia, 152, 26–36, https://doi.org/10.1007/s00442-006-0629-3, 2007. a, b
Rehschuh, R., Cecilia, A., Zuber, M., Faragó, T., Baumbach, T., Hartmann, H., Jansen, S., Mayr, S., and Ruehr, N.: Drought-induced xylem embolism limits the recovery of leaf gas exchange in Scots pine, Plant Physiol., 184, 852–864, https://doi.org/10.1104/pp.20.00407, 2020. a
Reichstein, M., Tenhunen, J. D., Roupsard, O., Ourcival, J.-M., Rambal, S., Dore, S., and Valentini, R.: Ecosystem respiration in two Mediterranean evergreen Holm Oak forests: drought effects and decomposition dynamics, Funct. Ecol., 16, 27–39, https://doi.org/10.1046/j.0269-8463.2001.00597.x, 2002. a
Rempe, D. M. and Dietrich, W. E.: Direct observations of rock moisture, a hidden component of the hydrologic cycle, P. Natl. Acad. Sci. USA, 115, 2664–2669, https://doi.org/10.1073/pnas.1800141115, 2018. a, b, c, d
Rouxel, M., Molénat, J., Ruiz, L., Chirié, G., and Hamon, Y.: Determination of saturated and unsaturated hydraulic conductivities and water retention curves of weathered granite, Geophys. Res. Abstr., EGU2010-3623, EGU General Assembly 2010, Vienna, Austria, 2010. a
Schulze, E.-D., Vygodskaya, N., Tchebakova, N., Czimczik, C., Kozlov, D., Lloyd, J., Mollicone, D., Parfenova, E., Sidorov, K., Varlagin, A., and Wirth, C.: The Eurosiberian Transect: an introduction to the experiment region, Tellus B, 54, 421, https://doi.org/10.3402/tellusb.v54i5.16678, 2002. a, b, c
Schwinning, S.: The ecohydrology of roots in rocks, Ecohydrology, 3, 238–245, https://doi.org/10.1002/eco.134, 2010. a
Schwinning, S.: A critical question for the critical zone: how do plants use rock water?, Plant Soil, 454, 49–56, https://doi.org/10.1007/s11104-020-04648-4, 2020. a
Shahin, O., Paul, N. M.-S., Rambal, S., Joffre, R., and Richard, F.: Ectomycorrhizal fungal diversity in Quercus ilex Mediterranean woodlands: variation among sites and over soil depth profiles in hyphal exploration types, species richness and community composition, Symbiosis, 61, 1–12, https://doi.org/10.1007/s13199-013-0252-0, 2013. a
Shangguan, W., Hengl, T., Mendes de Jesus, J., Yuan, H., and Dai, Y.: Mapping the global depth to bedrock for land surface modeling, J. Adv. Model. Earth Sy., 9, 65–88, https://doi.org/10.1002/2016MS000686, 2017. a
Sperry, J., Hacke, U., Oren, R., and Comstock, J.: Water deficits and hydraulic limits to leaf water supply, Plant Cell Environ., 25, 251–263, https://doi.org/10.1046/j.0016-8025.2001.00799.x, 2002. a
Sperry, J. S. and Love, D. M.: What plant hydraulics can tell us about responses to climate-change droughts, New Phytol., 207, 14–27, https://doi.org/10.1111/nph.13354, 2015. a
Sperry, J. S., Adler, F. R., Campbell, G. S., and Comstock, J. P.: Limitation of plant water use by rhizosphere and xylem conductance: results from a model, Plant Cell Environ., 21, 347–359, https://doi.org/10.1046/j.1365-3040.1998.00287.x, 1998. a
Sternberg, P., Anderson, M., Graham, R., Beyers, J., and Tice, K.: Root distribution and seasonal water status in weathered granitic bedrock under chaparral, Geoderma, 72, 89–98, https://doi.org/10.1016/0016-7061(96)00019-5, 1996. a, b, c
Summerfield, M.: Global Geomorphology, Longman, 1991. a
Sun, Y., Goll, D. S., Chang, J., Ciais, P., Guenet, B., Helfenstein, J., Huang, Y., Lauerwald, R., Maignan, F., Naipal, V., Wang, Y., Yang, H., and Zhang, H.: Global evaluation of the nutrient-enabled version of the land surface model ORCHIDEE-CNP v1.2 (r5986), Geosci. Model Dev., 14, 1987–2010, https://doi.org/10.5194/gmd-14-1987-2021, 2021. a
Swaffer, B. A., Holland, K. L., Doody, T. M., Li, C., and Hutson, J.: Water use strategies of two co-occurring tree species in a semi-arid karst environment, Hydrol. Process., 28, 2003–2017, https://doi.org/10.1002/hyp.9739, 2014. a, b
Swenson, S. C. and Lawrence, D. M.: A GRACE-based assessment of interannual groundwater dynamics in the Community Land Model, Water Resour. Res., 51, 8817–8833, https://doi.org/10.1002/2015WR017582, 2015. a
Tao, Z., Neil, E., and Si, B.: Determining deep root water uptake patterns with tree age in the Chinese loess area, Agr. Water Manage., 249, 106810, https://doi.org/10.1016/j.agwat.2021.106810, 2021. a
S̆amonil, P., Phillips, J., Danĕk, P., Benes̆, V., and Pawlik, Ł.: Soil, regolith, and weathered rock: Theoretical concepts and evolution in old-growth temperate forests, Central Europe, Geoderma, 368, 114261, https://doi.org/10.1016/j.geoderma.2020.114261, 2020. a
van der Laan, S., van der Laan-Luijkx, I., Rödenbeck, C., Varlagin, A., Shironya, I., Neubert, R., Ramonet, M., and Meijer, H.: Atmospheric CO2, δ(O2/N2), APO and oxidative ratios from aircraft flask samples over Fyodorovskoye, Western Russia, Atmos. Environ., 97, 174–181, https://doi.org/10.1016/j.atmosenv.2014.08.022, 2014. a
Vrettas, M. D. and Fung, I. Y.: Sensitivity of transpiration to subsurface properties: Exploration with a 1-D model, J. Adv. Model. Earth Sy., 9, 1030–1045, https://doi.org/10.1002/2016MS000901, 2017. a
Vygodskaya, N. N., Schulze, E.-D., Tchebakova, N., Karpachevskii, L. O., Kozlov, D., Sidorov, K. N., Panfyorov, M., Abrazko, M., Shaposhnikov, E., Solnzeva, O., Minaeva, T., Jeltuchin, A., Wirth, C., and Pugachevskii, A.: Climate control of stand thinning in unmanaged spruce forests of the southern taiga in European Russia, Tellus B, 54, 443, https://doi.org/10.3402/tellusb.v54i5.16680, 2002. a, b, c
Welch, L. and Allen, D.: Hydraulic conductivity characteristics in mountains and implications for conceptualizing bedrock groundwater flow, Hydrogeol. J., 22, 1003–1026, https://doi.org/10.1007/s10040-014-1121-5, 2014. a
Zapater, M., Hossann, C., Bréda, N., Bréchet, C., Bonal, D., and Granier, A.: Evidence of hydraulic lift in a young beech and oak mixed forest using 18O soil water labelling, Trees, 25, 885, https://doi.org/10.1007/s00468-011-0563-9, 2012. a, b, c, d, e
Zapico, I., Laronne, J. B., Martín-Moreno, C., Martín-Duque, J. F., Ortega, A., and Sánchez-Castillo, L.: Baseline to Evaluate Off-Site Suspended Sediment-Related Mining Effects in the Alto Tajo Natural Park, Spain, Land Degrad. Dev., 28, 232–242, https://doi.org/10.1002/ldr.2605, 2017. a
Zarebanadkouki, M., Ahmed, M. A., and Carminati, A.: Hydraulic conductivity of the root-soil interface of lupin in sandy soil after drying and rewetting, Plant Soil, 398, 267–280, https://doi.org/10.1007/s11104-015-2668-1, 2016. a
Zeng, Y., Xie, Z., Liu, S., Xie, J., Jia, B., Qin, P., and Gao, J.: Global land surface modeling including lateral groundwater flow, J. Adv. Model. Earth Sy., 10, 1882–1900, https://doi.org/10.1029/2018MS001304, 2018. a
Zhang, Z., Li, M., Si, B., and Feng, H.: Deep rooted apple trees decrease groundwater recharge in the highland region of the Loess Plateau, China, Sci. Total Environ., 622-623, 584–593, https://doi.org/10.1016/j.scitotenv.2017.11.230, 2018. a