the Creative Commons Attribution 4.0 License.
the Creative Commons Attribution 4.0 License.
 | 23 Aug 2022
Stable isotope profiles of soil organic carbon in forested and grassland landscapes in the Lake Alaotra basin (Madagascar): insights in past vegetation changes
Vao Fenotiana Razanamahandry
Marjolein Dewaele
Gerard Govers
Liesa Brosens
Benjamin Campforts
Liesbet Jacobs
Tantely Razafimbelo
Tovonarivo Rafolisy
Steven Bouillon
The extent to which the central highlands of Madagascar were once covered by forests is still a matter of debate: while reconstructing past environments is inherently difficult, the debate is further hampered by the fact that the evidence documenting land cover changes and their effects on carbon and sediment dynamics in Madagascar has hitherto mainly been derived from lake coring studies. Such studies provide an integrated view over relatively large areas but do not provide information on how land-use change affects hillslopes in terms of carbon and sediment dynamics. Such information would not only be complementary to lake inventories but may also help to correctly interpret lake sediment data. Carbon stable isotope ratios (δ13C) are particularly useful tracers to study the past dynamics of soil carbon over time spans ranging from years to millennia and thus to understand the consequences of land-use change over such time spans. We analysed soil profiles down to a depth of 2 m from pristine forests and grasslands in the Lake Alaotra region in central Madagascar. Along grassland hillslopes, soil organic carbon (SOC) content was low, from 0.4 % to 1.7 % in the top layer, and decreased rapidly to ca. 0.2 % below 100 cm depth. The current vegetation predominantly consists of C4 grasses (δ13C ∼ −13 ‰), yet topsoil δ13C-OC ranges between −23.0 ‰ and −15.8 ‰, and most profiles show a decrease in δ13C-OC with depth. This contrasts with our observations in the C3-dominated forest profiles, which show a typical profile whereby δ13C values increase slightly with depth. Moreover, the SOC stock of grasslands was ∼ 55.6 % lower than along the forested hillslopes for the upper 0–30 cm layer. δ13C values in grassland and forest profiles converge to similar values (within 2.0 ± 1.8 ‰) at depths below ∼ 80 cm, suggesting that the grasslands in the Lake Alaotra region have indeed developed on soils formerly covered by a tree vegetation dominated by C3 plants. We also observed that the percent of modern carbon (pMC) of the bulk OC in the top, middle and lower middle positions of grasslands was less than 85 % near the surface. This could reflect a combination of (i) the long residence time of forest OC in the soil, (ii) the slow replacement rate of grassland-derived OC (iii) and the substantial erosion of the top positions towards the valley position of grasslands. At the valley positions under grassland, the upper 80 cm contains higher amounts of recent grass-derived OC in comparison to the hillslope positions. This is likely to be related to the higher productivity of the grassland valleys (due to higher moisture and nutrient availability), and the deposition of OC that was eroded further upslope may also have contributed. The method we applied, which is based on the large difference in δ13C values between the two major photosynthetic pathways (C3 and C4) in (sub-)tropical terrestrial environments, provides a relatively straightforward approach to quantitatively determine changing vegetation cover, and we advocate for its broader application across Madagascar to better understand the island's vegetation history.
- Article
(6223 KB) - Full-text XML
-
Supplement
(1285 KB) - BibTeX
- EndNote


Madagascar is an island characterized by highly distinct landscapes. The eastern part of the island is humid and covered by tropical rainforest, while the southern and western regions are drier and dominated by (wooded) grasslands including shrubby bushlands and arborescent species of Euphorbia. Madagascar is often considered to experience very high erosion rates (Szabó et al., 2015). The most spectacular erosion forms on the island are large inverse-teardrop-shaped gullies or lavaka meaning “hole” in the Malagasy language. Lavaka are omnipresent in the central highlands of Madagascar (Brosens et al., 2022; Cox et al., 2010; Szabó et al., 2015; Voarintsoa et al., 2012; Wells and Andriamihaja, 1993) and frequently initiate on convex slopes covered by grassland vegetation and patches of shrubs (Brosens et al., 2022; Wells and Andriamihaja, 1993). Active lavaka are absent under forest vegetation (Aubréville and Bossanyi, 2015).
Cox et al. (2009) concluded from 10Be concentrations that ∼ 80 % of the sediment in the Malagasy highland rivers originated from lavaka and concluded that these were already widely present when humans arrived. However, a recent study by Brosens et al. (2022) shows that, although lavaka probably have indeed been present for millennia, their number strongly increased over the last 4 centuries due to a strong increase in environmental pressure exerted by an ever growing rural population. Although it is undisputed that environmental pressure has indeed increased since the arrival of humans, the question remains of the extent human activities have changed the land cover of the Malagasy highlands. The isolated residual forest patches that are present within grassland regions are believed to provide evidence that the Malagasy highlands were nearly completely forested prior to the arrival of humans (Chevalier, 1922). Baron (1889) already believed that the whole eastern part of the island was densely forested but did not present solid evidence for this claim. Other early researchers, however, questioned whether the forest covered the whole island in the past (e.g. Battistini and Verin, 1972). They suggested that the drier parts of the island were likely covered by an alternation of grasslands and sparse forests mainly composed of tall shrubs and xerophilous vegetation, while the more humid parts were generally covered by a dense forest. They assumed that the latter was dramatically reduced by human deforestation, resulting in a transition to grasslands and leading to more intense erosion (Chevalier, 1922). This view has been widely adopted by major international development institutions that strongly stimulated afforestation in grassland regions in Madagascar. However, Bond et al. (2008) claimed that the Malagasy grasslands have an ancient origin that was part of the global expansion of C4 grass biomes at the end of the last glacial period and are thus not anthropogenically driven. They conclude this based on (i) evidence that the extinct Malagasy fauna consumed C4 or CAM (crassulacean acid metabolism) plants and (ii) the diversity of C4 grass lineages in Madagascar relative to the mainland African continent. Recent work relying on floristic inventories revealed that 40 % of Madagascar's grass species are endemic, supporting the argument for an ancient origin of the open grassland vegetation on the island (Vorontsova et al., 2016). Furthermore, different centres of grass endemism were identified, suggesting that grasslands were scattered across the island before human arrival. Evidence from several sites, using dated fossil pollen, charcoal and diatoms, further confirms this, showing that graminoid vegetation was present in the Malagasy highlands before human settlement (Burney, 2004; Gasse and Van Campo, 2001; Matsumoto and Burney, 1994).
These two views are not necessarily contradictory. While it is clear that grasslands are indeed endemic to Madagascar, there is also strong evidence that the fraction of the land covered by grasses has increased over the last 1000–1500 years (Virah-Sawmy et al., 2016). Pollen profiles suggest that this “opening up” of the landscape may have occurred relatively rapidly, over a timescale of centuries. It remains very difficult to quantify the extent of this vegetation change: while pollen diagrams from lake deposits do provide an integrated assessment, they do not provide information on where in the landscape changes may have occurred nor do they allow us to quantify the degree of change (Straka, 1996; Virah-Sawmy et al., 2016). Furthermore, lake sediment studies do not allow us to assess how vegetation changes affect carbon and sediment dynamics on the hillslopes, making it impossible to derive solid conclusions on how carbon inventories and fluxes of carbon and sediment may have changed due to vegetation changes.
Land-use cover changes such as deforestation represent an important anthropogenic contribution to the emission of greenhouse gases in tropical regions (Harris et al., 2012), and the concurrent increase in erosion rates (Restrepo et al., 2015) can significantly impact soil organic carbon (SOC) stocks (Batlle-Bayer et al., 2010; Rabetokotany-Rarivoson et al., 2015; Yang et al., 2018). On the one hand, soil erosion induces SOC losses due to structural aggregate degradation and due to reduced productivity resulting from a decrease in soil nutrients in the eroding area (Jacinthe et al., 2002; Lal, 2004). On the other hand, soil erosion can lead to a SOC sink in the depositional area due to transfer and burial of high SOC from the eroding area (Van Oost et al., 2007). In (sub-)tropical environments, stable isotopes offer one of the possible approaches to quantify land-use and vegetation changes at the landscape scale (Boutton et al., 1998). Forest vegetation (following the C3 photosynthetic pathway) and grasses (following the C4 pathway for the majority of tropical and subtropical species) show a different degree of isotope fractionation (Peterson and Fry, 1987), and therefore, stable carbon isotope ratios (δ13C) of SOC have been an important technique to understand vegetation shifts (e.g. Desjardins et al., 2013, 2020).
The main aim of this study is therefore to provide insight into the vegetation history and the impact of vegetation changes on carbon and sediment dynamics at the hillslope scale of the grasslands in the Lake Alaotra region located in the central highlands of Madagascar. As it is the most important rice-producing region in Madagascar, population density is high. Irrigated rice is located mainly in the lake's plains, while the surrounding hills and mountains are used for extensive cattle herding and, to a much smaller extent, for arable crops (Penot et al., 2018). While much of the Lake Alaotra catchment consists of grassland-covered hills with a high density of lavaka (Cox et al., 2010; Voarintsoa et al., 2012), pristine forests are located just east of the lake. These forests form the westernmost part of a larger rainforest-covered region extending from north to south along the east coast of the island. We sampled soil profiles along hillslope transects at both forested and grassland sites whereby organic carbon (OC) stocks were quantified, and δ13C values and 14C activity of soil OC were measured to evaluate differences in OC stocks and OC isotopic signatures between grassland and forest land. The stable carbon isotope ratio (δ13C) is an interesting tracer to understand vegetation shifts in a landscape over time because forest plants (following the C3 photosynthetic pathway) and grasses (following the C4 pathway for the majority of tropical and subtropical species) show a different degree of isotope fractionation (Cerling and Harris, 1999). This results in C3 plants having more negative δ13C values with an average of approximately −28 ‰, while C4 plants have less negative δ13C values around −13 ‰ (Peterson and Fry, 1987). 14C activity measurements of the bulk SOC, on the other hand, allow us to assess the (relative) age of SOC. We use this information to assess whether the current grassland sites were formerly forested and how vegetation cover changes may have affected carbon and sediment dynamics on the hillslopes.
2.1 Study area: Lake Alaotra region
Lake Alaotra is the largest lake of Madagascar, located in the central eastern part (17–18∘ S and 48–49∘ E) at about 775 m above sea level (a.s.l.) (Mietton et al., 2018) (Fig. 1a). The surrounding hills rise up to 900–1300 m a.s.l. (Bakoariniaina et al., 2006). Precambrian crystalline rocks, predominantly magmatic rocks of the graphitic system of Madagascar, underlie the area. Lake Alaotra is located in a graben bounded by faults on its eastern and western sides that probably originated in the Tertiary in response to Neogene extensional tectonic events (Mietton et al., 2018). The rainfall (mean annual precipitation between 900 and 1250 mm) is characterized by a distinct wet and dry season with the occurrence of tropical cyclones. The mean annual temperature is 20.6 ∘C, ranging from 11 ∘C in July to 28 ∘C in January (Ferry, 2009).
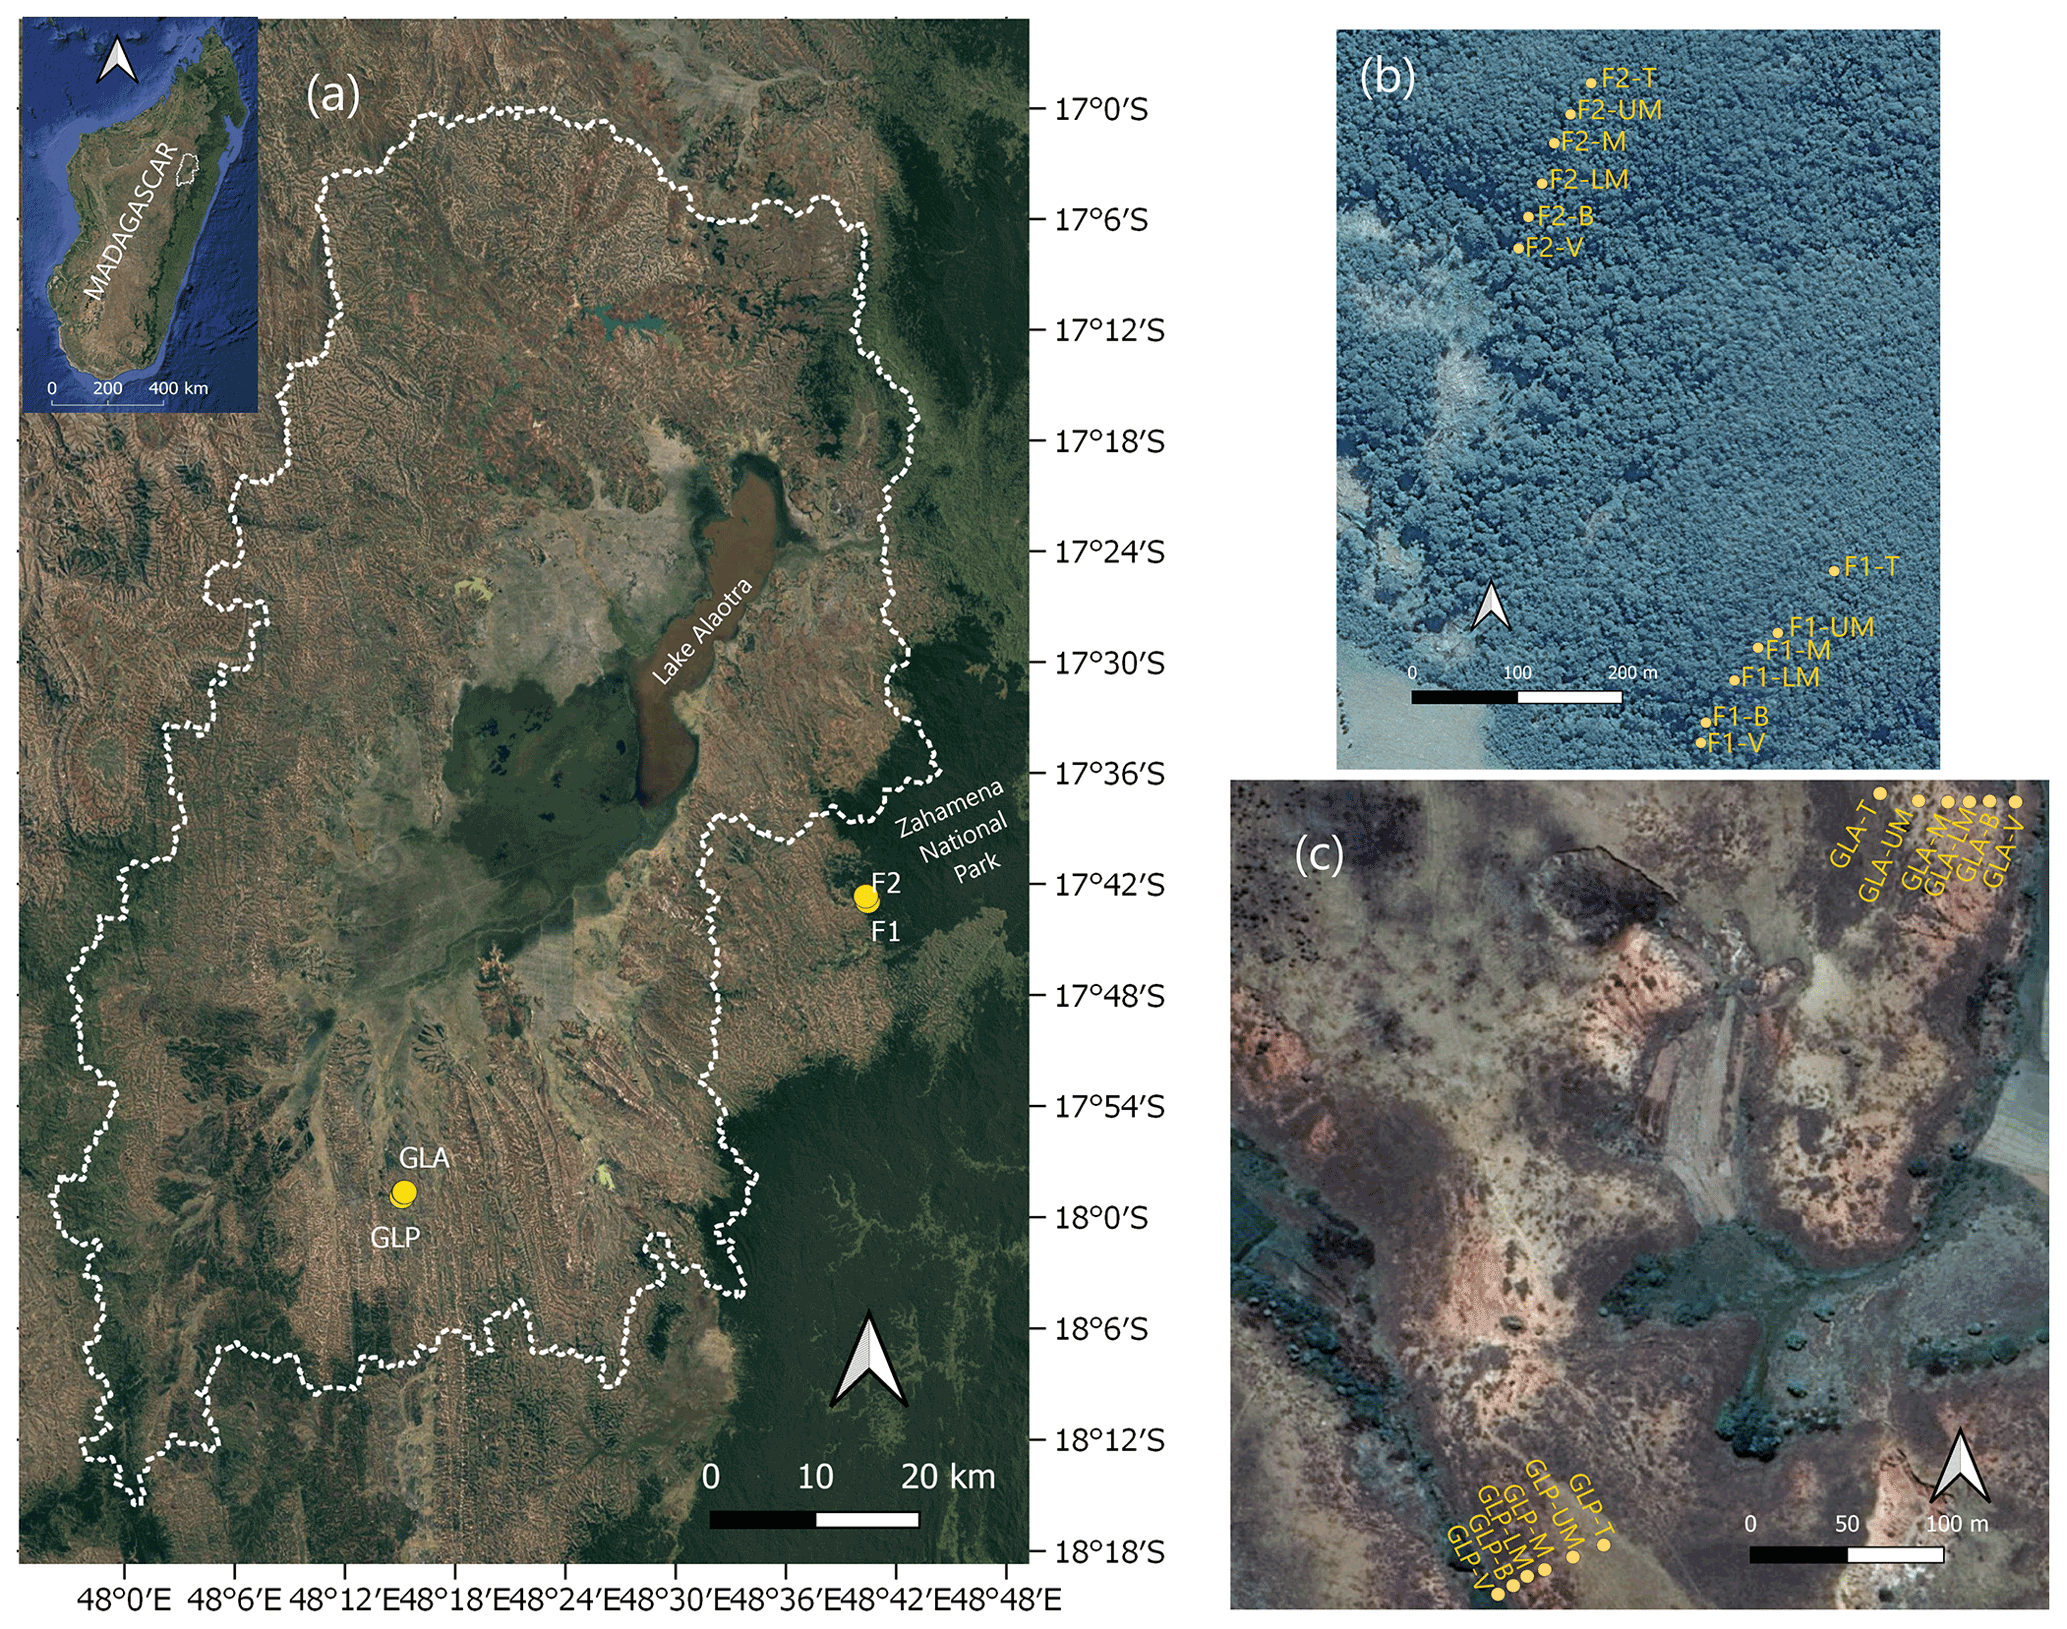
Figure 1(a) Location of the study region with indication of the sampled hillslope profiles. The dotted white line delineates the watershed of the Lake Alaotra basin. GLA and GLP are the two convex hillslopes under grassland, and F1 and F2 are the two forested convex hillslopes in the Zahamena National Park. Satellite view of the two forest transects (b) and the two grassland transects (c) (© Google Earth 2020).
Nowadays, most of the hills surrounding Lake Alaotra are covered by C4 grasses. These areas are being used for cattle herding and are characterized by a high density of lavaka (Voarintsoa et al., 2012). Recent research has shown that lavaka in the Lake Alaotra region (Fig. S1 in the Supplement) are on average ca. 400 years old. Lavaka became far more numerous since ca. 1000 years ago, and lavaka formation rates have increased dramatically over the last 200 years. This timing and the rapid increase in lavaka erosion rates has been confirmed by floodplain sedimentation data in the same area (Brosens et al., 2022). Brosens et al. (2022) link this increase in lavaka erosion to increased environmental pressure due to growing human populations and intensified grazing based on scenario modelling and on the absence of significant climatic variations in this period.
The soils in our study area are classified as Ferralsols according to the World Reference Base for Soil Resources (2006). They are underlain by a deeply weathered regolith that is in most locations several tens of metres thick. At many locations, a hard lateritic horizon has developed in the upper part of the regolith, covering it like a “shield” (Voarintsoa et al., 2012; Wells and Andriamihaja, 1993). The lateritic soil horizon is usually between 0.5 to 2 m thick (Voarintsoa et al., 2012) and is considered to be relatively impermeable, thus favouring surface run-off, especially if there is no or little vegetation and if no cracks are present (Wells and Andriamihaja, 1993). In addition, the basement rocks on the site are metamorphic and igneous (Du Puy and Moat, 1996). Therefore, geogenic OC is not considered to be substantial, in contrast to subsoils developed from sedimentary rocks where this might be more important (Graz et al., 2010).
While most of the Lake Alaotra region is covered by C4 grasses, a small part of the eastern side of the catchment is covered by forest which is part of the Zahamena National Park. Zahamena is the third strict nature reserve of Madagascar that was established in 1927, and since then no human occupancy has been allowed within its boundaries except for scientific research (Andriamampianina, 1984). This national park contains important remnants of the evergreen rainforest of Madagascar at low (0–800 m) and medium altitudes (800–1800 m) (Styger et al., 2007) and extends over 3710 km2 (Andriamananjara et al., 2016) (Fig. S2). The rainforest of the Zahamena National Park is one of the most diverse in Madagascar with many species of flora with a high degree of endemism (Raboanarielina, 2012). This pristine forest zone is part of the eastern forest corridor of eastern Madagascar (Fig. 1), where Hackel et al. (2018) have inventoried endemic C3 grass species in Madagascar. These endemic C3 grasses belong to the group “forest shade clade” (Paniceae: Boivinellinea), and their diversification since the Miocene is reported to be favoured by the expansion of the Sambirano rainforest (in the north of Madagascar) (Hackel et al., 2018; Yoder and Nowak, 2006).
2.2 Sampling transects
The hillslopes surrounding Lake Alaotra are nearly all convex-sloping hills (Fig. S3), a characteristic that is commonly observed throughout the central highlands of Madagascar (Wells and Andriamihaja, 1993). These convex hillslopes typically have a rounded flat top and steepen downslope with the highest slope gradients near the bottom of the hillslope (Figs. 1b, c, S3 and S4).
Vegetation varies with topography: grass vegetative cover is typically highest in the valleys and lowest at the hillslope convexities (Figs. S2 and S4).
Soil samples were collected in the lateritic horizon, along four convex hillslope transects, two of which are located in the grassland habitat, while two hillslopes under pristine forest were sampled just east of the basin boundary in the Zahamena Forest Corridor (Fig. 1). The two chosen grassland hillslopes are denoted as GLP (grassland hillslope where Lavaka is Present) and GLA (grassland hillslope where Lavaka is absent). For GLP, the chosen transect was situated outside the actual lavaka. By choosing a slope with and without lavaka, we wanted to investigate whether soils on slopes that have lavaka development may differ from slopes that do not have them. The two pristine forest transects are denoted as F1 and F2. The slope gradients (derived from the 12 m resolution TanDEM-X digital elevation model) of the four transects were comparable, with the maximum slope gradient of 25 and 30∘ for the forest transect and 25 and 29∘ under grassland (see Fig. S3).
Along each of the hillslope transects, six soil profiles were sampled down to 2 m deep. We named the sampling positions top (T), upper middle (UM), middle (M), lower middle (LM), bottom (B) and valley (V) (Figs. 1 and S3). Soil samples were collected using a motorized auger with 10 cm diameter for the upper 0–100 cm and 7.5 cm for the soil layer between 100 and 200 cm. The sample resolution was 5 cm for the first metre and 10 cm for the second metre. Compaction of the soil during sampling was negligible given the wide auger diameters. Soil samples were taken using Kopecky rings (diameter = 4 cm and height = 4 cm) in the open side of the auger. In total, 720 soil samples were collected, including 180 per transect and 30 per sampling location. We additionally collected leaves of the most abundant vegetation types at both the grassland and forest sampling sites.
2.3 Laboratory and data analyses
OC content, δ13C and 14C measurements
Soil and vegetation samples were first air-dried and later dried in an oven at 50 ∘C for several days. Soil samples were homogenized with a mortar and pestle. Liquid nitrogen was used while crushing the vegetation samples to facilitate their homogenization, and vegetation subsamples were placed in tin cups (8×5 mm). For each soil sample, a subsample was weighed into 8×5 mm Ag cups and acidified by adding a 40 µL HCl (10 %) solution to eliminate inorganic C. The methodology and efficacy of this acidification method are described in detail elsewhere (Kennedy et al., 2005; Komada et al., 2008).
Both soil and vegetation subsamples were analysed using an elemental analyser isotope ratio mass spectrometer (Thermo Flash HT/EA or CE 1110 coupled to a DELTA V Advantage) to determine the OC content and δ13C of soil OC and vegetation samples. Data calibrations were performed using multiple analyses of different standards within each run: caffeine (IAEA-600) and two in-house reference materials (leucine and tuna muscle tissue) which were calibrated versus certified standards. Reproducibility of δ13C measurements was better than ±0.2 ‰. Carbon isotope ratios are expressed in the δ notation:
where Rsample is the ratio of the sample, and Rstd is the ratio of the international standard V-PDB (Vienna Pee Dee Belemnite) (Hoefs, 2015). In principle, the contribution of C4 vegetation-derived carbon to the OC pool at grassland sites can be estimated by applying a simple mixing model:
where %C is the contribution of the C4 vegetation in the SOC expressed (in %) in grassland profile i at depth j, δ13C is the isotope ratio of the soil sample in grassland profile i at depth j, δ13Cg is the isotope ratio of grassland vegetation, and δ13Cf is the isotope ratio of forest vegetation.
However, this mixing model implicitly assumes that the δ13C ratio in a forest soil equals the δ13C ratio in C3 vegetation, which is not the case: δ13C values in soils under C3 vegetation tend to systematically deviate from those observed in near-ground vegetation, and these deviations vary with depth. Such variations can be accounted for by using a modified form of Eq. (2) whereby the δ13C signal measured under forest at the same depth is used as the reference rather than the δ13C of the C3 vegetation. Equation (2) then becomes
where δ13C is the average δ13C value of a soil sample taken under the C3 forest vegetation at the same depth.
For soils that have permanently been under C4 vegetation, evidence suggests that the difference between C4 values in soils and corresponding vegetation is relatively limited (Conrad et al., 2017; Desjardins et al., 2020) and that the variations in δ13C with depth are limited under C4 vegetation.
Here we used values ranging from −15 ‰ to −13 ‰ as the reference values for soils with C4 vegetation. These values are similar to the values observed by Conrad et al. (2017) in soils under permanent C4 vegetation in a research station in Gayndah, in southern Queensland, Australia. We then obtain
where δ13Cg,ref is the reference δ13C, i.e. the δ13C we expect for a soil profile that has permanently been under C4 vegetation (from −15 ‰ to −13 ‰). Finally, the contribution of C3 vegetation in the SOC in grassland profile i at depth j (expressed in %) will be
Radiocarbon analyses were performed on bulk soil organic matter of the surface soil samples (5–10 cm) for each sampling position of F2 and GLP. Additional 14C measurements were made at 20–25, 50–55 and 100–110 cm depth for GLP-T, GLP-V, F2-T and F2-V as well as at 5–10 cm depth for GLA-T, GLA-V, F1-T and F1-V (see details in the Excel file in the Supplement). These measurements were performed on bulk soil samples which were acidified to remove carbonates. Sample pre-treatment and 14C activity measurements were carried out at the Radiocarbon Laboratory of the Royal Institute of Cultural Heritage (Brussels, Belgium), using a MICADAS (mini carbon dating system) accelerator mass spectrometer.
In an open system such as a soil profile, there is a continuous exchange of C with the surrounding environment, and 14C measurements of bulk soil organic C should thus be interpreted with caution since it is influenced by the inputs and the outputs of C within the soil (Trumbore, 2009; Wang et al., 1996). Thus, while Δ14C data on bulk SOC do not necessarily correspond to absolute dates of the formation of the C within a given depth layer and thus do not suffice to precisely date the timing of a vegetation change, they at least provide a relative framework and shed light on how fast the SOC pool may respond in a changing environment (e.g. Desjardins et al., 2020; Krull et al., 2005; Trumbore, 2009). We used our actual 14C measurements of bulk SOC to calculate the percent modern carbon (pMC), as recommended for an open system such as soil (Reimer et al., 2004; Schuur et al., 2016). The pMC reflects the incorporation of C fixed from the atmosphere since atomic weapon testing in the early 1950s, which nearly doubled the activity of 14C in the atmosphere (Reimer et al., 2004). A pMC greater than 100 % indicates that the majority of SOC bulk was fixed post-1950s (Krull et al., 2005; Trumbore, 2009). We also provide data expressed in radiocarbon ages (years BP, see the Supplement). For a sample where pMC > 100 %, no 14C age is provided since these indicate the presence of bomb-derived carbon (post-1950s) (Krull et al., 2005).
2.4 Dry bulk density and estimation of carbon stock
The dry bulk density (ρd) was calculated by using the dry weight of the soil samples and the known volume of the Kopecky rings. Absolute cumulative SOC stocks were calculated by integrating the carbon amount of each depth interval using the dry bulk density and the organic carbon concentration:
where q(i) is the carbon stock in soil depth interval i (units converted into Mg C ha−1), %OC(i) is organic carbon content in soil depth interval i, D(i) is the thickness of horizon i (cm), and ρd(i) is dry bulk density of the soil depth interval i (g cm−3). The estimated absolute value of the cumulative SOC stock (Q(z)) is the amount of SOC stored between the soil surface and soil depth z (Cerri et al., 2007).
The relative value of the cumulative SOC stocks at depth z (R(z), %) was calculated as the ratio of the absolute value of the cumulative SOC stock at this depth (Q(z)) to the absolute value of the SOC stock for the whole soil profile (i.e. between 0 and 2 m depth, Q):
Soil texture analyses
To analyse the soil texture, we pre-treated dry soil subsamples (15 to 20 g) with HCl (5 %) to remove carbonates. Subsequently, organic matter was removed with a H2O2 (35 %) solution at 40 ∘C, and each soil subsample was washed with demineralized water. A peptizing solution of 50 mL sodium oxalate and sodium carbonate was added to the pre-treated soil samples. Afterwards, water was added to 150 mL, and the mixture was boiled for 10 min and allowed to cool to room temperature. Sand (0.63–2 mm) was separated by wet sieving, and silt (2–63 µm) and clay (<2 µm) fractions were determined by sedimentation and decantation. Material retained and collected from sieves and decantation was oven-dried and weighed.
2.5 Statistical analyses
Overall comparisons between two groups were done using Student's t test if the data were normally distributed and passed an equal variance test. For non-normally distributed data, non-parametric tests (Mann–Whitney U test) were used. Differences were considered statistically significant at P<0.05. To compare more than two groups, standard one-way analysis of variance was performed, with parametric pairwise test (Tukey's honestly significant difference test) comparisons for normally distributed data. Non-parametric tests using one-way analysis of variance on ranks (Kruskal–Wallis), followed by non-parametric pairwise comparison (Dunn's test), were used for non-normally distributed data. The relationship between δ13C and pMC of SOC was tested using ordinary Pearson correlation and least squares linear regressions. Linear regressions were used despite not having an explicit independent variable as we sought only the presence or absence of a relationship between pMC and δ13C of SOC.
3.1 Soil texture for grassland and forest soils
For the transects under forest, the proportion of clays ranged between 46.3 % and 50.2 %, silt ranged between 8.5 % and 15.2 %, and the sand fraction constituted between 36.1 % and 43.6 % of the soil mass. For the transects under grassland, clays were the dominant fraction (39.5 %–52.4 %), followed by sand (28.2 %–46.7 %) and silt (3.0 %–26.9 %). There were no significant differences in texture of soils under grassland and forest (p-value = 0.7 (sand), p-value = 0.7 (silt) and p-value = 0.2 (clay)). Soil texture under both grassland and forest was thus classified as sandy clays to clays (Fig. S5).
3.2 Organic carbon content and stable carbon isotope of forest soil and vegetation
The OC content of the forest profiles ranged between 1.5 % and 4.6 % for F1 and between 2.9 % and 5.6 % for F2 for the topsoil samples (0–5 cm; Fig. 2a and b). Overall, the percent of OC (%OC) trends of the profiles were similar for the different sampling locations, where the %OC was highest in the topsoil, decreasing exponentially with depth over the first ∼ 60 cm. At 190 cm depth, %OC decreased to 0.1 %–0.3 % for both profiles. For forest transect F1, %OC content in the upper ca. 60 cm was higher at the UM and LM positions compared to the other hillslope positions. These differences were particularly apparent in the upper ca. ∼ 20 cm of the profile. This difference between the hillslope positions was less marked in F2. However, the %OC was highest for the F2-B, F2-UM and F2-LM when compared to the F2-V, F2-T and F2-M at 0–20 cm depth.

Figure 2Depth profiles of %OC for each sampling location (top, upper middle, middle, lower middle, bottom, valley) of the four transects including F1 (a), F2 (b), GLA (c) and GLP (d).
At the surface, the δ13C values only showed minor variations, ranging between −27.1 ‰ and −25.5 ‰ (0–5 cm; Fig. 3a and b). δ13C values increased with depth and reached a value of ‰ at a depth of 60 cm. Below this depth, δ13C values no longer showed a systematic variation with depth but varied within a narrow range. No distinct trends were observed for the different sampling positions, in which only the δ13C of F1-T was slightly higher throughout depth when compared to the other sampling positions. δ13C values of profiles under forest (F1 and F2) did not differ significantly in the upper 50 cm depth of the profiles (Table S1 in the Supplement). The vegetation samples from the forest showed δ13C values that are clearly lower than those observed in the forest soils, with values between −35.8 ‰ and −30.5 ‰ with an average δ13C value of ‰ (n=10).

Figure 3Depth profiles of δ13C for each sampling location (top, upper middle, middle, lower middle, bottom, valley) of the four transects including F1 (a), F2 (b), GLA (c) and GLP (d).
3.3 Organic carbon content and carbon isotope ratios of grassland soil and vegetation
The SOC content of the grassland soil in the upper layers is much lower than that in the forest soil and ranges between 0.4 % and 1.5 % for GLA and between 0.7 % and 1.7 % for GLP (0–5 cm; Fig. 2c and d). Most grassland profiles show a similar relation between SOC content and depth: the SOC content decreases from values between ca. 0.7 % and 1.3 % at the top to values of ca. 0.2 % below 1 m depth. However, there are exceptions: in the first few decimetres, the GLA-M and GLA-LM profiles have lower SOC than the other profiles. The valley profiles are also different: both have much higher SOC values than the other hillslope profiles in the top 30 cm. At the GLP profile, the SOC content of the valley profile is higher than that of other profiles down to a depth of ca. 100 cm. %OC values do not differ significantly in the upper 0–50 cm depth for GLA and GLP for all profile positions (Table S1).
On both grassland hillslopes, δ13C values are clearly higher for the valley profiles in comparison to the hillslope profiles, with the absolute differences being largest down to a depth of 40 cm for the GLA site and down to ca. 60 cm at the GLP site (Fig. 3c and d). The variation in δ13C values with depth is similar on most hillslope positions under grassland: on all sites, δ13C values vary within a relatively narrow range (from −24 ‰ to −20 ‰) below a depth of 40 cm. Above 40 cm, some profiles (GLP-B, GLP-UM, GLA-UM and GLA-T) show a gradual decline of δ13C values with depth, with maximum δ13C values of ca. −16 ‰ at the top. In most profiles, however, the decline of δ13C with depth is much smaller or even non-existent. δ13C values of profiles under grassland (GLA and GLP) did not differ significantly in the upper 0–50 cm of the profiles (Table S1). Soil δ13C values are consistently lower than those observed in the vegetation: the δ13C of the grassland vegetation ranges between −13.4 ‰ and −11.4 ‰ with an average value of ‰ (n=7).
3.4 Soil organic carbon stocks for grassland and forest soil profiles
For all hillslope positions, the absolute values of the cumulative SOC stocks were consistently higher in forest profiles, irrespective of the lower depth considered to integrate the SOC stock (Fig. 4). However, in the valley profile, the absolute cumulative SOC stock under grassland is similar to that under forest for every soil layer. Both for the forested (F1 and F2) and grassland transects (GLA and GLP), no major differences in SOC stocks were observed between both profiles (Table S1). SOC stocks at the valley position were significantly different from all other hillslope positions under grassland (Table S2).
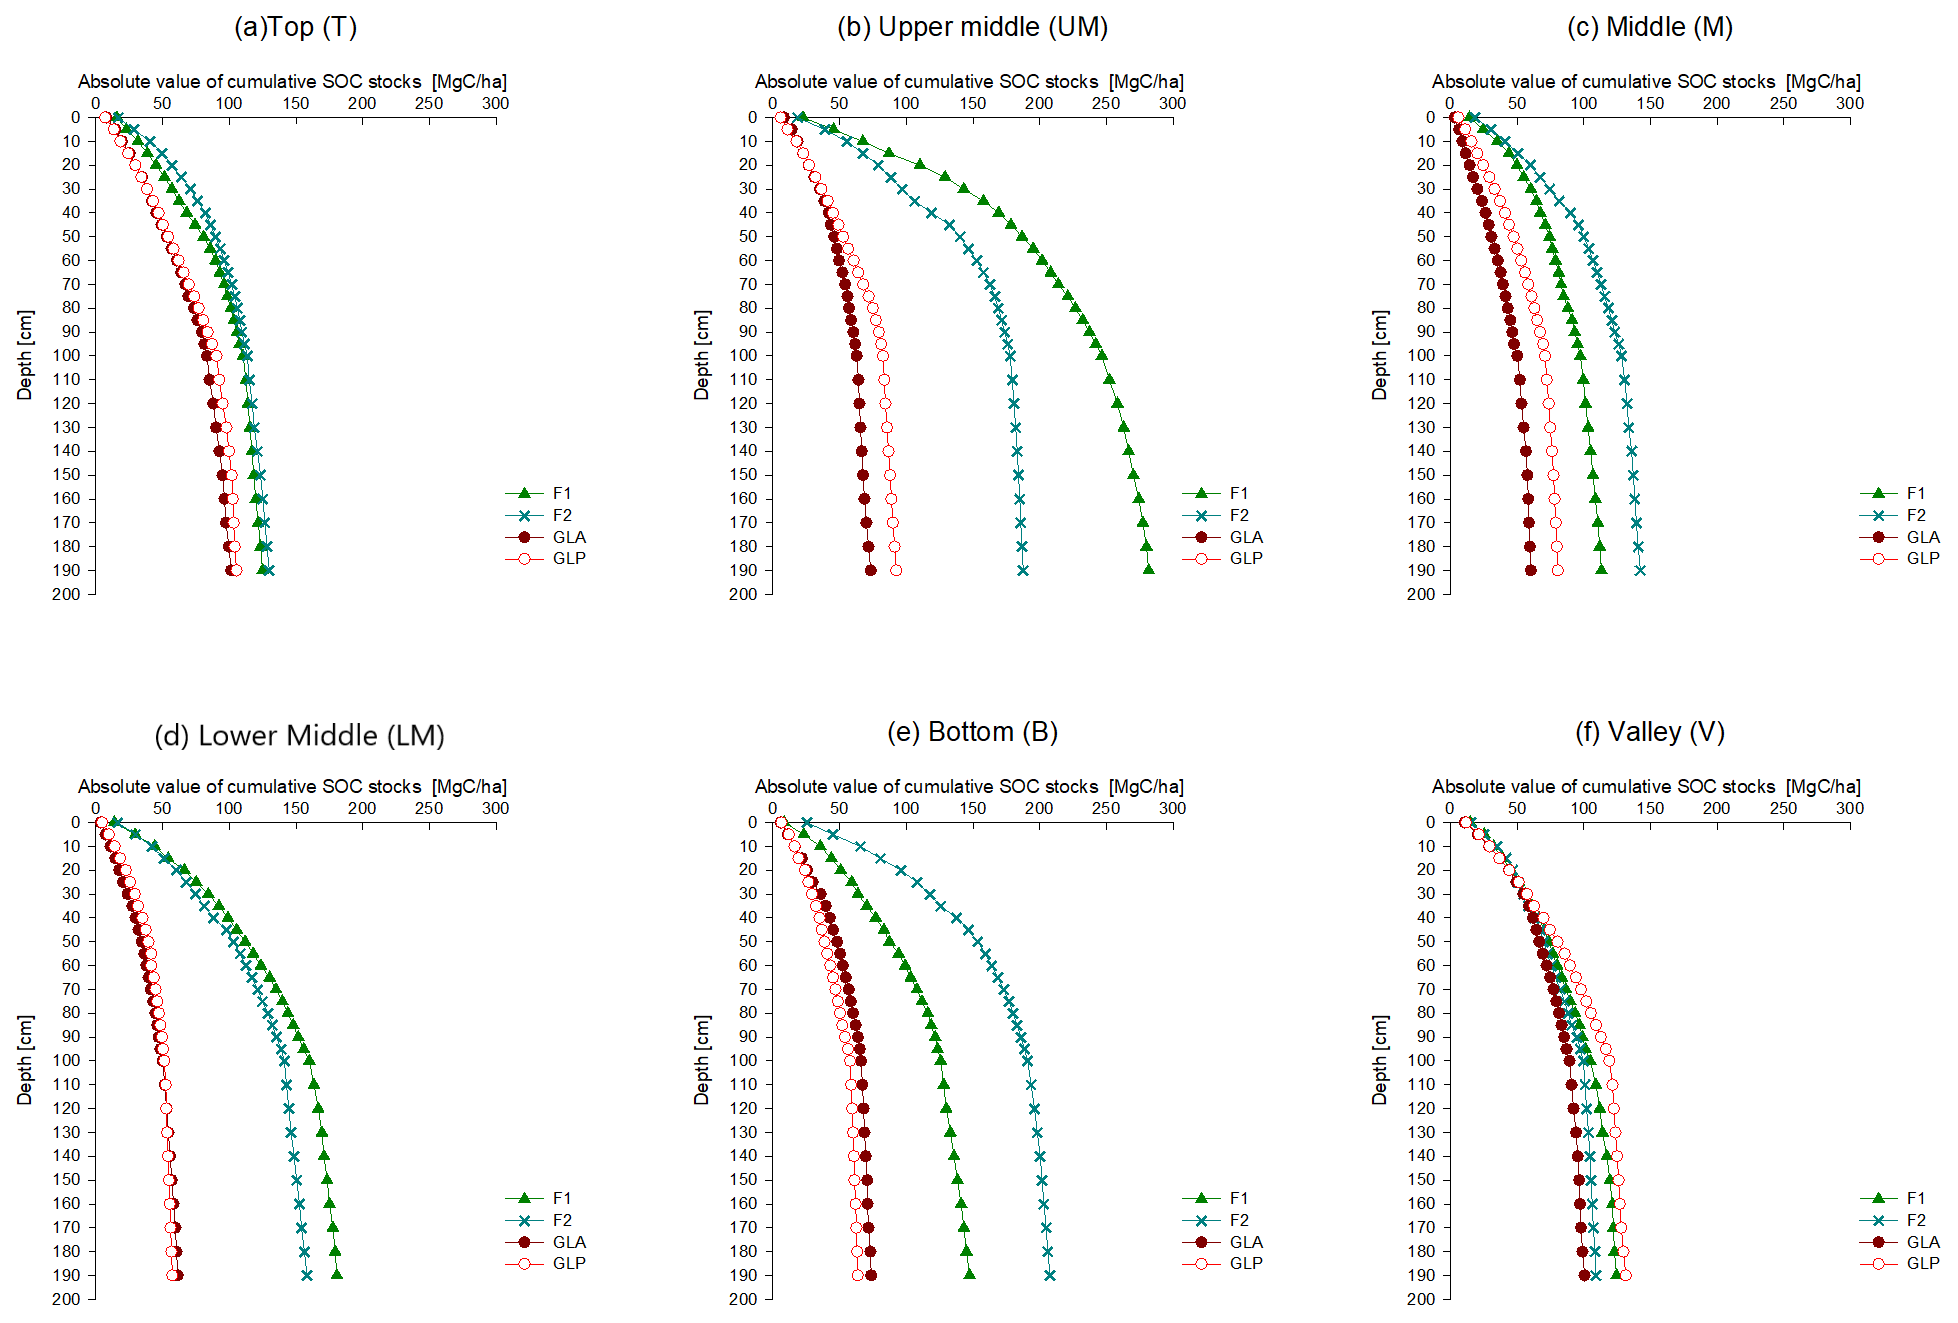
Figure 4Absolute values of cumulative SOC stocks of hillslopes F1, F2, GLA and GLP plotted together for each sampling location: (a) Top, (b) Upper Middle, (c) Middle, (d) Lower Middle, (e) Bottom and (f) Valley.
3.5 14C analyses of bulk SOC
We measured the 14C activity of bulk SOC at different depths in both grassland and forest profiles (5–10, 20–25, 50–60 and 100–110 cm). The 14C activity of the bulk SOC is plotted against the δ13C of SOC in Fig. 5. Along the forest transect, all surface samples at the top and valley positions showed a pMC value greater than 100 %, indicating a significant contribution from bomb-derived carbon (post-1950). The pMC values of the forest soil samples (F2-T and F2-V) decrease to 42 %–52 % at a depth of 50 cm. This decrease in pMC with depth is associated with a modest increase in δ13C.
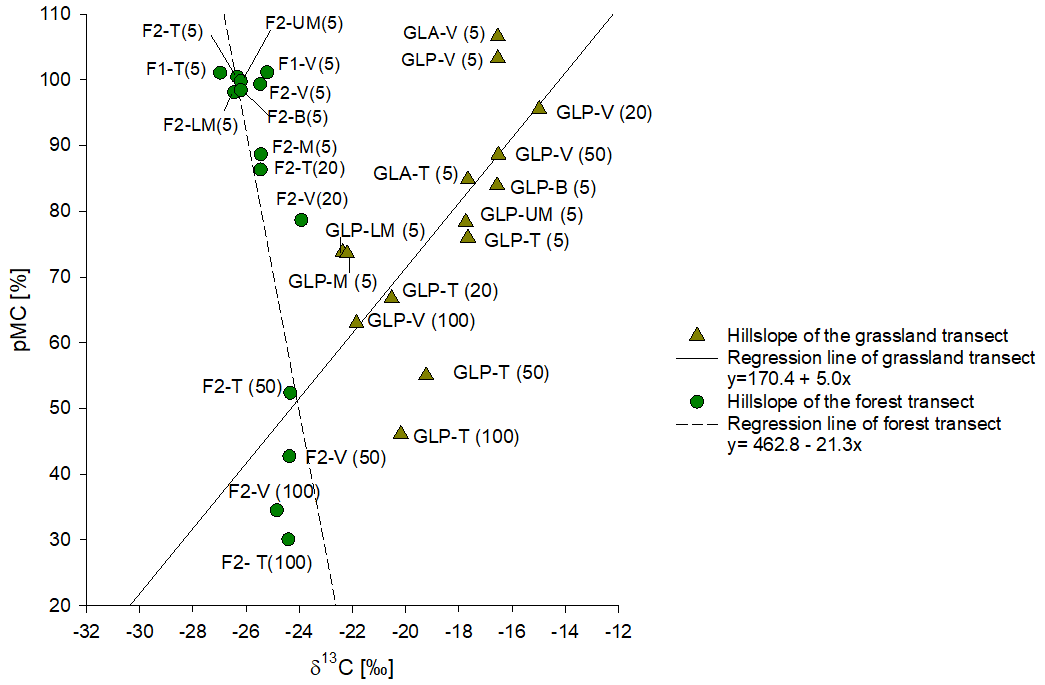
Figure 5Comparison of the average value of 14C pMC of bulk SOC plotted against δ13C of SOC of grassland and forested soil. Each point is labelled by the transect position and the top depth interval. Continuous and dotted black lines represent the regression lines for grassland soil data and forest soil data, respectively.
For the grassland transect, samples from the soil surface layer (5–10 cm) on the hillslopes show clearly lower pMC values in comparison to the forest sites, ranging between 78 % and 85 %. At the valley position, topsoil samples from both grassland transects have pMC values greater than 100 % (106 % and 103 % respectively), slightly higher than the pMC values observed for topsoils in the valley positions under forests. The pMC values of bulk SOC decrease with increasing depth down to 60 % at 100 cm depth (GLP-T; Fig. S6). The pMC values under grassland at depth are generally higher than the pMC values observed under forest at similar positions. Under grasslands, the decrease in pMC with depth is associated with a decrease in δ13C (Fig. 5).
4.1 Difference in carbon sources between grassland and forest soils
δ13C depth profiles of forest soils (Fig. 3a and b) are similar to those observed in the primary vegetated forest of Didy, located ca. 60 km south of our forest sampling locations (Winowiecki et al., 2017). They reported a median value of −27 ‰ in the forest topsoil and also found that δ13C increased with depth. One partial explanation for the 13C enrichment with depth under forest is the Suess effect which leads to a gradual decrease in the δ13C values of atmospheric CO2 over time (Keeling et al., 2017). In our forest profiles, an increase in δ13C values of 2 ‰–3 ‰ over the upper 60 cm is observed (Fig. 3a and b). Given the magnitude of the Suess effect (2 ‰ over the past 250 years; Keeling et al., 2017), the variations in δ13C that we observe in the forest soil profiles may, to a large extent, be ascribed to the Suess effect. An additional explanation for 13C enrichment with depth commonly observed in soil profiles is that the soil microbial biomass is generally more 13C-enriched than its substrate, and soil organic matter therefore typically becomes more enriched in 13C due to the incorporation of microbial biomass or microbially derived C (Ehleringer et al., 2000). It has been shown that SOC in deeper soil layers is in a more advanced stage of decomposition and is increasingly composed of stable microbially derived SOC (Domeignoz-Horta et al., 2021; Kallenbach et al., 2016; Schlesinger, 1977).
The δ13C values of forest vegetation ( ‰) are consistent with a C3 vegetation signature. However, they are ca. 3 ‰ lower than the value estimated from the empirical relationship of Kohn (2010) that predicts the δ13C values of C3 vegetation based on annual precipitation, latitude and altitude (−29 ‰). As the vegetation samples were collected by hand and thus taken not far above the soil surface, the lower measured values could be due to the “understorey effect”. The understorey effect or canopy effect found in tropical forest is mainly related to the gradient in δ13C of ambient CO2 along the vertical gradient: δ13C-CO2 is low close to the ground due to elevated CO2 concentrations via the contribution of soil respiration. Higher up in the canopy, the δ13C-CO2 values are closer to the average atmospheric CO2 composition. Kohn (2010) recommends −31.5 ‰ as a cut-off value for identifying the understorey effect in a closed-canopy forest such as the Zahamena National Park.
In contrast to the forest profiles, SOC profiles on the grassland transects show a decline of δ13C with depth (Fig. 3c and d). Some of our profiles, such as GLP-UM and GLP-B, show a very clear decrease in δ13C in the upper 40 cm of the soil profile (from ca. −16 ‰ to ca. −22 ‰; Fig. 3d). In most profiles, however, δ13C values of −20 ‰ down to −23 ‰ are observed in the top layer, and values decrease very gradually over the whole depth of the profile with minimum values of −23 ‰ to −24 ‰ at 2 m depth.
The δ13C soil value of the SOC depends on the δ13C value of the aboveground vegetation and the corresponding litter that gets incorporated into the soil profile over the period which is represented by the remaining SOC (Burney, 2004; Bird et al., 2003). The δ13C average value of the vegetation in the grassland transects ( ‰) is a typical value for grassland plant species (C4 plants) and is consistent with the value found in a C4-species-dominated basin in Madagascar ( ‰; Marwick et al., 2014). If C4 vegetation would have been dominant for a long time on the hillslopes, we would therefore expect topsoil δ13C values typically between −15 ‰ to −13 ‰, with little variation with depth as observed in the few studies documenting soil δ13C profiles under long-term C4 vegetation (Conrad et al., 2017). In contrast, while a few of our grassland soil δ13C profiles have topsoil δ13C values that are consistent with the current C4 vegetation (GLP-UM, GLP-B and GLA-T), most surface soil samples show a δ13C value that is lower than would be expected of soils under C4 vegetation. This suggests that, even in the topsoil, an important fraction of the SOC is derived from C3 vegetation. Using the average δ13C of the forest soils as the C3 endmember (δ13C = ‰) and using the values found by Conrad et al. (2017) as the C4 endmember (values range from −15 ‰ and −13 ‰ with mean value of −13.8 ‰), the contribution of C3 plant material to the SOC present in the upper 0–55 cm of these grassland soil profiles is estimated at ca. 70 %, with the exception of the valley position (Fig. 6).

Figure 6Variation with depth of the fraction of remaining forest SOC for the grassland profiles. The black line represents the variation in %C3 by taking −13.8 ‰ as the reference value of δ13C SOC under permanent C4 vegetation. The grey area represents the range of %C3 by using a reference range of −15 ‰ to −13 ‰ as the δ13C SOC under permanent C4 vegetation.
In contrast to the other grassland hillslope profiles, surface δ13C values of the valley positions are closer to the expected δ13C value of grassland vegetation, with an average value of ‰. For GLP-V, the δ13C values increase between the surface and 50 cm. This suggests a much higher incorporation of OC from C4 vegetation in the valleys in comparison to the hillslopes (Fig. 6).
The same processes that cause an increase in δ13C with depth under C3 vegetation (Suess effect and microbial processing) would be expected to also lead to an increase in δ13C with depth for grassland profiles if the latter would have fully developed under C4 vegetation. However, we observed an opposite pattern: δ13C decreases with depth under grassland vegetation (Fig. 3c and d). Desjardins et al. (2013) observed a similar depletion in δ13C with depth in soils under tropical savannah (C4) vegetation in central Cameroon. At the surface, the δ13C values ranged from −16.4 ‰ to −13.9 ‰ and decreased towards −21.9 ‰ and −22.3 ‰ at between 2 and 4 m depth. They interpreted this decrease in δ13C with depth as the result of a C3 to C4 vegetation shift. While the relatively young SOC at the top of the profiles was primarily derived from C4 plants (resulting in a high δ13C), the older SOC in the lower part of the profile was primarily a relic from the time when the landscape was covered by forest (with a low δ13C). Sanaiotti et al. (2002) reported similar results from a savannah landscape in the Amazon region where the δ13C signatures of soil organic matter under savannah areas converged to the signature of a nearby forest at greater depths. Therefore, it was assumed that the savannah areas had replaced forested areas during the Holocene period (Sanaiotti et al., 2002). Importantly, a decline of δ13C with depth towards the values reported in these studies and similar to those we observed is not always observed under C4 vegetation. For instance, Martin et al. (1990) describe profiles under C4 savannah where δ13C values are always above −17 ‰ down to depths of 120 cm and showed little systematic variation with depth, except for somewhat lower values for the deepest horizon that was sampled. This is to be expected in systems which have been under C4 vegetation for very long time spans: indeed, both the Suess effect and fractionation during microbial decomposition of SOC are expected to lead to an increase in δ13C under C4 vegetation as well.
Similar to Desjardins et al. (2013) and Sanaiotti et al. (2002), we observed a clear convergence of the grassland soil profiles towards the forest signature of −24.0 ‰ to −23.0 ‰ with depth, except for the valley sites (Fig. S7). At the surface, the average difference is ∼ 6.6 ‰, declining to ∼ 1.5 ‰ at 1 m depth. The average difference never becomes zero, except for the UM slope position, suggesting that there may be some contribution from C4 plants to the SOC pool at all depths.
This pattern, where the δ13C value of grassland converges towards the δ13C value of forested soil with depth, is best explained by assuming that the vegetation of the grassland hillslopes we sampled has changed rather dramatically from a vegetation that was most likely dominated by C3 plants (thus most likely a forest or wooded savannah) to an open vegetation completely dominated by C4 vegetation. The higher δ13C values we observed in the upper part of some of the profiles (GLA-T, GLP-UM and GLP-B) suggest that deforestation may have occurred in patches and that the locations of these profiles were deforested first, resulting in topsoil SOC pools with a higher δ13C value in comparison to more recently deforested locations. The fact that the δ13C profiles measured at GLA-T, GLP-UM and GLP-B also converge to the forest profiles at depth suggests that also these locations originally had a tree-rich vegetation cover but that this tree cover was removed earlier than in the other locations.
The results for the valley locations are different: here the SOC has a δ13C value reflecting a C4 vegetation down to 50 cm, and also below this depth, the forest and grassland profiles remain significantly different, with higher δ13C values under grassland (p-value < 0.001). The difference at depth compared to other locations suggests that the vegetation in the valleys has had an important fraction of C4 plants for a very long time allowing the slow-cycling SOC pools stored at greater depth to acquire a δ13C signature significantly affected by C4 vegetation (ca. 43 %). In addition, we observed more dense grass vegetation in the valley positions compared to other profile positions (Figs. S2 and S4). The higher δ13C values observed in the upper part of the valley profiles (0–40 cm for GLP-V) suggest that also in these landscape positions the relative importance of C4 vegetation has recently increased, but lateral transfers may also play a role via erosion of recent C4 inputs from the upper slopes and subsequent deposition in the valley.
Within our profiles, we only observed pMC values > 100 % in some upper layers (<10 cm) of forest sites and at the valley position of the grassland soil transects (Fig. 5). In contrast, the SOC at 5–10 cm depth in the grassland hillslope sites always showed pMC values lower than 85 %. At the same time, the δ13C data indicate that a significant fraction (ca. ∼ 65 %) of the SOC at these sites is still C3-derived in most grassland profiles (Fig. 6) despite the current dominance of C4 grasses. Thus, the 14C data corroborate the δ13C results and suggest that a significant fraction of the grassland soil SOC is relatively old and was formed when these locations were still under forest. This, in combination with a low degree of SOC replacement after the vegetation transition, results in the presence of a mixed δ13C signal in combination with a relatively low pMC. The low replenishment/replacement of SOC from the grassland vegetation may be partly explained by (over-)grazing and fire activity, both of which should reduce the organic inputs from C4 vegetation after deforestation (Abril et al., 2005; Bond and Keeley, 2005). A second mechanism possibly contributing to the lower δ13C and pMC values of surface soils along the grassland transect is that the soil might have been subjected to more intense surface erosion after the vegetation shift, thereby constantly removing young SOC (with a higher δ13C value) towards the valley position. This is confirmed by soil erosion rates derived from in situ 10Be analysis of the topsoil samples (5–15 cm) which indicates that on a convex hillslope, both under grassland and forest, erosion rates increase from the top towards the valley position, where the erosion rates are consistently higher under grassland when compared to forest (Liesa Brosens et al., unpublished data).
For the grassland transects, significant differences were observed in %OC, δ13C and SOC stocks between the valley and other hillslope positions (T, UM, M, LM and B; Table S2). SOC stocks and surface δ13C values on the upper slope were lower than at the valley positions. δ13C values on the upper slope positions (T, UM, M, LM and B) were slightly higher than those of forest soils at corresponding depths (Fig. S7). Erosion rates in the upslope positions are expected to have increased after deforestation. Restrepo et al. (2015) have reported a 33 % increase in erosion rates 30 years after deforestation in the Colombian Andes. This erosion leads to losses of SOC (Don et al., 2011; Rabetokotany-Rarivoson et al., 2015). Even though surface erosion itself is not associated with isotope fractionation, it indirectly influences SOC δ13C values by removing the surface layer and exposing the deeper soil layer, where SOC is a mixture of SOC from the subsoil and fresh OC from the vegetation. Thus, erosion can lead to different δ13C values (Häring et al., 2013), and this process could contribute to the higher SOC stocks and δ13C values observed in the valley positions for the grassland transect. However, under forest (C3 vegetation), no substantial differences in the δ13C are observed along the transects (Table S2). This suggests that erosion might not play a major role in the variation in δ13C in a forest-dominated landscape as significant erosion would have led to SOC accumulation in the valley position.
The high pMC of SOC in the grassland valley position (GLP-V) is consistent with the idea that this site acts as a depositional area for recently eroded C. It can be noticed that also in the valley sites, pMC decreases with depth (Fig. S6), which is consistent with a significant local production of SOC. On the other hand, pMC values in the valley sites are clearly higher than those observed on the forest and grassland hillslopes, at least for depths <55 cm: this suggests a significant addition of young eroded SOC. Surface erosion is expected to be variable across topographic positions along the hillslope transect, with minimal impact at the top and maximum impact on the steeper sections towards the bottom of the hillslope transect. However, no consistent variation in topsoil pMC values was observed along the grassland transect (Fig. S6). Within the grassland profiles, there is a clear positive relationship between δ13C values and 14C activity (R2 = 0.7, P-value = 0.006; Fig. 5), whereby older SOC corresponds to a higher contribution of C3-derived (forest) C. In contrast, for sites under current forest vegetation, the upper soil layer contains mostly young OC (pMC > 100 %), and these profiles are dominated by C3-derived C throughout the range of 14C activities they represent. In addition, pMC values of grassland soil profiles converge to the pMC values observed in the forest soil profiles at greater depths (Fig. 5).
4.2 Response of SOC stocks to vegetation transition
The average SOC stock we measured in the upper layer (0–30 cm) of our grassland transect of 33 ± 9 Mg C ha−1 and 30±11 Mg C ha−1 (Table S3) is clearly lower than the average stock found in Ferralsols under grassland in Madagascar, with an average of 77±33 (n=8) Mg C ha−1, and is in the same range as Luvisols and Arenosols under grassland with an average of 49±33 Mg C ha−1 (n=4) (Chevallier et al., 2020).
The SOC stocks in our forest transect of 70–74 Mg C ha−1 (0–30 cm) and 137–139 Mg C ha−1 (0–100 cm) are similar to those of Grinand et al. (2017), who conducted a field study in the southeast humid forest of Madagascar and measured SOC stocks of 70–131 Mg C ha−1 in the upper 30 cm and 139–296 Mg C ha−1 in the upper 100 cm. In addition to this, they found that the SOC stock in the upper 30 cm accounts for half (49 %) of the SOC stored in the upper 100 cm. Rabetokotany-Rarivoson et al. (2015) observed a wide range of SOC stocks between 39 and 233 Mg C ha−1 for the upper 30 cm in the humid eastern forest. The average values they reported for both soil layers were 110 Mg C ha−1 (0–30 cm) and 226 Mg C ha−1 (0–100 cm), showing that 49 % of the SOC of the 0–100 cm soil layer is stored in the upper 30 cm. Andriamananjara et al. (2017) measured SOC stocks sampled in the eastern humid forest of Madagascar and reported an average cumulative SOC stock of 90 Mg C ha−1 (0–30 cm) and 137 Mg C ha−1 (0–100 cm), which are also similar to the reported values in our study.
By comparing the absolute value of cumulative SOC stocks under forest and grassland, it can be seen that total stocks are clearly higher under forest, except in the valley (Fig. 4).
The first-order control on the SOC stock of the soil is the balance between inputs and outputs of carbon in soils (Davidson and Janssens, 2006). These inputs include vegetation such as litter and roots from biomass, while the outputs include CO2 emissions, erosion and leaching of dissolved organic matter into the groundwater. Deforestation has a significant impact on SOC stocks, primarily because carbon inputs are reduced. Grinand et al. (2017) estimated an average change in SOC stocks of −10.7 % and −5.2 % in the 0–30 and 0–100 cm soil layers when forest is converted to grassland in the humid ecoregion of Madagascar over a 20-year time span. In addition, a study of tropical soils by Don et al. (2011) reports an estimated −12 % change in SOC stock when the primary forest is converted to grassland over a 25-year time span. However, when comparing the grassland SOC stocks with the forest SOC stocks for our profiles, an average loss of −55.7 % is observed in the upper 30 cm soil layer, which is much higher than in the aforementioned studies. Several factors may explain this difference. The studies of Don et al. (2011) and Grinand et al. (2017) report changes over a period of 20–25 years after deforestation. The fact that we find a much larger reduction in SOC stock may be due to the fact that deforestation has occurred much longer ago at the sites we sampled. It is often assumed that the major change in SOC occurs during the first 5 years after deforestation, and a new SOC equilibrium is reached between 20 and 40 years (Cerri et al., 2007). Our data suggest that this may not be the case in the environment we studied: this may be due to the large difference in SOC production between grasslands and forests. Indeed, our data suggest that even today, a large fraction of the SOC that is present under grassland was produced when the grassland sites were under C3 vegetation. Similar observations were reported by several authors in landscapes where forest vegetation had been transformed into grassland more than a 1000 years ago, showing evidence that C3-derived carbon can remain present for millennia after the replacement of the original vegetation (Desjardins et al., 2013; Guillet et al., 2001; Schwartz et al., 1986). Rabetokotany-Rarivoson et al. (2015) and Razafindrakoto et al. (2018) found a strong difference in SOC stocks between the initial forest vegetation and the final stage of deforestation (i.e. a landscape dominated by grasses). This suggests that due to the low SOC productivity of savannah systems, the time needed to reach a new equilibrium SOC stock is indeed in the order of centuries to millennia rather than decades (Wutzler and Reichstein, 2007).
As opposed to what we found on the other hillslope positions, the SOC stocks under forest and grassland are relatively similar in the valley positions (Fig. 4). There are two mutually, non-exclusive mechanisms that can explain this observation: first, the valleys may have been permanently covered by C4 vegetation that is much more productive than the vegetation on the hillslopes. This is indeed highly likely: the valleys are clearly much wetter than the hillslopes and are locations where nutrients eroded from the hillslopes may accumulate. Second, part of the SOC found at the valley locations may not have been produced locally but may result from lateral transport of SOC through erosion from the hillslopes.
We report soil organic carbon and δ13C profiles from hillslope transects in both forested and grassland sites in the Lake Alaotra region in the central highlands of Madagascar, a region characterized by a high density of intense erosion features (lavaka). The δ13C values of the forest soil profiles are typical of soils developed under C3 vegetation for a very long time. In contrast, the δ13C values of the grassland soil profiles decreased with depth and showed a clear convergence towards the forest δ13C signature at depths below ∼ 80 cm. These δ13C trends indicate a C3 to C4 vegetation shift in the present-day grasslands close to the Zahamena National Park. While the SOC stocks of the forest were in the same range as those reported in other parts of Madagascar's humid forest ecoregion, grassland SOC stocks were substantially lower (by ∼ 48 %–56 % over the entire 2 m profile) than those of the forest. Topsoil (0–5 cm) δ13C values under grassland indicate that the middle and the lower middle profiles were most vulnerable to erosion and that the valley position acts as a depositional zone. Despite the absence of substantial new inputs from C3 vegetation, the bulk of the SOC stocks remains largely dominated (70 %) by (old) C3 vegetation. 14C measurements of bulk SOC of the topsoil in the top, middle and lower middle positions under grassland furthermore show that soil organic carbon contains less modern carbon at the surface. For the valley position of our grassland transects, the surface SOC with a higher δ13C consists of modern carbon indicating a late expansion of C4 vegetation. Overall, in our study area where human pressure is high, current grass covers have expanded strongly to the detriment of forest. The hillslope soil profile data give explicit information on the aboveground vegetation shift in the past. Our study does not only show that these changes are indeed reflected in the OC characteristics in the hillslope and valley soils of the area but also allows us to make an estimate of the impact of anthropogenic deforestation and water erosion on soil carbon inventories in a tropical environment. A strong decline of the soil organic carbon content is detected under grassland, which is only half of that under forest conditions. This very strong reduction can be attributed to the low net C4 input since deforestation: more than half of the OC stored under grasslands is still C3-derived. In addition, there is a limited contribution of C4 grass production to the soil organic carbon pool. This indicates that the time since deforestation is likely to be reflected in the fraction of the SOC pool that has been mineralized or lost. Our results are consistent with the hypothesis that a vegetation shift has occurred in the Lake Alaotra region and offer a promising avenue to expand this approach on a wider scale to help us understand the vegetation cover changes in the central highlands of Madagascar. A soil organic carbon model combining stable and radiocarbon isotope data could offer a valuable tool to determine the timing of the vegetation change in the Lake Alaotra landscape.
All data generated in this study are available in the Supplement.
The supplement related to this article is available online at: https://doi.org/10.5194/bg-19-3825-2022-supplement.
GG, SB, BC and LJ with contribution from LB and VFR designed the study project. TaR, ToR and LJ helped supervise the project. LB and VFR planned fieldwork and collected samples. MD contributed to forest profile sampling and the analyses of these samples. VFR analysed grassland soil samples and wrote the manuscript with SB and MD. All authors provided critical feedback and helped shape the research, analysis and manuscript.
The contact author has declared that none of the authors has any competing interests.
Publisher's note: Copernicus Publications remains neutral with regard to jurisdictional claims in published maps and institutional affiliations.
This research is part of the MaLESA (Malagasy Lavaka, Environmental reconstruction and Sediment Archives) project funded by KU Leuven (Special Research Fund). Travel and research grants were provided by YouReCa and FWO. We thank two anonymous reviewers for their constructive inputs, which greatly improved our manuscript. We thank Zita Kelemen, Lore Fondu, Christophe Coeck, Cedric Morana, Elvira Vassilieva, Jasper Verdonck and Yannick Stroobandt (KU Leuven), Marie Paule Razafimanantsoa, Modeste Rakontondramanana, Mamimbola Elysé Rakotonirina and Fidy Raharison (LRI, Antananarivo), and Mathieu Boudin (KIK/IRPA, Brussels) for technical and analytical assistance. We also thank Marijn Van de Broek, Ny Riavo Gilbertinie Voarintsoa, Ronadh Cox and Michel Mietton for constructive input and discussions. We thank MNP (Madagascar National Parks) and MEDD (Ministère de l'Environment et de Development Durable) of Madagascar for authorizing sample collection in the protected area of the Zahamena National Park.
This research has been supported by the Onderzoeksraad, KU Leuven (grant no. C14/17/052) and the Fonds Wetenschappelijk Onderzoek (grant nos. V436719N, 12Z6518N, and 11B6921N).
This paper was edited by Edzo Veldkamp and reviewed by two anonymous referees.
Abril, A., Barttfeld, P., and Bucher, E. H.: The effect of fire and overgrazing disturbes on soil carbon balance in the Dry Chaco forest, Forest Ecol. Manage., 206, 399–405, https://doi.org/10.1016/j.foreco.2004.11.014, 2005.
Andriamampianina, J.: Nature Reserves and Nature Conservation in Madagascar, in Key Environments: Madagascar, edited by: Jolly, A., Oberle, P., Albignac, R., 219–228, Elsevier, https://doi.org/10.1016/B978-0-08-028002-8.50023-X, 1984.
Andriamananjara, A., Hewson, J., Razakamanarivo, H., Andrisoa, R. H., Ranaivoson, N., Ramboatiana, N., Razafindrakoto, M., Ramifehiarivo, N., Razafimanantsoa, M.-P., Rabeharisoa, L., Ramananantoandro, T., Rasolohery, A., Rabetokotany, N., and Razafimbelo, T.: Land cover impacts on aboveground and soil carbon stocks in Malagasy rainforest, Agr. Ecosyst. Environ., 233, 1–15, https://doi.org/10.1016/j.agee.2016.08.030, 2016.
Andriamananjara, A., Ranaivoson, N., Razafimbelo, T., Hewson, J., Ramifehiarivo, N., Rasolohery, A., Andrisoa, R. H., Razafindrakoto, M. A., Razafimanantsoa, M. P., Rabetokotany, N., and Razakamanarivo, R. H.: Towards a better understanding of soil organic carbon variation in Madagascar, Eur. J. Soil Sci., 68, 930–940, https://doi.org/10.1111/ejss.12473, 2017.
Aubréville, A. and Bossanyi, I.: Erosion under Forest Cover and Erosion in Deforested Areas in the Humid Tropical Zone, Bois Fôr. Trop., 323, 103–112, https://doi.org/10.19182/bft2015.323.a31259, 2015.
Bakoariniaina, L. N., Kusky, T., and Raharimahefa, T.: Disappearing Lake Alaotra: Monitoring catastrophic erosion, waterway silting, and land degradation hazards in Madagascar using Landsat imagery, J. Afr. Earth Sci., 44, 241–252, https://doi.org/10.1016/j.jafrearsci.2005.10.013, 2006.
Baron, R.: The Flora of Madagascar, J. Linn. Soc. London, Bot., 25, 246–294, https://doi.org/10.1111/j.1095-8339.1889.tb00798.x, 1889.
Batlle-Bayer, L., Batjes, N. H., and Bindraban, P. S.: Changes in organic carbon stocks upon land use conversion in the Brazilian Cerrado: A review, Agr. Ecosyst. Environ., 137, 47–58, https://doi.org/10.1016/j.agee.2010.02.003, 2010.
Battistini, R. and Verin, P.: Man and the Environment in Madagascar, in: Monographiae Biologicae, 311–337, Springer Netherlands, edited by: Dumont, H. J., https://doi.org/10.1007/978-94-015-7159-3_9, 1972.
Bird, M., Kracht, O., Derrien, D., and Zhou, Y.: The effect of soil texture and roots on the stable carbon isotope composition of soil organic carbon, Soil Res., 41, 77–94, https://doi.org/10.1071/SR02044, 2003.
Bond, W. and Keeley, J.: Fire as a global “herbivore”: the ecology and evolution of flammable ecosystems, Trends Ecol. Evol., 20, 387–394, https://doi.org/10.1016/j.tree.2005.04.025, 2005.
Bond, W. J., Silander, J. A., Ranaivonasy, J., and Ratsirarson, J.: The antiquity of Madagascar's grasslands and the rise of C4 grassy biomes, J. Biogeogr., 35, 1743–1758, https://doi.org/10.1111/j.1365-2699.2008.01923.x, 2008.
Boutton, T. W., Archer, S. R., Midwood, A. J., Zitzer, S. F., and Bol, R.: δ13C values of soil organic carbon and their use in documenting vegetation change in a subtropical savanna ecosystem, Geoderma, 82, 5–41, https://doi.org/10.1016/S0016-7061(97)00095-5, 1998.
Brosens, L., Broothaerts, N., Campforts, B., Jacobs, L., Razanamahandry, V. F., Van Moerbeke, Q., Bouillon, S., Razafimbelo, T., Rafolisy, T., and Govers, G.: Under pressure: Rapid lavaka erosion and floodplain sedimentation in central Madagascar, Sci. Total Environ., 806, 150483, https://doi.org/10.1016/j.scitotenv.2021.150483, 2022.
Burney, D. A.: A chronology for late prehistoric Madagascar, J. Hum. Evol., 47, 25–63, https://doi.org/10.1016/j.jhevol.2004.05.005, 2004.
Cerling, T. E. and Harris, J. M.: Carbon isotope fractionation between diet and bioapatite in ungulate mammals and implications for ecological and paleoecological studies, Oecologia, 120, 347–363, https://doi.org/10.1007/s004420050868, 1999.
Cerri, C. E. P., Easter, M., Paustian, K., Killian, K., Coleman, K., Bernoux, M., Falloon, P., Powlson, D. S., Batjes, N. H., Milne, E., and Cerri, C. C.: Predicted soil organic carbon stocks and changes in the Brazilian Amazon between 2000 and 2030, Agr. Ecosyst. Environ., 122, 58–72, https://doi.org/10.1016/j.agee.2007.01.008, 2007.
Chevalier, A.: La végétation à Madagascar, Ann. Geogr., 31, 465–484, https://doi.org/10.3406/geo.1922.10075, 1922.
Chevallier, T., Razafimbelo, T. M., and Michel, L. C.: Carbone des sols en Afrique, edited by: Chevallier, T., Razafimbelo, T. M., Chapuis-Lardy, L., and Brossard, M., IRD Éditions, https://doi.org/10.4000/books.irdeditions.34867, 2020.
Conrad, K. A., Dalal, R. C., Dalzell, S. A., Allen, D. E., and Menzies, N. W.: The sequestration and turnover of soil organic carbon in subtropical leucaena-grass pastures, Agr. Ecosyst. Environ., 248, 38–47, https://doi.org/10.1016/j.agee.2017.07.020, 2017.
Cox, R., Bierman, P., Jungers, M. C., and Rakotondrazafy, A. F. M.: Erosion Rates and Sediment Sources in Madagascar Inferred from 10Be Analysis of Lavaka, Slope, and River Sediment, J. Geol., 117, 363–376, https://doi.org/10.1086/598945, 2009.
Cox, R., Zentner, D. B., Rakotondrazafy, A. F. M., and Rasoazanamparany, C. F.: Shakedown in Madagascar: Occurrence of lavakas (erosional gullies) associated with seismic activity, Geology, 38, 179–182, https://doi.org/10.1130/G30670.1, 2010.
Davidson, E. A. and Janssens, I. A.: Temperature sensitivity of soil carbon decomposition and feedbacks to climate change, Nature, 440, 165–173, https://doi.org/10.1038/nature04514, 2006.
Desjardins, T., Turcq, B., Nguetnkam, J.-P., Achoundong, G., Mandeng-Yogo, M., Cetin, F., and Lézine, A.-M.: ä13C variation of soil organic matter as an indicator of vegetation change during the Holocene in central Cameroon, C.R. Geosci., 345, 266–271, https://doi.org/10.1016/j.crte.2013.06.001, 2013.
Desjardins, T., Turcq, B., Lézine, A. M., Nguetnkam, J. P., Mandeng-Yogo, M., Cetin, F., and Achoundong, G.: The origin of the forest-grassland mosaic of central Cameroon: What we learn from the isotopic geochemistry of soil organic matter, Holocene, 30, 1391–1399, https://doi.org/10.1177/0959683620932963, 2020.
Domeignoz-Horta, L. A., Shinfuku, M., Junier, P., Poirier, S., Verrecchia, E., Sebag, D., and Deangelis, K. M.: Direct evidence for the role of microbial community composition in the formation of soil organic matter composition and persistence, ISME Commun., 1, https://doi.org/10.1038/s43705-021-00071-7, 2021.
Don, A., Schumacher, J., and Freibauer, A.: Impact of tropical land-use change on soil organic carbon stocks – a meta-analysis, Glob. Change Biol., 17, 1658–1670, https://doi.org/10.1111/j.1365-2486.2010.02336.x, 2011.
Du Puy, D. J. and Moat, J.: A refined classification of the primary vegetation of Madagascar based on the underlying geology: using GIS to map its distribution and to assess its conservation status, Biogéographie de Madagascar, 205–218, 1996.
Ehleringer, J. R., Buchmann, N., and Flanagan, L. B.: Carbon Isotope Ratios in Belowground Carbon Cycle Processes, Ecol. Appl., 10, 412–422, https://doi.org/10.2307/2641103, 2000.
Ferry, L. M.: Alaotra Lake (Madagascar) Past, Present and Future, Z. Geomorphol., 53, 299–318, https://doi.org/10.1127/0372-8854/2009/0053-0299, 2009.
Gasse, F. and Van Campo, E.: Late Quaternary environmental changes from a pollen and diatom record in the southern tropics (Lake Tritrivakely, Madagascar), Palaeogeogr. Palaeocl., 167, 287–308, https://doi.org/10.1016/S0031-0182(00)00242-X, 2001.
Graz, Y., Di-Giovanni, C., Copard, Y., Laggoun-Défarge, F., Boussafir, M., Lallier-Vergès, E., Baillif, P., Perdereau, L., and Simonneau, A.: Quantitative palynofacies analysis as a new tool to study transfers of fossil organic matter in recent terrestrial environments, Int. J. Coal Geol., 84, 49–62, https://doi.org/10.1016/j.coal.2010.08.006, 2010.
Grinand, C., Maire, G. Le, Vieilledent, G., Razakamanarivo, H., Razafimbelo, T., and Bernoux, M.: Estimating temporal changes in soil carbon stocks at ecoregional scale in Madagascar using remote-sensing, Int. J. Appl. Earth Obs., 54, 1–14, https://doi.org/10.1016/j.jag.2016.09.002, 2017.
Guillet, B., Achoundong, G., Happi, J. Y., Beyala, V. K. K., Bonvallot, J., Riera, B., Mariotti, A., and Schwartz, D.: Agreement between floristic and soil organic carbon isotope (, 14C) indicators of forest invasion of savannas during the last century in Cameroon, J. Trop. Ecol., 17, 809–832, https://doi.org/10.1017/S0266467401001614, 2001.
Hackel, J., Vorontsova, M. S., Nanjarisoa, O. P., Hall, R. C., Razanatsoa, J., Malakasi, P., and Besnard, G.: Grass diversification in Madagascar: In situ radiation of two large C3 shade clades and support for a Miocene to Pliocene origin of C4 grassy biomes, J. Biogeogr., 45, 750–761, https://doi.org/10.1111/jbi.13147, 2018.
Häring, V., Fischer, H., Cadisch, G., and Stahr, K.: Improved ä13C method to assess soil organic carbon dynamics on sites affected by soil erosion, Eur. J. Soil Sci., 64, 639–650, https://doi.org/10.1111/ejss.12060, 2013.
Harris, N. L., Brown, S., Hagen, S. C., Saatchi, S. S., Petrova, S., Salas, W., Hansen, M. C., Potapov, P. V., and Lotsch, A.: Baseline map of carbon emissions from deforestation in tropical regions, Science, 336, 1573–1576, https://doi.org/10.1126/science.1217962, 2012.
Hoefs, J.: Stable Isotope Geochemistry, Springer International Publishing, Cham., edited by: Hoefs, J., 6th Edn., https://doi.org/10.1007/978-3-540-70708-0, 2015.
Jacinthe, P.-A., Lal, R., and Kimble, J. M.: Carbon dioxide evolution in runoff from simulated rainfall on long-term no-till and plowed soils in southwestern Ohio, Soil Till. Res., 66, 23–33, https://doi.org/10.1016/s0167-1987(02)00010-7, 2002.
Kallenbach, C. M., Frey, S. D., and Grandy, A. S.: Direct evidence for microbial-derived soil organic matter formation and its ecophysiological controls, Nat. Commun., 7, 13630, https://doi.org/10.1038/ncomms13630, 2016.
Keeling, R. F., Graven, H. D., Welp, L. R., Resplandy, L., Bi, J., Piper, S. C., Sun, Y., Bollenbacher, A., and Meijer, H. A. J.: Atmospheric evidence for a global secular increase in carbon isotopic discrimination of land photosynthesis, P. Natl. Acad. Sci., 114, 10361–10366, https://doi.org/10.1073/pnas.1619240114, 2017.
Kennedy, P., Kennedy, H., and Papadimitriou, S.: The effect of acidification on the determination of organic carbon, total nitrogen and their stable isotopic composition in algae and marine sediment, Rapid Commun. Mass Sp., 19, 1063–1068, https://doi.org/10.1002/rcm.1889, 2005.
Kohn, M. J.: Carbon isotope compositions of terrestrial C3 plants as indicators of (paleo)ecology and (paleo)climate, P. Natl. Acad. Sci., 107, 19691–19695, https://doi.org/10.1073/pnas.1004933107, 2010.
Komada, T., Anderson, M. R., and Dorfmeier, C. L.: Carbonate removal from coastal sediments for the determination of organic carbon and its isotopic signatures, ä13C and Ä14C: comparison of fumigation and direct acidification by hydrochloric acid, Limnol. Oceanogr. Meth., 6, 254–262, https://doi.org/10.4319/lom.2008.6.254, 2008.
Krull, E. S., Skjemstad, J. O., Burrows, W. H., Bray, S. G., Wynn, J. G., Bol, R., Spouncer, L., and Harms, B.: Recent vegetation changes in central Queensland, Australia: Evidence from ä13C and 14C analyses of soil organic matter, Geoderma, 126, 241–259, https://doi.org/10.1016/j.geoderma.2004.09.012, 2005.
Lal, R.: Soil carbon sequestration to mitigate climate change, Geoderma, 123, 1–22, https://doi.org/10.1016/j.geoderma.2004.01.032, 2004.
Marwick, T. R., Borges, A. V., Van Acker, K., Darchambeau, F., and Bouillon, S.: Disproportionate Contribution of Riparian Inputs to Organic Carbon Pools in Freshwater Systems, Ecosystems, 17, 974–989, https://doi.org/10.1007/s10021-014-9772-6, 2014.
Martin, A., Mariotti, A., Balesdent, J., Lavelle, P., and Vuattoux, R.: Estimate of organic matter turnover rate in a savanna soil by 13C natural abundance measurements, Soil Biol. Biochem., 22, 517–523, https://doi.org/10.1016/0038-0717(90)90188-6, 1990.
Matsumoto, K. and Burney, D. A.: Late Holocene environments at Lake Mitsinjo, northwestern Madagascar, Holocene, 4, 16–24, https://doi.org/10.1177/095968369400400103, 1994.
Mietton, M., Gunnell, Y., Nicoud, G., Ferry, L., Razafimahefa, R., and Grandjean, P.: “Lake” Alaotra, Madagascar: A late Quaternary wetland regulated by the tectonic regime, Catena, 165, 22–41, https://doi.org/10.1016/j.catena.2018.01.021, 2018.
Penot, E., Fevre, V., Flodrops, P., and Razafimahatratra, H. M.: Conservation Agriculture to buffer and alleviate the impact of climatic variations in Madagascar: farmers' perception, Cah. Agric., 27, 25003, https://doi.org/10.1051/cagri/2018009, 2018.
Peterson, B. J. and Fry, B.: Stable isotopes in ecosystem studies, Annu. Rev. Ecol. Syst., 18, 293–320, https://doi.org/10.1146/annurev.es.18.110187.001453, 1987.
Rabetokotany-Rarivoson, N., Andriamananjara, A., Razafimbelo, T., Ramifehiarivo, N., Ramboatiana, N., Razafimanantsoa, M., Razafimahatratra, H., Rabeharisoa, L., Bernoux, M., Brossard, M., Albrecht, A., Winowiecki, L., Vagen, T., Grinand, C., Vaudry, R., Rakotoarijaona, J.-R., Rahagalala, P., Rasolohery, A., Parany, L., Bürren, C., Saneho, H. J., Miasa, E., and Razakamanarivo, H.: Changes in soil organic carbon (SOC) stocks after forest conversion in humid ecoregion of Madagascar, XIV WORLD For. Congr. Durban, South Africa, 7–11 September 2015, 8 pp., 2015.
Raboanarielina, C.: The forgotten resource: Community perspectives on conservation and well-being in Zahamena National Park, Madagascar, Madagascar Conserv. Dev., 7, 70–78, https://doi.org/10.4314/mcd.v7i2S.3, 2012.
Razafindrakoto, M., Andriamananjara, A., Razafimbelo, T., Hewson, J., Andrisoa, R. H., Jones, J. P. G., van Meerveld, I., Cameron, A., Ranaivoson, N., Ramifehiarivo, N., Ramboatiana, N., Razafinarivo, R. N. G., Ramananantoandro, T., Rasolohery, A., Razafimanantsoa, M. P., Jourdan, C., Saint-André, L., Rajoelison, G., and Razakamanarivo, H.: Organic Carbon Stocks in all Pools Following Land Cover Change in the Rainforest of Madagascar, Soil Manag. Clim. Chang. Eff. Org. Carbon, Nitrogen Dyn. Greenh. Gas Emiss., edited by: Ángeles Muñoz, M. and Zornoza, R., Academic press, September 2018, 25–37, https://doi.org/10.1016/B978-0-12-812128-3.00003-3, 2018.
Reimer, P. J., Brown, T. A., and Reimer, R. W.: Discussion: Reporting and calibration of post-bomb 14C data, Radiocarbon, 46, 1299–1304, https://doi.org/10.1017/S0033822200033154, 2004.
Restrepo, J. D., Kettner, A. J., and Syvitski, J. P. M.: Recent deforestation causes rapid increase in river sediment load in the Colombian Andes, Anthropocene, 10, 13–28, https://doi.org/10.1016/j.ancene.2015.09.001, 2015.
Sanaiotti, T. M., Martinelli, L. A., Victoria, R. L., Trumbore, S. E., and Camargo, P. B.: Past Vegetation Changes in Amazon Savannas Determined Using Carbon Isotopes of Soil Organic Matter1, Biotropica, 34, 2–16, https://doi.org/10.1111/j.1744-7429.2002.tb00237.x, 2002.
Schlesinger, W. H.: Carbon Balance in Terrestrial Detritus, Annu. Rev. Ecol. Syst., 8, 51–81, https://doi.org/10.1146/annurev.es.08.110177.000411, 1977.
Schuur, E. A. G., Trumbore, S. E., Druffel, E. R. M., Southon, J. R., Steinhof, A., Taylor, R. E., and Turnbull, J. C.: Radiocarbon and the Global Carbon Cycle, in Radiocarbon and Climate Change, 1–19, Springer International Publishing, Cham., https://doi.org/10.1007/978-3-319-25643-6_1, 2016.
Schwartz, D., Mariotti, A., Lanfranchi, R., and Guillet, B.: 13C/12C Ratios of soil organic matter as indicators of vegetation changes in the congo, Geoderma, 39, 97–103, https://doi.org/10.1016/0016-7061(86)90069-8, 1986.
Straka, H.: Histoire de la végétation de Madagascar oriental dans les derniers 100 millenaires, Biogéographie de Madagascar, 37–47, doi:fdi:010008445, 1996.
Styger, E., Rakotondramasy, H. M., Pfeffer, M. J., Fernandes, E. C. M., and Bates, D. M.: Influence of slash-and-burn farming practices on fallow succession and land degradation in the rainforest region of Madagascar, Agr. Ecosyst. Environ., 119, 257–269, https://doi.org/10.1016/j.agee.2006.07.012, 2007.
Szabó, A. I., Raveloson, A., and Székely, B.: Landscape evolution and climate in Madagascar: lavakization in the light of archive precipitation data, Cuad. Investig. Geográfica, 41, 181, https://doi.org/10.18172/cig.2646, 2015.
Trumbore, S.: Radiocarbon and Soil Carbon Dynamics, Annu. Rev. Earth Planet. Sc., 37, 47–66, https://doi.org/10.1146/annurev.earth.36.031207.124300, 2009.
Van Oost, K., Quine, T. A., Govers, G., De Gryze, S., Six, J., Harden, J. W., Ritchie, J. C., McCarty, G. W., Heckrath, G., Kosmas, C., Giraldez, J. V., da Silva, J. R. M., and Merckx, R.: The Impact of Agricultural Soil Erosion on the Global Carbon Cycle, Science, 318, 626–629, https://doi.org/10.1126/science.1145724, 2007.
Virah-Sawmy, M., Gillson, L., Gardner, C. J., Anderson, A., Clark, G., and Haberle, S.: A landscape vulnerability framework for identifying integrated conservation and adaptation pathways to climate change: the case of Madagascar's spiny forest, Landscape. Ecol., 31, 637–654, https://doi.org/10.1007/s10980-015-0269-2, 2016.
Voarintsoa, N. R. G., Cox, R., Razanatseheno, M. O. M., and Rakotondrazafy, A. F. M.: Relation between bedrock geology, topography and lavaka distribution in Madagascar, S. Afr. J. Geol., 115, 225–250, https://doi.org/10.2113/gssajg.115.225, 2012.
Vorontsova, M. S., Besnard, G., Forest, F., Malakasi, P., Moat, J., Clayton, W. D., Ficinski, P., Savva, G. M., Nanjarisoa, O. P., Razanatsoa, J., Randriatsara, F. O., Kimeu, J. M., Quentin Luke, W. R., Kayombo, C., and Peter Linder, H.: Madagascar's grasses and grasslands: Anthropogenic or natural?, P. Roy. Soc. B-Biol. Sci., 283, 20152262, https://doi.org/10.1098/rspb.2015.2262, 2016.
Wang, Y., Amundson, R., and Trumbore, S.: Radiocarbon dating of soil organic matter, Quaternary Res., 45, 282–288, https://doi.org/10.1006/qres.1996.0029, 1996.
Wells, N. A. and Andriamihaja, B.: The initiation and growth of gullies in Madagascar: are humans to blame?, Geomorphology, 8, 1–46, https://doi.org/10.1016/0169-555X(93)90002-J, 1993.
Winowiecki, L. A., Vågen, T.-G., Boeckx, P., and Dungait, J. A. J.: Landscape-scale assessments of stable carbon isotopes in soil under diverse vegetation classes in East Africa: application of near-infrared spectroscopy, Plant Soil, 421, 259–272, https://doi.org/10.1007/s11104-017-3418-3, 2017.
World Reference Base for Soil Resources: A framework for international classification, correlation and communication, World Soil Resources Report 103, FAO, Rome, 2006.
Wutzler, T. and Reichstein, M.: Soils apart from equilibrium – consequences for soil carbon balance modelling, Biogeosciences, 4, 125–136, https://doi.org/10.5194/bg-4-125-2007, 2007.
Yang, Y., Chen, Y., Li, Z., and Chen, Y.: Land-use/cover conversion affects soil organic-carbon stocks: A case study along the main channel of the Tarim River, China, PLOS One, 13, e0206903, https://doi.org/10.1371/journal.pone.0206903, 2018.
Yoder, A. D. and Nowak, M. D.: Has Vicariance or Dispersal Been the Predominant Biogeographic Force in Madagascar? Only Time Will Tell, Annu. Rev. Ecol. Evol., 37, 405–431, https://doi.org/10.1146/annurev.ecolsys.37.091305.110239, 2006.