the Creative Commons Attribution 4.0 License.
the Creative Commons Attribution 4.0 License.
 | 05 Sep 2022
Carbon isotopic ratios of modern C3 and C4 vegetation on the Indian peninsula and changes along the plant–soil–river continuum – implications for vegetation reconstructions
Frédérique M. S. A. Kirkels
Hugo J. de Boer
Paulina Concha Hernández
Chris R. T. Martes
Marcel T. J. van der Meer
Sayak Basu
Muhammed O. Usman
The large difference in the fractionation of stable carbon isotopes between C3 and C4 plants is widely used in vegetation reconstructions, where the predominance of C3 plants suggests wetter and that of C4 plants drier conditions. The stable carbon isotopic composition of organic carbon (OC) preserved in soils or sediments may be a valuable (paleo-)environmental indicator, based on the assumption that plant-derived material retains the stable carbon isotopic value of its photosynthetic pathway during transfer from plant to sediment. In this study, we investigated the bulk carbon isotopic values of C3 and C4 plants (δ13C) and of organic carbon (δ13Corg) in soils, river suspended particulate matter (SPM) and riverbed sediments to gain insight into the control of precipitation on C3 and C4 plant δ13C values and to assess changes in δ13Corg values along the plant–soil–river continuum. This information allows us to elucidate the implications of different δ13C end-members on C3 / C4 vegetation reconstructions. Our analysis was performed in the Godavari River basin, located in the core monsoon zone in peninsular India, a region that integrates the hydroclimatic and vegetation changes caused by variation in monsoonal strength. The basin has distinct wet and dry seasons and is characterised by natural gradients in soil type (from clay-rich to sandy), precipitation (∼ 500 to 1500 mm yr−1) and vegetation type (from mixed C3 / C4 to primarily C3) from the upper to the lower basin. The δ13C values of Godavari C3 plants were strongly controlled by mean annual precipitation (MAP), showing an isotopic enrichment of ∼ 2.2 ‰ from ∼ 1500 to 500 mm yr−1. Tracing δ13Corg values from plant to soils and rivers revealed that soils and riverbed sediments reflected the transition from mixed C3 and C4 vegetation in the dry upper basin to more C3 vegetation in the humid lower basin. Soil degradation and stabilisation processes and hydrodynamic sorting within the river altered the plant-derived δ13C signal. Phytoplankton dominated the δ13Corg signal carried by SPM in the dry season and year-round in the upper basin. Application of a linear mixing model showed that the %C4 plants in the different subbasins was ∼ 7 %–15 % higher using plant end-members based on measurement of the Godavari vegetation and tailored to local moisture availability than using those derived from data compilations of global vegetation. Including a correction for the 13C enrichment in Godavari C3 plants due to drought resulted in maximally 6 % lower estimated C4 plant cover. Our results from the Godavari basin underline the importance of making informed choices about the plant δ13C end-members for vegetation reconstructions, considering characteristics of the regional vegetation and environmental factors such as MAP in monsoonal regions.
- Article
(6879 KB) - Full-text XML
-
Supplement
(1106 KB) - BibTeX
- EndNote


Vegetation reconstruction of the coverage of C3 and C4 plants uses the distinct δ13C values of both vegetation types with the assumption that organic carbon (OC) retains the stable carbon isotopic composition during transfer from plant to soils and sediments (e.g. Koch, 1998; Dawson et al., 2002; Wynn and Bird, 2007). The C3 and C4 photosynthetic pathways fractionate carbon isotopes to a different extent; this is reflected in bulk δ13C values of ∼ −20 ‰ to −37 ‰ in C3 and ∼ −10 ‰ to −16 ‰ in C4 plants (e.g. Bender, 1971; Farquhar et al., 1989; Kohn, 2010). C3 plants fix CO2 using the Calvin–Benson cycle, and they are prevalent in relatively cold and humid environments. C4 plants add an initial CO2 fixation step using phosphoenolpyruvate (PEP) carboxylase to concentrate CO2 via bundle sheath cells inside the leaf. This additional step in the photosynthesis pathway allows for C4 plants to maintain relatively high photosynthesis rates under low stomatal conductance with limited water loss, which enables them to thrive in high temperature and (semi-)arid environments (e.g. Farquhar, 1983; Sage and Monson, 1999; Sage, 2004).
Given the sensitivity of vegetation type to water availability, shifts in the relative contribution of C3 and C4 plants can be used to infer hydroclimatic changes, with a shift to more dominant C4 vegetation in drier periods or areas and more dominant C3 vegetation in wetter conditions (Koch, 1998; Sage, 2004; Still et al., 2003, and references therein). The bulk carbon isotopic composition of organic matter (δ13Corg) preserved in soils or in river-dominated sediments in the marine realm is often used as a proxy for vegetation reconstructions, as it is considered to represent an integrated signal of the vegetation (e.g. Galy et al., 2007; Sarangi et al., 2021). For vegetation reconstructions, different techniques can be employed, including bulk or compound-specific isotope analyses. Although less source specific, bulk isotope analyses provide a low-cost, high-throughput approach that can be applied at high resolution and/or for large geographic areas, also in (sub)tropical regions where carbon- and vegetation-specific compound concentrations are generally low and may undergo compound-specific degradation patterns and/or differential settling into sediments (e.g. Hou et al., 2020; Li et al., 2020). Subsequently, isotope mixing models provide a means to infer the distribution of C3 and C4 plants and changes therein at spatial or temporal scales, which is particularly relevant in the context of changing climatic conditions affecting C3 / C4 vegetation patterns. For instance, gradual aridification in a basin can result in drought-stressed C3 plants, as well as an increased abundance of aridity-adapted C4 plants. Both changes result in an increase in bulk δ13Corg values. A shift to more dominant C4 vegetation is important to identify, as a shift to a dry ecosystem indicates a reduced resilience to changes in moisture availability (e.g. Cui et al., 2017; Ghosh et al., 2017).
The monsoon-influenced Indian subcontinent is particularly sensitive to changes in hydroclimate on both short (seasonal) and long (orbital) timescales (Turner and Annamalai, 2012; Sinha et al., 2011, 2015; Banerji et al., 2020; Dutt et al., 2021), resulting in changes in the C3 and C4 vegetation distributions over the Neogene and Quaternary period (e.g. Agrawal et al., 2012; Ghosh et al., 2017; Basu et al., 2018, 2019a; Roy et al., 2020). For example, changes in bulk δ13Corg and leaf-wax-specific δ13C values captured the late Miocene (7.4–7.2 Ma) expansion of C4 plants recorded in Himalayan-derived Indus Fan sediments (Feakins et al., 2020) as well as in Gangetic Plain alluvial sediments and paleosols (Ghosh et al., 2017; Roy et al., 2020). C4 plants spread southward over the Indian peninsula during the mid-Pliocene to mid-Pleistocene (3.5–1.5 Ma), linked to reduced rainfall (Dunlea et al., 2020), whereas an increase in monsoon strength over the last deglaciation led to a shift to a more C3-dominated ecosystem (e.g. Galy et al., 2008a; Contreras-Rosales et al., 2014). Finally, an increase in C4 plants across India from the mid- to late Holocene, establishing the modern-day vegetation, was linked to aridification (Ponton et al., 2012; Contreras-Rosales et al., 2014; Sarkar et al., 2015; Usman et al., 2018; Basu et al., 2019a). At the seasonal to decadal scale, changes in monsoon intensity and distribution can affect plant δ13C as well as preservation and provenance of the bulk δ13Corg signal in soils and sediments (e.g. Ittekkot et al., 1985; Galy et al., 2008b). However, the effect of monsoon variation on the bulk δ13C(org) signal along the plant–soil–river continuum has not been thoroughly tested for peninsular India.
One approach to reconstructing vegetation is the application of a straightforward, linear isotope mixing model, which requires an informed choice about the C3 and C4 plant δ13C end-members and their variability, which are used as input. These end-members can be based on averages determined in compilations of vegetation occurring around the globe or be based on (modern) vegetation samples in a region. In addition, their date of sampling with respect to OC turnover rates in soils or sediments and controls by environmental factors need to be considered. Meta-analyses of global C3 vegetation revealed that hydroclimatic conditions such as rainfall amount and seasonality affect the plant δ13C (Diefendorf et al., 2010; Kohn, 2010; Basu et al., 2019b, 2021). In particular drought stress results in a less negative δ13C in C3 plants, where mean annual precipitation (MAP) has a much stronger control than other environmental factors such as temperature or altitude (Stewart et al., 1995; Diefendorf et al., 2010). Observed changes in C3 plant δ13C due to drought stress are the result of changes in the ratio of leaf interior to atmospheric CO2 concentrations, which can be the result of changes in stomatal conductance, photosynthetic capacity and photosynthetic rate or a combination thereof (Farquhar et al., 1989; Diefendorf et al., 2010; Liu et al., 2013). For C4 vegetation, carbon isotope fractionation is generally unaffected by drought stress, although a few field and experimental studies have shown that C4 plant δ13C becomes more negative under water-limiting conditions as a result of a less efficient CO2-concentrating mechanism referred to as “bundle sheath leakiness” (e.g. Buchmann et al., 1996; Yoneyama et al., 2010; Basu et al., 2015; Ellsworth and Cousins, 2016). Plants using an alternative photosynthetic pathway, i.e. crassulacean acid metabolism (CAM), as adaption to aridity photosynthesise during the day and respire at night (i.e. temporal CO2-concentrating mechanism), where moisture availability determines the expression of the C3 or C4 fixation pattern (Sankhla et al., 1975). Under water-stressed conditions CAM plants have stable carbon isotopic values similar to C4 plants, but they are relatively rare in India (Sankhla et al., 1975; Ziegler et al., 1981) and are, therefore, not further considered here. Regardless, drought stress has the largest impact on C3 plants and is recognised to cause high intraspecies variability in water-limited ecosystems (<1000 mm yr−1; e.g. Ma et al., 2012; Liu et al., 2013, 2014; Luo et al., 2021). Hence, the existing plant community in a region and the impact of water availability on those plant species may vary locally and result in a C3 plant δ13C value that differs depending on the regional conditions (Liu et al., 2014; Basu et al., 2019b).
Although it is possible to determine region-specific plant δ13C end-members that are representative of the regional conditions, including vegetation species, structure, density, agriculture/land use and important environmental controls such as MAP, this approach requires detailed knowledge of the δ13C values of the regional C3 and C4 vegetation as well as of rainfall distributions. Problematically, such detailed information is often unavailable and yet to be established for Indian plants in the core monsoon zone (CMZ). Furthermore, correction of the plant end-members for drought conditions that (seasonally) prevail in peninsular India requires details on regional rainfall distributions and depends on the δ13C value that was derived from measurement of regional vegetation or estimated based on data compilations of global vegetation. Recently, a study of δ13C values in region-specific vegetation along a precipitation gradient on the Gangetic Plain prompted a recalculation of the abundance C3 and C4 plants in sedimentary deposits accounting for drought-stress-induced 13C enrichment in C3 plants (Basu et al., 2015, 2019b). They showed that earlier investigations likely underestimated the abundance of C4 plants (∼ 20 %). Recalculation using an end-member and mixing-model approach revealed that C4 plants existed in this region at an earlier date than anticipated, changing the timing of (Miocene) C4 grassland expansion on the Gangetic Plain to ∼ 17 Ma (Basu et al., 2015, 2019b). This shift highlights the effect of plant δ13C end-member values on vegetation reconstructions.
Next to precipitation controls on vegetation δ13C, the initial plant δ13C signal may be altered during transit from the plant to the sedimentary archive, depending on physical and biogeochemical processes that determine the stability, i.e. protection against degradation and transport efficiency of this plant-derived OC (e.g. Battin et al., 2009; Ward et al., 2017). Soil and sedimentary deposits integrate a temporal signal, depending on OC turnover rates which are estimated to range from ∼ 10 years in tropical forest soils to ∼ 25–40 years in savanna soils (Martin et al., 1990; Bird et al., 1996). Comparison of the older δ13C value of soils and sediment with that of the modern vegetation requires consideration of the Suess effect that describes the rapid decline over the last few decades in the δ13C value of atmospheric CO2 as a result of fossil fuel burning, causing a change in the OC stable carbon isotopic composition of vegetation over time. Furthermore, it is well-established that soil degradation processes lead to a 13C enrichment in the remaining soil OC, which is usually estimated to be ∼ 1 ‰–3 ‰ but can be as high as 6 ‰ in tropical and semi-arid regions (e.g. Krull et al., 2005). Possible factors that contribute to this 13C enrichment are preferred uptake and degradation to CO2 of 13C-depleted OC by microbes, incorporation of 13C-enriched microbial and fungal biomass in the soil, and/or preferential adsorption of 13C by fine mineral particles (Krull et al., 2005; Wynn, 2007; Wynn and Bird, 2007). Soil OC thus comprises a mixture of plant-derived, fungal and bacterial biomass, and microbially processed carbon. The different compounds (e.g. lipids, proteins, carbohydrates) differ in their degradability but may also be associated with mineral surfaces, which protects them from degradation. Compound-specific degradation rates or preservation in soils via microbial processing or association with mineral particles may influence the reconstructed C3 / C4 vegetation balance depending on the targeted compound, as shown for vegetation and soils in the Gangetic Plain (Sarangi et al., 2021; Roy and Sanyal, 2022). This complex interplay between different inputs and microbial processing may challenge the use of stable carbon isotope ratios for vegetation reconstructions.
Furthermore, the marked hydrological changes in Indian monsoonal rivers can change the source and thereby the δ13C value of the OC that it contains at a seasonal scale, from mainly soil-derived OC in the wet season to aquatic produced OC in the dry season, or change its provenance by sourcing from particular parts of the basin with a different vegetation cover in response to the rainfall distribution (Gupta et al., 1997; Balakrishna and Probst, 2005; Aucour et al., 2006; Galy et al., 2008b, 2011; Kirkels et al., 2020a; Menges et al., 2020). For example, Galy et al. (2008b) showed that δ13Corg values of suspended particulate matter (SPM) in the Ganges–Brahmaputra River reflected dominant C3 input in the Himalayan tributaries, but after in-river degradation, this signal was replaced by C4 inputs in the Gangetic Plain. Finally, hydrodynamic sorting within the river may result in depth-specific OC distributions and thereby influence the δ13C signal that is transported downriver (Galy et al., 2008b; Bouchez et al., 2014; Feng et al., 2016; Repasch et al., 2022). Hence, interpretation of δ13C-based vegetation reconstructions needs to consider potential alterations during transit from plant source to sedimentary deposits.
In this study, we examine the δ13C values of C3 and C4 vegetation in the modern-day Godavari River basin, the largest monsoonal river of peninsular India (Fig. 1a), to examine links between monsoon-driven hydroclimate and plant δ13C values. In addition, we analyse the bulk δ13Corg values in soils, river SPM and riverbed sediments collected in the wet and dry season to explore the evolution of the initial plant-derived δ13C signal along the plant–soil–river continuum. Finally, we use our insights into the modern system to assess the influence of drought stress and the use of region-specific plant δ13C end-members on C3 / C4 vegetation mixing-model estimates and thus the uncertainty in δ13C-based vegetation reconstructions.
2.1 Regional setting
The Godavari is the largest peninsular river of India (catchment area: 3.1×10⁵ km2, length: 1465 km), with an annual discharge of 110 km3 and sediment load of 170 Mt, of which ∼ 2.8 Mt is OC (Biksham and Subramanian, 1988a, b; Gupta et al., 1997). The Godavari River starts in the Western Ghats mountains and flows across peninsular India before emptying in the Bay of Bengal and is situated in the core monsoon zone (Ponton et al., 2012; Sarkar et al., 2015; Giosan et al., 2017) (Fig. 1a, b), which dictates the seasonality of the Godavari River, with 75 %–85 % of the annual rainfall and 98 % of the sediment transport in the monsoon/wet season between June and September (Biksham and Subramanian, 1988a, b).
The basin is characterised by several natural gradients, where the upper basin developed on Deccan flood basalts which weathered into clay-rich soils, while the lower basin formed on felsic rock formations with sandy to loamy textured soils (Giosan et al., 2017). Petrogenic OC is absent in the upper basin (Reddy et al., 2021) and very sporadic (i.e. coal deposits) in the lower basin (Usman et al., 2018). In addition, the precipitation gradient ranges from ∼ 430 mm yr−1 in the interior upper basin that is in the rain shadow of the Western Ghats mountain range to ∼ 2300 mm yr−1 near the coast of the Bay of Bengal (Fig. 2). The natural vegetation reflects this gradient and varies from (C4) grasses, dry deciduous forests and thorny shrublands in the upper basin to moist and evergreen deciduous forests with mostly C3 flora in the lower basin (Olson et al., 2001; Asouti and Fuller, 2008; Fig. 1b). Agriculture covers ∼ 60 % of the basin, with dominant C4 crops (sorghum, millet, maize, sugar cane) in the upper basin and rice fields (C3) in the lower basin (CWC, 2014; Pradhan et al., 2014). Hence, the upper and lower Godavari basin are distinctly different in terms of C3 / C4 vegetation distributions, moisture conditions and bedrock geology.
The Godavari basin is divided into five subbasins: the upper (∼ 37 % of the total basin area), middle (6 %) and lower (2 %) Godavari cover the main stem river and are joined by the north (35 %; Wainganga, Penganga, Wardha and Pranhita rivers) and east tributaries (20 %; Indravati and Sabari rivers) (Babar and Kaplay, 2018) (Figs. 1b, S1 in the Supplement). Abundant dams in the upper basin limit the river flow, while a large dam with a reservoir lake at Rajahmundry (Rajamahendravaram) controls the flow into the tidally influenced delta (Pradhan et al., 2014).
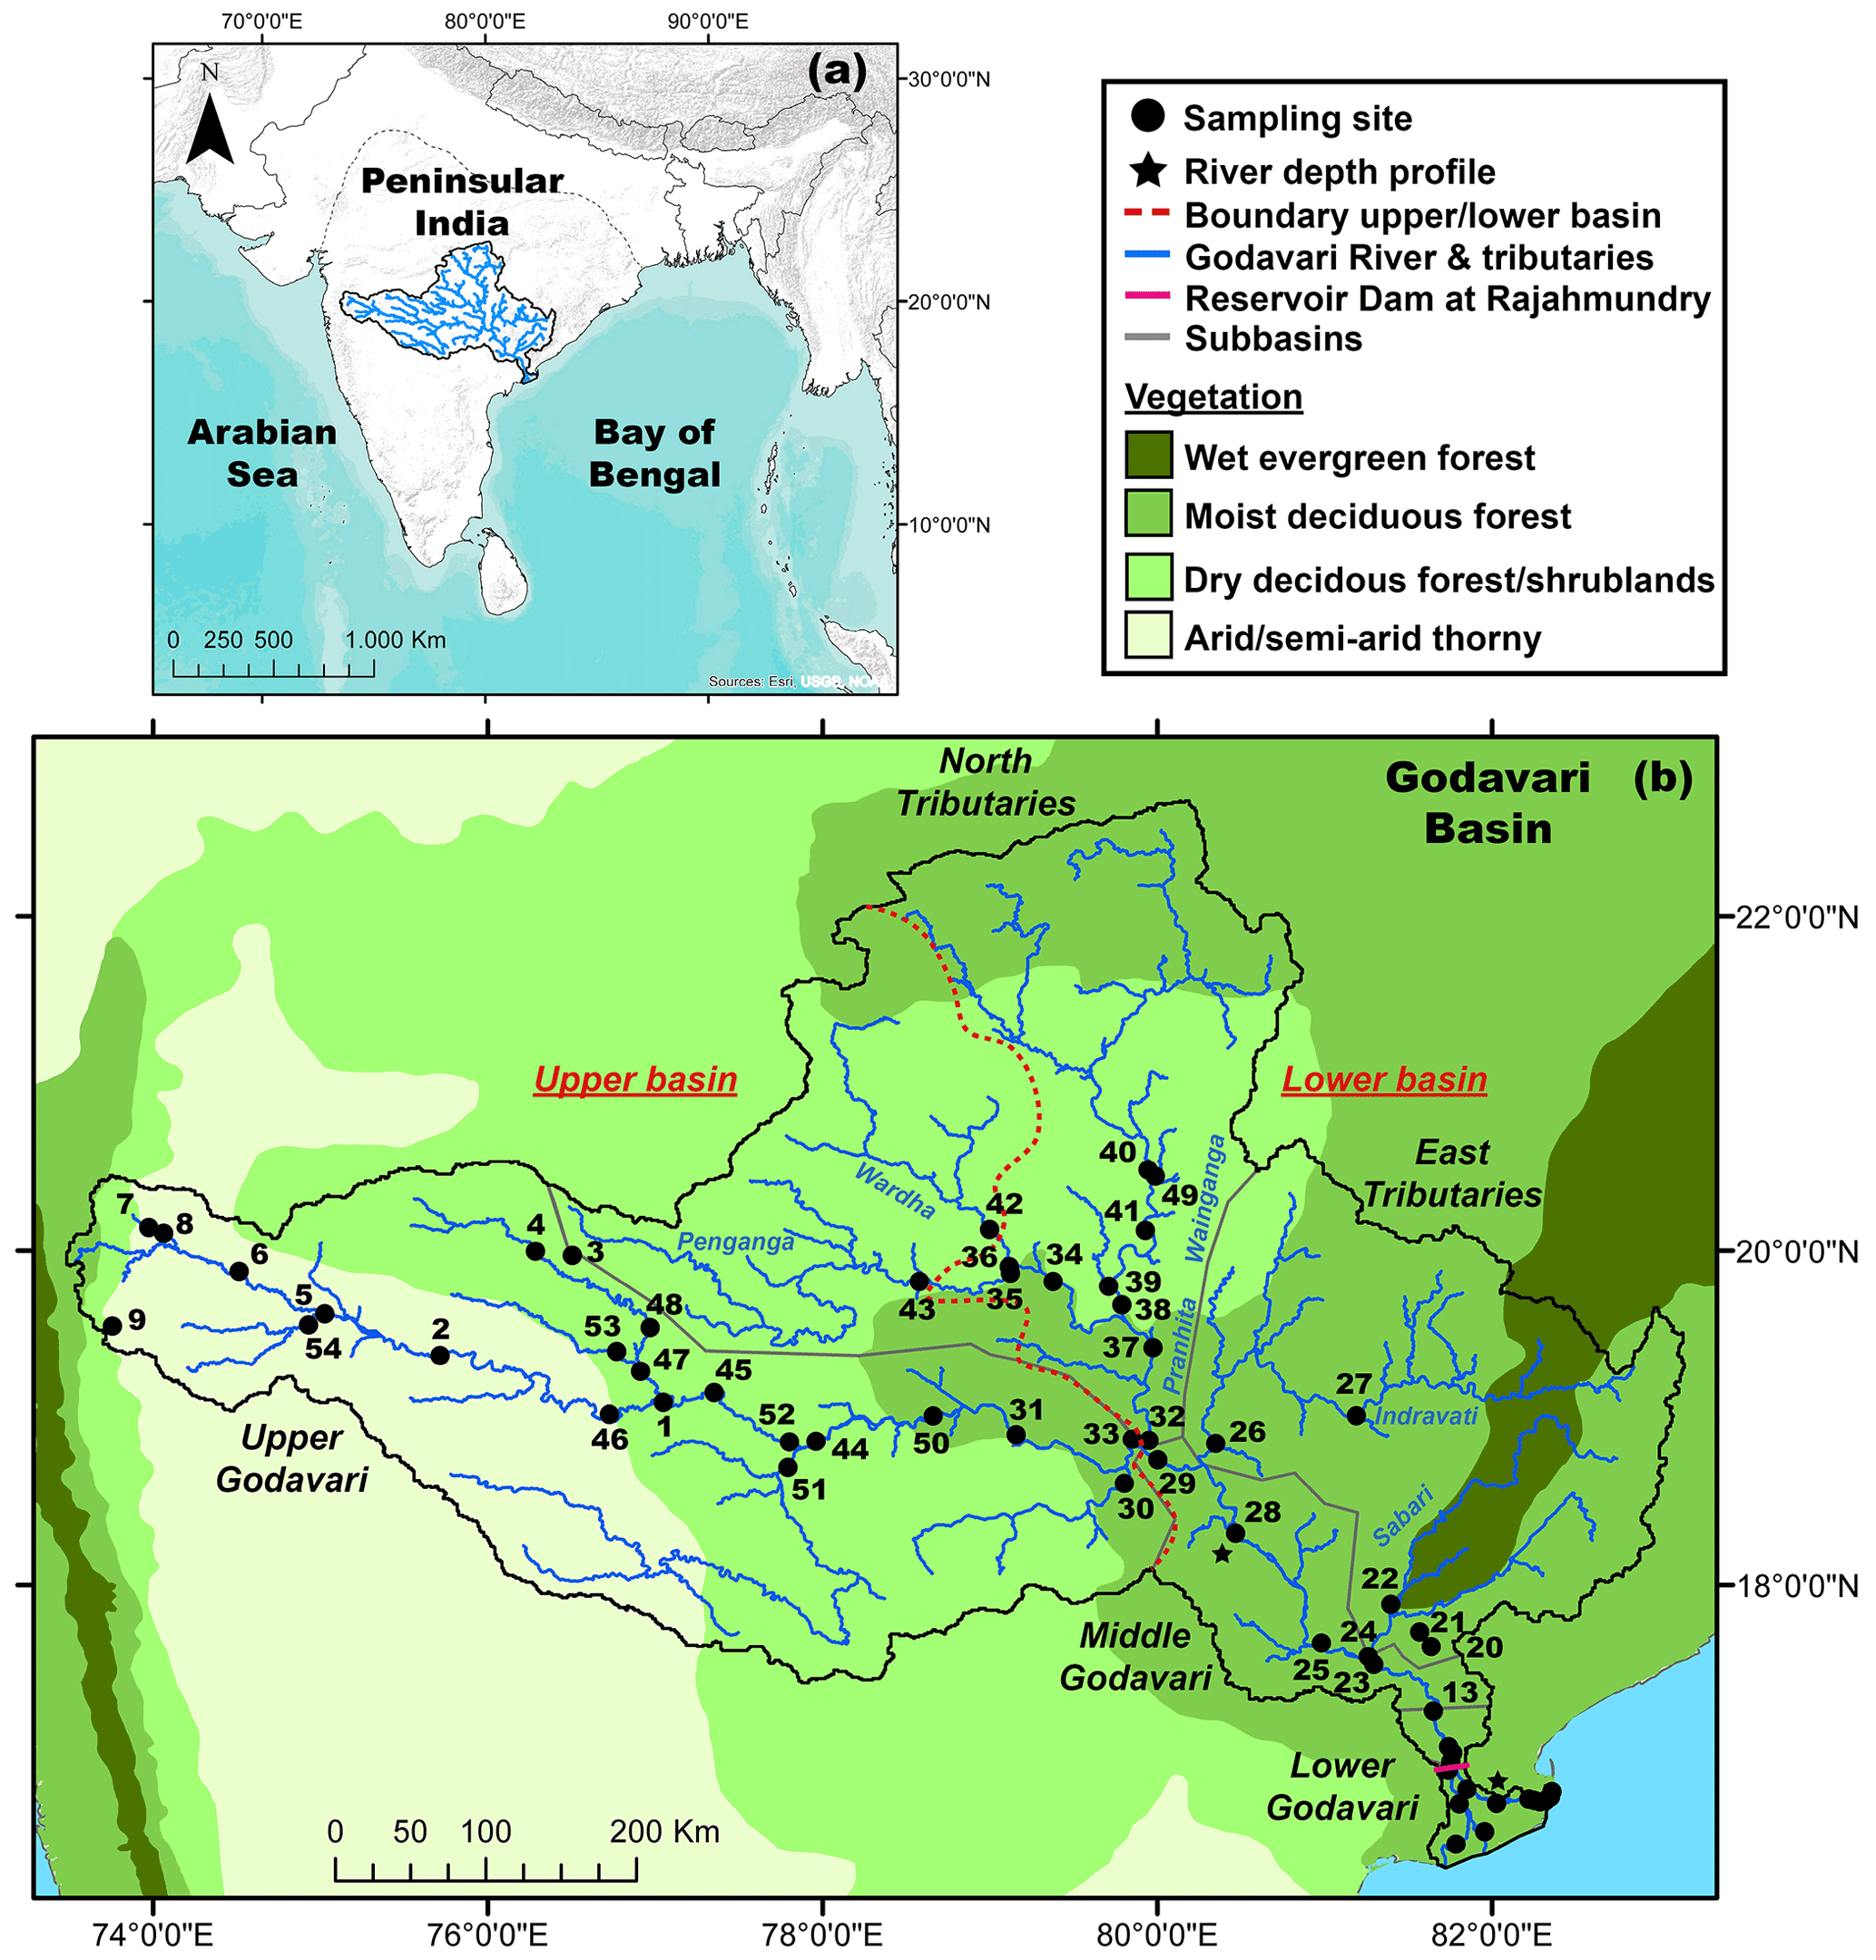
Figure 1(a) Location of the Godavari River basin in peninsular India. (b) Godavari River basin and sampling sites, with the major vegetation zones (Olson et al., 2001; Asouti and Fuller, 2008). Names of the subbasins (grey) and major rivers (blue) are indicated; a zoom for the Godavari delta is available in Fig. S1.
2.2 Sample collection
Samples of aboveground plant material were collected in February–March 2015 (dry season) across the Godavari basin, selecting the three to five most dominant species at each site and spanning the full range of plant life-forms (i.e. trees, shrubs, herbaceous plants and grasses). For shrubs and trees the leaves were collected, and for herbs and grasses the leaves and stems were combined. Given that the deciduous trees and shrubs shed their leaves annually in the dry season (Kushwaha and Singh, 2005; Elliott et al., 2006), leaves were considered the main contributor to soil OC rather than woody biomass. Depending on plant size, each sample consisted of approximately 10 to 50 g of leaves or aboveground plant parts of three to five individuals of the same species or multiple “sun” and “shade” leaves of the same individual. Dominant agricultural crops (e.g. sorghum, maize, millet, sugarcane) were also sampled. After collection, plant samples were air-dried and subsequently frozen upon arrival in the laboratory. In total, 77 samples of C3 plants and 16 samples of C4 plants were prepared for analysis.
Topsoils (1–10 cm) were collected during the same campaign (n=47), after removal of the litter layer and by combining three to five spatial replicates. This topsoil layer receives most plant input and gets most likely eroded and transported into the river. SPM (n=40) and riverbed sediments (n=37) were collected in the dry (February–March 2015) and wet (July–August 2015) season. For SPM, surface river water (10–80 L) was collected at a mid-channel position from a bridge or boat or 2–3 m out of the riverbank and filtered on pre-combusted (450 ∘C, 6 h) GF/F filters (0.7 µm, Whatman) using pressurised steel filtration units (after Galy et al., 2007). Additional river depth profiles (two to three depths, one to three sites across the river) were sampled in the Godavari delta and in the middle Godavari (Fig. 1b; site 10 and 28). At these sites, river water was collected at equal increments to the riverbed with a custom-built depth sampler (after Lupker et al., 2011). Riverbed sediments were dredged at each location with a sediment grabber (Van Veen grab 04.30.01, Eijkelkamp) or with a shovel when the water level was low. The fine fraction (≤ 63 µm) was isolated by sieving for a selection of sites for soils (n=10) and riverbed sediments collected in the wet season (n=25). All samples were frozen upon arrival in the laboratory.
2.3 Elemental and bulk isotopic analysis
Prior to analysis, C3 and C4 plants, bulk soils, and riverbed sediments were freeze-dried, homogenised and ground into powder using an agate mortar and pestle or a steel ball mill. The bulk soils and sediments were decalcified by overnight treatment with 1 M HCl and then rinsed twice with deionised water and left to dry at 60 ∘C, following van Helmond et al. (2017). SPM was decalcified by vapour acidification (Komada et al., 2008; van der Voort et al., 2016). In short, randomly selected, small pieces of GF/F filters containing the SPM were placed in pre-combusted (450 ∘C, 6 h) Ag capsules and put in a desiccator at 70 ∘C with 37 % HCl for 72 h and subsequently dried for minimal 120 h with NaOH. Fine-fraction (≤ 63 µm) soils and sediments were placed in pre-combusted Ag capsules and decalcified by addition of 100 µL 1 M HCl and then left to dry overnight at 60 ∘C, following Vonk et al. (2008, 2010).
Total organic carbon (TOC) content (wt %) and bulk stable carbon isotopic composition (δ13C) of plants, (bulk) soils, riverbed sediments and SPM was measured with a Flash 2000 organic element analyser connected to a Thermo Delta V Advantage isotope ratio mass spectrometer (Thermo Scientific, Italy), at NIOZ (Royal Netherlands Institute for Sea Research; Texel, the Netherlands). Total nitrogen (TN) (wt %) was measured for plants and in non-decalcified bulk soils in the same way. Integration was performed with Isodat 3.0 software. TN in non-decalcified bulk sediments was measured with an NA 1500 NCS analyser (Fison Instruments, United Kingdom), at Utrecht University (Utrecht, the Netherlands). Fine-fraction (≤63 µm) soils and riverbed sediments were analysed with an NC2500 elemental analyser coupled to a Thermo Finnigan DeltaPlus isotope ratio mass spectrometer (ThermoQuest, Germany), at Vrije Universiteit Amsterdam (the Netherlands). The results were normalised to certified standards (acetanilide, benzoic acid and urea at NIOZ and USGS40, USGS41 and IAEA-601 at Vrije Universiteit Amsterdam), with an analytical uncertainty <0.1 % for TOC, <0.2 ‰ for δ13C and <3 % for TN, based on replicate analysis of standards and samples. The δ13C values were reported in the standard delta notation, relative to the international Vienna Pee Dee Belemnite (VPDB) standard for δ13C. ratios were reported as mass ratios.
2.4 Precipitation and regression analysis
The mean annual precipitation (MAP) in the Godavari basin was used to evaluate the control of drought stress on plant δ13C values, as prior studies found evidence for a relationship between MAP and δ13C values of C3 plants around the world (Stewart et al., 1995; Diefendorf et al., 2010; Kohn, 2010). Nonetheless, field surveys and data compilations of C3 vegetation in drought-stressed regions reported high inter- and intraspecies variation in C3 plant δ13C values in response to MAP (Ma et al., 2012; Liu et al., 2013, 2014; Basu et al., 2021; Luo et al., 2021). The range of ∼ 500 to 1500 mm yr−1 MAP in the Godavari basin was markedly lower than in tropical forests, where MAP is typically >2000 mm yr−1 and where the majority of global C3 biomass occurs (Kohn, 2010). Here, we focused on MAP in 2014 (Harris et al., 2014; Water Resources Information System, 2021), the growing season preceding the sampling campaign in the dry season in early 2015, considering that the majority (>80 %) of rainfall falls in the wet season and that dry to moist deciduous vegetation is prevalent, which grows new leaves over the wet season and sheds them at the end of the dry period (Kushwaha and Singh, 2005; Elliott et al., 2006). Long-term rainfall deficiencies have resulted in pronounced drought conditions in the upper basin (Kirkels et al., 2020b) (Fig. S2).
In order to deal with the uneven distribution of analysed C3 plants over the MAP range in the Godavari basin, we used a binning approach for the C3 plant δ13C values. The data were binned by calculating the average and standard error in C3 plant δ13C values per MAP range of 100 mm yr−1. These binned Godavari C3 plant data were subsequently plotted against the average MAP of each bin and utilised for regression analysis to assess the relation between C3 plant δ13C values and MAP. The correlation established by regression analysis, and the (sub)basin-specific MAP was subsequently used to correct the plant stable carbon isotope end-member values that are used in the C3 / C4 mixing model for drought effects. A cut-off value for MAP of 1750 mm yr−1 was used to determine plant end-members without drought effects, as above this MAP the C3 plant δ13C value can be considered constant, as there is no water limitation (Kohn, 2010).
2.5 Mixing model and Suess correction
The relative abundance of C3 and C4 plants was estimated based on the isotope mixing model by Phillips and Gregg (2001) using linear mass-balance equations and accounting for the variation in the C3 and C4 plants (i.e. sources) as well as in the soils or sediment (i.e. mixture):
In Eq. (1) and represent the bulk δ13C plant end-member values (‰), and δ13CS is the (sub)basin-specific bulk δ13C value (‰) of soil or riverbed sediments. The δ13CS values were concentration-weighted using the TOC content (wt %) of the individual samples in the (sub)basin, and error propagation was accounted for. This mixing model provided an estimation of the proportion of C3 and C4 plants, including the standard error of variance on these estimates. Alternative mixing approaches including the C3 fraction woody cover, which accounts for vegetation structure and shading effects (e.g. Wynn and Bird, 2008; Cerling et al., 2011; Garcin et al., 2014), may be complicated by the fact that agricultural use (∼ 60 % of the basin) and deforestation since the 19th century have resulted in a more open landscape and have drastically reduced the area covered by native, closed-canopy forests, which is now limited to the region of the east tributaries.
C3 and C4 plant end-members to resolve the mixing model can be based on measurement of regionally occurring, modern vegetation in the Godavari basin (referred to as Godavari-based or regional end-members), which are representative of the prevailing habitat conditions. Alternatively, global end-members can be used based on C3 and C4 plants collected worldwide and reported in literature compilations. Commonly quoted global averages are −27 ‰ for C3 plants (Cerling et al., 1997; Koch, 1998; Dawson et al., 2002) and −12 ‰ for C4 plants (Koch, 1998; Dawson et al., 2002). However, the atmospheric δ13C of CO2 has rapidly declined over the past decades due to fossil fuel burning, so δ13C data based on analyses of plants in the past require a correction for this so-called Suess effect. Unfortunately, the exact sampling year for these global averages was unknown, but considering that similar values have been reported since the late 1970s we estimated a maximum decrease in global plant δ13C values of ∼ 0.9 ‰ (atmospheric CO2: ∼ −7.5 ‰ in 1978 to ∼ −8.4 ‰ in 2015; Keeling et al., 2001, 2017; Graven et al., 2017; NOAA, 2022). This correction for the Suess effect translated in to estimates of ∼ −27.9 ‰ and −12.9 ‰ for the global averages for C3 and C4 plants, respectively (Table 1). Alternatively, Kohn (2010) determined a value of ∼ −28.5 ‰ (corrected for Suess effect for the year 2000) representing global C3 vegetation including equatorial and mid-latitude biomass, which was updated to a modern value of ∼ −28.9 ‰. To compare δ13C values measured in Godavari plants collected in early 2015 with those reported in earlier studies, we updated the latter to account for the Suess effect (Table 1).
Table 1Suess correction of plant δ13C values.
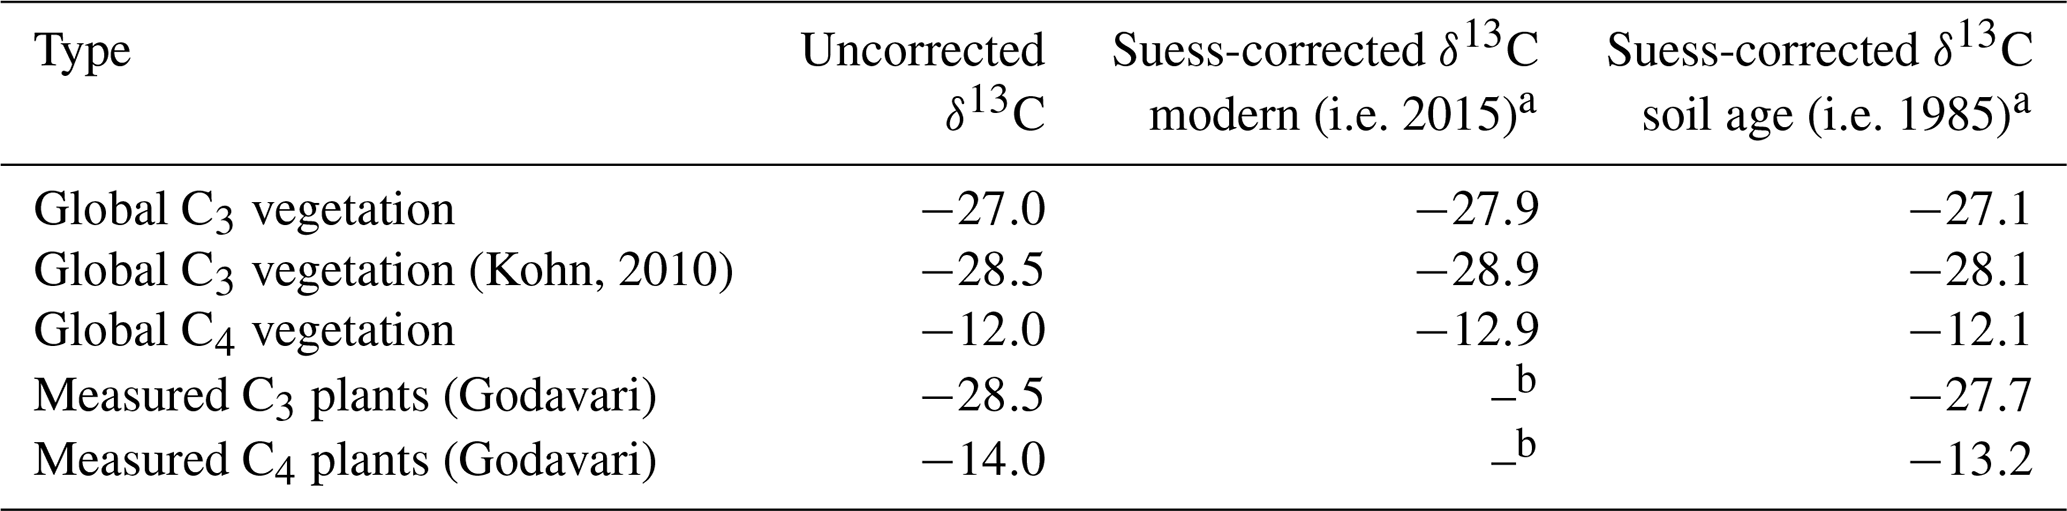
a Based on Keeling et al. (2001, 2017) and Graven et al. (2017). b Measured plants in the Godavari basin are modern.
The plant δ13C signal is subsequently transferred to soils or sedimentary deposits, where the δ13Corg signal is assumed to integrate long-term and/or spatial areas and thus incorporate/average the plant δ13C signal for a range of precipitation within this period/region. In order to compare the δ13Corg values of pre-aged soils and sediments with those of modern vegetation, a correction for the Suess effect is warranted. Analysis of Δ14C of OC in a selection of Godavari soils and sediments by Usman et al. (2018) revealed no distinct differences between the upper and lower basin nor between bulk soils and riverbed sediments. However, the large variation in Δ14COC values, potentially related to small contributions of very old OC from wind-blown coal dust from the open-pit mines in the north of the basin, made it difficult to determine the average age of OC in the Godavari basin based on these data. Assuming OC turnover rates of ∼ 10 years in tropical forest soils to ∼ 25–40 years in savanna ecosystems (Martin et al., 1990; Bird et al., 1996), we estimated an average age of ∼ 30 years for OC in Godavari soils and riverbed sediments. This estimate is at the upper end of recently determined biome-specific OC turnover rates for tropical forests and savannas, where precipitation was shown to have a major effect on soil OC turnover rates (e.g. Carvalhais et al., 2014; Hein et al., 2020). To enable direct comparison of δ13C values from plants with δ13Corg values from soils and sediments and employ these in the mixing model, we corrected the measured δ13C in modern vegetation for the Suess effect to the average age of soil/sediment OC (i.e. 30 years preceding the plant collection in 2015: 1985) (Table 1).
To evaluate the impact of C4 and C3 plant end-members on the reconstructed vegetation distribution, we compared four scenarios that included average global and regional vegetation end-members and C3 plant end-members with and without a correction for a drought-induced 13C enrichment (i.e. drought correction). This included (1) Godavari C4 and C3 plant end-members, with drought correction of C3 plant δ13C; (2) Godavari C4 and C3 end-members, with no drought correction of C3 plant δ13C; (3) C4 and C3 end-members based on global data compilations, with the C3 end-member according to Kohn (2010) that includes equatorial and low-latitude biomass; and (4) global C4 and C3 end-members based on global data compilations and commonly quoted in literature. All plant end-members were Suess corrected to the equivalent age of soils and sediments in the Godavari basin (Table 1).
2.6 Statistics
Spatial and seasonal differences were evaluated with (Welch's) one- and two-way ANOVA, (paired) t tests, and non-parametric Mann–Whitney and Kruskal–Wallis tests with the R software package for statistical computing (R4.0.4; RStudio, v. 1.2.5033) and SPSS (IBM, v. 27.0.1.0). The level of significance was p≤0.05. The reported values are the mean ± standard error (SE). Linear regression analysis (Pearson's R) was performed to obtain the correlation between δ13C and MAP. Spatial patterns were further investigated with ArcGIS software (Esri, v. 10.8.1).
3.1 Modern C3 and C4 plants in the Godavari basin and control by MAP
The Godavari plants (n=96) showed two distinct groups, with bulk δ13C values that ranged from −12.7 ‰ to −15.1 ‰ for C4 plants (n=16, 9 different species) and from −24.3 ‰ to −33.2 ‰ for C3 plants (n=77, 38 different species) (Kirkels et al., 2022a) (Figs. 2, 3a). The sampled Godavari plants fell within the typical ranges for global C4 (∼ −10.5 ‰ to −14.5 ‰; Cerling et al., 1997) and C3 vegetation (∼ −20.5 ‰ to −37.5 ‰; Kohn, 2010) (downward corrected by ∼ −0.5 ‰ for fossil fuel burning). As in the Godavari basin only a very small area was covered by wet evergreen forest with a MAP of ∼ 1500–2000 mm yr−1, we observed less negative δ13C values for C3 plants compared to tropical rain forests with MAP typically exceeding 2000 mm yr−1 (Kohn, 2010) (Figs. 1b, 2).
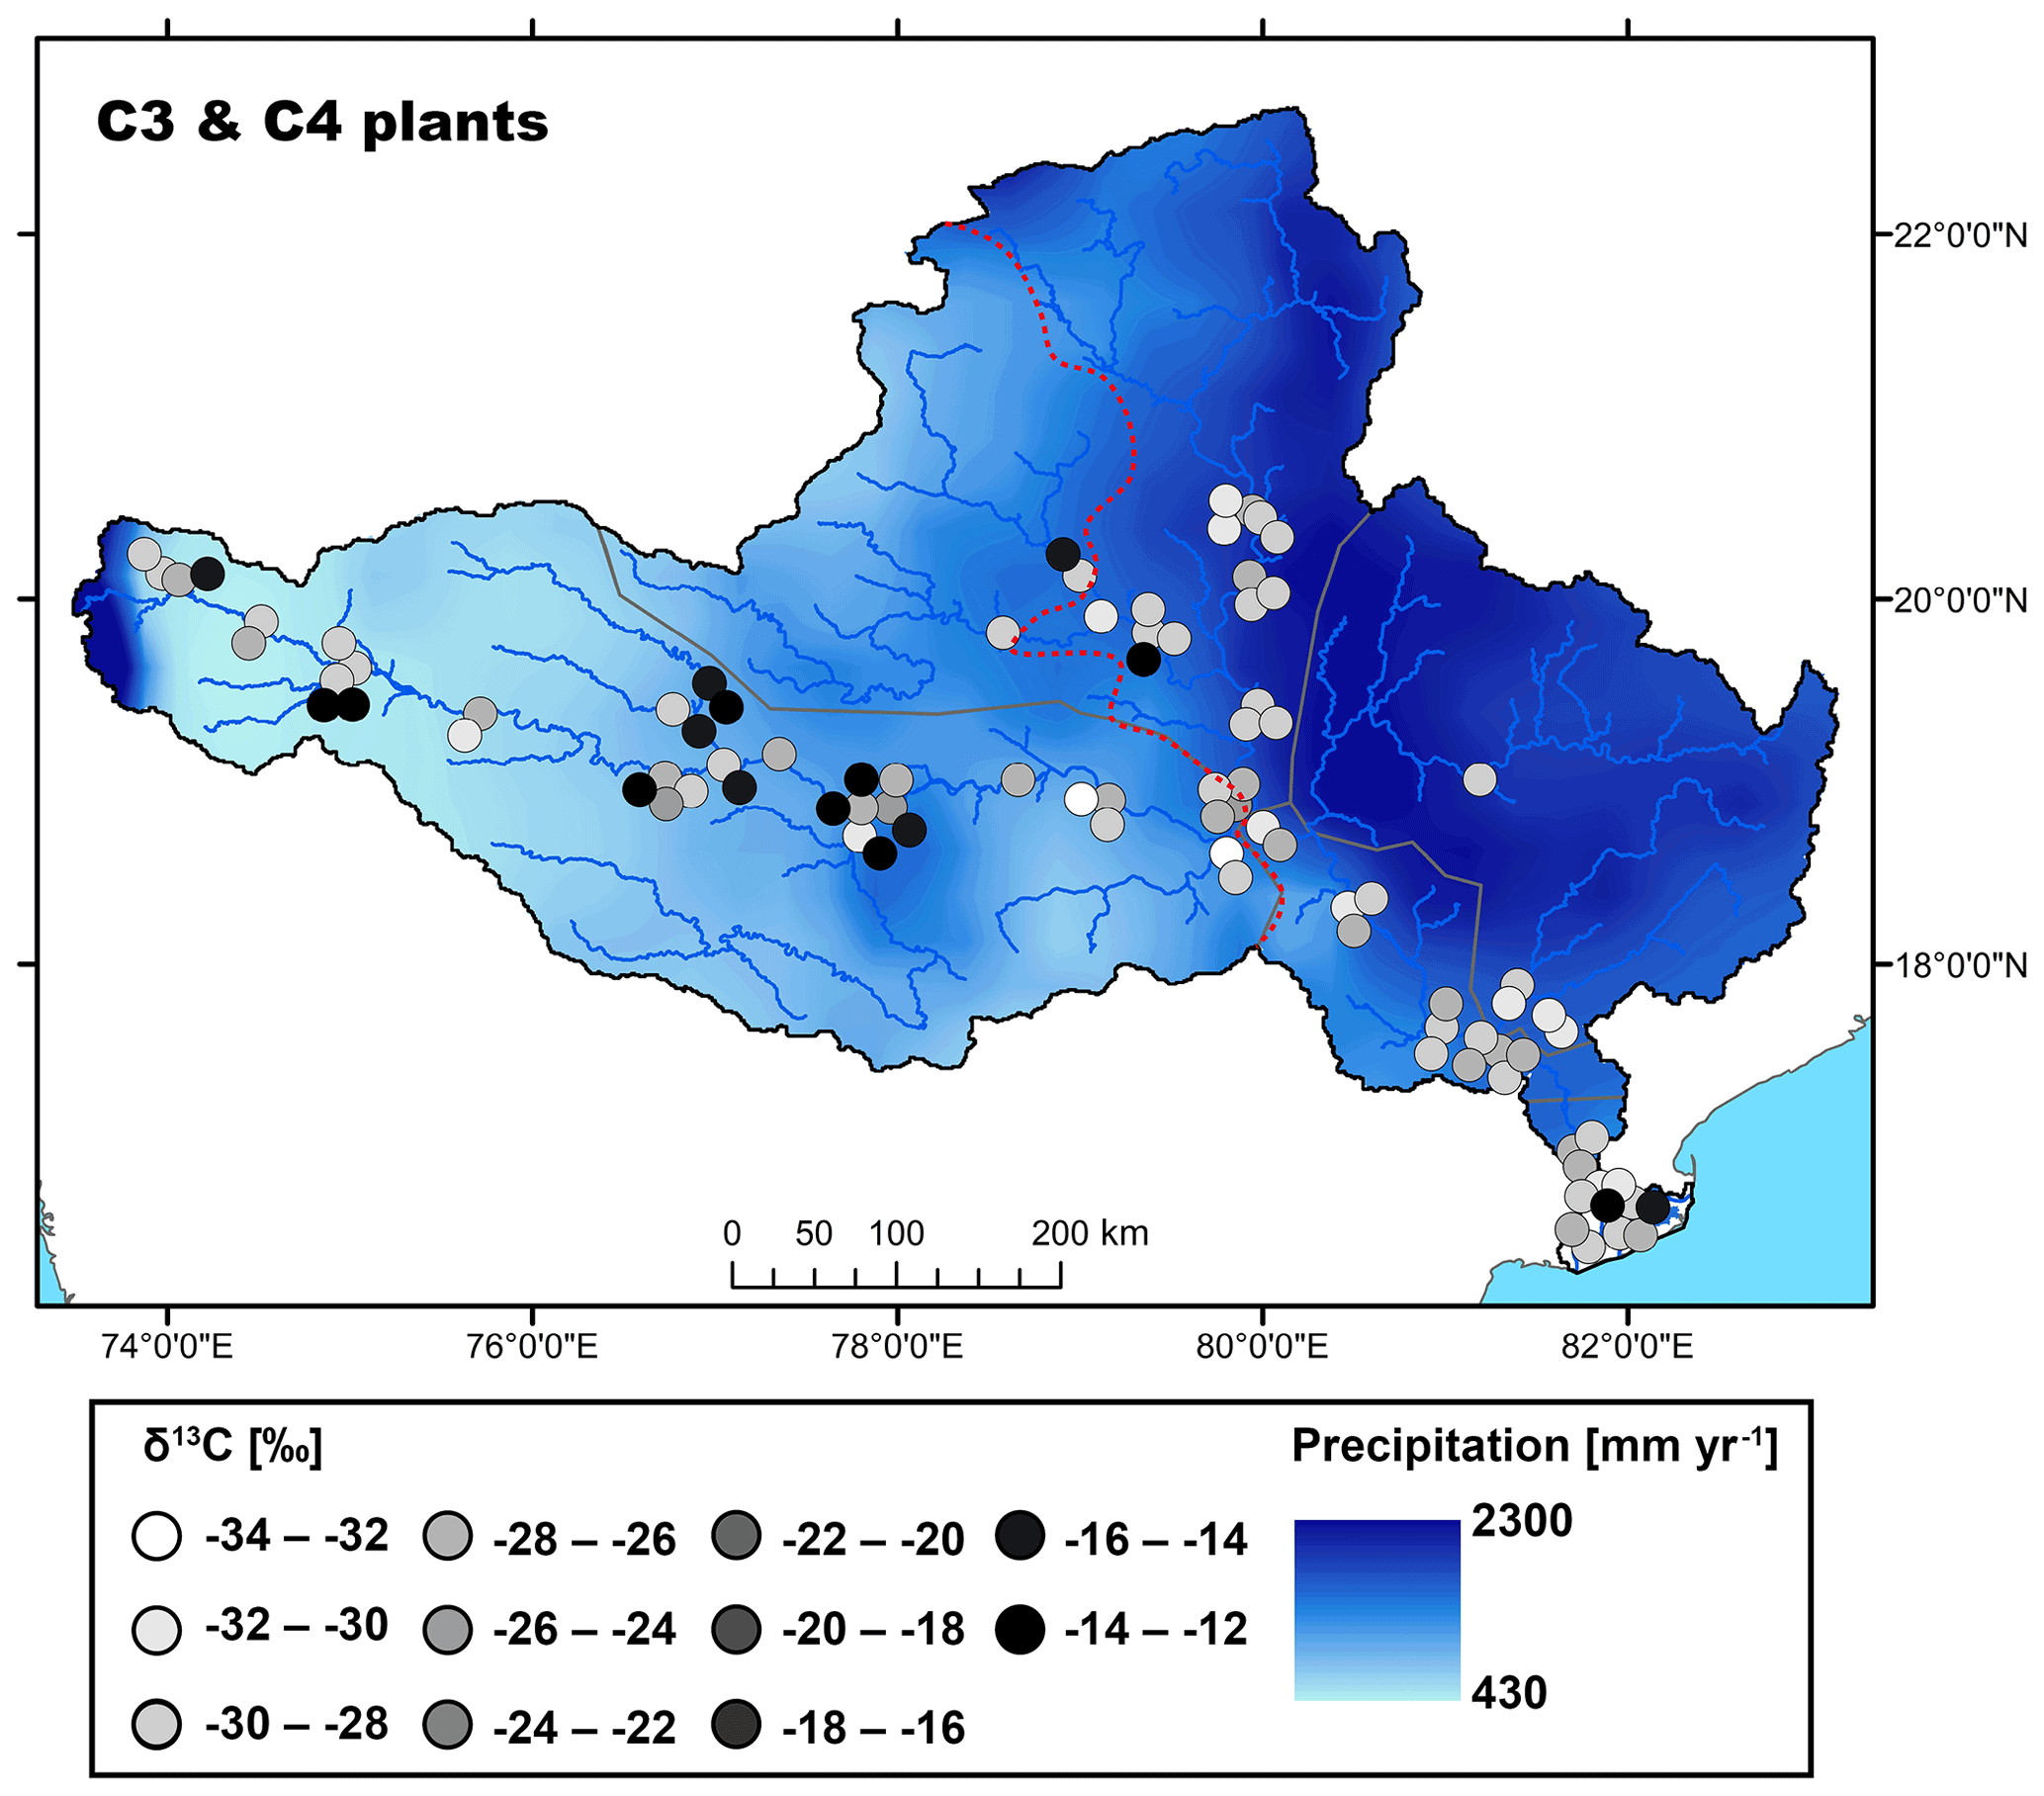
Figure 2Map showing the spatial distribution of C3 and C4 plant δ13C values in the Godavari basin. The red dashed line indicates the boundary of the upper/lower basin. The points refer to the measured δ13C values and the 30-year average rainfall distribution (MAP; 0.25∘, APHRODITE dataset, Asian Precipitation–Highly Resolved Observational Data Integration Towards Evaluation of Water Resources; Yatagai et al., 2012) is shown in the background.

Figure 3Box-and-whisker plot of δ13C(org) values measured in C3 and C4 plants, soils, SPM, and riverbed sediments collected in the dry and wet season in the upper and lower Godavari basin. The box represents the first (Q1) and third (Q3) quartiles, and the line in the box represents the median value; the whiskers extend to values, and outliers are shown as points. Outcomes of the two-way ANOVA are indicated for plants, soils and SPM, and those of non-parametric tests (Mann–Whitney and Kruskal–Wallis) are for the sediments. The level of significance is as follows: NS for not significant, * for p≤0.05, for p≤0.01 and for p≤0.001.
The C4 crops we collected in the Godavari basin, including Zea mays, Sorghum vulgare and Saccharum officinarum, had similar δ13C values as earlier reported for these species in the Godavari basin (Pradhan et al., 2014; Krishna et al., 2015). The Godavari C4 plants we sampled had on average more negative δ13C values than those collected in the only other extensive field survey of Indian plants on the Gangetic Plain ( ‰ (± standard error: SE), n=16, (Fig. 3a) vs. ‰, n=45; p≤0.001), where they found most negative δ13C values in areas with MAP < 1000 mm yr−1 and observed an effect of MAP on C4 plant δ13C values (Basu et al., 2015). In contrast, the Godavari C4 plants showed no significant correlation with MAP (Eq. 3; Pearson's ; p=0.70) (Fig. 4). The absence of a correlation for the Godavari C4 plants may be influenced by the relatively small sample size, and their main occurrence is only a limited part of the MAP range covered (i.e. ∼ 500–900 mm yr−1 in 2014). Nevertheless, earlier studies also predominantly found no trends in C4 plant δ13C values in response to MAP in dry ecosystems around the globe (<800 mm yr−1; Schulze et al., 1996; Swap et al., 2004). This finding was attributed to the CO2-concentrating mechanism in C4 plants. This adaption to water loss due to evaporation in warm and dry climates may be influenced by the leaking of CO2 from bundle sheath cells during extreme drought but functions relatively robustly for a wide range of environmental conditions, including drought stress (Murphy and Bowman, 2009). Taken together, we interpret that there was no basis for correction of the δ13C C4 end-member for drought conditions.
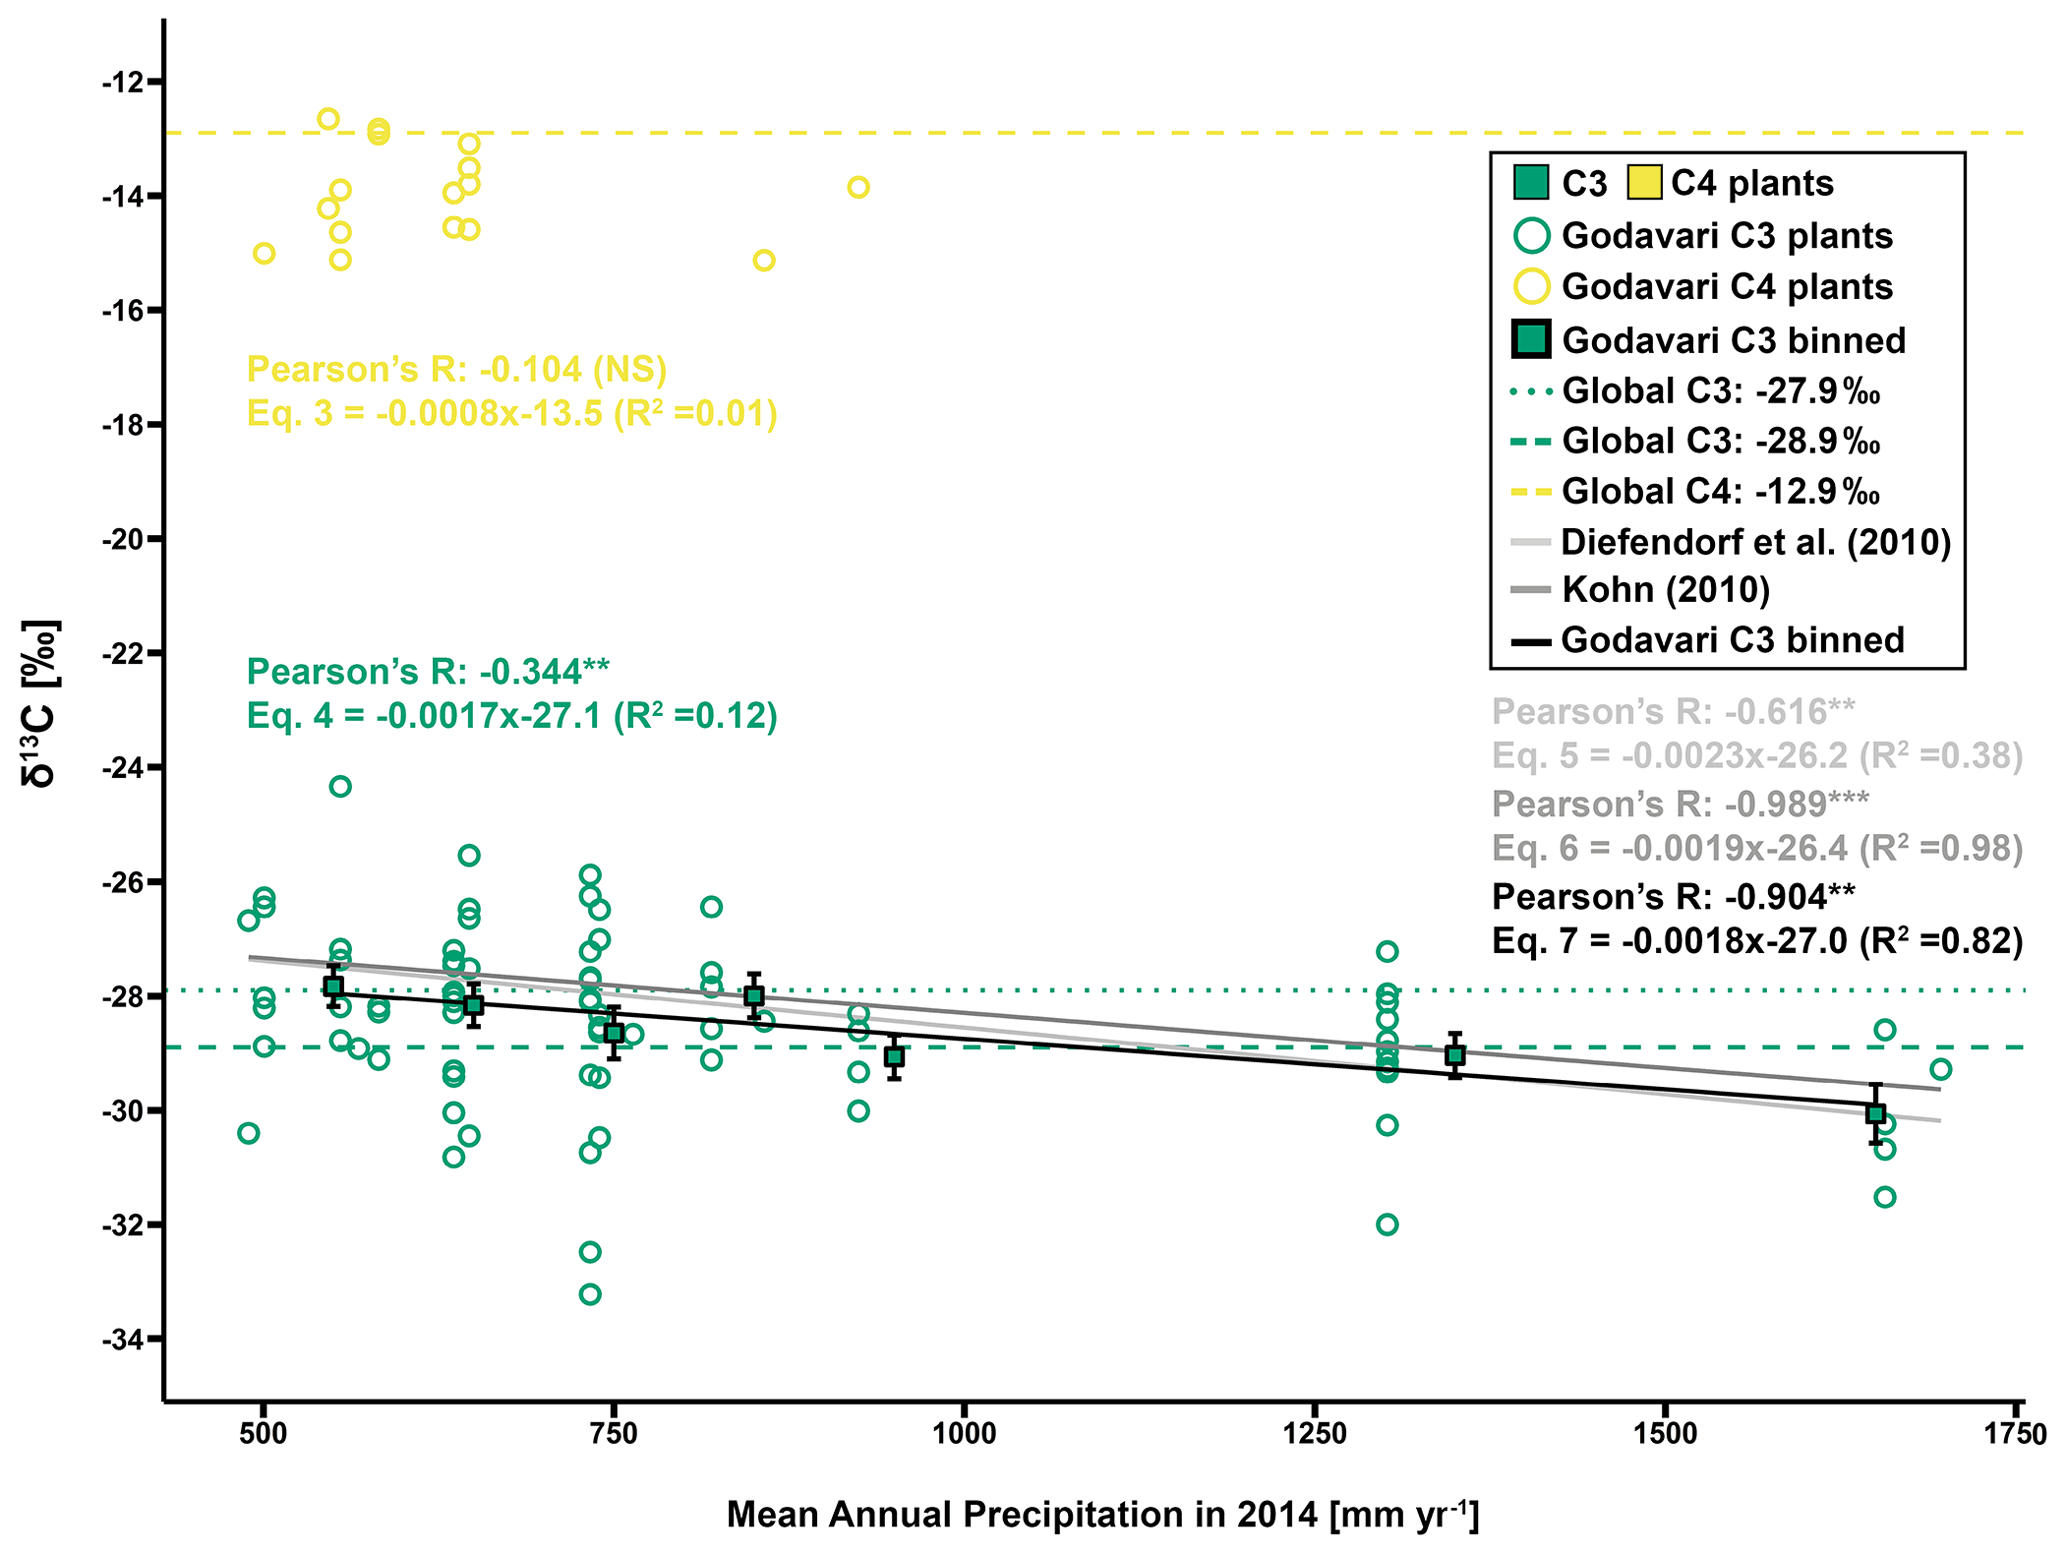
Figure 4Regression analysis of δ13C values against MAP (2014, previous growing season) for C3 and C4 plants in the Godavari basin and estimates based on global C3 vegetation models by Diefendorf et al. (2010) and Kohn (2010). For Godavari C3 plants, δ13C values are also binned per MAP of 100 mm yr−1, and the mean ± standard error (SE; whiskers) is presented. The bin of 500–600 mm yr−1 includes two samples with a MAP of 489 mm. The solid lines denote the linear fit for the Diefendorf et al. (2010), Kohn (2010) and C3 binned correlation. Pearson's R, equation and R2 are given for each correlation. Compilation-based δ13C values of vegetation sampled around the world are given for C4 (−12.9 ‰) (yellow dashed) and C3 plants (see Table 1). The latter is represented by a commonly quoted δ13C value of −27.9 ‰ (dark green, dotted) that is biased toward dry ecosystems according to Kohn (2010) and a δ13C value established by Kohn (2010) of −28.9 ‰ (dark green, dashed) that includes more equatorial and mid-latitude C3 biomass. The level of significance is as follows: NS for not significant, * for p≤0.05, for p≤0.01 and for p≤0.001.
The average δ13C value of Godavari C3 plants was significantly different in the upper and lower basin, where values are slightly less negative in the upper basin ( ‰, n=32) than in the lower basin ( ‰, n=45; p≤0.05) (Fig. 3a). This finding corresponds to the observed spatial gradient in MAP in the Godavari basin and thus suggests an effect of MAP on C3 plant δ13C values. Indeed, long-term MAP (1901–2015) was markedly lower in the upper than the lower Godavari basin (p≤0.001), and this contrast became more extreme for the 5-year average and 2014 MAP, which resulted in drought conditions in the upper basin (Kirkels et al., 2020b) (Fig. S2). The least negative subbasin-averaged δ13C value for C3 plants was found in the upper Godavari subbasin that received the least precipitation (δ13C: ‰, n=30; MAP: 593±18 mm yr−1), compared to the most negative value in the east tributaries that received significantly more precipitation (δ13C: ‰, n=5; p≤0.05; MAP: 1530±142 mm yr−1; p≤0.01) (Figs. 2, S2). The east tributaries are the only part of the Godavari basin that is covered by native, wet to moist forests where a denser canopy caused ample shading. This likely resulted in lower soil temperatures and higher moisture and humidity levels in the understorey, which generally favours C3 vegetation (Cerling et al., 2011), which was indeed exclusively found in this Godavari subbasin (Figs. 1b, 2). Likewise, Garcin et al. (2014) reported very negative stable carbon isotopic values for dense tropical forests in Cameroon (>80 % tree cover), mainly controlled by water availability, although a “canopy effect” (van der Merwe and Medina, 1991), which involves recycling of 13C-depleted CO2 in the understorey of closed-canopy forests and stable carbon isotope fractionation due to photosynthesis under low-light conditions, may have resulted in additional 13C-depletion in the C3 leaves.
The individual Godavari C3 plants revealed a small but significant effect by MAP on their δ13C values (Eq. 4; Pearson's ; p≤0.01) (Fig. 4). This finding supports earlier studies by Diefendorf et al. (2010) and Kohn (2010) that found a strong control by MAP on C3 plant δ13C on a global scale and established quantified relationships between the fractionation of carbon isotopes and environmental conditions, including MAP. Application of these established relations for the Godavari basin revealed very similar trends as the Godavari C3 plants (Eqs. 5 and 6, respectively; Fig. 4), although the Kohn (2010) relation was most similar in terms of slope and had a higher R2 than the Diefendorf et al. (2010) correlation. For the individual Godavari C3 plants, we noted considerable variation in δ13C values for any certain amount of precipitation, in line with earlier studies that found high inter- and intraspecies variation in C3 plant δ13C values in response to MAP (Ma et al., 2012; Liu et al., 2013, 2014; Basu et al., 2021; Luo et al., 2021). Moreover, the individual Godavari C3 plants were not evenly distributed over the entire precipitation range, making it more difficult to establish a correlation. Together, this resulted in a relatively weak linear correlation between MAP and individually measured C3 plants (Eq. 4; R2=0.12), where MAP explained only ∼ 12 % of the variation in C3 plant δ13C values.
Subsequent binning of C3 plant δ13C values to overcome their uneven distribution over the range of MAP revealed a strong and significant correlation with MAP (Eq. 7; Pearson's ; p≤0.01) (Fig. 4). The slope of this binned C3 plant correlation (i.e. −0.18 ‰ per 100 mm MAP) could be used to estimate the offset of measured plant δ13C values to those expected as a function of MAP. For the binned C3 plants, MAP explained ∼ 82 % of the variation in δ13C values. This linear relation applies to the interval of precipitation of ∼ 500 to 1750 mm yr−1, above which the C3 plant δ13C value is assumed to be constant, as there is no water limitation (Kohn, 2010). For very dry ecosystems with MAP < 500 mm yr−1, non-linear effects on C3 plant δ13C values need to be considered due to extreme drought stress (Kohn, 2010, 2011; Freeman et al., 2011). Similar to the Godavari C3 plants, a meta-analysis for low-latitude regions (11–30∘ N) showed that the average C3 plant δ13C value would change by ∼ −0.2 ‰ for every 100 mm increase in MAP for the interval of 500–1500 mm yr−1 (Basu et al., 2019b). We note that although the slope of the binned Godavari C3 plants was similar to that of the Kohn (2010) correlation, the ∼ 0.6 ‰ offset in intercept suggests consistently more negative δ13C values for Indian C3 vegetation in relation to MAP than established based on global data compilations by Kohn (2010) and Diefendorf et al. (2010). Within the MAP interval of ∼ 1000–1500 mm yr−1, Godavari C3 plants had similar δ13C values ( ‰, n=11; p>0.20) to those collected on the Gangetic Plain situated in the Himalayan foreland ( ‰, n=76; Basu et al., 2015). The strong control by MAP on C3 plant δ13C values we established for the Godavari basin suggests that this factor needs to be considered in mixing-model approaches to reconstruct vegetation in regions influenced by the Indian monsoon.
3.2 Tracing the plant δ13C signal along the plant–soil–river continuum
The bulk δ13Corg signal preserved in soil or sedimentary archives depends on the input and integration of the C3- and C4-plant-derived δ13C signal, where a temporal shift of ∼ 0.8 ‰ due to the Suess effect is considered regarding the ∼ 30-year turnover rate of OC in soils and sediments (Martin et al., 1990; Bird et al., 1996; Usman et al., 2018) (Table 1). Regardless, δ13Corg may also be influenced by hydroclimatic controls on OC degradation and stabilisation mechanisms in soils and in the river (e.g. Carvalhais et al., 2014; Ward et al., 2017; Hein et al., 2020; Eglinton et al., 2021). The river-transported OC, in the form of suspended (SPM) or riverbed sediments, may be a complex mixture depending on soil- and plant-/litter-derived OC sourcing from particular parts of the basin following rainfall distributions, soil mobilisation, aquatic primary production and hydrodynamic sorting processes within the river. This complexity warrants further exploration of the evolution and provenance of the δ13Corg signal along the plant–soil–river continuum in the Godavari basin.
3.2.1 Soils
The Godavari (bulk) soils had on average less negative δ13Corg values in the upper than in the lower basin ( ‰, n=22 vs. ‰, n=25; p≤0.01) (Kirkels et al., 2022a) (Figs. 3b, 5b). This isotopic contrast corresponds with the vegetation distribution in the basin, with mixed C3 and C4 vegetation in the upper basin and more C3 plants in the lower basin (Figs. 1b, 2). The least negative δ13Corg values were found in soils in the upper Godavari and north tributaries ( ‰, n=20 and ‰, n=12, respectively) covered by thorny shrublands, dry deciduous forest and predominantly C4 crops, followed by the middle Godavari ( ‰, n=4) in a transition zone, and most negative δ13Corg values were found in soils in the east tributaries and lower Godavari that were covered by moist/evergreen forests and C3 crops ( ‰, n=6 and ‰, n=5, respectively) (Figs. 1b, 5a, b, S3). These findings correspond with the general observation that the majority of the soil organic carbon derives from microbially processed plant residues, while the microbial biomass itself has been estimated to contribute only 1 %–5 % (Kögel-Knabner, 2002; Simpson et al., 2007). We note that it is challenging to determine the actual size of the microbial biomass, which is highly dependent on prevailing moisture levels and the availability of easy degradable carbon as an energy source and has a high spatial heterogeneity (Birge et al., 2015; Wiesmeier et al., 2019). Given our sampling strategy where soils were collected in the dry season, the low moisture levels likely limited the microbial biomass size and activity in the Godavari soils. Hence, the δ13Corg values in Godavari soils can be interpreted as a time-averaged plant signal on a decadal scale that reflects the long-term hydrological conditions that underlie this vegetation distribution.
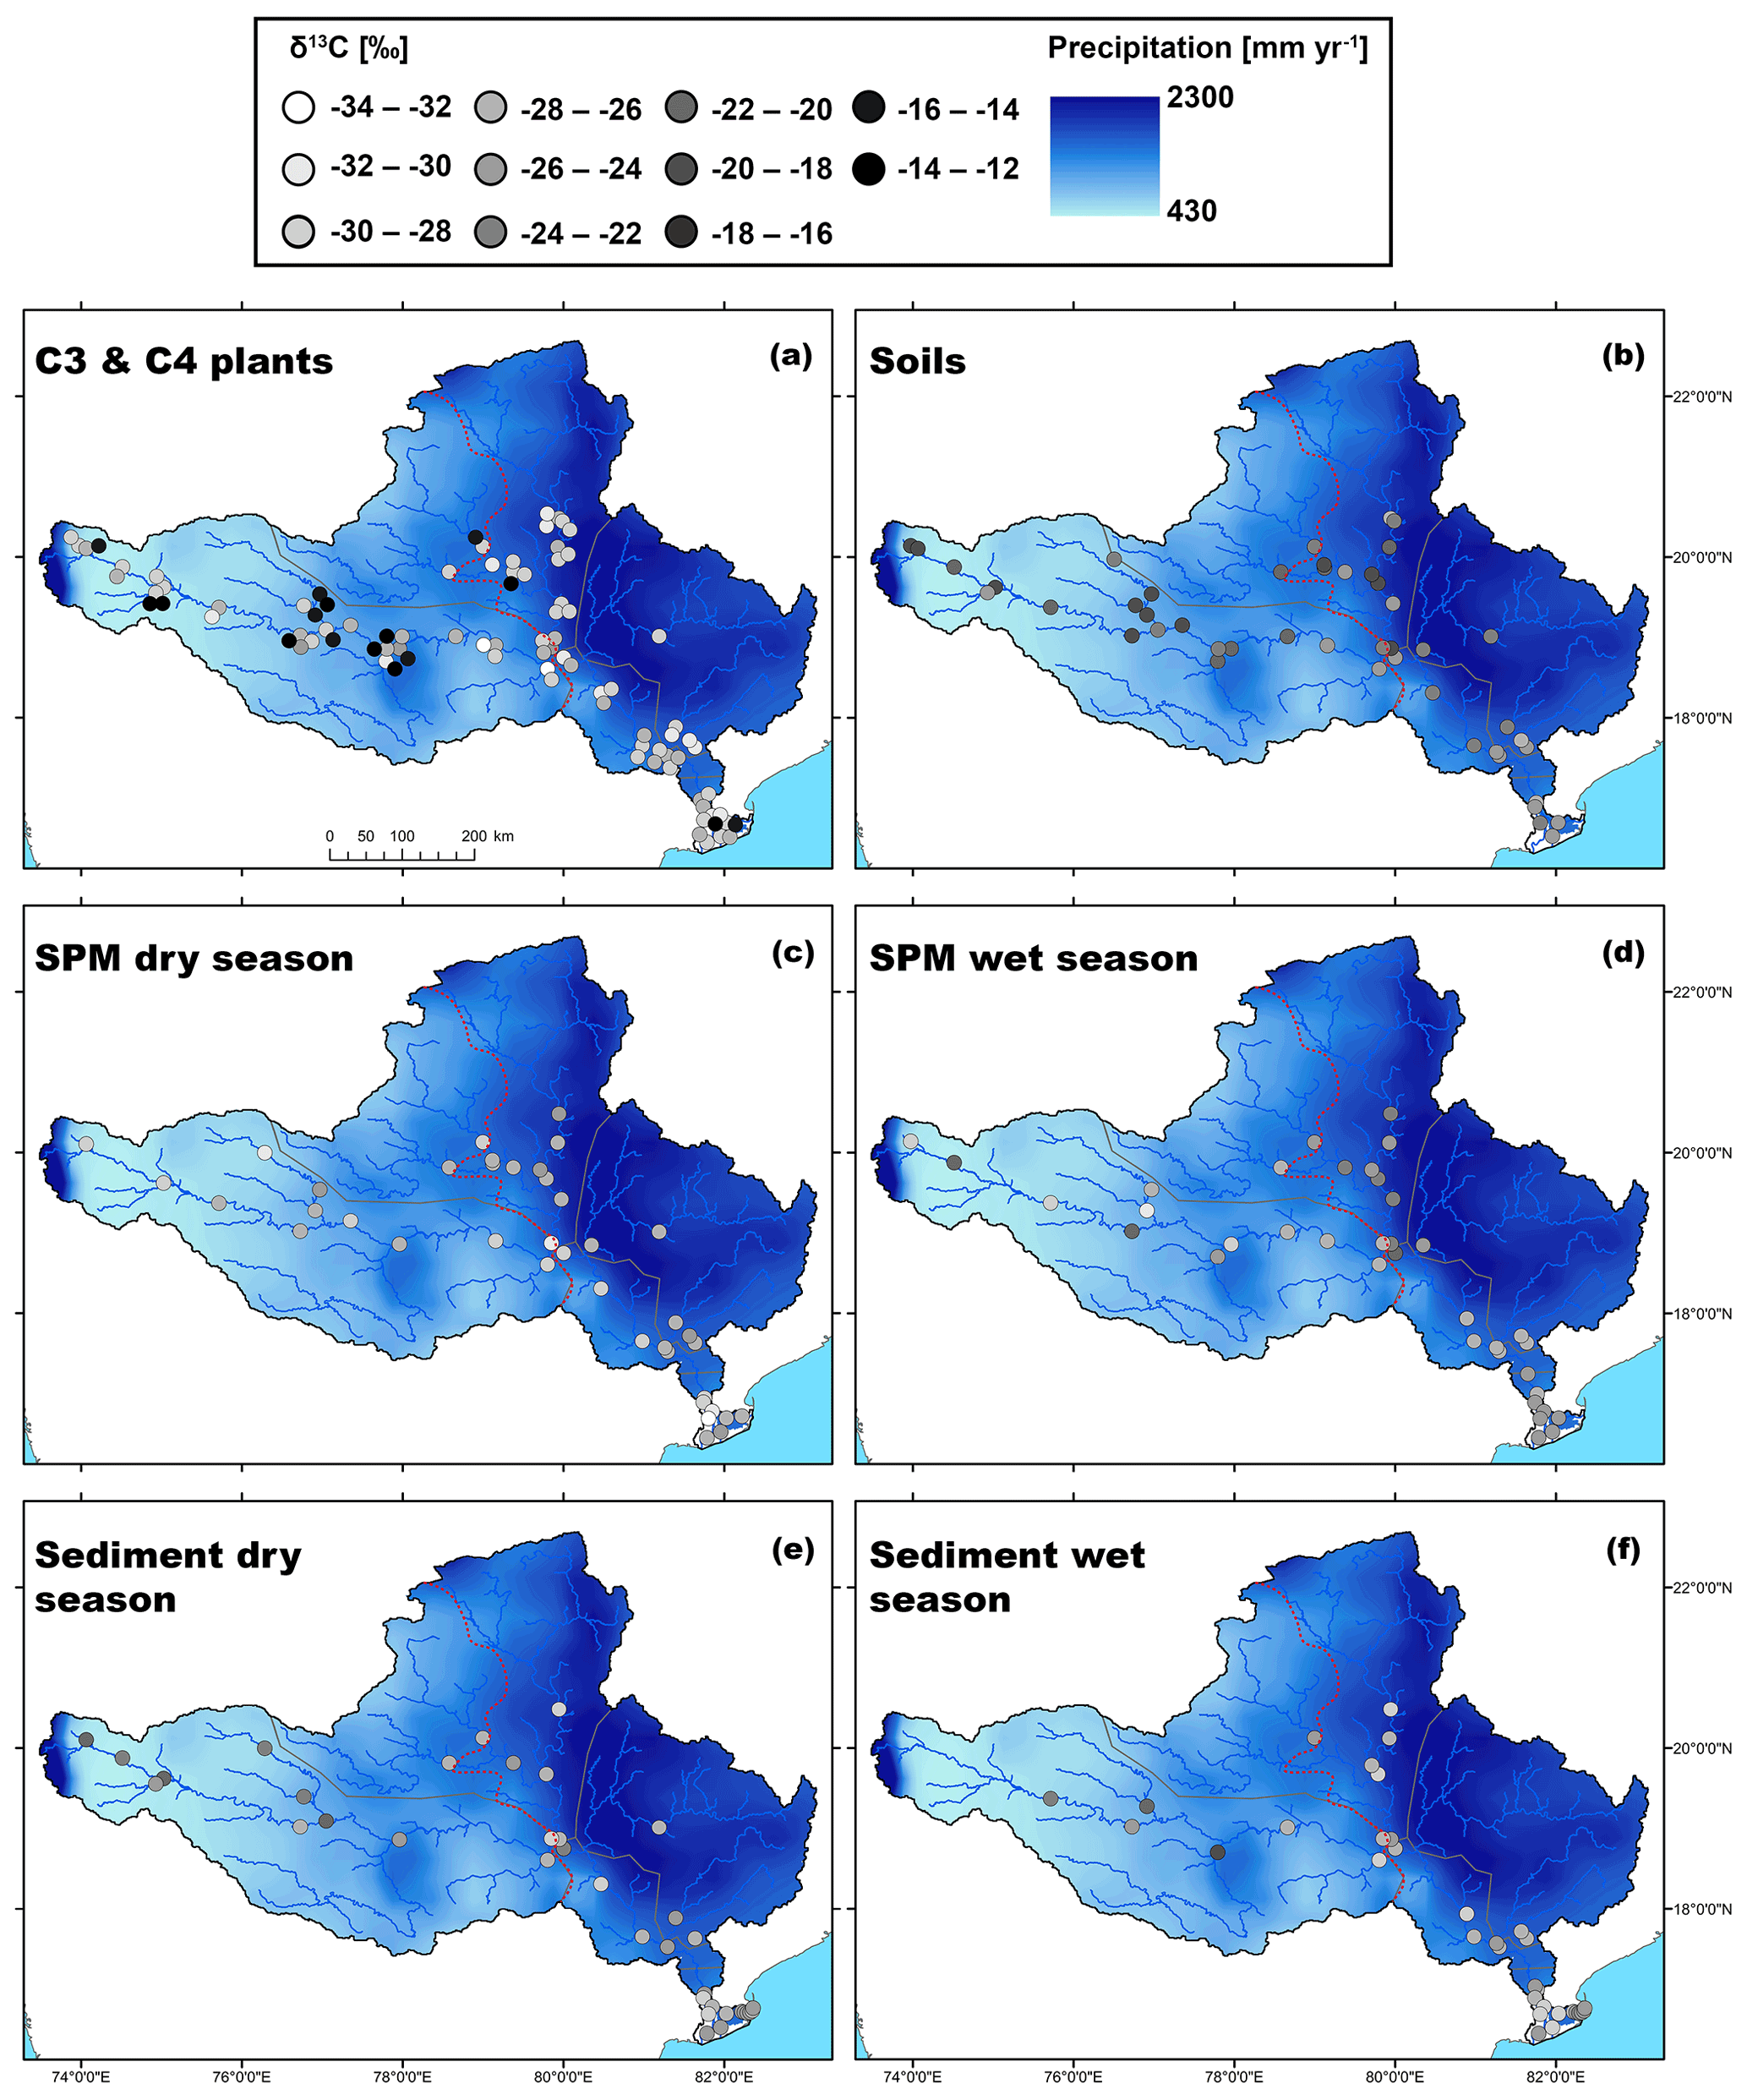
Figure 5Maps showing the spatial distribution of (bulk) δ13C(org) values in the Godavari basin for (a) C3 and C4 plants, (b) (bulk) soils, SPM collected in the (c) dry and (d) wet season, and (bulk) riverbed sediments collected in the (e) dry and (f) wet season. The points refer to the measured δ13C(org) values, and the 30-year average rainfall distribution is shown in the background.
A potential degradation-related 13C enrichment of the plant-derived OC in soils may be suggested by the ∼ 4 ‰ difference between Suess-corrected C3 plant δ13C and soil δ13Corg values found in the C3-dominated lower basin (Fig. 3b, Table 1). This offset is relatively large compared to typical 1 ‰–3 ‰ higher δ13Corg values due to soil OC degradation (e.g. Krull et al., 2005; Sreemany and Bera, 2020), which may result from preferential mineralisation of chemical compounds containing less 13C (i.e. with a lower δ13C value) and/or stable carbon isotope fractionation during microbial processing preferentially utilising 12C over 13C (Schmidt and Gleixner, 1998). Instead of a degradation-induced shift, deforestation since the late 19th century and agricultural expansion with predominantly drought-adapted C4 crops (Ponton et al., 2012; CWC, 2014; Pradhan et al., 2014) may have contributed to relatively more C4 input and thus enrichment of topsoil δ13Corg values. Regardless, soil OC degradation and stabilisation processes in tropical to subtropical biomes may have an opposite effect on soil δ13Corg signals. In mixed C3 / C4 ecosystems, C4-plant-derived OC has been shown to contain more labile compounds and thus degrade more rapidly than C3-plant-derived OC that contains compounds that are more difficult to degrade (Wynn, 2007; Wynn and Bird, 2007). However, C4-derived OC has also been shown to be preferentially incorporated into fine fractions, as fine particles are presumed to have a higher ability to stabilise the labile, C4-derived compounds onto mineral surfaces where they are better protected against degradation, whereas C3-derived OC is preferentially added to the coarse fraction, thus leaving it less protected (Bird and Pousai, 1997; Wynn, 2007; Wynn and Bird, 2007). In the Godavari basin, Usman et al. (2018) reported similar Δ14C values for soil OC in the upper and lower basin that have different C3 and C4 plant covers, suggesting that the net effect of preferential degradation (more young OC) and stabilisation (more old OC) is minor. Indeed, extensive degradation of C4-plant-derived OC is unlikely, given that the upper basin with most C4 plants contains clay-rich, fine particles from weathering of the Deccan basalts (Giosan et al., 2017; Usman et al., 2018; Kirkels et al., 2022b), which would contribute to stabilising the C4-derived OC. Fine soils (≤63 µm) sampled in the upper basin had on average slightly less negative δ13Corg values than the bulk soils ( ‰, n=8 vs. ‰, n=8; p≤0.09), pointing towards preferential stabilisation of C4-derived OC in the fine fraction (Fig. S4). This result highlights that differences between bulk and fine size fractions could be important for the δ13Corg signal preserved in soils.
3.2.2 Suspended particulate matter
For SPM collected in the Godavari River, bulk δ13Corg values were consistently more negative in the dry than in the wet season and more negative in the upper than the lower basin, but there was no significant interaction between the effects of the season and upper/lower basin (Fig. 3c). In the dry season, SPM δ13Corg values were significantly more negative than in Godavari soils ( ‰, n=40 vs. ‰, n=47; p≤0.001), making a predominant contribution of soil material to the river in this season unlikely (Figs. 3b, c, 5b, c). Instead, the quiescent waters behind dams and very low river discharge favour aquatic primary production (Pradhan et al., 2014). Freshwater phytoplanktonic matter usually has relatively low δ13Corg values. The isotopic fractionation between phytoplankton and dissolved inorganic carbon (DIC) has been estimated at ∼ −23 ‰, resulting in typical phytoplankton-derived δ13Corg values between −31 ‰ and −35 ‰ in the Ganges–Brahmaputra as well as at the start of the dry season in the Godavari River (e.g. Aucour et al., 2006; Galy et al., 2008b; Krishna et al., 2015). The observation of slightly less negative δ13Corg values in our SPM collected at the end of the dry season may be explained by eutrophic conditions due to agricultural/wastewater inputs which fuelled intense aquatic production in the Godavari River (Balakrishna and Probst, 2005; Pradhan et al., 2014). During periods of high aquatic productivity, the carbon isotope fractionation becomes smaller (up to 0 ‰; Torres et al., 2012), and more 13C gets incorporated into the phytoplanktonic biomass. Aquatic primary production is also supported by the strong increase in %OC from soils to dry-season SPM (0.8 ± 0.1 %, n=47 vs. 11.4±1.1 %, n=39; p≤0.001), since phytoplankton-derived SPM is typically high in %OC (Aucour et al., 2006; Galy et al., 2008b). Notably, δ13Corg values of dry-season SPM became less negative near the Godavari's outflows into the Bay of Bengal (Figs. 5c, S3), suggesting mixing of freshwater and estuarine/marine phytoplankton in the delta, where the latter has typically less negative δ13Corg values (i.e. −22.8 ‰ to −24.4 ‰; Dehairs et al., 2000; Krishna et al., 2015; Gawade et al., 2018). This observation is consistent with changes in electrical conductivity and water isotopic values (δ18O) that showed seawater intrusion in the delta in the dry season (Kirkels et al., 2020b). Regardless, mixing of riverine and marine OC with different stable carbon isotopic values at the outflow complicates the tracing of the Godavari-derived OC signal from the river mouth to marine sedimentary deposits.
In the wet season, there was a strong isotopic contrast between SPM collected in the upper and lower basin ( ‰, n=14 vs. ‰, n=26; p≤0.001) (Fig. 3c). The negative δ13Corg values in the upper basin suggest continuous aquatic production, allowed by the limited rainfall and abundant dams in this region that created standing waters and facilitated year-round aquatic productivity (Pradhan et al., 2014; Kirkels et al., 2020b). A few sites in the upper basin had remarkably less negative δ13Corg values, suggesting that some local soil or C4 plant input occurred at locations where agricultural fields with exposed topsoils were situated next to the river (Fig. 5d). In the lower basin, wet-season SPM δ13Corg values varied from −21.3 ‰ to −27.1 ‰ and fell within the range of bulk soils in this region (−18.7 ‰ to −27.1 ‰). This resemblance suggests contribution of soil-derived OC to wet-season SPM in the lower basin. Water isotopic values and rainfall distributions confirmed substantial discharge in the wet season and identified the Weiganga and Pranhita rivers in the north tributaries and the Indravati River in the subbasin of the east tributaries as major source areas (Kirkels et al., 2020b). It is generally assumed that the high flow velocity and turbidity in the wet season would limit aquatic production as well as OC degradation during fluvial transport (Balakrishna and Probst, 2005; Acharyya et al., 2012). In contrast, Galy et al. (2008b) showed for the Ganges–Brahmaputra that ∼ 50 % of the wet-season SPM derived from the upper reaches of the basin was degraded during river transit and replaced by local input from the plains. Quantifying the extent of OC degradation during fluvial transport is thus not straightforward, as it depends on the stability of OC in the river, e.g. protected by mineral associations or not and on its residence time in a specific basin (e.g. Ward et al., 2017; Eglinton et al., 2021).
3.2.3 Riverbed sediments
For riverbed sediments collected in the Godavari River, bulk δ13Corg values were consistently less negative in the upper than in the lower basin ( ‰, n=21 vs. ‰, n=53; p≤0.001), but there was no significant seasonal effect (Figs. 3d; 5e, f). The latter suggests that riverbed sediments represented a season-integrated δ13Corg signal vs. SPM that showed more seasonal variation. A Kruskal–Wallis test revealed that sediments collected in the upper basin in the dry season and those collected in the lower basin in the wet season were significantly different ( ‰, n=13 vs. ‰, n=29; (Bonferroni-corrected) p≤0.05) (Fig. 3d). However, riverbed sediments showed a high spatial variation in δ13Corg values, which ranged from −20.0 ‰ to −29.0 ‰ in the upper and −23.3 ‰ to −28.7 ‰ in the lower basin (Fig. 5e, f). The strong influence of location (upper or lower basin) on sediment δ13Corg values corresponds to the vegetation distribution with more C4 plants and drought-stressed C3 plants in the upper basin, leading to less negative plant δ13C and soil δ13Corg values being transferred to the riverbed sediments. Riverbed sediment δ13Corg values were consistently more negative than soil δ13Corg values in the upper and lower basin (Fig. 3b, d), suggesting input from an additional, 13C-depleted source, likely phytoplankton- or C3-plant-derived OC.
Possible contributions of additional sources can be further explored using a source diagram, where the relation between δ13Corg values and ratios reveals source-specific distributions which help to identify the provenance of OC sources in aquatic ecosystems (e.g. Lamb et al., 2006). For the Godavari basin, riverbed sediments plotted close to Godavari C3 plants, albeit at lower ratios (Fig. 6). This may suggest that slightly degraded C3-plant-derived OC is selectively transported by/stored in the sediments of the lower basin. The lower ratios suggest slight degradation of this OC, although there could also be a small contribution of phytoplankton-derived OC that settled onto the riverbed. Notably, the sediments of the upper basin plotted generally closer to the soils of the upper basin, suggesting an inherited soil δ13Corg signal in these sediments, as soil input was diminished by limited rainfall in this region during our sampling campaigns.
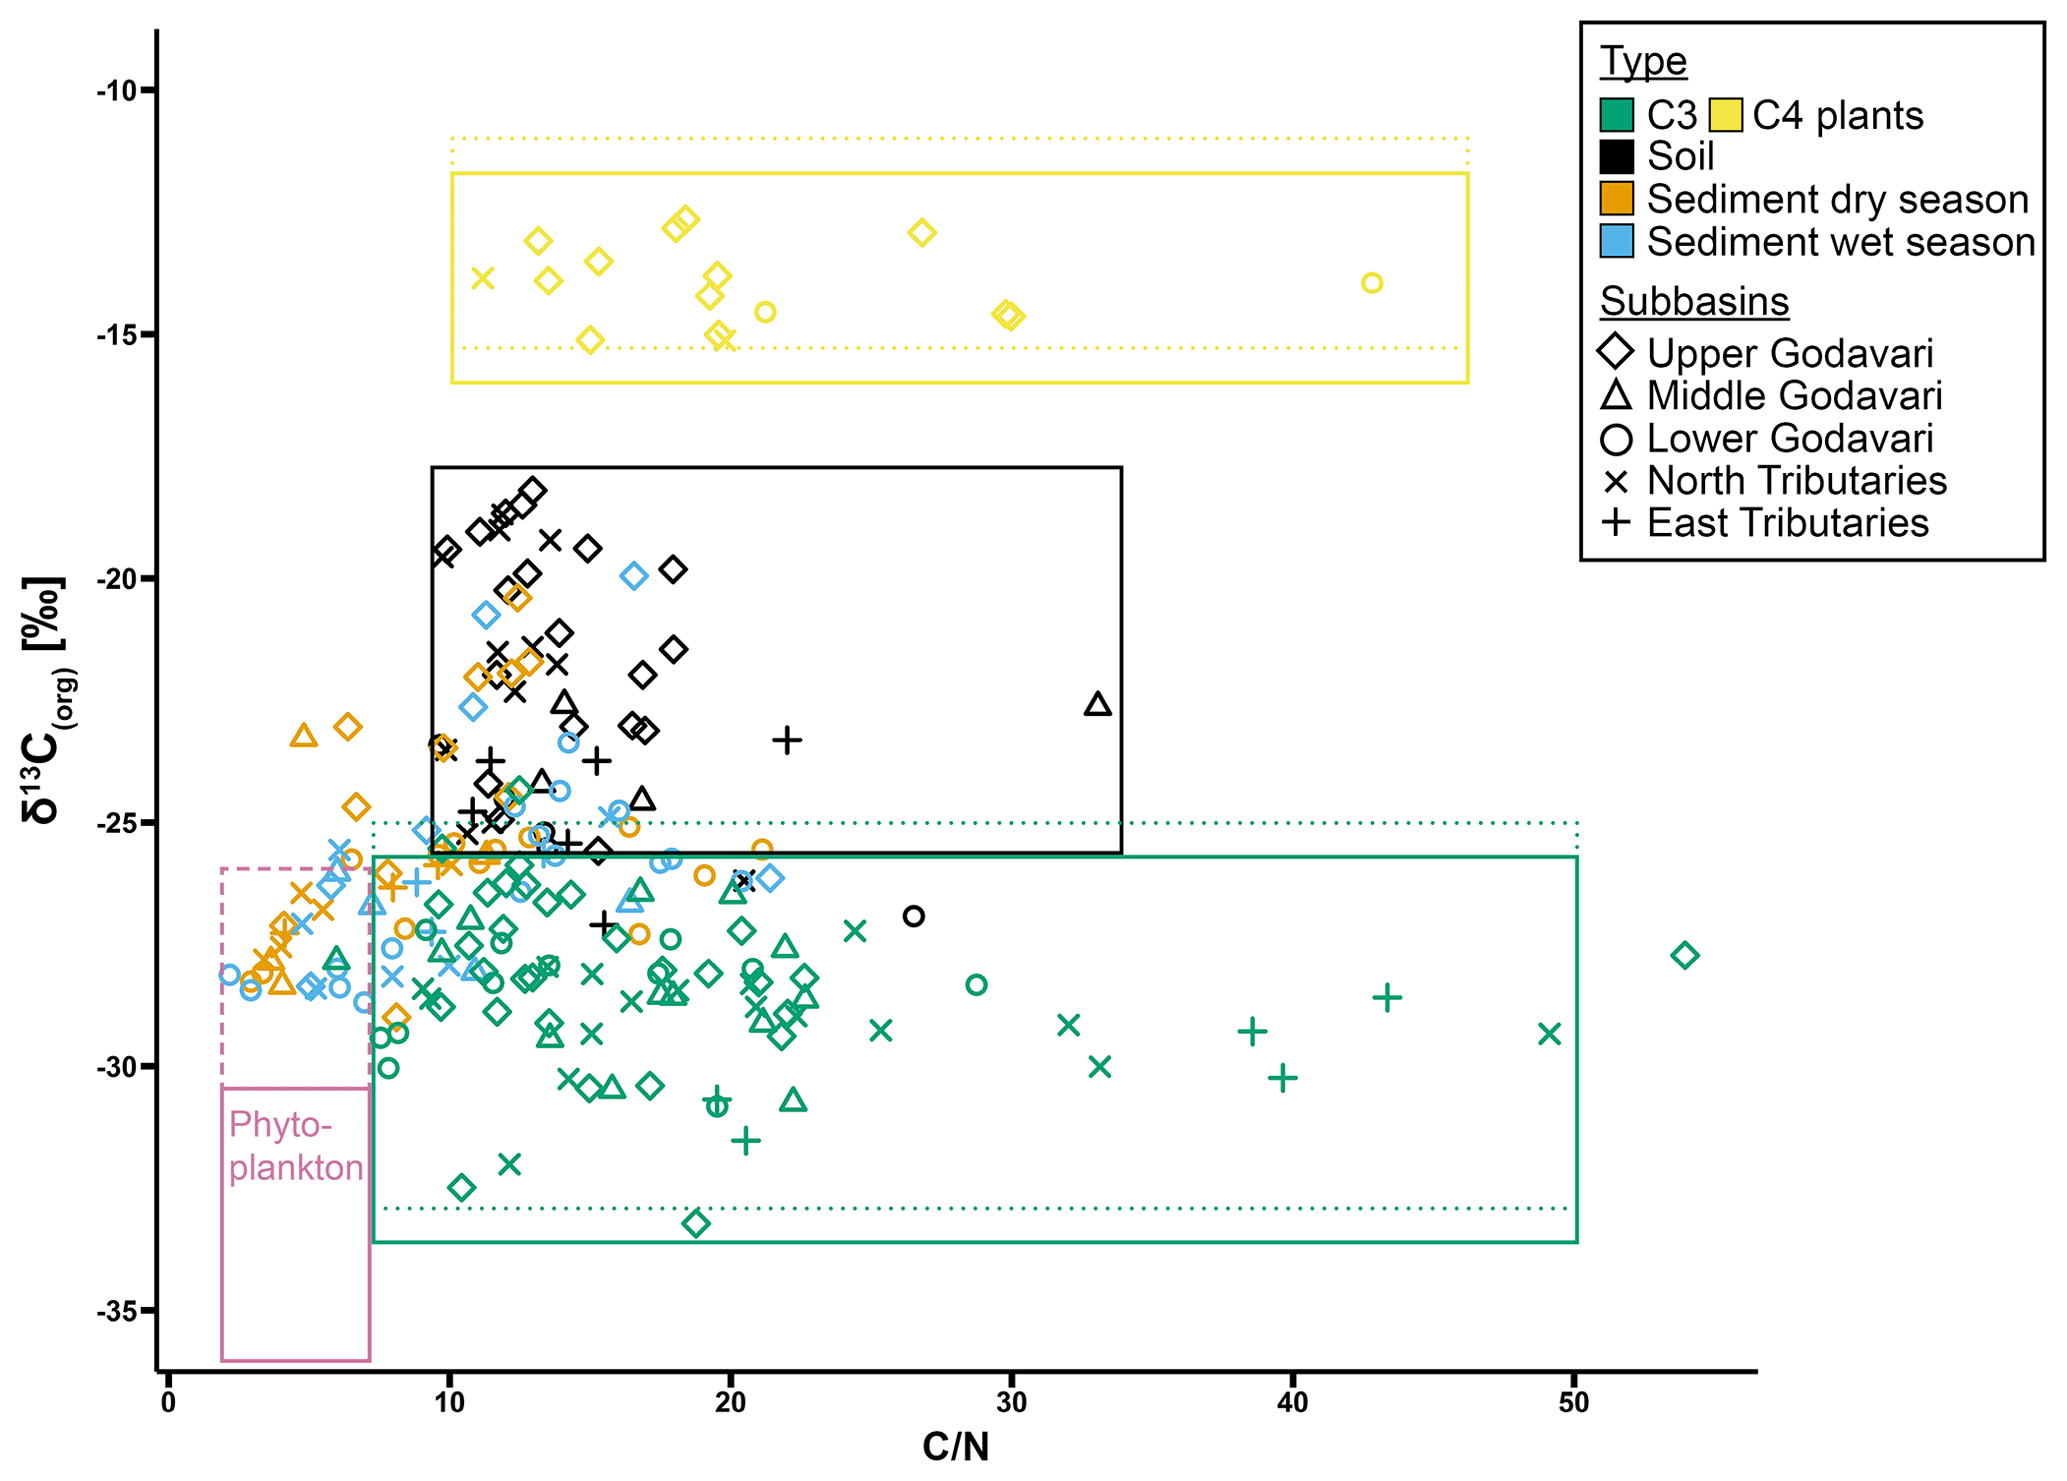
Figure 6Source plot with relation between δ13Corg values and mass ratios for modern C3 and C4 plants and (bulk) soils and riverbed sediments collected in the dry and wet season in the Godavari basin. ratios are retrieved from Kirkels et al. (2021). Freshwater phytoplankton is defined for Indian monsoonal rivers in the dry season (solid line) (: 2.5–8; data from Balakrishna and Probst, 2005; δ13Corg: −31 ‰ to −35 ‰; data from Aucour et al., 2006; Galy et al., 2008b; Krishna et al., 2015) and based on SPM collected at the end of the dry season in this study (dashed pink line). For C3 and C4 plants, Suess-corrected δ13C values (equivalent to the age of soils and sediments; see Table 1) are indicated by the dotted lines.
3.2.4 Hydrodynamic sorting
Fluvial transport of fine particles is of particular interest, as they are generally enriched in OC and their size facilitates effective offshore transport to sedimentary deposits (e.g. Bianchi et al., 2018). At the same time, coarse- and fine-grained particles have been shown to be sensitive to hydrodynamic sorting effects within the river, resulting in depth-specific OC distributions and/or preferential transport of certain OC components (Galy et al., 2008b; Bouchez et al., 2014; Feng et al., 2016; Repasch et al., 2022). Similar to the Godavari soils, riverbed sediments collected in the wet season revealed distinctly less negative δ13Corg values for the fine fractions than the corresponding bulk sediments ( ‰, n=25 vs. ‰, n=25; p≤0.001) (Figs. 5f, S4). This difference corresponds to previous findings that C4-plant-derived OC is preferentially associated with finer fractions, whereas C3-plant-derived OC is contained in the coarser fraction of soils (Bird and Pousai, 1997; Wynn and Bird, 2007) and river(-dominated) sediments (e.g. France-Lanord and Derry, 1994; Bianchi et al., 2002). This finding suggests differential transport of C3- and C4-derived OC in the fine and bulk Godavari riverbed sediments.
Furthermore, wet-season SPM collected along river depth profiles in the middle and lower Godavari showed in general more negative δ13Corg values with depth (Fig. S5). Also, the riverbed sediments dredged at each location had more negative δ13Corg values than the SPM in the water column above. This trend in δ13Corg values suggests that C3-derived OC with typically more negative δ13Corg values was transported in coarse-grained sediments and SPM near the riverbed, similar to findings at peak discharge for the Himalayan-derived Ganges–Brahmaputra (Galy et al., 2008b) and the Bermejo River draining the central Andes (Repasch et al., 2022). Alternatively, a 13C-depleted phytoplankton source was unlikely given that the high flow velocity and turbidity in the monsoon season prevent light penetration and generally limit algae production (Balakrishna and Probst, 2005; Acharyya et al., 2012). Indeed, analysis of lignin, a macromolecule that is exclusively produced by plants, revealed a C3-derived “woody undercurrent” in Godavari riverbed sediments collected in the wet season in the lower basin (Pradhan et al., 2014), similar to earlier findings in the Madre de Dios and Mississippi rivers with strong seasonal variability in their hydrology (Bianchi et al., 2002; Feng et al., 2016). This information corroborates differential transport of fine- and coarse-grained particles and their associated OC sources in the Godavari basin. This insight has important implications for the δ13Corg signal that is finally exported to marine sedimentary deposits in front of the Godavari's mouth, where C4-derived OC with less negative δ13Corg values may be overrepresented, as fine fractions are transported farther offshore and in greater quantities than coarse-grained particles (Goñi et al., 1997, 1998; Bianchi et al., 2002). Indeed, Holocene marine sediments collected in front of the Godavari's mouth contained no woody particles (Ponton et al., 2012; Giosan et al., 2017; Usman et al., 2018), in contrast to the Bengal Fan fed by the Himalayan-derived Ganges–Brahmaputra, which covers a steep altitudinal gradient and carries coarse sediments far offshore at high-flow conditions, where wood particles were found in sediments spanning the last 19 Myr (Lee et al., 2019).
3.3 C3 / C4 vegetation reconstruction and end-member analysis
Mixing-model estimates based on the δ13Corg signal in Godavari soils revealed a high %C4 plants in the upper Godavari subbasin (43±3 %; scenario 1) and in general in the upper basin (43±3 %), which decreased toward the lower basin (31±3 %), from the north tributaries (40±5 %), middle Godavari (32±4%) and east tributaries (29±4 %) to the lowest %C4 plants in the lower Godavari subbasin (19±4 %) (Fig. 7a). This result is consistent with the vegetation structure in the Godavari basin, with a mixed C3 / C4 vegetation in the dry upper basin and dominant C3 vegetation in the lower basin (Figs. 1b, 2) (Giosan et al., 2017; Usman et al., 2018). Pollen assemblages of the modern vegetation corroborate these findings, as they found ∼ 50 % Poaceae (here C4 grasses) in the upper basin based on surface sediments of Lonar Lake (Prasad et al., 2014; Riedel et al., 2015) and ∼ 30 % Poaceae for the whole Godavari basin based on marine surface sediments in front of the Godavari mouth in the Bay of Bengal (Zorzi et al., 2015), which was close to our estimate of 37±2 % C4 plants for the whole basin. Notably, the estimated %C4 plants in the C3-dominated lower basin was relatively high (31±3 %) and may have been influenced by degradation-related enrichment of the soil δ13Corg signal leading to a potential overestimation of the %C4 plants. The C3 / C4 abundances based on the δ13Corg signal of riverbed sediments collected in the wet season also reflected the vegetation gradient (Figs. 7b, 1b). The estimated %C4 plants was consistently lower for riverbed sediments than for soils (−1 % to −21 %; scenario 1), particularly in the north tributaries (−19 %) and the middle Godavari (−21 %) subbasins. Hydrodynamic sorting and preferential transport of C3-plant-derived OC in the coarse-grained riverbed sediments may have influenced the C3 / C4 plant estimates, resulting in a potential underestimation of the %C4 plants in these basins.

Figure 7The estimated proportion (%) of C4 plants determined by a linear mixing model (by Phillips and Gregg, 2001) vs. MAP for different (sub)basins, based the OC-weighted δ13Corg signal in (a) soils and (b) riverbed sediments collected in the wet season. The whiskers represent ± standard error (SE). Four scenarios are included: (1) Godavari C4 and C3 plant end-members, with drought correction of C3 plant δ13C; (2) Godavari C4 and C3 end-members, with no drought correction of C3 plant δ13C; (3) C4 and C3 (based on Kohn, 2010) plant end-members based on compilations of global vegetation; and (4) C4 and C3 plant end-members as commonly quoted in literature (e.g. Cerling et al., 1997; Koch, 1998; Dawson et al., 2002) based on global vegetation (see Table 1). For scenario (2) the mean δ13C value for Godavari C3 plants with no drought stress (i.e. −29.3 ‰) was determined at a MAP of 1750 mm yr−1 using Eq. 7 (see Fig. 4).
In order to assess the influence of drought stress and the use of region-specific plant δ13C end-members on C3 / C4 vegetation mixing-model estimates, we compared four scenarios (Fig. 7). Comparing end-members with and without drought correction of the Godavari C3 plant δ13C end-member (scenario 1 and 2, respectively) revealed a differential effect of MAP on the estimated %C4 plants. For MAP above 1500 mm yr−1 when water was probably no limiting factor for C3 plants (Kohn, 2010), the estimated %C4 plants was ∼ 2 % lower without correction. But for MAP below 1500 mm yr−1, the estimated %C4 plants was 2 %–6 % higher without this correction for MAP, suggesting a potential overestimation of the %C4 plants. Notably, drought correction of the C3 plant δ13C end-member is increasingly important with decreasing MAP.
Comparing mixing-model results for Godavari-specific end-members with drought correction and global average end-members for C4 plants (−12.1 ‰) and C3 plants (−28.1 ‰; based on Kohn, 2010) (scenario 1 and 3, respectively) revealed that the estimated %C4 plants was 1 %–9 % lower for the latter, suggesting a potential, minor underestimation. The estimated %C4 plants was 5 %–9 % lower for the wetter north and east tributaries, while the difference was minor (≤ 5 % lower) for the other subbasins as well as for the whole, upper and lower basin. Notably, comparing Godavari-specific end-members with drought correction and commonly quoted global end-members for C4 (−12.1 ‰) and C3 plants (−27.1 ‰) (scenario 1 and 4, respectively) showed that the estimated %C4 plants was 7 %–15 % lower for the latter, suggesting a substantial underestimation when using these global end-members. This would result in a %C4 plants of only 36±3 % for the upper basin, where C4 grasses and crops are most abundant (Pradhan et al., 2014; Prasad et al., 2014; Riedel et al., 2015; Giosan et al., 2017) and only 21±3 % C4 plants in the C3-dominated lower basin. Finally, the underestimation of %C4 plants was even larger (11 %–14 %) for all (sub)basins when comparing the latter global end-members with Godavari-specific end-members without drought correction (scenario 4 and 2, respectively). Our results from the Godavari basin highlight how important it is to make informed choices about the plant end-members used for vegetation reconstructions, considering characteristics of the regional vegetation and environmental controls such as MAP in regions where moisture limiting conditions may prevail (on a seasonal scale).
Our analysis of contemporary C3 and C4 plants, soils, and sediments from the Godavari basin has resulted in three important considerations for the reconstruction of C3 / C4 vegetation distributions using bulk δ13C analysis. Firstly, our C3 and C4 plant δ13C data for the Godavari revealed the importance of making informed choices about the plant end-members used for vegetation reconstructions, considering the regional conditions including vegetation species, structure, land use and environmental controls. In particular in tropical to subtropical regions with generally high vegetation biomass and more negative δ13C C3 plant values, the use of end-members representing these negative C3 plant δ13C values would result in a higher estimation of %C4 plants when applied to areas with less precipitation (MAP < 2000 mm), such as the Godavari basin. Given that extensive datasets of the stable carbon isotopic values of commonly occurring plants in certain areas are not generally available, an alternative approach is to derive carbon stable isotope plant end-member values from data compilations of global vegetation, with consideration for the conditions prevailing in the area of interest. For the Godavari basin, using plant end-members based on the measurement of Godavari plants resulted in a ∼ 1 %–9 % higher estimated %C4 plants compared to using a compilation-based end-member value from Kohn (2010) that was considered representative of the vegetation in this region (Table 2). Correction for the Suess effect to account for fossil fuel burning over the last decades had a relatively minor impact (generally <2 %, depending on the plant end-member chosen) on the estimated %C4 plants (Table 2). The offset we observed for the Godavari basin can thus be attributed to the choice of plant end-members used in the mixing model.
Secondly, it is well-known that C3 plant δ13C values become less negative with decreasing amounts of precipitation, which may result in an underestimation of the %C4 plants. Incorporating a drought correction for the C3 plant end-member resulted in maximally 6 % lower %C4 plants for the different Godavari subbasins, but the extent of this effect will be most pronounced in C3-dominated ecosystems with low MAP. For the Godavari basin, we established that the impact of drought correction on the estimated %C4 plants differed depending on the amount of MAP (Table 2). The effect was relatively minor (∼ 2 % lower) for C3-dominated areas that received >1500 mm yr−1 and where water was no limiting factor but became positive (∼ 2 % higher) for areas with 1000–1500 mm yr−1 rainfall and even larger (4 %–6 %) for areas with a MAP of ∼ 500–1000 mm yr−1 and mixed C3 and C4 vegetation.
Table 2Summary of processes/factors influencing the C3 / C4 mixing-model estimates.
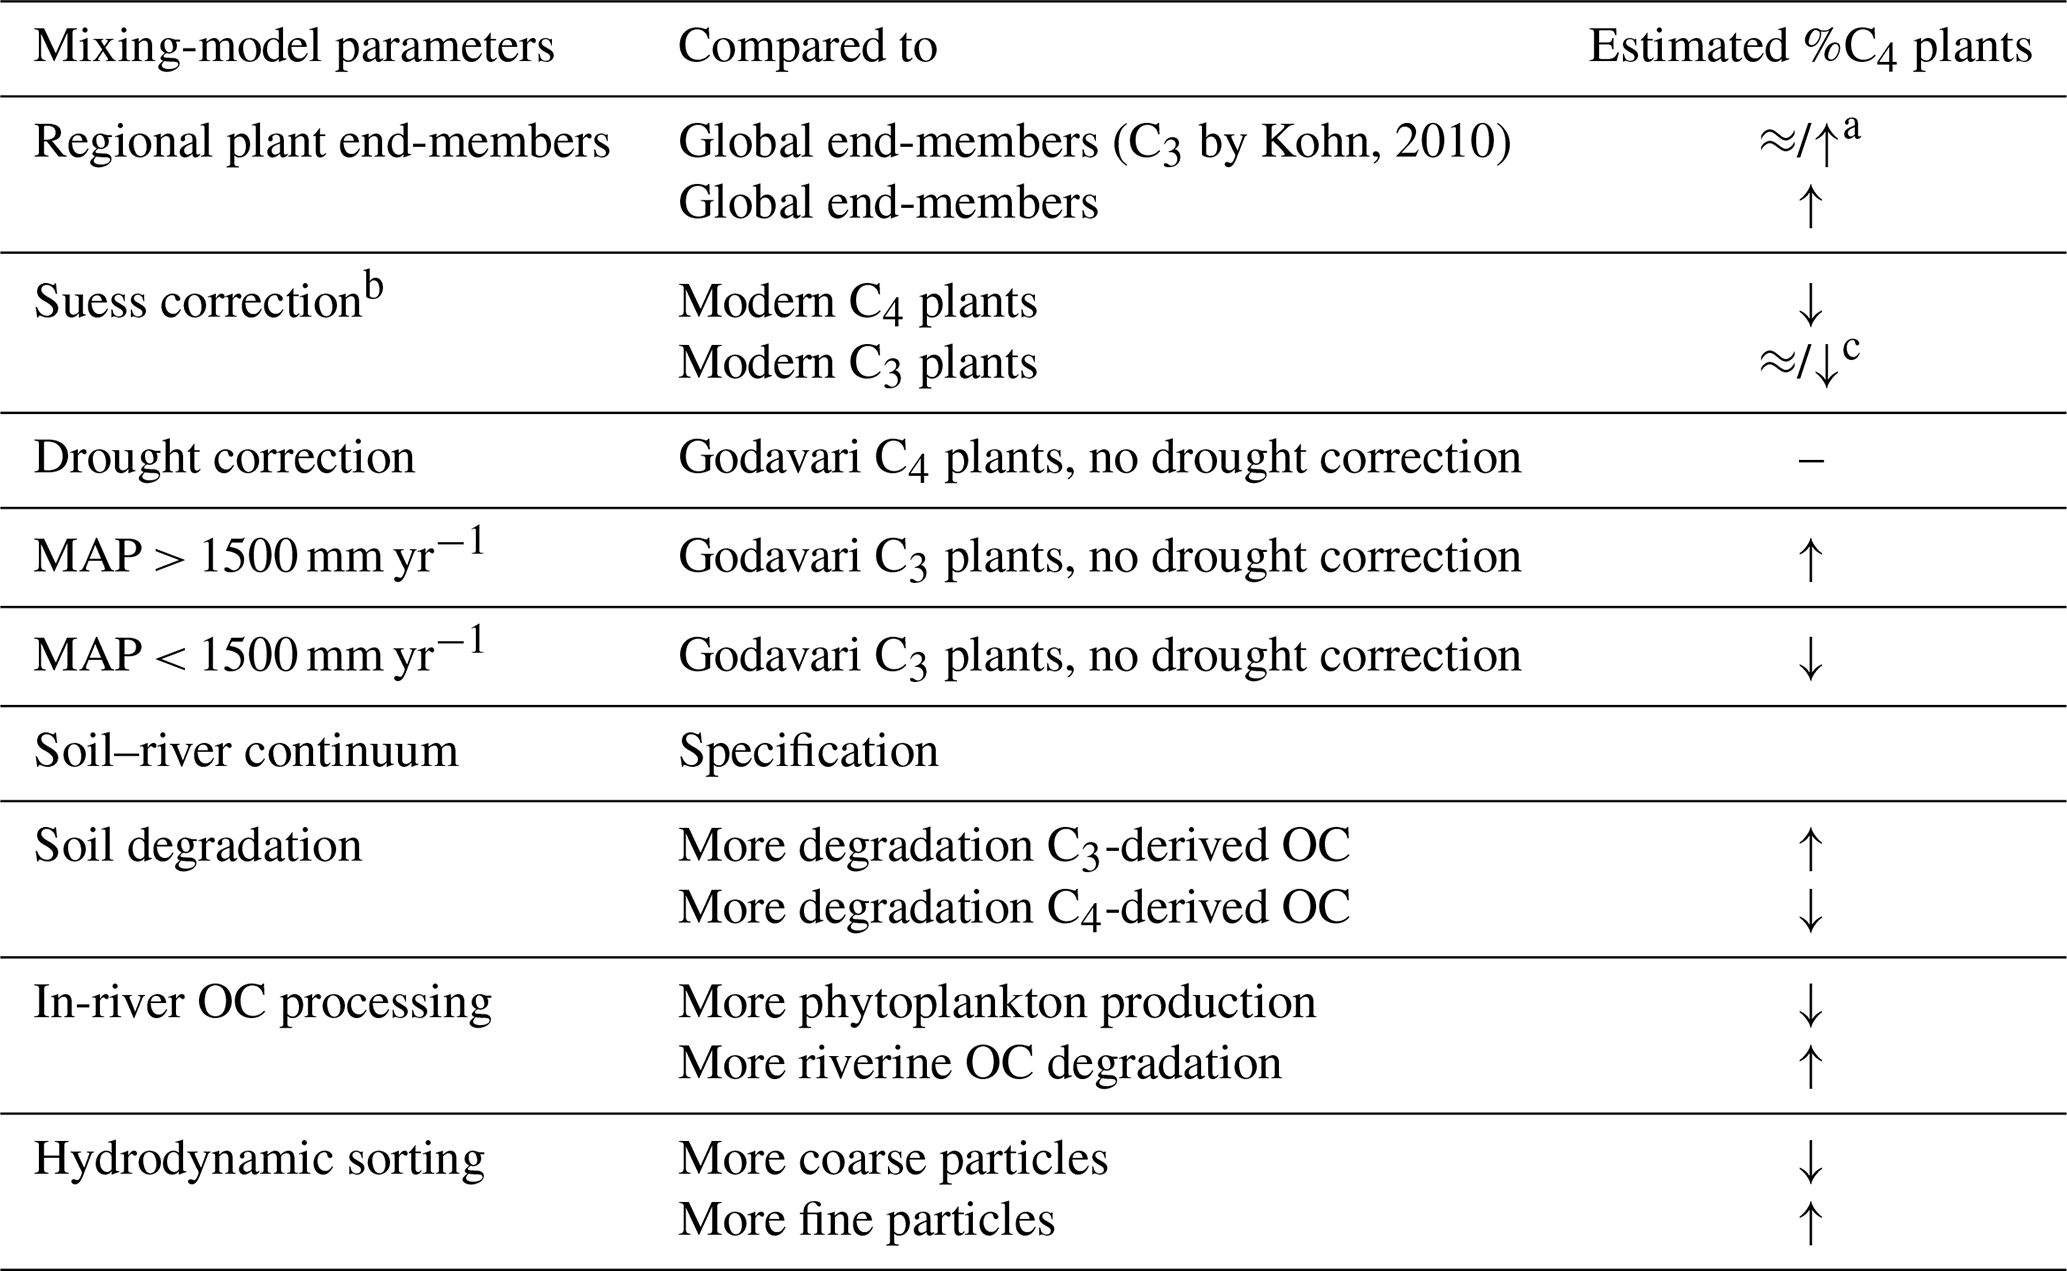
a With/without drought correction of the regional end-member. b Equivalent to the OC turnover in soils and sediments (i.e. 1985). c C3 plant (global) end-member of −27.1 ‰; Godavari-based or −28.1 ‰ (global) end-member.
Thirdly, C3 / C4 vegetation reconstructions based on the δ13Corg signal preserved in soils, riverine and/or marine sediments should take potential alterations in this signal along the plant–soil–river continuum into account. Differential degradation and stabilisation of C3- and C4-derived OC in soils and sediments as well as phytoplankton contributions in the river and hydrodynamic sorting effects that separate coarse and fine fractions and their associated OC may result in a complex interplay affecting the mixing-model estimates (Table 2). For the Godavari basin, our results suggest that the δ13C values of C3 and C4 plants are relatively well-maintained throughout the transport chain, so δ13Corg values of soils and riverbed sediments can be used as proxy for C3 / C4 vegetation distributions.
Finally, our results in the Godavari basin highlight that precipitation plays an impactful role in the reconstruction of vegetation by influencing plant δ13C end-members and OC decomposition rates and driving OC transport by rivers. Our results thereby support the assumption that in monsoon-influenced regions, wetter conditions/periods require no drought correction of the C3 plant end-member and generate more erosion and rapid transport downstream, which generally limits degradation during river transit. This implies that the δ13Corg signal exported to sedimentary deposits would reflect the C3 / C4 vegetation distribution in the basin.
Research data associated with this article are available in the open-access Pangaea data repository (Kirkels et al., 2022a; accessible via https://doi.org/10.1594/PANGAEA.940189). Background geochemical data on the Godavari basin and TN data (Kirkels et al., 2021; accessible via https://doi.org/10.1594/PANGAEA.937965) are also available in the Pangaea data repository.
The supplement related to this article is available online at: https://doi.org/10.5194/bg-19-4107-2022-supplement.
FMSAK, HJdB, SB and FP conceptualised this research. FMSAK, MOU and FP planned the fieldwork and carried it out with help from CRTM and SB. FMSAK, PCH, CRTM and MTJvdM performed laboratory analyses. FMSAK prepared the manuscript; HJdB and FP revised and edited the draft with contributions from the other co-authors.
The contact author has declared that none of the authors has any competing interests.
Publisher's note: Copernicus Publications remains neutral with regard to jurisdictional claims in published maps and institutional affiliations.
We thank Prasanta Sanyal for his guidance and help in planning the fieldwork in the Godavari basin. We thank Maarten Lupker (ETH Zurich) and Huub Zwart (UU) for their assistance in the field. We are grateful to Coen Mulder, Dominika Kasjaniuk, Anita van Leeuwen-Tolboom, Dineke van den Meent-Olieman and Klaas Nierop for technical and analytical support. We thank Jan-Frits Veldkamp (Naturalis Biodiversity Centre, National Herbarium of the Netherlands, Leiden) as an expert on Southeast Asian botany for his help with taxonomical classification of the Indian peninsular plants. We are grateful to Sarah Feakins and an anonymous reviewer for their helpful comments, which greatly improved our manuscript.
This research has been supported by the Nederlandse Organisatie voor Wetenschappelijk Onderzoek (Veni grant no. 863.13.016 to Francien Peterse).
This paper was edited by Steven Bouillon and reviewed by Sarah Feakins and one anonymous referee.
Acharyya, T., Sarma, V., Sridevi, B., Venkataramana, V., Bharathi, M. D., Naidu, S. A., Kumar, B., Prasad, V. R., Bandyopadhyay, D., and Reddy, N.: Reduced river discharge intensifies phytoplankton bloom in Godavari estuary, India, Mar. Chem., 132, 15–22, 2012.
Agrawal, S., Sanyal, P., Sarkar, A., Jaiswal, M. K., and Dutta, K.: Variability of Indian monsoonal rainfall over the past 100 ka and its implication for C3–C4 vegetational change, Quaternary Res., 77, 159–170, 2012.
Asouti, E. and Fuller, D. Q.: Trees and woodlands of South India: archaeological perspectives, Left Coast Press, Inc., Walnut Creek, Ca., USA, ISBN 978-1-59874-231-2, 2008.
Aucour, A., France-Lanord, C., Pedoja, K., Pierson-Wickmann, A., and Sheppard, S. M.: Fluxes and sources of particulate organic carbon in the Ganga-Brahmaputra river system, Global Biogeochem. Cy., 20, 1–12, 2006.
Babar, M. and Kaplay, R. D.: Godavari River: geomorphology and socio-economic characteristics, in: The Indian Rivers, edited by: Singh, D. S., Springer, Singapore, 319–337, https://doi.org/10.1007/978-981-10-2984-4_26, 2018.
Balakrishna, K. and Probst, J.: Organic carbon transport and ratio variations in a large tropical river: Godavari as a case study, India, Biogeochemistry, 73, 457–473, 2005.
Banerji, U. S., Arulbalaji, P., and Padmalal, D.: Holocene climate variability and Indian Summer Monsoon: an overview, Holocene, 30, 744–773, 2020.
Basu, S., Agrawal, S., Sanyal, P., Mahato, P., Kumar, S., and Sarkar, A.: Carbon isotopic ratios of modern C3–C4 plants from the Gangetic Plain, India and its implications to paleovegetational reconstruction, Palaeogeogr. Palaeocl., 440, 22–32, 2015.
Basu, S., Sanyal, P., Sahoo, K., Chauhan, N., Sarkar, A., and Juyal, N.: Variation in monsoonal rainfall sources (Arabian Sea and Bay of Bengal) during the late Quaternary: Implications for regional vegetation and fluvial systems, Palaeogeogr. Palaeocl., 491, 77–91, 2018.
Basu, S., Sanyal, P., Pillai, A. A., and Ambili, A.: Response of grassland ecosystem to monsoonal precipitation variability during the Mid-Late Holocene: Inferences based on molecular isotopic records from Banni grassland, western India, PloS one, 14, e0212743, https://doi.org/10.1371/journal.pone.0212743, 2019a.
Basu, S., Ghosh, S., and Sanyal, P.: Spatial heterogeneity in the relationship between precipitation and carbon isotopic discrimination in C3 plants: inferences from a global compilation, Global Planet. Change, 176, 123–131, 2019b.
Basu, S., Ghosh, S., and Chattopadhyay, D.: Disentangling the abiotic versus biotic controls on C3 plant leaf carbon isotopes: inferences from a global review, Earth-Sci. Rev., 222, 103839, https://doi.org/10.1016/j.earscirev.2021.103839, 2021.
Battin, T. J., Luyssaert, S., Kaplan, L. A., Aufdenkampe, A. K., Richter, A., and Tranvik, L. J.: The boundless carbon cycle, Nat. Geosci., 2, 598–600, 2009.
Bender, M. M.: Variations in the 13C/12C ratios of plants in relation to the pathway of photosynthetic carbon dioxide fixation, Phytochemistry, 10, 1239–1244, 1971.
Bianchi, T. S., Mitra, S., and McKee, B. A.: Sources of terrestrially-derived organic carbon in lower Mississippi River and Louisiana shelf sediments: implications for differential sedimentation and transport at the coastal margin, Mar. Chem., 77, 211–223, 2002.
Bianchi, T. S., Cui, X., Blair, N. E., Burdige, D. J., Eglinton, T. I., and Galy, V.: Centers of organic carbon burial and oxidation at the land-ocean interface, Org. Geochem., 115, 138–155, 2018.
Biksham, G. and Subramanian, V.: Nature of solute transport in the Godavari basin, India, J. Hydrol., 103, 375–392, 1988a.
Biksham, G. and Subramanian, V.: Sediment transport of the Godavari River basin and its controlling factors, J. Hydrol., 101, 275–290, 1988b.
Bird, M. I. and Pousai, P.: Variations of δ13C in the surface soil organic carbon pool, Global Biogeochem. Cy., 11, 313–322, 1997.
Bird, M. I., Chivas, A. R., and Head, J.: A latitudinal gradient in carbon turnover times in forest soils, Nature, 381, 143–146, 1996.
Birge, H. E., Conant, R. T., Follett, R. F., Haddix, M. L., Morris, S. J., Snapp, S. S., Wallenstein, M. D., and Paul, E. A.: Soil respiration is not limited by reductions in microbial biomass during long-term soil incubations, Soil Biol. Biochem., 81, 304–310, 2015.
Bouchez, J., Galy, V., Hilton, R. G., Gaillardet, J., Moreira-Turcq, P., Pérez, M. A., France-Lanord, C., and Maurice, L.: Source, transport and fluxes of Amazon River particulate organic carbon: Insights from river sediment depth-profiles, Geochim. Cosmochim. Ac., 133, 280–298, 2014.
Buchmann, N., Brooks, J. R., Rapp, K. D., and Ehleringer, J. R.: Carbon isotope composition of C4 grasses is influenced by light and water supply, Plant Cell Environ., 19, 392–402, 1996.
Carvalhais, N., Forkel, M., Khomik, M., Bellarby, J., Jung, M., Migliavacca, M., Saatchi, S., Santoro, M., Thurner, M., and Weber, U.: Global covariation of carbon turnover times with climate in terrestrial ecosystems, Nature, 514, 213–217, 2014.
Cerling, T. E., Harris, J. M., MacFadden, B. J., Leakey, M. G., Quade, J., Eisenmann, V., and Ehleringer, J. R.: Global vegetation change through the Miocene/Pliocene boundary, Nature, 389, 153–158, 1997.
Cerling, T. E., Wynn, J. G., Andanje, S. A., Bird, M. I., Korir, D. K., Levin, N. E., Mace, W., Macharia, A. N., Quade, J., and Remien, C. H.: Woody cover and hominin environments in the past 6 million years, Nature, 476, 51–56, 2011.
Contreras-Rosales, L. A., Jennerjahn, T., Tharammal, T., Meyer, V., Lückge, A., Paul, A., and Schefuß, E.: Evolution of the Indian Summer Monsoon and terrestrial vegetation in the Bengal region during the past 18 ka, Quaternary Sci. Rev., 102, 133–148, 2014.
Cui, M., Wang, Z., Nageswara Rao, K., Sangode, S. J., Saito, Y., Chen, T., Kulkarni, Y. R., Naga Kumar, K. C. V., and Demudu, G.: A mid- to late-Holocene record of vegetation decline and erosion triggered by monsoon weakening and human adaptations in the south-east Indian Peninsula, Holocene, 27, 1976–1987, 2017.
CWC (Central Water Commission): Government of India, Ministry of Water Resources, Godavari basin, 1–187, http://cwc.gov.in/sites/default/files/godavaribasin-volume-i.pdf (last access: 31 August 2022), 2014.
Dawson, T. E., Mambelli, S., Plamboeck, A. H., Templer, P. H., and Tu, K. P.: Stable isotopes in plant ecology, Annu. Rev. Ecol. Syst., 33, 507–559, 2002.
Dehairs, F., Rao, R. G., Mohan, P. C., Raman, A. V., Marguillier, S., and Hellings, L.: Tracing mangrove carbon in suspended matter and aquatic fauna of the Gautami–Godavari Delta, Bay of Bengal (India), Hydrobiologia, 431, 225–241, 2000.
Diefendorf, A. F., Mueller, K. E., Wing, S. L., Koch, P. L., and Freeman, K. H.: Global patterns in leaf 13C discrimination and implications for studies of past and future climate, P. Natl. Acad. Sci. USA, 107, 5738–5743, 2010.
Dunlea, A. G., Giosan, L., and Huang, Y.: Pliocene expansion of C4 vegetation in the Core Monsoon Zone on the Indian Peninsula, Clim. Past, 16, 2533–2546, https://doi.org/10.5194/cp-16-2533-2020, 2020.
Dutt, S., Gupta, A. K., Cheng, H., Clemens, S. C., Singh, R. K., and Tewari, V. C.: Indian summer monsoon variability in northeastern India during the last two millennia, Quaternary Int., 571, 73–80, 2021.
Eglinton, T. I., Galy, V. V., Hemingway, J. D., Feng, X., Bao, H., Blattmann, T. M., Dickens, A. F., Gies, H., Giosan, L., and Haghipour, N.: Climate control on terrestrial biospheric carbon turnover, P. Natl. Acad. Sci. USA, 118, 1–9, 2021.
Elliott, S., Baker, P. J., and Borchert, R.: Leaf flushing during the dry season: the paradox of Asian monsoon forests, Global Ecol. Biogeogr., 15, 248–257, 2006.
Ellsworth, P. Z. and Cousins, A. B.: Carbon isotopes and water use efficiency in C4 plants, Curr. Opin. Plant Biol., 31, 155–161, 2016.
Farquhar, G. D.: On the nature of carbon isotope discrimination in C4 species, Aust. J. Plant Physiol., 10, 205–226, 1983.
Farquhar, G. D., Ehleringer, J. R., and Hubick, K. T.: Carbon isotope discrimination and photosynthesis, Annu. Rev. Plant Physiol., 40, 503–537, 1989.
Feakins, S. J., Liddy, H. M., Tauxe, L., Galy, V., Feng, X., Tierney, J. E., Miao, Y., and Warny, S.: Miocene C4 grassland expansion as recorded by the Indus Fan, Paleoceanogr. Paleocl., 35, e2020PA003856, https://doi.org/10.1029/2020PA003856, 2020.
Feng, X., Feakins, S. J., Liu, Z., Ponton, C., Wang, R. Z., Karkabi, E., Galy, V., Berelson, W. M., Nottingham, A. T., and Meir, P.: Source to sink: Evolution of lignin composition in the Madre de Dios River system with connection to the Amazon basin and offshore, J. Geophys. Res.-Biogeo., 121, 1316–1338, 2016.
France-Lanord, C. and Derry, L. A.: δ13C of organic carbon in the Bengal Fan: source evolution and transport of C3 and C4 plant carbon to marine sediments, Geochim. Cosmochim. Ac., 58, 4809–4814, 1994.
Freeman, K. H., Mueller, K. E., Diefendorf, A. F., Wing, S. L., and Koch, P. L.: Clarifying the influence of water availability and plant types on carbon isotope discrimination by C3 plants, P. Natl. Acad. Sci. USA, 108, E59–E60, 2011.
Galy, V., France-Lanord, C., Beyssac, O., Faure, P., Kudrass, H., and Palhol, F.: Efficient organic carbon burial in the Bengal fan sustained by the Himalayan erosional system, Nature, 450, 407–411, 2007.
Galy, V., François, L., France-Lanord, C., Faure, P., Kudrass, H., Palhol, F., and Singh, S. K.: C4 plants decline in the Himalayan basin since the Last Glacial Maximum, Quaternary Sci. Rev., 27, 1396–1409, 2008a.
Galy, V., France-Lanord, C., and Lartiges, B.: Loading and fate of particulate organic carbon from the Himalaya to the Ganga–Brahmaputra delta, Geochim. Cosmochim. Ac., 72, 1767–1787, 2008b.
Galy, V., Eglinton, T., France-Lanord, C., and Sylva, S.: The provenance of vegetation and environmental signatures encoded in vascular plant biomarkers carried by the Ganges–Brahmaputra rivers, Earth Planet. Sc. Lett., 304, 1–12, 2011.
Garcin, Y., Schefuß, E., Schwab, V. F., Garreta, V., Gleixner, G., Vincens, A., Todou, G., Séné, O., Onana, J., and Achoundong, G.: Reconstructing C3 and C4 vegetation cover using n−alkane carbon isotope ratios in recent lake sediments from Cameroon, Western Central Africa, Geochim. Cosmochim. Ac., 142, 482–500, 2014.
Gawade, L., Krishna, M. S., Sarma, V., Hemalatha, K., and Rao, Y. V.: Spatio-temporal variability in the sources of particulate organic carbon and nitrogen in a tropical Godavari estuary, Estuar. Coast. Shelf S., 215, 20–29, 2018.
Ghosh, S., Sanyal, P., and Kumar, R.: Evolution of C4 plants and controlling factors: Insight from n-alkane isotopic values of NW Indian Siwalik paleosols, Org. Geochem., 110, 110–121, 2017.
Giosan, L., Ponton, C., Usman, M., Blusztajn, J., Fuller, D. Q., Galy, V., Haghipour, N., Johnson, J. E., McIntyre, C., Wacker, L., and Eglinton, T. I.: Short communication: Massive erosion in monsoonal central India linked to late Holocene land cover degradation, Earth Surf. Dynam., 5, 781–789, https://doi.org/10.5194/esurf-5-781-2017, 2017.
Goñi, M. A., Ruttenberg, K. C., and Eglinton, T. I.: Sources and contribution of terrigenous organic carbon to surface sediments in the Gulf of Mexico, Nature, 389, 275–278, 1997.
Goñi, M. A., Ruttenberg, K. C., and Eglinton, T. I.: A reassessment of the sources and importance of land-derived organic matter in surface sediments from the Gulf of Mexico, Geochim. Cosmochim. Ac., 62, 3055–3075, 1998.
Graven, H., Allison, C. E., Etheridge, D. M., Hammer, S., Keeling, R. F., Levin, I., Meijer, H. A. J., Rubino, M., Tans, P. P., Trudinger, C. M., Vaughn, B. H., and White, J. W. C.: Compiled records of carbon isotopes in atmospheric CO2 for historical simulations in CMIP6, Geosci. Model Dev., 10, 4405–4417, https://doi.org/10.5194/gmd-10-4405-2017, 2017.
Gupta, L. P., Subramanian, V., and Ittekkot, V.: Biogeochemistry of particulate organic matter transported by the Godavari River, India, Biogeochemistry, 38, 103–128, 1997.
Harris, I., Jones, P. D., Osborn, T. J., and Lister, D. H.: Updated high-resolution grids of monthly climatic observations – the CRU TS3.10 Dataset, Int. J. Climatol., 34, 623–642, 2014.
Hein, C. J., Usman, M., Eglinton, T. I., Haghipour, N., and Galy, V. V.: Millennial-scale hydroclimate control of tropical soil carbon storage, Nature, 581, 63–66, 2020.
Hou, P., Yu, M., Zhao, M., Montluçon, D. B., Su, C., and Eglinton, T. I.: Terrestrial biomolecular burial efficiencies on continental margins, J. Geophys. Res.-Biogeo., 125, 1–15, 2020.
Ittekkot, V., Safiullah, S., Mycke, B., and Seifert, R.: Seasonal variability and geochemical significance of organic matter in the River Ganges, Bangladesh, Nature, 317, 800–802, 1985.
Keeling, C. D., Piper, S. C., Bacastow, R. B., Wahlen, M., Whorf, T. P., Heimann, M., and Meijer, H. A.: Exchanges of atmospheric CO2 and 13CO2 with the terrestrial biosphere and oceans from 1978 to 2000. I. Global aspects, UC San Diego, Scripps Institution of Oceanography, 01–06, 1–28, https://escholarship.org/uc/item/09v319r9 (last access: 31 August 2022), 2001.
Keeling, R. F., Graven, H. D., Welp, L. R., Resplandy, L., Bi, J., Piper, S. C., Sun, Y., Bollenbacher, A., and Meijer, H. A.: Atmospheric evidence for a global secular increase in carbon isotopic discrimination of land photosynthesis, P. Natl. Acad. Sci. USA, 114, 10361–10366, 2017.
Kirkels, F. M., Ponton, C., Galy, V., West, A. J., Feakins, S. J., and Peterse, F.: From Andes to Amazon: assessing branched tetraether lipids as tracers for soil organic carbon in the Madre de Dios River system, J. Geophys. Res.-Bio., 125, 1–18, 2020a.
Kirkels, F. M., Zwart, H. M., Basu, S., Usman, M. O., and Peterse, F.: Seasonal and spatial variability in δ18O and δD values in waters of the Godavari River basin: insights into hydrological processes, J. Hydrol. Reg. Stud., 30, 1–25, 2020b.
Kirkels, F. M. S. A., Zwart, H. M., Usman, M. O., and Peterse, F.: Branched glycerol monoalkyl glycerol tetraethers (brGMGTs) and geochemical proxies in soils, SPM and riverbed sediments in the Godavari River basin (India), PANGAEA [data set] https://doi.org/10.1594/PANGAEA.937965, 2021.
Kirkels, F. M. S. A., de Boer, H., Concha Hernández, P., Martes, C., van der Meer, M., Basu, S., Usman, M., Sanyal, P., and Peterse, F.: Carbon and nitrogen (isotopic) signatures in C3 and C4 plants, soils, SPM and riverbed sediments in the Godavari River basin (India) in 2015, PANGAEA [data set], https://doi.org/10.1594/PANGAEA.940189, 2022a.
Kirkels, F. M. S. A., Zwart, H. M., Usman, M. O., Hou, S., Ponton, C., Giosan, L., Eglinton, T. I., and Peterse, F.: From soil to sea: sources and transport of organic carbon traced by tetraether lipids in the monsoonal Godavari River, India, Biogeosciences, 19, 3979–4010, https://doi.org/10.5194/bg-19-3979-2022, 2022b.
Koch, P. L.: Isotopic reconstruction of past continental environments, Annu. Rev. Earth Pl. Sci., 26, 573–613, 1998.
Kögel-Knabner, I.: The macromolecular organic composition of plant and microbial residues as inputs to soil organic matter, Soil Biol. Biochem., 34, 139–162, 2002.
Kohn, M. J.: Carbon isotope compositions of terrestrial C3 plants as indicators of (paleo) ecology and (paleo) climate, P. Natl. Acad. Sci. USA, 107, 19691–19695, 2010.
Kohn, M. J.: Reply to Freeman et al.: Carbon isotope discrimination by C3 plants, P. Natl. Acad. Sci. USA, 108, E61, https://doi.org/10.1073/pnas.1103222108, 2011.
Komada, T., Anderson, M. R., and Dorfmeier, C. L.: Carbonate removal from coastal sediments for the determination of organic carbon and its isotopic signatures, δ13C and Δ14C: comparison of fumigation and direct acidification by hydrochloric acid, Limnol. Oceanogr.-Meth., 6, 254–262, 2008.
Krishna, M. S., Naidu, S. A., Subbaiah, C. V., Gawade, L., Sarma, V., and Reddy, N.: Sources, distribution and preservation of organic matter in a tropical estuary (Godavari, India), Estuar. Coast., 38, 1032–1047, 2015.
Krull, E. S., Skjemstad, J. O., Burrows, W. H., Bray, S. G., Wynn, J. G., Bol, R., Spouncer, L., and Harms, B.: Recent vegetation changes in central Queensland, Australia: evidence from δ13C and 14C analyses of soil organic matter, Geoderma, 126, 241–259, 2005.
Kushwaha, C. P. and Singh, K. P.: Diversity of leaf phenology in a tropical deciduous forest in India, J. Trop. Ecol., 21, 47–56, 2005.
Lamb, A. L., Wilson, G. P., and Leng, M. J.: A review of coastal palaeoclimate and relative sea-level reconstructions using δ13C and ratios in organic material, Earth-Sci. Rev., 75, 29–57, 2006.
Lee, H., Galy, V., Feng, X., Ponton, C., Galy, A., France-Lanord, C., and Feakins, S. J.: Sustained wood burial in the Bengal Fan over the last 19 My, P. Natl. Acad. Sci. USA, 116, 22518–22525, 2019.
Li, Z., Sun, Y., and Nie, X.: Biomarkers as a soil organic carbon tracer of sediment: Recent advances and challenges, Earth-Sci. Rev., 208, 1–13, 2020.
Liu, Y., Niu, H., and Xu, X.: Foliar δ13C response patterns along a moisture gradient arising from genetic variation and phenotypic plasticity in grassland species of Inner Mongolia, Ecol. Evol., 3, 262–267, 2013.
Liu, Y., Zhang, L., Niu, H., Sun, Y., and Xu, X.: Habitat-specific differences in plasticity of foliar δ13C in temperate steppe grasses, Ecol. Evol., 4, 648–655, 2014.
Luo, W., Wang, X., Auerswald, K., Wang, Z., Bird, M. I., Still, C. J., Lü, X., and Han, X.: Effects of plant intraspecific variation on the prediction of C3/C4 vegetation ratio from carbon isotope composition of topsoil organic matter across grasslands, J. Plant Ecol., 14, 628–637, 2021.
Lupker, M., France-Lanord, C., Lavé, J., Bouchez, J., Galy, V., Métivier, F., Gaillardet, J., Lartiges, B., and Mugnier, J.: A Rouse-based method to integrate the chemical composition of river sediments: application to the Ganga basin, J. Geophys. Res. Earth, 116, 1–24, 2011.
Ma, J., Sun, W., Liu, X., and Chen, F.: Variation in the stable carbon and nitrogen isotope composition of plants and soil along a precipitation gradient in northern China, PLoS One, 7, e51894, https://doi.org/10.1371/journal.pone.0051894, 2012.
Martin, A., Mariotti, A., Lavelle, P., and Vuattoux, R.: Estimate of organic matter turnover rate in a savanna soil by 13C natural abundance measurements, Soil Biol. Biochem., 22, 517–523, 1990.
Menges, J., Hovius, N., Andermann, C., Lupker, M., Haghipour, N., Märki, L., and Sachse, D.: Variations in organic carbon sourcing along a trans-Himalayan river determined by a Bayesian mixing approach, Geochim. Cosmochim. Ac., 286, 159–176, 2020.
Murphy, B. P. and Bowman, D. M.: The carbon and nitrogen isotope composition of Australian grasses in relation to climate, Funct. Ecol., 23, 1040–1049, 2009.
NOAA (National Oceanic and Atmospheric Administration): Earth System Research Laboratories – Global Monitoring Laboratory, https://gml.noaa.gov, last access: 21 June 2022.
Olson, D. M., Dinerstein, E., Wikramanayake, E. D., Burgess, N. D., Powell, G. V., Underwood, E. C., D'Amico, J. A., Itoua, I., Strand, H. E., and Morrison, J. C.: Terrestrial ecoregions of the world: a new map of life on earth: a new global map of terrestrial ecoregions provides an innovative tool for conserving biodiversity, BioSci., 51, 933–938, 2001.
Phillips, D. L. and Gregg, J. W.: Uncertainty in source partitioning using stable isotopes, Oecologia, 127, 171–179, 2001.
Ponton, C., Giosan, L., Eglinton, T. I., Fuller, D. Q., Johnson, J. E., Kumar, P., and Collett, T. S.: Holocene aridification of India, Geophys. Res. Lett., 39, L03704–L03709, 2012.
Pradhan, U. K., Wu, Y., Shirodkar, P. V., Zhang, J., and Zhang, G.: Multi-proxy evidence for compositional change of organic matter in the largest tropical (peninsular) river basin of India, J. Hydrol., 519, 999–1009, 2014.
Prasad, S., Anoop, A., Riedel, N., Sarkar, S., Menzel, P., Basavaiah, N., Krishnan, R., Fuller, D., Plessen, B., and Gaye, B.: Prolonged monsoon droughts and links to Indo-Pacific warm pool: a Holocene record from Lonar Lake, central India, Earth Planet. Sc. Lett., 391, 171–182, 2014.
Reddy, S. K. K., Gupta, H., Badimela, U., Reddy, D. V., Kurakalva, R. M., and Kumar, D.: Export of particulate organic carbon by the mountainous tropical rivers of Western Ghats, India: variations and controls, Sci. Total Environ., 751, 142115, https://doi.org/10.1016/j.scitotenv.2020.142115, 2021.
Repasch, M., Scheingross, J. S., Hovius, N., Vieth-Hillebrand, A., Mueller, C. W., Höschen, C., Szupiany, R. N., and Sachse, D.: River organic carbon fluxes modulated by hydrodynamic sorting of particulate organic matter, Geophys. Res. Lett., 49, e2021GL096343, https://doi.org/10.1029/2021GL096343, 2022.
Riedel, N., Stebich, M., Anoop, A., Basavaiah, N., Menzel, P., Prasad, S., Sachse, D., Sarkar, S., and Wiesner, M.: Modern pollen vegetation relationships in a dry deciduous monsoon forest: a case study from Lonar Crater Lake, central India, Quaternary Int., 371, 268–279, 2015.
Roy, B. and Sanyal, P.: Isotopic and molecular distribution of leaf-wax in plant-soil system of the Gangetic floodplain and its implication for paleorecords, Quaternary Int., 607, 89–99, 2022.
Roy, B., Ghosh, S., and Sanyal, P.: Morpho-tectonic control on the distribution of C3–C4 plants in the central Himalayan Siwaliks during Late Plio-Pleistocene, Earth Planet. Sc. Lett., 535, 116119, https://doi.org/10.1016/j.epsl.2020.116119, 2020.
Sage, R. F.: The evolution of C4 photosynthesis, New Phytol., 161, 341–370, 2004.
Sage, R. F. and Monson, R. K. (Eds.): C4 plant biology, Academic Press, San Diego, CA, USA, https://doi.org/10.1016/B978-0-12-614440-6.X5000-9, 1999.
Sankhla, N., Ziegler, H., Vyas, O. P., Stichler, W., and Trimborn, P.: Eco-physiological studies on Indian arid zone plants, Oecologia, 21, 123–129, 1975.
Sarangi, V., Agrawal, S., and Sanyal, P.: The disparity in the abundance of C4 plants estimated using the carbon isotopic composition of paleosol components, Palaeogeogr., Palaeocl., 561, 110068, https://doi.org/10.1016/j.palaeo.2020.110068, 2021.
Sarkar, S., Prasad, S., Wilkes, H., Riedel, N., Stebich, M., Basavaiah, N., and Sachse, D.: Monsoon source shifts during the drying mid-Holocene: Biomarker isotope based evidence from the core monsoon zone (CMZ) of India, Quarternary Sci. Rev., 123, 144–157, 2015.
Schmidt, H. and Gleixner, G.: Carbon isotope effects on key reactions in plant metabolism and 13C-patterns in natural compounds, in: Stable Isotopes and the Integration of Biological, Ecological and Geochemical Processes, edited by: Griffiths, H., Garland Science, London, 13–26, https://doi.org/10.1201/9781003076865, 1998.
Schulze, E., Ellis, R., Schulze, W., Trimborn, P., and Ziegler, H.: Diversity, metabolic types and δ13C carbon isotope ratios in the grass flora of Namibia in relation to growth form, precipitation and habitat conditions, Oecologia, 106, 352–369, 1996.
Simpson, A. J., Simpson, M. J., Smith, E., and Kelleher, B. P.: Microbially derived inputs to soil organic matter: are current estimates too low?, Environ. Sci. Technol., 41, 8070–8076, 2007.
Sinha, A., Berkelhammer, M., Stott, L., Mudelsee, M., Cheng, H., and Biswas, J.: The leading mode of Indian Summer Monsoon precipitation variability during the last millennium, Geophys. Res. Lett., 38, https://doi.org/10.1029/2011GL047713, 2011.
Sinha, A., Kathayat, G., Cheng, H., Breitenbach, S. F., Berkelhammer, M., Mudelsee, M., Biswas, J., and Edwards, R. L.: Trends and oscillations in the Indian summer monsoon rainfall over the last two millennia, Nat. Commun., 6, 1–8, 2015.
Sreemany, A. and Bera, M. K.: Does a large delta-fan sedimentary archive faithfully record floodplain vegetation composition?, Quaternary Sci. Rev., 228, 106108, https://doi.org/10.1016/j.quascirev.2019.106108, 2020.
Stewart, G. R., Turnbull, M. H., Schmidt, S., and Erskine, P. D.: 13C natural abundance in plant communities along a rainfall gradient: a biological integrator of water availability, Aust. J. Plant Physiol., 22, 51–55, 1995.
Still, C. J., Berry, J. A., Collatz, G. J., and DeFries, R. S.: Global distribution of C3 and C4 vegetation: carbon cycle implications, Global Biogeochem. Cy., 17, 6–14, 2003.
Swap, R. J., Aranibar, J. N., Dowty, P. R., Gilhooly III, W. P., and Macko, S. A.: Natural abundance of 13C and 15N in C3 and C4 vegetation of southern Africa: patterns and implications, Glob. Change Biol., 10, 350–358, 2004.
Torres, I. C., Inglett, P. W., Brenner, M., Kenney, W. F., and Reddy, K. R.: Stable isotope (δ13C and δ15N) values of sediment organic matter in subtropical lakes of different trophic status, J. Paleolimnol., 47, 693–706, 2012.
Turner, A. G. and Annamalai, H.: Climate change and the South Asian summer monsoon, Nat. Clim. Change, 2, 587–595, 2012.
Usman, M. O., Kirkels, F. M. S. A., Zwart, H. M., Basu, S., Ponton, C., Blattmann, T. M., Ploetze, M., Haghipour, N., McIntyre, C., Peterse, F., Lupker, M., Giosan, L., and Eglinton, T. I.: Reconciling drainage and receiving basin signatures of the Godavari River system, Biogeosciences, 15, 3357–3375, https://doi.org/10.5194/bg-15-3357-2018, 2018.
van der Merwe, N. J. and Medina, E.: The canopy effect, carbon isotope ratios and foodwebs in Amazonia, J. Archaeol. Sci., 18, 249–259, 1991.
van der Voort, T. S., Hagedorn, F., McIntyre, C., Zell, C., Walthert, L., Schleppi, P., Feng, X., and Eglinton, T. I.: Variability in 14C contents of soil organic matter at the plot and regional scale across climatic and geologic gradients, Biogeosciences, 13, 3427–3439, https://doi.org/10.5194/bg-13-3427-2016, 2016.
van Helmond, N. A., Krupinski, N. B. Q., Lougheed, B. C., Obrochta, S. P., Andrén, T., and Slomp, C. P.: Seasonal hypoxia was a natural feature of the coastal zone in the Little Belt, Denmark, during the past 8 ka, Mar. Geol., 387, 45–57, 2017.
Vonk, J. E., van Dongen, B. E., and Gustafsson, Ö: Lipid biomarker investigation of the origin and diagenetic state of sub-arctic terrestrial organic matter presently exported into the northern Bothnian Bay, Mar. Chem., 112, 1–10, 2008.
Vonk, J. E., Sánchez-García, L., Semiletov, I., Dudarev, O., Eglinton, T., Andersson, A., and Gustafsson, Ö.: Molecular and radiocarbon constraints on sources and degradation of terrestrial organic carbon along the Kolyma paleoriver transect, East Siberian Sea, Biogeosciences, 7, 3153–3166, https://doi.org/10.5194/bg-7-3153-2010, 2010.
Ward, N. D., Bianchi, T. S., Medeiros, P. M., Seidel, M., Richey, J. E., Keil, R. G., and Sawakuchi, H. O.: Where carbon goes when water flows: carbon cycling across the aquatic continuum, Front. Mar. Sci., 4, 1–27, 2017.
Water Resources Information System, Government of India, Ministry of Water Resources: Rainfall data in the Godavari basin, https://indiawris.gov.in/, last access: 1 February 2021.
Wiesmeier, M., Urbanski, L., Hobley, E., Lang, B., von Lützow, M., Marin-Spiotta, E., van Wesemael, B., Rabot, E., Ließ, M., and Garcia-Franco, N.: Soil organic carbon storage as a key function of soils – A review of drivers and indicators at various scales, Geoderma, 333, 149–162, 2019.
Wynn, J. G.: Carbon isotope fractionation during decomposition of organic matter in soils and paleosols: implications for paleoecological interpretations of paleosols, Palaeogeogr. Palaeocl., 251, 437–448, 2007.
Wynn, J. G. and Bird, M. I.: C4-derived soil organic carbon decomposes faster than its C3 counterpart in mixed C3/C4 soils, Glob. Change Biol., 13, 2206–2217, 2007.
Wynn, J. G. and Bird, M. I.: Environmental controls on the stable carbon isotopic composition of soil organic carbon: implications for modelling the distribution of C3 and C4 plants, Australia, Tellus B, 60, 604–621, 2008.
Yatagai, A., Kamiguchi, K., Arakawa, O., Hamada, A., Yasutomi, N., and Kitoh, A.: APHRODITE: Constructing a long-term daily gridded precipitation dataset for Asia based on a dense network of rain gauges, B. Am. Meteorol. Soc., 93, 1401–1415, 2012.
Yoneyama, T., Okada, H., and Ando, S.: Seasonal variations in natural 13C abundances in C3 and C4 plants collected in Thailand and the Philippines, Soil Sci. Plant Nutr., 56, 422–426, 2010.
Ziegler, H., Batanouny, K. H., Sankhla, N., Vyas, O. P., and Stichler, W.: The photosynthetic pathway types of some desert plants from India, Saudi Arabia, Egypt, and Iraq, Oecologia, 48, 93–99, 1981.
Zorzi, C., Goni, M. F. S., Anupama, K., Prasad, S., Hanquiez, V., Johnson, J., and Giosan, L.: Indian monsoon variations during three contrasting climatic periods: the Holocene, Heinrich Stadial 2 and the last interglacial–glacial transition, Quaternary Sci. Rev., 125, 50–60, 2015.