the Creative Commons Attribution 4.0 License.
the Creative Commons Attribution 4.0 License.
 | 09 Sep 2022
Diazotrophy as a key driver of the response of marine net primary productivity to climate change
Olivier Aumont
Lester Kwiatkowski
Corentin Clerc
Léonard Dupont
Christian Ethé
Thomas Gorgues
Roland Séférian
Alessandro Tagliabue
The impact of anthropogenic climate change on marine net primary production (NPP) is a reason for concern because changing NPP will have widespread consequences for marine ecosystems and their associated services. Projections by the current generation of Earth system models have suggested decreases in global NPP in response to future climate change, albeit with very large uncertainties. Here, we make use of two versions of the Institut Pierre-Simon Laplace Climate Model (IPSL-CM) that simulate divergent NPP responses to similar high-emission scenarios in the 21st century and identify nitrogen fixation as the main driver of these divergent NPP responses. Differences in the way N fixation is parameterised in the marine biogeochemical component PISCES (Pelagic Interactions Scheme for Carbon and Ecosystem Studies) of the IPSL-CM versions lead to N-fixation rates that are either stable or double over the course of the 21st century, resulting in decreasing or increasing global NPP, respectively. An evaluation of these two model versions does not help constrain future NPP projection uncertainties. However, the use of a more comprehensive version of PISCES, with variable nitrogen-to-phosphorus ratios as well as a revised parameterisation of the temperature sensitivity of N fixation, suggests only moderate changes in globally averaged N fixation in the 21st century. This leads to decreasing global NPP, in line with the model-mean changes of a recent multi-model intercomparison. Lastly, despite contrasting trends in NPP, all our model versions simulate similar and significant reductions in planktonic biomass. This suggests that projected plankton biomass may be a more robust indicator than NPP of the potential impact of anthropogenic climate change on marine ecosystems across models.
- Article
(10091 KB) - Full-text XML
- BibTeX
- EndNote


Net primary production (NPP) by marine phytoplankton is responsible for nearly 50 % of global carbon fixation (Field et al., 1998) and is the basis of almost all marine food chains, controlling the availability of energy and food for upper trophic levels. As such, marine NPP sustains most oceanic fisheries (Pauly and Christensen, 1995; Stock et al., 2017) and is considered to be one of the most important ecosystem services that the ocean provides (IPCC, 2014; Bindoff et al., 2019).
Impacts of anthropogenic climate change on marine NPP are particularly alarming as changing NPP could have widespread consequences for marine ecosystems and the services they provide. For instance, NPP drives the vitality of marine ecosystems, biogeochemical cycling and the biological carbon pump. Several modelling studies have used Earth system models (ESMs) to project the evolution of marine NPP over the 21st century under different global warming scenarios (Bopp et al., 2001; Steinacher et al., 2010; Bopp et al., 2013; Cabré et al., 2015; Laufkötter et al., 2015; Kwiatkowski et al., 2020; Tagliabue et al., 2021). Many of these studies have suggested decreases in global NPP in response to future climate change. For the high-emission scenario Representative Concentration Pathway (RCP) 8.5, estimates of changes in global NPP based on 10 ESMs used in the Coupled Model Intercomparison Project 5 (CMIP5) range from −2 % to −16 % in 2090–2099 as compared to 1990–1999 (Bopp et al., 2013). In the recent Coupled Model Intercomparison Project 6 (CMIP6), ESMs also project on average a decrease in global mean NPP under the high-emission scenario Shared Socioeconomic Pathway (SSP) 5-8.5, albeit with much larger uncertainties than in CMIP5 (Kwiatkowski et al., 2020; Tagliabue et al., 2021).
Multi-model climate change projections have been widely used to assess the potential impact of future climate change on marine biomass across trophic levels (Kwiatkowski et al., 2019; Lotze et al., 2019), fishery catch potential (Cheung et al., 2010) and global revenues (Lam et al., 2016), and planktonic diversity (Ibarbalz et al., 2019; Benedetti et al., 2021). Using six global ecosystem models and climate projections from two CMIP5 Earth system models, Lotze et al. (2019) have shown for instance that the mean global animal biomass in the ocean, largely driven by the decreasing trend in marine NPP, would decrease by 17 % under high emissions by 2100, corresponding to an average 5 % decrease for every 1 ∘C of warming.
Despite being used extensively, including in international assessment reports such as the Special Report on the Ocean and Cryosphere in a Changing Climate (IPCC SROCC; IPCC, 2019) and the Global Assessment Report on Biodiversity and Ecosystem Services (IPBES; IPBES, 2019), these projections of future marine NPP are subject to large uncertainties, as demonstrated by inter-model differences (Frölicher et al., 2016). This is especially the case at the regional level, as shown in the Arctic Ocean (Vancoppenolle et al., 2013), in the Southern Ocean (Leung et al., 2015) and in the tropical oceans (Kwiatkowski et al., 2017; Tagliabue et al., 2020, 2021). It is also the case for the global trend, with some models of the CMIP6 ensemble (IPSL-CM6A-LR, CNRM-ESM2-1, CESM2 and CESM2-WACCM) and others not included in the CMIP ensembles (UVic model in Taucher and Oschlies, 2011; PlankTOM5.3 model in Laufkötter et al., 2015) simulating increasing global NPP in response to anthropogenic climate change. Even within a specific model, poorly constrained assumptions around key biological components can drive substantial uncertainty in the projected changes in NPP across the tropical Pacific (Tagliabue et al., 2020).
The differences between models in projecting future NPP result from numerous factors and are underpinned by the delicate balance between the processes causing NPP decreases (e.g. stratification-driven declines in nutrient supply and temperature-driven increases in zooplankton grazing) and NPP increases (e.g. stratification-driven declines in light limitation, transport of excess nutrients and temperature-driven increases in phytoplankton growth rates) (Doney, 2006; Laufkötter et al., 2015). The effects of other key processes, such as the potential contribution of nitrogen fixation (Riche and Christian, 2018; Wrightson and Tagliabue, 2020), changing nutrient limitation regimes (Tagliabue et al., 2020) or the impact of ocean acidification on phytoplankton growth (Dutkiewicz et al., 2015), are even more uncertain and are typically only implicitly parameterised or ignored in current-generation ESMs.
Here, we make use of the newly developed version 6 of the Institut Pierre-Simon Laplace Climate Model (IPSL-CM6A-LR; Boucher et al., 2020), used in the framework of the Coupled Model Intercomparison Project Phase 6 (CMIP6; Eyring et al., 2016) and compare its projected NPP response to the previous version of the same climate model (IPSL-CM5A-LR; Dufresne et al., 2013) used in CMIP5. These two model versions differ in many ways (spatial resolution in the ocean and atmosphere, improved versions of multiple model components), but both use the Pelagic Interactions Scheme for Carbon and Ecosystem Studies (PISCES) model as their marine biogeochemical component. Note that whereas IPSL-CM5A-LR uses PISCES-v1 (Aumont and Bopp, 2006), the more recent version 2 (PISCES-v2; Aumont et al., 2015) is used in IPSL-CM6A-LR.
Whereas both models produce a near-identical trend in global sea surface temperature (SST) for comparable high-emission scenarios (RCP8.5 and SSP5-8.5) over the 21st century (Fig. 1a, Table 1), a first comparison of NPP projections shows a striking difference, with NPP decreasing by 9.1 % in IPSL-CM5A-LR in 2080–2099 relative to 1986–2005, whereas it increases by 6.8 % in IPSL-CM6A-LR (Fig. 1b, Table 1). The aim of this study is to explore and explain this striking global-scale divergence. As shown in Fig. 1, we identify the response of biological N fixation to anthropogenic climate change as one of the main differences between these two ESM versions, with N fixation slightly decreasing in IPSL-CM5A-LR and increasing significantly in IPSL-CM6A-LR over the 21st century (−9 % and +75 % from 1986–2005 to 2080–2099, respectively, Fig. 1, Table 1).
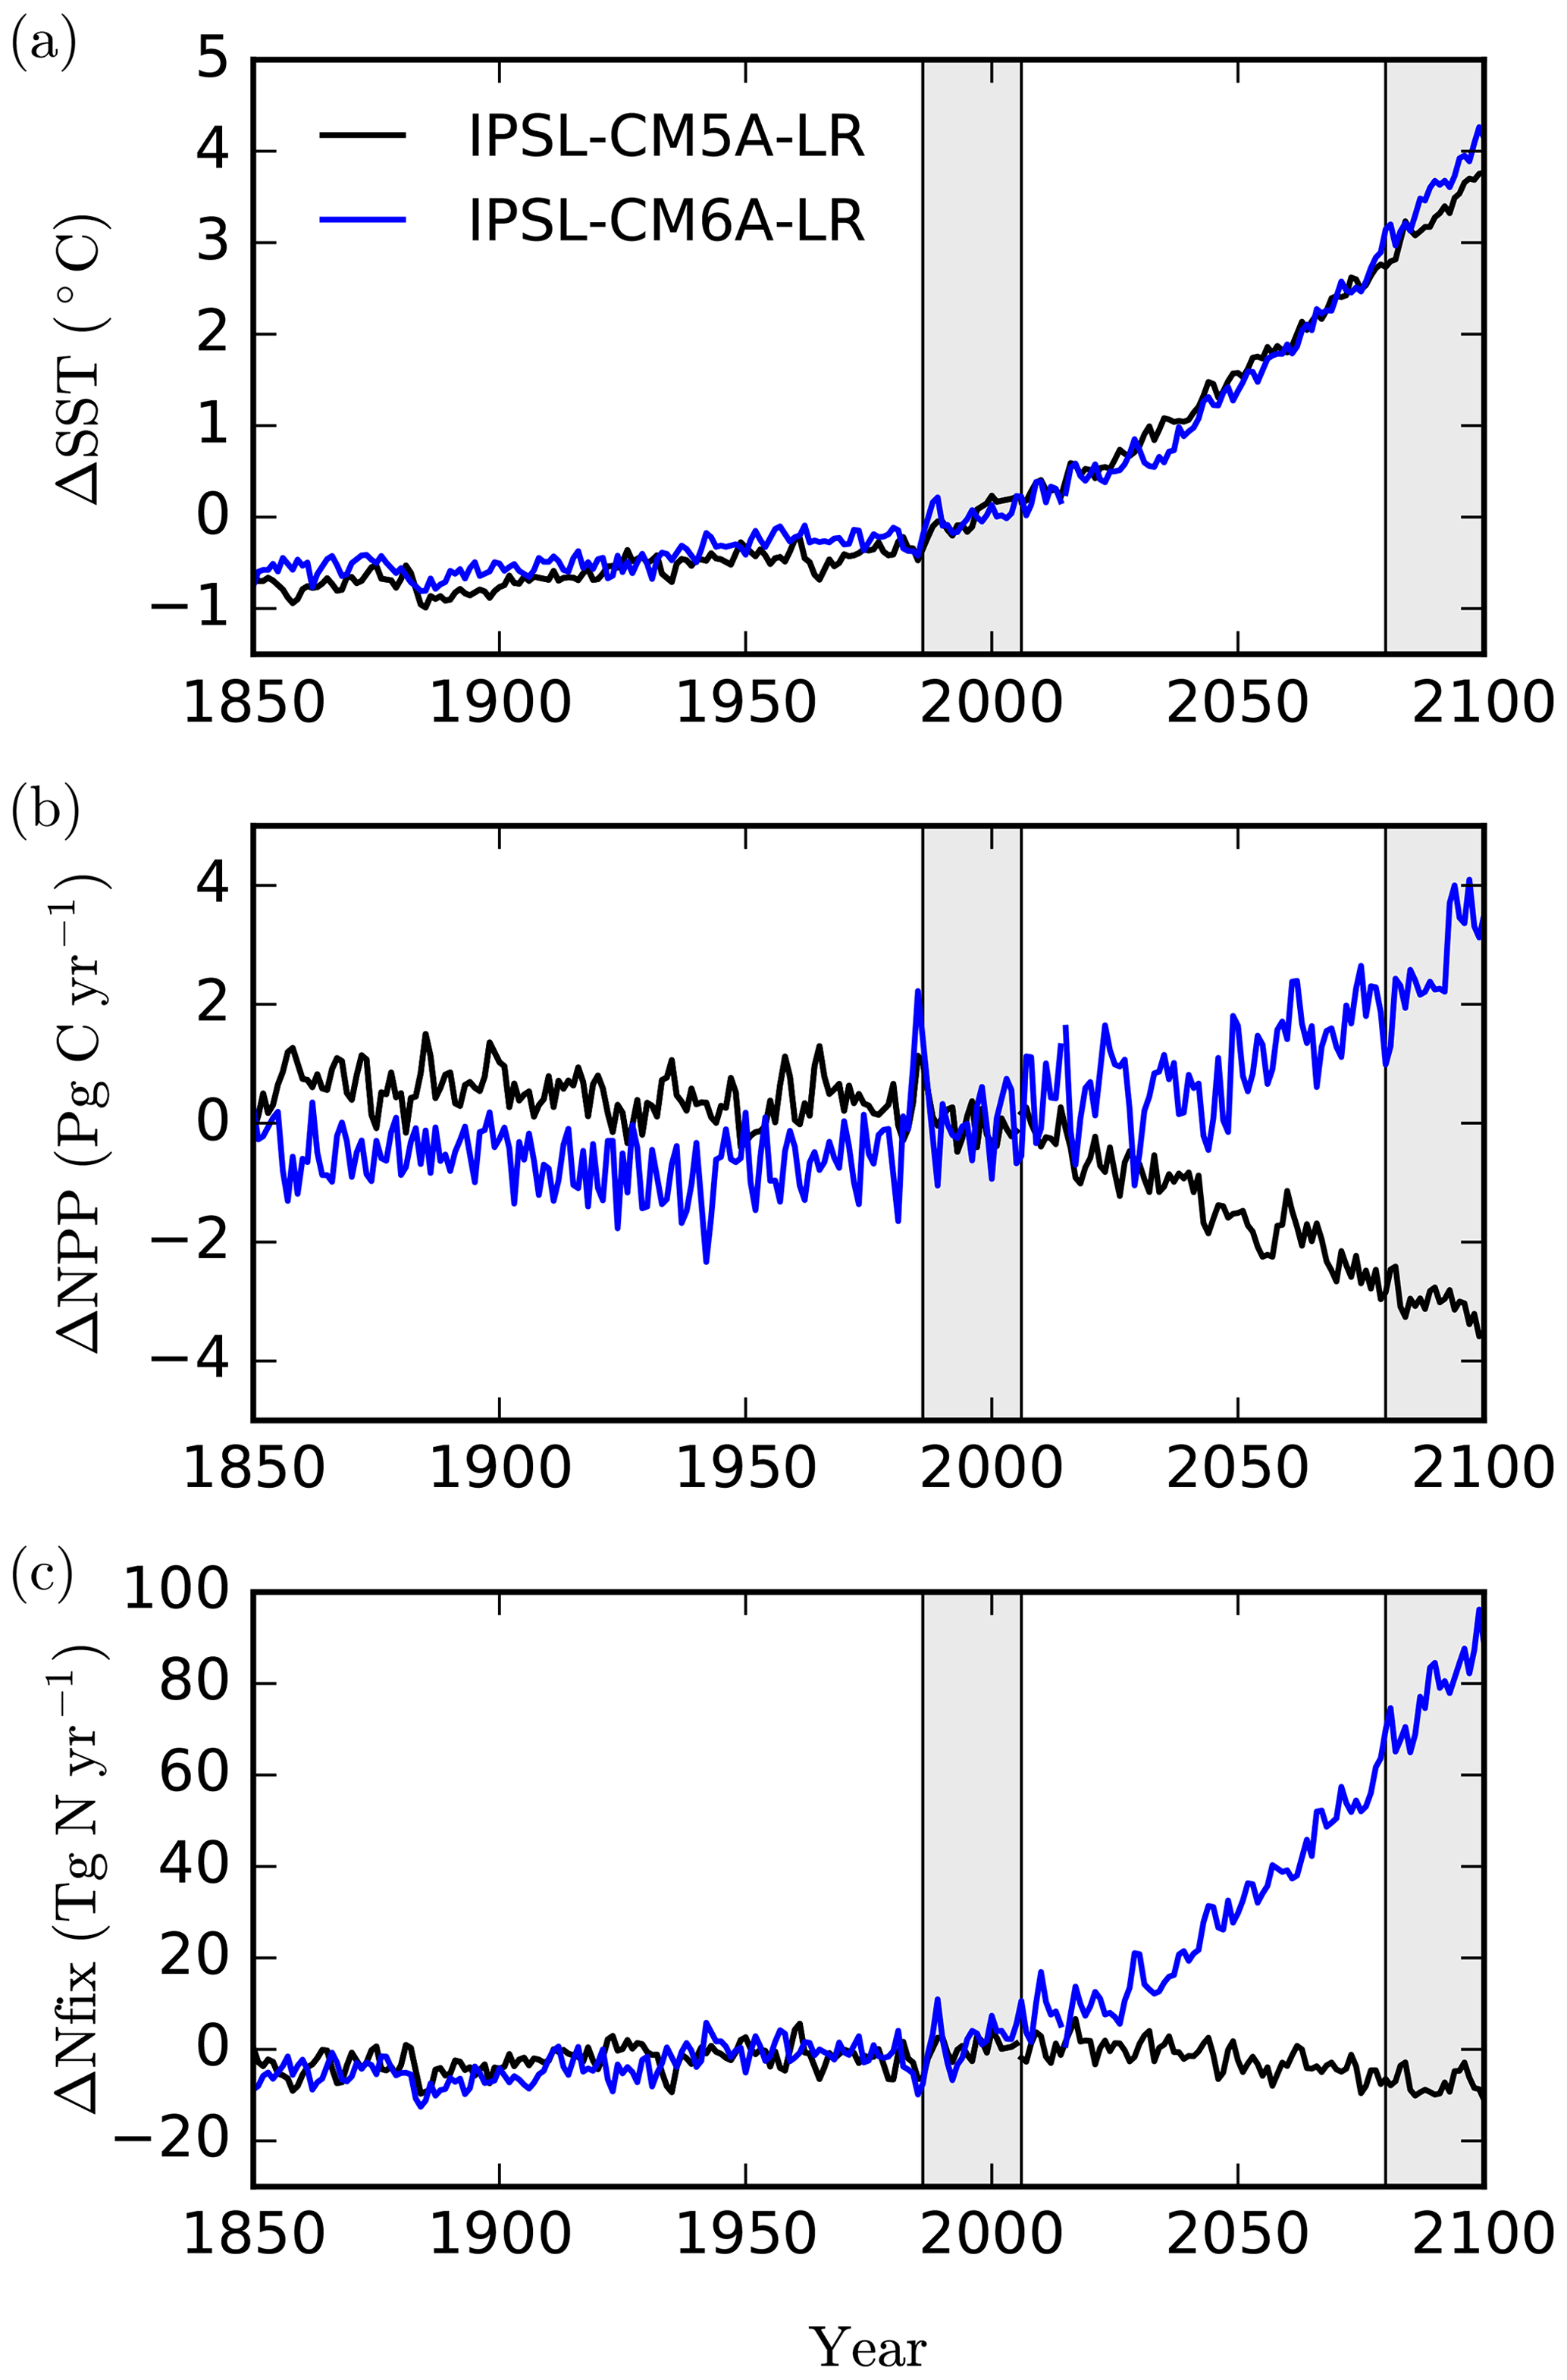
Figure 1Simulated changes relative to 1986–2005 in (a) sea surface temperature (∘C), (b) integrated net primary production (PgC yr−1) and (c) integrated N2 fixation (TgN yr−1), for IPSL-CM5A-LR (black) and IPSL-CM6A-LR (blue) over historical and future scenarios. Note that the RCP8.5 emission pathway is used for IPSL-CM5A-LR, but SSP5-8.5 is used for IPSL-CM6A-LR. The historical and future periods (1986–2005 and 2080–2099, respectively) are displayed as grey bars.
Biological dinitrogen (N2) fixation is a key process providing bio-available nitrogen to support marine primary production (Gruber and Galloway, 2008; Zehr and Capone, 2020). Nitrogen fixation was long thought to be confined to the warm, low-latitude ocean and only performed by very specific cyanobacteria. However, our knowledge has greatly evolved in recent years with the discovery of an ever-increasing array of microorganisms capable of fixing atmospheric nitrogen (Gradoville et al., 2017). Nitrogen fixation has also been observed in areas where it was previously not thought possible, e.g. in nutrient-rich, low-temperature waters (Tang et al., 2019; Benavides et al., 2018). At present, the response of N fixation to climate change appears highly unconstrained, as illustrated by the diversity of responses from ESMs that include some form of N-fixation parameterisation (Riche et al., 2018; Wrightson and Tagliabue, 2020). However, despite this variation, because N fixation emerges rapidly from the background of natural variability, it can be a key driver of NPP trends in N-limited waters (Wrightson and Tagliabue, 2020).
In this study, we first identify N fixation as the main process responsible for the sharp contrast between projected NPP in IPSL-CM5A-LR and IPSL-CM6A-LR. We then exploit a series of offline simulations using different versions of the PISCES model (including PISCES-v1, PISCES-v2 and other model versions differing in their representation of N fixation), consistently forced with the same climate model output. This ensures that no differences in the projections arise from variable climate scenarios, climate models or model resolution. We then analyse the mechanisms responsible for the different responses of N fixation in all models used here and discuss these differences in terms of their skill against data-based products. Lastly, we explore the implications of the divergent N-fixation and NPP responses for ocean carbon export, ocean deoxygenation and potential impacts on marine ecosystems in the 21st century.
2.1 Earth system models
In this study, we make use of two versions of the Institut Pierre-Simon Laplace Climate Model (IPSL-CM). The first model, IPSL-CM5A-LR (Dufresne et al., 2013), has been used extensively for Phase 5 of the Coupled Model Intercomparison Project (CMIP5; Taylor et al., 2012) and compared to other CMIP5 models in terms of its marine biogeochemistry response to climate change in Bopp et al. (2013). The second model is the newly developed IPSL-CM6A-LR (Boucher et al., 2020), used in the more recent CMIP6 (Eyring et al., 2016) and compared to other CMIP6 models in Kwiatkowski et al. (2020) for the response of marine ecosystem stressors to anthropogenic climate change.
Both IPSL models rely on the same atmospheric (LMDZ), ocean (NEMO) and land surface (ORCHIDEE) model components. However these model components have been substantially revised and upgraded in IPSL-CM6A-LR with respect to IPSL-CM5A-LR. The spatial resolution of the atmospheric model has also been increased from 96×95 points (mean resolution of 236 km) in longitude and latitude with 39 vertical layers in IPSL-CM5A-LR (Dufresne et al., 2013) to 144×143 points (mean resolution of 157 km) and 79 vertical layers in IPSL-CM6A-LR (Boucher et al., 2020). In addition, the nominal resolution of the ocean model has increased from 2∘ and 31 vertical layers to 1∘ and 75 vertical layers.
A detailed description of the changes to LMDZ, NEMO and ORCHIDEE is provided in Boucher et al. (2020). However, we note that the atmospheric general circulation model LMDZ6A (Hourdin et al., 2020) differs from LMDZ5A (Hourdin et al., 2013) in its inclusion of a new package of parameterisations for turbulence, convection and clouds. The NEMO ocean model comprises three components, i.e. ocean dynamics (NEMO-OPA), sea-ice dynamics and thermodynamics (NEMO-LIM), and marine biogeochemistry (NEMO-PISCES). All of these ocean components have been updated from IPSL-CM5A-LR to IPSL-CM6A-LR, from version 3.2 to version 3.6 of NEMO (Madec et al., 2017; Rousset et al., 2015; Aumont et al., 2015), with the addition of a nonlinear free surface, a parameterisation of mixing in the mixed layer due to submesoscale processes, an energy-constrained parameterisation of mixing due to internal tides for NEMO-OPA and a new multicategory halothermodynamic sea-ice model for NEMO-LIM. The changes in the marine biogeochemistry component (NEMO-PISCES) are described below. A detailed assessment of the key properties of the ocean and marine biogeochemical models as used in ESMs that have contributed to CMIP5 and CMIP6 (including IPSL models) is available in Séférian et al. (2020).
These two versions from the IPSL Climate Model family qualify as Earth system models as they include carbon cycle components for the land biosphere (ORCHIDEE) and the ocean (NEMO-PISCES). In the following we describe the PISCES model versions used in this study.
2.2 Marine biogeochemical components and N-fixation parameterisations
NEMO-PISCES is an ocean biogeochemical model that simulates marine biological productivity and describes the biogeochemical cycles of carbon, oxygen and the main limiting nutrients (P, N, Si, Fe). It is based on 24 prognostic tracers in its standard configuration, with two phytoplankton functional types (diatoms and nanophytoplankton) and two zooplankton size classes (micro- and mesozooplankton). PISCES is by nature a “Redfieldian” model; i.e. it assumes constant stoichiometric ratios for carbon, nitrogen and phosphorus in all organic compartments but considers flexible stoichiometry for iron and silica.
PISCES-v1 is used in IPSL-CM5A-LR and described in detail in Aumont and Bopp (2006), whereas PISCES-v2 is used in IPSL-CM6A-LR and described in Aumont et al. (2015). Despite being similar in terms of their overall architecture and number of prognostic tracers, PISCES-v2 differs from PISCES-v1 with an improved representation of iron cycling, phytoplankton growth and nutrient limitation, zooplankton grazing, the sinking of particles, external sources of nutrients, and the treatment of water–sediment interactions.
In both PISCES versions, the modelling of the nitrogen cycle relies on the explicit representation of nitrate and ammonium concentrations in seawater. It includes nitrification, which corresponds to the conversion of ammonium to nitrate and is assumed to be photo-inhibited and reduced in low-oxygen waters, as well as denitrification, when nitrate is used instead of oxygen for remineralisation in suboxic waters (Aumont et al., 2015). External sources of nitrogen in the ocean include riverine input (using Global NEWS 2 data sets – Mayorga et al., 2010 – for both PISCES versions), atmospheric deposition (using input4MIPs data – Hegglin et al., 2016 – in IPSL-CM6A-LR and output of the INCA model – Aumont et al., 2008 – for IPSL-CM5A-LR) and biological N fixation (see below). External sinks of nitrogen include denitrification and organic matter burial in the sediment (see Aumont and Bopp, 2006, and Aumont et al., 2015, for detailed descriptions).
In both PISCES versions, N fixation is represented implicitly as a source of ammonium, i.e. without an explicit diazotroph plankton functional type (Fig. 2). N fixation is restricted to warm waters (>20 ∘C) and increases exponentially with temperature following a Q10 value of 1.9 as for all autotrophic processes in PISCES (Aumont and Bopp, 2006; Aumont et al., 2015). N fixation is limited by the availability of light and iron and favoured in low-nitrogen (NO3 and NH4) environments. PISCES-v1 and PISCES-v2 differ in their treatment of phosphorus limitation on N fixation, which is absent in PISCES-v1 but combined with iron limitation in PISCES-v2. In PISCES-v1, due to the fixed stoichiometric ratios between carbon, nitrogen and phosphorus in all organic components, it is assumed that N fixation is accompanied by a release of inorganic phosphorus to account for the fact that diazotrophy-derived organic matter is much richer in N than the standard Redfield assumptions in the model. This additional P source is interpreted as deriving from the use of an unresolved dissolved organic phosphorus (DOP) pool by the implicit diazotrophs. Thus, in PISCES-v1, for every mole of N2 fixed by diazotrophy and instantaneously transferred into the ammonium pool, an additional 0.04 mol of phosphorus is added in the phosphate pool to represent the subsequent remineralisation of the diazotrophy-derived organic matter with an N : P ratio of 46 : 1 (Fig. 2a). In PISCES-v2, this parameterisation has been changed and instead includes an unresolved source of inorganic phosphorus from labile DOP, independently of N fixation. In strongly P-limited areas, diazotrophic cyanobacteria use DOP as a source of P, but this is the case also for other phytoplankton groups (Cotner and Wetzel, 1992; Paytan and McLaughlin, 2007). The parameterisation thus mimics this source of P, which depends on simulated dissolved organic matter concentrations and is inhibited when dissolved inorganic P is not limiting phytoplankton growth (Fig. 2b). In PISCES-v2, this P source is therefore not dependent on the rate of N fixation as it is in PISCES-v1.
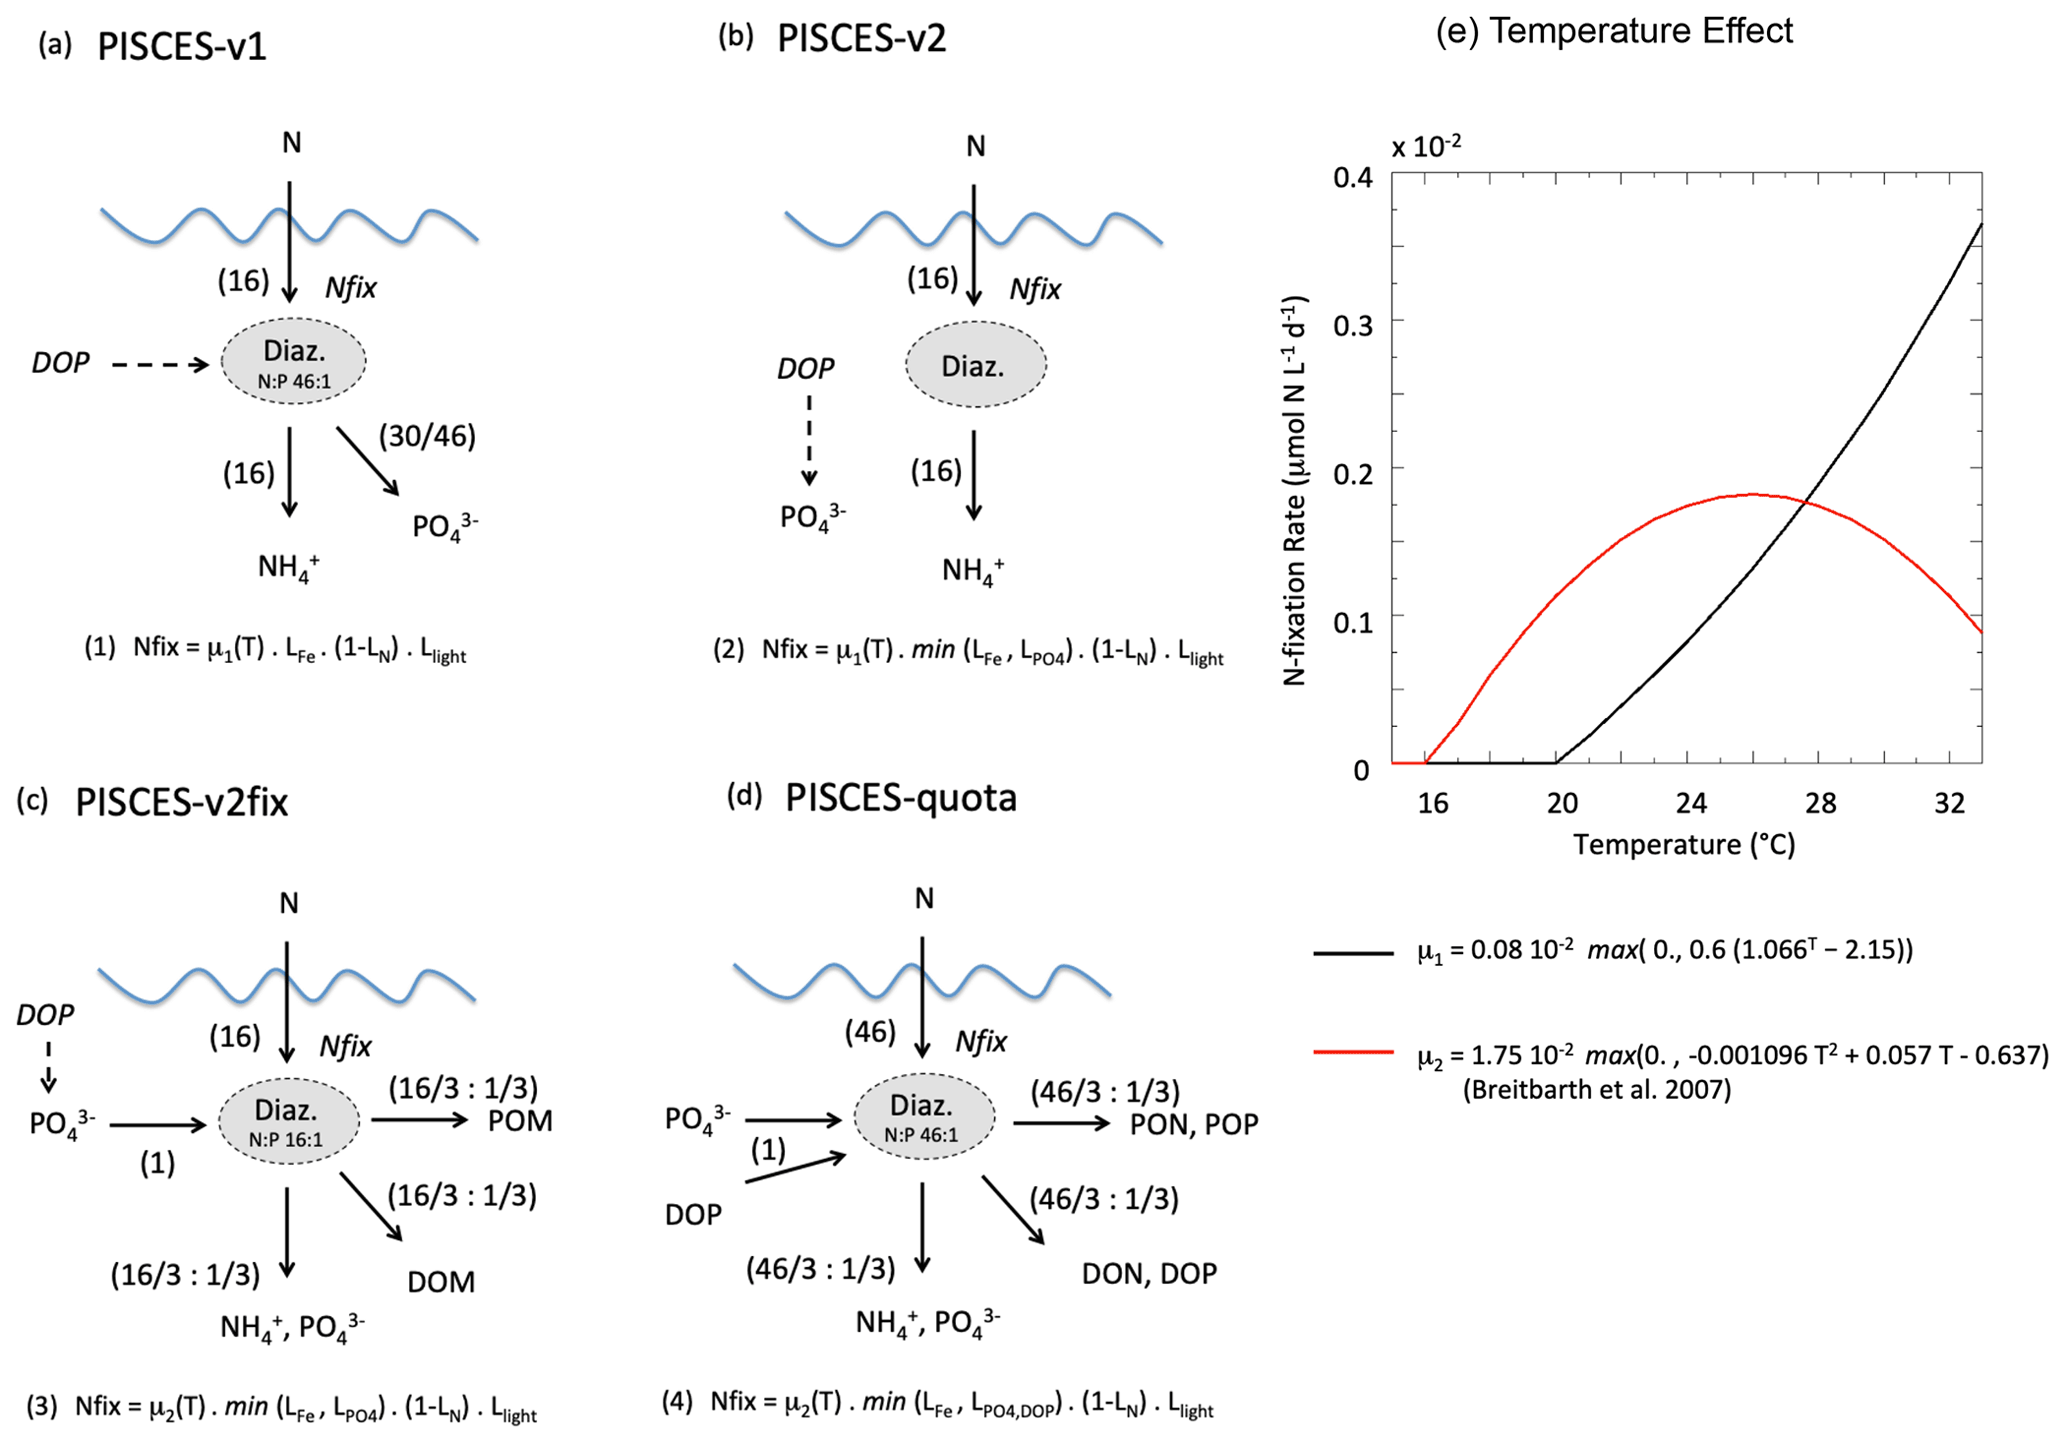
Figure 2Schematic diagram describing the parameterisation of N fixation for each of the PISCES versions (a–d) used in this study. Equations (1) to (4) give N-fixation rates as a function of μ, the N-fixation rate at temperature T; , LFe and LN limitation terms (varying between 0 and 1) for phosphorus, iron and nitrogen, respectively; and Llight a light limitation term (also between 0 and 1). The values in parentheses denote the number of moles (of nitrogen or phosphorus) that are consumed and produced by the implicit N-fixation parameterisation. (e) N-fixation rate (in µmolN L−1 d−1) as a function of water temperature and in the case of no other limitation, for PISCES-v1 and PISCES-v2 (black curve) and PISCES-v2fix and PISCES-quota (red curve, from Breitbarth et al., 2007). See text for details on the rationale for the different parameterisations.
Note that in all versions, the overall P inventory of the ocean is ensured by an annual restoring of the global mean PO4 concentration to its historical global value computed from the World Ocean Atlas 2001 for PISCES-v1 and World Ocean Atlas 2013 for PISCES-v2. This restoring term is applied everywhere (at all depths) and modifies phosphate concentration relatively, thus acting preferentially in the deep ocean where PO4 concentrations are higher. Overall, this term represents a restoring timescale of about 10 000 years (Aumont et al., 2015).
In this work, we use two modified versions of PISCES-v2. First, PISCES-quota is a newly developed version of PISCES, which accounts for flexible C : N : P stoichiometry. This is accompanied by the introduction of a new plankton functional type (picophytoplankton) and leads to a subsequent increase in the number of prognostic variables to 39 (compared to 24 in all other PISCES versions). A detailed description of PISCES-quota is provided in Kwiatkowski et al. (2018). As in PISCES-v1 and PISCES-v2, N fixation is parameterised implicitly, limited to waters with high light levels, low nitrogen, and adequate iron and phosphorus. However because PISCES-quota is non-Redfieldian, two major changes have been introduced (Fig. 2d): (1) N fixation consumes and is limited by the availability of an explicit dissolved organic phosphorus pool as seen in observations (Sohm and Capone, 2006; Orchard et al., 2010), and (2) the organic matter that is produced by diazotrophy is enriched in nitrogen with respect to phosphorus (with an N : P ratio of 46 : 1 vs. 16 : 1 for the canonical Redfield ratio). In PISCES-quota, implicit diazotrophy transfers nitrogen and phosphorus to three pools: particulate organic matter, dissolved organic matter, and ammonium and dissolved inorganic phosphorus, with a ratio of one-third each (Fig. 2d). Importantly, the temperature sensitivity of N fixation has been changed following Breitbarth et al. (2007), with a bell-shape response curve and a maximum N-fixation rate set at a thermal optimum of ∼ 26 ∘C (Fig. 2e).
Last and specifically for this study, we modified a version of PISCES-v2 in which only the parameterisation of N fixation was changed based on PISCES-quota (PISCES-v2fix, Fig. 2c). This newly developed parameterisation is inspired by PISCES-quota, except it assumes that the diazotrophy-produced material follows the Redfield stoichiometric ratio of N : P (i.e. 16 : 1) and uses the same release of additional inorganic phosphorus as in PISCES-v2 (Fig. 2c). PISCES-v2fix uses the same temperature-dependency as PISCES-quota (Fig. 2e).
2.3 Simulations
IPSL-CM5A-LR and IPSL-CM6A-LR have been integrated following the CMIP5 (Taylor et al., 2012) and CMIP6 (Eyring et al., 2016) protocols, respectively. After long spin-up integrations in pre-industrial conditions, both Earth system models are run under historical forcing (from 1850 to 2005 or 2014) and then under high-emission scenarios (from 2006 or 2015 to 2100, following RCP8.5 for IPSL-CM5A-LR and SSP5-8.5 for IPSL-CM6A-LR). Details on historical and projection simulations with IPSL-CM5A-LR and IPSL-CM6A-LR are given in Dufresne et al. (2013) and Boucher et al. (2020), respectively.
In addition to these coupled Earth system simulations and to facilitate the assessment of the role of biogeochemical parameterisations, we performed a series of “offline” ocean biogeochemistry simulations under the same physical forcing. The four PISCES versions that were run offline are PISCES-v1, PISCES-v2, PISCES-v2fix and PISCES-quota. To do so, we used the physical output of IPSL-CM5A-LR under historical and RCP8.5 conditions (monthly means of ocean temperature, salinity, currents and mixed-layer depth) and forced these different PISCES versions over 1850–2100 so that the only differences between the offline simulations originate from the biogeochemical parameterisations.
Hereafter, the coupled simulations are referred to as IPSL-CM5A and IPSL-CM6A, whereas the offline simulations are referred as PISCES-v1, PISCES-v2, PISCES-v2fix and PISCES-quota. To facilitate the comparison of simulations run under different protocols, the same 20-year periods have been retained for historical (1986–2005) and future (2080–2099) baseline periods.
3.1 Climate-change-driven responses of NPP and N fixation in IPSL Earth system models
We compare here two successive generations of the IPSL Climate Model, IPSL-CM5A (Dufresne et al., 2013) and IPSL-CM6A (Boucher et al., 2020), forced over the 21st century by two similar high-emission scenarios (RCP8.5 and SSP5-8.5). The equilibrium climate sensitivity (ECS) has increased slightly, from 4.1 K in IPSL-CM5A to 4.8 K in IPSL-CM6A (Boucher et al., 2020), both values being in the upper range of ECS from climate models developed in the framework of CMIP5 and CMIP6 (Forster et al., 2019). As a consequence, the warming level for the global mean sea surface temperature under the high-emission scenarios is slightly higher in IPSL-CM6A (+3.57 ∘C) than in IPSL-CM5A (+3.27 ∘C) at the end of the 21st century.
Table 1Climate change impact on global mean sea surface temperature (SST, ∘C), depth-integrated N fixation (Nfix, TgN yr−1) and depth-integrated net primary production (NPP, PgC yr−1). All are absolute differences between 2080–2099 and 1986–2005, with relative changes in parentheses.
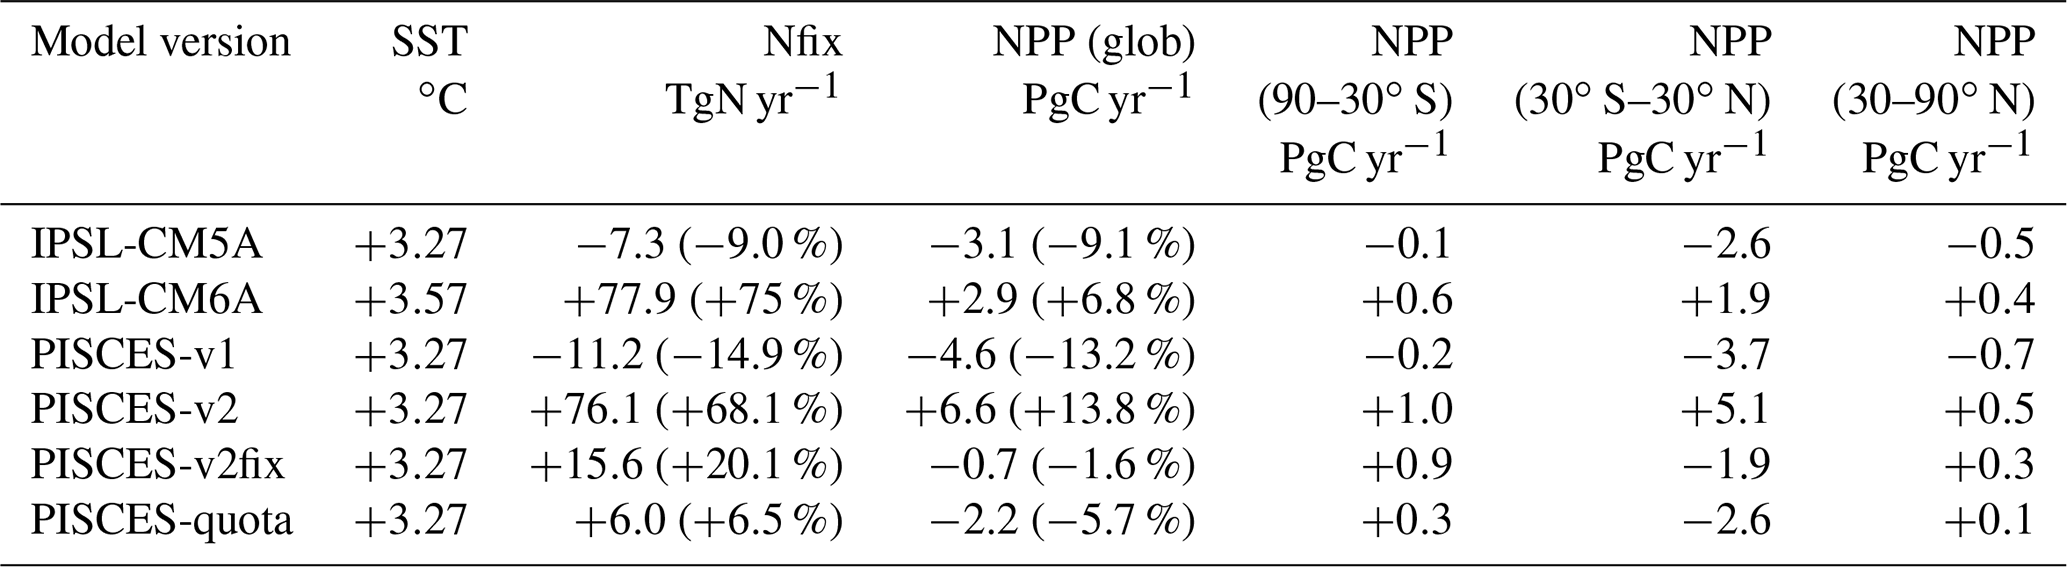
As stated in the Introduction, the two climate models that we compare here simulate opposing projections of global oceanic NPP over the 21st century. In IPSL-CM5A, NPP decreases by 3.1 PgC yr−1 from 1986–2005 to 2080–2099 (under RCP8.5), whereas IPSL-CM6A simulates an increase in NPP by 2.9 PgC yr−1 over the same period (but under SSP5-8.5) (Table 1, Fig. 1). These NPP global changes represent a 9.1 % decrease and a 6.8 % increase for IPSL-CM5A and IPSL-CM6A, respectively.
The difference between the two model versions mostly arises from the tropical oceans (30∘ S–30∘ N), with a decrease of 2.6 Pg yr−1 (−14.3 %) and an increase of 1.9 Pg yr−1 (+7.3 %) in IPSL-CM5A and IPSL-CM6A, respectively (Table 1). The extra-tropical oceans also show notable differences between the two model versions, but these differences contribute much less to the global NPP changes (Table 1). At the regional scale, the largest differences between the two model versions are located in the oligotrophic gyres of all ocean basins, which show significant increases in NPP for IPSL-CM6A (up to +45 gC m−2 yr−1) but slight decreases or increases in IPSL-CM5A (Fig. 3). Elsewhere, the general patterns are similar across the model versions with NPP increasing at high latitudes and decreasing in the equatorial band and at the poleward borders of subtropical gyres (Fig. 3).

Figure 3Changes in (a, b) sea surface temperature (SST, ∘C), (c, d) vertically integrated net primary production (NPP, gC m−2 yr−1) and (e, f) vertically integrated N fixation (Nfix, gN m−2 y−1) between 1986–2005 and 2081–2100. Panels (a), (c) and (e) are for IPSL-CM5A under RCP8.5, whereas (b), (d) and (f) are for IPSL-CM6A under SSP5-8.5.
The localisation of NPP differences in the oligotrophic gyres and the similarity of the physical ocean response (not shown) to anthropogenic climate change point towards a role for nitrogen fixation in explaining the contrast between IPSL-CM5A and IPSL-CM6A in terms of NPP projections. Indeed, whereas N fixation slightly decreases in IPSL-CM5A (−7.3 TgN yr−1; −9 %) through the 21st century, it almost doubles in IPSL-CM6A (+77.9 TgN yr−1; +75 %) (Fig. 1, Table 1). Spatially, the regions in which the increases in N fixation are strongest coincide with the regions in which NPP also increases strongly in IPSL-CM6A (Fig. 3).
3.2 Climate-change-driven responses of NPP and N fixation in PISCES offline simulations
To further understand the role of N fixation in explaining the differences between IPSL-CM5A and IPSL-CM6A, we use additional offline simulations where the same ocean physical forcing is applied to different versions of the PISCES biogeochemical model. This enables a direct comparison of specific biogeochemical parameterisations within the same physical framework (see Sect. 2.3).
The PISCES-v1 version (used in IPSL-CM5A) forced in offline mode with the IPSL-CM5A output over 1850–2100 gives broadly similar results to those obtained with IPSL-CM5A, i.e a decrease in NPP and in N fixation of −13.2 % and −14.9 %, in 2080–2099, respectively (Table 1, Fig. 4a and b). Spatially, the NPP and N-fixation changes obtained with PISCES-v1 in offline mode strongly resemble those from IPSL-CM5A, as can be seen when comparing Fig. 3c and e to Fig. 4c and d. Interestingly, these similarities between the online and offline versions are also maintained for PISCES-v2. By using the same PISCES version (PISCES-v2; Aumont et al., 2015) as that in IPSL-CM6A but forced with the physical output of IPSL-CM5A under RCP8.5 (simulation PISCES-v2; see Sect. 2.3), we obtain a very similar response to that in IPSL-CM6A in terms of N fixation, with an increase of 76.1 TgN yr−1 (+68.1 %) from 1986–2005 to 2080–2099, as compared to 77.9 TgN yr−1 (+75 %) over the same period in IPSL-CM6A (Table 1, Fig. 4). This shows that the differences between IPSL-CM6A and IPSL-CM5A are robust in a common physical framework. Consequently, NPP also increases in PISCES-v2 (by +13.8 %) (Table 1, Fig. 4). As in IPSL-CM6A, the increase in NPP in this offline simulation is largely concentrated in the tropical oceans, where it reaches +17 % (Table 2), and is typically coincident with regions of increasing N fixation (Fig. 4).
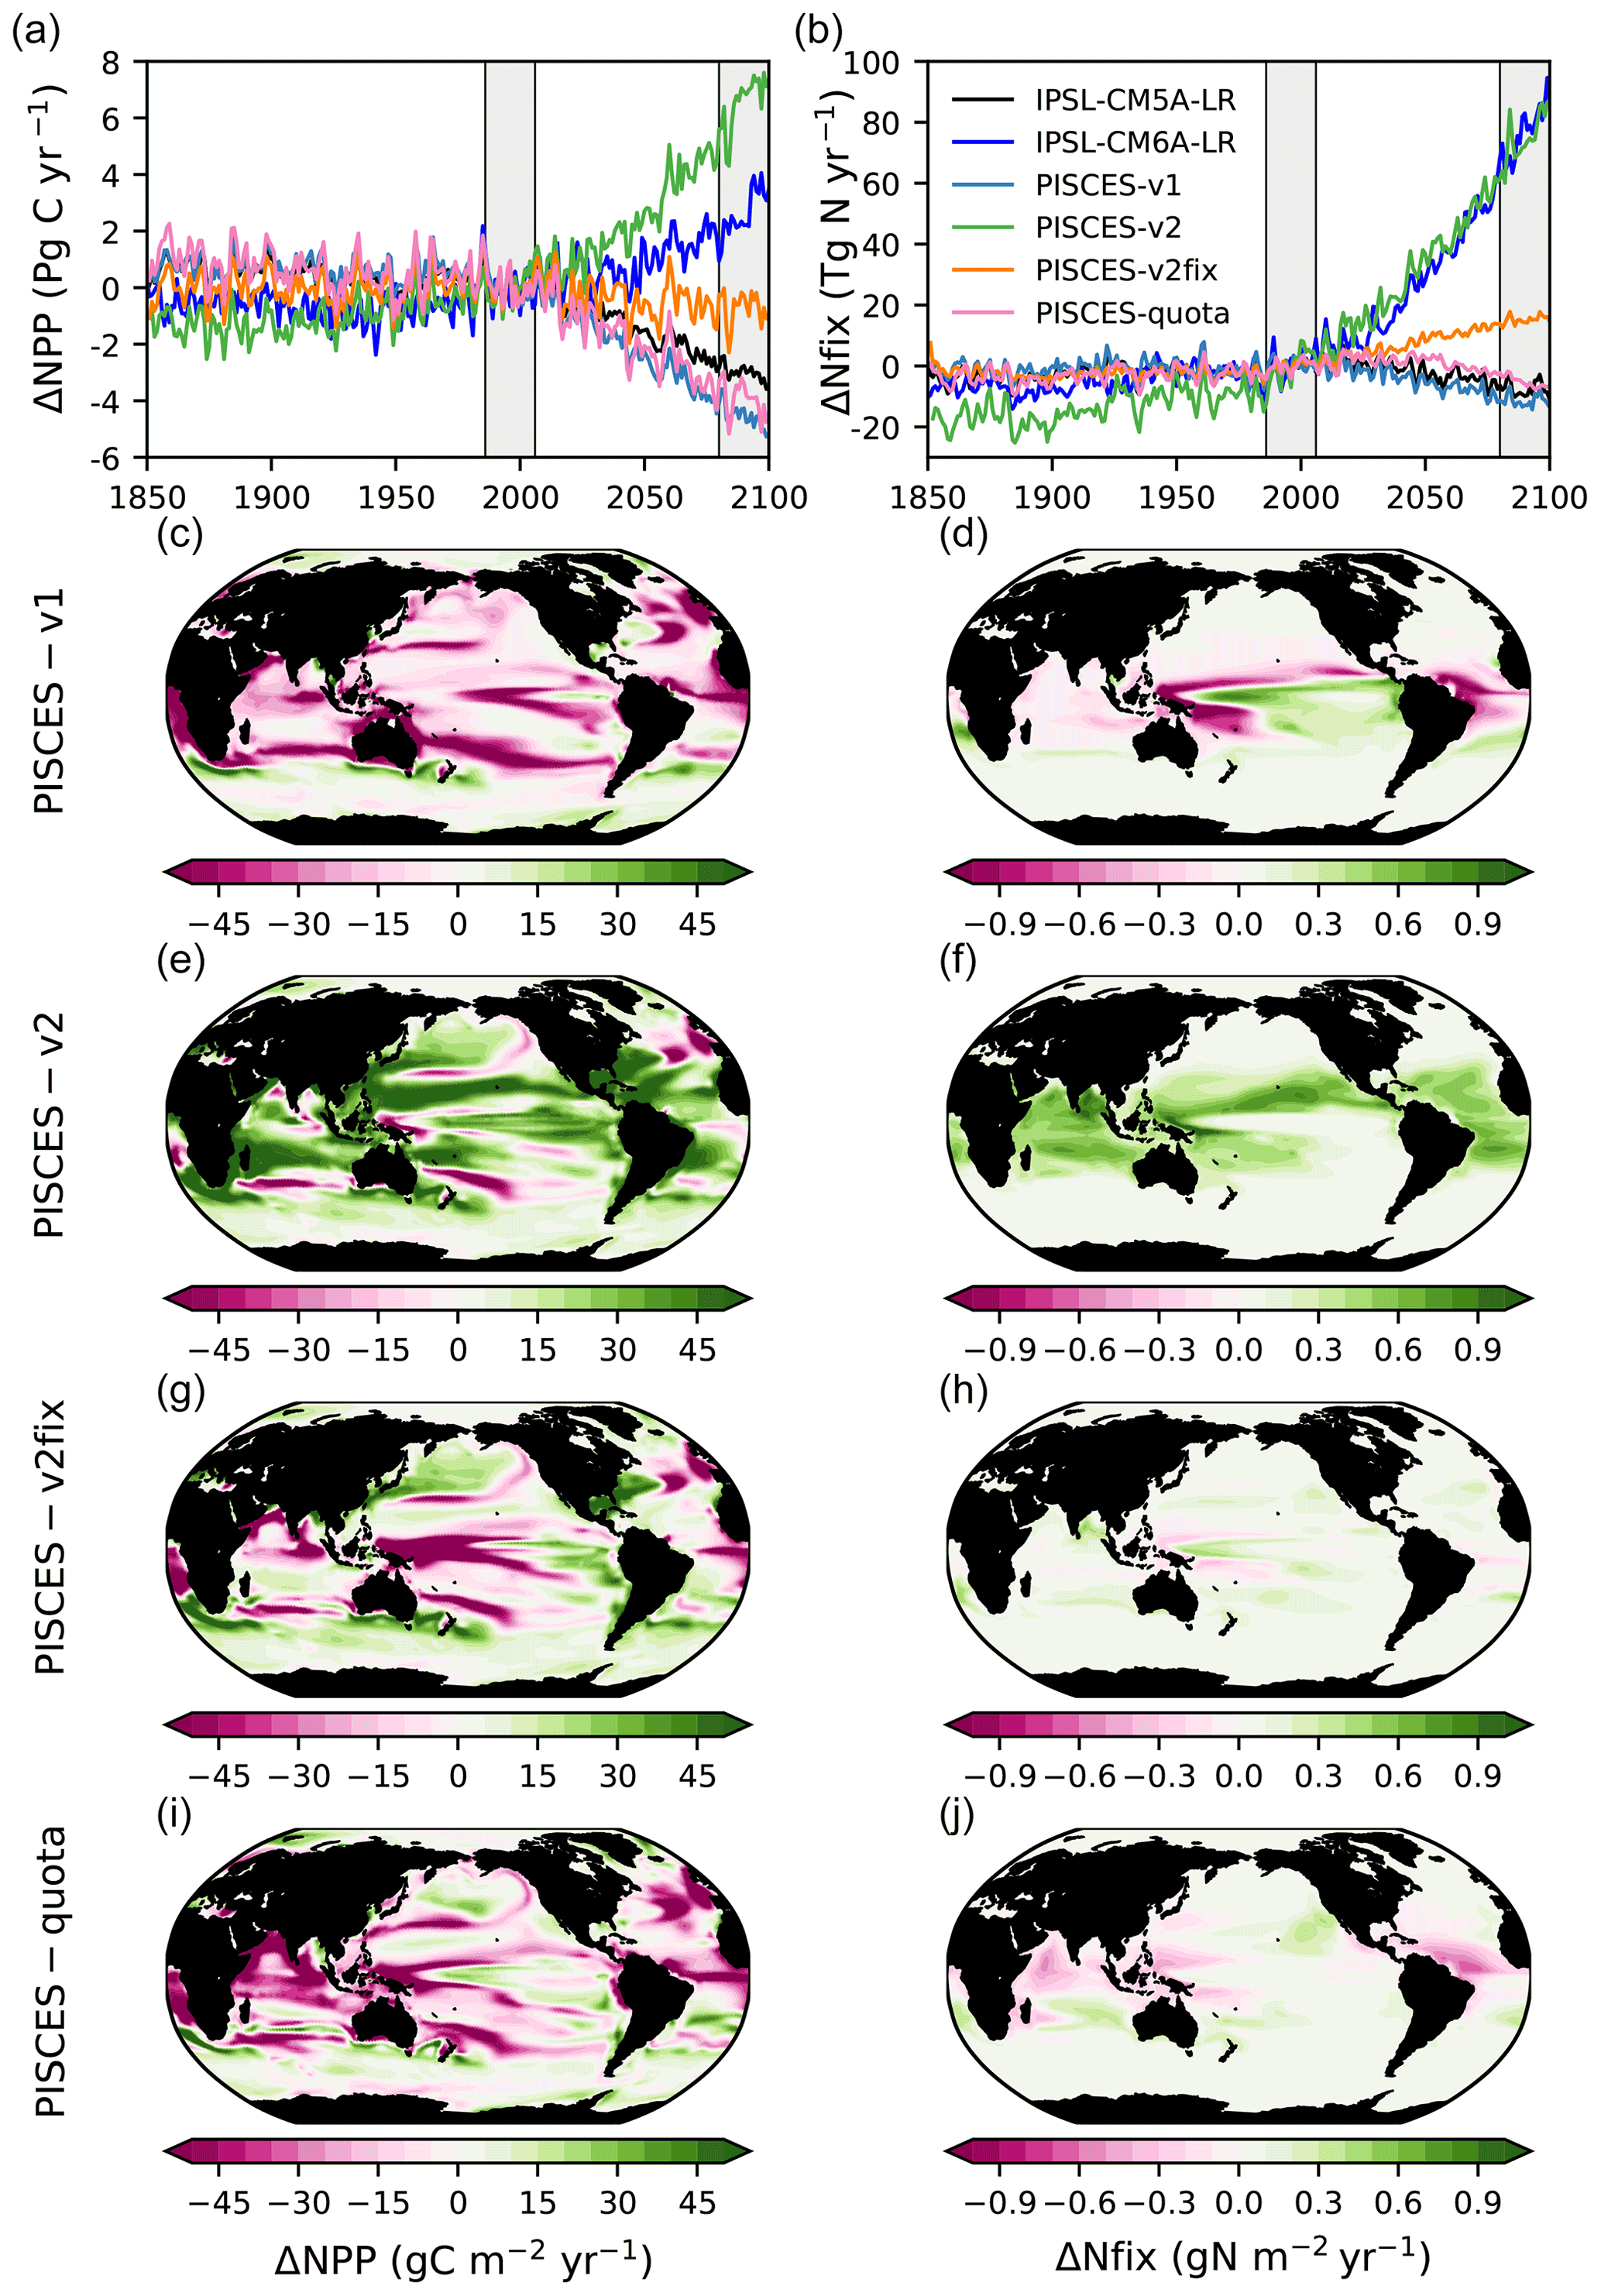
Figure 4Changes in NPP and N fixation across all model versions. Time series of (a) global NPP anomalies (PgC yr−1) and (b) global N-fixation anomalies (TgN yr−1), relative to 1986–2005 and under historical, RCP8.5 (all model versions except IPSL-CM6A-LR) and SSP5-8.5 (only IPSL-CM6A-LR). Changes in (c, e, g, i) vertically integrated NPP (gC m−2 yr−1) and in (d, f, h, j) vertically integrated N fixation (gN m−2 yr−1) for all offline model versions in 2080–2099 relative to 1986–2005, under RCP8.5.
In the PISCES-v2fix simulation, the temperature dependency of N fixation and the assumed N : P ratio of the implicit diazotrophs are modified from those in PISCES-v2 (Sect. 2.1), while the same forcing that derived from IPSL-CM5A is applied (Sect. 2.3). In this offline simulation, N fixation also increases over the 21st century (by 15.6 TgN yr−1 or 20.1 % at the end of the 21st century) but much less than in PISCES-v2. The increase in N fixation is small everywhere compared to PISCES-v2; there are even regions where N fixation decreases in PISCES-v2fix (west tropical Pacific, tropical Atlantic) (Fig. 5). Consequently, NPP changes are markedly different than those from PISCES-v2, with a global decrease of 1.6 % in 2080–2099 (Table 1), mostly located in the tropics (Fig. 4).
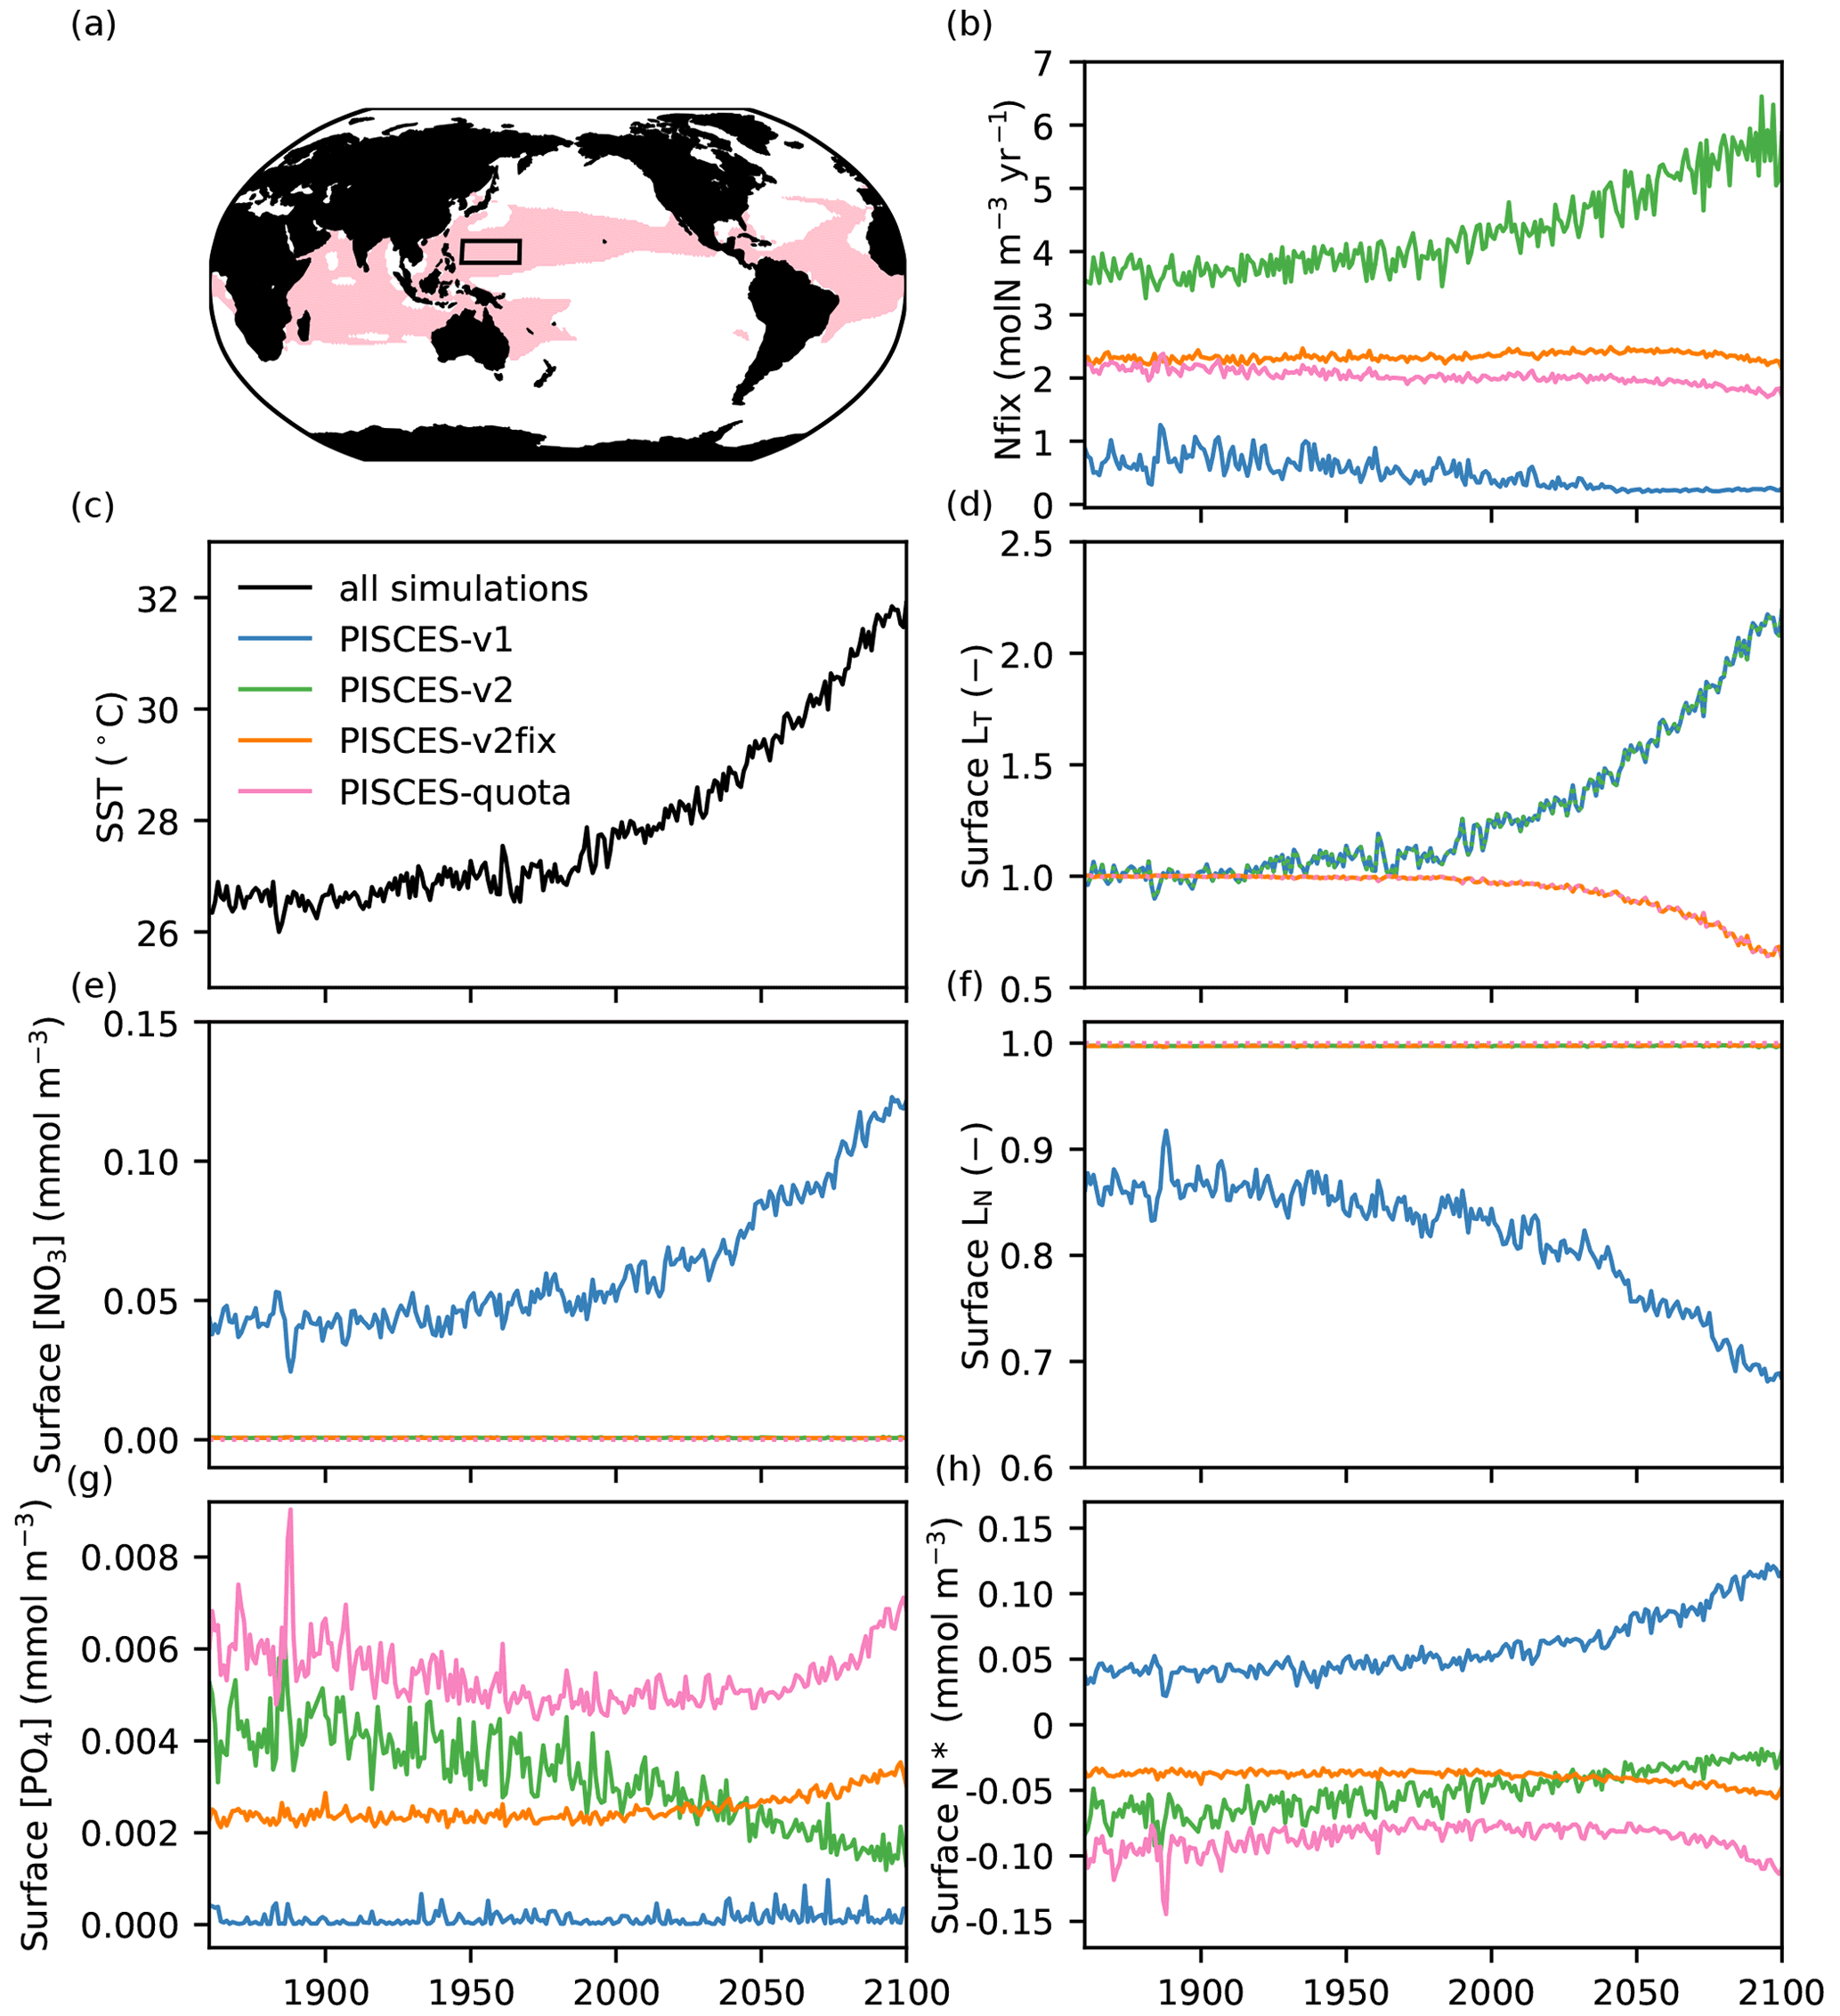
Figure 5Mechanisms explaining the contrasting response of N fixation across the different PISCES versions. (a) Regions where IPSL-CM5A and IPSL-CM6A simulate an N-fixation response of opposing sign (red) and where the detailed analysis is performed (130–160∘ E, 10–20∘ N; black box). (b) N fixation (molN m−3 yr−1) in the different PISCES versions. (c) Sea surface temperature (∘C) in IPSL-CM5A and (d) relative change in surface LT (no unit) for PISCES-v1 (blue) and PISCES-v2 (green) and PISCES-v2fix (orange) and PISCES-quota (pink). (e) Surface NO3 concentration (mmol m−3), (f) surface LN (no unit), (g) surface PO4 concentration (mmol m−3) and (h) surface N* (mmol m−3) in all PISCES versions. All (from b to h) are annual-mean time series averaged over 130–160∘ E and 10–20∘ N.
Lastly, we also compare these offline simulations with an offline simulation of the recently developed PISCES-quota model (Kwiatkowski et al., 2018), an advanced version of PISCES-v2 in which the assumption of fixed phytoplankton C : N : P stoichiometry has been relaxed. In this simulation, N fixation increases only slightly (by 6 TgN yr−1 or 6.5 % over the 21st century) whereas NPP decreases (by 2.2 PgC yr−1 or 5.7 %) over the 21st century. At regional scales, the patterns of N fixation display contrasting tendencies with decreases in the western Pacific, equatorial Atlantic and Indian Ocean and increases polewards of these regions. The regional changes in NPP resemble those simulated in IPSL-CM5A (Fig. 4). The differences between PISCES-quota and the two other offline simulations (PISCES-v2 and PISCES-v2fix) originate from the major developments in PISCES-quota such as variable C : N : P stoichiometry and the inclusion of a third phytoplankton functional type (picophytoplankton) as demonstrated in Kwiatkowski et al. (2018).
The comparison of our four offline simulations demonstrates the role of the response of N fixation in the evolution of NPP over the 21st century. Under the same physical forcing, N fixation changes by −14.9 %, +68.1 %, +20.1 % and +6.5 % over the 21st century, in PISCES-v1, PISCES-v2, PISCES-v2fix and PISCES-quota, respectively. The changes in global NPP over the same period are −13.1 %, +13.8 %, −1.6 % and −5.7 %, in the same four versions, respectively. The comparison of these offline simulations clearly links the response of global NPP to the parameterisation of N fixation and hence reinforces the assumption that differences in N fixation are the primary driver of the divergent IPSL-CM5A and IPSL-CM6A NPP projections.
3.3 Mechanisms determining the N-fixation response
The contrasting responses of N fixation in the IPSL-CM5A and IPSL-CM6A models (and thus between PISCES-v1 and PISCES-v2) are not entirely intuitive, as the two models share very similar parameterisations of N fixation (e.g. the same N-fixation temperature sensitivity) (Fig. 2). To explain these contrasting trends, we focus on an area located in the northwestern tropical Pacific (130–160∘ E, 10–20∘ N), where the response of nitrogen fixation diverges strongly between IPSL-CM5A and IPSL-CM6A (Fig. 5a), and exploit the comparison between the different offline versions of PISCES (PISCES-v1, PISCES-v2, PISCES-v2fix and PISCES-quota) that use an identical climate forcing. In this region, N fixation increases by 32 % in PISCES-v2 between 1986–2005 and 2080–2099 (of the same order of magnitude as in IPSL-CM6A, +45 %, not shown); decreases by 46 % in PISCES-v1; and decreases by 2 % and 10 % in PISCES-v2fix and PISCES-quota, respectively (Fig. 5b). Concurrently, sea surface temperature in this region increases by nearly 4 ∘C (between 1986–2005 and 2081–2100) to reach 31.5 ∘C at the end of the 21st century. In PISCES-v1 and PISCES-v2, this increase leads to a boost in N fixation by a factor of 2.1 (Fig. 5d). In PISCES-v2fix and PISCES-quota, on the contrary, the increase in temperature reduces N fixation by more than 30 % (Fig. 5d) due to the bell-shaped temperature sensitivity function of the Breitbarth et al. (2007) parameterisation.
In PISCES-v2, the limitation terms due to light, phosphate, iron and excess nitrate remain inoperative and N fixation responds almost exclusively to temperature (Fig. 5b). Indeed, NO3 concentrations remain close to zero (with N* values, defined as NO3 − 16*PO4, remaining slightly negative), and the LN term has no influence, allowing N fixation to increase in response to temperature. In PISCES-v1, on the other hand, the higher and increasing nitrate concentrations (Fig. 5e), resulting in positive N* values (Fig. 5h), lead to a limitation and even to a decrease in N fixation due to the LN term (limitation by excess inorganic nitrogen, Fig. 5f) (see Fig. 2b, Eq. 2).
The differential response of N fixation in PISCES-v1 and PISCES-v2 is thus related to how the parameterisation of N fixation simulates inorganic N and P inputs to surface waters (see Sect. 2.2). In PISCES-v1, surface waters in the oligotrophic subtropical gyres are P-limited for phytoplankton (N* being positive). Warming first increases N fixation, resulting in a continuous addition of N (through N fixation) at the expense of P. Nitrogen fixation is hence progressively limited by the accumulation of inorganic nitrogen and thus decreases. In PISCES-v2, warming also increases N fixation due to the same parameterisation of the thermal sensitivity of N fixation. But in this version, the sustained low addition of phosphate (which accounts for the implicit remineralisation of DOP and is independent of N-fixation rates) prevents any shift to P limitation. N* remains negative; inorganic N does not accumulate, and N fixation continues to increase.
In PISCES-v2fix and PISCES-quota, NO3 concentrations remain close to zero as in PISCES-v1 (Fig. 5e) and the excess nitrogen limitation term has no influence, remaining close to 1 (Fig. 5f). But contrary to PISCES-v1, N fixation decreases slightly (Fig. 5b) due to warming and the use of the bell-shape temperature sensitivity function (Fig. 5d).
Although the analysis presented here is limited to a small region of the western tropical Pacific (130–160∘ E, 10–20∘ N), we show the same contrasting behaviour between the different PISCES versions in other sub-tropical oligotrophic gyres (see Fig. A1 in the Appendix showing the same analysis in a region centred around the HOT station; 175–205∘ E, 15–25∘ N).
In summary, the simulated N-fixation response is highly sensitive to (1) the parameterisation used for the temperature sensitivity (PISCES-v1 and PISCES-v2 as compared to PISCES-v2fix and PISCES-quota) and (2) the respective evolution of NO3 and PO4 concentrations (PISCES-v1 as compared to PISCES-v2). To reiterate, it is the divergent responses of N fixation in oligotrophic gyres (Fig. 5a), where temperatures can exceed the optimal values in the Breitbarth et al. (2007) parameterisation (Fig. 2) and where NO3 accumulation can induce a decrease in the rate of N fixation, that explain the differences between the different versions of PISCES.
3.4 Evaluation and constraints on projections
As the responses of the different versions of PISCES to anthropogenic climate change were so variable (see Sect. 3.1 and 3.2), we conducted a brief evaluation of these simulations over the historical period for NPP, nutrients (nitrate, phosphate) and N fixation to determine if any of the PISCES versions have significantly better performance scores (based on root-mean-square errors – RMSEs; see “Materials and methods”). We note that the outputs of IPSL-CM5A and IPSL-CM6A are evaluated in Séférian et al. (2020) alongside the other Earth system models of the CMIP5 and CMIP6 exercises.
A visual inspection of the bias maps for NPP, NO3 and PO4 concentrations and N fixation fails to highlight a single model version that outperforms the others, with similar regional biases for all PISCES variants (Fig. 6). All versions tend to underestimate NPP in the mid-latitudes of the Northern Hemisphere and overestimate NPP in the equatorial band and the Southern Ocean. For macro-nutrient concentrations, the regional biases are also similar, with a marked underestimation in the North Pacific and equatorial Pacific and an overestimation in the sub-Antarctic. Finally, comparison of simulated N-fixation rates to the measured estimates of Landolfi et al. (2018) shows a fairly widespread underestimation, for all versions of PISCES, in the northern subtropical gyre of the Pacific and in the equatorial Atlantic.
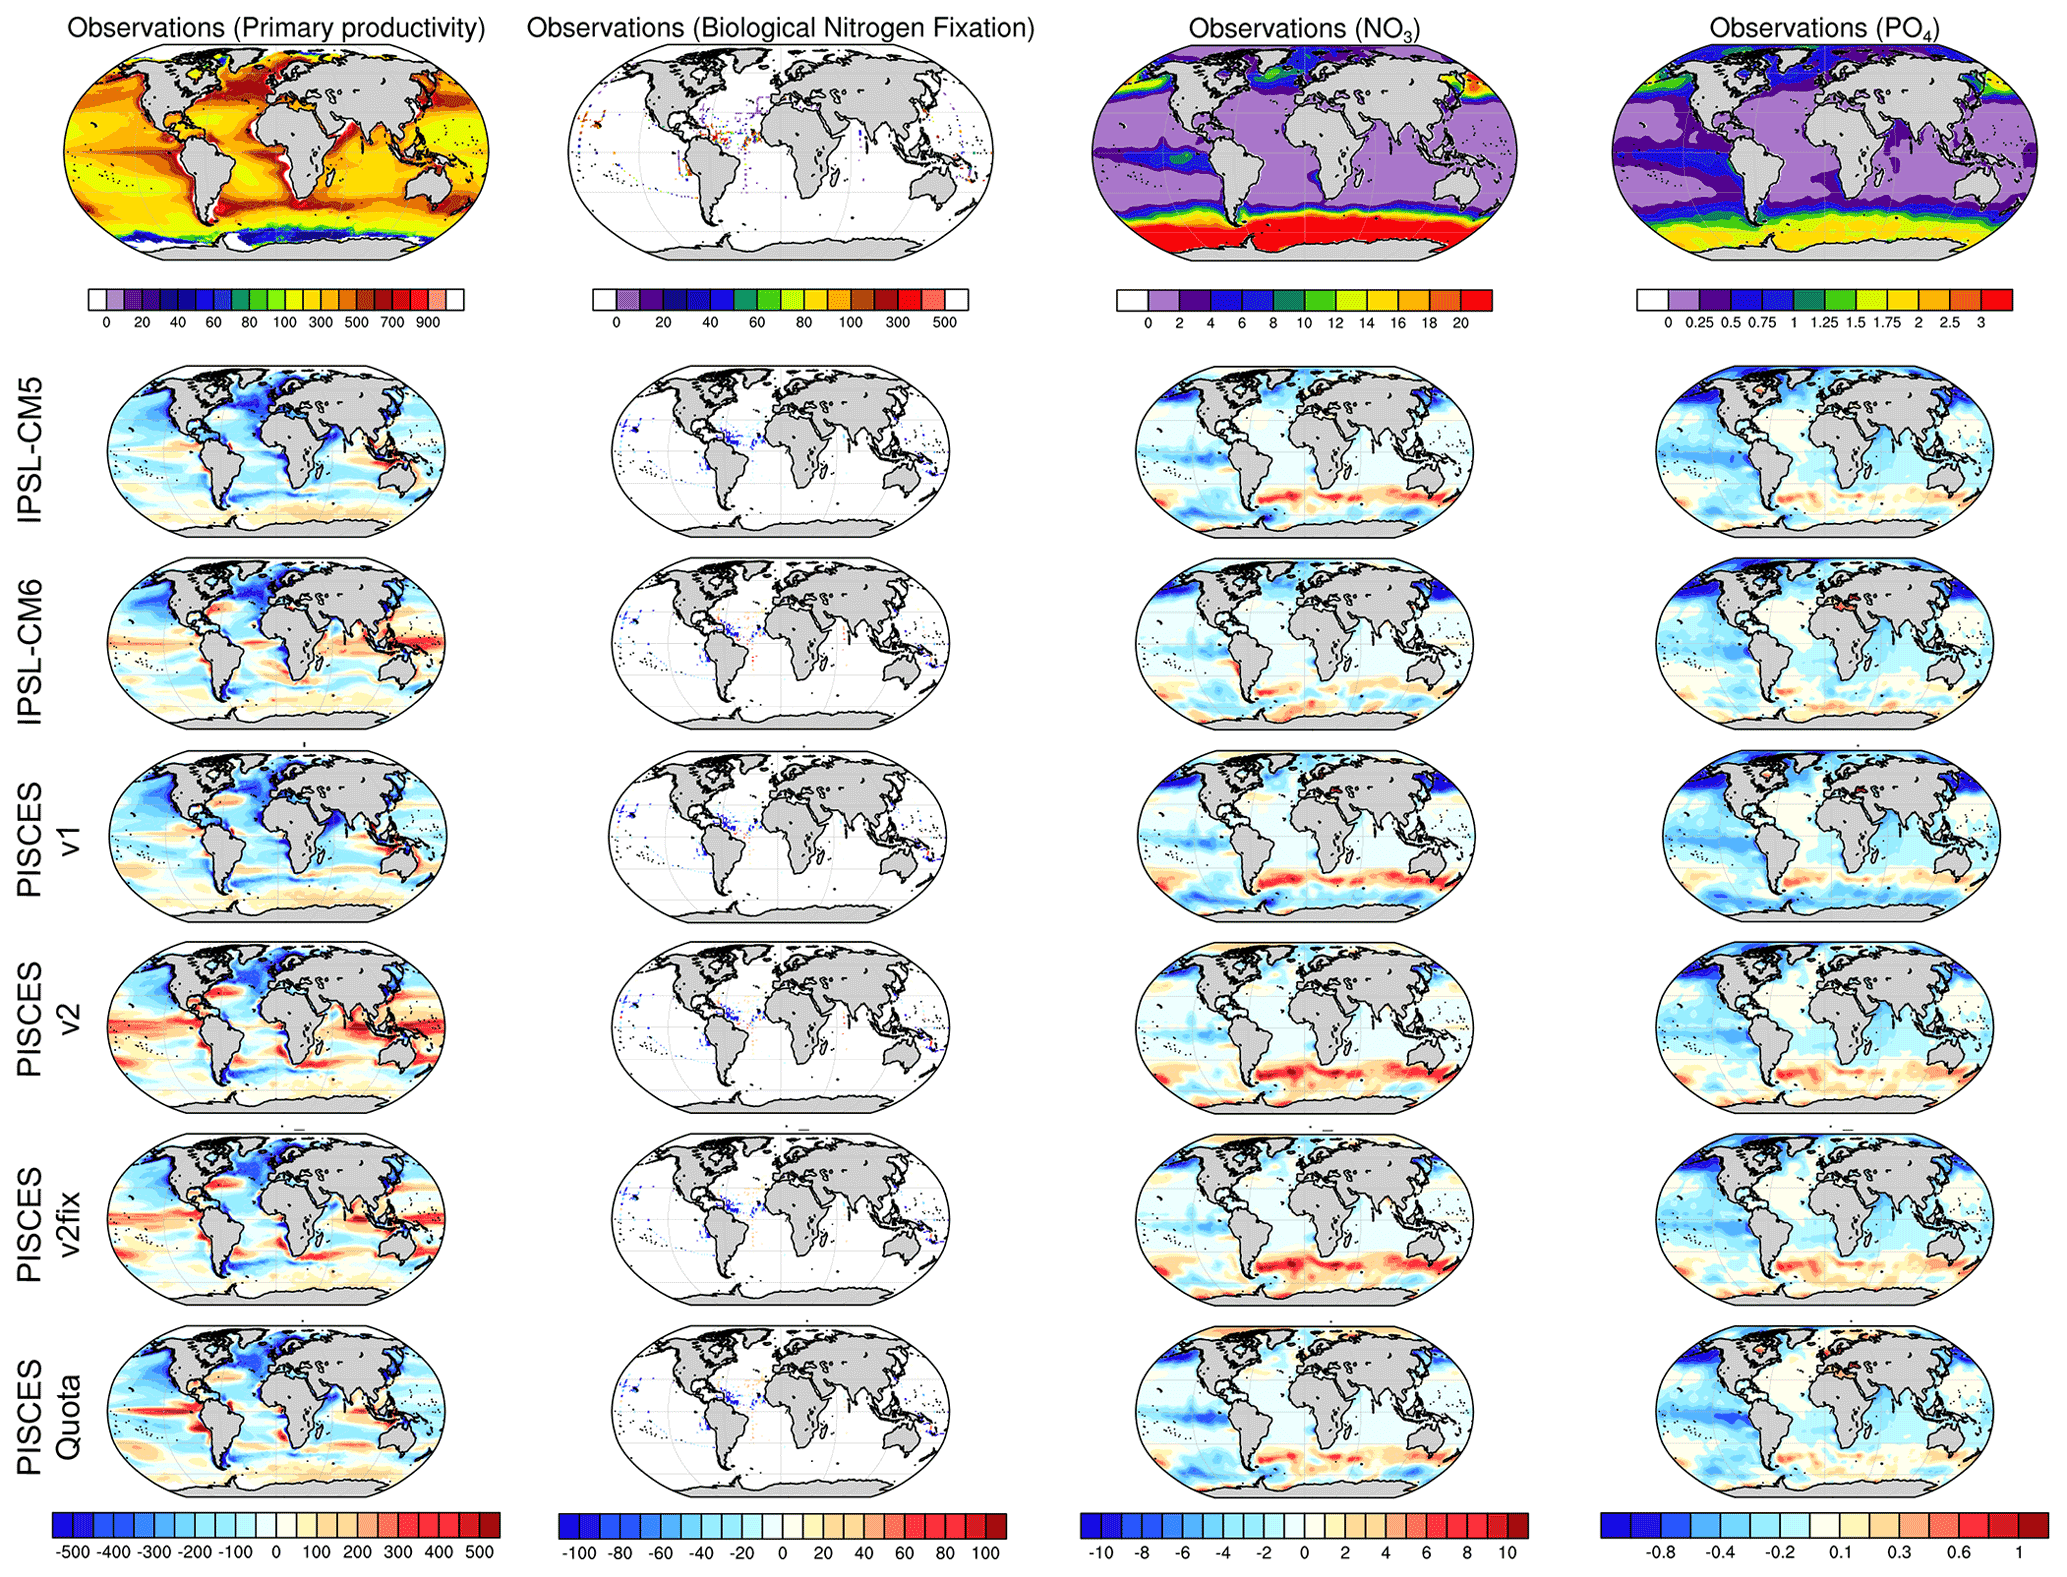
Figure 6Model–data intercomparison of NPP (mgC m−2 d−1), N fixation (mmolN m−2 yr−1), surface NO3 concentrations (mmol m−3) and surface PO4 concentrations (mmol m−3). The upper panels show NPP based on remote-sensing observations with the vertically generalized production model (VGPM) algorithm (Behrenfeld et al., 2005), N fixation from Luo et al. (2014) updated by Landolfi et al. (2018), and NO3 and PO4 as provided in the World Ocean Atlas database (Garcia et al., 2013). The other panels show model–data anomalies averaged over the period 1986–2005.
A more quantitative analysis using RMSE for each of the above fields confirms this visual impression with very similar RMSEs across all versions of PISCES. It can be noted, however, that the spatial distribution of NPP seems to be better reproduced in PISCES-quota, while the comparison of N-fixation rates gives the worst scores for PISCES-quota.
In conclusion this brief comparison with observations fails to distinguish between the different versions of the PISCES model used here. To go further, it would be necessary to compare the simulated trends over the historical period with time series obtained at marine stations (e.g. Hawaii Ocean Time-series programme – Karl and Church, 2014; Bermuda Atlantic Time-series Study – Lomas et al., 2013), or with reconstructions of the evolution of N fixation over the last century from palaeoceanographic proxies such as δ15N (Sherwood et al., 2014).
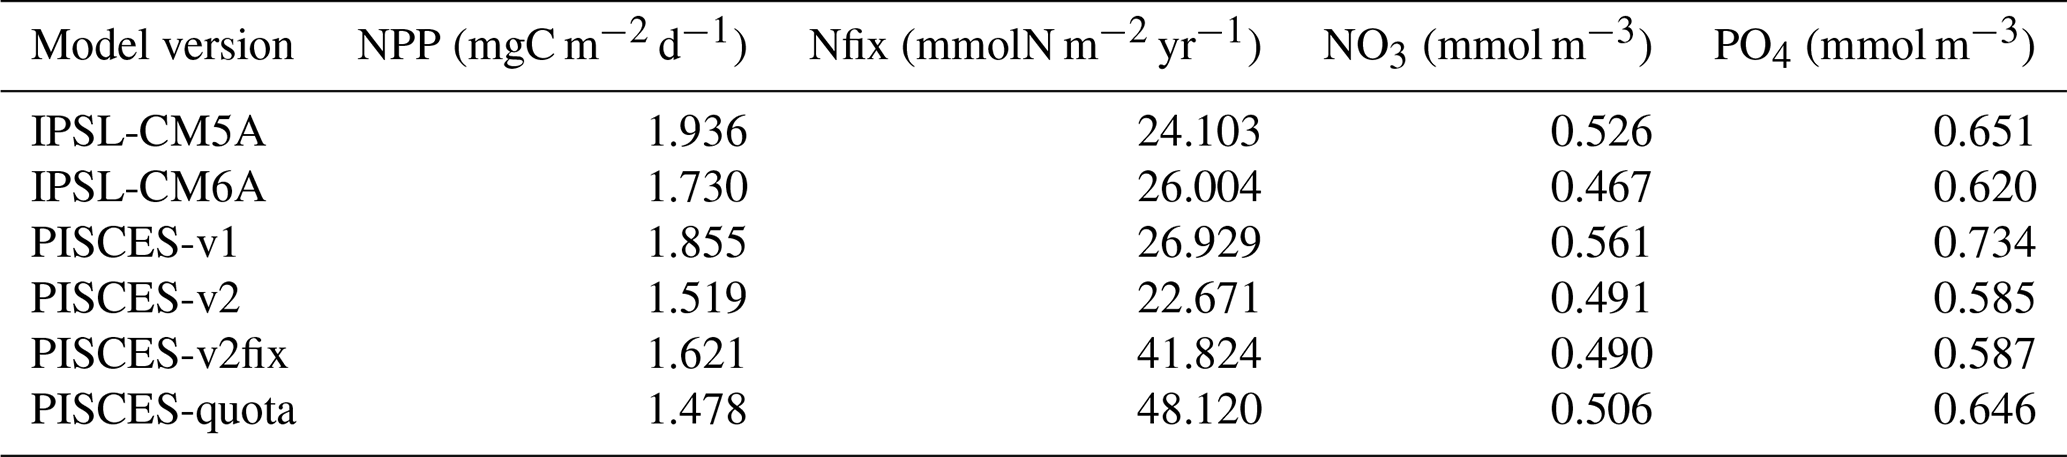
Table 2Root-mean-square errors (RMSEs) for NPP (mgC m−2 d−1), N fixation (Nfix, mmolN m−2 yr−1), and NO3 and PO4 surface concentrations (mmol m−3) for all PISCES versions used here against observations (NPP based on remote-sensing – Behrenfeld et al., 2005; N fixation from Luo et al., 2014, updated by Landolfi et al., 2018; and NO3 and PO4 as provided in the World Ocean Atlas database – Garcia et al., 2013). All model estimates are for 1986–2005.
Another method using observations to constrain projection uncertainties, known as the emergent constraint approach, relies on relating observable trends or sensitivities across a model ensemble to future differences in model simulations (Allen and Ingram, 2002; Hall and Qu, 2006; Hall et al., 2019). This approach has been used extensively within the Earth sciences to constrain projections as diverse as climate sensitivity (Caldwell et al., 2018), snow–albedo feedbacks (Hall and Qu, 2006), precipitation extremes (O'Gorman, 2012; DeAngelis et al., 2016) and carbon cycle feedbacks (Cox et al., 2013; Wenzel et al., 2014; Goris et al., 2018; Terhaar et al., 2020). Interestingly, Kwiatkowski et al. (2017) applied an emergent constraint approach to CMIP5 NPP projections, finding an emergent relationship between the tropical (30∘ N–30∘ S) sensitivity of integrated NPP to El Niño–Southern Oscillation (ENSO) variability (Niño 3.4 SST anomalies) in pre-industrial control simulations and the tropical NPP response to 21st century warming under a high-emission scenario (RCP8.5). That is, models that exhibited heightened tropical NPP sensitivity to ENSO-driven SST fluctuations typically exhibited greater future NPP declines in response to climate change. The authors then used observational estimates of the NPP ENSO sensitivity to constrain the future NPP response.
The present study highlights that N fixation may represent a slow or threshold process that has the potential to limit the applicability of emergent constraint approaches to projections of NPP. Indeed, the NPP ENSO sensitivities of PISCES-v1, PISCES-v2 and PISCES-v2fix are shown to be highly similar in the first 50 years of historical simulations (−2.6 % ∘C−1, −2.8 % ∘C−1 and −3.3 % ∘C−1), and yet the 21st century NPP sensitivity of PISCES-v2 changes sign (+3.2 % ∘C−1), due to the enhanced role of N fixation, while the sensitivities of PISCES-v1 and PISCES-v2fix remain negative (−3.4 % ∘C−1 and −2.2 % ∘C−1) (Fig. 7). The extent to which the differing PISCES-v2 model behaviour across timescales challenges the previously identified emergent constraint is unknown, but it is possible that future changes move beyond what is constrainable with historical variability (e.g. Tagliabue et al., 2020). Interestingly, the tropical NPP sensitivity of PISCES-quota in the early historical period (−2.9 % ∘C−1) and under RCP8.5 (−2.8 % ∘C−1) is highly similar and in line with PISCES-v1 and PISCES-v2fix (Fig. 7). As such, there is strong reason to doubt whether the sensitivity of N fixation to climate change and hence the response of NPP, in PISCES-v2, are realistic. However, given all of the above, verifying the validity of the Kwiatkowski et al. (2017) NPP emergent constraint with multiple quota models is identified as a priority. It is urgent as well to verify the sensitivity of nitrogen fixation with more mechanistic models of N fixation (such as those of Pahlow et al., 2013, or Inomura et al., 2018).
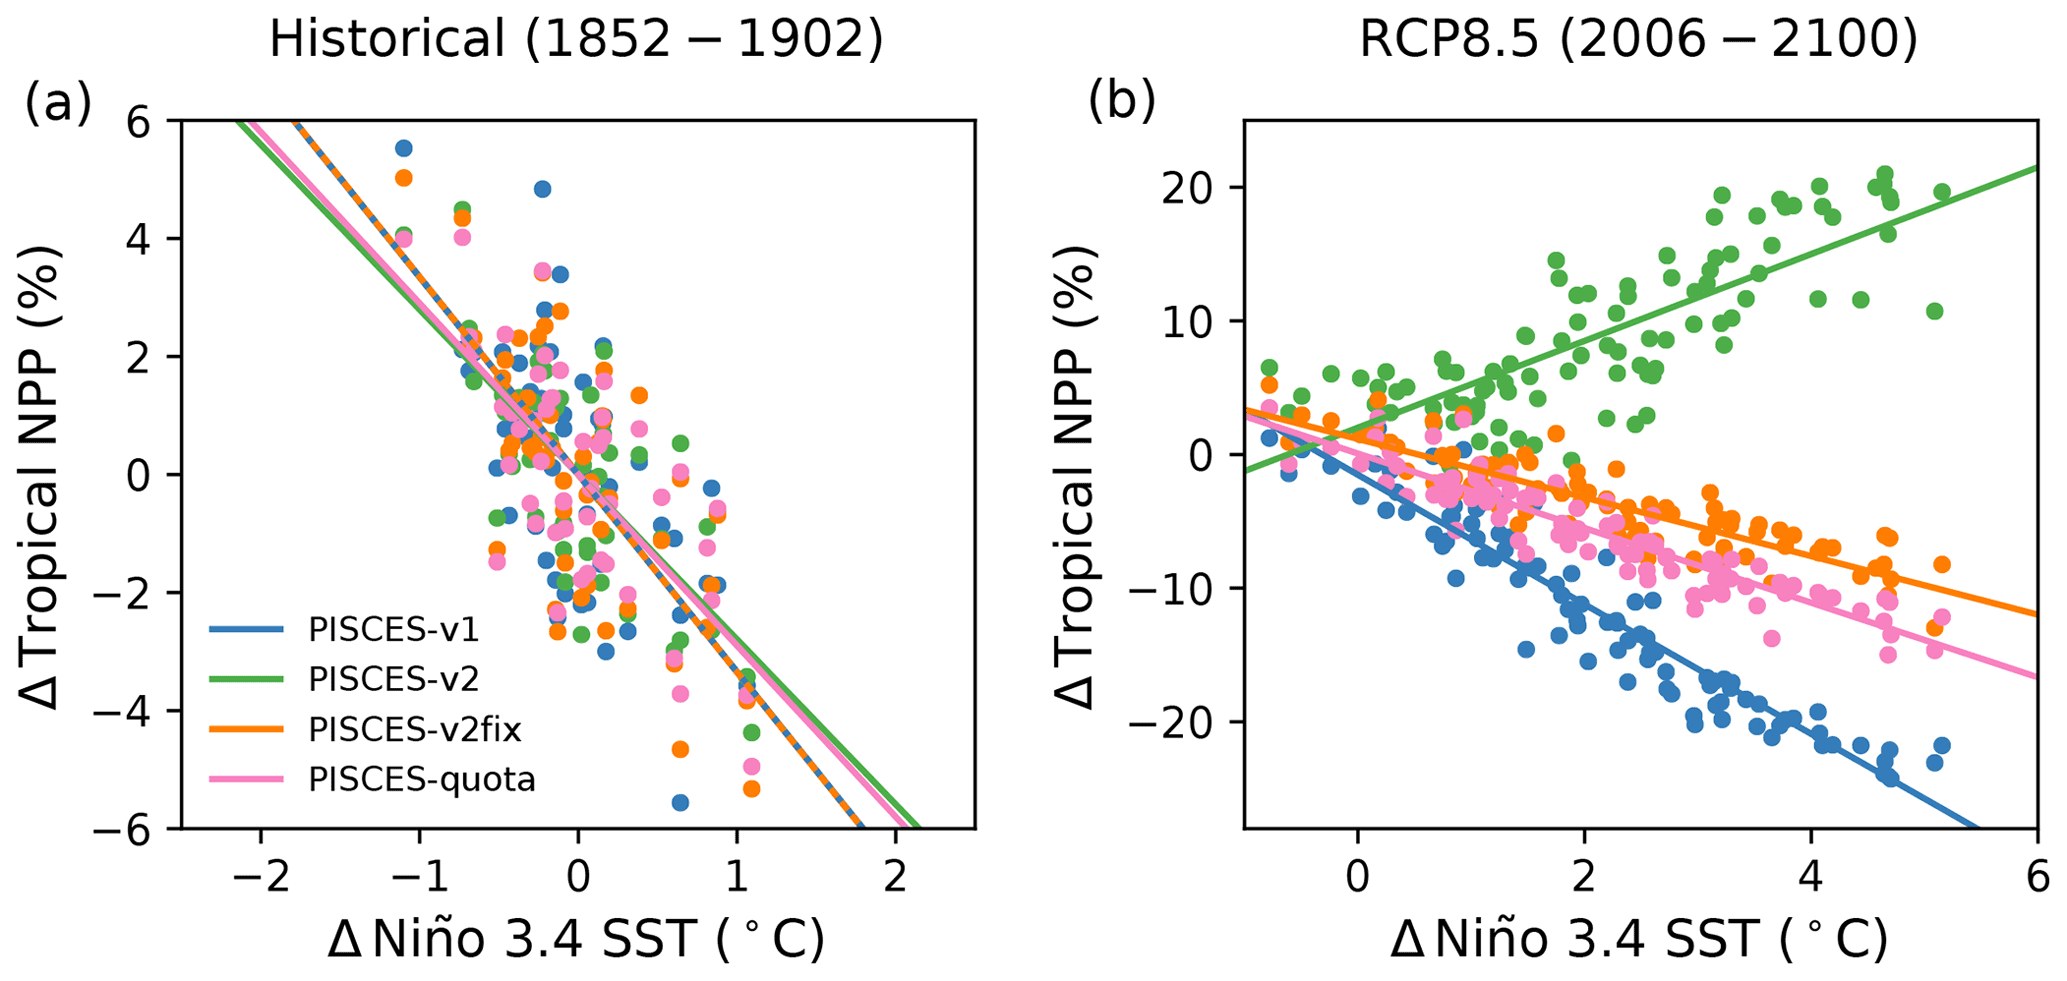
Figure 7The relationship between annual anomalies in tropical (30∘ N–30∘ S) NPP and Niño 3.4 region SST anomalies over (a) 1852–1902 for historical simulations and (b) 2006–2100 for RCP8.5 for PISCES-v1 (blue), PISCES-v2 (green), PISCES-v2fix (orange) and PISCES-quota (pink).
3.5 Implications for carbon export and ocean deoxygenation and impact on plankton biomass
The last question we explore is the potential implications of this large difference in NPP projections between IPSL-CM5A and IPSL-CM6A on (1) carbon export, (2) ocean deoxygenation and (3) impacts on plankton biomass.
Table 3Impact of climate change on organic matter export at 100 m, subsurface (100–600 m) oxygen concentrations, and phytoplankton (“Phyto”) and zooplankton (“Zoo”) biomass in the different model versions. All columns indicate absolute values for 1986–2005 and differences between 2080–2099 and 1986–2005 (relative values in parentheses).

As expected from NPP differences, the export of particulate organic matter at 100 m is strongly reduced in IPSL-CM5A (−17.1 %) at the end of the 21st century, whereas it is only slightly affected in IPSL-CM6A (−2.3 % in 2080–2099 as compared to 1986–2005) (Table 3). The same conclusions apply for the analysis of the offline simulations, with export changes reaching −19.6 %, +2.3 %, −10.9 % and −13.4 % in 2080–2099 (relative to 1986–2005) for PISCES-v1, PISCES-v2, PISCES-v2fix and PISCES-quota, respectively, in line with the already-mentioned NPP changes (−13.2 %, +13.8 %, −1.6 % and −5.7 % for the same four offline versions).
For ocean deoxygenation as well, the intensity of the subsurface signal we obtain with IPSL-CM5A and IPSL-CM6A may indeed be driven by the opposing NPP and export changes, even if the main drivers of ocean deoxygenation remain ocean warming and circulation/stratification changes. Whereas subsurface O2 concentrations only decrease by 8.2 mmol m−3 (−4.1 %) on average in IPSL-CM5A, they decrease by 17.96 mmol m−3 (−9.4 %) in IPSL-CM6A (Table 3). Spatially, the general patterns of subsurface ocean deoxygenation are similar across the two models, with the largest decreases, up to −60 mmol m−3 in 2080–2099, occurring in the North Atlantic, North Pacific and Southern Ocean (not shown). In the tropical oceans, the changes are weaker, from −20 to +20 mmol m−3 in IPSL-CM5A and from −20 to +10 mmol m−3 in IPSL-CM6A. Note that the regions where subsurface O2 concentrations increase in IPSL-CM5A, such as in the tropical Indian and Atlantic oceans, as discussed in Bopp et al. (2017), display on the contrary decreasing trends in IPSL-CM6A. We interpret this difference as due to the response to increasing NPP, increasing export of organic matter and the subsequent remineralisation-driven consumption of O2 at depth in IPSL-CM6A. An analysis of the offline simulations, all forced with the same physical fields, confirms the above hypothesis, i.e. a strong relationship between different export/NPP changes and the intensity of ocean deoxygenation in the subsurface ocean (Table 3).
Finally, the reduction in simulated plankton biomass in IPSL-CM5A (−6.7 % for phytoplankton and −14.9 % for zooplankton) is less extensive in IPSL-CM6A (−4.3 % and −10.7 % for phytoplankton and zooplankton, respectively; Table 3). It is interesting to note that despite opposite trends in projected NPP, both models simulate significant reductions in planktonic biomass and an associated trophic amplification, i.e. a larger decrease in zooplankton than phytoplankton (Lotze et al., 2019; Kwiatkowski et al., 2019). This suggests that the potential impact on projections of upper trophic levels (e.g. Tittensor et al., 2018) should not differ as much as the differences in NPP projections between IPSL-CM5A and IPSL-CM6A indicate for ecosystem models forced by biomass changes. It also implies that changes in NPP may not be a robust proxy for diagnosing the potential impact of anthropogenic climate change on marine ecosystems.
Two versions of the IPSL Climate Model (IPSL-CM5A and IPSL-CM6A) are shown to project diverging global NPP trends in the 21st century under similar high-emission scenarios because of the specificities of the diazotrophy parameterisation employed in the different versions of the marine biogeochemical component PISCES. The use of additional PISCES versions confirms the role of diazotrophy parameterisations in driving divergent NPP responses in all subtropical gyres, with increased (decreased) diazotrophy leading to increased (decreased) NPP. We identify both the thermal response and the treatment of stoichiometric N : P ratios to be of importance for the future evolution of N fixation in the future ocean. None of the PISCES versions used here perform significantly better when compared to observations or data-based reconstructions of surface nutrients, NPP and N-fixation rates. Under the same physical forcing, the divergent responses of N fixation lead to significantly different deoxygenation and changes in organic matter export at the end of the 21st century, with larger deoxygenation and weaker reduction in organic carbon export in the model version simulating a large warming-driven increase in N fixation. Despite these divergent NPP responses, all PISCES versions simulate decreasing trends of phytoplankton and zooplankton biomasses in the coming decades.
Although this study focuses on simulations performed with several versions of the same climate and marine biogeochemical models, similar conclusions have been drawn from using a series of ESMs that participated in CMIP5. Using an approach combining six CMIP5 models and proxies for historical trends of N fixation from the subtropical Pacific, Riche and Christian (2018) conclude that the environmental controls on ocean N fixation remain elusive and that future trends are therefore highly uncertain. In addition and using nine CMIP5 ESMs, Wrightson and Tagliabue (2020) demonstrate that the future evolution of nitrogen fixation is a key determinant of the future trends in NPP in the tropics. Similar analysis using the new set of CMIP6 ESMs remains to be carried out.
Ultimately, the results of this study argue for a more robust treatment of marine nitrogen fixation in ESMs used for climate projections of ecosystem services. This would suggest the need to include explicit diazotroph planktonic function groups in ESMs and to understand how differences between different nitrogen-fixing groups affect projections. For instance, the main open-ocean autotrophic diazotrophs Trichodesmium and Crocosphaera that contribute around half of total nitrogen fixation (Zehr and Capone, 2020) show variability in their thermal performance curves (Fu et al., 2014), in their nutrient requirements (Saito et al., 2011) and even in their response to changing ocean pCO2 levels (Hutchins et al., 2013). Intriguingly, it also appears that temperature may play a fundamental role, with the resource costs of nitrogen fixation strongly dependent on temperature for both groups, which implies potential increases in future N-fixation rates may arise (Yang et al., 2021). More mechanistic models of diazotrophy do include some of the above-mentioned processes (such as that of Pahlow et al., 2013, or Inomura et al., 2018), but their application has been mostly restricted to idealised settings. We currently lack an integrated assessment of how important these factors are in the context of a changing climate and the potential feedbacks on NPP.
Given the significant differences in the projections of N fixation over the 21st century that are reported here or arise from model intercomparison studies (Riche and Christian, 2018; Wrightson and Tagliabue, 2020), it is a priority to derive methods to better constrain these projections. The paucity of direct N-fixation rate measurement in the present ocean (Landolfi et al., 2018) is limiting the development of such constraints, and it is a priority to continue collecting such high-quality data to be able to extract significant temporal trends of N fixation to be compared to model output. Other approaches, such as the use of water column nitrogen isotopes (Buchanan et al., 2021) or marine sediment cores to reconstruct past trends in N fixation in contrasted regions of the world ocean (e.g. Sherwood et al., 2014), will offer new opportunities to constrain the modelled projections.

Figure A1Mechanisms explaining the contrasting response of N fixation across the different PISCES versions. (a) Regions where IPSL-CM5A and IPSL-CM6A simulate an N-fixation response of opposing sign (red) and where the detailed analysis is performed (175–205∘ E, 15–25∘ N; black box). (b) N fixation (molN m−3 yr−1) in the different PISCES versions. (c) Sea surface temperature (∘C) in IPSL-CM5A and (d) relative change in surface LT (no unit) for PISCES-v1 (blue) and PISCES-v2 (green) and PISCES-v2fix (orange) and PISCES-quota (pink). (e) Surface NO3 concentration (mmol m−3), (f) surface LN (no unit), (g) surface PO4 concentration (mmol m−3) and (f) surface N* (mmol m−3) in all PISCES versions. All (from b to h) are annual-mean time series averaged over 175–205∘ E and 15–25∘ N.
NEMO is released under the terms of the CeCILL licence. The standard NEMO-PISCES version (PISCES-v2; Aumont et al., 2015) used in this study is accessible through http://forge.ipsl.jussieu.fr/igcmg_doc/wiki/Doc/Config/NEMO. The other PISCES versions are available on request from the corresponding author.
The Earth system model output used in this study (for IPSL-CM5A-LR and IPSL-CM6A-LR) is available via the Earth System Grid Federation (https://esgf-node.ipsl.upmc.fr/projects/esgf-ipsl/, last access: July 2022; IPSL-CM6A-LR, https://doi.org/10.22033/ESGF/CMIP6.5271, Boucher et al., 2019).
LB conceived the study. LB, LK, LD, CC and RS processed model outputs and performed the analysis. OA and CE are the main contributors of the developments of the ocean biogeochemical models used here. All authors (LB, OA, LK, CC, LD, CE, TG, RS and AT) contributed to the manuscript text with initial contributions from LB, LK and AT.
Laurent Bopp has received research funding from the company Chanel under the Chaire de Recherche ENS-Chanel.
Publisher’s note: Copernicus Publications remains neutral with regard to jurisdictional claims in published maps and institutional affiliations.
The CMIP6 project at IPSL used the HPC resources of TGCC under the allocations 2016-A0030107732, 2017-R0040110492 and 2018-R0040110492 (project gencmip6) provided by GENCI (Grand Équipement National de Calcul Intensif). This study benefited from the ESPRI (Ensemble de Services Pour la Recherche à l'IPSL) computing and data centre (https://mesocentre.ipsl.fr, last access: July 2022), which is supported by CNRS, Sorbonne Université, École Polytechnique and CNES and through national and international grants. All authors acknowledge support from the French ANR project CIGOEF (grant ANR-17-CE32-0008-01). The authors also acknowledge support from the European Union's Horizon 2020 research and innovation programmes CRESCENDO (grant agreement no. 641816), COMFORT (grant agreement no. 820989), 4C (grant agreement no. 821003) and ESM2025 (grant agreement no. 101003536). Laurent Bopp received funding from the Chaire de Recherche ENS-Chanel. AT received funding from the European Research Council (ERC) under the European Union's Horizon 2020 research and innovation programme (grant agreement no. 724289).
This research has been supported by the Agence Nationale de la Recherche (CIGOEF (grant no. ANR-17-CE32-0008-01)) and the Horizon Europe framework programme, Horizon Europe Climate, Energy and Mobility (CRESCENDO (grant no. 641816), COMFORT (grant no. 820989), 4C (grant no. 821003), ESM2025 (grant no. 101003536) and BYONIC (grant no. 724289)).
This paper was edited by Carolin Löscher and reviewed by two anonymous referees.
Allen, M. R. and Ingram, W. J.: Constraints on future changes in climate and the hydrologic cycle, Nature, 419, 228–232, https://doi.org/10.1038/nature01092, 2002.
Aumont, O. and Bopp, L.: Globalizing results from ocean in situ iron fertilization studies, Global Biogeochem. Cy., 20, GB2017, https://doi.org/10.1029/2005GB002591, 2006.
Aumont, O., Bopp, L., and Schulz, M.: What does temporal variability in aeolian dust deposition contribute to sea-surface iron and chlorophyll distributions?, Geophys. Res. Lett., 35, L07607, https://doi.org/10.1029/2007GL031131, 2008.
Aumont, O., Ethé, C., Tagliabue, A., Bopp, L., and Gehlen, M.: PISCES-v2: an ocean biogeochemical model for carbon and ecosystem studies, Geosci. Model Dev., 8, 2465–2513, https://doi.org/10.5194/gmd-8-2465-2015, 2015 (code available at: http://forge.ipsl.jussieu.fr/igcmg_doc/wiki/Doc/Config/NEMO, last access: July 2022).
Behrenfeld, M. J., Boss, E., Siegel, D. A., and Shea, D. M.: Carbon-based ocean productivity and phytoplankton physiology from space, Global Biogeochem. Cy., 19, GB1006, https://doi.org/10.1029/2004GB002299, 2005.
Benavides, M., Martias, C., Elifantz, H., Berman-Frank, I., Dupouy, C., and Bonnet, S.: Dissolved Organic Matter Influences N2 Fixation in the New Caledonian Lagoon (Western Tropical South Pacific), Front. Mar. Sci., 5, 89, https://doi.org/10.3389/fmars.2018.00089, 2018.
Benedetti, F., Vogt, M., Elizondo, U. H., Righetti, D., Zimmermann, N. E., and Gruber, N.: Major restructuring of marine plankton assemblages under global warming, Nat. Commun., 12, 5226, https://doi.org/10.1038/s41467-021-25385-x, 2021.
Bindoff, N. L., Cheung, W. W. L., Kairo, J. G., Arístegui, J., Guinder, V. A., Hallberg, R., Hilmi, N., Jiao, N., Karim, M. S., Levin, L., O'Donoghue, S., Purca Cuicapusa, S. R., Rinkevich, B., Suga, T., Tagliabue, A., and Williamson, P.: Changing Ocean, Marine Ecosystems, and Dependent Communities, in: IPCC Special Report on the Ocean and Cryosphere in a Changing Climate edited by: Pörtner, H.-O., Roberts, D. C., Masson-Delmotte, V., Zhai, P., Tignor, M., Poloczanska, E., Mintenbeck, K., Alegría, A., Nicolai, M., Okem, A., Petzold, J., Rama, B., and Weyer, N. M., Cambridge University Press, Cambridge, UK and New York, NY, USA, 447–587, https://doi.org/10.1017/9781009157964.007, 2019.
Bopp, L., Monfray, P., Aumont, O., Dufresne, J.-L., Treut, H. L., Madec, G., Terray, L., and Orr, J. C.: Potential impact of climate change on marine export production, Global Biogeochem. Cy., 15, 81–99, https://doi.org/10.1029/1999GB001256, 2001.
Bopp, L., Resplandy, L., Orr, J. C., Doney, S. C., Dunne, J. P., Gehlen, M., Halloran, P., Heinze, C., Ilyina, T., Séférian, R., Tjiputra, J., and Vichi, M.: Multiple stressors of ocean ecosystems in the 21st century: projections with CMIP5 models, Biogeosciences, 10, 6225–6245, https://doi.org/10.5194/bg-10-6225-2013, 2013.
Bopp, L., Resplandy, L., Untersee, A., Mezo, P. L., and Kageyama, M.: Ocean (de)oxygenation from the Last Glacial Maximum to the twenty-first century: insights from Earth System models, Philos. T. R. Soc. A, 375, 20160323, https://doi.org/10.1098/rsta.2016.0323, 2017.
Boucher, O., Denvil, S., Caubel, A., and Foujols, M. A.: IPSL IPSL-CM6A-LR model output prepared for CMIP6 ScenarioMIP ssp585, Earth System Grid Federation [data set], https://doi.org/10.22033/ESGF/CMIP6.5271, 2019.
Boucher, O., Servonnat, J., Albright, A. L., Aumont, O., Balkanski, Y., Bastrikov, V., Bekki, S., Bonnet, R., Bony, S., Bopp, L., Braconnot, P., Brockmann, P., Cadule, P., Caubel, A., Cheruy, F., Codron, F., Cozic, A., Cugnet, D., D'Andrea, F., Davini, P., Lavergne, C. de, Denvil, S., Deshayes, J., Devilliers, M., Ducharne, A., Dufresne, J.-L., Dupont, E., Éthé, C., Fairhead, L., Falletti, L., Flavoni, S., Foujols, M.-A., Gardoll, S., Gastineau, G., Ghattas, J., Grandpeix, J.-Y., Guenet, B., Guez, L., E., Guilyardi, E., Guimberteau, M., Hauglustaine, D., Hourdin, F., Idelkadi, A., Joussaume, S., Kageyama, M., Khodri, M., Krinner, G., Lebas, N., Levavasseur, G., Lévy, C., Li, L., Lott, F., Lurton, T., Luyssaert, S., Madec, G., Madeleine, J.-B., Maignan, F., Marchand, M., Marti, O., Mellul, L., Meurdesoif, Y., Mignot, J., Musat, I., Ottlé, C., Peylin, P., Planton, Y., Polcher, J., Rio, C., Rochetin, N., Rousset, C., Sepulchre, P., Sima, A., Swingedouw, D., Thiéblemont, R., Traore, A. K., Vancoppenolle, M., Vial, J., Vialard, J., Viovy, N., and Vuichard, N.: Presentation and Evaluation of the IPSL-CM6A-LR Climate Model, J. Adv. Model. Earth Sy., 12, e2019MS002010, https://doi.org/10.1029/2019MS002010, 2020.
Breitbarth, E., Oschlies, A., and LaRoche, J.: Physiological constraints on the global distribution of Trichodesmium – effect of temperature on diazotrophy, Biogeosciences, 4, 53–61, https://doi.org/10.5194/bg-4-53-2007, 2007.
Buchanan, P. J., Aumont, O., Bopp, L., Mahaffey, C., and Tagliabue, A.: Impact of intensifying nitrogen limitation on ocean net primary production is fingerprinted by nitrogen isotopes, Nat. Commun., 12, 6214, https://doi.org/10.1038/s41467-021-26552-w, 2021.
Cabré, A., Marinov, I., and Leung, S.: Consistent global responses of marine ecosystems to future climate change across the IPCC AR5 earth system models, Clim. Dynam., 45, 1253–1280, https://doi.org/10.1007/s00382-014-2374-3, 2015.
Caldwell, P. M., Zelinka, M. D., and Klein, S. A.: Evaluating Emergent Constraints on Equilibrium Climate Sensitivity, J. Climate, 31, 3921–3942, https://doi.org/10.1175/JCLI-D-17-0631.1, 2018.
Cheung, W. W. L., Lam, V. W. Y., Sarmiento, J. L., Kearney, K., Watson, R., Zeller, D., and Pauly, D.: Large-scale redistribution of maximum fisheries catch potential in the global ocean under climate change, Glob. Change Biol., 16, 24–35, https://doi.org/10.1111/j.1365-2486.2009.01995.x, 2010.
Cotner Jr., J. B. and Wetzel, R. G.: Uptake of dissolved inorganic and organic bphosphorus compounds by phytoplankton and bacterioplankton, Limnol. Oceanogr., 37, 232–243, https://doi.org/10.4319/lo.1992.37.2.0232, 1992.
Cox, P. M., Pearson, D., Booth, B. B., Friedlingstein, P., Huntingford, C., Jones, C. D., and Luke, C. M.: Sensitivity of tropical carbon to climate change constrained by carbon dioxide variability, Nature, 494, 341–344, https://doi.org/10.1038/nature11882, 2013.
DeAngelis, A. M., Qu, X., and Hall, A.: Importance of vegetation processes for model spread in the fast precipitation response to CO2 forcing, Geophys. Res. Lett., 43, 12550–12559, https://doi.org/10.1002/2016GL071392, 2016.
Doney, S. C.: Oceanography: Plankton in a warmer world, Oceanography, 444, 695–696, https://doi.org/10.1038/444695a, 2006.
Dufresne, J.-L., Foujols, M.-A., Denvil, S., Caubel, A., Marti, O., Aumont, O., Balkanski, Y., Bekki, S., Bellenger, H., Benshila, R., Bony, S., Bopp, L., Braconnot, P., Brockmann, P., Cadule, P., Cheruy, F., Codron, F., Cozic, A., Cugnet, D., de Noblet, N., Duvel, J.-P., Ethé, C., Fairhead, L., Fichefet, T., Flavoni, S., Friedlingstein, P., Grandpeix, J.-Y., Guez, L., Guilyardi, E., Hauglustaine, D., Hourdin, F., Idelkadi, A., Ghattas, J., Joussaume, S., Kageyama, M., Krinner, G., Labetoulle, S., Lahellec, A., Lefebvre, M.-P., Lefevre, F., Levy, C., Li, Z. X., Lloyd, J., Lott, F., Madec, G., Mancip, M., Marchand, M., Masson, S., Meurdesoif, Y., Mignot, J., Musat, I., Parouty, S., Polcher, J., Rio, C., Schulz, M., Swingedouw, D., Szopa, S., Talandier, C., Terray, P., Viovy, N., and Vuichard, N.: Climate change projections using the IPSL-CM5 Earth System Model: from CMIP3 to CMIP5, Clim. Dynam., 40, 2123–2165, https://doi.org/10.1007/s00382-012-1636-1, 2013.
Dutkiewicz, S., Morris, J. J., Follows, M. J., Scott, J., Levitan, O., Dyhrman, S. T., and Berman-Frank, I.: Impact of ocean acidification on the structure of future phytoplankton communities, Nat. Clim. Change, 5, 1002–1006, https://doi.org/10.1038/nclimate2722, 2015.
Eyring, V., Bony, S., Meehl, G. A., Senior, C. A., Stevens, B., Stouffer, R. J., and Taylor, K. E.: Overview of the Coupled Model Intercomparison Project Phase 6 (CMIP6) experimental design and organization, Geosci. Model Dev., 9, 1937–1958, https://doi.org/10.5194/gmd-9-1937-2016, 2016.
Field, C. B., Behrenfeld, M. J., Randerson, J. T., and Falkowski, P.: Primary Production of the Biosphere: Integrating Terrestrial and Oceanic Components, Science, 281, 237–240, https://doi.org/10.1126/science.281.5374.237, 1998.
Forster, P. M., Maycock, A. C., McKenna, C. M., and Smith, C. J.: Latest climate models confirm need for urgent mitigation, Nat. Clim. Change, 10, 7–10, https://doi.org/10.1038/s41558-019-0660-0, 2019.
Frölicher, T. L., Rodgers, K. B., Stock, C. A., and Cheung, W. W. L.: Sources of uncertainties in 21st century projections of potential ocean ecosystem stressors, Global Biogeochem. Cy., 30, 2015GB005338, https://doi.org/10.1002/2015GB005338, 2016.
Fu, F.-X., Yu, E., Garcia, N. S., Gale, J., Luo, Y., Webb, E. A., and Hutchins, D. A.: Differing responses of marine N2 fixers to warming and consequences for future diazotroph community structure, Aquat. Microb. Ecol., 72, 33–46, https://doi.org/10.3354/ame01683, 2014.
Garcia, H. E., Locarnini, R. A., Boyer, T. P., Antonov, J. I., Baranova, O. K., Zweng, M. M., Reagan, J. R., Johnson, D. R., Mishonov, A. V., and Levitus, S.: World ocean atlas 2013, Vol. 4, Dissolved inorganic nutrients (phosphate, nitrate, silicate), NOAA atlas NESDIS, 76, https://doi.org/10.7289/V5J67DWD, 2013.
Goris, N., Tjiputra, J. F., Olsen, A., Schwinger, J., Lauvset, S. K., and Jeansson, E.: Constraining Projection-Based Estimates of the Future North Atlantic Carbon Uptake, J. Climate, 31, 3959–3978, https://doi.org/10.1175/JCLI-D-17-0564.1, 2018.
Gradoville, M. R., Bombar, D., Crump, B. C., Letelier, R. M., Zehr, J. P., and White, A. E.: Diversity and activity of nitrogen-fixing communities across ocean basins, 62, 1895–1909, https://doi.org/10.1002/lno.10542, 2017.
Gruber, N. and Galloway, J. N.: An Earth-system perspective of the global nitrogen cycle, Nature, 451, 293–296, https://doi.org/10.1038/nature06592, 2008.
Hall, A. and Qu, X.: Using the current seasonal cycle to constrain snow albedo feedback in future climate change, Geophys. Res. Lett., 33, L03502, https://doi.org/10.1029/2005GL025127, 2006.
Hall, A., Cox, P., Huntingford, C., and Klein, S.: Progressing emergent constraints on future climate change, Nat. Clim. Chang., 9, 269–278, https://doi.org/10.1038/s41558-019-0436-6, 2019.
Hegglin, M., Kinnison, D., Lamarque, J.-F.: CCMI nitrogen surface fluxes in support of CMIP6 – version 2.0. Earth System Grid Federation [data set], https://doi.org/10.22033/ESGF/input4MIPs.1125, 2016.
Hourdin, F., Foujols, M.-A., Codron, F., Guemas, V., Dufresne, J.-L., Bony, S., Denvil, S., Guez, L., Lott, F., Ghattas, J., Braconnot, P., Marti, O., Meurdesoif, Y., and Bopp, L.: Impact of the LMDZ atmospheric grid configuration on the climate and sensitivity of the IPSL-CM5A coupled model, Clim. Dynam., 40, 2167–2192, https://doi.org/10.1007/s00382-012-1411-3, 2013.
Hourdin, F., Rio, C., Grandpeix, J.-Y., Madeleine, J.-B., Cheruy, F., Rochetin, N., Jam, A., Musat, I., Idelkadi, A., Fairhead, L., Foujols, M.-A., Mellul, L., Traore, A.-K., Dufresne, J.-L., Boucher, O., Lefebvre, M.-P., Millour, E., Vignon, E., Jouhaud, J., Diallo, F. B., Lott, F., Gastineau, G., Caubel, A., Meurdesoif, Y., and Ghattas, J.: LMDZ6A: The Atmospheric Component of the IPSL Climate Model With Improved and Better Tuned Physics, J. Adv. Model. Earth Sy., 12, e2019MS001892, https://doi.org/10.1029/2019MS001892, 2020.
Hutchins, D. A., Fu, F.-X., Webb, E. A., Walworth, N., and Tagliabue, A.: Taxon-specific response of marine nitrogen fixers to elevated carbon dioxide concentrations, Nat. Geosci., 6, 790–795, https://doi.org/10.1038/ngeo1858, 2013.
Ibarbalz, F. M., Henry, N., Brandão, M. C., Martini, S., Busseni, G., Byrne, H., Coelho, L. P., Endo, H., Gasol, J. M., Gregory, A. C., Mahé, F., Rigonato, J., Royo-Llonch, M., Salazar, G., Sanz-Sáez, I., Scalco, E., Soviadan, D., Zayed, A. A., Zingone, A., Labadie, K., Ferland, J., Marec, C., Kandels, S., Picheral, M., Dimier, C., Poulain, J., Pisarev, S., Carmichael, M., Pesant, S., Acinas, S. G., Babin, M., Bork, P., Boss, E., Bowler, C., Cochrane, G., Vargas, C. de, Follows, M., Gorsky, G., Grimsley, N., Guidi, L., Hingamp, P., Iudicone, D., Jaillon, O., Kandels, S., Karp-Boss, L., Karsenti, E., Not, F., Ogata, H., Pesant, S., Poulton, N., Raes, J., Sardet, C., Speich, S., Stemmann, L., Sullivan, M. B., Sunagawa, S., Wincker, P., Babin, M., Boss, E., Iudicone, D., Jaillon, O., Acinas, S. G., Ogata, H., Pelletier, E., Stemmann, L., Sullivan, M. B., Sunagawa, S., Bopp, L., Vargas, C. de, Karp-Boss, L., Wincker, P., Lombard, F., Bowler, C., and Zinger, L.: Global Trends in Marine Plankton Diversity across Kingdoms of Life, Cell, 179, 1084–1097, https://doi.org/10.1016/j.cell.2019.10.008, 2019.
IPBES: Global assessment report of the Intergovernmental Science-Policy Platform on Biodiversity and Ecosystem Services, edited by: Díaz, S., Settele, J., Brondízio, E., and Ngo, H. T., Bonn, Germany, IPBES Secretariat: 1753, Zenodo, https://doi.org/10.5281/zenodo.3831673, 2019 (https://ipbes.net/global-assessment, last access: July 2022).
IPCC: Climate Change 2014: Impacts, Adaptation, and Vulnerability. Part A: Global and Sectoral Aspects. Contribution of Working Group II to the Fifth Assessment Report of the Intergovernmental Panel on Climate Change, edited by: Field, C. B., Barros, V. R., Dokken, D. J., Mach, K. J., Mastrandrea, M. D., Bilir, T. E., Chatterjee, M., Ebi, K. L., Estrada, Y. O., Genova, R. C., Girma, B., Kissel, E. S., Levy, A. N., MacCracken, S., Mastrandrea, P. R., and White, L. L., Cambridge University Press, Cambridge, United Kingdom and New York, NY, USA, 1132 pp., 2014.
IPCC: IPCC Special Report on the Ocean and Cryosphere in a Changing Climate, edited by: Pörtner, H.-O., Roberts, D. C., Masson-Delmotte, V., Zhai, P., Tignor, M., Poloczanska, E., Mintenbeck, K., Alegría, A., Nicolai, M., Okem, A., Petzold, J., Rama, B., and Weyer, N. M., Cambridge University Press, Cambridge, UK and New York, NY, USA, 755 pp., https://doi.org/10.1017/9781009157964, 2019.
Karl, D. M. and Church, M. J.: Microbial oceanography and the Hawaii Ocean Time-series programme, Nat. Rev. Microbiol., 12, 699–713, https://doi.org/10.1038/nrmicro3333, 2014.
Inomura, K., Bragg, J., Riemann, L., and Follows, M. J.: A quantitative model of nitrogen fixation in the presence of ammonium, PLOS ONE, 13, e0208282, https://doi.org/10.1371/journal.pone.0208282, 2018.
Kwiatkowski, L., Bopp, L., Aumont, O., Ciais, P., Cox, P. M., Laufkötter, C., Li, Y., and Séférian, R.: Emergent constraints on projections of declining primary production in the tropical oceans, Nat. Clim. Change, 7, 355–358, https://doi.org/10.1038/nclimate3265, 2017.
Kwiatkowski, L., Aumont, O., Bopp, L., and Ciais, P.: The Impact of Variable Phytoplankton Stoichiometry on Projections of Primary Production, Food Quality, and Carbon Uptake in the Global Ocean, Global Biogeochem. Cy., 32, 516–528, https://doi.org/10.1002/2017GB005799, 2018.
Kwiatkowski, L., Aumont, O., and Bopp, L.: Consistent trophic amplification of marine biomass declines under climate change, Glob. Change Biol., 25, 218–229, 2019.
Kwiatkowski, L., Torres, O., Bopp, L., Aumont, O., Chamberlain, M., Christian, J. R., Dunne, J. P., Gehlen, M., Ilyina, T., John, J. G., Lenton, A., Li, H., Lovenduski, N. S., Orr, J. C., Palmieri, J., Santana-Falcón, Y., Schwinger, J., Séférian, R., Stock, C. A., Tagliabue, A., Takano, Y., Tjiputra, J., Toyama, K., Tsujino, H., Watanabe, M., Yamamoto, A., Yool, A., and Ziehn, T.: Twenty-first century ocean warming, acidification, deoxygenation, and upper-ocean nutrient and primary production decline from CMIP6 model projections, Biogeosciences, 17, 3439–3470, https://doi.org/10.5194/bg-17-3439-2020, 2020.
Lam, V. W. Y., Cheung, W. W. L., Reygondeau, G., and Sumaila, U. R.: Projected change in global fisheries revenues under climate change, Sci. Rep.-UK, 6, 1–8, https://doi.org/10.1038/srep32607, 2016.
Landolfi, A., Kähler, P., Koeve, W., and Oschlies, A.: Global Marine N2 Fixation Estimates: From Observations to Models, Front. Microbiol., 9, 2112, https://doi.org/10.3389/fmicb.2018.02112, 2018.
Laufkötter, C., Vogt, M., Gruber, N., Aita-Noguchi, M., Aumont, O., Bopp, L., Buitenhuis, E., Doney, S. C., Dunne, J., Hashioka, T., Hauck, J., Hirata, T., John, J., Le Quéré, C., Lima, I. D., Nakano, H., Seferian, R., Totterdell, I., Vichi, M., and Völker, C.: Drivers and uncertainties of future global marine primary production in marine ecosystem models, Biogeosciences, 12, 6955–6984, https://doi.org/10.5194/bg-12-6955-2015, 2015.
Leung, S., Cabré, A., and Marinov, I.: A latitudinally banded phytoplankton response to 21st century climate change in the Southern Ocean across the CMIP5 model suite, Biogeosciences, 12, 5715–5734, https://doi.org/10.5194/bg-12-5715-2015, 2015.
Lomas, M. W., Bates, N. R., Johnson, R. J., Knap, A. H., Steinberg, D. K., and Carlson, C. A.: Two decades and counting: 24-years of sustained open ocean biogeochemical measurements in the Sargasso Sea, Deep-Sea Res. Pt. II, 93, 16–32, https://doi.org/10.1016/j.dsr2.2013.01.008, 2013.
Lotze, H. K., Tittensor, D. P., Bryndum-Buchholz, A., Eddy, T. D., Cheung, W. W. L., Galbraith, E. D., Barange, M., Barrier, N., Bianchi, D., Blanchard, J. L., Bopp, L., Büchner, M., Bulman, C. M., Carozza, D. A., Christensen, V., Coll, M., Dunne, J. P., Fulton, E. A., Jennings, S., Jones, M. C., Mackinson, S., Maury, O., Niiranen, S., Oliveros-Ramos, R., Roy, T., Fernandes, J. A., Schewe, J., Shin, Y.-J., Silva, T. A. M., Steenbeek, J., Stock, C. A., Verley, P., Volkholz, J., Walker, N. D., and Worm, B.: Global ensemble projections reveal trophic amplification of ocean biomass declines with climate change, P. Natl. Acad. Sci. USA, 116, 12907–12912, https://doi.org/10.1073/pnas.1900194116, 2019.
Luo, Y.-W., Lima, I. D., Karl, D. M., Deutsch, C. A., and Doney, S. C.: Data-based assessment of environmental controls on global marine nitrogen fixation, Biogeosciences, 11, 691–708, https://doi.org/10.5194/bg-11-691-2014, 2014.
Madec, G., Bourdallé-Badie, R., Bouttier, P.-A., Bricaud, C., Bruciaferri, D., Calvert, D., Chanut, J., Clementi, E., Coward, A., Delrosso, D., Ethé, C., Flavoni, S., Graham, T., Harle, J., Iovino, D., Lea, D., Lévy, C., Lovato, T., Martin, N., Masson, S., Mocavero, S., Paul, J., Rousset, C., Storkey, D., Storto, A., and Vancoppenolle, M.: NEMO ocean engine, Zenodo, https://doi.org/10.5281/zenodo.1472492, 2017.
Mayorga, E., Seitzinger, S. P., Harrison, J. A., Dumont, E., Beusen, A. H. W., Bouwman, A. F., Fekete, B. M., Kroeze, C., and Van Drecht, G.: Global Nutrient Export from WaterSheds 2 (NEWS 2): Model development and implementation, Environ. Modell. Softw., 25, 837–853, https://doi.org/10.1016/j.envsoft.2010.01.007, 2010.
O'Gorman, P. A.: Sensitivity of tropical precipitation extremes to climate change, Nat. Geosci., 5, 697–700, https://doi.org/10.1038/ngeo1568, 2012.
Orchard, E. D., Benitez-Nelson, C. R., Pellechia, P. J., Lomas, M. W., and Dyhrman, S. T.: Polyphosphate in Trichodesmium from the low-phosphorus Sargasso Sea, Limnol. Oceanogr., 55, 2161–2169, https://doi.org/10.4319/lo.2010.55.5.2161, 2010.
Pahlow, M., Dietze, H., and Oschlies, A.: Optimality-based model of phytoplankton growth and diazotrophy, Mar. Ecol.-Prog. Ser., 489, 1–16, https://doi.org/10.3354/meps10449, 2013.
Pauly, D. and Christensen, V.: Primary production required to sustain global fisheries, Nature, 374, 255–257, https://doi.org/10.1038/374255a0, 1995.
Paytan, A. and McLaughlin, K.: The Oceanic Phosphorus Cycle, Chem. Rev., 107, 563–576, https://doi.org/10.1021/cr0503613, 2007.
Riche, O. G. J. and Christian, J. R.: Ocean dinitrogen fixation and its potential effects on ocean primary production in Earth system model simulations of anthropogenic warming, Elementa, 6, 16, https://doi.org/10.1525/elementa.277, 2018.
Rousset, C., Vancoppenolle, M., Madec, G., Fichefet, T., Flavoni, S., Barthélemy, A., Benshila, R., Chanut, J., Levy, C., Masson, S., and Vivier, F.: The Louvain-La-Neuve sea ice model LIM3.6: global and regional capabilities, Geosci. Model Dev., 8, 2991–3005, https://doi.org/10.5194/gmd-8-2991-2015, 2015.
Saito, M. A., Bertrand, E. M., Dutkiewicz, S., Bulygin, V. V., Moran, D. M., Monteiro, F. M., Follows, M. J., Valois, F. W., and Waterbury, J. B.: Iron conservation by reduction of metalloenzyme inventories in the marine diazotroph Crocosphaera watsonii, P. Natl. Acad. Sci. USA, 108, 2184–2189, https://doi.org/10.1073/pnas.1006943108, 2011.
Séférian, R., Berthet, S., Yool, A., Palmiéri, J., Bopp, L., Tagliabue, A., Kwiatkowski, L., Aumont, O., Christian, J., Dunne, J., Gehlen, M., Ilyina, T., John, J. G., Li, H., Long, M. C., Luo, J. Y., Nakano, H., Romanou, A., Schwinger, J., Stock, C., Santana-Falcón, Y., Takano, Y., Tjiputra, J., Tsujino, H., Watanabe, M., Wu, T., Wu, F., and Yamamoto, A.: Tracking Improvement in Simulated Marine Biogeochemistry Between CMIP5 and CMIP6, Curr. Clim. Change Rep., 6, 95–119, https://doi.org/10.1007/s40641-020-00160-0, 2020.
Sherwood, O. A., Guilderson, T. P., Batista, F. C., Schiff, J. T., and McCarthy, M. D.: Increasing subtropical North Pacific Ocean nitrogen fixation since the Little Ice Age, Nature, 505, 78–81, https://doi.org/10.1038/nature12784, 2014.
Sohm, J. A. and Capone, D. G.: Phosphorus dynamics of the tropical and subtropical north Atlantic: Trichodesmium spp. versus bulk plankton, Mar. Ecol.-Prog. Ser., 317, 21–28, https://doi.org/10.3354/meps317021, 2006.
Steinacher, M., Joos, F., Frölicher, T. L., Bopp, L., Cadule, P., Cocco, V., Doney, S. C., Gehlen, M., Lindsay, K., Moore, J. K., Schneider, B., and Segschneider, J.: Projected 21st century decrease in marine productivity: a multi-model analysis, Biogeosciences, 7, 979–1005, https://doi.org/10.5194/bg-7-979-2010, 2010.
Stock, C. A., John, J. G., Rykaczewski, R. R., Asch, R. G., Cheung, W. W. L., Dunne, J. P., Friedland, K. D., Lam, V. W. Y., Sarmiento, J. L., and Watson, R. A.: Reconciling fisheries catch and ocean productivity, 114, E1441–E1449, https://doi.org/10.1073/pnas.1610238114, 2017.
Tagliabue, A., Barrier, N., Du Pontavice, H., Kwiatkowski, L., Aumont, O., Bopp, L., Cheung, W. W. L., Gascuel, D., and Maury, O.: An iron cycle cascade governs the response of equatorial Pacific ecosystems to climate change, Glob. Change Biol., 26, 6168–6179, https://doi.org/10.1111/gcb.15316, 2020.
Tagliabue, A., Kwiatkowski, L., Bopp, L., Butenschön, M., Cheung, W. W. L., Lengaigne, M., and Vialard, J.: Persistent uncertainties in ocean net primary production climate change projections at regional scales raise challenges for assessing impacts on ecosystem services, Front. Clim., 3, 738224, https://doi.org/10.3389/fclim.2021.738224, 2021.
Tang, W., Li, Z., and Cassar, N.: Machine Learning Estimates of Global Marine Nitrogen Fixation, J. Geophys. Res.-Biogeo., 124, 717–730, https://doi.org/10.1029/2018JG004828, 2019.
Taucher, J. and Oschlies, A.: Can we predict the direction of marine primary production changeunder global warming?, Geophys. Res. Lett., 38, L02603, https://doi.org/10.1029/2010GL045934, 2011.
Taylor, K. E., Stouffer, R. J., and Meehl, G. A.: An overview of CMIP5 and the experiment design, B. Am. Meteorol. Soc., 93, 485–498, 2012.
Terhaar, J., Kwiatkowski, L., and Bopp, L.: Emergent constraint on Arctic Ocean acidification in the twenty-first century, Nature, 582, 379–383, https://doi.org/10.1038/s41586-020-2360-3, 2020.
Tittensor, D. P., Eddy, T. D., Lotze, H. K., Galbraith, E. D., Cheung, W., Barange, M., Blanchard, J. L., Bopp, L., Bryndum-Buchholz, A., Büchner, M., Bulman, C., Carozza, D. A., Christensen, V., Coll, M., Dunne, J. P., Fernandes, J. A., Fulton, E. A., Hobday, A. J., Huber, V., Jennings, S., Jones, M., Lehodey, P., Link, J. S., Mackinson, S., Maury, O., Niiranen, S., Oliveros-Ramos, R., Roy, T., Schewe, J., Shin, Y.-J., Silva, T., Stock, C. A., Steenbeek, J., Underwood, P. J., Volkholz, J., Watson, J. R., and Walker, N. D.: A protocol for the intercomparison of marine fishery and ecosystem models: Fish-MIP v1.0, Geosci. Model Dev., 11, 1421–1442, https://doi.org/10.5194/gmd-11-1421-2018, 2018.
Vancoppenolle, M., Bopp, L., Madec, G., Dunne, J., Ilyina, T., Halloran, P. R., and Steiner, N.: Future Arctic Ocean primary productivity from CMIP5 simulations: Uncertain outcome, but consistent mechanisms, Global Biogeochem. Cy., 27, 605–619, https://doi.org/10.1002/gbc.20055, 2013.
Wenzel, S., Cox, P. M., Eyring, V., and Friedlingstein, P.: Emergent constraints on climate-carbon cycle feedbacks in the CMIP5 Earth system models, J. Geophys. Res.-Biogeo., 119, 794–807, https://doi.org/10.1002/2013JG002591, 2014.
Wrightson, L. and Tagliabue, A.: Quantifying the Impact of Climate Change on Marine Diazotrophy: Insights From Earth System Models, Front. Mar. Sci., 7, 635, https://doi.org/10.3389/fmars.2020.00635, 2020.
Yang, N., Merkel, C. A., Lin, Y.-A., Levine, N. M., Hawco, N. J., Jiang, H.-B., Qu, P.-P., DeMers, M. A., Webb, E. A., Fu, F.-X., and Hutchins, D. A.: Warming Iron-Limited Oceans Enhance Nitrogen Fixation and Drive Biogeographic Specialization of the Globally Important Cyanobacterium Crocosphaera, Front. Mar. Sci., 8, 118, https://doi.org/10.3389/fmars.2021.628363, 2021.
Zehr, J. P. and Capone, D. G.: Changing perspectives in marine nitrogen fixation, Science, 368, eaay9514, https://doi.org/10.1126/science.aay9514, 2020.