the Creative Commons Attribution 4.0 License.
the Creative Commons Attribution 4.0 License.
 | 09 Sep 2022
Implementation and initial calibration of carbon-13 soil organic matter decomposition in the Yasso model
Laura Arppe
Hannu Fritze
Jussi Heinonsalo
Kristiina Karhu
Jari Liski
Markku Oinonen
Petra Straková
Toni Viskari
Soils account for the largest share of carbon found in terrestrial ecosystems, and their status is of considerable interest for the global carbon cycle budget and atmospheric carbon concentration. The decomposition of soil organic matter depends on environmental conditions and human activities, which raises the question of how permanent are these carbon storages under changing climate. One way to get insight into carbon decomposition processes is to analyse different carbon isotope concentrations in soil organic matter. In this paper we introduce a carbon-13-isotope-specific soil organic matter decomposition add-on into the Yasso soil carbon model and assess its functionality. The new 13C-dedicated decomposition is straightforward to implement and depends linearly on the default Yasso model parameters and the relative carbon isotope (13CC) concentration. The model modifications are based on the assumption that the heavier 13C atoms are not as reactive as 12C. The new formulations were calibrated using fractionated C, 13C and δ13 measurements from litterbags containing pine needles and woody material, which were left to decompose in natural environment for 4 years. The introduced model modifications considerably improve the model behaviour in a 100-year-long simulation, where modelled δ13 is compared against fractionated peat column carbon content. The work presented here is a proof of concept and enables 13C to be used as a natural tracer to detect changes in the underlying soil organic matter decomposition.
- Article
(1384 KB) - Full-text XML
- BibTeX
- EndNote


Earth system models (ESMs) are essential in our need to understand and examine the global carbon (C) cycle, investigate the influence of environmental and human activities on it, and simulate possible future changes. One part of these complex models is the land-surface components that, for example, describe the C stored in soils as well as the various interactions in soils and between vegetation and the atmospheric boundary layer (Ontl and Schulte, 2012). Total C residing in soils has been estimated to be roughly 3000 Pg (Köchy et al., 2015), but this estimate has large uncertainties as exact quantities are difficult to measure globally. Nevertheless, soils are the second-largest global carbon pool, after oceans. The changing climate conditions are expected to influence the processes controlling C allocation into soils and the permanence of these storage pools (Lugato et al., 2021). A simple approach to track changes in these processes and pools is to examine the ratio of carbon isotopes in, for example, soil litter input and respiration. In order to fully utilise this approach, the underlying model must be capable of reliably simulating carbon-13 isotope (13C)-related processes in the soil.
The soil C pool can be divided into different fractions based on their chemical composition, physical characteristics, or assumed turnover or residence times (Poeplau et al., 2018). Soil processes in general are complex as biological, chemical and physical drivers act simultaneously. For modelling purposes, the fate of 13C can be used to test alternative model formulations and to give valuable additional information of the optimal parameter values as the 13C signatures are sensitive indicators of changes in processes. Soil organic matter (SOM) consists of molecules with different carbon isotopes. In theory, molecules with lighter 12C atoms have lower activation (kinetic) energy requirements than those with 13C. This leads to easier decomposition of 12C-bearing compounds and enrichment of 13C in residual organic molecules (Fry, 2006). Estimating 13C in different fractions of SOM or varying residence times and adding 12CC reaction kinetics into the models would allow verification of the model functioning and improve model predictions. 13C-CO2 measurements associated with gas flux measurements provide a promising way to link soil models to ecosystem models and allow further integration to ESMs, where 13C isotopes are used to detect large-scale C-cycling patterns (Flanagan et al., 2005). Furthermore, the use of 13C as a natural tracer enables more detailed examination of underlying C-cycling processes (Drake et al., 2019; Blaser and Conrad, 2016; Steinmann et al., 2004).
Additionally, soil carbon sequestration has been a serious topic of interest for several decades as a promising method to mitigate the rising atmospheric carbon dioxide (CO2) concentrations. These types of methods aim to increase the soil carbon sink by, for example, different soil tilling (Wilman, 2011), crop rotation (Acharya et al., 2012) or fertilisation practises (Triberti et al., 2016). The fundamental problem related to C sequestration is how to demonstrate that the proposed management practice and land use change increase soil C stock size, as well as under what conditions and for how long the C will remain in the soil. The quantification of small changes in soil C stocks is challenging due to large natural variability in soils and the large standing C stock. It has been estimated that the detection of 0.1 kg C m−2 change (≈1 %) in an agricultural field in Finland where C stock size ranges between 8.4 and 9.8 kg m−2 in the top 30 cm requires hundreds of soil samples to be analysed (Heikkinen et al., 2020). For this reason, an efficient verification system based on a combination of measurements (C stock size, CO2 exchange, remote sensing, etc.) and modelling is required, and a new global vision of MRV (monitoring, reporting, verification) platform was proposed by Smith et al. (2020). An overlooked approach to improve MRV is to examine the C isotope compositions in the soil and in heterotrophic respiration. The reason behind the lack of these examinations is simple – such approaches require a model that can reliably represent the soil organic carbon (SOC) dynamics for different carbon isotopes while still retaining relatively straightforward structure. The latter is especially important when we take into account the lack of good-quality calibration and validation data.
In this paper we introduce a simple 13C isotopic circulation into the recently re-calibrated SOC model Yasso (Viskari et al., 2022, 2020; Tuomi et al., 2011). In our approach, the decomposition of 13C-specific soil organic matter (13C-SOM) is linearly dependent on the default Yasso model parameters, the carbon isotope fraction 13CC and a new scaling factor θ, which represents the change to the decomposition rate between the carbon isotopes. The underlying hypothesis behind this design is that since 13C has a larger atomic weight, it is therefore not as reactive as 12C, but environmental factors should still affect the decomposition of SOM, containing either isotope, similarly. We calibrate the new 13C-related decomposition parameters (θ) and assess the model functionality both on a short- and long-term (100-year simulation) basis.
Our aim is to improve the Yasso20 model parameterisation (Viskari et al., 2022) to include 13CC reaction kinetics in the model by using empirically measured SOM and 13C data. The purpose of this paper is to provide a proof of concept, and we hypothesise that measuring 13C in soil organic matter fractions (1) detects differences in the pool 13C content supporting the 13C-fractionation and enrichment theory and (2) allows model development for future improvements in SOM decomposition predictions as 13C can be used as a tracer to detect changes in the underlying C decomposition processes.
2.1 Measurements
The SOC measurements were derived from experiments described in Straková et al. (2012), Straková et al. (2011) and Straková et al. (2010), where different types of plant litter were left to decompose inside litterbags in a natural environment at Lakkasuo, a raised bog complex located at the Hyytiälä forestry field station of the University of Helsinki (61.8∘ N, 24.3∘ E; 150 m a.s.l.). We utilised data detailing the conditions for pine-branch- and pine-needle-specific litterbags. In addition to determining the initial states for both litter types, 14 litterbags describe the soil conditions for pine branches and 7 for pine needles at later stages of decomposition during the 4-year-long experiment.
The litter was characterised by dividing it into carbon fractions by sequential extractions and hydrolysis according to Hilasvuori et al. (2013, and references therein), also called AWEN extraction (acid, water, ethanol, non-soluble). In short, this included analysing the amounts of nonpolar extracts (corresponds to E), polar extracts (W), acid hydrolysable substances (A) and non-soluble Klason type substances (N). Air-dried litter material was ground in a mill (Fritsch) to pass the 0.5 mm sieve and weighted into a centrifuge tube (35 mL). The amount of extractables was determined through the remaining mass after shaking (2 or 18 h; 250 rpm) with the different solvents followed by filtering through glass crucibles (Robu, borosilicate 3.3, porosity 4). At the start of the extraction procedure, 0.5 g litter mass was used. Dichloromethane (CH2Cl2; 15 mL; repeated twice) was first used to remove the nonpolar extractives. A total of 0.35 g of the remaining dried (105 ∘C) solid sample was weighted again into a centrifuge tube, and hot water (80 ∘C; 15 mL) was added and kept in a water bath (80 ∘C; 18 h). After centrifugation (1500×g) the pellet was washed with 30 mL hot water to finish the extraction for polar extractives. In all cases the respective extractives were combined and dried. Evaporation was used for the nonpolar fraction, and warming (50 ∘C) followed by freeze-drying was the polar fraction. A total of 0.1 g oven-dried (105 ∘C) material from the residue left after the hot water extraction was weighted into a centrifugation tube, and 1.25 mL 72 % sulfuric acid (H2SO4) was added and shaken in room temperature (1 h; 250 rpm). Thereafter 35 mL water was added and incubated in a water bath (95 ∘C; 18 h) followed by filtration. The remaining mass (Klason lignin) was washed once with hot water (95 ∘C; 30–40 mL), and the mass was dried overnight in 105 ∘C. The subsamples for each fraction – i.e. the original litter; the solid remains after dichloromethane, water and acid extraction; and those from the evaporated nonpolar and polar extractants – were analysed for their relative 13CC ratios as δ13C values. The definition of δ13C is given below, where is the Vienna Pee Dee Belemnite (Craig, 1957, VPDB).
The isotopic composition of carbon was measured on a NC2500 elemental analyser coupled to a Thermo Scientific Delta V Plus isotope ratio mass spectrometer at the Laboratory of Chronology, Finnish Museum of Natural History. The raw isotope data were normalised with a multi-point calibration using certified isotopic reference materials (USGS-40, USGS-41, IAEA-CH3 and IAEA-CH7). The mean measured (pre-normalisation) δ13C values for calibration references were −26.52 for USGS-40, +36.19 for USGS-41, −24.88 for IAEA-CH3 and −32.27 for IAEA-CH7, with an r2 of >0.999 between measured and expected values. Replicate analyses of quality control reference materials analysed alongside the unknowns indicate a 1σ internal precision of ≤0.20. For the purpose of model calibration, all samples were scaled to represent the same amount of original matter (we use 1000 mass units of original matter – the given C and 13C values are in relation to this value).
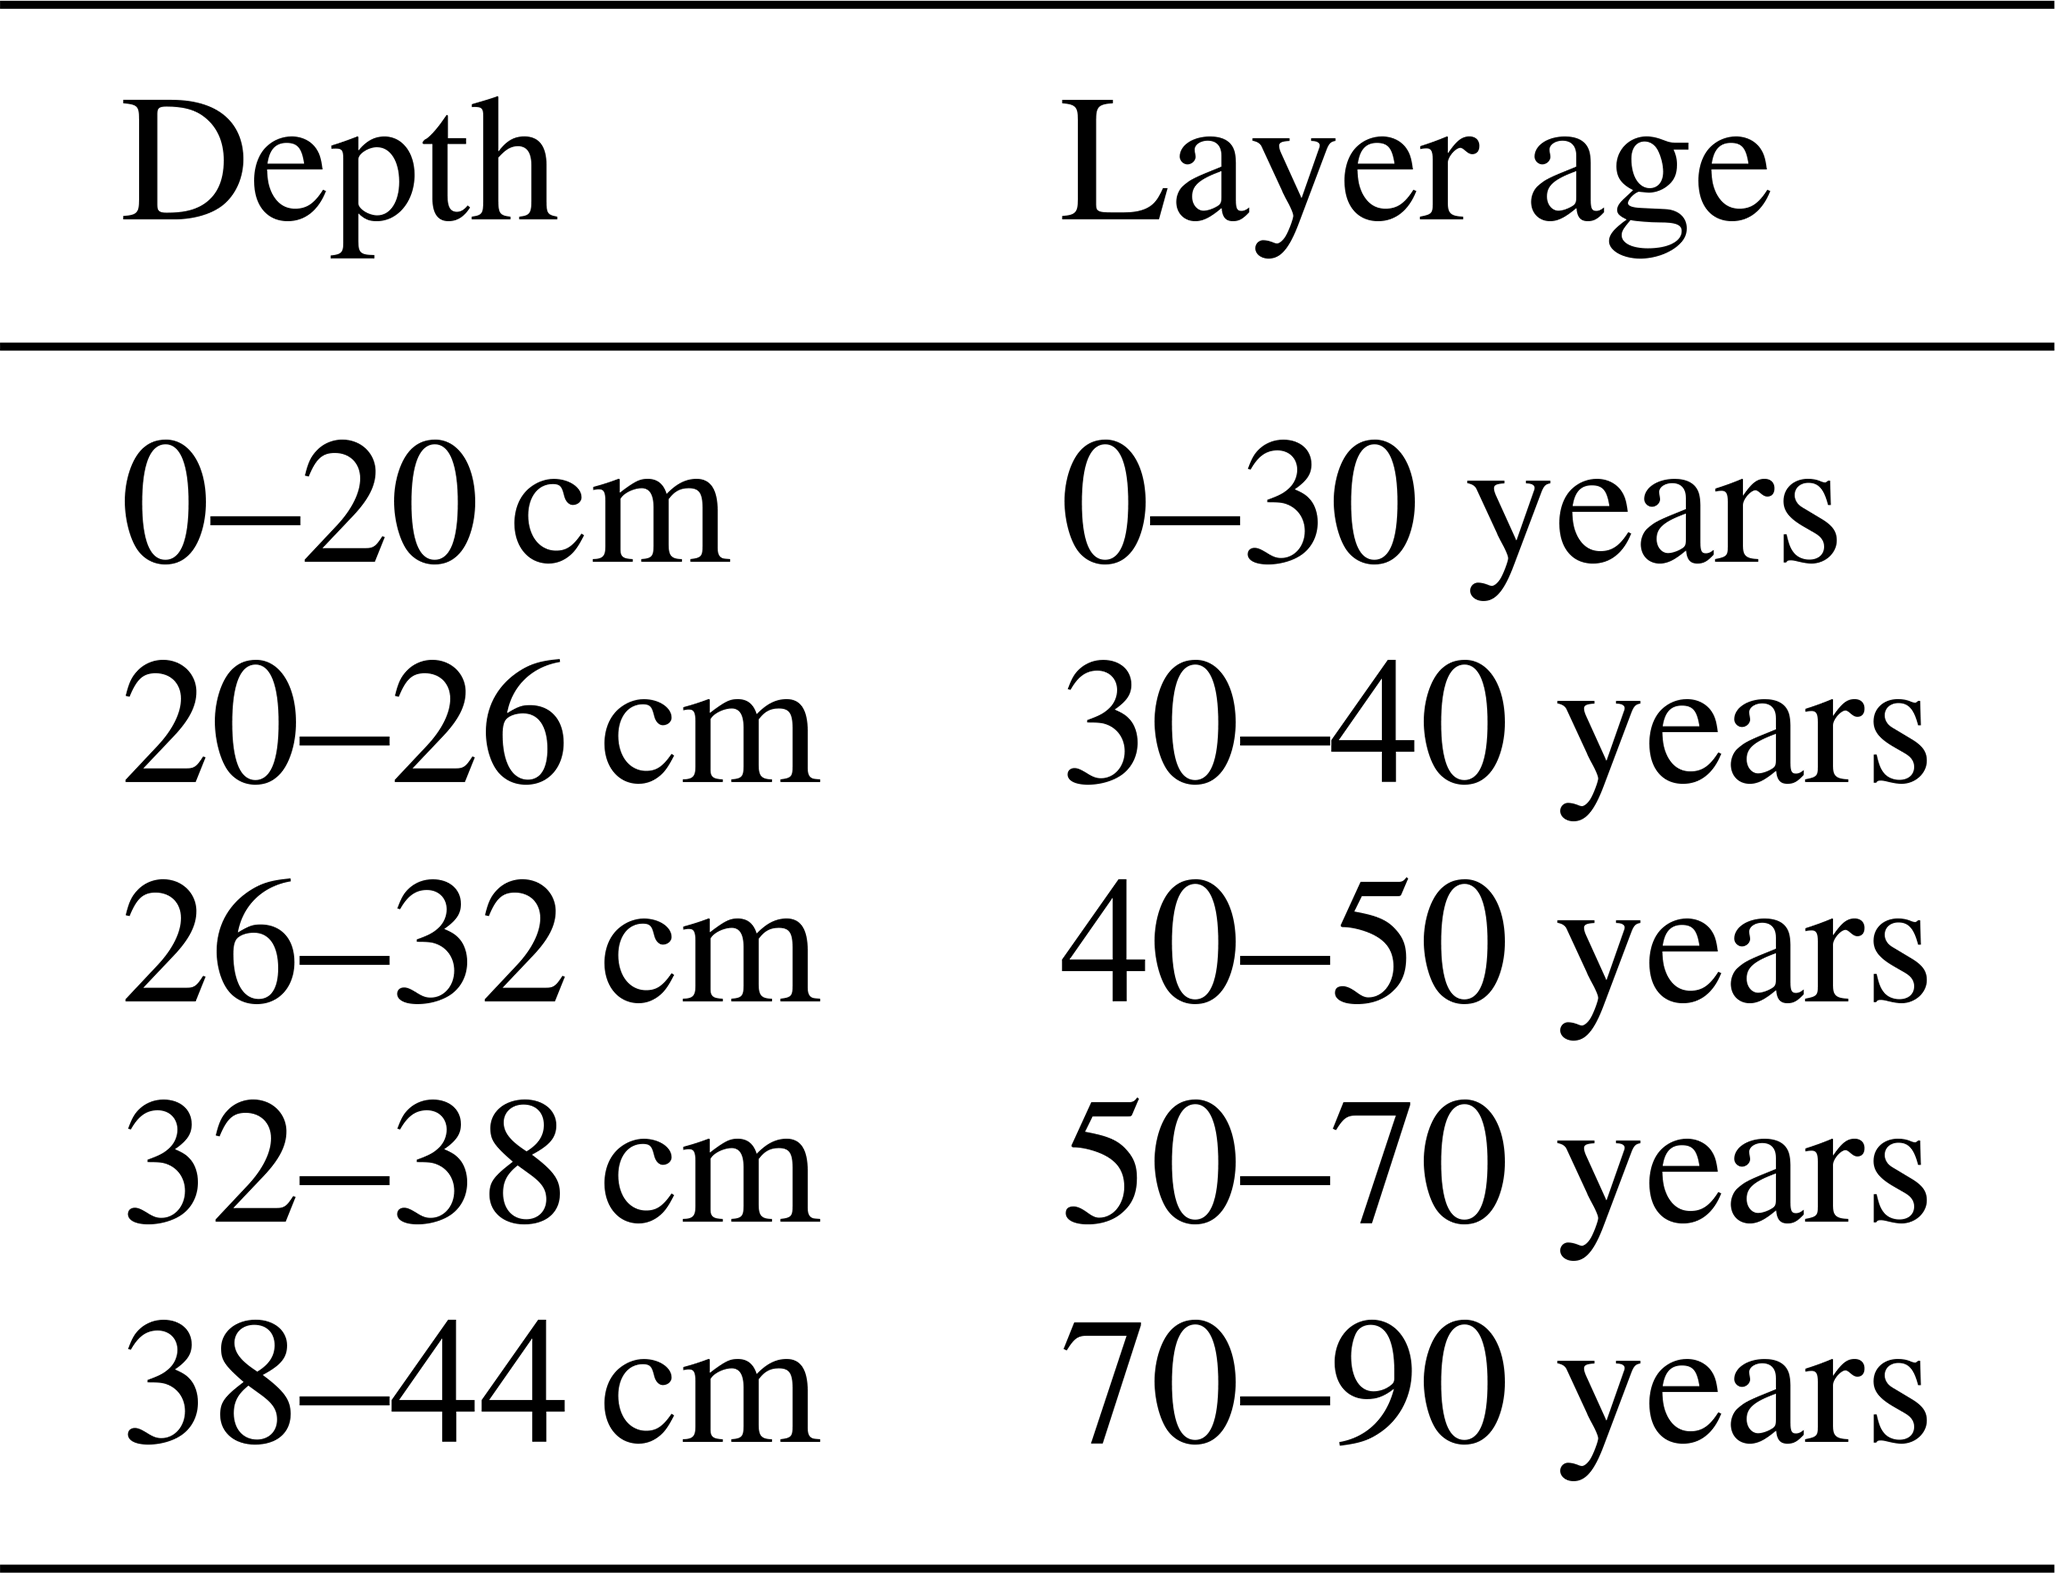
In addition to litterbag measurements, we have utilised peat profile measurements, detailed in Hilasvuori et al. (2013), to examine long-term carbon decomposition with the Yasso model. The corresponding profile is given in Table 1, and the age of the three topmost layers is based on radiocarbon signatures (Hilasvuori et al., 2013), which could not be used to accurately estimate the other two layers. We have naively set their age to 20 years each. The fractionated δ13C content of these layers is taken directly from Table 2 in (Hilasvuori et al., 2013), and their relation to the Yasso fractions will be given in the results.
Table 1Peat profile used to examine long-term carbon decomposition.
The meteorological variables required to run the Yasso model were extracted from a nearby weather station measurements (Kolari et al., 2009), located at Hyytiälä (61.85∘ N, 24.29∘ E; 180 m a.s.l.). We gathered monthly temperature and annual precipitation from the beginning of year 2005 to the end of 2008. Additionally we calculated averaged monthly temperature and averaged annual precipitation from years 2000–2014 to be used in simulating the long-term carbon decomposition.
2.2 Yasso model
The soil carbon model Yasso was originally built to simulate the soil carbon stock and changes in this stock for forest soils (Liski et al., 2005). Previous versions of the Yasso model have also been incorporated into land-surface models; see e.g. Goll et al. (2017) for Yasso implementation to JSBACH – the land-surface component of the Max Planck Institutes Earth System Model (MPI-ESM). We generate the soil carbon pools utilising a recently re-calibrated version of the model called Yasso20 (Viskari et al., 2022). This calibration utilised multiple global datasets, and we present relevant model parameter values in Appendix Table A1. We introduce a new 13C-specific decomposition into this model, which utilises new parameters (θ, explained below). When all θ≡0, both 12C and 13C use the same standard decomposition parameters; hence, we call this model the default Yasso model and the new version, with optimised θ parameters, as Yasso-C13 or optimised Yasso (Mäkelä, 2021b), when we need to make a distinction. Otherwise, both models are simply referred to as the Yasso model.
Yasso decomposes litter into different pools that represent acid, water and ethanol (A, W and E) soluble matter and a lignin-like pool (N), with all the pools having different decomposition rates. The decomposed C is released back to the atmosphere as heterotrophic respiration, shifted between the AWEN pools or transferred to inactive humus (H) pool. The model is driven with monthly temperature and annual precipitation. The SOC pool decomposition in the Yasso model can be represented by the following equation.
The state vector (xt), representing the C content in AWEN pools at time t, is calculated by operating the state transition matrix (M) on the state vector of the previous time step (xt−1) and adding litter input (bt), which in our simulations is set to zero (as we assume no litter is added into the litterbags after the beginning). The model initial state (in our simulations) is set to match the first measurements. The matrix M=FK is a product of fluxes (F) between the pools and decomposition (K). Pool-specific decomposition rates , presented in Eq. (3), are dependent on certain parameters (), base decomposition rates (αi), and functions depicting the effect of woody litter diameter (h(d)), precipitation (P) and temperature (T). See Viskari et al. (2022) for details.
We introduce 13C-SOM decomposition into the Yasso model by adding separate 13C-specific storages for each AWEN pool and including an additional 13C-specific SOM decomposition step. The input data (essentially carbon content) is first separated into 13C-specific content and the rest of the carbon. The Yasso model is first run normally as in Eq. (2), which is followed by 13C decomposition using a modified version of the pool-specific base decomposition rate:
The new coefficients replace αi in Eq. (3), which essentially introduces a dependency for the mass ratio of the carbon isotopes (13CC) as well as a free parameter θ to the Yasso model for each 13C-AWEN pool separately. We did not include a parameter for the humus pool (H) as we did not have measurements to calibrate the related parameter. Additionally, we do not include the humus pool in the bulk carbon examinations for the same reason – bulk carbon refers to the total sum of carbon in AWEN pools.
2.3 Model calibration
We calibrated the four θ parameters related to the decomposition of each AWEN pool 13C-SOM. The objective function (f) of the calibration is the cumulative squared error of the observed and modelled δ13C values:
Here the summation is taken over all AWEN pools and available litterbag measurements (with measurements indicating zero concentration for total carbon content removed from the calculations). The unnormalised (pointwise) parameter likelihood is calculated as .
Since we had only four parameters to calibrate, we produced a parameter grid by fixing an increment and giving each parameter a initial value of zero. Then we added multiple new values symmetrically around the initial value with the given increment. We ran the model with every member of the parameter grid to get an estimate of the overall shape of the parameter likelihood. This process was repeated several times with grid re-centred to the point with maximum likelihood and with readjusted (smaller) increment. The results were also verified with independent runs using different initial values. All experiments were run on a eight-core laptop utilising RStudio version 1.4.1103. We used the R interface of Yasso (see code and data availability) in addition to R.utils version 2.10.1 (no other libraries were needed).
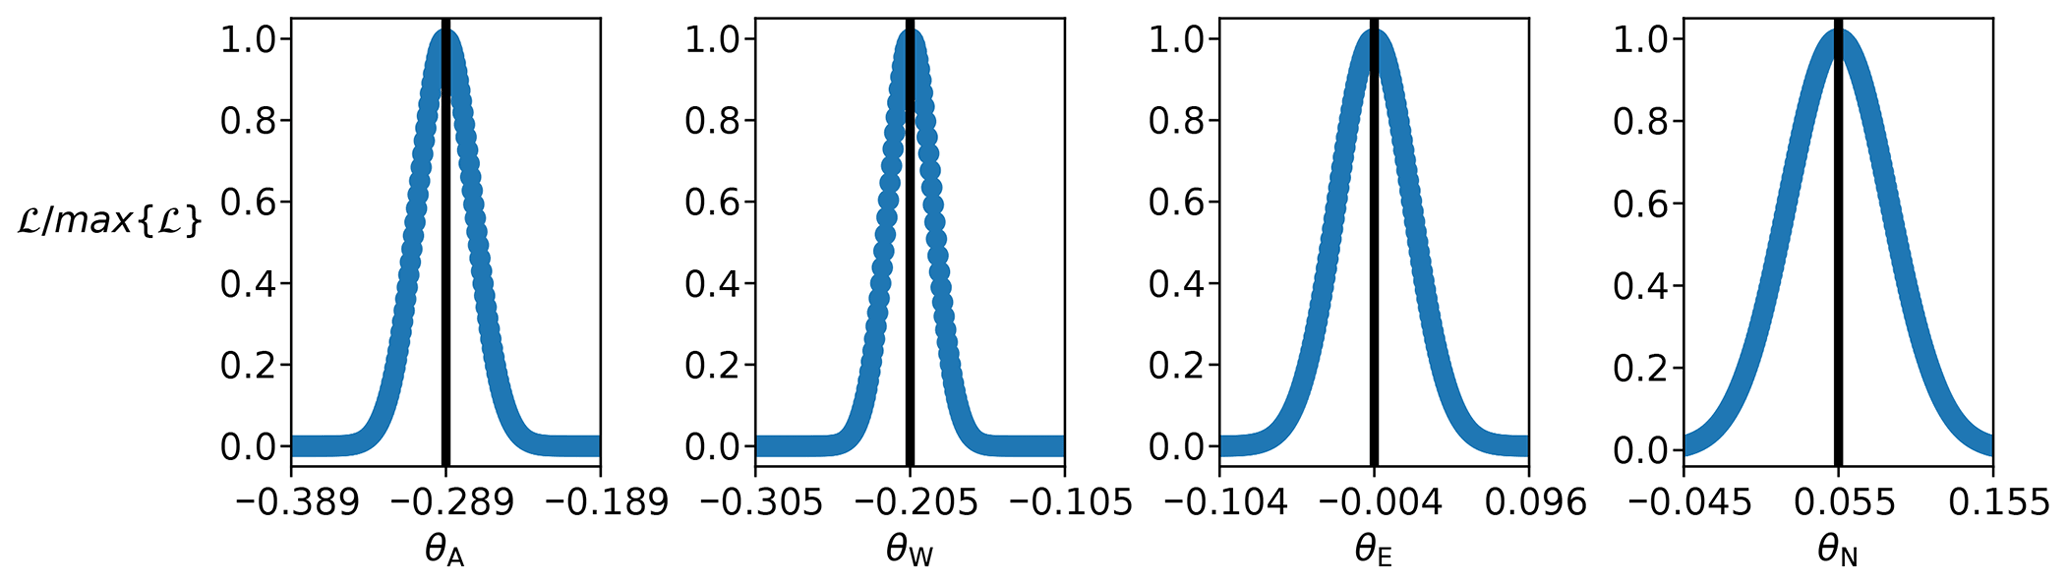
Figure 1Presented are the pointwise parameter likelihoods (when setting the other parameters at their optimal values), divided by the maximum likelihood value. The vertical lines indicate the parameter value with the highest likelihood.
The Yasso model calibration resulted in strictly unimodal parameter probability distributions (Fig. 1). This was not unexpected as each calibrated parameter could only directly affect a single AWEN pool. The optimised parameter values are , , and θN=0.055 (we also note that the precision of the calibration was left at the third decimal as likelihood values started to plateau). When we examine the parameter combinations with highest likelihoods (top 250 values), the strongest correlations (≈0.77) are present between θA and θW, θA, and θN, as well as θW and θN.
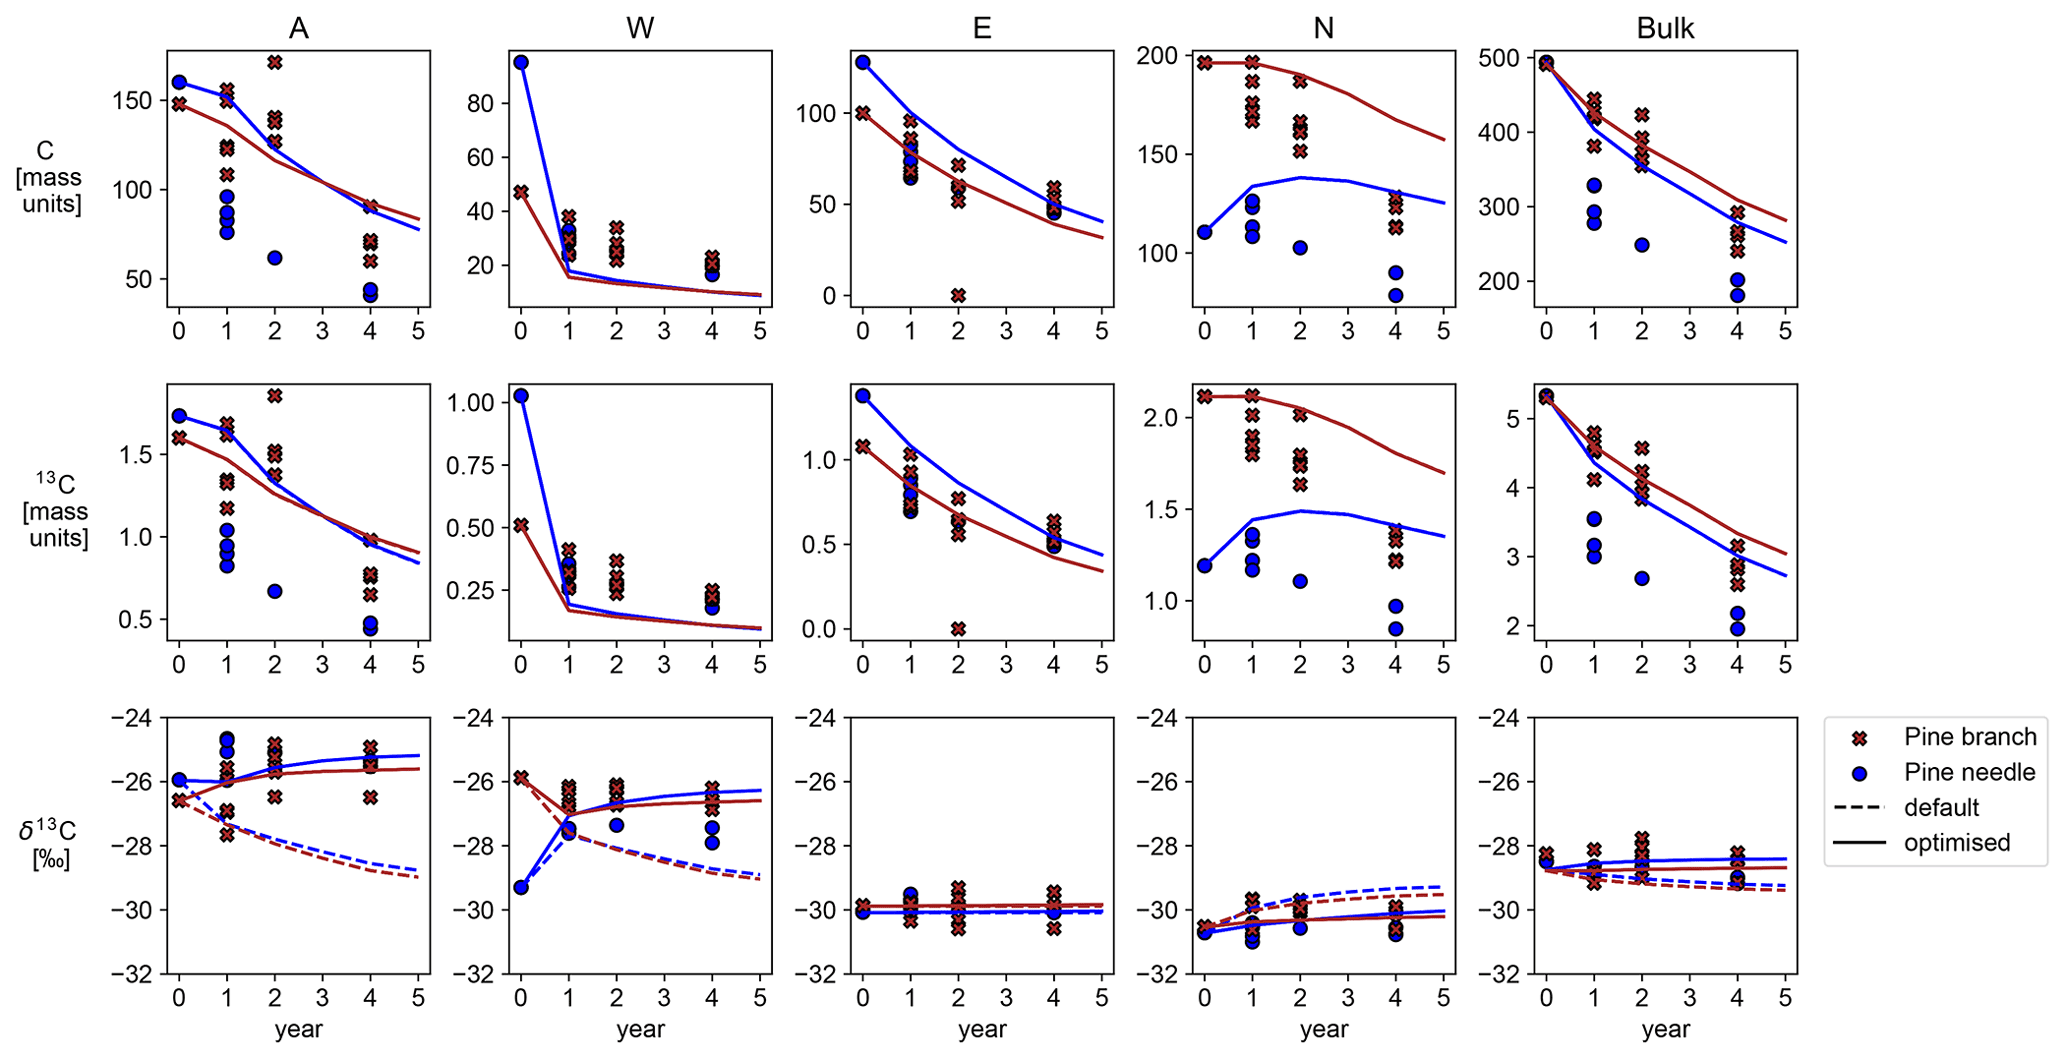
Figure 2Shown are time series produced by the default and optimised Yasso model versions for the different AWEN pools together with assimilated observations. The model results for C and 13C concentrations are on top of each other.
The default and optimised parameter values were used to generate SOM decomposition and related C, 13C and δ13C time series from the given initial states (Fig. 2). The differences between the simulated 13C concentrations are too small to be evident (C concentrations are identical), but we get a clear signal from the δ13C values. The default model depicts changing δ13C, which is driven by differences in the initial isotopic fractions between the pools and the rate of the flow of carbon between the pools.
Both model versions tend to underestimate the speed of SOM decomposition (the C and 13C concentrations) at Lakkasuo (Fig. 2) for the A and N pools and overestimate for the W pool. The bulk carbon content behaves similarly to A and N pools as these contain the most carbon. The default Yasso model is reducing the relative 13C content (reducing the δ13C values) for the A and W pools and deviating from the observations, whereas the optimised model version seems to be increasing the relative 13C content and following the observations more closely. There is no apparent difference for the E pool, but the calibration has lowered the rate of 13C enrichment for the N pool. We have calculated and gathered the mean and standard deviation of the corresponding pointwise δ13C model bias values (model − observations) for the individual AWEN pools to Table 2.
Table 2Calculated default and optimised model bias (model − observations) mean and standard deviation for the different AWEN pools.
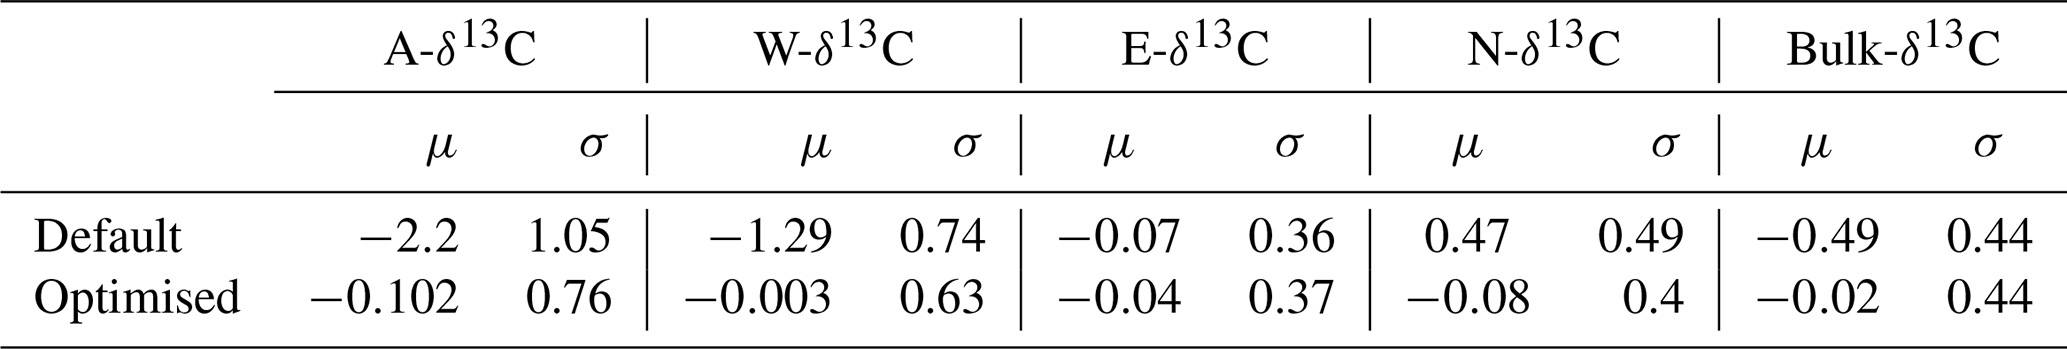

Figure 3Time series of simulated δ13C values of the different AWEN pools for the default and optimised Yasso model versions. Scatterplot shows the peat column δ13C values at different depths, positioned at the midpoint of assumed age, along with corresponding trend lines.
The Lakkasuo initial states and generated average year (averaged monthly temperature and annual precipitation) from years 2000–2014 were used to simulate a 100-year-long carbon decomposition (Fig. 3). This simulation can be compared to Lakkasuo peat column δ13C values at different depths given in Table 1 and in Hilasvuori et al. (2013). The holocellulose values are comparable to the A pool, Klason to the N pool, nonpolar extracts to the E pool and polar extracts to the W pool. A noteworthy detail is that in the short term (Fig. 2) the default model increased the relative 13C content (δ13C values) of E and N more than the optimised version, but on longer timescale this situation is reversed (Fig. 3). The difference in δ13C values for bulk C, between the default and optimised model versions at the end of the 100-year-long simulation, translates to approximately 0.3 ‰ difference in C mass percentage.
We have introduced simple modifications to the Yasso model in order to account for 13C-SOM decomposition. Incorporation of δ13C on SOM decomposition models is a necessary step towards integration of Earth system and dynamic land ecosystem models. The δ13C values of different organic compounds or chemical fractions of mixed organic material can be used as natural tracers which provide a unique tool to investigate and uncover complex decomposition processes in the soil. Examples of such approaches include, for example, examination of tree carbon use by chasing 13C-CO2 pulse in the respiration of leaves, whole crowns, roots, and soil (Drake et al., 2019); an analysis of how stable isotope fractionation might be used to identify microbial function without incubation in soil samples (Blaser and Conrad, 2016); and assessment of carbon uptake and respiration fluxes via the use of 13C depleted CO2 (Steinmann et al., 2004).
In the current study, we introduced new θ parameters to account for 13C-SOM decomposition in the Yasso model. The calibration of these parameters only depends on the δ13C values, i.e. the relative carbon isotope concentrations, and revealed unimodal distributions for all four AWEN pool related parameters. Considering the acquired optima and taking into account that generally the ratio , then the new 13C-SOM decomposition utilises values that differ at maximum 3 ‰ (for θA) from the default decomposition parameter values. Therefore, it is not surprising that both default and optimised model versions generate nearly identical SOM decomposition both on a short- (Fig. 2) and long-term basis. Moreover, the 0.3 ‰ relative difference in bulk C between the model versions at the end of the 100-year simulation is too small to be used directly to improve bulk C estimates. The benefits come in the various ways 13C can be used as a natural tracer.
The acquired optima for θA,θE and θW are all negative, which is consistent with the initial hypothesis and 13C-fractionation and enrichment theory. In the model, this translates to reduced 13C-SOM decomposition rate (Fig. 2). Likewise, the positive value for θN implies increased 13C-SOM decomposition when compared to the default model. However, the reduction in δ13C values, when compared to the default model version, is only true on shorter timescales (Fig. 2) as each pool has a trend to increase relative 13C content during the 100-year-long simulation (Fig. 3). This is due to the reduced 13C-SOM decomposition in other pools – as there is more 13C present in these pools, there is more 13C available to be transported into the N pool, which compensates for the increased decomposition. The positive θN goes against the initial hypothesis but is a direct result of model structure. It could be worthwhile to investigate how modifications to the model, such as adding multiple soil layers with differences in the effects of temperature, precipitation or Q10 (see e.g. Fig. 1 in Hilasvuori et al., 2013), would improve the model capabilities.
The straightforward changes to the Yasso model have improved the model capabilities in reproducing observed δ13C values in short (Fig. 2) and longer timescales (Fig. 3). Results from the 100-year-long simulation seem to corroborate the initial hypothesis for A, W and N pools that the relative 13C content in soil (larger δ13C values) increases with time. The optimised model even yields a positive trend for E pool δ13C, whereas the default model tends to converge the δ13C values of all pools to roughly −30. The optimised model behaviour follows the trend of these measurements, and the results are highly encouraging, even though the model is driven with a single averaged year representing the meteorological conditions from the beginning of the 21st century.
Estimation and modelling of soil organic matter decomposition, but also C sequestration, are current scientific challenges. We have demonstrated how 13C can be implemented into a soil carbon model, so that carbon isotope signals could then be used to analyse carbon cycles in more detail and to improve model capabilities, accuracy and predictability. The required model modifications were straightforward and resulted in drastic improvement of modelled δ13C values of SOM extracts. Although we emphasise the preliminary nature of our results due to limited calibration dataset, we foresee the model to act as a truly important tool to understand the role of isotopic fingerprints within soil carbon decomposition. The experiments demonstrated here should be viewed as a proof of concept, but further research is needed to verify the model capabilities on other sites, ecosystems and larger areas. Future research is expected to also include different management practices and croplands. Since the production of AWEN extractions with δ13C measurements is labour-intensive, future research will likely rely on inverse calibration on larger δ13C datasets that are rather straightforward to produce, or meta-analysis using literature-based values could be also used for further evaluation across varying scales (local, regional, global).
We have demonstrated how to incorporate 13C-SOM decomposition into the Yasso model and calibrate it. The model modifications were simple and straightforward and resulted in significantly improved simulated δ13C values. The results support the initial hypothesis of 13C-fractionation and enrichment theory. The capability of a model to simulate soil 13C content and isotope-specific SOM decomposition improves the applicability of the Yasso-C13 model to scale processes from the ecosystem level to the regional and global scale using δ13C as a tracer. Conceptually the presented work is on solid ground, but the lack of suitable calibration and validation data urges further studies with new, precise experimental δ13C data suitable for Yasso-C13 model calibration and validation.

JM was responsible for the model modifications, simulations and preparing the manuscript, with JH, JL and TV contributing to the experiment design. LA was responsible for the 13C analysis and HF and KK for the AWEN extractions. MO provided premises and equipment for the isotopic measurements.
The contact author has declared that none of the authors has any competing interests.
Publisher’s note: Copernicus Publications remains neutral with regard to jurisdictional claims in published maps and institutional affiliations.
Special thanks go to Anneli Rautiainen for the work on AWEN extractions and Hanna Turunen and Igor Shevchuk for stable isotopic sample preparation and measurement.
This research has been supported by the Strategic Research Council (grant no. 327214; MULTA), the Academy of Finland (grant no. 337552; ACCC), and the Suomalainen Tiedeakatemia (grant no. 297350; ACCUSOIL).
This paper was edited by Ben Bond-Lamberty and reviewed by three anonymous referees.
Acharya, B. S., Rasmussen, J., and Eriksen, J.: Grassland carbon sequestration and emissions following cultivation in a mixed crop rotation, Agr. Ecosyst. Environ., 153, 33–39, https://doi.org/10.1016/j.agee.2012.03.001, 2012. a
Blaser, M. and Conrad, R.: Stable carbon isotope fractionation as tracer of carbon cycling in anoxic soil ecosystems, Curr. Opin. Biotech., 41, 122–129, https://doi.org/10.1016/j.copbio.2016.07.001, 2016. a, b
Craig, H.: Isotopic standards for carbon and oxygen and correction factors for mass-spectrometric analysis of carbon dioxide, Geochim. Cosmochim. Ac., 12, 133–149, https://doi.org/10.1016/0016-7037(57)90024-8, 1957. a
Drake, J. E., Furze, M. E., Tjoelker, M. G., Carrillo, Y., Barton, C. V. M., and Pendall, E.: Climate warming and tree carbon use efficiency in a whole-tree 13CO2 tracer study, New Phytologist, 222, 1313–1324, https://doi.org/10.1111/nph.15721, 2019. a, b
Flanagan, L., Ehleringer, J., and Pataki, D.: Stable isotopes and biosphere-atmosphere interactions, in: Physiological Ecology, Stable Isotopes and Biosphere Atmosphere Interactions, Academic Press, 9–28, https://doi.org/10.1016/B978-0-12-088447-6.X5000-4, 2005. a
Fry, B.: Stable isotope Ecology, 1st edn., Springer New York, NY, XII, 308, https://doi.org/10.1007/0-387-33745-8, 2006. a
Goll, D. S., Winkler, A. J., Raddatz, T., Dong, N., Prentice, I. C., Ciais, P., and Brovkin, V.: Carbon–nitrogen interactions in idealized simulations with JSBACH (version 3.10), Geosci. Model Dev., 10, 2009–2030, https://doi.org/10.5194/gmd-10-2009-2017, 2017. a
Heikkinen, J., Keskinen, R., Regina, K., Honkanen, H., and Nuutinen, V.: Estimation of carbon stocks in boreal cropland soils – methodological considerations, Eur. J. Soil Sci., 72, 1–12, https://doi.org/10.1111/ejss.13033, 2020. a
Hilasvuori, E., Akujärvi, A., Fritze, H., Karhu, K., Laiho, R., Mäkiranta, P., Oinonen, M., Palonen, V., Vanhala, P., and Liski, J.: Temperature sensitivity of decomposition in a peat, Soil Biol. Biochem., 67, 47–54, https://doi.org/10.1016/j.soilbio.2013.08.009, 2013. a, b, c, d, e, f
Köchy, M., Hiederer, R., and Freibauer, A.: Global distribution of soil organic carbon – Part 1: Masses and frequency distributions of SOC stocks for the tropics, permafrost regions, wetlands, and the world, SOIL, 1, 351–365, https://doi.org/10.5194/soil-1-351-2015, 2015. a
Kolari, P., Kulmala, L., Pumpanen, J., Launiainen, S., Ilvesniemi, H., Hari, P., and Nikinmaa, E.: CO2 exchange and component CO2 fluxes of a boreal Scots pine forest, Boreal Environ. Res., 14, 761–783, http://www.borenv.net/BER/archive/pdfs/ber14/ber14-761.pdf (last access: 29 August 2022), 2009. a
Liski, J., Palosuo, T., Peltoniemi, M., and Sievänen, R.: Carbon and decomposition model Yasso for forest soil, Ecol. Model., 189, 168–182, https://doi.org/10.1016/j.ecolmodel.2005.03.005, 2005. a
Lugato, E., Lavallee, J., Haddix, M., Panagos, P., and Cotrufo, M.: Different climate sensitivity of particulate and mineral-associated soil organic matter, Nat. Geosci., 14, 295–300, https://doi.org/10.1038/s41561-021-00744-x, 2021. a
Mäkelä, J.: Lakkasuo carbon isotope and AWEN extraction data for Yasso-C13 model development, Zenodo [data set], https://doi.org/10.5281/zenodo.6983051, 2021a. a
Mäkelä, J.: Ryassofortran with C13, Zenodo [code], https://doi.org/10.5281/zenodo.4468521, 2021b. a, b
Ontl, T. and Schulte, L.: Soil Carbon Storage, Nature Education Knowledge, 3, 35, https://www.pacificwolves.org/wp-content/uploads/2019/06/Ontl-and-Schulte_2012.pdf (last access: 29 August 2022), 2012. a
Poeplau, C., Don, A., Six, J., Kaiser, M., Benbi, D., Chenu, C., Cotrufo, M. F., Derrien, D., Gioacchini, P., Grand, S., Gregorich, E., Griepentrog, M., Gunina, A., Haddix, M., Kuzyakov, Y., Kühnel, A., Macdonald, L. M., Soong, J., Trigalet, S., Vermeire, M.-L., Rovira, P., van Wesemael, B., Wiesmeier, M., Yeasmin, S., Yevdokimov, I., and Nieder, R.: Isolating organic carbon fractions with varying turnover rates in temperate agricultural soils – A comprehensive method comparison, Soil Biol. Biochem., 125, 10–26, https://doi.org/10.1016/j.soilbio.2018.06.025, 2018. a
Smith, P., Soussana, J.-F., Angers, D., Schipper, L., Chenu, C., Rasse, D. P., Batjes, N. H., van Egmond, F., McNeill, S., Kuhnert, M., Arias-Navarro, C., Olesen, J. E., Chirinda, N., Fornara, D., Wollenberg, E., Álvaro Fuentes, J., Sanz-Cobena, A., and Klumpp, K.: How to measure, report and verify soil carbon change to realize the potential of soil carbon sequestration for atmospheric greenhouse gas removal, Glob. Change Biol., 26, 2190–241, https://doi.org/10.1111/gcb.14815, 2020. a
Steinmann, K., Siegwolf, R., Saurer, M., and Körner, C.: Carbon fluxes to the soil in a mature temperate forest assessed by 13C isotope tracing, Oecologia, 141, 489–501, https://doi.org/10.1007/s00442-004-1674-4, 2004. a, b
Straková, P., Anttila, J., Spetz, P., Kitunen, V., Tapanila, T., and Laiho, R.: Litter quality and its response to water level drawdown in boreal peatlands at plant species and community level, Plant Soil, 335, 501–520, https://doi.org/10.1007/s11104-010-0447-6, 2010. a
Straková, P., Niemi, R. M., Freeman, C., Peltoniemi, K., Toberman, H., Heiskanen, I., Fritze, H., and Laiho, R.: Litter type affects the activity of aerobic decomposers in a boreal peatland more than site nutrient and water table regimes, Biogeosciences, 8, 2741–2755, https://doi.org/10.5194/bg-8-2741-2011, 2011. a
Straková, P., Penttilä, T., Laine, J., and Laiho, R.: Disentangling direct and indirect effects of water table drawdown on above- and belowground plant litter decomposition: consequences for accumulation of organic matter in boreal peatlands, Glob. Change Biol., 18, 322–335, https://doi.org/10.1111/j.1365-2486.2011.02503.x, 2012. a
Triberti, L., Nastri, A., and Baldoni, G.: Long-term effects of crop rotation, manure and mineral fertilisation on carbon sequestration and soil fertility, Eur. J. Agron., 74, 47–55, https://doi.org/10.1016/j.eja.2015.11.024, 2016. a
Tuomi, M., Laiho, R., Repo, A., and Liski, J.: Wood decomposition model for boreal forests, Ecol. Model., 222, 709–718, https://doi.org/10.1016/j.ecolmodel.2010.10.025, 2011. a
Viskari, T., Laine, M., Kulmala, L., Mäkelä, J., Fer, I., and Liski, J.: Improving Yasso15 soil carbon model estimates with ensemble adjustment Kalman filter state data assimilation, Geosci. Model Dev., 13, 5959–5971, https://doi.org/10.5194/gmd-13-5959-2020, 2020. a
Viskari, T., Pusa, J., Fer, I., Repo, A., Vira, J., and Liski, J.: Calibrating the soil organic carbon model Yasso20 with multiple datasets, Geosci. Model Dev., 15, 1735–1752, https://doi.org/10.5194/gmd-15-1735-2022, 2022. a, b, c, d
Wilman, E. A.: Carbon Sequestration in Agricultural Soils, J. Agr. Resour. Econ., 36, 1–18, https://doi.org/10.22004/ag.econ.105535, 2011. a